assessing global resource use: a systems approach to
TRANSCRIPT

ASSESSING GLOBAL RESOURCE USE
A systems approach to resource efficiency and pollution reduction
ASSE
SSIN
G G
LOBA
L RE
SOU
RCE
USE
- A
syst
ems
appr
oach
to re
sour
ce e
ffici
ency
and
pol
lutio
n re
duct
ion
Acknowledgements
Authors: Stefan Bringezu, Anu Ramaswami, Heinz Schandl, Meghan O’Brien, Rylie Pelton, Jean Acquatella, Elias T. Ayuk, Anthony Shun Fung Chiu, Robert Flanegin, Jacob Fry, Stefan Giljum, Seiji Hashimoto, Stefanie Hellweg, Karin Hosking, Yuanchao Hu, Manfred Lenzen, Mirko Lieber, Stephan Lutter, Alessio Miatto, Ajay Singh Nagpure, Michael Obersteiner, Lauran van Oers, Stephan Pfister, Peter-Paul Pichler, Armistead Russell, Lucilla Spini, Hiroki Tanikawa, Ester van der Voet, Helga Weisz, James West, Anders Wiijkman, Bing Zhu and Romain Zivy
* Authors other than SB, AR, HS, MO and RP are listed alphabetically.
Peer-review coordinator: Patrice Christmann, Former Head, Mineral Resources Unit, Bureau de Recherches Géologiques et Minières (BRGM), France
This interim report was written under the auspices of the International Resource Panel (IRP) of the United Nations Environmental Programme (UN Environment). We thank Janez Potocnik, the co-chair of the IRP, and the members of the IRP and its Steering Committee.
We also thank the United Nations Environment Programme Secretariat of the International Resource Panel:
Peder Jensen, Maria-Jose Baptista,Vera Gunther and, in particular Hala Razian, for assistance in the organization and editing of the report.
Recommended citation: IRP (2017). Assessing global resource use: A systems approach to resource efficiency and pollution reduction. Bringezu, S., Ramaswami, A., Schandl, H., O’Brien, M., Pelton, R., Acquatella, J., Ayuk, E., Chiu, A., Flanegin, R., Fry, J., Giljum, S., Hashimoto, S., Hellweg, S., Hosking, K., Hu, Y., Lenzen, M., Lieber, M., Lutter, S., Miatto, A., Singh Nagpure, A., Obersteiner, M., van Oers, L., Pfister, S., Pichler, P., Russell, A., Spini, L., Tanikawa, H., van der Voet, E., Weisz, H., West, J., Wiijkman, A., Zhu, B., Zivy, R. A Report of the International Resource Panel. United Nations Environment Programme. Nairobi, Kenya.
Design and layout: Anna Mortreux Printed by: UNESCO Photos: © Georgina Smith CIAT/Flickr, © Shutterstock, © Icaro Cooke Vieira CIFOR/Flickr
Copyright © United Nations Environment Programme, 2017
This publication may be reproduced in whole or in part and in any form for educational or non-profit purposes without special permission from the copyright holder, provided acknowledgement of the source is made. The United Nations Environment Programme would appreciate receiving a copy of any publication that uses this publication as a source. No use of this publication may be made for resale or for any other commercial purpose whatsoever without prior permission in writing from the United Nations Environment Programme.
Disclaimer
The designations employed and the presentation of the material in this publication do not imply the expression of any opinion whatsoever on the part of the United Nations Environment Programme concerning the legal status of any country, territory, city or area or of its authorities, or concerning delimitation of its frontiers or boundaries. Moreover, the views expressed do not necessarily represent the decision or the stated policy of the United Nations Environment Programme, nor does citing of trade names or commercial processes constitute endorsement.
ISBN: 978-92-807-3677-9 DTI/2141/PA UNEP 162
UN Environment promotes environmentally sound practices
globally and in its own activities. This publication is printed on 100% recycled paper,
using vegetable - based inks and other eco-friendly practices. Our distribution policy aims to
reduce UN Environment's carbon footprint.
ASSESSING GLOBAL RESOURCE USEA systems approach to resource efficiency and pollution reduction


A SYSTEMS APPROACH TO RESOURCE EFFICIENCY AND POLLUTION REDUCTION
3
Contents
List of Acronyms 4Preface 6Foreword 7Key Messages 8Summary For Policymakers 9
1. Introduction . . . . . . . . . . . . . . . . . . . . . . . . . . . . . . . . . . . . . . . . . . . . . . . . . . . . . . . . . . . . . . . . . . . . . . . . . . . 161 .1 Natural resources and sustainable development 161.2 Thebenefitsofresourceefficiency 171 .3 The need for a systems approach 181 .4 The International Resource Panel’s vision for regular resource reporting 191 .5 Structure of the report 201 .6 Key terms, concepts and approaches 21
2. Global trends and outlook . . . . . . . . . . . . . . . . . . . . . . . . . . . . . . . . . . . . . . . . . . . . . . . . . . . . . . . . . . . . . . . 262 .1 Global trends in natural resource extraction 282 .2 Material productivity 292 .3 Environmental impacts of materials extraction 302 .4 Trade of materials 332 .5 Material footprints 382 .6 Drivers of material extraction 402 .7 Scenarios for future global material demand and Greenhouse Gas emissions,
with ambitious policies 42
3. Governance solutions . . . . . . . . . . . . . . . . . . . . . . . . . . . . . . . . . . . . . . . . . . . . . . . . . . . . . . . . . . . . . . . . . . . 463.1 Towardsaneweraofmulti-beneficialpolicymaking 473 .2 Key strategies towards sustainable consumption and production 513.3 Keysolutionsinspecificpolicyareas 62
4. Special feature: Mitigating air pollution and achieving SDGs in cities through a systems focus on natural resources and infrastructure . . . . . . . . . . . . . . . . . . . . . . . . . . . . . . . . . . . . . . . . . . . . . 684 .1 Objectives of the special feature 704 .2 Challenges of urbanization 714 .3 The importance of infrastructure and food supply systems to SDGs 744 .4 The opportunity of urban transformations 764.5 CaseStudy:AirpollutionandSDGco-benefitsofdevelopingresource-efficient
and inclusive cities (Delhi, India) 774.6 CaseStudy:Greenhousegas,airpollutionandhealthco-benefitsofcirculareconomy
and urban-industrial symbiosis in Chinese cities 83
5. Conclusions and opportunities . . . . . . . . . . . . . . . . . . . . . . . . . . . . . . . . . . . . . . . . . . . . . . . . . . . . . . . . . . 88
References 90

ASSESSING GLOBAL RESOURCE USE
4
List of Acronyms
10YFP 10-Year Framework of Programmes on Sustainable Consumption and ProductionALA American Lung Association
APCC The Australasian Procurement and Construction CouncilAQMD Air Quality Management District BioIS Bio Intelligence Service
BREEAM Building Research Establishment Environmental Assessment BRICS Brazil, Russian Federation, India, China and South Africa
C CelsiusC2E2 CopenhagenCentreonEnergyEfficiencyCAAP Clean Air Action Plan
CASBEE ComprehensiveAssessmentSystemforBuildingEnvironmentalEfficiency CE Cambridge Econometrics
CED Cumulative Energy Demand (MJ)CML-IA Impact assessment proposed by the Institute of Environmental Sciences of Leiden
University, NetherlandsCO2 Carbon dioxide
CO2e Carbon dioxide equivalentCOMTRADE United Nations International Trade Statistics Database United Nations (COMTRADE)
CSIRO CommonwealthScientificandIndustrialResearchOrganisationDE Domestic extraction
DG Environment European Commission’s Directorate-General for EnvironmentDMC Domestic Material ConsumptionDPO Domestically processed output
DPSIR framework Drivers-pressures-state-impacts-response frameworkEEA European Environment Agency
EECCA Eastern Europe, Caucasus and Central Asia EIO Eco Innovation Observatory
EMF Ellen MacArthur FoundationEPD Environmental Product DeclarationsEPR Extended producer responsibility
ESCAP UnitedNationsEconomicandSocialCommissionforAsiaandthePacificEU European Union
EUROSTAT EuropeanStatisticalOfficeEX Direct exports
FAO Food and Agriculture Organization of the United NationsGDP Gross Domestic Product
Gg GigagramGGKP Green Growth Knowledge Platform
GHG Greenhouse gasHK-BEAM Hong Kong Building Environmental Assessment Method
HLPE High Level Panel of Experts on Food Security and NutritionICCA Institute for Climate Change and Adaptation, University of Nairobi
IEA International Energy AssociationIHME Institute for Health Metrics and EvaluationIIASA International Institute for Applied Systems AnalysisINDC Intended Nationally Determined Contributions

A SYSTEMS APPROACH TO RESOURCE EFFICIENCY AND POLLUTION REDUCTION
5
IM Direct importsIMF International Monetary Fund
IPCC Intergovernmental Panel on Climate ChangeKg Kilogram
LCA Life cycle assessmentLEED Leadership in Energy and Environmental Design MCW Municipal Waste
MJ MegajouleMNRE Ministry of New and Renewable Energy, India
MoHURD Ministry of Housing and Urban-Rural Development, ChinaMRIO multi-regional input-output MSW Municipal solid waste
NAAQS National Ambient Air Quality Standards NAS Net additions to stock
NCPC National Cleaner Production CentresNDRC National Development and Reform Commission, China
NIH National Institute of Health, United StatesOECD Organisation for Economic Co-operation and Development
PM2.5 Particulate Matter < 2 .5 micron diameterPOCP Photochemical Ozone Creation Potential
PRC People’s Republic of ChinaPTB Physical Trade BalancePTI Press Trust of India
RCPs Representative Concentration Pathways RME Raw Material Equivalent
RMEEX Raw material equivalent of exports RMEIM Raw material equivalent of imports
SCP Sustainable Consumption and ProductionSDG Sustainable Development Goal
SEEA System of Environmental-Economic Accounting SETAC Society of Environmental Toxicology and Chemistry
SHEE Society for Excellence in Habitat Development, Environment Protection and Employment Generation (India)
SO2 Sulphur dioxideSMCS Sound Material Cycle Society
UBA German Federal Environmental AgencyUN Habitat United Nations Human Settlements Programme
UNDP United Nations Development ProgrammeUNEP United Nations Environment Programme
UN Environment United Nations Environment ProgrammeUNIDO United Nations Industrial Development Organization
USD United States DollarsUS EPA United States Environmental Protection Agency
USGS United States Geological ServiceVAT Value Added Tax
WEEE Waste electrical and electronic equipment WHO World Health Organization
WRAP Waste and Resources Action Programme, United KingdomWRF Water Research Foundation

ASSESSING GLOBAL RESOURCE USE
6
Preface
At the Second Session of the United Nations Environment Assembly, nations not only recognized that fundamental changes in the way societies consume and produce are indispensable for achieving global sustainable development, butalsoacknowledgedtheimportanceofrigorousscientificevidenceonthesustainableuseofnaturalresourcestoinform policies to this end .
The International Resource Panel was honoured to be called upon at that session to make available information on the state, trends and outlook of sustainable consumption and production to the Assembly by 2019 .1 This interim report isthefirststepinrespondingtothatrequest.ItbuildsontenyearsofresearchbythePaneltoreassertthecentralityof natural resource management to achieving sustainable development; to reiterate the urgency and imperative to decouple economic activity and human well-being from resource use; and to provide innovative solutions based on cutting-edgedatatosupportthetransformationofourlinearproductionandconsumptionsystemstowardsefficiencyand circularity .
In line with the drive for a pollution free planet at the Third Session of the United Nations Environment Assembly, the research takes a step further to look at the relationship between resource use and pollution . The amount of natural resourcesusediscloselylinkedtotheamountoffinalwasteandemissionsgeneratedthroughtheiruse.Effectivepollutioncontrolmustthereforealsolooktominimizerawmaterialuse,therebydecreasingfinalwasteandemissions.This link between natural resource use and management and pollution mitigation is explored in depth at the city scale in the special feature of this report . Using a systems approach to examine resources used in developing and emerging economy cities, strategies are being put forward to reduce pollution while also advancing human well-being .
Suchinnovativeandmulti-beneficialapproachestothecomplexsocial,economicandecologicalchallengesofourtimes can be revealed by measuring and monitoring the way we extract, use and dispose of our natural resources . The scientificevidenceputforwardinthisinterimreportfocusesonmaterialresources,including-forthefirsttime-resultsdrawnfromadatabasespanningfiftyyearsupto2017.SubsequentresearchofthePanel,includingareporttobesubmitted to the Fourth Session of the United Nations Environment Assembly in 2019, will expand this analysis to include water, land and fossil fuel and emission footprints .
Through continued reporting on this information at regular intervals, the International Resource Panel aims to improve the evidence base for systemic monitoring and policymaking for sustainability . It is our hope that such regularly reported data in our Global Assessment series can support the efforts of nations to monitor natural resource flows and the work of policymakers to orient socio-economic transitions toward sustainability .
We wish to sincerely thank the lead authors and the members of the International Resource Panel working group for laying the groundwork for such important research through this interim edition of the Global Assessment series . Equally,wewouldliketothankthemembersoftheUnitedNationsEnvironmentAssemblyfortheirconfidenceintheInternational Resource Panel to deliver this important work .
Janez PotocnikCo-ChairInternational Resource Panel
Izabella TeixeiraCo-ChairInternational Resource Panel
1 Second Session of the United Nations Environment Assembly, Resolution 2/8 on Sustainable Consumption and Production available at: http://wedocs .unep .org/bitstream/handle/20 .500 .11822/11184/K1607179_UNEPEA2_RES8E .pdf?sequence=1&isAllowed=y .

A SYSTEMS APPROACH TO RESOURCE EFFICIENCY AND POLLUTION REDUCTION
7
Foreword
The more natural resources that move through our economy, the more impact - including waste, emissions and hazardous pollutants - we can expect on our environment and, in turn, our well-being . While seemingly a straightforward proposition, the links between human well-being, economic prosperity and environmental resilience are complex and varied . This means that, unless all three dimensions are taken into consideration in policymaking, any progress in achieving ambitions across them may be hampered by unintended consequences and rebound effects .
ThisinterimreportoftheInternationalResourcePanelprovidesafirstglimpseatanewevidencebasethatcaninformprecisely this kind of integrated policymaking . It presents up-to-date information on material resources that reveals where material resources are extracted and used, for what purpose and to what effect . This information can drive targeted policyinterventionsandthesettingoflong-termgoalstotransformhowresourcesareusedforthebenefitofpeopleanda pollution-free planet . Seven key strategies are proposed, and existing examples from across the globe shared, to drive the transformation of consumption patterns and production systems that contribute to human well-being without putting unsustainable pressures on the environment .
The implications of this type of integrated policymaking are potentially transformative . Using data on water, fossil fuels, air pollution and greenhouse gas emissions for Delhi, India, and over 600 cities in China, case studies demonstrate howinformationonnaturalresourcescanhelpidentifypolicybundlesthatdeliverasignificantimprovementinhumanwell-being with a relatively small investment in resources . For developing and emerging economies, this means that delivering well-being for all citizens can be achieved with only a modest increase in the amount of resources used . For developed economies, absolute levels of resource use and impacts can be reduced while still achieving high social and economic gains .
InthecaseexampleofDelhi,apolicybundlethatrequiresonlya10 percentincreaseinthecity’senergyandmaterial(cement) resource demand was estimated to improve the well-being of 7 million underserved homes (while decreasing greenhousegasemissionsandthefineparticulatematteremissionsthatareadominantriskfactorinair-pollutionrelated premature deaths) . In China, a mix of compact urban design and circular economy policies could contribute up to 35 percenttowardscarbondioxidemitigationcomparedtosingle-sectorstrategies,whilealsoavoidingpollution-relatedmortalities . While every city faces its own unique challenges and circumstances, the case examples demonstrate the importance of this new evidence base in supporting impactful policy design .
The drive towards transformative, integrated approaches to sustainability must be founded on rigorous science - so that progress in one area reinforces advancements in others . Recognizing this, in Resolution 2/8 on Sustainable Consumption and ProductiontheSecondSessionoftheUnitedNationsEnvironmentAssemblyinvitedthePaneltosharescientificknowledge on the state, trends, and outlook of sustainable consumption and production . This report is the interim response to this request, with impressive results . I am sure you will join me in welcoming this contribution to the debates at the Third Session of the Environment Assembly, and in looking forward to the subsequent reports of this series that will expand its assessment to other natural resources including land, water and greenhouse gas emissions .
Ligia Noronha Director, Economy Division United Nations Environment Programme

ASSESSING GLOBAL RESOURCE USE
8
Key Messages
1 Global material resource use is expected to reach nearly 90 billion tonnes in 2017 and may more than double from 2015 to 2050, with high-income countries currently consuming 10 times more per person than low-income countries and the planetary boundaries being pushed beyond their limits .
2 Environmental impacts – including climate change and pollution – cannot be effectively mitigated by focusing on emission abatement alone . The level of resource use determines the magnitude of final waste and emissions released to the environment, making resource management andefficiencykeystrategiesforenvironmentalprotection.
3 Decoupling economic activity and human well-being from resource use–i.e.enhancedresourceefficiency–isnecessarytoachievetheSustainable Development Goals for all .
4 To achieve effective decoupling, today’s linear material flows must becomecircular throughacombinationofintelligentinfrastructureandproduct design, standardization, reuse, recycling and remanufacturing .
5 Resourceefficiencyandcirculareconomycreatejobsanddeliverbettersocio-economic and environmental outcomes compared to business as usual over the long term .
6 Countries face differing circumstances and therefore have varying opportunities for decoupling wealth creation and resource use, including leapfrogging .
7 A systems approach that avoids burden shifting between sectors, regions, resources and impacts is needed to transform production and consumption systems toward the SDGs .
8 A systems approach can also be used to steer sustainable urban infra-structure transitions, transforming the way in which the basic needs of food, energy, water and shelter are met in order to develop inclusive, resource-efficientandlow-pollutingcities.
9 Targets and indicators, such as material footprints, are needed at all levels of governance to monitor material flows and steer socio-economic transitions toward the SDGs .
10 Technical, business and policy innovation across the whole product life cycle,aswellasreformoffinancialinstruments,willbecrucialforthetransitiontoresourceefficienteconomies-aswillpolicylearning,capacitybuilding and knowledge sharing .
The International Resource Panel aims to improve the evidence base for systemic monitoring and policymaking, in particular through systems-based assessment of the resource related challenges and opportunities supporting the transition towards sustainable development.
© K
ate
Evan
s CI
FOR
/Flic
kr

A SYSTEMS APPROACH TO RESOURCE EFFICIENCY AND POLLUTION REDUCTION
9
Summary for Policymakers
Why a Global Assessment of Resource Use?The way in which societies use and care for natural resources fundamentally shapes the well-being of humanity, the environment and the economy . Natural resources - that is, plants and plant-based materials, metals, minerals, fossil fuels, land and water - are the basic inputs for the goods, services and infrastructure of socio-economic systems from the local to the global scale . Research shows that, either directly or indirectly, natural resources and the environment are linked to all of the United Nations Sustainable Development Goals . Restoring and maintaining the health of the natural resource base is a necessary condition to achieving the ambitious level of well-being for current and future gen-erations set out in these goals .
Improving the well-being of people while minimizing resource use and environmental impacts in particular through enhanced resource efficiency is an essential aspect of delivering on Sustainable Development Goal 12 on Responsible Production and Consumption, and also on almost all of the goals in a direct or indirect manner . To achieve such decoupling, today’s linear material flows through the economy must become circular through intel-ligent design of products incorporating standardization, reuse,recycling/remanufacturing,developmentofefficientand inclusive infrastructure systems, and, a focus on delivering services rather than material products . Resource efficiency is also complementary to conventional pollu-tion-control strategies . By lowering the amount of resources used, the amount of related emissions and impacts can also be reduced, and many of them at the same time .
Viable pathways exist for society to undertake such decou-pling of economic growth from natural resource use and environmental impacts . Technically feasible and commer-cially viable technologies can improve water and energy
efficiencyby60to80 percentinconstruction,agriculture,food, industry, transport and other sectors, while also deliv-ering economic cost savings of between USD $2 .9 and 3 .7 trillion each year by 2030 . Essential infrastructure (energy, buildings, transportation, water supply, sanitation and wastemanagement)andfoodsupplysectorssignificantlycontribute to global resource-use pollution and environ-ment-related impacts on human health . These sectors also shape social equity in basic provisioning and impact multipleSustainableDevelopmentGoals.Withover60 percent of the urban infrastructure expected to exist by 2050 yet to be built, the opportunity exists to shape the future over the long term .
In this sense, decoupling is not the domain of environmen-tal ministries alone, but rather cuts across all ministries and levels of government . This means that a mix of multi-level and multi-sectoral policies is needed to move beyond piecemeal changes to a profound transformation of how natural resources flow through society .
The foundation for this change is accurate information . Environmental and sustainability policy requires a solid evi-dence base that makes it possible to monitor the scale of the physical economy, that is - the amount of material, energy, water and land used and of emissions generated in making, using and providing goods, services and infrastructure systems . Data drawn from up-to-date information on the state, trends, and drivers of the physical economy can help to identify leverage points for targeted and effective policy intervention across sectors and geographical scales . This kind of regularly reported data, such as those drawn from a global assessment of natural resources, can inform the setting of long-term orientation goals, incentive frameworks and systems of engagement and mutual learning that will pave the way for transformational change .
ASSESSING GLOBAL RESOURCE USE
10
Summary for Policymakers
Resource use and pollutionBetterandmoreefficientproductionanduseofnaturalresources can be one of the most cost-efficient and effective ways to reduce impacts on the environment and advancehumanwell-being.Identifyingefficienciesacrossthelifecycleofnaturalresourcesmeansfindingopportuni-ties for improving how they are extracted, processed, used (including re-use, recovery and recycling) and disposed of to achieve the same - or greater - economic and social gains while minimizing negative environmental impacts (including pollution) .
Approximately 19 million premature deaths are estimated to occur each year globally due to environmental and infrastructure-related risk factors that arise from the way societies extract and use natural resources in production and consumption systems, including essential infrastruc-ture and food provision . About 6 .5 million premature deaths (the vast majority in cities) are caused by air pollution related to energy supply and use in homes and industries, as well as transportation and construction sectors within cities .
Effective pollution control requires mitigation of sub-stance-specifichazardsandareductionofrawmaterialusethroughtheeconomy,inordertolowerthevolumeoffinalwaste and emissions to air and water . Material demand has continued to shift from biomass and renewable materials
to non-renewable materials, creating new waste flows and contributing to higher emissions and pollution . The global trend of moving from traditional to modern technologies, and from agriculture-based economies to urban and indus-trial economies (along with their fast-growing new material requirements), further accelerates global material use and createssignificantchallengesforsustainabilitypolicy.
Metal-ore extraction and metal production increased three-fold from 1970 to 2010 . The steepest increase occurred from 2000 to 2010, driven mainly by the industrialization and urbanization of emerging economies . Environmental impacts have increased over time, mainly as a result of increased production . Decreasing material and energy productivity is bad economically – it means reduction of potential economic growth – and also bad environmentally (as pressures and impacts upon the environment, including pollution, grow disproportionally faster than the production of goods and services) . Investing in material and energy pro-ductivity is therefore a key area for improving the integration of economic and environmental objectives and reducing pollution . This is integral to Sustainable Development Goal 12, which aims to reshape consumption and production patterns by transforming resource use in a way that reduces pressures on the environment and climate while promoting human and economic development .
What can a systems approach to natural resources tell us?
Focusing on single resources, single economic sectors or single environmental and health impacts will not achieve the collective vision of the Sustainable Development Goals, and may instead cause harm if the interactions between each of the goals are not considered . Analysis linking the way natural resources are used in the economy to their impacts on the environment (pollution, deforestation, biodiversity loss and water depletion) and people (health, well-being, wealth and so on) across time requires the adoption of a systems approach . A systems approach connects the flow of resources - from extractionthroughtofinalwastedisposal-withtheiruseand impact on the environment, economies and societies at each stage of the life cycle . The approach can be used to identify key leverage points; develop resource targets; designmulti-beneficialpoliciesthattakeintoaccounttradeoffs and synergies; and steer a transition toward sustainable consumption and production and infrastructure systems .
The International Resource Panel assesses natural resources from a systems perspective in keeping with the DPSIR analyti-cal framework for human-nature interactions . The framework
looks at multiple drivers of resource use and resulting pres-sures on the natural environment as determinants of the state of the environment . The state of the environment in turn impacts human wellbeing and socio-economic systems that rely on it, thus requiring a response strategy to influence key drivers, and direct the resulting pressure, state and impacts to desired levels through an iterative and continuous process .
The use of natural resources and their related impacts are increasingly transboundary, largely due to trade and globalization . As a result, national accounting metrics that focus solely on a nation’s direct natural resource use do not fully represent the resources and associated impacts that contribute to economic activity . The concept of footprints that captures resource use across borders is therefore a critical tool in a systems approach . Footprints can measure different types of pressures, including resource use, pollution emissions and environmental impacts . Four footprints on resource use (materials, land, water and fossil energy) have beenidentifiedasdeterminingthemagnitudeofmostspe-cificenvironmentalimpacts.

A SYSTEMS APPROACH TO RESOURCE EFFICIENCY AND POLLUTION REDUCTION
11
Summary for Policymakers
A Global Assessment of Material Resources
2 The raw material equivalents (RME) of trade flows, that is, the amount of primary raw materials required along the supply chain to produce commodities .
While subsequent reports of this series will assess footprints of all resources (materials, land, water and greenhouse gas emissions), the focus of this report is on material resources . Material resources are the biomass (such as wood and crops for food, energy and plant-based materials), fossil fuels (such as coal, gas and oil), metals (such as iron, aluminum and copper) and non-metallic minerals (including sand, gravel and limestone) that are used in the economy . Strong growth in the extraction of material resources continues to support the global econ-omy, and also adds to global environmental pressures and impacts . Based on a material resources database that coversalmostfivedecades(1970to2017)and191 coun-tries, existing trends forecast global material use to reach 88.6 billiontonnesin2017–morethanthreetimestheamountusedin1970.Thisissignificantbecause,allelsebeing equal, growing material extraction with subsequent material flows would lead to growing environmental pres-sures and impacts across the globe .
Growing material use is driven by expanding populations, consumption trends in mainly developed economies and the transformation of developing economies . Demand for materials has shifted from renewable to non-renewable resources, reflecting the global trend away from traditional towards modern technologies, and from agriculture-based economies to urban and industrial economies . This creates new waste flows - thereby increasing emissions and pol-lution . For example, data show that the steep increases in demand for metal ores, like iron, have contributed to sharp risesingreenhousegasemissions,acidification,aquaticecotoxicity and emissions of smog-forming substances .
New analytical tools provide insight into the amount of pri-mary raw materials required along the entire supply chain of commodities .2 For imports, and measured on a per capita basis, the use of primary raw materials is four times the world average in Europe and North America . Global materials have historically been sourced from low-income and middle-income regions that bear the burden of local impacts of resource extraction, often for the sake of pro-ducing primary exports to high-income countries . Until the year 2000, high-income countries were net importers of materials while all other regions were net exporters . This has changed dramatically in 2017 . High-income countries now export one billion tonnes of materials, mainly driven by the United States and Australia’s fast growing exports, while upper-middle-income countries import around 750 milliontonnes.
Material footprints add further depth to the picture of global materials use . In 2017, despite more than half ofglobalmaterialusebeingdirectedtofinaldemandinAsiaandthePacific,thematerialfootprintoftheregionis estimated at 11 .4 tonnes per capita . North America recorded30tonnesofmaterialpercapitaforfinaldemand,Europe 20 .6 tonnes and all other regions measured under 10 tonnes per capita . On a per capita basis, high-income countries continue to consume 10 times more materials than low-income countries .
The full report provides in-depth analysis of material resources to illustrate where materials are extracted, where they are used, what the impacts are and what has driven material use . Understanding these interactions facilitates the development of appropriate policy responses . Reigning in the total physical scale of the economy is one essential firststeptoreducewasteandemissionsandtomitigateoverall environmental impacts . A new economic paradigm is needed to improve resource productivity and allow for production and consumption systems to be run with lower material and energy requirements, as well as reducing waste and emissions while providing all services needed .
© S
hutt
erst
ock

ASSESSING GLOBAL RESOURCE USE
12
Summary for Policymakers
How resource efficiency can transform economiesThe International Resource Panel modelled the combined economic and environmental consequences of ambitious resource efficiency and greenhouse gas abatement policies (UNEP, 2017) and found that there is substantial potential to achieve win-win outcomes that reduce envi-ronmental pressure while improving income and boosting economic growth .
By2050,ambitiouspolicesforresourceefficiencycouldreduce global resource requirements by about a quarter anddeliverglobaleconomicgrowthof3to5 percentabove the existing trend . This would also have consider-ableco-benefitsforclimatemitigationefforts.
Resourceefficiencypoliciesandinitiativescould: � reducenaturalresourceusegloballyby26 percent
by 2050, in combination with ambitious global action on climate change, as well as stabilizing per capita resourceuseatcurrentlevelsinhigh-income countries;
� reduce greenhouse gas emissions by an additional 15 to20 percentby2050(foragivensetofgreenhouse
policies),withglobalemissionsin2050fallingto63 percent below 2010 levels, and emissions in high-income countriesin2050fallingto74 percentbelow2010levels;
� more than offset the economic costs of ambitious climate action, so that income is higher and economic growth is stronger than in the ‘existing trends’ scenario;
� deliver annual economic benefits of USD $2 trillion globally by 2050 relative to existing trends, including benefitsofUSD$520billioninhigh-incomenations,while also helping put the world on track to limit climate change to 2°C or lower .
These projections can be treated as a reasonable minimum estimateofeconomicallyattractivephysicalresourceeffi-ciency potential . Further reports of this series will present in-depth scenario modelling to support informed policy and decision making . The level and mix of economic and environ-mentalbenefitsachievedwilldepend,however,onthedesignof the policies and approaches implemented – suggesting that attention will be required to develop and test a smart andpracticalpackageofresource-efficiencymeasures.
Driving a profound resource efficiency transition
Efficiency in the way resources are extracted and man-ufactured by industry, used and re-used by people and recycled and disposed of by all is essential to efforts toward a sustainable and pollution-free planet . A long-term vision underpinned by evidence-based targets and incremental policy signals can combine to produce a profound trans-formation of the physical economy . It is crucial to ensure a coordinated and coherent approach to policymaking across ministries, as well as the participation of stakeholders capable of turning shared visions into reality and managing resistancetochangebyclarifyingmultiplebenefitsfortheactors . This implies not only bottom-up changes in the way businesses create value and citizens access, use and dispose of resources, but also top-down changes in the way that policies steer the markets where businesses operate and build the social infrastructure in which citizens live .
To steer long-term and profound changes, four iterative steps across all levels of governance are required: (1) monitor cur-rentperformanceanduse;(2)settargetsanddefinefutureobjectives in the light of international agreements; (3) test and innovate targets, regulation and voluntary approaches, subsidiesandtaxesforresourceefficiencyandintegratedresource management; and (4) evaluate, learn and adapt .
At the national level, a bundle of strategies and tools is available to public authorities to support the shift towards inclusive,resource-efficientandpollution-freeeconomies.
The overarching strategies manifest differently in terms of possible pathways depending on a country’s level of natural resource endowment and its socio-economic context . Absolute decoupling is recommended as an aim for high-in-come nations, with the need to lower average resource-con-sumption levels, distribute prosperity equally (including for gender equality) and maintain a high quality of life . Strategies toward waste prevention, high-value resource recovery, circular resource flows and adjusting social norms are particularly relevant . Relative decoupling is a key strategy suited to developing economies and economies in transition to raise average income levels and eliminate poverty . These countriesshouldstrivetoimprovetheirresourceefficiencyeven as their net consumption increases, until a socially acceptable quality of life is achieved . There is an opportunity to fast track sustainable development in such countries by learning from and leapfrogging traditional pathways .
Resourceefficiencyaloneisnotenough.Productivitygainsin today’s linear production system are likely to lead to increased material demand through a combination of eco-nomic growth and rebound effects . What is needed is a move from linear to circular material flows through a combination of extended product life cycles, intelligent product design and standardization, reuse, recycling and remanufacturing . Business models aiming at offering high-quality services as an alternative to selling more products would be another important component .
A SYSTEMS APPROACH TO RESOURCE EFFICIENCY AND POLLUTION REDUCTION
13
Summary for Policymakers
Seven policy strategies for multi-beneficial policymakingManypolicytoolshavebeensuccessfullyusedfortacklingaspectsoftheresourceefficiencychallengeindifferentpartsof the world . This report proposes seven strategies for consumption patterns and production systems that contribute to human well-being without putting unsustainable pressures on the environment .
3 This relates to the fact that vested interests may not be as set on defending the status quo, and that consumption habits may not yet be as tied to mass consumption with rapid obsolescence, thereby providing greater scope for new forms of consumption and leasing (Swilling and Annecke, 2012; Boston Consulting Group, 2010) .
1. Set targets and measure progressA set of resource efficiency targets for the use of key resources (materials, land and water, as well as green-house gas emissions) can guide policy development and inform a progress-monitoring framework . Targets should preferably be footprint-based to consider transboundary effects of product use and minimize the risk of shifting problems to other regions . Reporting on harmonized metricsofresourceuseandefficienciesatregularinter-valsacrossandwithincountriescouldraisetheprofileofresourceefficiencyanddriveambitionstoincreaseit.Resource-efficiencytargetsarethefirststepforward,whilenational and international targets for sustainable levels of global resource consumption will also be needed .
2. Act on key leverage points across all levels of governance
To identify “hot spots” for policy action, national and internationalresource-efficiencyprogrammescouldplaya strategic role in the coordination of monitoring to stream-line institutional arrangements and promote synergies in national – and cross-sectoral – policy interventions .
3. Take advantage of leapfrogging opportunitiesMany fast-growing cities and developing economies are not locked into current design and business models . They canbenefitfromaweakerbias3againstresource-efficientinvestments, and the opportunity to avoid the resource- and energy-intensive design for new infrastructure . Taking advantage of these opportunities requires access to finance and international cooperation, in particular for low-income economies .
4. Implement a policy mix that builds incentives and corrects market failures
Aligningpricesignalsandfiscalpolicieswiththestrategicgoalsofsocietycanadjustthebehaviouroffirmsandindi-viduals, so that their investment and purchase decisions reflect those of society as a whole . Implementing a policy mix that builds incentives and corrects market failures for
resourceefficiency,includingslowlyshiftingtaxesfromlabour to materials in line with the pace of decoupling suc-cess, can have a strong steering effect and help to avoid rebounds .
5. Promote innovations toward a circular economy
Aswitchfromconsumptionoffiniteresourcestorecycledmaterials and renewable resources (such as sunlight, wind and sustainably managed biomass) opens up the possibility of meeting the needs of more people over the long term . Before recycling, extending the lifetime of material resources through direct reuse, repair, refurbish-ing or remanufacture, as well as policies that encourage recycling to be considered as part of product design, are crucial to breaking through infrastructural lock-in of exist-ing production and consumption systems .
6. Enablepeopletodevelopresource-efficientsolutions
New types of alliances to collaborate, experiment and learn are critical to a successful transition . Initiating and partic-ipating in multi-stakeholder platforms, cross-cutting and expert networks and private-public partnerships will help promote cooperation and collaboration . Governments can provide skills training, improve education programmes and providefinancialsupporttospreadriskassociatedwithpotential breakthrough innovations .
7. Unlock the resistance to changeAny reduced revenues and job losses occurring during transformationstoaresource-efficientandsustainableglobal economy must be addressed to overcome resis-tance to change and to support workers and businesses that are impacted . Upskilling training and education, recycling tax revenues back to affected industries and businesses to support transformation and protecting the very poor and vulnerable through policy packages that take their needs into account are some of the ways resistance to change can be mitigated .
ASSESSING GLOBAL RESOURCE USE
14
Summary for Policymakers
Special feature: mitigating air pollution and achieving the Sustainable Development Goals in cities through a systems focus on natural resources and infrastructure
Air pollution has emerged as one of the primary risk fac-tors for premature mortality in the 21st century, linked with 6.5 millionprematuredeathsannually,themajorityofwhichare in global cities . Indoor and ambient air pollution in the formoffineparticulatematter(PM2.5)isthedominantriskfactor(accountingfor96 percentofhealthimpacts).
Addressing PM2 .5 air pollution is challenging because it arises from multiple sectors within the city boundary (industry, transportation, household cook stoves, waste burning, construction and road dust) and outside city boundaries (agricultural burning, industrial emissions and natural sources) . Furthermore, PM2 .5 concentrations in air are influenced by local weather patterns in complex ways and exacerbated by climate change (particularly extreme heat and drought events) .
Lessons learned from air-quality management experiences indicate that systems-based approaches complemented by end-of-pipe control strategies are important in address-ing the multi-faceted sources of PM2 .5 . The Special Feature presents a systems approach anchored in the use of natural resources, with a focus on essential infrastruc-turesandfoodsupplyincities.Thefindingssuggestpath-ways for reducing pollution while also providing multiple co-benefitsthatadvanceSustainableDevelopmentGoalsfor economies at differing stages of development .
For developing economies, strategic pathways are identi-fiedfortransformingcitieswithunderservedpopulations,high inequality and high pollution levels to become inclu-sive,resourceefficientandcleaner,therebyadvancingthewell-being of large urban populations . A case study of the National Capital Territory of Delhi, India (hereafter Delhi) demonstrates how a bundle of strategies (provision of transit services, in situ slum rehabilitation within the urban fabric,resource-efficientmulti-storeybuildingconstructionwithlow-pollutingmaterials,energyefficiencyamonghighconsumers and replacement of dirty cooking fuels) can deliverbasicservicestoabout7 millionadditionalpeoplewhileconsumingasmallfraction(lessthan5 percent)of the total amount of cement and electricity used in the citytoday,whileavoidingover22 percentofgreenhousegas emissions and air pollution (PM2 .5) emissions and preventing more than 2,500 premature deaths from dirty cooking fuel use alone . This case study indicates a signif-icant improvement in human well-being, with a relatively
small investment in resources, as a good example of the concept of decoupling .
For emerging economies undergoing rapid urbaniza-tion and industrialization, circular economy policies (combinedwithurbanplanningthatenablesbeneficialexchange of materials and energy across different industry and infrastructure sectors in cities) are found to yield economic gains, natural resource conservation, greenhouse gas mitigation and air-pollution reductions . Using modelled energy use in different sectors (residen-tial, commercial and industrial) in more than 630 Chinese cities, circular economy strategies in cities had a demon-strated collective impact on national sustainability and greenhouse gas emissions targets, while also showing localhealthco-benefitsspecifictoeachcity’scontext.The models show that circular economy strategies applied in cities can collectively contribute an additional 15 percentto36 percenttowardsnationalgreenhousegas mitigation compared to conventional single-sector strategies.Co-beneficially,about47,000(range25,500- 57,500) premature deaths are estimated to be avoided annually through air-pollution reduction .
Developed economies also benefit from a systems approachthatsystemicallyintegratesresourceefficiencyin multiple sectors with air-pollution control, as has been demonstrated from experiences in air-quality manage-ment in countries including the United States . Air pollution is a worldwide challenge requiring a systems approach anchoredinresourceuseandefficiencies,particularlyinthe infrastructure and food supply sectors .
For cities, the bundle of policy strategies listed below, when implemented together, can simultaneously reduce air pol-lution and advance human well-being, achieving multiple benefitsindiverseworldregions.
� Develop urban-rural market mechanisms and avoid urban area expansion to agricultural lands and lands that provide high-value ecosystem services to ensure preservation of lands and reduction of dust/air pollution emissions;
� Undertake strategic urban land-use and infrastructure planning within cities and urban areas to reduce travel demand;

A SYSTEMS APPROACH TO RESOURCE EFFICIENCY AND POLLUTION REDUCTION
15
Summary for Policymakers
� Investinefficienttransitsystemstoreducevehicularemissions and congestion;
� Undertake inclusive development and in situ slum rehabilitation in multi-storey buildings within dense city areas that provide essential services and access to livelihoods while reducing the travel burden on the poor;
� Promotemulti-storeyresource-efficientbuildingcon-structionandenergyefficiencyforallbuildings;
� Promote culturally-sensitive behavioural change strategies to reduce resource use, including a focus on resource substitutions for dirty cooking fuels and construction materials;
� Implement electricity grid transformations with high levels of renewable energy;
� Encourage business innovations to reduce agricultural and solid-waste burning .
Where to from here?
Sustaining and managing resource use is a cornerstone of sustainable development, particularly in terms of achieving environmental and socio-economic goals . A systems approach considering all phases of natural resources life cycles – from extraction through produc-tion, consumption, recycling and final disposal – has been shown to foster a better understanding of the phys-ical basis of societies . This improved understanding can, in turn, inform the design of effective policy measures across all sectors and levels of the economy to promote resourceefficiencyandreducepollution.
The twin issues of reducing overconsumption and waste of natural resources on the one hand, and providing secure access to natural resources and food on the other, must be addressed simultaneously to ensure that neither surpasses the thresholds of a global “safe operating space” . Strategies and solutions should there-fore be designed according to national circumstances, but in a globally consistent manner by approaching the Sustainable Development Goals without compromising other regions’ progress towards this end .
Conventional pollution control by add-on technologies is bound to shift environmental problems and increase resource consumption . Keeping natural resource use and associated impacts within safe limits can only
be achieved by significant increases in resource effi-ciency within production and consumption systems and infrastructure provision . Transformations toward resource-efficient urban infrastructures also have the co-benefitofincreasingprogressrelatedtohumanhealthand well-being .
Overall, transformational policies are needed to enhance resourceefficiencyandsustainableresourceusethrough-out the economy . There has been initial progress in estab-lishing instruments that foster a more sustainable use of natural resources in production and consumption systems, including infrastructure management . Nevertheless, there remain huge opportunities for the future .
Improved information and scenario analysis on the state, trends and outlook of natural resource use, reported on a regular basis, can support effective and targeted policy design and evaluation . The Global Assessment of Natural Resource Use and Management series of the International Resource Panel aims to provide this knowl-edge base . All in all, this report can be taken as a pilot, providing strategic elements for regular reporting based on a new and authoritative database of the International Resource Panel on material flows . A report covering natural resources (water and land) and greenhouse gas emissions is expected to be released in 2019 .

© A
DB /
Flic
kr
16
ASSESSING GLOBAL RESOURCE USE
1. Introduction

A SYSTEMS APPROACH TO RESOURCE EFFICIENCY AND POLLUTION REDUCTION
17
Introduction
1
2
3
4
5
The way in which society uses and cares for natural resources fundamentally shapes the well-being of humanity, the environmentandtheeconomy.Effectivepollutioncontrolrequiresmitigationofsubstancespecifichazardsand a reduc-tionofrawmaterialusethroughouttheeconomy,inordertolowerthevolumeoffinalwasteandemissionsinairandwater . This chapter introduces the challenges and opportunities for resource management and use towards sustainable development . From a material flow perspective, it argues that a systems approach to resource assessment is needed to provide the insight that policymakers need to steer development towards the ambitious level of well-being for 9 billion people articulated in the Sustainable Development Goals (SDGs) .
This chapter also sets the overarching framework for this report . It describes the approach of the International Resource Panel to assess resource use from a systems perspective, presents the structure of the report and briefly introduces key concepts and terms for building a common understanding of the fundamental issues and methods involved .
1.1 Natural resources and sustainable development
The Sustainable Development Goals aim to end poverty, protect the planet and ensure prosperity for all by the year 2030. They represent a collective vision of a better future that is ambitious, universally applicable and truly transfor-mative . To this end, restoring and maintaining the health of the natural resource base is a necessary condition . Box
1 .1 provides examples of the linkages between the use of multiple natural resources (materials, land and water) and environmental impacts (greenhouse gas emissions, pollu-tion and biodiversity loss), economic development, human health and well-being . Understanding these linkages is essential to achieving the Sustainable Development Goals .
BOX 1.1 Challenges for resource management and use
� Global material resource use has accelerated in the first decade of the 21st century, thereby increasing environmental pressures and impacts such as pollution. An estimated four out of nine planetary boundaries have been surpassed, irreversibly changing the functioning of major Earth system processes (such as climate) (Rockström et al., 2009; Steffen et al., 2015). Over the last few decades, a combination of habitat loss, overexploitation and pollution has led to catastrophic declines in biodiversity – known as Earth’s sixth mass extinction – in the form of damage to ecosystem functioning and services vital to sustaining civilization (Ceballos et al., 2017).
� There is high inequality in the distribution, availability and use of natural resources and in exposure to environmental risk factors across world regions and within countries and cities. For example, the 1.2 billion poorest people account for 1 per cent of the world’s consumption, while the billion richest consume 72 per cent of the world’s resources (United Nations, 2013). In many cities, more than 30 to 40 per cent of the population is living without access to basic services (United Nations Environment Programme (UN Environment and/or UNEP), 2012c), and the infrastructure deficit in water supply and sanitation, food supply and transportation places an undue burden on the poor and particularly on women (resulting in poverty, poor access to livelihoods and safety concerns) (United Nations Human Settlements Programme (UN Habitat), 2013).
� Approximately 19 million premature deaths are estimated to occur globally each year due to environmental and infrastructure-related risk factors that arise from the way societies use natural resources in production and consumption systems, including essential infrastructure and food provision (Ramaswami et al., 2016). About 6.5 million premature deaths (the vast majority in cities) arise from air pollution associated with energy supply and use in homes and industries, as well as transportation and construction sectors of cities (ibid).
� Economic stability is reduced by volatile world market prices for natural resources, as well as the financial, environmental and social limits of resource extraction adding to the pressure.
� The cost of inaction is high. Estimates indicate that the combined economic costs of air pollution and climate change will be nearly 5 to 6 per cent of Gross Domestic Product (GDP) in many nations by 2060 (Organisation for Economic Co-operation and Development (OECD), 2016).
� Regionally, access to fresh water and availability of other resources (like sand from river beds) constrain both human and economic development. By 2050, it is estimated that about 3.9 billion people will be living in water-insecure regions, thereby increasing vulnerability and costs (UNEP, 2012c). The boom in construction spurred by urbanization in emerging economies has created such excessive demand for sand that river beds close to urban areas are being depleted to meet it, causing acute water stress that harms humans and ecosystems alike (with additional impacts on the construction sector) (see Tejpal et al., 2014; Shaji and Anilkuar, 2014; and Ashraf et al., 2011).

ASSESSING GLOBAL RESOURCE USE
18
Introduction
One of the great strengths of the SDG framework is its recognition of the intimate links between human well-be-ing, economic prosperity and a healthy environment . Either directly or indirectly, natural resources and environ-ment are linked to all 17 SDGs - impacting poverty, health, hunger, gender inequality, food and agriculture, water and sanitation, human settlements, energy, climate change, sustainable consumption/production and oceans/terres-trial ecosystems (UNEP, 2016a) . The linkage of natural
4 Available at: http://hdr .undp .org/en/content/human-development-index-hdi .
resources and SDGs manifests in society-environment interactions in the form of consumption and production systems (such as infrastructure provisioning) that are played out at different scales – global, national, regional and city . Figure 1 .1 depicts these links . Analysis of these interactions at multiple scales provides a pow-erful means of understanding the drivers and potential pathways to achieving SDGs in different world regions, nations and cities .
FIGURE 1.1 Naturalresourcesflowthroughsocietyviaproduction,consumptionandinfrastructureprovisioning-impactingSustainableDevelopmentGoalsatdifferentscales
Subject to Planetary
Boundaries
Regional Scale
National Scale
CityScale
Multi-Level Policies & Technology Innovations for: Sustainable Production, Consumption & Infrastructure Transitions
HUMAN RESPONSE
Biomass* (food, non-food)Metals*Minerals*Fossil Fuels*WaterLand/Soil
Production & Consumption (Including Supply of Basic Infrastructure and Food: Energy Water supply Sanitation/Waste Management Transportation Communication Buildings Food Supply
NATURAL RESOURCE TYPES
HUMANACTIVITIES
MULTIPLE GEOGRAPHICAL SCALES SUSTAINABLEDEVELOPEMENT GOALS(Trade across cities, nations and regions)
USED FOR USED TO
* The focus of this report is on material resources corresponding to biomass, metals, minerals and fossil fuels, although future reports may focus on additional resource categories.
direct linkageindirect linkage
1.2 Thebenefitsofresourceefficiency
Better and more efficient use of natural resources can be one of the most cost-efficient and effective ways to reduce impacts on the environment and to advance human well-being . Increased efficiency across the life cycle of resource use means more effective extraction and production, as well as smarter consumption (includ-ing a shift towards circular material flows requiring changes in business models, behaviours and products) . Several recent international reports and global scenario analyses demonstrate viable pathways for society to decouple economic growth from natural resource use and environmental degradation . These reports present the opportunities for achieving economic benefits by promotingresourceefficiency(UNEP,2017a;Meyeretal.,2015; Cambridge Econometrics (CE) and Bio Intelligence Service (BioIS), 2014; and McKinsey Global Institute,
2011), urban infrastructure transitions (UNEP, 2017b) and a circular economy (Ellen MacArthur Foundation (EMF), 2015).Forexample,itisestimatedthat60to80 percentimprovementsinenergyandwaterefficiencyaretechni-cally possible and commercially viable in construction, agriculture, food, industry, transport and other sectors compared to conventionally used technologies - delivering economic cost savings of between 2 .9 and 3 .7 trillion USD each year by 2030 (UNEP, 2014b; UNEP, 2017a) . Human well-being, measured by the Human Development Index,4 demonstrates little improvement beyond a relatively low level of material consumption (UNEP, 2016c) .
Nations, cities, companies and civil society are begin-ning to engage in large-scale supply and infrastructure transitions in the provisioning of energy, water, food,

A SYSTEMS APPROACH TO RESOURCE EFFICIENCY AND POLLUTION REDUCTION
19
Introduction
1
2
3
4
5
transportation, communication, buildings and sanitation and waste management – sectors that form the fabric upon which other production and consumption activities are carried out . In the electric power sector, for example, renewable energy sources are becoming cost competitive with fossil fuels . New construction materials are the sub-ject of experimentation, including innovative ways to re-use certain waste streams . Smart technologies and behaviour changes contribute to transforming transportation options in cities, with options such as shared taxis, on-demand bus services, bike lanes and pedestrian-only zones . These infrastructure transitions create strategic opportunities. The decisions taken during such transitions shape the future over the long term. They offer the opportunity to reimaginefuturecities,recognizingthat60 percentofthe urban areas expected to house 3 .9 billion people by 2050 have yet to be built (UNEP, 2013a) . At the same
time, infrastructure in existing cities in the United States, Australia, the European Union and elsewhere is being replaced or refurbished . Given the long lifespan of infra-structure, an urban infrastructure transition perspective offers a strategic opportunity for achieving resource efficiencyandinclusivedevelopmentindifferentworldregions.Ithasbeenestimatedthata30to60 percentreduction in energy and material use can be achieved in citiesthroughstrategicintensificationandcriticalinfra-structuretransitions,includingenergy-efficientbuildings,district energy systems and transit systems built upon a compact and sustainable land-use plan (UNEP, 2017b) . With more than 1 billion people in cities living in informal settlements with poor infrastructure provisioning, strate-giestowardresource-efficientandinclusiveinfrastructuresystem transformations are vital to achieving SDGs and reducing pollution .
1.3 The need for a systems approach
Focusing on single resources, single economic sectors or single environmental and health impacts will not achieve the collective vision of the SDGs, and may instead cause harm if these interactions are not addressed . For exam-ple, it will not be possible to achieve climate goals if soci-ety focuses solely on the energy sector: consideration of the “embodied” energy of materials has been found to be indispensable for mitigating greenhouse gas emissions (UNEP, 2017a) . Likewise, agricultural intensification, forest/biodiversity conservation, climate change mitiga-tion, soil health maintenance and freshwater protection are all included as fundamental goals in the SDGs, yet they all entail potential synergies and trade offs with other objectives . A whole systems approach is essential tomaximizeco-benefitsandanticipateandmitigatetrade offs in the light of net effects on resource supply and demand (UNEP, 2015b) .
Theworld’sincreasingrelianceontrademakesitdifficultto readily track progress toward the SDGs, particularly where impacts are transboundary . This means that those impacts are either displaced abroad (as in the case of pol-luting industries) or occur at regional or global scales (like when greenhouse gas emissions accumulate to change climate systems at a global scale and land-use change contributes to global biodiversity loss) . National account-ingmetricsforresourceefficiencythatfocussolelyonanation’s direct material consumption do not fully repre-sent all the resources that contribute to economic activity in a given country . Thus, the footprints concept – which
captures resource use across borders – has become critical to assessing progress toward sustainability . Transboundary material footprint assessments, for example,showthataround40 percentofthetotalannualglobal material flows are linked to trade (Wiedmann et al ., 2015) . Furthermore, the indirect or embodied materials in trade far exceed the direct mass of goods traded across nations (by a factor of 4) (ibid) .
Altogether, there is a need for robust monitoring data that are regularly updated and coherent across scales (global, regional, national and city) . A systems approach is required for analysis to connect different types of material resources used in the economy (such as bio-mass, fossil fuels, metals and non-metallic minerals) to their impacts on the environment (pollution, deforesta-tion, biodiversity loss and water depletion) and people (health, well-being and wealth) over time . Such a systems approach (a) takes the whole life cycle of resources used into account (b) uses material flow analysis to link resource use to environmental pressures (through footprints) and (c) considers interactions between human activities and the environment across scale, time and boundary dimensions . It can be used to identify key leveragepointsfordesigningmulti-beneficialpoliciesforachieving SDGs, in particular by considering trade offs and synergies between individual SDGs and providing the data foundation for developing resource-use targets to steer a transition toward sustainable consumption and production systems .

ASSESSING GLOBAL RESOURCE USE
20
Introduction
1.4 The International Resource Panel’s vision for regular resource reporting
5 Ending poverty in all its forms everywhere is Goal 1 of the SDGs . While providing essential services will contribute to increased resource use and thereby pressures, this represents a basic human right at the core of sustainable development . It increases the urgency of addressing drivers such as excessive consumption related to lifestyle and affluence .
The International Resource Panel is hosted by the United Nations Environment Programme (UN Environment) . It is tasked with building and sharing the knowledge needed to increase the sustainability of resource use worldwide . The International Resource Panel aims to develop better ways to promote human well-being and economic growth while minimizing environmental deg-radation and resource depletion . The Panel emphasizes systems thinking and a life-cycle perspective that takes the drivers-pressures-state-impact-response framework intoaccount(seefigure1.2).
This report focuses on the state and trends of ‘material’ resource use (biomass, fossil fuels, metals and non-metallic minerals), with further types of resources (land/water) and greenhouse gas emissions remaining as major areas for future reports . These material resources are assessed from a systems perspective, in keeping with the analytical frame-work for assessing how human-nature systems interact:
� multiple drivers of resource use, including production/consumption patterns, urbanization, economic growth, population growth, lifestyle changes, emerging disruptive technologies, poverty and inequalities in basic services .5
FIGURE 1.2 NaturalresourceuselinkedtotheSustainableDevelopmentGoalsviatheDrivers-Pressures-State-Impact-ResponseFramework
PRESSURES STATE
DR
IVERS
RESPONSE
IMPA
CTS
• Sustainable consumption-production (SDG 12)• Infrastructure transition with emerging technologies (SDG 11)
INCREASED DEMAND FOR• Infrastructure Services• Production• Consumption
VARY ACROSS SCALES AND
GLOBAL GEOGRAPHIC
REGIONS
IMPACT ON HUMAN AND PLANETARY WELL-BEING• Poverty (SDG 1)• Hunger (SDG 2)• Clean water (SDG 6)• Economic growth (SDG 8, 9, 11)• Climate (SDG 13)• Biodiversity (aquatic and
terrestrial) (SDG 14, 15)• Land/soil (SDG 2, 15)• Access to education, equality,
clean energy, infrastructure, etc. (SDG 4, 5, 7, 9, 10)
NATURAL ENVIRONMENT• Depletion of finite resources• Pollution levels (in air, water and
soil) (SDG 3, 14, 15)• Climate extremes (SDG 13)
• Resource use (fuel, metals, minerals, biomass, water and land)
• Pollution emissions in air, water and land (SDG 13, 14, 15)
• Population growth• Migration• Urbanization (SDG 9)• Poverty and inequality
(SDG 1, 10)• Deprivation in basic
infrastructure (SDG 6, 7)
• Affluence and lifestyle changes

A SYSTEMS APPROACH TO RESOURCE EFFICIENCY AND POLLUTION REDUCTION
21
Introduction
1
2
3
4
5
� pressures on the natural environment, represented in terms of both resource use (in material footprints) and environmental impacts .
� as a consequence, the state of the environment dete-riorates: surface and groundwater become polluted, groundwater levels plummet, fertile soils are lost, forests are degraded, city air pollution grows, carbon emissions increase and so forth .
� these changes have various impacts on human and environmental health, leading to premature deaths, hunger, increased species extinction and climate change .
6 Resolution 2/8, point 13 of the 27 May 2016 session, Nairobi; available online: http://www .unep .org/about/cpr/resolutions-adopted-un-environment-assembly-its-second-session .
� a response strategy to keep resource use and the resulting impacts within acceptable levels would be to change production and consumption systems, includ-ing infrastructure systems .
The evidence generated can support socio-technical transi-tions towards the SDGs . Future reports of the International Resource Panel will continuously update the data sets and scenarios to provide a platform where different types of resource use are linked to impacts on the economy, envi-ronment and human well-being . All in all, this report can be taken as a pilot, providing strategic elements for regular reporting based on a new and authoritative database of the International Resource Panel on material flows .
1.5 Structure of the report
This interim report responds to a request at the Second Session of the United Nations Environment Assembly6 to assess the state and trends of natural resource use and provide an outlook on sustainable consumption and production, in a manner that informs transitions toward sustainable development . It aims, in particular, to pro-vide an evidence base for policymaking and to enable monitoring of progress or regression in the interests of achieving SDGs. It is intended to be a short report that highlights important trends, challenges and policies from the unique resource-based systems approach advocated by the International Resource Panel . The scope and depth of analysis shall be expanded in future . With a continued focus on trends and policies, each subsequent report is expected to include a focus issue that addresses an environmental challengeofsignificantconcern,usinganaturalresourcesystems perspective . This report includes a special feature on air pollution in cities . In detail:
� Chapter 2 presents new data and trends related to resource flows of biomass, fossil fuels, metals and non-metallic minerals (including global extraction, environmental impacts, trade, material footprints, driv-ers and future outlook) . It compares the performance of world regions and country groupings (such as low- and high-incomecountries)andidentifiesdriversofmaterialextraction in different national contexts .
� Chapter 3 presents resource-oriented strategies and policies integral to the success of the SDGs . Seven transition strategies towards sustainable consumption
and production systems are presented, including con-sideration of appropriate policy instruments and good practice examples from cities and countries around the world . Policy solutions related to food systems, the built environment, cities and urban infrastructure are exam-ined in more detail .
� Chapter 4 is a special feature that focuses on the link between resource use, infrastructure provisioning, air pollution and human health in cities . It argues that resource-efficienturbaninfrastructuretransformationswill be instrumental in reducing air pollution and co-bene-ficiallyadvancingmultipleSDGsincities.Twoillustrativecase studies of cities at varying stages of development faced with different infrastructure provisioning challenges arepresentedandasetofstrategiesidentifiedthatcancombine to encourage diverse world cities to reduce air pollution while advancing broader sustainability goals .
� Chapter 5 draws together strategic conclusions and summarizeskeyfindings.
All in all, this report will demonstrate the type of analysis possible at different scales to improve the knowledge base and support a common understanding of the challenges and opportunities for action in preventing further degradation of ecosystems across the world and preserving the resource base for generations to come .

ASSESSING GLOBAL RESOURCE USE
22
Introduction
1.6 Key terms, concepts and approaches
7 Available at: www .resourcepanel .org/glossary .
This section describes the key terms, concepts and scien-tificapproachesusedinthisreport.Itislargelybasedonthe online glossary of the International Resource Panel,7 as well as UNEP, 2016e .
DecouplingDecoupling is when resource use or some environmental pressure either grows at a slower rate than the economic activity that is causing it (relative decoupling) or declines while the economic activity continues to grow (absolute decoupling) . The concept of decoupling is represented in figure1.3,whichshowsincreasingtrajectoriesforGDPand human well-being that could result from successful achievementofSDGs.Thefigurealsoshowsthatresource
use can increase at a much slower rate than GDP (relative resource decoupling) and environmental impacts may actu-ally decline (absolute environmental impact decoupling) . Thisconceptualfigurethereforeindicatestheidealgoalofresourceefficiency,throughthenotionofdecoupling–that economic output and human well-being will increase at the same time as rates of resource use and environmen-tal degradation slow down and eventually decline to levels compatible with planetary boundaries (thereby enabling resource use and the delivery of ecosystem goods and services to be sustained for future generations) . So far, there is evidence for resource decoupling at the national level, while decoupling of overall environmental impacts from resource use seems limited .
FIGURE 1.3 Conceptofdecoupling
TIME
Human well-being
Resource use
Environmental impact
Economic activity (GDP)
IMPACT DECOUPLING
RESSOURCE DECOUPLING
Source: UNEP, 2011a.

A SYSTEMS APPROACH TO RESOURCE EFFICIENCY AND POLLUTION REDUCTION
23
Introduction
1
2
3
4
5
DPSIR (Drivers-pressures-state-impacts-response) frameworkThe DPSIR framework (see, inter alia, EEA, 1999) aims to provide a step-wise description of the causal chain linking economic activity (the drivers), the pressures (such as emissions of pollutants), changes in the state of the environment (including land cover change) and impacts (diminished human health and others) . This then leads to a societal response aimed at adapting those driving forces to reduce impacts . It must not be understood as a reactive governance approach that waits for irreversible changes to the environment before responding, but rather an approach that supports preventative action and can be used as an analytical tool for linking human-nature systems in future modelling to help steer a transition .
FootprintsHerein, the term footprints is mainly used to represent the whole system of environmental pressures exerted by a human activity, including direct pressures occurring within the geographical boundary where the activity occurs and indirect/or supply chain pressures outside (transboundary ones) . The direct and indirect pressures can be assigned to different activity sectors, including (a) production (economicoutputinanationorcity),(b)finalconsump-tion (by households, government and business capital formation), and (c) community-wide infrastructure and food supply to the geographic area (including producers and consumers) . Footprints can measure different types of pressures including resource use (such as materials and water), pollution emissions (including emission in air) and environmental impacts (climate change, water scarcity and biodiversity losses and so forth) . Four foot-prints on resource use (abiotic non-energetic materials, land, water and fossil energy) have been found to deter-minemorethan80 percentofallspecificenvironmentalimpacts (Steinmann et al ., 2016) . The material footprint in this report encompasses all material resources used (biomass, fossil fuels, metals and non-metallic minerals extracted/harvested for use; unused extraction is not yet accounted for) . Together with land, water and GHG emis-sion footprints, these four footprints seem to account for most of the potential environmental impact . However, they mustbesupplementedbyspecificindicatorstomeasurespecificenvironmentalimpactssuchaseutrophication.To compare footprints across cities or nations, some type of normalization is necessary (although this has been the subject of much debate) . Normalization into per capita metrics follows consumption-based footprints quite closely . For community infrastructure, the normalization metrics can be either per unit GDP or per capita, and both have been discussed in the literature .
Infrastructure provisioning and food supplyThis term describes the provisioning of essential utilities (water, energy, buildings, sanitation, transportation and waste management) and nutrition supply to commu-nities . These sectors are of particular importance as they address basic needs and are at the core of SDGs related to resource access and inequality . These sectors are essential for human and economic development . They also dominate natural resource use at the global level: togethertheyaccountfor80 percentofglobalmaterialuse,over90 percentofwaterwithdrawalsandaround85 percentofglobalgreenhousegasemissions.Furthermore, they represent the sectors where high-im-pactinterventionstoenhanceresourceefficiencyhavebeen shown to be possible, which encourages a con-certed focus on these sectors (see UNEP, 2017a) .
ResourceefficiencyIngeneralterms,resourceefficiencydescribestheover-arching goals of decoupling — increasing human well-be-ing and economic growth while lowering the amount of resources required . In other words, this means doing betterwithless.Intechnicalterms,resourceefficiencymeans achieving higher outputs with lower inputs and can be reflected by indicators such as resource produc-tivity (including GDP/resource consumption) . Ambitions toachievearesource-efficienteconomythereforerefertosystems of production and consumption that have been optimized with regard to resource use . This includes strategies of dematerialization (savings, reduction of material and energy use) and rematerialization (reuse, remanufacturing and recycling) in a systems-wide approach to a circular economy, as well as infrastructure transitions within sustainable urbanization .
ResourcesResources — including land, water, air and materials — are seen as parts of the natural world that can be used in economic activities to produce goods and services . The focus of this report is on material resources . These include inputs from the environment into the economy such as biomass (like crops for food, energy and bio-based materials, as well as wood for energy and indus-trial uses), fossil fuels (in particular coal, gas and oil for energy), metals (such as iron, aluminum and copper used in construction and electronics manufacturing) and non-metallic minerals (used for construction, notably sand, gravel and limestone) .

ASSESSING GLOBAL RESOURCE USE
Introduction
24
Sustainable consumption and productionAt the Oslo Symposium in 1994, the Norwegian Ministry ofEnvironmentdefinedsustainableconsumptionandproduction as: the use of services and related products that respond to basic needs and bring a better quality of life while minimizing the use of natural resources and toxic materials as well as the emissions of waste and pollutants over the life cycle of the service or product (so as not to jeopardize the needs of future generations) . Ensuring sustainable consumption and production patterns has become an explicit goal of the SDGs (Goal number12),withthespecifictargetofachievingsustain-ablemanagementandefficientuseofnaturalresourcesby2030(seealsofigure3.2inchapter3).The concept thus combines with economic and environmental processes to support the design of policy instruments and tools in a way that minimizes problem shifting and achieves multiple objectives — such as SDGs — simultaneously .
Systems approachThis approach is derived from systems thinking, which is used to identify and understand systems, as well as predicting their behaviours and devising modifications to produce desired effects (Arnold and Wade, 2015) . This report applies the DPSIR Framework to assess the linkages between the use of natural resources in society, through production-consumption systems and essential infrastructure and food provisioning services, as they
impact economic development, human well-being and the environment (as reflected in multiple SDGs) . The system approach (1) considers the total material throughput of the economy from resource extraction and harvest to final disposal, and their environmental impacts (called “pressures”intheDPSIRframework,figure1.4),(2)relatesthese flows to activities in production and consumption (driving forces) across spatial scale, time, nexus and boundary dimensions, and (3) searches for leverage pointsformulti-beneficialchanges(technological,social,or organizational), all encouraged by policies to achieve sustainable production/consumption and multi-scale sustainable resource management . Chapters of this report present different elements of a systems approach . Chapter 2 and chapter 4 identify metrics to track progress towardstheSDGs.Chapter3identifiesasuiteofpoliciesthat support system transformations . Chapter 4 goes on to link infrastructure and natural resource use with economic development, pollution emissions and environmental qual-ity (including air quality), to inform the goal of good health and well-being with reduced levels of resource use .
TransitionThe International Resource Panel sees transition as a process of transformation from current systems of unsus-tainable production and consumption to sustainable ones . It describes long-term, structural changes occurring simul-taneously in economic, political, cultural, technological and environmental areas - and may be steered by policies .
© Deanna Ramsay CIFOR/Flickr

A SYSTEMS APPROACH TO RESOURCE EFFICIENCY AND POLLUTION REDUCTION
Introduction
1
2
3
4
5
25
FIGURE 1.4 Systemsapproachconsideringmaterialflowsandtheirenvironmentalimpactsresultingfromproductionandconsumptionactivities
Landscape changes
Hydrology changes
Biodiversity changes
Soil degradation
etc.
Climate change
Eutrophication
Acidification
Landscape changes
Hydrology changes
Biodiversity losses
Minerals
Fossil fuels
Metal ores
Construction minerals
Industrial minerals
Emission to air/water
Waste deposition
Dissipative losses
Biomass
Water
PRODUCTION
&
CONSUMPTION
Policies
DRIVING FORCES
RESPONSE
IMPACTS IMPACTSPRESSURESInput
Extraction from environment
PRESSURESOutput
Release to environment
ConflictsRisks
HazardsRisks
Source: Bringezu et al., 2016.

© S
hutt
erst
ock
26
ASSESSING GLOBAL RESOURCE USE
2. Global trends and outlook

A SYSTEMS APPROACH TO RESOURCE EFFICIENCY AND POLLUTION REDUCTION
27
Global trends and outlook
1
2
3
4
5
Environmental and sustainability policy require a new evi-dence base that enables the scale of the physical economy to be monitored, that is, the amount of materials and energy used and waste and emissions generated, connected to the production and consumption of goods and services and the provisioning of infrastructure services . This chapter presents trends in global material use and productivity . The purpose of this type of reporting is to provide an evidence base for policymaking and to enable monitoring of the SDGs . The database made available by the International Resource Panelnowcoversalmostfivedecades–1970to2017–and 191 countries.8
This chapter focuses on the total amount of natural resources extracted for further use in the economy, the asso-ciated environmental impacts of resource extraction and the economicefficiencyofmaterialuseinglobalandregionaleconomies.Tradeflowsandmaterialrequirementsoffinaldemand in different world regions are reported, and how these relate to the level of affluence in a country is described . The chapter illustrates where materials are extracted, where they are used and what has driven material extraction in the past.Finally,thechapteridentifiestheenvironmentalandeconomicbenefitsofambitiousresourceefficiencypoliciesto conserve the global natural resource base, abate green-house gas emissions and reduce environmental impacts of resource use .
The analysis is guided by the methodology for national mate-rial flow accounts established at the European Statistical Office(EuropeanStatisticalOffice(EUROSTAT),2001),incol-laboration with the Organisation for Economic Co-operation and Development (OECD, 2008), and adopted by the United
8 Data are sourced from the international databases of reputable international organizations and adapted to the methodological guidelines of material flow accounting . Data sources include the Food and Agriculture Organization of the United Nations (FAO), the International Energy Agency (IEA), the United States Geological Service (USGS) and the United Nations International Trade Statistics Database (COMTRADE) . Most dataset report data are up to 2014 . Data for 2015-2017 are estimated based on existing trends . Data are expected to be updated on a yearly basis .
9 Available at http://www .resourcepanel .org/
Nations Environment Programme (UNEP, 2016c) . The anal-ysis is based on a large and detailed database of material extraction, trade and use9 compiled by the Commonwealth ScientificandIndustrialResearchOrganisation(CSIRO)ofAustralia; the Vienna University of Business and Economics, Austria; Nagoya University, Japan; and the Institute of Social Ecology in Vienna, Austria . Material footprints were calculated with the Eora multi-regional input-output (MRIO) framework of the University of Sydney (Lenzen et al ., 2013) .
This report has focused on direct material use and material footprints . There are plans to monitor other resource and emission footprints in subsequent reports . The material flow accounting approach is based on the notion of indus-trial metabolism (Ayres and Simonis, 1994) and provides a comprehensive overview of the material requirements and the resulting waste and emissions of national economies (figure2.1).TheapproachiscompatiblewiththeSystemof National Accounts and the System of Environmental-Economic Accounting (SEEA) framework (Bartelmus, 2003) .
The material flow accounting framework captures material inputs to the economy (whether imported or extracted domestically); net additions of materials in stocks of build-ings, transport, communication and energy infrastructure; and outflows (disposal of waste and emissions and exports) . It distinguishes direct flows, such as the amount of materi-als in traded goods, and indirect flows that include the raw material requirements of direct imports and exports (as well as unused extraction that may be related to domestic extraction or extraction abroad) . This report focuses on direct flows and the raw material equivalents of imports and exports, but does not cover unused extraction .
FIGURE 2.1 Centralframeworkofmaterialflowaccounting
DEPrimary materials (biomass, fossil fuels, metal ores, non-metallic minerals)
DPOWaste Emissions Dissipative use and loss
NAS
StockBuildings, transport
infrastructure, capital goods
unused extraction
IMPrimary materials and final goods
RMEIM
unused extraction
EXPrimary materials and final goods
RMEEX
unused extraction
Source: UNEP, 2016c.Legend: DE: domestic extraction of materials; IM: (direct) imports; EX: (direct) exports; RMEIM: Raw material equivalent of imports, i.e. direct imports plus upstream material requirements for producing imports; RMEEX: raw material equivalent of exports; NAS: net additions to stock; Stock: assets in-use of buildings, infrastructure, capital and long-lived consumer goods; DPO: domestically processed output, such as waste and emissions generated within the domestic territory; and unused extraction: movement of materials without further economic use. The size of the arrows and boxes does not represent magnitudes.

© U
SAID
/ Fl
ickr
ASSESSING GLOBAL RESOURCE USE
28
Global trends and outlook
2.1 Global trends in natural resource extraction
10 Annex: Assessing Global Resource Use – Tables and Figures for More Information is available at http://www .resourcepanel .org/reports/assessing-global-resource-use)andprovidesthespecificbreakdownineachcategory.
Strong growth in natural resource extraction of biomass, fossil fuels, metal ores and non-metallic minerals continues to support the global economy, and also adds to global environmental pressures and impacts . Global material demand has increasingly been supplied by low-income and middle-income regions, indicating outsourcing of local impacts of resource extraction - often for the sake of producing primary exports to high-income countries.
During the period 1970 to 2010, the annual global use of materials grew from 26 .7 billion tonnes to 75 .6 billion tonnes(seefigure2.2andtheannex).10 In other words, the last three decades of the 20th century saw yearly average growthinglobalmaterialuseof2.3 percent.Annual growth acceleratedto3.5percentinthefirstdecadeofthe21st century – from 2000 to 2010 – and the 2008–2009 global financialcrisishadanegligibleimpactonglobalmaterialuse . From 2010 to 2014, global material use grew again byanadditional7.3billiontonnes,oranaverageof2.3 percent per year, to 82 .9 billion tonnes . This report forecasts that, based on existing trends, global material use will reach 88 .6 billion tonnes in 2017 – more than three times theamountobservedin1970.Thisissignificantbecause,all else being equal, growing material extraction indicates growing environmental pressures and impacts across the globe . Reigning in the total physical scale of the economy isthereforeanimportantfirststeptoreducingwasteandemissions and mitigating overall environmental impacts .
Material demand has continued to shift from biomass and renewable materials to non-renewable materials, creating newwasteflowsandcontributingtohigheremissionsand pollution. The global trend of moving away from tradi-tional to modern technologies, and from agriculture-based economies to urban and industrial economies (and their fast-growing new material requirements), further acceler-atesglobalmaterialuseandcreatessignificantchallengesfor sustainability policy (Steinberger et al ., 2010) .
In 1970, biomass represented one third of all extracted materials, reflecting the large group of developing countries that relied on agriculture and renewable resources, espe-cially in the global South . Biomass extraction grew from 8 .8 billion tonnes in 1970 to 21 .2 billion tonnes in 2014, and is expected to reach 22 .5 billion tonnes in 2017 . This isanaverage2 percentincreaseperyear(whichisslightlyfasterthanaveragepopulationgrowthof1.5 percentperyear) . The share of biomass in global material extraction
had reduced to one quarter of the total by 2014, and is expected to remain at that level in 2017 . The rate of growth has been slowest for those biomass sub-categories where non-biomass alternatives are most easily substituted (such as wood), and where there are hard limits on yields that are not easily improved by advancing technology (including wild-caughtfish).
Fossil fuelshavegrowninabsolutetermsfrom6.2to14.4 bil-lion tonnes, but their share in global extraction decreased from23 percentin1970toaround17 percentin2014.Theyare expected to represent about 15 billion tonnes in 2017 . Theygrewbyanaverageof1.9 percentperyear.Naturalgasand coal had higher growth rates compared with crude oil, which mainly reflects the greatly expanded electricity-gener-ationcapacityofcoal-andgas-firedpowerstations.
Metal oreshadashareof10 percentinglobalmaterialextraction (2 .6 billion tonnes in 1970), which remained at 10 percent(8.2billiontonnes)in2014,andisexpectedtoslightlyexceed10 percent(9.1billiontonnes)in2017.Thisisanaveragegrowthof2.7 percentperyear.
The largest growth in relative terms was in non-metallic minerals,upfrom34 percentin1970toover47 percentin2014(withthisexpectedtoexceed47 percentin2017),reflecting the large shift in global extraction from renewable to non-renewable natural resources . Non-metallic mineral extraction was 9 .2 billion tonnes in 1970, and had reached 38.6billiontonnesin2014.Itisforecastedtoreach41.7 bil-liontonnesin2017.Thisisanaveragegrowthof3.3 percent per year .
Ferrous metals and non-metallic minerals for construction had the highest average growth rates of extraction of all materials, fuelling the major build-up of infrastructure in many transitioning countries (particularly China, India, Brazil and South Africa) .
Over the past four decades, a large shift has occurred in material extraction from Europe and North America to Asia andthePacificandWestAsia(figure2.3).This shift has ratcheted up environmental pressures of primary industries as well as resource flows in Asia and the Pacific, Latin America and the Caribbean and Africa (Schandl and West, 2010; West and Schandl, 2013) . While increased material extraction in the South has underpinned poverty alleviation and growing material standards of living in some countries,

A SYSTEMS APPROACH TO RESOURCE EFFICIENCY AND POLLUTION REDUCTION
29
Global trends and outlook
1
2
3
4
5
it is also associated with considerable environmental (Mudd, 2010) and social (Reeson et al ., 2012) problems .
Additionally, a considerable share of material extraction has occurred for consumption in wealthy parts of the world, while low-income countries have fallen short of yieldingthebenefitsoftheirresourcebase.
In1970,43.6 percentofallmaterialextractionoccurredin Europe and North America, in other words extraction focused on high-income parts of the world at that time . Asia andthePacific,alsothenthemostpopulousworldregionby far, accounted for just one quarter of global material extraction,theformerSovietUnionwasat14 percent,Africaat7.8 percentandLatinAmericaandtheCaribbeanat7.2 percent.Only2.4 percentofglobalmaterialextractionoccurred in West Asia .
This report forecasts that the shift in global material extraction share from Europe and North America to Asia andthePacificwillcontinue. Most of the growth in global material extraction over the four decades from 1970 to 2014wasdrivenbyAsiaandthePacificandWestAsia,whichweregrowingatanannual4.5 percentand3.4 percent respectively . Some of this growth reverberated in the resource-rich region of Latin America, which has seen averageyearlygrowthinmaterialextractionof3 percent.In comparison, yearly average growth in material extraction was0.5 percentinEuropeand0.6 percentinNorthAmerica,perhaps reflecting a continuous process of outsourcing of resource extraction by the rich parts of the world to the fast-growing developing economies, which not only had to supply their growing populations with domestic resources but also have increasingly supplied the wealthy parts of the world (Bruckner et al ., 2012) .
In2017,58.5 percentofallmaterialsareexpected tobeextractedinAsiaandthePacific,8.6 percentinLatin
AmericaandtheCaribbean,8.3 percentinNorthAmericaand8 percentinEurope.Theresource-richregionofAfricaisexpectedtosupply7.3 percentofallglobalmaterials,butmost certainly will see large growth in coming decades .
FIGURE 2.2 Globalmaterialextractioninfourmainmaterialcategories,1970–2017,milliontonnes
Biomass Fossil fuels Non-metallic minerals Metal ores
0
10000
20000
30000
40000
50000
60000
70000
80000
90000
100000
mill
ion
tonn
es
FIGURE 2.3 Regionalsharesinglobalmaterialextraction,1970–2017,milliontonnes
0
10000
30000
20000
40000
50000
60000
mill
ion
tonn
es
Africa
1970 1980
Asia & Pacific
1990
EECCA
2010
North America
West Asia
2017
Europe
2000
Latin America
& Caribbean
Legend: Regional aggregates represent the United Nations Environment regional classification. EECCA refers to Eastern Europe, Caucasus and Central Asia.
2.2 Material productivity
Material productivity is seen as an important feature of managing natural resources sustainably, and yet the amount of economic value that we can extract from every kilogram of material and every megajoule (MJ)of energy has been decreasing or stagnant since about the year 2000 (Schandl and West, 2010) .
Over the last 45 years, the global average for labour pro-ductivity – USD per hour of work – has almost doubled .
Energy productivity – USD per MJ – has risen substan-tially since the oil price shocks in the 1970s (at a lower rate than labour productivity), and has plateaued since about 2000 . This has been caused by the energy transi-tion in many developing economies, which involved steep increases in electricity supply and fuel use for transport and mobility . As a result, energy use has started to grow faster than GDP . Improvements in material productivity – USD per kg - posted the slowest progress of all three factor

ASSESSING GLOBAL RESOURCE USE
30
Global trends and outlook
productivities and started to decline around the year 2000 . The decline in material productivity is attributable to a shift in the share of global output from highly material productive economies (such as Japan) to less productive economies such as the BRICS (Brazil, Russian Federation, India, China and South Africa) countries . Urbanization and industri-alization in many developing economies have required large amounts of materials to build the infrastructure and manufacturing capacity to fuel economic growth, increase human well-being and reduce poverty . This has ratcheted up material use, which has grown faster than GDP . In 2015, the global economy gained 0 .75 USD per kg of material and 0 .10 USD per MJ of energy compared to 6 .50 USD per hour of work on average .11
Decreasing material and energy productivity is bad econom-ically – it means reduction of potential economic growth – and also bad environmentally as pressures and impacts upon the environment grow disproportionally faster than the production of goods and services . Investing in material and energy productivity is therefore a main area for improving the integration of economic and environmental objectives (UNEP, 2017a) .
Improving material and energy efficiency is a necessary but not sufficient strategy for achieving environmental sustainability . In the past, labour productivity gains have been achieved against the backdrop of reducing resource
11 Material productivity is calculated as global GDP at 2005 prices per unit of material extraction (global DE); energy productivity is GDP per energy use (global energy supply); labour productivity as GDP per labour hours (global labour volume) .
productivity . This is an effect of substitution between labour and capital, where the latter relies on materials to establish new capital and energy to fuel it . A new economic paradigm is needed that improves resource productivity and allows for production and consumption systems to be run with lower material and energy requirements, as well as reduced waste and emissions . This would allow refocusing from a single objective of labour productivity to a multi-factor productivity objective .
FIGURE 2.4 Globalmaterialproductivitycomparedtolabourandenergyproductivity
Inde
x 19
70 =
100
100
200
175
150
125
1970 1975 1980 1990 1995 2000 2005 2010 20151985
Material Productivity
EnergyProductivity
LabourProductivity
2.3 Environmental impacts of materials extraction
Environmental impacts occur at all stages of material utilization, as they result from extraction, transformation, productuseandwastemanagement(seefigure2.5andfigure1.4).Someofthegrowthinnegativeenvironmentalimpacts may be offset by circular economy initiatives where virgin material input is replaced by recycled mate-rials, remanufacturing and reuse (Allwood and Cullen, 2012) . The objective of the International Resource Panel
is to measure environmental impacts comprehensively . In this report, environmental impacts related to the extraction ofspecific(groupsof)materialresourcesovertimeareassessed . Nevertheless, it should be borne in mind that resource flows also determine the flow of materials through production and consumption and all subsequent waste and emissions released back to the environment, including various bundles of impacts .
FIGURE 2.5 Thelifecycleofresourceuse
EXTRACTIONof primary materials
renewable and non-renewable
TRANSFORMATIONProduction of goods,
services and infrastructure
USEConsumption of housing, mobility, food, consumer
goods
WASTE MANAGEMENTRecycling, incineration,
landfill
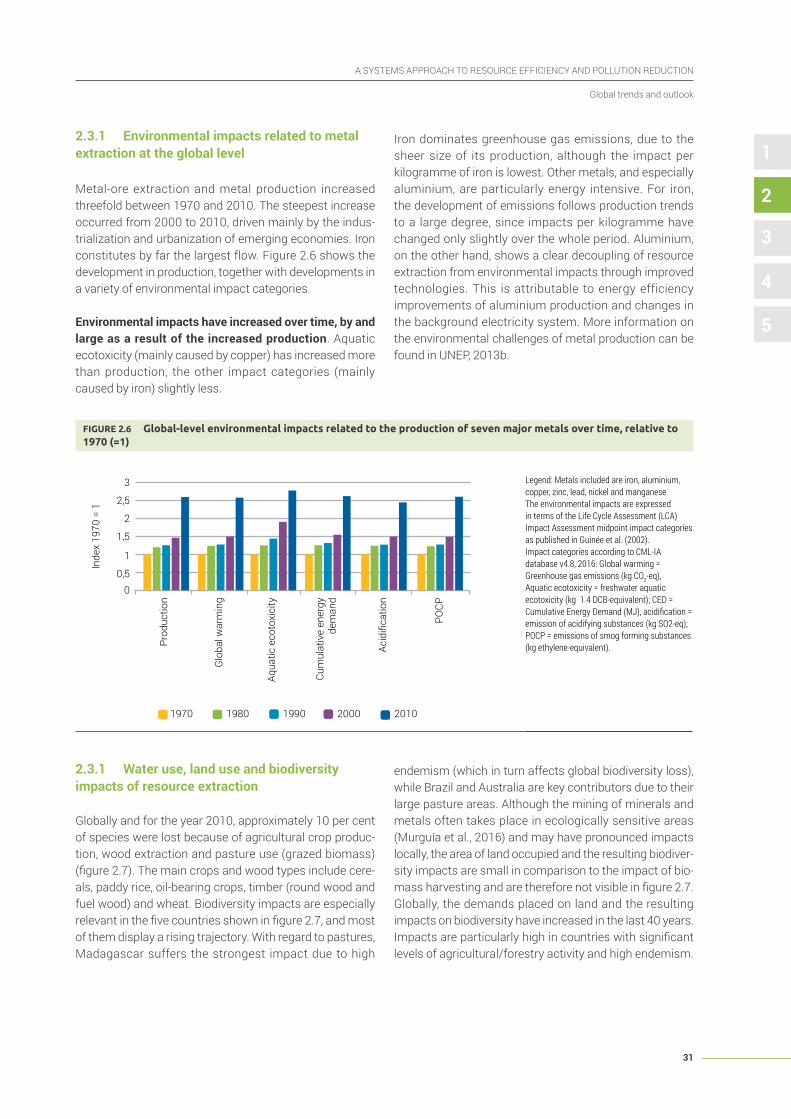
A SYSTEMS APPROACH TO RESOURCE EFFICIENCY AND POLLUTION REDUCTION
31
Global trends and outlook
1
2
3
4
5
2.3.1 Environmental impacts related to metal extraction at the global level
Metal-ore extraction and metal production increased threefold between 1970 and 2010 . The steepest increase occurred from 2000 to 2010, driven mainly by the indus-trialization and urbanization of emerging economies . Iron constitutes by far the largest flow . Figure 2 .6 shows the development in production, together with developments in a variety of environmental impact categories .
Environmental impacts have increased over time, by and large as a result of the increased production . Aquatic ecotoxicity (mainly caused by copper) has increased more than production, the other impact categories (mainly caused by iron) slightly less .
Iron dominates greenhouse gas emissions, due to the sheer size of its production, although the impact per kilogramme of iron is lowest . Other metals, and especially aluminium, are particularly energy intensive . For iron, the development of emissions follows production trends to a large degree, since impacts per kilogramme have changed only slightly over the whole period . Aluminium, on the other hand, shows a clear decoupling of resource extraction from environmental impacts through improved technologies . This is attributable to energy efficiency improvements of aluminium production and changes in the background electricity system . More information on the environmental challenges of metal production can be found in UNEP, 2013b .
FIGURE 2.6 Global-levelenvironmentalimpactsrelatedtotheproductionofsevenmajormetalsovertime,relativeto1970(=1)
00,5
1
1,5
2
2,5
3
Prod
uctio
n
Glo
bal w
arm
ing
Aqua
tic e
coto
xici
ty
Cum
ulat
ive
ener
gy
dem
and
Acidifica
tion
POCP
Inde
x 19
70 =
1
1970 1980 1990 2000 2010
Legend: Metals included are iron, aluminium, copper, zinc, lead, nickel and manganeseThe environmental impacts are expressed in terms of the Life Cycle Assessment (LCA) Impact Assessment midpoint impact categories as published in Guinée et al. (2002). Impact categories according to CML-IA database v4.8, 2016: Global warming = Greenhouse gas emissions (kg CO2-eq), Aquatic ecotoxicity = freshwater aquatic ecotoxicity (kg 1.4 DCB-equivalent); CED = Cumulative Energy Demand (MJ), acidification = emission of acidifying substances (kg SO2-eq); POCP = emissions of smog forming substances (kg ethylene-equivalent).
2.3.1 Water use, land use and biodiversity impacts of resource extraction
Globallyandfortheyear2010,approximately10 percentof species were lost because of agricultural crop produc-tion, wood extraction and pasture use (grazed biomass) (figure2.7).Themaincropsandwoodtypesincludecere-als, paddy rice, oil-bearing crops, timber (round wood and fuel wood) and wheat . Biodiversity impacts are especially relevantinthefivecountriesshowninfigure2.7,andmostof them display a rising trajectory . With regard to pastures, Madagascar suffers the strongest impact due to high
endemism (which in turn affects global biodiversity loss), while Brazil and Australia are key contributors due to their large pasture areas . Although the mining of minerals and metals often takes place in ecologically sensitive areas (Murguía et al ., 2016) and may have pronounced impacts locally, the area of land occupied and the resulting biodiver-sity impacts are small in comparison to the impact of bio-massharvestingandarethereforenotvisibleinfigure 2.7.Globally, the demands placed on land and the resulting impacts on biodiversity have increased in the last 40 years . Impactsareparticularlyhighincountrieswithsignificantlevels of agricultural/forestry activity and high endemism .

ASSESSING GLOBAL RESOURCE USE
32
Global trends and outlook
FIGURE2.7 Globalbiodiversityloss(proportionofspecieslost)duetolanduseassociatedwithglobalresourceextraction(leftfigure)andthetopfivecountriesintermsofimpacts(rightfigure)
1970 1975 1980 1985 1990 1995 2000 2005 2010
0,01
0,008
0,006
0,004
0,002
0
Brazil India Madagascar
Indonesia China
perc
enta
ge o
f glo
bal
spec
ies
loss
2010
2%
0%
4%
6%
8%
10%
1972
1970
1974
1976
1978
1980
1982
1984
1986
1988
1990
1992
1994
1996
1998
2000
2002
2004
2006
2008
Agricultural crops
Pasture (grazed biomass)
Wood extraction
Metal ores
Non-metallic minerals, clay, kaolin, peat
perc
enta
ge o
f glo
bal
spec
ies
loss
Note: The indicator for biodiversity loss (UNEP and Society of Environmental Toxicology and Chemistry (SETAC), 2016) due to land use measures the percentage of global species lost under steady-state conditions, in other words the global extinctions that will result as a consequence of current land use. Only direct land use (such as for mining sites and related infrastructure) was counted, while indirect land uses were ignored (such as settlements that form due to a new mining site). Therefore, the results should be understood as a lower-bound estimate of the impacts of resource extraction.
FIGURE 2.8 Trendsofwaterconsumptionimpacts[m3-eq.]forcropbiomassproductioninthetopfivecountriesforwaterscarcityimpact
1970
1965
1975
1980
1985
1990
1995
2000
2005
2010
2015
1,00E+13
1,20E+13
8,00E+12
6,00E+12
4,00E+12
2,00E+12
0,00E+00
ChinaIndiaUnited StatesPakistanEgypt
Note: The unit of “m3-eq.” denotes equivalents of water consumed under conditions of global average water stress (UNEP and SETAC, 2016).
FIGURE2.9 TrendsofGDP,populationgrowth,amountofresourceextractionandbiodiversityimpacts(1970indexedto1)
1970 1980 1990 2000 2010
0,0
1,0
2,0
3,0
4,0
GDP
Inde
x
Popu
latio
n
DE b
iom
ass
DE m
etal
ore
s
DE n
on-m
etal
lic m
iner
als
DE fo
ssil
fuel
s
Wat
er im
pact
s of
cro
p pr
oduc
tion
Biod
iver
sity
loss
re
sour
ce e
xtra
ctio
n
GH
G e
mis
sion
s m
etal
ex
trac
tion
Sources: World Bank, United Nations and the Global Material Flows Database.

A SYSTEMS APPROACH TO RESOURCE EFFICIENCY AND POLLUTION REDUCTION
33
Global trends and outlook
1
2
3
4
5
Although water scarcity12 is mainly driven by wheat pro-duction, rice, other cereals, fruits and oil crops groups also contribute a high share . Water impact for crop production is particularly relevant in the five countries shown in figure 2.8.Waterscarcityforcropsincreasedgloballybyafactor of 2 .3 from 1970–2010, with the greatest impact in China, where it increased by a factor of 3 .4 .
As depicted in figure 2 .9, the amounts of resources extracted increased less than GDP, indicating decoupling . Compared with population trends, per capita water impacts have increased, while per capita land impacts on biodiversity decreased . Compared to GDP, decoupling of both water impacts and biodiversity land impacts can be observed . However, this decoupling should not distract from the fact that biodiversity loss is still increasing in absolute terms and represents one of the planetary boundaries that has already been exceeded (Steffen et al ., 2015) . The projected increase in global population will lead to a further increase in demand for food and other biomass, indicating that further decoupling is needed to limit biodiversity impacts .
ForGHGemissionsrelatedtometals,figure2.9showsarelative decoupling between GDP and metal production
12 The indicator for water impacts (UNEP and SETAC, 2016) is a measure of water scarcity and resulting water deprivation for humans and ecosystems . A m3 extracted in a water-scarce region is multiplied by a scarcity factor .
in the 1970–2000 period, followed by a re-coupling in the decade to 2010 . Greenhouse gas (GHG) emissions closely follow production of iron . For the metals group, it appears that the dynamics of demand development are not straightforwardly determined by GDP . The decoupling during 1970–2000 probably has to do with stock satu-ration in OECD countries, and the recoupling afterwards with the rapid build-up of the infrastructure of emerg-ing economies . Demand, therefore, can be expected to continue to grow rapidly for the period to come . Impact decoupling for metals is also not straightforward . The transition towards a renewable energy system plays an important role in two ways . Initially, the build-up of such a system will require an additional input of metals, includ-ing major metals such as copper, aluminium and steel (UNEP, 2015) . Emissions related to metal production will increase as well . In the end, energy-intensive metals can beexpectedtobenefitfromatransitiontowardsarenew-able energy system, as emissions of energy production will go down . For iron, however, impact decoupling can only be expected as a result of radical changes in tech-nology and/or society: either the development of novel low-carbonproductionprocesses,orasignificantlylargershare of secondary production .
2.4 Trade of materials
Some primary materials (such as biomass, sand and gravel) are widely available in a large number of coun-tries, while others (such as metal ores and fossil fuels) are concentrated in just a few . Trade in primary materials mitigates regional imbalances in resource availability and
supports production and consumption systems world-wide . Markets for many strategic primary materials - such as oil, coal, iron ore and aluminum - have become global, and price volatility has become a dominant feature of resource trade between countries .
BOX 2.1 Doesinternationaltradeimproveorworsentheglobalefficiencyofresourceuse?
The International Resource Panel report International Trade in Resources: A biophysical assessment (UNEP, 2015a) asked how trade affects the global efficiency of resource use. It found evidence that upstream resource requirements of trade are, for the most part, rising. Various factors may be driving this growth, including an increasing share of higher-processed goods in total trade and higher trade activities in general. At the same time, we see declining ore grades for metals and industrial minerals, as well as declining energy returns on energy investment for fossil fuels. The increas-ing consumption of fossil energy carriers for fuelling transport and increasing virtual water consumption, due to growth in demand for food from arid regions, also contributes to rising upstream requirements. Such factors may completely cancel out a potentially better allocation of extraction and production processes through world trade. As such, the answer to the question of whether trade leads to greater global environmental efficiency remains undetermined. It does appear, however, that trade leads to a redistribution of environmental burdens towards resource-extracting and producing countries. By depleting their natural resources, exporting countries have to deal with waste and emissions from primary processing, and may not be gaining high economic revenues. For instance, the export of biomass from regions such as Latin America, North America and areas in Sub-Saharan Africa has led to loss of forest cover, land degradation and other negative ecosystem changes. This makes mitigating such adverse environmental impacts a key role of policy. For example, regulatory framework changes accompanied by favourable advancements in process technologies and voluntary initiatives reduced harmful sulphur dioxide emissions from the mining of platinum by up to 90 per cent. Policy initiatives, such as the phasing out of fossil fuel subsidies, could act as a catalyst in discouraging extraction and consumption of fossil fuels, thereby reducing carbon dioxide (CO2) and sulphur dioxide (SO2) emissions and spearheading the urgently needed transition towards renewable resources.
Source: UNEP, 2015a.

ASSESSING GLOBAL RESOURCE USE
34
Global trends and outlook
FIGURE2.10 Globaltradeinmaterials,bymaterialcategory,1970-2017(milliontonnes)
Biomass Fossil fuels Non-metallic minerals Metal ores
0
2 000
4 000
6 000
8 000
10 000
12 000
17 000
mill
ion
tonn
es
Trade also redistributes incomes, employment and envi-ronmental pressures and impacts among countries, as well as spreading out the opportunities, risks and vulnera-bilities of national economies. Exporting countries receive some of the trade revenues thorough royalties and tax revenues, but also accept environmental and social impacts relatedtosignificantexport-orientedindustries.Importingcountries face issues of supply security and price volatility . Trade also adds to the growth dynamic of global resource use. Recent decades were characterized by increasing trade liberalization, leading to growing levels of globalization of financial,labourandnaturalresourcemarkets.Inthelightof current global policy trends, however, it is questionable whether globalization will continue in a similar fashion to past decades (Bello, 2017) . This may require countries to reassess their dependence on traded commodities .
Trade in primary materials, and commodities made from those materials, has grown strongly and surpassed growth rates in domestic extraction . The global economy is now more dependent on material trade than ever before. Although growth in global trade of materials and com-moditiesstalledduringthefinancialcrisisin2008–2009,it experienced a rapid recovery. Trade volumes have been dominated by primary materials and basic commodities, with fossil fuels accounting for 50 per cent of the total global trade volume in 2014.
Between 1970 and 2017, the quantity of traded materials morethantripled,growingfrom2.7 billiontonnesto11.6 bil-lion tonnes . This amounts to an average annual growth rate of3.2 percent,outpacingthegrowthinglobalmaterialextraction(whichwasonaverage2.6 percentperyearduring the same period) . This roughly linear trend was only disrupted in 1975, 1980-82 and most recently by the 2008–9 globalfinancialcrisis,resultingina3.6 percentdropin2009 physical trade volume . While physical trade recovered
to its pre-crisis level and growth trend in 2010, monetary trade growth has been sluggish ever since (International Monetary Fund (IMF), 2016) . The material composition of trade was relatively stable over the last four decades with fossil fuels by far dominating the total quantity, followed by metal ores and biomass .
2.4.1 Which world regions dominate global imports and exports of materials? The rise of Asia
There are large differences in scale, dynamic and material composition of imports among the seven world regions . AsiaandthePacificexperiencedthehighestgrowthratesand became the largest importing region . Overall, the three largestimportingregionsin2017areAsiaandthePacific(representing48 percentofallimports),Europeat28 percentandNorthAmericaat8 percent.Thesethreeregionscombinedaccountfor84 percentofallphysicalimports.In1970,thegroupofhigh-incomecountriesreceived93 percent of all imports . Today, the situation is more balanced withhigh-incomecountriesreceiving52 percent,upper-mid-dle-incomecountries34 percentandlower-middle-incomecountries13 percentofallimports.Low-incomecountriesare mostly excluded from physical trade flows (See also figureA1intheAnnex).
The regional balance for exporting regions is more even than that relating to imports . West Asia and Europe had the largestexportshareofaround20 percenteachin1970.In2017,AsiaandthePacificrecordedanexportshareof31 percent,followedbyEuropeat17 percent.Differencesin scale, dynamic and material composition of exports can be observed, but they are less pronounced than in the case of imports . Asia experienced the highest growth rates and has become the largest exporting region . China, India and the Russian Federation account for a large share of this effect . Fossil fuels dominate export volumes in all regions, with two exceptions: Latin America’s export of metals and oresequalleditsfossilfuelexportsafterthefinancialcrisis.North America’s fossil fuel exports overtook its biomass exports in 1999, and have dominated export composition ever since . Exports have been concentrated on high-income countries,witha60 percentsharein2017.Upper-andlower-middle-incomecountriescombinedexported40 percent of all exported materials . Exports from low-income countries were negligible in terms of the amounts involved (seealsofigureA.2intheAnnex).
Inrecentdecades,AsiaandthePacificandEuropehavebeen net importers of materials while all other regions were net exporters. North America turned from a net importer to a net exporter in 2011, but only by a very small margin.
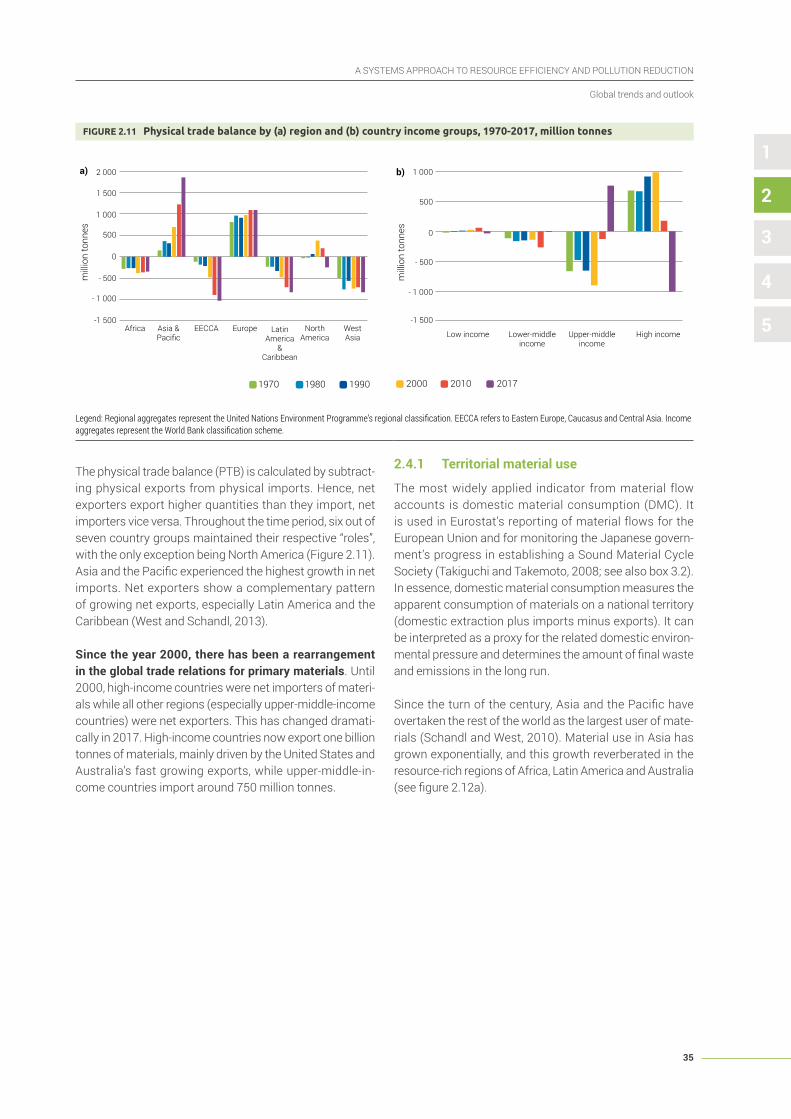
A SYSTEMS APPROACH TO RESOURCE EFFICIENCY AND POLLUTION REDUCTION
35
Global trends and outlook
1
2
3
4
5
FIGURE 2.11 Physicaltradebalanceby(a)regionand(b)countryincomegroups,1970-2017,milliontonnes
Low income Lower-middle income
Upper-middle income
High income
2010 20172000
0
500
- 500
1 000
- 1 000
-1 500
mill
ion
tonn
es
1970 1980 1990
Africa Asia & Pacific
NorthAmerica
WestAsia
EECCA Europe Latin America
& Caribbean
0
500
- 500
1 000
- 1 000
1 500
2 000
-1 500
mill
ion
tonn
es
a)
b)
Low income Lower-middle income
Upper-middle income
High income
2010 20172000
0
500
- 500
1 000
- 1 000
-1 500
mill
ion
tonn
es
1970 1980 1990
Africa Asia & Pacific
NorthAmerica
WestAsia
EECCA Europe Latin America
& Caribbean
0
500
- 500
1 000
- 1 000
1 500
2 000
-1 500
mill
ion
tonn
es
a)
b)
Legend: Regional aggregates represent the United Nations Environment Programme’s regional classification. EECCA refers to Eastern Europe, Caucasus and Central Asia. Income aggregates represent the World Bank classification scheme.
The physical trade balance (PTB) is calculated by subtract-ing physical exports from physical imports . Hence, net exporters export higher quantities than they import, net importers vice versa . Throughout the time period, six out of seven country groups maintained their respective “roles”, with the only exception being North America (Figure 2 .11) . AsiaandthePacificexperiencedthehighestgrowthinnetimports . Net exporters show a complementary pattern of growing net exports, especially Latin America and the Caribbean (West and Schandl, 2013) .
Since the year 2000, there has been a rearrangement in the global trade relations for primary materials . Until 2000, high-income countries were net importers of materi-als while all other regions (especially upper-middle-income countries) were net exporters . This has changed dramati-cally in 2017 . High-income countries now export one billion tonnes of materials, mainly driven by the United States and Australia’s fast growing exports, while upper-middle-in-comecountriesimportaround750 milliontonnes.
2.4.1 Territorial material use
The most widely applied indicator from material flow accounts is domestic material consumption (DMC) . It is used in Eurostat’s reporting of material flows for the European Union and for monitoring the Japanese govern-ment’s progress in establishing a Sound Material Cycle Society (Takiguchi and Takemoto, 2008; see also box 3 .2) . In essence, domestic material consumption measures the apparent consumption of materials on a national territory (domestic extraction plus imports minus exports) . It can be interpreted as a proxy for the related domestic environ-mentalpressureanddeterminestheamountoffinalwasteand emissions in the long run .
Sincetheturnofthecentury,AsiaandthePacifichaveovertaken the rest of the world as the largest user of mate-rials (Schandl and West, 2010) . Material use in Asia has grown exponentially, and this growth reverberated in the resource-rich regions of Africa, Latin America and Australia (seefigure2.12a).

ASSESSING GLOBAL RESOURCE USE
36
Global trends and outlook
FIGURE 2.12 Domesticmaterialconsumptionbyregion(a)totals,milliontonnesand(b)per-capita
Wor
ld
0
5,0
10,0
15,0
20,0
25,0
30,0
35,0
tonn
es
Afric
a
Asia
&
Pacific
Nor
thAm
eric
a
Wes
tAs
ia
EECC
A
Euro
pe
Latin
Am
eric
a &
Carib
bean
0
10 000
20 000
30 000
40 000
50 000
60 000
mill
ion
tonn
es
1970 1980 1990 2010 20172000
Afric
a
Asia
&
Pacific
Nor
thAm
eric
a
Wes
tAs
ia
EECC
A
Euro
pe
Latin
Am
eric
a &
Carib
bean
a) b)
On a per capita level, North America remains the largest material user (albeit as part of a downward trend) . Asia and thePacificandWestAsiahavecaughtupwithEuropeinterms of territorial per capita material use . The global per capitaaverageofmaterialusehasgrownfrom7.2 tonnesto 11 .8 tonnes . This means that the environmental pres-sureofanaveragepersongloballyhasincreasedby1.1 percent per year between 1970 and 2017 .
2.4.1 Supply chains underpin the material requirements of international trade
Trade flows are linked to upstream commodity production in the countries of origin of trade flows . This production requires material extraction, which often leads to envi-ronmental impacts where materials are extracted . New analytical tools allow assessment of the raw material equiv-alents (RME) of trade flows, that is, the amount of primary raw materials required along the supply chain to produce commodities .
The raw material equivalents of imports, measured on a per capita basis, are highest in Europe and North America,atfourtimestheworldaverage,reflectingtheseregions’highlevelsofaffluenceandconsumption.The highest per capita raw material equivalents of exports are observed in the oil-exporting regions of West Asia and the Eastern Europe, Caucasus and Central Asia (EECCA) . As a result, the raw material trade balance shows Europe and North America as net importers and West Asia and EECCA as net exporters of materials embodied in trade . Other regions have a low per capita raw material equivalent trade balance.However,withintheseregionsspecificcountriesshow very large differences .
The raw material trade balance by income groups of countries demonstrates the extent to which high-income countries rely on the resource base of the rest of the world through trade relations . The fact that the raw material trade balance for high-income countries is still growing showsthatthedependenceofaffluentnationsontheresource base and manufacturing capacity of the world is continuing to grow .

A SYSTEMS APPROACH TO RESOURCE EFFICIENCY AND POLLUTION REDUCTION
37
Global trends and outlook
1
2
3
4
5
FIGURE 2.13 Percapitarawmaterialequivalentsofimportsandexports,andrawmaterialtradebalance,by region,1990,2000,2010,2017(tonnespercapita)
1990 2010 20172000
0
5,0
- 5,0
10,0
- 10,0
15,0
-15,0
tonn
es
Per-capita raw material trade balance by region
Afric
a
Asia
&
Pacific
Nor
thAm
eric
a
Wes
tAs
ia
Wor
ld
EECC
A
Euro
pe
Latin
Am
eric
a &
Carib
bean
0,0
4,06,08,0
10,012,014,016,018,0
2,0
tonn
es
Afric
a
Asia
&
Pacific
Nor
thAm
eric
a
Wes
tAs
ia
Wor
ld
EECC
A
Euro
pe
Latin
Am
eric
a &
Carib
bean
Per-capita RME of exports by region
0,0
4,06,08,0
10,012,014,016,018,0
2,0
tonn
es
Per-capita RME of imports by region
Afric
a
Asia
&
Pacific
Nor
thAm
eric
a
Wes
tAs
ia
Wor
ld
EECC
A
Euro
pe
Latin
Am
eric
a &
Carib
bean
FIGURE 2.14 Percapitarawmaterialequivalentsofimportsandexports,andrawmaterialtradebalance,byincomegroup,1990,2000,2010,2017(tonnespercapita)
1990 2010 20172000
2
4
0
6
- 2
8
-4
tonn
es
Per-capita raw material trade balance by region
Low
inco
me
Hig
hin
com
e
Wor
ld
Low
er
mid
dle
inco
me
Upp
erm
iddl
e in
com
e
0
23456789
10
1
tonn
esPer-capita RME of exports by region
Low
inco
me
Hig
hin
com
e
Wor
ld
Low
er
mid
dle
inco
me
Upp
erm
iddl
e in
com
e
0,0
4,06,08,0
10,012,014,016,018,0
2,0
tonn
es
Per-capita RME of imports by region
Low
inco
me
Hig
hin
com
e
Wor
ld
Low
er
mid
dle
inco
me
Upp
erm
iddl
e in
com
e

ASSESSING GLOBAL RESOURCE USE
38
Global trends and outlook
2.5 Material footprints
The concept of a material footprint offers an additional perspective on a country’s material use by attributing material extraction, wherever it may have occurred globally, along supply chains of different products and servicestofinaldomesticdemand(Giljumetal.,2015).It is therefore a measure of the material requirement of the consumption and infrastructure system of a country (Wiedmann et al ., 2015) . Indirectly, it also indicates the materialflowbasedenvironmentalpressureoffinalcon-sumption across the entire supply chain .
Materialfootprintdevelopmentsdiffersignificantlyfromindicators of direct material flows (such as domestic material consumption) . For the period 1990–2008, Wiedmann et al . (2015) showed that, in many industri-alized countries, domestic material consumption trends declined(byabout20 percentinJapanandtheUnitedKingdom), while material footprint trends increased (by about30 percentoreven60 percent,respectively).Onthe other hand, in resource-extracting countries like Chile, Brazil and India, domestic material consumption and material footprints show similar developments .
AsiaandthePacificisthemostpopulousworldregionand features a fast-growing and increasingly commen-surate claim on global materials supply . In 2017, more than half of global material use is destined for final demand (consumption and capital investment) in Asia andthePacific. Europe and North America are of similar importanceandeachrequiresaround15 percentoftheglobalmaterialsupplyfortheirfinaldemand.
An analysis of the material footprint per capita shows North America requiring about 30 tonnes of material per capitaforfinaldemand.MaterialconsumptioninEuropeismore moderate, and the fastest growth has been occurring inAsiaandthePacific.Africa, on the contrary, has seen nogrowthinpercapitamaterialsupplyforfinaldemandover the past three decades, which coincides with a stagnating material standard of living of large parts of the population . In other words, material and infrastructure supply is not keeping up with fast population growth .
The average per capita material footprint of Asia and the Pacifichasgrownfrom4.8tonnespercapitain1990to11.4tonnespercapitain2017,a3.2 percentaverageyearly growth, which bears testament to rapid economic growth underpinned by the region’s unprecedented indus-trial and urban transitions (in scale and speed) . Average growth of the per capita material footprint in Europe, Latin
America and the Caribbean and West Asia was half that ofAsiaandthePacific,ataround1.4 percentaveragegrowth per year . In 2017, Europe’s per capita material footprint was around 20 .6 tonnes, which was twice that of Latin America at 10 .2 tonnes per capita and West Asia at 9 .6 tonnes per capita .
Per capita material footprints in North America have seen asignificantdownwardadjustmentfrom36.1 tonnespercapita in 2000 to 31 .9 tonnes per capita in 2010, mainly as a result of the global financial crisis and the large decrease in consumption and investment that has been prevalent since that time . The EECCA region saw a very sharp downward adjustment after the break up of the SovietUnion,andhassincerecoveredtoreach9.8 tonnesper capita material footprint in 2017 . Africa continues to have the lowest level of materials available per capita for finalconsumptionandinvestment,justbelow3tonnespercapitain2017,andanoverallyearlydeclineof0.6 percentsince1990,whichpointstoasignificantincentivefor increasing material standards of living in this region . While absolute material footprint levels are by far highestinAsiaandthePacificduetohighpopulationnumbers, North America and Europe remain the top consumers with regard to per capita levels .
In 2010, upper-middle-income countries were on a par with high-income countries in terms of their material requirements for final demand (around 30 billion tonnes) . Growth in the material footprint has been mod-erate in high-income countries since about 2000, while upper-middle-income countries have seen a rapid overall increase over the past two decades . They have now over-taken high-income countries and require 40 billion tonnes in 2017 (compared to a little above 30 billion tonnes in high-income countries) . Lower-income countries do not matchthelevelorpaceofmaterialsupplytofinalcon-sumption and for building much-needed infrastructure, which perpetuates ingrained inequalities in resource distribution around the globe .
On a per capita basis, high-income countries still consume 10 times more materials than low-income countries . Material footprints have somewhat stabilized in high-income countries and have grown strongly in upper-middle-income countries (and to a lesser extent in lower-middle-income nations) . Low-income countries rely on a very small per capita material footprint with no significantincreaseinpercapitanaturalresourcesupplyover the last 30 years .
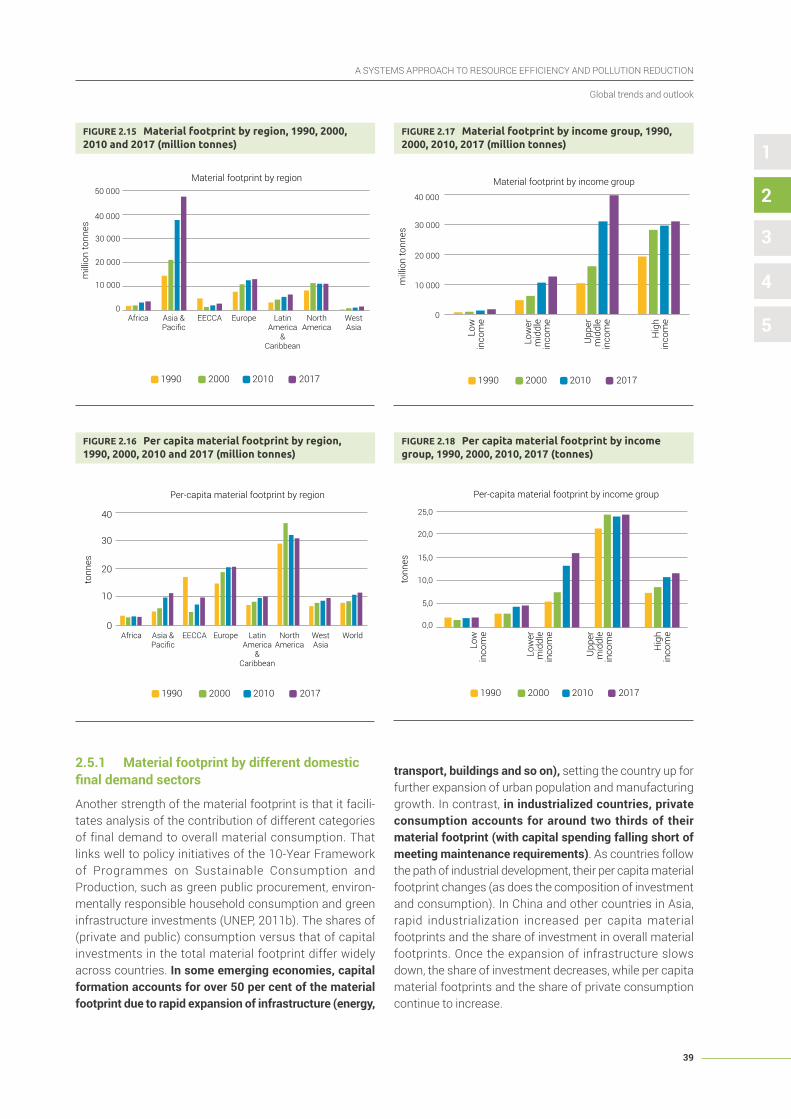
A SYSTEMS APPROACH TO RESOURCE EFFICIENCY AND POLLUTION REDUCTION
39
Global trends and outlook
1
2
3
4
5
FIGURE 2.15 Materialfootprintbyregion,1990,2000,2010and2017(milliontonnes)
Africa Asia & Pacific
NorthAmerica
WestAsia
EECCA Europe Latin America
& Caribbean
0
10 000
20 000
30 000
40 000
50 000
mill
ion
tonn
es
Material footprint by region
1990 2010 20172000
FIGURE 2.16 Percapitamaterialfootprintbyregion,1990,2000,2010and2017(milliontonnes)
0
10
20
30
40
tonn
es
Per-capita material footprint by region
1990 2010 20172000
Africa Asia & Pacific
NorthAmerica
WestAsia
WorldEECCA Europe Latin America
& Caribbean
FIGURE2.17 Materialfootprintbyincomegroup,1990,2000,2010,2017(milliontonnes)
mill
ion
tonn
es
Material footprint by income group
1990 2010 20172000
Low
inco
me
Hig
hin
com
e
Low
er
mid
dle
inco
me
Upp
erm
iddl
e in
com
e0
10 000
20 000
30 000
40 000
FIGURE 2.18 Percapitamaterialfootprintbyincomegroup,1990,2000,2010,2017(tonnes)
tonn
es
Per-capita material footprint by income group
1990 2010 20172000
Low
inco
me
Hig
hin
com
e
Low
er
mid
dle
inco
me
Upp
erm
iddl
e in
com
e
0,0
10,0
5,0
20,0
15,0
25,0
2.5.1 Material footprint by different domestic finaldemandsectors
Another strength of the material footprint is that it facili-tates analysis of the contribution of different categories of final demand to overall material consumption . That links well to policy initiatives of the 10-Year Framework of Programmes on Sustainable Consumption and Production, such as green public procurement, environ-mentally responsible household consumption and green infrastructure investments (UNEP, 2011b) . The shares of (private and public) consumption versus that of capital investments in the total material footprint differ widely across countries . In some emerging economies, capital formation accounts for over 50 per cent of the material footprint due to rapid expansion of infrastructure (energy,
transport, buildings and so on), setting the country up for further expansion of urban population and manufacturing growth . In contrast, in industrialized countries, private consumption accounts for around two thirds of their material footprint (with capital spending falling short of meeting maintenance requirements) . As countries follow the path of industrial development, their per capita material footprint changes (as does the composition of investment and consumption) . In China and other countries in Asia, rapid industrialization increased per capita material footprints and the share of investment in overall material footprints . Once the expansion of infrastructure slows down, the share of investment decreases, while per capita material footprints and the share of private consumption continue to increase .

ASSESSING GLOBAL RESOURCE USE
40
Global trends and outlook
These dynamics are reflected in how materials are used for differentaspectsoffinaldemandacrossthewholesupplychain . Various world regions have different shares of mate-rial supply for household and government consumption and capital investment . Africa, the EECCA region and North America have the highest share of material footprint of householdconsumptionataround70 percent.TheAsia-Pacificregionhasthelowestmaterialsupplytohouseholdconsumption; this has been decreasing over time and is
13 IPAT refers to the multiplicative relationship of population (P), affluence (A) and technology (T) for any environmental impact (I) . IPAT has become the most commonly used framework for analysing drivers of changing environmental impacts . Note that technology refers to all other factors combined, beyond population and affluence, and does not reflect an engineering notion of technology .
nowataround40 percentofthetotalmaterialfootprint.The material footprint of government consumption is highestintheAsia-Pacificregion.AfricaandLatinAmericaand the Caribbean, by comparison, have the lowest share of material footprint of government consumption . The Asia-Pacificregionalsohasthehighestshareofmaterialfootprint for capital investment, which reflects investment by China and countries in Southeast Asia into urban and transport infrastructure .
FIGURE2.19 Shareofmaterialfootprintbyfinaldemandcategoryoftotalmaterialfootprintbyregion,1990and2015(percentages)
1990 2017
Afric
a
Asia
&
Pacific
Nor
thAm
eric
a
Wes
tAs
ia
EECC
A
Euro
pe
Latin
Am
eric
a &
Carib
bean
Afric
a
Asia
&
Pacific
Nor
thAm
eric
a
Wes
tAs
ia
EECC
A
Euro
pe
Latin
Am
eric
a &
Carib
bean
Household CapitalGovernment
100%22%
8%
22%39%
11%
17%
10% 6% 8% 17%17%
49% 40%54%57% 57%55%58%61%50%70%
18% 43% 20% 28% 32% 36% 32%
8% 9%
5%10%10% 11%
74% 72% 62% 62%
32% 37% 38% 34%
80%
60%
40%
20%
0%
100%
80%
60%
40%
20%
0%
2.6 Drivers of material extraction
A simple IPAT framework13 (Ehrlich and Holdren, 1971) identifiesthemaindriversofchangeinmaterialfoot-prints as a result of changes in population, affluence (GDP per capita) and technology (material footprint per unit of GDP) . This framework is applied to the analysis of material footprints to consider what has driven material footprints in different world regions since the 1990s .
Between 1990 and 2000, the material footprint grew fast-estinWestAsiaandAsiaandthePacific,butwasreducedin Eastern Europe, Caucasus and Central Asia (EECCA region) as a result of the break up of the former Soviet Unionandtheretirementofinefficientheavyindustry
(West et al ., 2014) . Population growth was the strongest driver in Africa and West Asia . In North America and Asia andthePacific,growingaffluenceandconsumptionhada larger influence on expanding material footprints than population growth . Changes in technology, resulting in changes in material intensity of consumption, have mediated the impact of population and affluence that has driven growth in material extraction . Globally, popu-lation and affluence had a similar influence of the growth of material footprints (with technology compensating somewhat the growth impact) .

A SYSTEMS APPROACH TO RESOURCE EFFICIENCY AND POLLUTION REDUCTION
41
Global trends and outlook
1
2
3
4
5
FIGURE2.20 Driversofmaterialfootprint,1990–2000(percentages)
Africa
Asia & Pacific
North America
West Asia
World
EECCA
Europe
Latin America & Caribbean
Net Change % DMC
10%
46%
-73%
40%
39%
40%
57%
26%
-100% 0% 100%
Population Affluence Technological coefficient
0%-25% 25%-50% 50%-75% 75% 100% 125%
-14% -11% 36%
18%
18%
24%
26%13%
38% 13%
13%
6%
20%
-25% -2%
17%
17%
16%
-47%
-4%
3%
FIGURE 2.21 Driversofmaterialfootprint,2000–2010(percentages)
Africa
Asia & Pacific
North America
West Asia
World
EECCA
Europe
Latin America & Caribbean
Net Change % DMC
50%
80%
59%
15%
31%
-3%
50%
42%
-100% 0% 100%
Population Affluence Technological coefficient
0%-25% 25%-50% 50%-75% 75% 100% 125%
-17% 30% 30%
15%
-1%
-5%
-19%
43%
7%
7%
9%
39% 15%
12%
15%
-7% 66%
21%
15%
9%
-4%
15%
22%
FIGURE 2.22 Driversofmaterialfootprint,2010–2015(percentages)
25% 0% 25% 50%
Population Affluence Technological coefficient
-5%
-5%
18%
5%
2%
2%
2%
-2%
-10%
-6%
18%
7%4%
13% 10% 1%
6%
6%
7% 21%
7%
5%
5%
-1%
Africa
Asia & Pacific
North America
West Asia
World
EECCA
Europe
Latin America & Caribbean
Net Change % DMC
12%
18%
30%
0%
10%
1%
25%
12%
- 100% 0% 100%

ASSESSING GLOBAL RESOURCE USE
42
Global trends and outlook
The following decade to 2010 saw a decline in material extraction in North America and a very small increase in Europe, which is attributable to the impact of the global financialcrisis.AsiaandthePacific,theEECCAregionandWest Asia became the most dynamic regions in terms of material footprint growth, and changes in technology addedtomaterialgrowthinAsiaandthePacificandalsoglobally . Modern technologies replaced traditional tech-nologies for buildings, transport and electricity generation infrastructure and added to the material intensity of con-sumption . Growing affluence replaced population growth as the main driver for material footprint growth in all world regions, with the exception of West Asia .
Since 2010, growth in the material footprint has been dominated by the dynamic Asian economies and Eastern Europe . North America and Europe have seen negligible growth in material footprints because of a slow recovery of economicgrowthinthoseregionsaftertheglobalfinancialcrisis.Theenvironmentalpressuresoffinaldemandhavebeen reduced, not because of successful environmental policy but rather because of the economic slowdown .
As a result, population has become more important as a driver . Technology improvements have mitigated some of the growth in material footprint in most regions, with the exception of the EECCA region .
This demonstrates that the material requirements of consumption and infrastructure are still growing strongly in developing economies to facilitate delivery of basic ser-vices and further economic growth, and more moderately in high-income countries due to the economic slowdown in many of these nations . Populationandaffluencehaveboth been strong drivers of material footprint growth, and innovation and technological change have done little to mitigate growth . This signals the tremendous change that is required to current production and consumption systems in order to deliver higher material standards of living to more people with lower material use and associ-ated environmental impacts of waste flows, pollution and climate change . Achieving the SDGs inclusively for the planet will require producing goods and services and deliv-ering infrastructure using much lower material and energy throughput and at lower levels of waste and emissions .
2.7 Scenarios for future global material demand and Greenhouse Gas emissions, with ambitious policies
Modelling undertaken by the International Resource Panel shows ample evidence for economically attractive resourceefficiency,leadingtohighereconomicgrowthinthe medium and long term and reducing pressures on the globalresourcebase.Resourceefficiencyalsocontributes,all else being equal, to lower environmental impacts . The International Resource Panel modelled the combined economic and environmental consequences of ambitious resourceefficiencyandgreenhousegasabatementpoli-cies(seefigure2.23)(UNEP,2017a).
Eachofthefourscenariosrepresentsaspecificcombi-nation of potential future resource use trends and future greenhouse gas emission pathways .
Existing Trends is calibrated to historical natural resource use trends and greenhouse policies that would see a 3°C increase in temperatures by the end of the century, rising to around 4°C after that . Natural resource use trends are applied across major world regions, accounting for changes in GDP per capita . Existing Trends is aligned with the “middle of the road” Shared Socioeconomic Pathway two (SSP) (O’Neill et al ., 2015; International Institute for Applied Systems Analysis (IIASA), 2015) and greenhouse
emissions match the trajectory for RCP6 .0 (Rogelj et al ., 2012), which is a little lower than most interpretations of the Paris pledges (the Intended Nationally Determined Contributions (INDCs) to 2030) .
Resource Efficiency assumes the same climate path-way as Existing Trends, but introduces a package of innovations, information, incentives and regulations to promote ambitious but achievable improvements in resource efficiency, and reductions in total resource extractions . The model explores potential improvements in resource efficiency (lower resource intensity and slower growth in natural resource extraction) through three measures: (1) Technical resource innovation and improvements reduce the quantity of resource input required for a given volume of output; (2) a resource extraction tax increases the price of natural resources relative to other inputs; and (3) an exogenous resource demand shift changes the demand curve towards the origin . It mimics the effect of changes to regulations, planning and procurement policies that seek to pro-gressively lower resource intensity while maintaining or improving the services or amenity (such as the space and comfort provided by buildings) .

A SYSTEMS APPROACH TO RESOURCE EFFICIENCY AND POLLUTION REDUCTION
43
Global trends and outlook
1
2
3
4
5
FIGURE 2.23 Scenariosforresourceefficiencyandgreenhousegasabatement
RESOURCE USE
Historical resource trends Resource efficiency
GREE
NHOU
SE E
MIS
SION
S AN
D CL
IMAT
E
3°C+ pathway(RCP6.0) Existing Trends Resource Efficiency
2°C pathway(RCP2.6) Climate Only Efficiency Plus
Climate
Source: Hatfield-Dodds et al., 2017.14
14 Tomeasuregreenhousegasconcentration(notemissions)trajectoriestheIntergovernmentalPanelonClimateChange(IPCC),initsfifthAssessment Report in 2014, adopted the notion of Representative Concentration Pathways (RCPs) . RCP 6 .0 represents a global three degree warming pathway, while RCP 2 .6 represents a two degree warming pathway .
The three types of measures have very different impacts on natural resource extraction, resource prices, invest-ment and overall economic activity . Technical resource innovation and improvements reduce prices and boost economic growth, but have only very modest impacts on extraction volumes (since lower unit costs promote higher direct and indirect natural resource use) . A resource extraction tax increases prices and slows the growth of natural resource use, and also lowers the rate of economic growth . A resource demand shift causes a moderate and fairly even reduction in prices and extraction volumes, with a positive second-round impact on economic activity through increased investment (due to reduced expenditure on consumption of materials-based goods and services) . The measures also impact differently across natural resource categories (biomass, fossil fuels, metal ores and non-metallic minerals) .
Crucially, these different patterns imply that the physi-cal effectiveness and economic impacts of real-world resource-efficiencyinitiativeswilldependonthemix,their respective intensities and detailed design of the measures employed.Whileresourceefficiencyboostseconomicgrowthandprovidesneteconomicbenefits,itispossiblethatsomeresource-efficiencystrategiescouldslow growth and result in net economic costs in some circumstances .
Ambitious Climate assumes the same natural resource use policies as Existing Trends, but that the world adopts ambitious greenhouse gas abatement policies capable of limiting likely global temperature increases to 2°C above pre-industriallevels.Thisgoesbeyondthespecificpledgesmade in Paris for 2025–2030, with global greenhouse emissions to 2050 calibrated to match RCP2 .6 . The model represents the stronger greenhouse abatement policies for the Ambitious Climate scenario as a global carbon price, applied uniformly across all countries and all industrial and energy sectors, with the price level determined endog-enously to achieve the year-on-year emissions trajectory for RCP2 .6 (as a deviation from RCP6 .0) . The carbon price beginsatUSD $5percarbondioxideequivalent(CO2e) in 2021andrises18.1 percentperyearto2050,reachingUSD $42 in 2035 and USD $573 in 2050 .
While a uniform carbon price is an appropriate and trans-parent way of determining the extent and location of cost-effective abatement, it does not account for differen-tiated responsibilities for emission reductions or various forms of assistance that could be provided to lower-income nations(includingfinancialassistanceandpotentialtradein emissions credits) . This implies that the analysis is likely to underestimate the value of economic activity in lower-in-come nations (particularly in the ‘rest of the world’ group), perhaps materially, and may overstate the value of eco-nomic activity in high- and future middle-income nations .

ASSESSING GLOBAL RESOURCE USE
44
Global trends and outlook
EfficiencyPluscombinestheresourceefficiencysettingsand greenhouse gas abatement settings to explore poten-tial policy interactions . This scenario is found to have a higher chance of limiting climate change to 2°C than any other scenario . Greenhouse gas emissions in the Resource Efficiency and Efficiency Plus scenarios arise endogenously from interactions between scenario assumptions, and are not calibrated to RCP6 .0 or RCP2 .6 . Cumulative emissions to 2050 in the Efficiency Plusscenarioare9 percent(97GT CO2e) lower than in the Ambitious Climate scenario, implying a higher chance of limiting global warming to 2°C than under RCP2 .6 .
In an existing trend scenario, the global economy would require 180 billion tonnes of natural resources by 2050 or more than twice the level of 2017 .
There is substantial potential to achieve economically attractive resource efficiency, providing win-win out-comes that reduce environmental pressure while improv-ing income and boosting economic growth .
Ambitiouspolicesforresourceefficiencycanreduceglobalresourcerequirementsbyabout25 percentanddeliverglobaleconomicgrowthof3to5 percentaboveexistingtrend.Thiswouldalsohaveconsiderableco-benefitsforclimate mitigation efforts .
Resource-efficiencypoliciesandinitiativescould:
� reducenaturalresourceusegloballyby26 percentby 2050 compared to business-as-usual increases, in combination with ambitious global action on climate change, and stabilize per capita resource use at current levelsinhigh-income countries;
� reduce greenhouse gas emissions by an additional 15-20 percentby2050(foragivensetofgreenhousepolicies),withglobalemissionsfallingto63 percentbelow 2010 levels by 2050, and emissions in high-in-comecountriesfallingto74 percentbelow2010levelsby 2050
� more than offset the economic costs of ambitious climate action, so that income is higher and economic growth is stronger than in the Existing Trends scenario;
� deliver annual economic benefits of USD $ 2 trillion globally by 2050 relative to Existing Trends, including benefitsofUSD$520billioninhigh-incomenations,while also helping to put the world on track towards limiting climate change to 2°C or lower .
These projections can be treated as a reasonable mini-mum (or ‘lower bound’) estimate of economically attractive physicalresourceefficiencypotential.
Thelevelandmixofeconomicandenvironmentalbenefitsachieved will depend, however, on the detail of the policies and approaches implemented – suggesting that there will be a need to focus on developing and testing a smart and practicalpackageofresource-efficiencymeasures.
Domestic extraction under Existing Trends would grow to 184 billion tonnes in all world regions by 2050 - more than double the 2015 levels (with lower growth in Latin America and North America and lowest growth of all in Eastern Europe, Caucasus and Central Asia) . The combination of resourceefficiencyandgreenhouseabatementpolicies(Climate Plus) would trigger a significant reduction in material extraction to 132 billion tonnes . Reduced mate-rial extraction would be strongest in North America and Latin America, and material extraction would decline in the EECCA region . Even under Climate Plus, global material extractionwouldstillexpandbyaround75 percentby2050 - demonstrating the inertia of current systems of production and consumption and lock-in with regard to important infrastructure with long-lasting legacies for material requirements .
Whilemostcountrieswouldbenefiteconomicallyfromaglobal effort to reduce resource use through investment in resource efficiency, low-income countries that have invested mainly in primary sector activities would lose out . This would require a compensation effort, redistributing someoftheeconomicgainsofincreasedresourceeffi-ciency to countries that would carry the cost (in order to achieve a no-loser outcome) .
DespitethebeneficialoutcomeoftheClimate Plus scenario for reducing greenhouse gas emissions, the 132 billion tonnes material requirement of the global economy of (around75 percentabove2017levels)willnonethelesshave huge environmental impacts, contribute to surpass-ing important global boundaries (Steffen et al ., 2015) and increase the risk of pushing the Earth System into a different state that is less suitable for social and economic systems and that will make it harder, if not impossible, to achieve the SDGs comprehensively .

A SYSTEMS APPROACH TO RESOURCE EFFICIENCY AND POLLUTION REDUCTION
45
Global trends and outlook
1
2
3
4
5
FIGURE 2.24 Globalresourceextractions(DE)byfourcategories(biomass,fossilfuels,metaloresandnon-metallicminerals)(a)2010–2050forExisting Trends,and(b)changefrom2015to2050forfourscenarios
billi
on to
nnes
20
40
60
80
100
120
140
160
180
200
0
2015
2025
2020
2030
2035
2040
2045
2050
Biomass Fossil fuels Metal ores Non-metalic minerals
a)
-50%
0%
50%
100%
150%
200%
Total Biomass Fossil Fuels
Metal ores
Non-metalic minerals
Existing Trend
Resource Efficiency
Ambitious Climate
Climate Plus
perc
enta
ge c
hang
e 20
15 to
205
0
b)
FIGURE 2.25 Globalresourceextractions(DE)byworldregions(a)2010–2050forExisting Trends,and(b)changefrom2015to2050forfourscenarios
Africa Asia & Pacific
NorthAmerica
WestAsia
EECCA Europe Latin America
& Caribbean
0
20
40
60
80
100
120
billi
on to
nnes
2030 20502010
a)
-50%
0
50%
100%
150%
200%b)
perc
enta
ge c
hang
e 20
15 to
205
0
Resource EfficiencyAmbitious Climate Climate PlusExisting Trend

© U
SAID
/ Fl
ickr
46
ASSESSING GLOBAL RESOURCE USE
3. Governance solutions

A SYSTEMS APPROACH TO RESOURCE EFFICIENCY AND POLLUTION REDUCTION
47
Governance solutions
1
2
3
4
5
Smart integration of the natural resource perspective across public and private governance operations and political strategies is needed if Sustainable Development Goalsaretobeachieved.Efficiencyinthewayresourcesare extracted and manufactured by industry, used and re-used by people, and recycled and disposed of by all are essential efforts towards a pollution-free planet .
15 This section largely draws from the International Resource Panel report (UNEP, 2015b) on the policy coherence of the Sustainable Development Goals .16 People are forced to leave their homes due to phenomena including land grabbing and climate-change-induced conflicts (see Institute for Climate
Change and Adaptation, University of Nairobi (ICCA, 2016), on experiences from Kenya) .
This chapter pinpoints key strategies for system-wide pollution reduction and more sustainable resource use throughout the economy . It provides a long but non-ex-haustive list of policies and instruments in action in different countries and regions of the world, and points to specificInternationalResourcePanelreportsforamorein-depth analysis .
3.1 Towardsaneweraofmulti-beneficialpolicymaking
Nations are at the cusp of enormous challenge and oppor-tunity . Environmental management and socio-economic development need to be pursued together if either is to be achieved . Sustainable prosperity for current and future gen-erations requires the maintenance and restoration of eco-system health across the globe . A new era of policymaking can and must make simultaneous progress towards economic, social and environmental imperatives . For envi-ronmental policies, this means a broadening of goals from managing to preventing environmental harm by creating the conditions that encourage investments in resource pro-ductivity . Economic and market-based policies encouraging eco-innovation (Machiba, 2010), green investments and sustainable business models (United States Environmental Protection Agency (US EPA), 2009) are particularly relevant (UNEP, 2014b; UNEP, 2017a) . In this sense, decoupling is not the domain of environmental ministries alone, but rather cuts across all ministries and levels of government . From a systems perspective, decoupling helps to lower emissions and reduce environmental impacts such as pollution, as well as lowering costs and enhancing security of supply (see, inter alia, UNEP, 2011a and UNEP, 2014b) . This goes hand in hand with policies to regulate and manage pollu-tion . That means that a synergetic mix of multi-level and multi-sectoral policies are needed to move beyond incre-mental changes towards a profound transformation of how resources flow through society . Providing long-term orienta-tion, setting the incentive framework rather than prescribing specifictechnologies,increasingpublicengagementandlearning from past experiences (including beyond borders) will pave the way for change .
3.1.1 Paving the way to the Sustainable Development Goals through a systems approach15
Countries and their policies are faced with different environmental conditions and socio-economic contexts . Where high levels of air or water pollution and severe draughts exert proximate pressure, people’s very survival
is at stake . Where the living conditions for people and local environments have been secured, the effects of their activ-ities on other regions and resulting repercussions, such as refugee streams16, become relevant . Widening of this sphere is observable for each country and region over time .
A systems perspective connects material flows from resourceextractionthroughtofinalwastedisposal,inorder to build a bridge between the environment and economy: (a) material flows are linked with a bundle of environmental impacts along the production-consump-tion chain, and (b) the resulting products, infrastructures and buildings provide the basis of material welfare . Two insights are of particular importance:
1 . Environmental impacts – including pollution and climate pressure – cannot be mitigated effectively without reducing raw material inputs into production and consumption, because their throughput determines themagnitudeoffinalwasteandemissionsreleasedtothe environment .
2 . Decoupling economic activity and human well-being from resource use – in the form of enhanced resource efficiency–isnecessarytoachievetheSustainableDevelopment Goals for all .
Traditional pollution control often uses end-of-pipe tech-nologiessuchasfiltersandcatalyststokeepthereleaseofhazardous substances below critical thresholds . Such an approach may help to reduce SO2 and NOx emissions from power plants/car exhaust pipes and improve air quality in cities, for instance . However, the equipment also requires materialsandenergyupfront(suchasminingandrefin-ingofplatinumgroupmetalsforcatalysts)(figure3.1a).Moreover, the upstream processes (including coal and fuel for power stations and cars) and their environmental impacts are not reduced, but may even be increased by reductionsinprocessefficiency.Asaconsequence,overthe whole production-consumption system, those end-of-pipe technologies lead to increased resource requirements

ASSESSING GLOBAL RESOURCE USE
48
Governance solutions
and environmental impacts (albeit in other places) (see Saurat and Bringezu, 2008) .17
Incontrast,resourceefficiencygains(inpowersupplyormobility provision) may still generate the same output in terms of products and their functionality (electricity/trans-port) while reducing not only the critical emissions of the original target process, but also the resource requirements and environmental impacts in the upstream processes (figure3.1b).Suchinnovationsinresourceefficiencymayrangefromresourcesavings(asdepictedinfigure3.1b)toout-of-the-box solutions for providing the same service in new ways (including through user-led, social and business model innovation) (O’Brien et al ., 2014) .
While end-of-pipe technologies can lead to reductions of proximate environmental impacts, systems-wide reduc-tions of environmental burdens can only be reduced by life-cycleorientedincreasesinresourceefficiency. This is integral to SDG 12, which aims to reshape consumption and production patterns by transforming resource use in a way that reduces pressures on the environment and climate while promoting human and economic develop-ment . Figure 3 .2 depicts the targets and indicators of SDG 12 in more detail, as well as where further information on each topic can be found in this chapter . The decoupling of economic growth from environmental degradation is also explicitly stipulated in target 8 .4 of the SDGs .
17 Thestudyshowstheadditionalresourcerequirementsforplatinum-groupmetalsusedforcarcatalysts(end-of-pipetechnology)andfindsthatemissionsareshiftedfromcitiestopointsourcesattherefiningsites.Takingthehigherfuelconsumptionintoaccount,theoverallwasteandemissionflowsincreased(withvariousspecificenvironmentalimpactsasaresult).
BOX 3.1 TowardsSustainableConsumptionandProductioninAsiaandthePacific
Issues, priorities and progress in implementing sustainable con-sumption and production (SCP) have been varied in the Asia-Pacific region, with Northeast Asian countries leading its promotion and practice. Several priorities have been determined, usually as a result of the Marrakech Process, including energy, mobility, water and waste. Poverty and unemployment rates are given due con-sideration in the implementation of SCP programmes alongside resource conservation. The demand for green consumerism, technical knowledge on life cycle analysis, development of national policies on SCP for business and the emphasis on products and companies over services are some of the key concerns raised in roundtables in the region. Following years of work by United Nations agencies in the region, several SCP programmes and actions have been built from bottom-up consultations and round-tables to the establishment of national plans and strategies. The regional accomplishments in the implementation of SCP include the following:
� SCP tools and initiatives have progressed, particularly in terms of sustainable production as energy efficiency legislations (Copenhagen Centre on Energy Efficiency (C2E2), 2015), national cleaner production centres (United Nations Industrial Development Organization (UNIDO) and UNEP, 2015) and national SCP policies (Akenji, 2012) have been established in many countries.
� The Asia-Pacific region is also part of the Sustainable Public Procurement and Ecolabelling Project (2013–2017), which aims to promote a shift in consumption and production patterns.
� The Seoul Initiative Network on Green Growth has been established with Asia-Pacific member countries to support the Seoul Initiative (2005), which provides a framework for green growth in the region.
FIGURE 3.1 Schemeofpollutionreductionby(a)end-of-pipetechnologies,and(b)efficiencyincreaseofprocesses
Controlled emission
a)
b)
Pollutant treatment process
Controlled emission
Critical emission
Desired product
Desired product
Note: The same volume flow of product and the controlled emission result in (a) and (b) while resource extraction and other emission flows are higher in (a) than in (b). The boxes represent production or consumption processes, the width of the arrows indicate turnover volume of material flows, inputs match output of each process. Blue arrows: product flows; red arrows: uncontrolled emissions to air, water or waste disposal; yellow flows: resource extraction (input side) or non-critical release to the environment (output side)

A SYSTEMS APPROACH TO RESOURCE EFFICIENCY AND POLLUTION REDUCTION
49
Governance solutions
1
2
3
4
5
FIGURE 3.2 TargetsandindicatorstowardSustainableDevelopmentGoal12
SUSTAINABLE DEVELOPMENT GOAL 12
TARGETS INDICATORS LINK
12.1 Implement the 10-year framework of programmes on sustainable consumption and production, all countries taking action, with developed countries taking the lead, taking into account the development and capabilities of developing countries
12.1.1 Number of countries with sustainable consumption and production (SCP) national action plans or SCP mainstreamed as a priority or a target into national policies
See this section and Box 3.1
12.2 By 2030, achieve the sustainable management and efficient use of natural resources
12.2.1 Material footprint, material footprint per capita, and material footprint per GDP 12.2.2 Domestic material consumption, domestic material consumption per capita, and domestic material consumption per GDP
See Section 3.2.1
12.3 By 2030, halve per capita global food waste at the retail and consumer levels and reduce food losses along production and supply chains, including post-harvest losses
12.3.1 Global food loss index See Section 3.3.1
12.4 By 2020, achieve the environmentally sound management of chemicals and all wastes throughout their life cycle, in accordance with agreed international frameworks, and significantly reduce their release to air, water and soil in order to minimize their adverse impacts on human health and the environment
12.4.1 Number of parties to international multilateral environmental agreements on hazardous waste, and other chemicals that meet their commitments and obligations in transmitting information as required by each relevant agreement12.4.2 Hazardous waste generated per capita and proportion of hazardous waste treated, by type of treatment
See this section
12.5 By 2030, substantially reduce waste generation through prevention, reduction, recycling and reuse
12.5.1 National recycling rate, tons of material recycled See Section 3.2.5
12.6 Encourage companies, especially large and transnational companies, to adopt sustainable practices and to integrate sustainability information into their reporting cycle
12.6.1 Number of companies publishing sustainability reports See Section 3.2.6
12.7 Promote public procurement practices that are sustainable, in accordance with national policies and priorities
12.7.1 Number of countries implementing sustainable public procurement policies and action plans
See Section 3.3
12.8 By 2030, ensure that people everywhere have the relevant information and awareness for sustainable development and lifestyles in harmony with nature
12.8.1 Extent to which (i) global citizenship education and (ii) education for sustainable development (including climate change education) are mainstreamed in (a) national education policies; (b) curricula; (c) teacher education; and (d) student assessment
See Section 3.2.6
Source: The Sustainable Development Goals, targets and indicators. Available online: https://sustainabledevelopment.un.org/sdg12.

ASSESSING GLOBAL RESOURCE USE
50
Governance solutions
The concept of ‘sustainable consumption and produc-tion’ joins up economic and environmental processes to provide policy instruments and tools that can contribute to cleaner production and responsible consumption (UNEP, 2012b) . Sustainable consumption and production strategies are designed to ensure that (a) multiple SDGs are attainable simultaneously, (b) policy measures are implemented effectively in a multi-objective environment and (c) problem shifting is minimized . However, despite being an explicit global objective since at least the Earth Summit in 1992, sustainable production and consump-tion has so far proved an elusive goal - probably because the need for increased resource efficiency has been underestimated so far . As an example, box 3 .1 provides an overview of sustainable consumption and production activitiesintheAsia-Pacificregion.
Overall, the SDG framework provides an opportunity to transform the international debate about sustainable development and take it beyond the usual question of trade offs between environment and development (UNEP, 2014c; 2015b) . The need to make progress on all the goals together offers an opportunity to avoid the all-too-commonexperienceof“sacrificing”onedesirableoutcome to reach another . A systems approach is needed to understand the complexities and support the develop-ment of coherent policy mixes (see the case studies in chapter 4) .
3.1.2 Drivingaprofoundresourceefficiencytransition
Resource efficiency is vital for transforming unsus-tainable production and consumption practices into sustainableones.Resourceefficiencycanbeachievedthrough the following parallel actions: (a) technological, organizational and social innovations that foster savings (such as reducing resource use - including changing citi-zen behaviour - in high-consumption countries); (b) reuse and recycling of products and materials (such as keeping resources within the economic system for longer); and (c) an orientation towards service provision (including focusing on providing functions instead of physical prod-ucts) . Over the long run, the physical economy needs to be supplied mainly by recycled material flows driven by renewable energies, while maintaining the extraction of primaryresourcesandfinalreleaseswithin“safe”thresh-olds (see section 3 .2 .1 below) .
In the process of a transition (Geels and Schot, 2007; Kemp et al ., 2007), countries with a long-term vision (underpinned by targets and incremental policy signals thatmakesmartandefficientuseofnaturalresources
moreprofitablethaninefficientuse)aremorelikelytosucceed (UNEP, 2014b) . A coordinated and coherent approach to policymaking across ministries, underpinned byscientificevidence,iscrucial(asshowninchapter2).Itwill require the participation of stakeholders able to turn shared visions into reality and manage any resistance to changebyclarifyingmultiplebenefitsfortheactors.
FIGURE 3.3 Transitioncycletowardsustainableresource use
RESOURCE USE
Learn from effective and ineffective policies
nationally and abroad.
Monitor the state of environment and account for resource use and flows.
Adjust andimplement
policies to setthe frameworkfor sustainableinfrastructures
and businessmodels in
green markets.
Commit to attainment of allSDGs and set subtargets for
resource use, e.g. for materials, water, land and carbon.
LEARN AND EVALUATE
MON
ITOR U
SE
TEST
AN
D IN
NOV
ATE
SET TARGETS
Steering long-term and profound changes in the way resources are extracted from the environment, processed in production and used in society requires four iterative stepsacrossalllevelsofgovernance(figure3.3):
1 . Monitor current performance and use (including by improving knowledge of the state of natural resources like soil, air, biodiversity and water and increasing understanding of earth operating systems and planetary boundaries); monitor the flows and stocks of resources used in the economy; and, in particular, improve footprint accounting for different types of resource use;
2. Settargetsanddefinefutureobjectivesinthelightofthe SDGs (such as setting targets for resource con-sumption until 2030 and 2050, based on the principles of a safe operating space);
3 . Test innovations to change infrastructure, business models and markets as well as lifestyles (includ-ing by adjusting targets, subsidies and taxes and

A SYSTEMS APPROACH TO RESOURCE EFFICIENCY AND POLLUTION REDUCTION
51
Governance solutions
1
2
3
4
5
establishaframeworkforresourceefficiencywithinthe economy; and establishing a framework for integrated resource management across scales: national-community-company-product);
18 For example, the Global Reporting Initiative is an independent international organization that helps businesses, governments and other organizations to understand and communicate how business activities cause impacts on issues like climate change, human rights, corruption and many others . More information is available online: https://www .globalreporting .org .
19 Austria, Estonia, France, Germany, Hungary, Latvia, Poland, Portugal and Slovenia20 Atthegloballevel,resourceconsumptionequalsextraction.Nationaltargetsshouldbebasedonthefinalconsumptionofproductsandservicesand
setbudgetsfortheresourcesusedtosupplythatconsumption(sothatnotfinalconsumptionislimitedbuttheuseofresourcesforthatpurpose)21 For example, the German Federal Environment Agency recognizes an order of magnitude of 5 to 8 tonnes per person annually as a target corridor
for 2050, based on current thinking (see Bringezu, 2015), and supporting the precautionary principle and a limit to the amount of resources that may be extracted in the light of intra and intergenerational equity (German Federal Environmental Agency (UBA), 2015) .
4 . Learn from effectiveness and evaluation (for instance, through impact assessments of policies to determine which strategies were particularly effective or ineffec-tive for next time; promote cross-country learning) .
3.2 Key strategies towards sustainable consumption and production
Change across all levels of society is needed to achieve the SDGs . This implies both “bottom-up” changes in the way businesses create value and citizens access, use and dispose of resources, as well as “top-down” changes in the way that policies steer the markets where businesses operate and build the social infrastructure in which citizens live.Thissectionidentifiessevenstrategiesforfosteringconsumption patterns and production systems that con-tribute to human well-being without putting unsustainable pressures on the environment . The first sub-section coversthefirstandsecondstepsofthetransitioncycle,while the bulk of strategies presented focus on the third step: namely, policy options to steer development and promote innovations toward an inclusive and resource-ef-ficientglobaleconomy.Manyoftheexamplesfocusonthe national level, with the potential to manage and steer global natural resource use . If the SDGs are to be achieved, global initiatives18 and governance will need to play a strengthened role (particularly in terms of responsible mining) (Ali et al ., 2017) .
3.2.1 Set targets and use footprint, waste and pollution indicators to measure progress
The foundation for change is accurate information and a common understanding of challenges . The transition must be underpinned by greatly increased knowledge and data about the current state of natural resources in the environment, related trends and their use at different levels of society . A thorough analysis can assist policymakers in identifying the most important challenges, such as the
prevention of problem shifting, as well as opportunities for effective regulatory, fiscal, social and/or technical policy interventions . In particular, indicators reporting and evaluating the use of materials, energy, land and water (as well as the disposal of waste and greenhouse gas emissions) should play a central role as they capture major environmental pressures and can be applied across sectors and for all geographical scales (Bringezu et al ., 2016) . This implies the need for a systemic monitoring system that includes targets and indicators, in particular on footprints.
International and national targets play a vital role in providing incentives for business to prioritize resource efficiency,aswellasinencouragingpolicydevelopmentand guiding policy implementation. Aresource-efficiencytarget, underpinned by targets for the use of key resources (materials, land and water) as well as) GHG emissions could become a fundamental aspect of a regular monitor-ing framework . Nine countries in the European Union cur-rentlyhaveresourceefficiencytargets.19 Japan developed an indicator framework and set targets for 2020 related to three aspects of material flow (entrance, circulation and exit) in the context of its Sound Material-Cycle Policy . Monitoring of progress reveals that these targets are on track to being met (Japan’s Ministry of the Environment, 2014), and it therefore provides a good example of target setting and progress to reach targets (see box 3 .2) . While resource efficiency targets are the first step forward, targets for sustainable levels of global resource con-sumption20 are still in an early stage of development.21
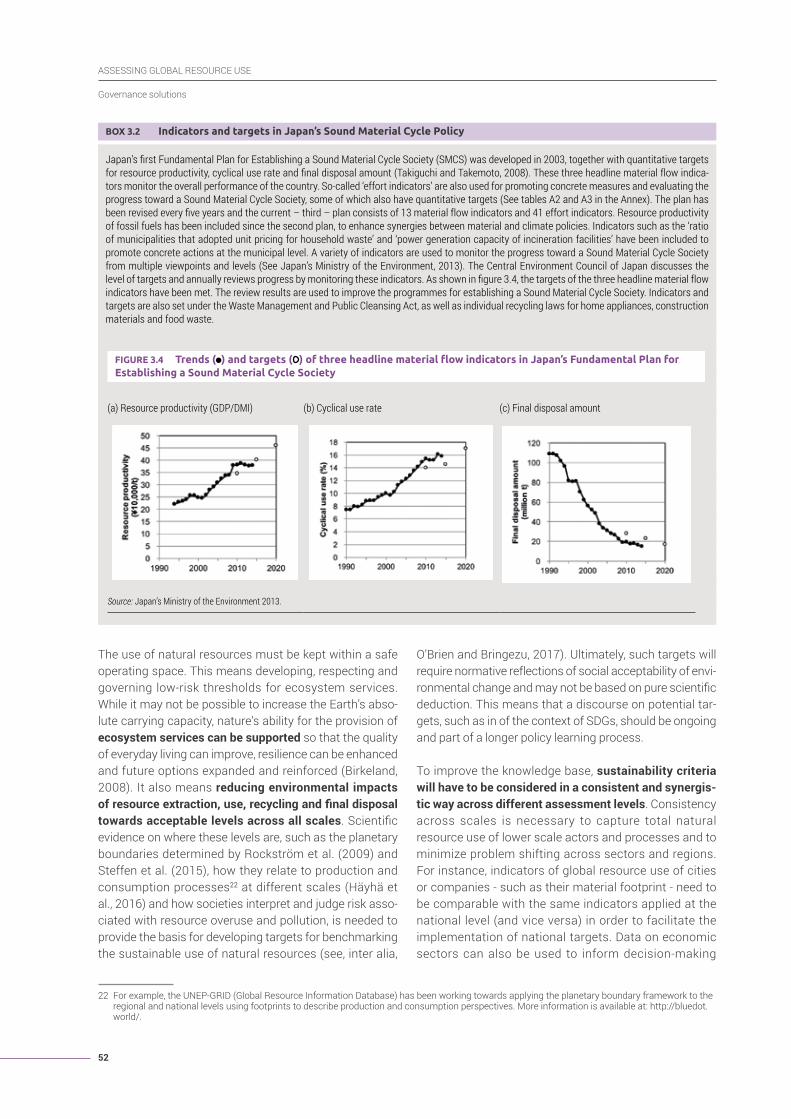
ASSESSING GLOBAL RESOURCE USE
52
Governance solutions
BOX 3.2 IndicatorsandtargetsinJapan’sSoundMaterialCyclePolicy
Japan’s first Fundamental Plan for Establishing a Sound Material Cycle Society (SMCS) was developed in 2003, together with quantitative targets for resource productivity, cyclical use rate and final disposal amount (Takiguchi and Takemoto, 2008). These three headline material flow indica-tors monitor the overall performance of the country. So-called ‘effort indicators’ are also used for promoting concrete measures and evaluating the progress toward a Sound Material Cycle Society, some of which also have quantitative targets (See tables A2 and A3 in the Annex). The plan has been revised every five years and the current – third – plan consists of 13 material flow indicators and 41 effort indicators. Resource productivity of fossil fuels has been included since the second plan, to enhance synergies between material and climate policies. Indicators such as the ‘ratio of municipalities that adopted unit pricing for household waste’ and ‘power generation capacity of incineration facilities’ have been included to promote concrete actions at the municipal level. A variety of indicators are used to monitor the progress toward a Sound Material Cycle Society from multiple viewpoints and levels (See Japan’s Ministry of the Environment, 2013). The Central Environment Council of Japan discusses the level of targets and annually reviews progress by monitoring these indicators. As shown in figure 3.4, the targets of the three headline material flow indicators have been met. The review results are used to improve the programmes for establishing a Sound Material Cycle Society. Indicators and targets are also set under the Waste Management and Public Cleansing Act, as well as individual recycling laws for home appliances, construction materials and food waste.
22 For example, the UNEP-GRID (Global Resource Information Database) has been working towards applying the planetary boundary framework to the regional and national levels using footprints to describe production and consumption perspectives . More information is available at: http://bluedot .world/ .
The use of natural resources must be kept within a safe operating space . This means developing, respecting and governing low-risk thresholds for ecosystem services . While it may not be possible to increase the Earth’s abso-lute carrying capacity, nature’s ability for the provision of ecosystem services can be supported so that the quality of everyday living can improve, resilience can be enhanced and future options expanded and reinforced (Birkeland, 2008) . It also means reducing environmental impacts ofresourceextraction,use,recyclingandfinaldisposaltowards acceptable levels across all scales.Scientificevidence on where these levels are, such as the planetary boundaries determined by Rockström et al . (2009) and Steffen et al . (2015), how they relate to production and consumption processes22 at different scales (Häyhä et al ., 2016) and how societies interpret and judge risk asso-ciated with resource overuse and pollution, is needed to provide the basis for developing targets for benchmarking the sustainable use of natural resources (see, inter alia,
O’Brien and Bringezu, 2017) . Ultimately, such targets will require normative reflections of social acceptability of envi-ronmentalchangeandmaynotbebasedonpurescientificdeduction . This means that a discourse on potential tar-gets, such as in of the context of SDGs, should be ongoing and part of a longer policy learning process .
To improve the knowledge base, sustainability criteria will have to be considered in a consistent and synergis-tic way across different assessment levels . Consistency across scales is necessary to capture total natural resource use of lower scale actors and processes and to minimize problem shifting across sectors and regions . For instance, indicators of global resource use of cities or companies - such as their material footprint - need to be comparable with the same indicators applied at the national level (and vice versa) in order to facilitate the implementation of national targets . Data on economic sectors can also be used to inform decision-making
FIGURE 3.4 Trends( )andtargets( )ofthreeheadlinematerialflowindicatorsinJapan’sFundamentalPlanforEstablishingaSoundMaterialCycleSociety
(a) Resource productivity (GDP/DMI) (b) Cyclical use rate (c) Final disposal amount
Source: Japan’s Ministry of the Environment 2013.

A SYSTEMS APPROACH TO RESOURCE EFFICIENCY AND POLLUTION REDUCTION
53
Governance solutions
1
2
3
4
5
and guide sectoral policies in the domains of primary industries, cities and trade . It would also strengthen the value of the information beyond the policy community by increasing its usefulness for business . Consistency across the supply chain is needed to capture indirect material flows associated with trade and to prevent problem shifting across countries . In other words, a whole-product life cycle perspective is also needed at the national level (Bringezu et al ., 2016) . Research to report outflows to air, soil and water (UNEP, 2016c), as well as on material in-use in stocks (existing building stock of infrastructure) (Krausmann et al ., 2017; Zhang et al ., 2017) should be strengthened . This would also allow the material balance at different scales to be closed and enable better understanding of the material stock that services the global economy, the relationship between existing assets and flows and the long-term waste and emission potential of the global economy (UNEP, 2017a) .
At the international and national levels, a monitoring process to assess and benchmark the resource use andresourceefficiencyofcountries,withharmonizedmetrics and results published at regular intervals, could alsogiveresourceefficiencyahigherprofile and lead togreaterambitiontoincreasesuchefficiency(inthesame way as currently occurs for GDP growth) (UNEP, 2017a).Forexample,theEuropeanResourceEfficiencyScoreboard23 benchmarks and compares country per-formance with regard to resource productivity, similarly to a competitiveness index or innovation scoreboard . Also, the European Raw Materials Scoreboard24 - which monitors progression of the circular economy in the European Union (EU) - raises the visibility of challenges related to raw materials across the life-cycle of resource use, and also includes social, economic and environmen-tal aspects . The International Resource Panel aims to provide a systemic understanding of linkages between the economy, population and material use (based on a new and authoritative database of global material extraction and a revised database for materials trade) . This report could be taken as a pilot for providing key elements for regular reporting. One option would be to establish a regular reporting mechanism on the global resource use of countries, including their resource
23 Availableat:http://ec.europa.eu/eurostat/web/europe-2020-indicators/resource-efficient-europe.24 The 2016 version is available at: https://bookshop .europa .eu/en/raw-materials-scoreboard-pbET0416759/ .25 Problem shifting by end-of-pipe technologies can also be reduced by recycling, as shown for platinum group metals in car catalysts (Saurat and
Bringezu, 2009) .
productivity (to monitor progress of decoupling) and natural resource footprints (to monitor progress towards sustainable resource consumption), within the United Nations system . The International Resource Panel could potentially supervise the reporting and support with assessment . Further outlets of strategic indicators could include the Green Growth Knowledge Platform . In the future, research and analysis from the International Resource Panel shall strengthen the links to the resource nexus, including materials, water, land and greenhouse gas emissions .
National accounting capacities need to be supported, particularly in countries facing stringent limitations on the gathering of information about their resources and environments due to the absence or weakness of institutions responsible for collecting statistical data . International or regional intergovernmental organizations could lead the way in developing statistical capacities, including at the national level (Bringezu et al ., 2016) . Improving the quality of data collection and the creation of decision support tools suited to all country contexts, potentially as part of the SDG process, will help build more reliable information for national and international policy planning (UNEP, 2015b) .
Data and indicators, in particular on the four footprints measurable across scales (land, water, GHG emissions and materials), would combine to provide the knowledge base for facilitating a transition and the tools to monitor its progress at the global, country, community, company and household levels .
3.2.2 Target key leverage points across all levels of governance
Policies address material flows at three general phases acrossthelifecycle(figure3.5):(1)controllingimpactsofmining,agriculture,forestryandfisheries;(2)improvingefficient use in manufacturing and final consumption, including recycling; and (3) safe disposal of waste (and emissions control) . The reader will note that, the higher the recycling in phase (2), the lower the material flows and impacts on (1) and (3) .25

ASSESSING GLOBAL RESOURCE USE
54
Governance solutions
FIGURE 3.5 Maintargetareasforeconomy-widematerialflowmanagementincludingpollutioncontrol
Mining waste, overburden etc.
Waste deposition
Production
Consumption
Emissions
Products
Industrial wastes
Recovery, recycling
Resource Extraction
Imports
Natural resources Raw materials
1
2 3
Waste Management
MCW
Note: MCW stands for municipal waste.Source: Bringezu, 2002.
BOX 3.3 NationalprogrammesformaterialresourceefficiencyinGermany,AustriaandFinland
The number of national programmes and policy initiatives for improving material resource efficiency has recently increased across Europe. This goes hand in hand with the European Union Flagship initiative for a Resource Efficient Europe and the Roadmap to a Resource Efficient Europe. Meanwhile, three countries have dedicated national strategies for resource efficiency, in addition to two regions (Flanders, Belgium, and Scotland, United Kingdom). The German Resource Efficiency Programme (ProgRess) was adopted in 2012 with the aims of securing a sustainable supply of raw materials, raising resource efficiency in production, making consumption more resource efficient, enhancing resource-efficient closed-cycle management and using overarching instruments. It promotes twenty strategic approaches and highlights the partic-ular importance of market incentives, information, expert advice, education, research/innovation and voluntary measures and initia-tives. In addition, it adopts an indicator and target framework for promoting resource efficiency. The Austrian Resource Efficiency Action Plan was published in 2012 with the overarching aim of increasing resource efficiency by at least 50 per cent by 2020 rela-tive to 2008, and fourfold to tenfold by 2050. It outlines measures such as resource-efficient production, public procurement, the circular economy and awareness-raising. In 2015, the Resources.Efficiency.Technologies initiative was developed to implement resource efficiency in the areas of environmental technology, sus-tainable production and sustainable consumption. Finland’s 2014 National Material Efficiency Programme promotes sustainable growth through material efficiency, aiming to achieve economic growth, the sensible use of natural resources and disengagement from harmful environmental effects at the same time. It proposes eight measures for material efficiency and focuses in particular on creating the preconditions for ecologically sustainable growth and employment; promoting competitiveness and balanced oper-ational preconditions for business; utilizing non-renewable natural resources in a sustainable manner; and promoting the production of high added-value products based on strong knowledge and skills.
Source: EEA, 2016.
Topromoteresourceefficiencyinatargetedway,leveragepointsforspecificresourcestreamsmustbeidentified.These leverage points refer to particularly resource intensive processes, products or infrastructure, as well asinefficientpractices(wherechangecouldhaveahighimpactonoverallresourceefficiency) . For example, foot-print analysis shows that food consumption is the most important driver of biodiversity loss for most countries, as well as across borders (Wilting et al ., 2017) . Around one third of global food produced for human consumption is estimated to be lost or wasted (Gustavsson et al ., 2011) . In high-income economies, food waste is more prevalent at the end of the supply chain . For example, it was recently estimatedthataround53 percentoffoodwastedintheEuropean Union is from households, and that around 60 percentofthefoodthrownoutisedible(Stenmarcket al ., 2016) . In the United Kingdom, the voluntary ‘Love Food Hate Waste’ campaign promotes behavioural change acrossfivehotspotareasthattypicallyleadtofoodwaste:planning, portions, date labels, leftovers/forgotten foods andstorage. Itcontributedtoa21 percentreductionin the amount of food being wasted between 2007 and 2012 (Waste and Resources Action Programme, United Kingdom (WRAP), 2013) .
To identify “hot spots” for policy action, national and inter-nationalresourceefficiencyprogrammescouldplayastrategic role. Such agencies could coordinate monitoring (see section 3 .2 .1 above), as well as streamlining institu-tional arrangements to promote synergies in national – and cross-sectoral – policy interventions . This is partic-ularly important as policy coherence and coordination is a struggle in many countries . For example, in the European

A SYSTEMS APPROACH TO RESOURCE EFFICIENCY AND POLLUTION REDUCTION
55
Governance solutions
1
2
3
4
5
Union: “Many and varied institutional arrangements are in place to develop and implement policies for material resource efficiency, reflecting national conditions and requirements . In most cases, however, several ministries are involved, with overlapping responsibilities and compe-tencies” (European Environment Agency (EEA), 2016) . As a firststep,threeEuropeancountriescurrentlyhavenationalstrategiesfocusedonmaterialresourceefficiency(Seebox 3 .3) . In at least 56 developing economies, ‘National Cleaner Production Centres’ (NCPC) have increased their focus on preventative measures for pollution control, includingresourceefficiencyinparticular(seebox3.4).26 In the United States, the Sustainable Materials Management Programme helps to promote capacity and consistency at state and local levels, as well as to facilitate dialogue and collaboration for meeting challenges in a cross-cutting way (US EPA, 2015) .
3.2.3 Take advantage of leapfrogging opportunities to achieve relative decoupling in developing economies and promote absolute decoupling in developed economiesThere are huge global inequalities in terms of access tonaturalresourcesandtheireconomicbenefits,bothamong and within countries (see section 2 .4 .2) .27 The twin issues of reducing overconsumption and waste of natural resources on the one hand, and providing secure access to natural resources and food on the other, must be addressed simultaneously to ensure that neither resource extraction/equitable use nor waste disposal/emissions surpass the thresholds of a global “safe operating space” . Strategies and solutions should therefore be designed according to national circumstances, but in a globally consistent manner by approaching the SDGs without compromising other regions’ progress towards this end .
While the challenge of decoupling is the same across the world, it manifests differently in terms of strategies and possible pathways in countries at varying stages of “devel-opment” . Absolute decoupling is the aim of high-income nations, with strategies needed to lower average resource consumption levels, distribute prosperity equally and maintain a high quality of life (UNEP, 2014b) . To achieve an inclusive, green economy – and meet the SDGs for all – overconsumption must be reduced . Strategies for waste prevention, resource recovery, new business models and
26 AlsoasindicatedbythechangeintheprogrammenametoUNIDO-UNEPJointGlobalResourceEfficientandCleanerProduction(RECP)Programmefor developing and transition countries in 2009 and the launch of the RECP network . See the UNIDO website: http://www .unido .org/ncpc .html .
27 There is no longer a geographical divide in terms of poverty: countries in which citizens on average enjoy high levels of material comforts co-exist with poverty stricken communities, and vice versa, throughout the world .
28 This relates to the fact that vested interests may not be as set on defending the status quo and consumption habits may not yet be as tied to mass consumption with rapid obsolescence, thereby providing greater scope for new forms of consumption and leasing (Swilling and Annecke, 2012; Boston Consulting Group, 2010) .
changed consumption patterns are further discussed in this chapter . The magnitude and speed of the decoupling chal-lenge must be established by targets for “sustainable” levels of total resource consumption (see section 3 .2 .2 above) .
Relative decoupling is a key strategy for developing economies and economies in transition to raise average income levels and eliminate poverty . These countries muststrivetoimproveresourceefficienciesandachievecleaner production processes, even as their net con-sumption of natural resources increases for a period (in other words, until a socially acceptable quality of life is achieved) . This could be seen as an opportunity to fast track development goals by learning from and avoiding the unsustainable economic development pathways previously adopted by more developed economies . Some even view this as a relative advantage for decoupling as there are weaker biases28 against resource efficient investments (UNEP, 2014b) . Moreover, where much of the population is poorly serviced by infrastructure networks, as in many fast-growing cities in lower-income countries, there are opportunities to design and build new infra-structure that avoids the resource- and energy-inten-sive approaches typical of many cities in high-income countries (UNEP, 2013a) .
Opportunities to leapfrog infrastructure and technology development require access to sustained finance and international cooperation on capacity-building, technology advancement and investment . In low-income countries in particular, support from development aid cooperation agencies is needed to build the necessary capacity for fiscalreforms,strengthenweakinstitutionsanddevelopcoordination mechanisms that involve key stakeholders .
BOX 3.4 TheNationalCleanerProductionCentre(NCPC)ofSouthAfrica
The vision of the NCPC of South Africa is: “To be South Africa’s leading catalyst for industrial resource efficiency and cleaner pro-duction that contributes to economic growth, sustainable industry practices and human development”. It offers a range of subsidized services, such as resource efficiency assessments of companies to help identify areas and strategies for improvement; a training programme for creating skills to maximize resource efficiency; an internship programme; as well as advocacy and awareness raising.
Source and more information available online: http://ncpc.co.za.

ASSESSING GLOBAL RESOURCE USE
56
Governance solutions
3.2.4 Align price signals with the strategic goals of society: Implement a policy mix that builds incentives and corrects market failures for resourceefficiency
Aligning price signals with the strategic goals of society has the potential to adjust the goals and operation modes of firms and individuals, so that their investment and purchase decisions reflect those of society as a whole (UNEP, 2014b) . Currently, the vast majority of taxes on emissions, energy or – rarely – on raw materials (Commonwealth Secretariat and International Council on Minerals and Metals (ICMM), 2009) are designed primarily to raise revenues and tend to be set at modest levels, partly to avoid migration of polluters to tax havens .29 Subsidies of up to 1 .1 trillion USD each year for the productive use of energy, land and water resources (McKinsey Global Institute, 2011) block incentives to investinresourceefficiencyinordertosaveresourcesand lower costs . The same can be said of tax systems that place the burden of taxes on labour instead of resources, as in most European countries (which derive morethan50 percentoftaxrevenuefromlabour)(EEA,2017) . Moreover, the regulatory frameworks for markets have often been developed in ways that discourage long-term management of resources, and instead incentivize their wasteful early use . Adjusting such frameworks will require strong leadership at the level of prime ministers, as well as policies that cut across economic sectors to address economy-wide resource use (UNEP, 2014b) .
BOX 3.5 ReformedwaterpricingleadstosignificantdecouplinginSingapore
Singapore is heavily dependent on imported water and faces chronic water shortages. In 1997, water-pricing reform was undertaken to reflect the ecological costs of water use and to streamline the tax rate based on the amount of water used. It raised average monthly domestic bills for water from S$ 13 in 1996 to S$ 30 in 2000, and provided a rebate scheme for lower-income households tied to incentives to conserve water, energy and gas. As a result, domestic per capita water consumption decreased from 176 to 160 litres daily between 1994 and 2005, while water imports decreased from more than 50 per cent in 1994 to 33 per cent in 2008. The average home in Singapore now uses four times less water than a United States home of comparable income.
Source: UNEP, 2014b; United Nations Economic and Social Commission for Asia and the Pacific (ESCAP), 2012.
Implementing a price signal that steadily increases at the pace of decoupling successes is one key strategy (UNEP, 2014b). Economic instruments face a characteristic chal-lenge: if price signals are strong, citizens may contest and industries may just give up or emigrate . If price signals are
29 SouthKoreaisnowthecountrywithoneofthehighestlevelsofresourceandenvironmentaltaxation:roughly10 percentoffiscalrevenues(comparedwithabout6 percentintypicalEuropeanUnioncountriesand3 percentintheUnitedStates).
weak,however,theeffectsforresourceefficiencymaybeinsignificant:theefficiencygainsriskbeingeatenupbythecombination of rebound effects and economic growth . By explicitlylinkingpricerisestoefficiencygains,thepoliticaldiscourse around the effects of the proposal broadens . It moves the discussion to net costs, innovation and invest-ment, rather than just price and fear of losses. Moreover, gradual introduction of measures such as tax reform may have a strong steering effect and help to avoid rebounds . In many cases, the announcement of future changes in taxes aloneinducesmoreresource-efficientbehaviours,asfirmsand people adjust in anticipation (the signalling effect) . Addressing flawed price signals could also provide multiple benefits.Theremovaloffossilfuelsubsidieswouldnotonlyhave direct consequences on air pollution and greenhouse gas emissions, but would also free up resources that can be allocated to the general budget and/or invested in the wider economy (ibid) . In any case, whenever prices are changed, special attention must be focused on the impacts on the very poor . A growing number of lower-income countries have embarked on tax and subsidy reform as part of their poverty reduction strategies, combining those with water and energy block tariffs for meeting the needs of the poor-est (see box 3 .11 in section 3 .2 .7) . How a particular policy addresses job creation, raises revenues and its associated costs and benefits are considerations that would be important to policymakers.
Table 3 .1 provides a summary of different financial instruments for a selected number of sectors related to resourceefficiency.Thelistisnotexhaustive,butidentifiesexamplesofspecificpolicyinstrumentsrelatedmainlytotaxation and expenditure, as well as stating where such policies have been implemented (with effectiveness or sustainability not necessarily assessed in each context) . Itoutlinesthewiderangeoffinancialinstrumentsthatcan be used as part of a policy mix to promote resource efficiency (see also Bontoux and Bengtsson, 2016) . For example, many industrialized countries (including Australia, Sweden and Canada) are using carbon taxes to encourage companies and households to invest in cleaner technologies and adopt green practices . The Danish pesticide tax was meant to improve environmental performance, and has the spillover effect of improving materialefficiency(DirectorateGeneral(DG)Environment,2011) . In Burkina Faso, a progressive tariff grid for drinking waterhasreducedpercapitawateruseandimprovedeffi-ciency.Ecologicalfiscaltransfersaimtoprovidefinancialresources to local governments for their conservation activities, and have experienced some success in Brazil . Trading emission permits was successful in reducing SO2

A SYSTEMS APPROACH TO RESOURCE EFFICIENCY AND POLLUTION REDUCTION
57
Governance solutions
1
2
3
4
5
emissions in some states of the United States, while the European Emission Trading System for greenhouse gas emissions has so far proven rather ineffective due to low prices (with the EU now striving to cap the number of availablecertificates).These examples show the variety
of tools available and appropriate for different national, sectoral and resource contexts. All in all, identifying good practices that have been employed elsewhere may support policy development and implementation in a cross-country capacity-building and learning exchange .
TABLE3.1 Examplesoffiscalpolicyinstrumentsbysector/policyareausedtopromoteresourceefficiencyacrosstheglobe
SECTOR/POLICY AREA POLICY INSTRUMENT SELECTED COUNTRY EXAMPLES
MATERIAL USE Raw material levyAggregates and gravel taxes
DenmarkUnited Kingdom, Italy, Sweden
ENERGY AND CLIMATE
Clean vehicle/energy taxCarbon taxClean technology subsidies
Germany, NetherlandsDenmark, Slovenia, Norway, Netherlands and several European countries.Netherlands, Denmark
WATERBlock/grid tariffsPlastic bag charges/taxesWater supply and sanitation tariffs
Burkina FasoUnited Kingdom, DenmarkSouth Africa, Malaysia
LAND Landfill taxPesticide tax
United KingdomDenmark
BIODIVERSITY AND CHANGES TO ECOSYSTEM Ecological fiscal transfers Brazil
WASTE Waste tax Denmark
EMISSIONSPollution chargeNitrogen Oxide taxEmission trading (SO2, GHG)
China, Colombia, MexicoSwedenUnited States, European Union
MINERALS AND OIL Mineral (extraction) taxMineral oil tax
Bulgaria, EstoniaGermany
Source: Compiled by the authors from various sources: DG Environment, 2011; EEA, 2011.
3.2.5 Promote innovation for a circular economy to reduce resource demands and increase resource security
Aswitchfromconsumptionoffiniteresourcestorecycledmaterials and renewable resources (such as sunlight, wind and sustainably managed biomass) opens up the possibility of meeting the needs of more people over the long term . This shifts the focus from reducing damage to generating new alternatives, and broadens the scope of innovation for sustainable solutions beyond the status quo . Increased use of recycled resources also promotes security and decreases dependence on trade .
There are emerging national specializations in terms of natural resource extraction for trade, and this has led to different environmental and social issues in countries that are net exporters versus net importers, thereby creating different policy contexts for decoupling (UNEP, 2016c) . Both types of countries are affected by
global resource price changes but in very different ways . Countriesrelyingonmaterialimportsprofitfromlowworldmarket prices, and their economic performance is harmed by high prices . Material exporters make windfall gains when natural resource prices are high but experience a drop in their trade balance when prices fall . Commodity-exporting region, including Latin America, Africa and Australia, have experienced such effects in recent years (UNEP, 2017a) . There are two complementary interests and strategies that are relevant here:
� Net importers may strive to become more independent from external supply and develop resource saving tech-nologies and reliable domestic supply routes, depending also on cost considerations; they will also have strong incentivestoinvestinmaterialefficiencystrategiesandpolicies – achieving more with less .
� Net exporters may strive to become more indepen-dent from fluctuating and diminishing returns of their

ASSESSING GLOBAL RESOURCE USE
58
Governance solutions
resource exports and develop domestic markets in a more resilient manner .
Both strategies will mutually enhance one another . Even more importantly, net importers and exporters will need to innovate to shift their economies towards greater and sustainable shares of renewable and recycled resource use to relieve environmental burdens locally and globally .
As regards the reuse and recycling of resources, high-level policy agendas have been implemented in Japan (the Sound Material-Cycle Society), the European Union (the Circular Economy policy package) and China (the Circular Economy Promotion Law) . Table 3 .2 outlines a range of initiatives and strategies employed by European countries across the supply chain in the context of circular economy . It demonstrates the wide range of activities to this end,
but is not exhaustive . In general, policies have tended to focusmoreonregulatingortaxingwastetolandfill,oronrecycling targets, rather than on life-cycle based inter-ventions (EEA, 2016) . For example, targets are increasingly used to promote the recovery of critical, valuable materials from end-of-life products . Both Japan’s Home Appliance Recycling Act and the EU’s Waste Electrical and Electronic Directive set mandatory targets, based on the weight of recoveredmaterials.Whilesuchtargetsareacrucialfirststep in reducing the amount of waste sent to landfills, targets based on physical weight of product composition may miss the aim of recovering the most resource-in-tensive raw materials along the whole production chain (Bahn-Walkowiak et al ., 2014) . For instance, palladium comprisesonlyabout0.005 percentoftheweightofamobilephone,butaccountsfor5 percentofthetotalmaterial requirements (Chancerel and Rotter, 2009) .
BOX 3.6 TheCircularEconomyPromotionLawinChina
In 2009, the Chinese government made circular economy one of China’s major socio-economic development strategies by enacting the Circu-lar Economy Promotion Law. It required the central government and local authorities to compile dedicated circular economy content in their socio-economic development plans. For example, The 12th Five-Year Plan for National Economic and Social Development included a target to raise the country’s resource productivity by 15 per cent between 2011 and 2015, and focused in particular on reducing waste. More than 200 national standards were proposed, as well as concrete actions including the “Ten-Hundred-Thousand Demonstration Programme on Circular Economy”, with a plan to implement 10 major pilot projects, establish 100 demonstration cities and foster 1000 demonstration enterprises and industrial parks by the end of 2015.
The National Urban Mine Demonstration Base project, which focused on the scale development and industrialization of urban mine utilization (waste iron and steel, non-ferrous metals, plastics and rubber) was one such example. The aim was not to construct new recycling centres for resources, but to upgrade the existing system with the help of fiscal subsidies and policy supports for scaling up, advancing innovation and reducing pollution. To date, 49 Urban Mine Demonstration Bases have been established to collect and treat recycling resources such as waste iron and steel, non-ferrous metals, plastics and rubber. The newly increased capacity for the collection and treatment of recycling resources in these 49 bases is planned to reach more than 40 million tonnes per year.
To evaluate the effectiveness of policy measures and strengthen policy enforcement in early 2017, relevant Government departments in China jointly issued the Evaluation Indicator System of Circular Economy Development. The indicator system is built upon the Material Flows Analysis framework and consists of 17 indicators (four focused on inputs, nine on recycling and four on waste output). Resource productivity (based on major constituents of domestic material consumption) and the recycling rate for main waste were selected as the two headline indicators. Evaluation has shown that resource productivity increased by more than 20 percent in 2011–2015, the use of recycling resources reached 246 million tonnes in 2015 and 10 major pilot projects were completed successfully. In particular, the circular transformation of industrial parks, commercialization of remanufacturing, resource regeneration and decontamination processing of kitchen waste were broadened and generalized throughout the period. In May 2017, the Chinese government issued “The Guiding Action Plan for Circular Economy for 2016–2020”, which includes new actions to promote circular development.
Source: National Development and Reform Commission of the People’s Republic of China (2016). B. Zhu, Tsinghua University.
BOX3.7 ExtendedproducerresponsibilityhasincreasedrecoveryinSofia,Bulgaria,andIlfov,Romania.
Extended producer responsibility (EPR) means that producers must take responsibility for the “post-consumer stage of a product’s life cycle” (OECD, 2011). This is a strategy in Europe where proposals in the Action Plan of the European Commission’s Circular Economy Strategy (European Com-mission (EC), 2015) seek to make EPR schemes more transparent and cost effective (UNEP, 2017a). In practice, the Municipality of Sofia, Bulgaria, introduced a requirement for producers of electrical equipment to finance separate collection of waste electrical and electronic equipment (WEEE) from households. It set up two organizations responsible for implementation and partly due to a vigorous information campaign, the amount of WEEE recovered increased from 722 tonnes to 1,831 tonnes between 2009 and 2013. The Municipality of Ilfov, Romania, requires all consumers to pay a “green stamp” when they purchase electrical and electronic equipment. This is put towards financing two producer responsibility organizations that “buy back” or collect WEEE. Buy-back campaigns now represent about 30 per cent of total WEEE sales in Romania, and the total percentage of raw material recovery is 80–90 per cent (partly thanks to such instruments).
Source: Regions 4 Recycling; www.regions4recycling.eu/R4R_toolkit/R4R_good_practices.

A SYSTEMS APPROACH TO RESOURCE EFFICIENCY AND POLLUTION REDUCTION
59
Governance solutions
1
2
3
4
5
TABLE3.2 ExamplesofcirculareconomystrategiesandinitiativesreportedbycountriesinEurope
STAGE OF MATERIAL LIFE CYCLE STRATEGIES AND INITIATIVE REPORTED BY DIFFERENT COUNTRIES
Extraction of raw materials � Reduce the use of primary raw materials (Iceland) � Reduce the impact of material extraction (United Kingdom)
Design of products � Integrate environmental aspects into product design (France) � Extend the lifespan of products (Ireland)
Production and distribution � Extended producer responsibility, for example for waste electrical and electronic equipment, packaging and end-of-life vehicles (Portugal)
� Industrial symbiosis and new business models (Sweden)
Consumption and use � Pay-as-you-throw schemes (Belgium) � Changing consumption patterns (Italy)
Reuse, repair, redistribute, refurbish and remanufacture
� REPANET and REVITAL initiatives (Austria) � The Scottish Institute for Remanufacture (Scotland, the United Kingdom)
Waste prevention � Secondary Raw Materials Policy (Czech Republic) � Strategies for prevention of waste (Denmark)
Waste management (including recycling) � Separate collection of metal and biowaste to improve recycling rates (Croatia) � Seven goals for the National Waste Management Plan and Waste Prevention Programme (Finland) � Tailor norms or certifications to the circular economy (Netherlands) � Transform waste into resources (Poland)
Source: EEA, 2016.Note: This list is not exhaustive, but rather outlines the range of activities across the economy and throughout Europe.
30 As opposed to a “material-centric” approach, which sees recycling as a process to extract one (usually bulk) metal and views other materials as a hindrance .
One tool for policymakers is supporting “design for recycling”, whereby product designers must make design choices that help rather than hinder recycling processes (for instance by avoiding incompatible metal mixtures or joints that hinder recycling) (UNEP, 2013c) . A product-centric approach30 supports high material recovery rates as it considers all elements within a product at the same time, sees the value in each and optimizes various recycling options and processes accordingly (UNEP, 2013c) . To this end, design requirements and standards for high quality re-applications are crucial to developing a well-functioning secondary materials market geared not only toward downcycling, but also promoting upcycling of valuable material resources . A shift toward product-service-systems may also be used to extend the lifetime of products . This is because, if producers retain ownership, incentives to develop high-quality, robust products and to maintain them may be increased (see Tukker and Tischner, 2006; Fischer et al ., 2015) .
Before recycling, extending the lifetime of material resources through direct reuse, repair, refurbishing or remanufacture is crucial to achieving policy aims for waste reduction . In this case, overcoming infrastructural lock-in is a key policy challenge, in particular as the demand for waste streams for energy generation and recycling may
run counter to prioritizing reuse and waste avoidance. Wilts et al . (2014) found that, in rich Western societies, repair and second hand have become more of a niche phenomenon primarily targeting low-income populations . This is mainly attributed to increasing product complexity, shorter innovation cycles and sometimes deliberate deg-radation of product quality (built-in obsolescence), which rapidly lowers the value of products and has resulted in a subtle throw-away mentality . Overcoming this stigma, as well as the vested interests in generating waste due to large investments in waste incineration, will require sys-temic and innovative policy tools . In Sweden, for example, reuse is promoted through tax breaks (see box 3 .8) .
BOX 3.8 ReducedtaxesforrepairofhouseholdcommoditiesinSweden
A new tax law was implemented in Sweden at the beginning of 2017 to reduce value added tax (VAT) rates on repairs to bicycles, clothes and shoes from 25 per cent to 12 per cent. It also allows for half of the labour costs to repairs on appliances like fridges, ovens, dishwashers and washing machines to be claimed back from income taxes. In this way, Sweden aims to promote repair to reduce waste and lower emissions.
Source: Government Offices of Sweden 2016, www.recyclingpoint.info/sweden-repair-your-goods-to-pay-less-taxes/?lang=en.

ASSESSING GLOBAL RESOURCE USE
60
Governance solutions
3.2.6 Build capacity to support change in the way businesses create value and citizens access, use and dispose of resources
“There is a growing awareness that regulatory/top-down measures are not the only ones needed for economies to becomemoreresourceefficient;bottom-upandcollab-orative approaches can be equally effective” (EEA, 2016, p. 114).Inthissense,the role of government is to provide the training, knowledge and socio-economic conditions that enable business and consumers to embark on and scale up eco-innovations .
One of the primary challenges is overcoming systemic lock-ins . Behaviours are generally tied to the use of existing products and technologies, creating a barrier to the uptake of eco-innovations requiring a change in habits . Individual behavioural patterns are strongly influenced by peer groups and their social norms (Thomas and Sharp, 2013) . In instances of excessive consumption, this can cause partic-ular challenges for efforts to initiate a wide-scale shift from personal ownership, also associated with social status, to a service-based approach for using appliances, vehicles and otherconsumergoodsinamoreresource-efficientway(Healy et al ., 2011; Duhigg, 2012) . Social norms do change andcanbeinfluencedbyleadership,educationandmar-keting, all of which can either work to perpetuate current patterns of (excessive) consumption engrained in certain lifestyles or move to change them . One particular norm that worksagainstinvestmentsininnovationandresourceeffi-ciencyisthepreferenceofshort-termfinancialgain.Long-term economic success and stability require a longer-term framework (UNEP, 2014b) . Moreover, environmental educa-tion and pricing mechanisms aimed at changing consumer behaviour are helpful, but when people are “locked-in” to infrastructure that influences certain behaviours (such as the absence of a separated waste recycling system or alternativestocommutingviaprivatevehicle),significantchange is unlikely (UNEP, 2013a) .
New types of alliances to collaborate, experiment and learn are critical to a successful transition . Associations, networks and partnerships that pool knowledge, share risk, mobilize support and instigate innovation are needed (UNEP, 2016b) . To this end, identifying the dominant agentsofchangeforreachingspecificvisionsisessen-tial (UNEP, 2014b) . Possible examples of change agents include businesses, political elites or groups dominated by community interests and local forms of expertise . Shared-vision development provides an avenue for build-ing networks, gaining commitments, orienting actions and forming alliances (UNEP, 2013a) .
31 www .resource-germany .com .
One strategy for both national and global governance could be to establish an information centre on technologies andinstitutionaloptionstoenhanceresourceefficiencyand sustainable use of resources, as also requested by the 10-Year Framework of Programmes on Sustainable Consumption and Production on the Global Sustainable Consumption and Production Clearing House . For instance, theGermanCentreforResourceEfficiency31, which is run by the Association of German Engineers and supported by the Environmental Ministry, provides practical guidance for small and medium-sized enterprise (SMEs) and industries . AlsoataregionallevelinGermany,theEfficiencyAgencyofNorth Rhine Westphalia plays an important role in promot-ingresourceefficiency,inparticularbyofferingconsultingservices,financingactivities,eventsandtrainingcoursesfor companies . National Cleaner Production Centres can play a similar role (see box 3 .4 above) .
Governments may lag behind businesses and civil society in terms of eco-innovations . Cooperating with private actors can be a way of promoting innovation, and requires governments to adopt institutional frameworks that are flexible and participative in order to broker new and broader coalitions for change . This requires procurement criteria that favour sustainable innovation (see box 3 .9), regulatory reforms that open up markets monopolized by existing infrastructure providers, social processes that encourage and stimulate a culture of innovation, research funding that supports networks of innovators and protective measures that create space for innovations to mature to a point where they can compete in the open market (UNEP, 2013a; 2016a) . To create an enabling environment for scaling up eco-innovations, policymakers may aim to:
� Initiatemulti-stakeholderplatformsonresourceeffi-ciency and sustainable resource use to facilitate and mediate cooperation, for instance by acting as a “third party” to counter distrust among business accustomed to high levels of competition and to promote the sharing of good practices . For example, the United Nations Global Compact supports companies to act in a way that advances the SDGs . See also box 3 .10 .
� Address institutional constraints on cooperation, in particular where cooperation is feared to clash with existing competition law and anti-trust agreements . A cross-ministerial dialogue for institutional adaptation would help governments to identify key barriers to scaling up (UNEP, 2016b) .

A SYSTEMS APPROACH TO RESOURCE EFFICIENCY AND POLLUTION REDUCTION
61
Governance solutions
1
2
3
4
5
BOX3.9 Leadingbyexample:creatingmarketsforsustainableinnovationsthroughsustainableprocurement
Public procurement generally accounts for around 8–30 per cent of a country’s GDP (The Australasian Procurement and Con-struction Council Inc (APCC), 2007; UNEP, 2009a). It therefore (a) provides the opportunity for governments to set an example for private and corporate consumers and (b) enables governments to use their purchasing power to create a market for “sustainable” products and services. For example, public buildings may be used to illustrate how solarization, energy and material efficiency can be combined, and to show how electric cooling in tropical countries can be minimized. Governments may lead by example, for instance in terms of sustainable food choices in public can-teens. Use of eco-labels, such as fair-trade coffee in government offices, may also help to create a market for such products. For example in Korea, the Act on Encouragement of Purchase of Green Products in 2004 stimulated the market for eco-labelled products in public procurement, leading to an increase in certified products (with the Korean Eco-label) by a factor of 3.8 from 2004 to 2012 (OECD, 2014). Products and services in the IT, energy, transport and building sectors are key candidates for sustainable procurement. To this end, labelling must be further developed and mainstreamed to provide information on the material and energy efficiency of products, in order to promote purchasing decisions that reflect the transition toward resource efficiency.
Source: Based on UNEP, 2017a.
BOX3.10 Multi-stakeholderinitiativespromotecollaborationinSweden,SwitzerlandandFrance
Sweden’s Centre for Resource Efficiency brings together companies, authorities and research institutes from various industries (energy, pulp and paper, manufacturing, chemicals, waste and recycling) to support competitiveness and resource efficiency, in particular through network seminars and participation in joint research projects. Switzerland’s Green Economy Dialogue brings together stakeholders from the private sector, non-governmental organiza-tions, science and academia to work on voluntary measures that promote resource conservation and efficiency. In line with the SDGs, it specifically targets participants who are responsible for the sus-tainability and business performance of their organizations and who demonstrate willingness to approach the green economy agenda in a systemic way. France’s National Council for Ecological Transition is chaired by the Minister for the Environment, and membership is made up of representatives of all social stakeholders (communities, management institutions, environmental protection associations, civil society representatives of and parliamentarians). The Council (1) supports the preparation of international negotiations on environment and sustainable development; (2) prepares national environmental conferences (annual stakeholder meetings to define and debate various actions to be pursued during the year to come); (3) monitors implementation of roadmaps; and (4) is consulted on any proposed environmental legislation.
Sources: cerise.ivl.se; www.gruenewirtschaft.admin.ch; www.developpementdurable.gouv.fr.
� Providefinancialsupportforinnovationandscalingup, in particular to manage and spread risks asso-ciated with new technologies and potential break-through innovations that may not receive enough private-sector investment, in addition to creating a levelplayingfieldthroughregulatoryframeworksandfiscalincentivesthatsetthepriceofresourcesattheright level . For example, Climate-KIC32 is the largest public-private innovation partnership in the EU for developing and scaling-up low carbon solutions .
� Build knowledge and capacity to provide companies and stakeholders with the tools needed to improve resourceefficiencyintheircurrentoperations(includinginternational standards for measuring systems-wide resourceefficiency)andtoscaleuptheirnewandinno-vative solutions . For example, the 10-Year Framework of Programmes on Sustainable Consumption and Production supports capacity-building partnerships, in particular for smallholder farmers in low- and mid-dle-income countries by helping to provide them with the tools to coordinate, collaborate and compete in markets . Strengthening knowledge and capacity already in schools promotes an educated population from the ground up . For example, the German network “Education forresourceconservationandresourceefficiency”aimsto anchor learning about sustainable resource use across different levels and areas of education .33
3.2.7 Unlock resistance to change by addressing barriers and creating opportunities for “losers” from the transitionThetransitiontoaresource-efficientandsustainableglobaleconomy may make some industries, business models and extractive/harvest practices outdated or obsolete . Reduced revenues and job losses must be addressed by policies to (1) overcome resistance to change that may be stepped up by those affected (systemic lock-ins) and (2) provide options on how losses may be reduced, cushioned or turned into new opportunities for workers and businesses . The particular challenge for policy is that such new opportu-nities may require skills training, education and investment (whichalldependsonfinancing).Theverypoorandvulner-able may need extra protection, particularly if getting the prices of resources “right” implies raising prices for essential resourcesandgoods(seebox 3.11).Thisemphasizestheneed for a coherent policy package addressing different aims and impacts of the transition (UNEP, 2014b; 2017a) .
32 KIC stands for knowledge and innovation community . For more information, see: http://www .climate-kic .org/ .
33 See also http://www .bilress .de .

ASSESSING GLOBAL RESOURCE USE
62
Governance solutions
One policy solution could be the “recycling” of revenues from a tax or charge . The goal here is to align implementa-tion of change with existing investment cycles in order to reduce capital loss . For example, countries applying a virgin resourcetaxmightfindthattheirnettaxrevenuesincreased,even if the export or domestic use of their virgin resources slowed . These countries could use their increased revenue to support sectors affected by the rising tax . An example of a pollution tax being recycled back to industry can be seen in Sweden (box 3 .12) .
Resource efficiency has the potential to create jobs, which could compensate job losses in other industries. This would require programmes to transfer and retrain workers for employment in resource-efficient sectors and activities . The scale of available job creation through resource efficiency has been estimated by a number of studies . For example, employment in the EU was estimated toincreasebyaround1 percentperyear(around2 millionnet extra jobs) by 2030 (BioIS et al ., 2014) . A report by the Club of Rome found that measures to increase energy and resourceefficiency,andthedeploymentofrenewables,mayreduce unemployment by around a third in Sweden, the Netherlands, Finland and France (Wijkman and Skånberg, 2015) . It should be noted that, even in countries where change is not immediately visible, economies experience day-to-daychangesasfirmssucceedandfailandemploy-eeschangejobs.Forexample,intheUnitedKingdom28 percent of private-sector jobs are estimated to be lost every year, and around the same number created (Anyadike-Danes et al ., 2011; UNEP, 2017a) .
34 This section largely draws on two International Resource Panel reports: UNEP, 2016b, Food Systems and Natural Resources; and UNEP, 2014a, Assessing Global Land Use: Balancing Consumption with Sustainable Supply .
There is a bundle of strategies and tools available to public authorities to promote a systems-wide transition to resourceefficiencyinawaythatmeetstheobjectivesofallSDGs for sustainable and inclusive economic development .
BOX 3.11 Protectingtheverypoorandvulnerable:anintegratedwaterplaninSouthAfrica
Countries have found ways to protect vulnerable, low-income people from policy-induced price rises. Moves away from generally low and subsidized energy and water prices towards realistic market prices have often been accompanied by policies that provide for preferential low prices for poor families. South Africa has set a good example with its Integrated Water Plan. The Plan involves realistic water prices to encourage private and public investments in water conservation and water supply, while also ensuring that a “lifeline” amount of water is affordable for the poor.
Source: UNEP, 2017a; Republic of South Africa, 2009.
BOX 3.12 NitrousoxidetaxrevenuesreturnedtoplantoperatorsinSweden
Nitrous oxides were seen as one of the main causes of acid rain, which plagued Sweden in the early 1990s. A nitrous oxide tax was announced, which large power plants were liable to pay. Small plants had no obligation because of prohibitive cost – but that would have been unfair to the big operators. Sweden therefore applied the tax with a mechanism that returned tax revenues to the operators of power plants in relation to how many kilowatt hours of power they produced. The industry as a whole did therefore not lose any money, but each operator had a strong incentive to reduce nitrous oxides. This model can and has been adjusted to energy and resource taxes for industry. For example, the refund of revenue raised could be made based on workers employed.
Source: UNEP, 2017a.
3.3 Keysolutionsinspecificpolicyareas
Althoughthesector-specificchallengesfacedbycountriesdo differ based on their socio-economic contexts, sustain-able resource management can be promoted effectively by adopting a systems perspective and focusing on key lever points . In particular, sharing experiences and learning from what has succeeded and failed in other contexts will sup-port learning-by-doing and adaptive approaches (Allen et al ., 2011; Ludwig, 2001) . Examples provided in the follow-ing sections address different aspects of the decoupling challenge related to how food and shelter are provided, as well as how infrastructure is organized . Enhancing resourceefficiencyintheseareashasgreatpotentialforreducing resource demands overall (see, inter alia, the material footprint assessment identifying priority areas for
resourcepolicieswithbenefitsforreducingpollutionandincreasing well-being within the EU by Giljum et al ., 2016) .
3.3.1 Food systems34
Ensuring access to nutritious food for all is at the core of theSDGs.Over800millionpeoplearehungry,over2 billionsufferfrommicronutrientdeficienciesandover2 billionareoverweight or obese (Ng et al ., 2014) . Changes are needed across food systems to (a) change the way markets per-form at the local, national, regional and global levels, (b) ensure that the social safety nets created for vulnerable groups function, and secure their access to infrastructure, finance,knowledgeandtechnology,and(c)supportashift

A SYSTEMS APPROACH TO RESOURCE EFFICIENCY AND POLLUTION REDUCTION
63
Governance solutions
1
2
3
4
5
in the lifestyles and wasteful behaviours of overconsum-ers, as well as their access to information regarding the impacts of their choices .
Trends towards increased liberalization from regulations, privatization of State-owned agribusiness enterprises, consolidation across food sectors and supply chains and increasing supermarketization35 have shifted power to large private actors . This speaks to the growing responsibility of business, as well as unique policy challenges . Food produc-tion and food consumption no longer take place within clear boundaries,makingitmoredifficultforgovernmentstoregulate and control and for business to get a full overview . This highlights the need for policymakers to cooperate with other governments, private actors and civil society to exercise oversight in the food sector . Interventions can occur across all levels of governance: examples span from international (e .g . trade regulations), national (e .g . standards, regulations and pricing) to local (e .g . local farming extension services, location of restaurants and urban waste management) level .
National governments can support the development of more sustainable food systems with measures aimed at all stages of the production-consumption chain . At the beginning of the food chain, enhanced measures pro-moting and regulating sustainable cultivation and best practicemanagementoffarmsandfisheries-toimproveand maintain land, soil and water quality - are needed . Goodagriculturalandfisheriespracticesareincreasinglybeingcertifiedbyexpertinstitutions,whichleadstomorereliable consumer information and choice . Policy support to assist smallholders in complying with health, safety and environmental criteria would help them to compete in their region with global markets . Governments could facilitate collaborative schemes, such as cooperation agreements among producers, to help increase their market power . Consolidating the legal framework for farmers in clear property and tenure right regimes is a critical precondition . At the international level, global guidance36 is useful for national governments in setting up land-use and land-ten-ure laws and ensuring their local implementation and enforcement . Another priority issue for government reform, especially in low-income countries, is the need for invest-ments in rural infrastructure including irrigation, water supply, roads and services that enable local production and
35 This refers to the increasing share (in most cases) of internationally operated supermarkets in the total share of consumer food purchases . This is particularly prevalent in Asia and South America (with supermarket dominance in Brazil rising from around 15 per cent in the 1990s to a more than 60 per cent current share in overall food retail) . This not only affects power relations across the food supply chain, but also eating habits and product sourcing .
36 As is done in the FAO Voluntary Guidelines on Responsible Governance of Tenure of Land and other natural resources by the Committee on World Food Security .
37 In contrast to pure fertilizer subsidy schemes, such an approach links directly to investments on the farm to provide long-term nutrient supply, enhancesoilhealthforsustainedyieldsandimproveefficiencyinfertilizeruse(Garrityetal.,2010).
38 Formoreinformation,seetheFinnishMinistryofAgricultureandForestrywebsiteon“Makinguseofagriculturalnutrients”:http://mmm.fi/en/recyclenutrients .
“value-addition” activities such as processing and packag-ing (The High Level Panel of Experts on Food Security and Nutrition (HLPE), 2013; UNEP, 2017a) . Financial support for the use of fertilizers by cooperatives could be also helpful, potentially in “subsidy to sustainability” schemes .37 In rich countries, oversupply of fertilizers and manure leads to eutrophication of water bodies, which can be reduced by more stringent regulations and compliance control, tax-ation of fertilizers and cooperation agreements between farmers and water suppliers . In Finland, for example, a key Government project is promoting nutrient recycling - as part of a circular economy - to improve the health of water systems and create new business opportunities .38 It is crucially important to remove harmful subsidies (such as those on fossil fuels) that stimulate over-extraction ofwaterforirrigationorunsustainablefisherypractices . Price subsidies for agricultural commodities (such as rice and sugar), which are generally distorting and lead to overproductionandinefficientpractices,shouldalsobere-evaluated .
TheSDGsincludea50 percentreductiontargetforglobalfood waste by 2030 . The Zero Hunger Challenge was launched by the United Nations in 2012 with the goal of eliminating hunger, malnutrition and rural poverty by 2030 . Minimizing food loss and waste are integral to these efforts . For example, UNEP launched the “Think Eat Save” initiative in 2013 as a public awareness-raising and engagement activity to catalyse global action toward this vision . Increased reliability, consistency and depth of data on food waste and loss, in particular across borders, is urgently needed to inform policy and aid efforts towards food waste and loss reduction (Xue et al ., 2017) .
The current business logic of many food systems does not always give actors the right incentives to promote more sustainable practices. Consumer preferences, which are heavily influenced by food marketing and media, have become a driving force for what are often processed, fast and convenient foods . On the other hand, trends for organic, seasonal and locally produced food are increasing in many countries, and may be supported by government . Through its procurement policies, the city of Copenhagen for instance, serves around 20,000 meals per day (in nursing homes, schools, day care centres and so on) and aims to

ASSESSING GLOBAL RESOURCE USE
64
Governance solutions
serve100 percentorganic,seasonalfruitandvegetables.Because organic food tends to be more expensive than non-organic food, the municipality kept costs the same by making simultaneous changes in kitchens and meal plans (particularly by reducing meat and replacing it with morevegetables,withsynergisticbenefitsforgreenhousegas emission reductions) . Further consumption-oriented policies may be used to promote behaviour research and stricter marketing rules for unhealthy food, as well as cre-ating a food environment that stimulates healthy and sus-tainable diets. In this regard, education is crucial for food producers and consumers (especially children) . In general, special attention is needed for the role of women, as they are usually critical participants in food production and the main managers of food consumption in their households . Lastly, countries can monitor the overall consumption of agrarian andfisheriesproductsagainstdomesticproductioncapac-ities in terms of global footprints in order to determine their fair share and adjust the incentive framework towards a moreefficientuseofbioticresourcesifnecessary.
BOX 3.13 ImprovingmaterialefficiencyinRathkerewwadesiccatedcoconutmillinSriLankareducesfoodwaste
Measures such as laying rubber carpets on the floor of loading bays, raising employee awareness, reduction of wash water and energetic reuse of coconut shells reduced waste and saved energy. Combined measures provided savings of around USD $200,000 for an invest-ment of less than usd $5,000.
Source: UNIDO, 2013.
BOX 3.14 RelaxingcosmeticstandardsforFrenchbeansinsupermarketsleadstolowerfoodlossinKenya
In general, supermarket retailers of French beans order beans of a spe-cific length to fit their packaging requirements, meaning that farmers must cut them to the required length, wasting 30–40 per cent of the bean. One major customer was persuaded to change its buying policy, allowing Kenyan exporters to reduce waste by one third.
Source: Feedback, 2015.
BOX 3.15 TheSchoolLunchProgrammeinBrazil:ThecaseofParagominasboostingthelocaleconomyandshorteningthesupplychain
At least 30 per cent of the total funds allocated in the Brazilian National School Feeding Programme must be used to purchase food directly from family farms. The city of Paragominas (with around 100,000 inhabitants) has been purchasing food from family farms since 2005, mostly for school lunches. In doing so, it has stimulated and diversified production, boosted the organization of associations of farmers and the value of household production.
Source: UNEP, 2016b.
39 Based on data from the website of the UNEP Sustainable buildings and climate initiative: www .unep .org/sbci/, .
3.3.2 Buildings and construction
Onaglobalscale,buildingsusearound40 percentofresources,25 percentofwaterand40 percentofenergy,and they account for around one third of greenhouse gas emissions .39 Changes in the planning, design, commission-ing, construction, maintenance, refurbishment and end-of-lifestageofbuildingsprovidesignificantopportunitiesto reduce environmental impacts while providing healthy and safe living and working spaces . Meeting the needs for housing, employment and public infrastructure in a sustainable way is particularly crucial for those countries facing rapid urbanization and urban population growth . Investing in green sustainable buildings has the co-ben-efitofcreatingjobs,especiallyatthelocallevel . It has been estimated that, for every USD $1 million invested in buildingenergyefficiencyretrofits,10–14directjobsand3–4 indirect jobs would be created (UNEP, 2011c; 2012a) .
Harnessing the potential for resource efficiency in construction requires a collaboration of home and build-ing owners and users, businesses and governments . Innovation in the construction industry is traditionally slow moving, with various actors and experts addressing different aspects, often in isolation (building core, energy provision, functional use of the developed space for living, working and so forth) . There is little communication across supply chains in the construction sector, and a lack of integration of technical and social challenges and solu-tions (Eco Innovation Observatory (EIO), 2011) . Integrated planning from a systems perspective may make progress towardsinnovativeandcase-specificsolutionsforvarioustypes of buildings in different world cities .
Asystemsperspectiveisessentialforretrofittingexist-ingbuildingstocktoensurethattheenergyefficiencyof operating a building is not improved at the cost of resourceefficiencyinthelife-cycle-wideimpactsofthematerials used. A systems approach must play a role in evaluating the demolition and construction of buildings compared to the renovation of existing building stock, in particular in terms of operational versus “embodied” carbon dioxide emissions (Ibn-Mohammed et al ., 2013) . Beyond a systemic vision for individual buildings, greater resource, energy and water savings can be made at the settlement level in relation to many different types of buildings . For energyefficiencyandlocalnutrientmanagement,thisisdemonstrated in numerous examples of eco-villages, tran-sition towns and one-planet communities . For example, the Beddington Zero Energy Development community (BedZED) in the United Kingdom has enabled residents tosignificantlyreducetheirecologicalfootprintduetoitsinnovative approach to design, energy provision, service

A SYSTEMS APPROACH TO RESOURCE EFFICIENCY AND POLLUTION REDUCTION
65
Governance solutions
1
2
3
4
5
organization and lifestyles .40 Building standards to also include material footprints are still under development .
As owners and operators of buildings, governments have the opportunity to promote sustainable construction of new buildings and environmentally conscious use of the built environment through their procurement strategies (through reuse of construction materials and renewable power sources, for instance) and behaviours (lighting, cool-ing and heating practices and so forth) . Multiple standards and certification systems showcase sustainable prac-tices and support the creation of a green building sector . Prominent examples of green building rating systems devel-oped in different parts of the world include BREEAM (United Kingdom), the LEED programme (United States), Green Star (Australia), CASBEE (Japan), and HK-BEAM (Hong Kong) .41 Environmental product declarations (EPDs) are another toolthatareincreasinglyusedasabasisforthecertifi-cation of green or sustainable buildings and the materials used for construction . However, the standard indicators remain focused on climate and pollution pressures, and indicators of material resource requirements still need to be incorporated in order to support the design of new build-ingsandtheretrofittingofoldbuildingsinanenergy-and material-efficientmanner.
Financial support is vital to develop new technologies and methods and to facilitate their uptake. In the building sector, this may take the form of government-sponsored cost-efficient loans for homeowners to renovate or retrofit their homes. It is possible to ensure that such loans are affordable and accessible for all through pro-grammesspecificallytargetinglow-incomehouseholds.Accompanying measures are also needed in the form of awareness raising and information campaigns to promote adoption of such loans . These campaigns may focus on the cost-saving potential, with environmental and health benefitspresentedasabonus(UNEP,2017a).
The construction, renovation and demolition of buildings accountforabout40 percentofsolidwastestreamsin“developed” countries (UNEP, 2012a), and there is sub-stantial potential to reuse the non-hazardous portions of this waste . Governments have had success encouraging innovation in waste prevention and recovery through the implementationoflandfillbansandtaxes. For example, theLandfillTaximplementedintheUnitedKingdomin1996 (and steadily increasing since then) has been a key factor in changing attitudes and diverting waste from
40 Sustainable lifestyles accounted for around half of the eco-savings achieved, highlighting the importance of considering how residents can conveniently access services in future projects (BioRegional and Peabody, 2009) .
41 BREEAM: Building Research Establishment Environmental Assessment; LEED: Leadership in Energy and Environmental Design; CASBEE: ComprehensiveAssessmentSystemforBuildingEnvironmentalEfficiency;andHK-BEAM:HongKongBuildingEnvironmentalAssessmentMethod.
landfill,somuchsothatrecyclingandrecoveryareinmanycases cheaper than sending construction and demolition wastetolandfill(Deloitte,2016).Theintroductionofanaggregate tax for mineral extraction in 2002 most probably enhanced the effect (EEA, 2008) .
BOX 3.16 Ahousingfinanceschemeencouragesenergy-efficientsystemsandtechnologiesforlow-incomehouseholdsinMexico
More than 900,000 “Green Mortgage” credits were granted between 2007 and 2012 in Mexico, mostly targeting low-income households. This includes an additional credit of up to USD $1,250 to cover the cost of additional eco-technologies such as energy-saving lamps, ecological level toilets, purified water filters and gas water heaters, among others. These technologies have led to resource savings and lower utility bills for households.
Source: www.bshf.org/world-habitat-awards/winners-and-finalists/green-mortgage/
BOX3.17 Decentralizedproductionandrecyclinghelpcreateeco-materialsforboostingconstructioninCuba
In Cuba, local production and distribution of environmentally and economically sustainable building materials are needed for low-cost repairs and new constructions, especially in disaster-prone areas and for social housing ( relying on centralized and remote production of building materials was no longer viable for large parts of the pop-ulation due to rising fossil fuel costs). A project helped to develop the local manufacture of eco-building materials, in particular by recycling waste such as roofing tiles, concrete blocks and clay bricks; by supporting eco-material workshops; and backing a decentralized management model for housing renovation including a micro-credit facility. The project contributed to job creation and won the World Habitat Award in 2007.
Source: www.bshf.org/world-habitat-awards/winners-and-finalists/ecomaterials-in-social-housing-projects/
BOX 3.18 ImprovedresourceefficiencyofbrickproductioninBangladeshalsoreduceslocalairpollutionandCO2emissions
Green Bricks Bangladesh, which promotes smokeless brick produc-tion while also increasing resource productivity, has shown how a change in the manufacture of construction materials can have significant impacts on reducing energy use and air pollution. In comparison to traditional brick fabrication, Green Bricks require only about one third of the amount of coal and a single improved kiln, which can produce up to 15 million bricks, can cut CO2 emissions by 5000 tons every year (Hossain and Abdullah, 2012). It is estimated that the 15 demonstration kilns built in the Green Brick project in Bangladesh will save 314,000 tonnes CO2 equivalent by the end of the project in 2015, while also improving workers’ health and incomes.
Source: United Nations Development Programme (UNDP) Bangladesh 2010; UNEP 2017a.
ASSESSING GLOBAL RESOURCE USE
66
Governance solutions
3.3.3 Cities and urban infrastructure42
Cities are the building blocks of a socially inclusive global green economy . They are the spatial nodes where the major global and national resource flows connect, as well as being centres of innovation, diversity and culture . They also account for the bulk of resource consumption: approx-imately75 percentofglobalenergyandmaterialflowswere consumed in cities in 2005, despite the latter cover-ingjust2 percentoftheland.However,the metabolism of cities is often not well understood, and there is limited research into the links between social organization and thepolicydynamicsofresourceflowsatanurbanscale.Nevertheless,understandingthoseflowsisthefirststepto being able to address the environmental externalities of urban activities (UNEP, 2013a) . A systems approach to sustainable cities can help promote long-lasting solutions toward achieving the interlinked goals of the SDGs (Bai et al ., 2016; see also the city case studies in chapter 4) .
Each region has distinct patterns and processes that reveal the emergence of a lumpy “rural-urban continuum”, in which rural-urban links are highly heterogeneous between and within countries and change slowly over time . Challenges, such as the growing number of urban poor, resource security and infrastructure development, must be approached together on a case-by-case basis and oriented by vision building. For example, urban planning in low-income countries with rapid population growth has been highly challenging in cities all over the world . Master plans have to be made and, within the master plans, micro planning is needed to develop appropriate transit infra-structure (including bus and road) .
The design, construction and operation of energy, waste, water, sanitation and transport infrastructure creates a socio-technical environment that shapes the “way of life” for city residents and determines how they obtain, use and dispose of the resources they require . How resources flow within cities, as well as how cities are linked to their hinterlands and to more long-distance resource wells and final sinks, are important considerations for assessing infrastructure networks . There is evidence to suggest thatitcanoftenbemoreresourceefficienttoachievethe well-being of people with respect to services, health, education and income if they are concentrated in cities, rather than spread out across rural areas (UNEP, 2017a) .
42 This section is largely based on the IRP report: UNEP (2013a) . City-Level Decoupling: Urban resource flows and the governance of infrastructure transitions .
43 Maintainingredundantwaterinfrastructure,forexample,creates“artificialdemand”thatmayusecleanwaterresourcesforpurposesthatwouldotherwise use grey water . Such challenges are prevalent in “shrinking” cities, found mainly in Europe, North America and Japan, thereby slowing the potential rate of both resource and impact decoupling (UNEP, 2017a) .
Infrastructure is key to urban resource efficiency . Infrastructure built today lasts 25 to 75 years . This not only requires materials and energy to build (contributing to the physical “stock” of resources within national econ-omies), but also determines how energy, water, materials and waste are managed at a city scale . The design of urban infrastructure is thus critical to environmental aims, as well as being costly to build, maintain and refur-bish (especially if it is redundant) .43 It is estimated that a total of USD $41 trillion is required to refurbish the urban infrastructure old (mainly in “developed” country cities) and build the new (mainly in the “developing” countrycities)between2005and2030.Over50 percent(USD $22.6 trillion)wouldberequiredforwatersystems,USD $9 trillion for energy, USD $7 .8 trillion for road and rail infrastructure and USD $1 .6 trillion for air and sea ports (Doshi et al ., 2007) .
A combination of resource productivity improvements, increased use of local renewable resources and reuse of waste products can allow cities to better manage the flowspassingthroughtheminpursuitofdecoupling. “Green cities” show signs of a trend towards re-localiza-tion and attempts to create more autonomous circular or “closed-loop” metabolisms . Four types of interventions are particularlyimportantforpromotingresourceefficiencyincities (Salat, 2011; Salat and Bourdic, 2011; UNEP, 2017a):
� spatial restructuring of urban morphology to reverse thecentury-longtrendtowardsde-densificationandtoinstead achieve much greater densities – and a richer mix – of housing, jobs and amenities at the neighbour-hood level;
� human-scale sustainable design to create the condi-tions for “soft” mobility (pedestrianization and cycling) at the city and neighbourhood scales and “passive” heating, cooling and lighting at building level;
� sustainable energy (radical resource efficiency of all components such as vehicles, infrastructure, buildings and factories, plus maximum use of renewable energy) at all scales (city-wide, neighbourhood and building); and
� the promotion of sustainable behaviours (such as the wish to recycle waste, use public transport, walk, cycle, use parks and so on) .

A SYSTEMS APPROACH TO RESOURCE EFFICIENCY AND POLLUTION REDUCTION
67
Governance solutions
1
2
3
4
5
One strategy for national governments is the adoption of National Sustainable Urban Development Policy Frameworks that support the role of cities in national sus-tainable development strategies . They should align spatial planning guidelines, infrastructure investment strategies andfinancialandlong-termsustainabilitygoals.Cityplan-ners must be able to take the rural-urban continuum into account, highlighting the importance of multi-disciplinary spatial planning mechanisms and tools to support the long-term transition process from rural to urban areas inaresource-efficientway.InSouthAfrica,forexample,national legislation stipulates that every town and city must set a vision and draft an “Integrated Development Plan” on an annual basis .
UNEP(2017b)identifiedbroadsetsofstrategiesthatfocuson systems level transformation as a pathway to achiev-ingresource-efficienturbanization.Thebroadstrategiesinclude:
� Avoid urban area expansion to agricultural areas and lands that provide high value ecosystem services, such as flood protection .
� Planforstrategicintensificationandlimiturbansprawlwith higher density and mixed use around transit, devel-oping human-scaled urban forms and encouraging non-motorized travel and social interactions .
� Promoteenergy-efficiencystrategiesinsinglesectors,includinghigh-efficiencybuildings,districtenergysys-tems and transit .
� Supportcross-sectoralefficiencybypromotingstrate-gies that include reusing waste heat in district energy systems (see case study 2 in section 4 .5) .
Scenario analyses indicate that these strategies have the potential to achieve a 30 per cent to 60 per cent reduction in resource use in buildings and transportation sectors indiverseworldcities(seefigure3.6;UNEP,2017b).In order to proceed towards more sustainable paths, one might expect system-level transformations at the city level to reflect, incorporate and drive socioeconomic transitions at the national and global levels . The next chapter builds uponthebasicstrategiesforbuildingresource-efficientcities outlined here, expanding the strategies to address the challenge of air pollution in cities .
FIGURE 3.6 Reductionpotentialofsystem-leveltransformationstrategiesinbuildingsandtransportationsectors
Climate Water Metal Land0%
20%
40%
60%
80%
100%
Resource-Efficiency RE+DensificationBaseline
46%
53%
64%
76%
57%
66%
53%
56%
100%
100%
100%
100%
Source: UNEP, 2017b.Note: Depicts aggregate change in resource consumption for each socio-technical system in 84 cities combined under resource-efficient scenarios in 2050 (compared to forecasted baseline in 2050).

© N
eil P
alm
er C
IAT
/ Flic
kr
68
ASSESSING GLOBAL RESOURCE USE
4. Special feature: Mitigating air pollution and achieving SDGs in cities through a systems focus on natural resources and infrastructure

A SYSTEMS APPROACH TO RESOURCE EFFICIENCY AND POLLUTION REDUCTION
69
Special feature
1
2
3
4
5
BOX 4.1 Highlightsofthespecialfeature
� Air pollution has emerged as one of the primary risk factors for premature mortality in the 21st century, linked with 6.5 million premature deaths annually due to cardiovascular disease, respiratory disease, lung cancer and diabetes, (with the majority occurring in global cities). Indoor and ambient air pollution by fine particulate matter (PM2.5) is the dominant risk factor, accounting for 96 per cent of these health effects.
� Addressing PM2.5 air pollution has been challenging because it arises from multiple infrastructure sectors within the city boundary (industry, transportation, household cook stoves, waste burning, construction and road dust) and outside city boundaries (agricultural burning, industrial emissions and natural sources). Furthermore, PM2.5 concentrations in the air are influenced in complex ways by local weather patterns and exacerbated by climate change, particularly extreme heat and drought events.
� Lessons learned from air-quality management experiences in the United States and other countries indicate that systems-based approaches complemented by end-of-pipe control strategies are important for addressing the multi-faceted sources of PM2.5 (such as waste burning, biomass burning stoves and agricultural burning).
� This chapter presents a systems approach anchored in the use of natural resources, with a focus on essential infrastructures and food supply in cities, which delineates pathways to reduce pollution while also providing multiple co-benefits that advance SDGs locally.
� Applying this systems approach to developing economies, strategic pathways are identified for transforming cities with underserved populations, high inequality and high pollution levels into more inclusive, resource-efficient and cleaner places that advance the well-being of large urban populations.
� Pathway analysis based on a systems approach to emerging economies undergoing rapid urbanization and industrialization finds that circular economy policies, along with urban planning that enables beneficial exchange of materials and energy across different industry and infrastructure sectors, can yield economic gains, natural resource conservation, greenhouse gas mitigation and air pollution reductions.
� Overall, a “bundle of strategies”, when implemented together, can simultaneously reduce air pollution and advance human well-being, achieving multiple SDGs in diverse world cities. The key strategies include:
� Avoid urban area expansion to agricultural areas and land that provide high value ecosystem services, developing urban-rural market mechanisms that ensure preservation of lands and reduction of dust/air pollution emissions;
� Strategic urban land-use and infrastructure planning within cities and urban areas to reduce travel demand;
� Investments in efficient transit systems to reduce vehicular emissions and congestion;
� Inclusive development and in situ slum rehabilitation in multi-storey buildings within denser city cores that provide essential services and access to livelihoods with reduced travel burden on the poor;
� Promoting multi-storey resource-efficient building construction and energy efficiency for all buildings;
� Promoting culturally sensitive behavioural strategies to reduce resource use;
� Focusing on key resource substitutions for dirty cooking fuels and construction materials with high embodied fuel and PM2.5 emissions;
� Electricity grid transformations with high levels of renewable energy;
� Creating business innovations to reduce agricultural and solid-waste burning.

ASSESSING GLOBAL RESOURCE USE
70
Special feature
4.1 Objectives of the special feature
Consistent with the third United Nations Environmental Assembly’s focus on pollution, chapter 4 specifically addresses the topic of air pollution in cities from a resource-basedsystemsperspective.Thespecificobjec-tives of this special feature are:
� To demonstrate application of a systems approach to world cities that links resource use in essential infra-structure and food supply sectors with more than 9 SDGs, with special emphasis on inclusive development, resourceefficiencyandtheresource-infrastructure-airpollution-health nexus .
� Toillustratetheairpollutionandhealthco-benefitsofresource-efficienturbanization,specificallyfocusingonco-beneficiallyachievingmultipleSDGsincasestudiesfrom India and China where the bulk of future urbaniza-tion will occur and where cities are facing substantial air pollution challenges .
� To highlight a general “policy/strategy bundle” focused on resource transitions and infrastructure transfor-mations that combine to conserve natural resources, mitigate air pollution and advance multiple SDGs in diverse world cities .
� To outline quantitative metrics for individual cities to track progress toward multiple SDGs, with a focus on natural resource use in urban infrastructures .
Overall, this chapter presents a city-level approach to mon-itoring resource use, infrastructure provisioning and asso-ciated PM2 .5 air pollution and greenhouse gas impacts, as well as assessing progress toward SDGs in keeping with theDPSIRframeworkillustratedinfigure1.4.Thechapterbegins with an overview of the global urbanization chal-lenge . It describes resource use for basic infrastructure and food provisioning in cities, and the resulting impacts on multiple SDGs (including human health impacts of PM2 .5 pollution in world cities) . Historical trends in air-quality managementintheUnitedStates(includingthesignificantprogress made) are briefly reviewed, as are challenges that require a whole systems approach to achieve healthy and clean air in all cities . Lastly, a systems approach to assess
theairpollution,health,andmultipleSDGco-benefitsofresource-efficienturbanizationispresentedthroughpath-way analysis in cities of India and China . The case studies represent two broad situations, and serve to illustrate different insights:
1. Cities in growing economies that are dealing with basic infrastructure challenges, air pollution and resource scarcity . The case study of Delhi, India, represents rapidly growing cities in the developing world where infrastructure is inadequate and unable to keep up with growth, resulting in informal settlements that lack basic infrastructure provi-sioning (which in turn leads to deprivation and inequality) . Thecasestudydemonstratesthepotentialbenefitsofa bundle of strategies that can promote more inclusive development, while reducing net air pollution emissions, greenhouse gas mitigation and human health risks . This case study also illustrates metrics to track progress toward SDGs in individual cities, applying the DPSIR framework to Delhi, India .
2. Middle-income countries undergoing rapid urban infrastructure development and industrialization that are experiencing the challenges of high resource use and air pollution . This case study provides baseline energy use and air pollution emissions data for of all 637 cities in China (Ramaswami et al ., 2017c), and illustrates potential multipleco-benefitsachievablebyimplementingurban-in-dustrial circular economy strategies in cities . This case study seeks to demonstrate the collective role that cities can play in achieving national greenhouse gas mitigation targets through urban-industrial symbiosis strategies, whilealsoprovidinglocalairpollutionandhealthbenefits,alongwithsignificantnaturalresourceandmonetarysav-ings.Theurban-industrialresourceefficiencystrategiesare broadly relevant to China and other nations in Asia and Africa where future urbanization and industrialization are expected to occur together . This illustrates that the adop-tionofresource-efficientinfrastructureplanningisakeypathway to prevent air pollution .
Both studies demonstrate the value in applying a sys-temsapproachthatquantifieslinkagesbetweennaturalresources,infrastructureandmultipleSDGco-benefits.

A SYSTEMS APPROACH TO RESOURCE EFFICIENCY AND POLLUTION REDUCTION
71
Special feature
1
2
3
4
5
4.2 Challenges of urbanization
Bytheyear2050,about6billionpeople(nearly70 percent of the global population) are expected to be living in cities, almost doubling our current urban population of 3 billion in a short span of only 40 years (UNEP, 2013a) . Such rates of urban growth are faster than any previously experienced in human history, and are placing enormous pressures on the local environment within cities, as well as impacting the global resource base and regional and global environmental quality . While the urban middle class is pro-jected to expand, inequalities are also expected to become worse.Between30and40 percentofthepopulationinmany world cities are already living in slums and informal settlements (UN-Habitat, 2016), and this proportion is projected to grow (particularly in Asia and Africa where the bulk of future urbanization will occur) . Increasing urban populations,risingaffluence,growinginequalities,rapidrates of migration and inequalities in basic infrastructure are major drivers that shape resource use, environmental quality and associated human well-being .
FIGURE 4.1 Worldurbanizationtrends
6.5
billi
on
.9.5
bill
ion
3 bi
llion
5.7
billi
on
1 bi
llion
2-3
billi
on
1.5
billi
on
3-5
billi
on
2010
Worldpopulation
Urbanpopulation
Informalurban
population
Middleclass
2050
Source: UN-Habitat, 2016.
Cities are engines of global innovation and economic activ-ity . While the high concentration of people, in proximity to industrial and commercial activities in cities, helps enable innovation (Bettencourt, 2013), it has also historically impacted the environment negatively through soil, water and air pollution . Sanitation, sewerage and waste manage-ment infrastructures have evolved and become effective in addressing pollution in many world cities . For example, the choleraoutbreakinLondonledtothefirstwatersupplyandsewage treatment systems (Angelakis, 2015), yielding vast improvements in human and environmental health in many world cities . However, the global challenge of air pollution in cities remains, and suggests that end-of-pipe pollution controlaloneisnotsufficienttocomprehensivelyaddresscomplex environmental pollution challenges.
Air pollution by particulate matter (PM) has emerged as one of the primary risk factors affecting human health in the 21st century (Institute for Health Metrics and Evaluation (IHME),2016).Theglobalburdenofdiseasestudyidentifiesair pollution to be among the top ten risk factors for pre-mature death in several nations of the world (IHME, 2016) . In fact, indoor and outdoor air pollution in 2015 was asso-ciated with about 6 .5 million premature deaths worldwide, with a vast majority occurring in cities . Annual premature deaths from air pollution are estimated at 99,000 in the United States, more than 283,000 in the European Union and over 4 .6 million in Asia (IHME, 2016) . Particulate matter of less than 2 .5 micrometers is the dominant air pollutant linked to adverse health effects such as cardiovascular disease, respiratory diseases, diabetes and lung cancer (Lin et al ., 2002) . Among 74 world cities with reliable air quality data collated by the World Health Organization and with populations of over 400,000, only 9 cities report annual average PM concentrations of less than the 10 µg/m3 World Health Organization (WHO) guideline . Average estimates of premature mortality rates from air pollution in these cities, assessed using the global burden of disease methodology (Burnett et al ., 2014) in conjunction with air quality data, are staggering(seefigure4.2).
Despite the severity of health effects, controlling air pollution has proved to be challenging because it arises from multiple infrastructure sectors within the city bound-ary (transportation, industrial combustion, household cooking stoves, waste burning, construction and road dust) and outside city boundaries (agricultural burning, industrialemissionsandnaturalsources)(seefigure4.3).Furthermore, PM2 .5 concentrations in air are influenced in complex ways by local weather patterns and exacer-bated by climate change, particularly extreme heat and drought events . The history of air pollution regulations in the United States over the past several decades (see box 4.2)illustratesthatcontrollinglargesourcesofpol-lution by end-of-pipe control has proven to be easier than controlling smaller ubiquitous sources such as household cook stoves, waste burning in streets and land manage-ment(dust,agriculture,forestandfires).Increasingly,fuelswitching, waste management and land management are becoming important aspects for managing air pollution that complement pollution control, based on a combina-tion of regulations, incentives, technology and business innovations (Sharma et al ., 2016) . Therefore, a systems approach focused on resource use in seven key essential infrastructureandfoodsupplysectors(seefigure4.4)can provide a strategic pathway to reduce air pollution whileachievingbroaderSDGco-benefits.

ASSESSING GLOBAL RESOURCE USE
72
Special feature
Figure4.2 Averageestimatesofprematuremortalityratesfromairpollutioninworldcities(prematuredeathsper10,000population):assessedbyapplyingtheglobalburdenofdiseasemethodology(Burnettetal.,2014)tocityairqualitydatareportedbytheWorldHealthOrganization(WHO,2016b)
Based on WHO Global Urban Ambient Air Pollution Databasehttp://www.who.int/phe/health_topics/outdoorair/databases/cities/en/
FIGURE 4.3 PM2.5concentrationsandsourcesasreportedbytheWorldHealthOrganizationinworldcitieswithpopulation>400,000people(WHO,2016b)
Note: Concentrations greater than the WHO guideline of 10 µg/m3 (annual average) are seen in a majority of cities, across all development levels. Sources of pollution are also diverse in different cities, encompassing many infrastructure sectors.

A SYSTEMS APPROACH TO RESOURCE EFFICIENCY AND POLLUTION REDUCTION
73
Special feature
1
2
3
4
5
FIGURE 4.4. Linkingnaturalresourceusewithinfrastructureandfoodsupply/usesectors,andassociatedsourcesofairpollutionemissions
NATURAL RESOURCE USE (DIRECT LINKS)
BASIC INFRASTRUCTURE & FOOD SUPPLY/USE SECTORS (HOMES, BUSINESSES, INDUSTRY)
AIR POLLUTION SOURCE APPORTIONMENT STUDIES (WHO)
Materials � Fossil Fuels � Biomass (Food & Non-food) � Metals & Minerals
Land
Water
� Energy Supply (electricity & heat to homes/business/industry)
� Sanitation & Waste Management � Buildings (Materials &
Construction) � Public Spaces � Food supply (agriculture) � Transportation � Water supply
� Industry (e.g. power plants, refineries, brick kilns, etc.)
� Biomass Burning (e.g. fuels, MSW, agricultural waste)
� Dust (e.g. roads, construction)
� Transportation
BOX 4.2. EmerginginsightsfromairqualitymanagementintheUnitedStates:1970-2016–Aneedforasystemsapproach
The United States has seen significant improvements in air quality over the past 46 years. In particular, the Clean Air Act (1970, with significant amendments in 1977 and 1990) established National Ambient Air Quality Standards (NAAQS) and increased enforcement authority for controlling industrial point sources and motor vehicle emissions. While the Act provides flexibility in how to achieve lower emissions, much of the improve-ment has come through end-of-pipe pollution controls. These efforts resulted in substantial decoupling of emissions from continued growth in population and GDP (see figure 4.5), and substantial reductions in the absolute level of pollutant concentrations in ambient air. Most of the country’s cities now meet annual air quality standards representing clean air overall, yet, some cities are still exceeding the national standards and the World Health Organization (WHO) guidelines, notably for PM2.5 and ozone (American Lung Association (ALA), 2017). For example, in the city of Los Angeles, the number of days of daily PM pollution exceedance has reduced ten fold from 120 days in 2001, to about 13 days in 2011 (Hayward, 2013), but achieving further reductions has proved to be challenging. Cities and states that are facing such pollution challenges are increasingly integrating end-of-pipe pollution control strategies with broader systems approaches (US EPA, 2017; National Research Council (NRC), 2004). For example, in Los Angeles, such systems efforts to achieve clean air now include managing and reducing travel demand, promoting electric vehicles and energy efficiency, along with land-use management plans (Barboza, 2016; Air Quality management District (AQMD), 2014; Clean Air Action Plan (CAAP), 2016; Metro, 2017). These experiences in the United States over the past 46 years yield several insights that can inform future air pollution mitigation efforts in developed and developing economies. Key insights are noted below:
� Controlling air pollution is challenging because multiple interacting resource sectors and infrastructure sectors shape pollution in cities, including land use (which shapes transportation networks, building intensity and green spaces); fuel types (such as biomass-based fuels, diesel and natural gas); and construction material choices (some more polluting than others).
� PM2.5 concentrations are influenced in complex ways by local conditions (meteorology and topography) and exacerbated by climate change, particularly extreme heat and drought events. Emission reductions do not result in proportional reductions in concentrations in all cities, and controls have varying effectiveness across space and time.
� While controlling pollution emissions from large industrial sources, power plants and vehicles can be accomplished more readily via end-of-pipe regulations, controlling ubiquitous smaller sources is a challenge. Approaches such as increased efficiency, fuel switching (to renewables or electric vehicles) and land-use and transit strategies to reduce motorized travel demand are being recognized as important, as they complement end-of-pipe control by addressing different aspects of the system. Future improvements will benefit from systems transformations to further address and improve air quality and human health conditions.
� Effective pollution control is dynamic, requiring continuous monitoring of air quality and a systems-based response strategy that integrates end-of-pipe control with systemic resource management strategies that address population, economy, lifestyles, wealth, industry, resource use, infrastructure and technology trends unique to each city. Such a systems approach can provide multiple SDG co-benefits.
Based on these insights, this chapter illustrates a systems approach that explores the linkage of multiple resources (land, fuels and biomass) and their interaction with multiple infrastructure and food supply sectors to provide air quality, climate (mitigation and adaptation) and other SDG co-benefits.

ASSESSING GLOBAL RESOURCE USE
74
Special feature
FIGURE 4.5 DecouplingofairpollutionemissionsintheUnitedStates,showingsteadydecreasesinemissionssince1970whentheCleanAirActwasimplemented,evenaseconomyandpopulationscontinuetogrow.Reductionsinpollutionconcentrationsinairaremorevariable
-80%70 80 90 95 96 97 98 99 00 01 02 03 04 05 08 09 10 11 12 13 14 15
246%
184%
57%
44%28%
-71%
06 07
-60%
-40%
-20%
0%
20%
40%
60%
80%
100%
120%
140%
160%
180%
200%
220%
240%
260%
Gross Domestic Product
Vehicle Miles Traveled
Population
Energy Consumption
CO2 Emissions
Aggregate Emissions(Six Common Pollutants)
Source: ALA, 2017.
4.3 The importance of infrastructure and food supply systems to SDGs
The provisioning of infrastructure and food supply pro-foundly shape human health and well-being, as they are associated with about 19 .5 million premature deaths annually worldwide, including air pollution-related health effects accounting for about 6 .5 million deaths in 2010 (Ramaswamietal.,2016;seefigure4.6).Globally,trafficaccidents related to transportation infrastructure and sedentary lifestyles contributed to about 4 .4 million deaths worldwide, while a combination of undernourishment, and poor diets contribute to 7 .6 million lives lost prematurely each year (WHO, 2013; Lim et al ., 2012; Institute for Health Metrics and Evaluation (IHME) 2016) . Poor water and sanitation infrastructures accounted for approximately 337,00 premature deaths annually (Lim et al ., 2012) . Those numbersarefor2010,whileupdatedfiguresareprovidedby IHME (2016) .
These global health risk factors are often exacerbated and/or concentrated in cities . For example, the majority of ambient air-pollution related mortality occurs in cities (WHO, 2016a) . Furthermore, inadequate infrastructure in informal settlements in many world cities results in about 1 billion people today (and 2 to 3 billion projected in 2050) not having basic access to water, energy, food, sanitation and adequate housing (affecting SDGs 6, 7, and 11) . This places them at risk for hunger and
poverty (SDGs 1 and 2) . Lack of access to convenient and affordable transportation impacts urban livelihoods, and is an integral part of SDG 11 . Exposure to water- and climate-related risk factors can also take a toll on people and the economy of cities, as seen during recent storms and flooding events in New York City, Mumbai and Bangkok . Lastly, the distribution, provision and consumption of infrastructure in cities, and exposure to infrastructure- and pollution-related risks, are unequal within (and between) cities, thereby impacting equitable and inclusive development (SDG 10) . The gender dimen-sions of these inequalities are particularly striking (UN, 2010) – including exacerbated loss of economic oppor-tunity for women without access to basic services, and proportionately higher exposure of women and children to health risks from poor sanitation and waste manage-ment, and increased exposure to indoor air pollution from cook stoves (National Institute of Health, united States (NIH), 2017; Smith, 2000) . Essential infrastructure and food supply sectors are therefore intricately connected to diverse human health impacts, including access to clean water and energy (SDGs 6 and 7) and pollu-tion-related health impacts on well-being (SDG3). They also contribute to multiple dimensions of inequality in cities (SDG 10 and 3), and this is relevant to the goal of inclusive urban development (SDG 11).

A SYSTEMS APPROACH TO RESOURCE EFFICIENCY AND POLLUTION REDUCTION
75
Special feature
1
2
3
4
5
FIGURE 4.6 Impactsofkeyurbaninfrastructuresectorsandfoodsupplyonglobalanthropogenicgreenhousegasemissions,globalwaterwithdrawalsandtheglobaldiseaseburden
Food supply (agriculture, livestock)
Building/shelter materials & public spaces
Transportation (vehicle operations)
Municipal water supply/waste & sanitation
Energy supply (residential, commercial & industrial)
Disaster & extreme events
Childhood underweight, diets low in fruits & vegetables
Air pollution/indoor & outdoor
Accidents & reduced mobility
Global anthropogenicGHG emissions
(2010)
86.6% 96.7% 19.5 million*
Global waterwithdrawal
(2010)
Global infrastructure-related mortality(2010)
0 0
4
8
12
16
20
10
20
30
40
50
60
70
80
90
100
Perc
enta
ge o
f tot
al
Num
ber o
f pre
mat
ure
deat
hs in
mill
ions
Source: Ramaswami et al., 2016.
Infrastructure and food supply sectors are also impacting global material, energy, carbon and nutrient cycles to an unprecedented degree . Figure 4 .6 shows that these sectors are responsible for almost all the world’s water extraction, material extractions, global energy use and greenhouse gas emissions . For example, when imports of electricity and other fuels are included, urban areas are estimatedtoaccountforover70 percentofglobalenergyuse and greenhouse gas emissions (Seto et al ., 2012) . In terms of direct land impacts, although urban areas pres-entlyoccupyonlyaround3 percentofland,urbanlandexpansion in most world regions is growing dramatically at rates that exceed urban population growth (Seto et al ., 2011) . Such expansion is displacing agricultural lands, which in turn displaces forested land (UNEP, 2014a) . This resultsinsignificantlossofbiodiversityworldwide(Setoet al ., 2012; D’Amour et al, 2016) .
Furthermore, the supply chains that provide cities with essential infrastructural services – water, energy, buildings,
transportation, sanitation-waste management and food supply – extend well beyond the city boundary (drawing resources, generating associated pollution and impacting biodiversity in the regions of supply) . For example, as seen in the case study of Delhi, industries that support demand for Delhi’s construction materials are large sources of regional air pollution . Likewise, water drawn to support Delhi’s municipal water and food needs is a heavy drain on the already water-stressed Northern Gangetic Plain . In fact, the indirect (transboundary) impact of urban areas on natural resources (like land and water) is often much larger than the direct use of resources within cities – often by a factor of 2 to 3 (Ramaswami et al ., 2008; Kennedy et al ., 2009; Chavez and Ramaswami, 2013) . Urban resource demand therefore essentially shapes global resource demand, and it is essential to examine the transboundary impact of cities on natural resources and environmen-tal pollution through footprint approaches if we are to address the global sustainable development goals and promote sustainable consumption-production (SDG 12).

ASSESSING GLOBAL RESOURCE USE
76
Special feature
4.4 The opportunity of urban transformations
44 A One Water approach is an integrated planning and implementation approach for water resource management considering water treatment and supply, wastewater treatment and stormwater management holistically to meet community and ecosystem needs (Water Research Foundation (WRF), 2017) .
Given that infrastructure and food supply systems, col-lectively, place tremendous pressure on the global natural resource base, pollution and human well-being (figure 4 .6), transforming these systems offers an opportunity to achievemultipleSDGco-benefits.Urbanareastodayareon the cusp of catalysing such future transformations .
Around60 percentoftheurbanarearequiredtoaccom-modate the urban population by 2050 is yet to be built and, once built, it will last for the next 40 years . This provides a historic opportunity and an imperative to build ‘better’ infrastructure from the outset (UNEP, 2013a) . At the same time, existing cities in advanced economies are repairing or replacing aging infrastructures . Several infrastructure innovations are on the horizon in developed and developing cities, including new strategies for shared mobility, in-situ slum rehabilitation, a One-Water approach44 to urban water management, urban-industrial symbiosis, electric and autonomous vehicles and distributed solar energy to achieve a decarbonized grid . Cities around the world are engaging in experimentation around infrastructure – involvingtechnology,humanbehaviours,financingandnovel governance arrangements .
The interactions among the infrastructure sectors, and between infrastructures, natural systems and social sys-tems impact almost all 17 SDGs . However, the relationship between resource use in the multiple sectors and the various well-being outcomes is complicated by nexus chal-lenges . This chapter highlights the resource-infrastruc-ture-health nexus, representing the linkages between resource use, infrastructure provisioning, environmental
pollution and human well-being impacts. Quantifying such linkages through systems-based methods is essentialforsystematicallyassessingco-benefitsandtrade offs among multiple SDGs, as well as to evaluate pathways and scenarios toward a more sustainable future. The systems approach utilizes trans-boundary, life cycle-based footprint analysis to quantify the multiple natural resources used in basic infrastructure and food supply to cities, and connects these to inequality mea-sures and pollution/health impacts that are at the heart of the SDGs . The impacts of potential future infrastructure transformation pathways are then evaluated in terms of their effects on multiple natural resources, pollution and measures for human well-being (including health and inequalities) . The case studies in this chapter apply this systemsapproachtohighlightresource-efficienturbaninfrastructure transformations that can co-beneficially address the air pollution challenge and achieve multiple SDGs in cities .
City case studies:Thefirstcasestudypresentsthelinkagebetween multiple natural resources, infrastructure, inclu-sive development, air pollution and health - focusing on these processes and associated metrics in a single city: Delhi, India, which is a fast-growing city in the developing world facing infrastructure challenges . The second case study demonstrates the collective role that all 637 cities in China can play, through urban-industrial symbiosis andresourceefficiencystrategies,inachievingnationalgreenhouse gas emission mitigation targets while also providinglocalairpollutionandhealthbenefits(alongwithsignificantnaturalresourceandmonetarysavings).

A SYSTEMS APPROACH TO RESOURCE EFFICIENCY AND POLLUTION REDUCTION
77
Special feature
1
2
3
4
5
4.5 CaseStudy:AirpollutionandSDGco-benefitsofdevelopingresource-efficientandinclusivecities(Delhi,India)
Purpose of the case studyDelhi is typical of many megacities in Asia and Africa with large populations, rapid economic growth that spursin-migrationandsignificantunderservedpopula-tions lacking access to basic services . The combination of rapid development and inadequate infrastructure to keep up with such growth places pressures on the built environment and the natural environment in terms of air pollution, water quality degradation, ground water deple-tion and human well-being (thereby impacting almost all the SDGs) . In response, new urban design strategies, infrastructure transformations and policy innovations focused on social inclusivity and the environment that have potential to advance multiple SDGs are emerging in many Indian cities .
The DISPR framework can be used to evaluate the impact ofinclusiveandresource-efficientdevelopmentincitiessuch as Delhi, including on air pollution and Delhi multiple SDGs(figure1.4).
FIGURE4.7 ThedevelopingcityofDelhi-driversoffutureresourceuseandrelatedSDGs
10% in poverty
25% & 43% lack access to tap water and sewerage
4%, 1% & 10% lack access to permanent housing, electricity and clean cooking fuels
6% of surveyed homes report diarrheal disease (Desai and Vanneman 2015), 2500 premature deaths are estimated from dirty cooking fuels (Ramaswami et al 2017)
1. DRIVERSCensus data showed Delhi’s population (in 2011) to be 17 millionpeople-growingat2.4 percentannuallyinthepast decade, and a largely service-dominated economy growingat~12 percentperyear.Similartomanyworldcities, infrastructure development does not occur fast enough to cope with the pace of growth, resulting in signif-icant inequality in access to basic infrastructure . In Delhi, 4 percentofthepopulationdoesnothavepermanenthousing,while25 percentlackaccesstotreatedtapwater,43 percenthavenoaccesstosewerageand10 percentlackaccesstocleancookingfuels.Thesefiguresarehighlyrelevant to several SDGs (1, 3, 6, 7, and 10) .
Toprovideperspective,30 percentoftheurbanpopulationin Asian cities live in slums, while this number is estimated at60 percentinAfricancities(UN-Habitat,2016).Therefore,the situation in Delhi is commonplace for a developing city where infrastructure is inadequate, creating a demand for more and better infrastructure and with it, increasing demand for resources) .
2. PRESSURES, STATE AND IMPACTS The above drivers place large pressures on the natural resource base, the environment and on human life experience .
FootprintsThe natural resource use and the environmental pollution impacts of infrastructure and food provisioning to Delhi are quantifiedbytrans-boundaryfootprintsthatrepresentbothdirect resource-use (fuel and water), greenhouse gas emis-sions and air pollution emissions within the city boundary, as well as transboundary impacts from supply chains serv-ing cities . For example, the energy use and greenhouse gas emission footprints of community-wide infrastructure and food provisioning to homes, businesses and industry results in 51,000 Gg of CO2e, of which only half is emitted within the city boundary . Given the global reach of greenhouse gas emissions and the transboundary nature of supply chains, the in-boundary plus transboundary footprint approach better captures the larger impact of cities on the planet (beyond their local impact). The overall greenhouse gas emissions footprint of community-wide infrastructure and food provisioning in Delhi is dominated by transportation (38 percent),electricitysupply(30 percent),foodsupply(16 percent)andcookingandotherfuels(diesel,kerosene,dieselusedinpowergeneration~9 percent),followedbyemissions from producing infrastructure construction materials(cement,bricksandsteel)of5 percent.

ASSESSING GLOBAL RESOURCE USE
78
Special feature
FIGURE 4.8 Resourceuse(waterandfossilfuels)footprintsandairpollutionandgreenhousegasemissionfootprintsofinfrastructureprovisionandfoodsupplyinDelhi,India
0% 10%
Fuel
Direct Transboundary = Fuel footprint
Direct Transboundary = Air pollution footprint
Direct Transboundary = GHG emission footprint
Direct Transboundary = Water footprint
Water Withdrawal
PM2.5
GHG
(734
GJ)
(76
Gg)
(516
30 G
g)(M
3)
20% 30% 40% 50% 60% 70% 80% 90% 100%
Electricity use Focil fuel use (non-transport)Food
Biomass Fuel (non-trasport)Building materials/constructionTransportation-Road & Air
Water-wastewater & Municipal Solid Waste
Data from Ramaswami et al., 2017a; Nagpure et al., 2017a.
BOX 4.3 Assessinginfrastructurelinkageswithairpollution—greenhousegasemissionsandhealthco-benefits
Focusing on direct PM2.5 emissions sectors within the city boundary, transportation, indus-trial powerplant energy use, construction dust, residential energy use (dirty cooking fuels) and garbage burning are main contributors to PM2.5 emissions (Amman et al., 2017). In recent years, garbage burning in cities has been identified as a major source of PM2.5 emissions globally (Wiedinmyer et al., 2014); studies in Indian cities show 5 per cent and up to 25 per cent of garbage being burned in different Indian cities (Nagpure et al., 2015).
Transboundary PM2.5 emissions: In addition to the in-boundary sources, many of the supply chains that serve Delhi are in close proximity to the city. Examples include brick kilns and agricul-tural burning in near proximity to Delhi, which are both found to contribute to pollution in Delhi. Consequently, brick manufacturing (construction materials) and agricultural crop-residue burning outside the city have also now become the focus of transboundary air quality management efforts in the region (Guttikunda and Calori, 2013; Bhattacharya, 2016; Amman et al., 2017). These same sectors contribute to significant energy use and GHG pollution emissions as seen in the GHG emissions footprint, thus enabling assessment of co-beneficial reduction in emission of both pollutants from specific infrastructure changes.
Connecting PM2.5 emissions with airborne pollutant concentrations and human health risk assessment: The air pollution emission footprint can then be mapped out by specific area and linked with environmental transport and fate/exposure models to reveal health impacts at various locations in cities, computed using methods consistent with the WHO’S global burden of disease study. This provides a systematic approach to assess the linkages between infrastructure changes and their carbon-PM2.5 pollution and health co-benefits, recently demonstrated in Chinese cities (Ramaswami et al., 2017b). Such a modelling approach advances the emerging co-benefits methods that are typically implemented at larger national or regional scales to uniquely capture the co-benefits and cross-sector interactions at the city scale. Such methods provide location-specific information needed by cities about the trade offs, co-benefits and SDG linkages that may arise from different infrastructure designs and policies.
Waste burning
Source: Ajay Nagpure (personal photo)

A SYSTEMS APPROACH TO RESOURCE EFFICIENCY AND POLLUTION REDUCTION
79
Special feature
1
2
3
4
5
Using multiple footprints of infrastructure provision to assess SDG linkagesFigure 4 .8 illustrates the footprints for natural resourc-es-use (water and fossil fuels) and for air pollution and greenhouse gas emission, which are closely related to infrastructure provision and food supply in Delhi, India, distinguishing in-boundary from transboundary contri-butions) . Nexus issues, such as the greenhouse gas-air pollution nexus, food-water-energy nexus and multiple SDG linkages, can be quantitatively addressed through these footprints . For example, policies that reduce vehicle miles driven will reduce greenhouse gas emissions and PM2 .5 emissions as a result of lower fuel use, as well as reducing PM2 .5 from road dust . All three are calculated from the linked greenhouse gas emissions and PM2 .5 footprints shown (showing that they are connected through their association with all the seven infrastructure and food supply sectors) . The application of footprints to address the greenhouse gas-air pollution-health nexus is highlighted in box 4 .3 . Figure 4 .7 and box 4 .3 assess
potential SDG linkages to be considered by implementing policy responses to achieve SDGs .
3. RESPONSESSustainable Development Goals 11 (Developing Sustainable Cities) highlights the importance of inclusive andresource-efficientcities.CitiesinIndiaandworldwidehave responded to their sustainability and air pollution challenges by experimenting and innovating with diverse policies . This report applies a coherent bundle of strategies drawn from case studies and policies already emerging in Indian cities, building upon the base set of resource efficiency strategies highlighted in UNEP, 2017b . The policybundle(seetable4.1)identifiesasetofstrategiestoachieveinclusiveandresourceefficienturbanizationthatcanbringbenefitsintermsofgreenhousegasandair pollution mitigation in exchange for modest additional resource requirements . Table 4 .1 highlights the basic nat-ural resource focus of these strategies, and their linkages to different infrastructure sectors .
TABLE4.1 Policystrategiestowardinclusiveandresource-efficientcities
RESOURCE FOCUS STRATEGY
LAND USE INTENSIFICATION
Strategic urban land use and infrastructure planning to reduce travel demand. Focuses on the 5Ds of: density, diversity (mixed land uses), distance to transit, multimodal street design and destination access (to jobs)
Investments in efficient transit systems to reduce vehicular emissions and congestion
RESOURCES FOR THE UNDER-SERVED
Inclusive development and in situ slum rehabilitation in multi-storey buildings within denser city cores that provide essential services and access to livelihoods with reduced travel burden on the poor
RESOURCE EFFICIENCY FOR ALL
Promoting multi-storey resource-efficient building construction and energy-efficient buildings for all
Using culturally sensitive behavioural nudges to reduce resource use
RESOURCE SUBSTITUTION
Phasing out dirty cooking fuels and construction materials with high embodied fuel and PM2.5 emissions
RENEWABLE ENERGY
Electricity grid transformations with higher levels of renewable energy
WASTE MANAGEMENT
Creating business innovations to reduce agricultural burning outside cities and waste burning within cities, both of which significantly contribute to PM2.5 emissions that cause air pollution and to GHG emissions.
AssessingSDGlinkagesandco-benefitsA systems approach is applied to assess the multiple SDG co-benefitsarisingfromeachofthestrategies,usingthefollowing mechanisms .
A compact urban form can reduce motorized travel dis-tancesbyasmuchas40 percent,assuggestedfromcase studies comparing a compact city (Ahmedabad) with other similarly wealthy but more sprawling Indian
cities (Hyderabad & Bangalore) (Munshi, 2012) . Provision of transit (such as the metro rail in Delhi) can further create amodeshift,displacingabout10 percentofDelhi’sprivatemotorizedtripsinthefirstyearofoperation.About30 percent personal motorized trips are expected to be displaced at the build-out stage .
Against the backdrop of a compact urban form, in situ slum rehabilitation in multi-storey buildings (>5 storeys)

ASSESSING GLOBAL RESOURCE USE
80
Special feature
provides good housing and basic services (water, sewerage and electricity) for underserved populations within the city core, thereby enhancing well-being and providing access to livelihoods without an added burden of transportation (UNEP,2017b).Indeed,almost40 percentoftripstoworkinIndian cities are by walking or cycling (DowntoEarth, 2011), which could be preserved with a successful integration of economically weaker sections in the city core .
There is considerable inequality in infrastructure provi-sioning in cities . Because the underserved consume so little compared to the wealthiest high-consuming groups, industry and businesses, providing basic services for the underservedresultsinverysmall(<10 percent)increasesin citywide resource flows in Delhi (Nagpure et al, 2017b) .
The added resource needs of providing basic services to the underserved can readily be countered by modest behavioural nudges and energy-efficiency strategies aimed at high consumers, such as those already being evaluated in Delhi’s Solar City Plan (Ministry of New and Renewable Energy, India (MNRE), 2016) .
Materialandresourceefficientdesignsformulti-storeybuildingsinIndia’shotterclimatehavebeenfieldtestedand show that basic energy services can be provided with a comfortable living environment, consuming less than 25 kWh/person/month . Locally produced, low-polluting construction materials that use waste materials and gen-eratelowerPM2.5emissionshavealsobeenfieldtested(World Bank, 2011) .
Resource switching, particularly from current use of dirty cooking fuels to clean burning gas is estimated to reduce 2,500 premature deaths annually (Nagpure and Ramaswami, 2017c) . A majority of these avoided deaths are likely to be women and children, who are dispropor-tionately exposed to indoor air pollution from cooking fuels (Smith, 2000) .
When applied together, these strategies are estimated to improve well-being for about 7 million underserved homes in Delhi, with only a modest increase (<10 per cent) in Delhi’s current communitywide material-energy demand, along with a 22 to 25 per cent reduction in communitywide GHG and PM2.5 emissions (Nagpure et al ., 2017b; Ramaswami et al ., 2017a) . The reduced PM2 .5 emissionsresultinsignificanthealthbenefits,estimatedtoprevent 2,500 premature deaths annually . This case study indicatesasignificantimprovementinhumanwell-being,with a relatively small investment in resources (thereby exemplifying the concept of decoupling).
Delhi’s Metro Rail
Source: PTI 2015
Slum-rehabilitation in Delhi
Source: Haidar, 2017
Delhi's solar plan to provide energy access
Source: PTI 2016
Compressed stabilized earth blocks
Source: World Bank 2011

A SYSTEMS APPROACH TO RESOURCE EFFICIENCY AND POLLUTION REDUCTION
81
Special feature
1
2
3
4
5
Policy learnings for inclusive infrastructure in citiesIndia has recently initiated several successful pilots proj-ects to upgrade basic services in cities, particularly in situ slum rehabilitation programmes in many cities, such as Ahmedabad, where slum dwellers are rehabilitated in new multi-storey constructions within the city core, thereby reducing the travel burden for improved access to jobs/live-lihoods within the city (UNEP, 2017; Society for Excellence in Habitat Development, Environment Protection and Employment Generation (India) (SHEE), n .d .) .
BOX 4.4 Towardsinsituslumrehabilitationandresource-efficientconstructionwithlow-pollutingmaterials
Key enabling factors:
� Partnerships between government, builders and slum dwellers
� Incentives for builders to finance slum upgrades, along with active participation of slum dwellers. Rehabilitation plans require consent of >70 per cent of slum dwellers
� Multi-storey construction enables rehabilitation in the city core and reduces material use by 36 per cent (UNEP, 2017b)
� Construction with alternative building materials and technologies such as ‘green bricks’ reduces air pollution emissions from manu-facturing bricks (World Bank, 2011)
� Fly ash and steel slag cements reuse industrial waste, thereby saving energy and virgin materials
� Consider manufactured sand, lightweight concrete and other materials to combat sand scarcity.
Source: UNEP, 2017b; SHEE n.d.
Policy learning on air pollutionDelhi and other cities in Asia have explored numerous strat-egies to reduce air pollution, as shown in the inset for the transportation sector . The main lesson is that, while fuel switching and end-of-pipe control solutions are important and have temporarily reduced air pollution in the past, these strategies alone cannot address the overwhelming pace of urbanization . Eventually, a transformation of urban form for reduced travel demand, transit investment, co-location/mixed use development and efforts to retain the walkability and bike-ability of cities will be essential if we are to combat air pollution . Better waste management, provision of clean cooking fuels and industrial emission controls will also prove vital . Such strategic land use and transit polices have the potential to reduce energy use, GHG emissions and PM2 .5emissions (UNEP, 2017b), as illustrated in Delhi and other Indian cities .
A second important lesson is that policies in individual citiesareinsufficienttoaddressthechallengeofairpol-lution – given the wind-blown transport of pollution into
and out of cities, as well as the transboundary pollution stimulated by urban demand for infrastructure and other goodsandservices(seefigure4.3).Arecenthigh-levelcommission on air pollution in India (Sharma et al ., 2016) stressed the role of cross-sector and multi-level gover-nance to address this challenge, including actions that address agricultural crop burning and brick kilns .
BOX 4.5 StrategiestoreduceairpollutioninDelhi
� Fuel switching: In 1985, Delhi issued a Supreme Court order for all diesel buses and commercial vehicles to switch to cleaner-burning natural gas fuels.
� In 2017, all vehicles are required to adhere to EU’s Euro 4 emis-sions standards; diesel-burning trucks are not allowed in the city boundary in the day.
� India’s Green Tribunal banned waste burning in 2015, recognizing that it contributes to air pollution.
� During extreme air pollution episodes, odd-even day license plate policies were introduced in 2016 to reduce travel congestion.
� Increasingly, urban land use and transit planning is recognized as the main solution to address the root cause of air pollution: excessive automobile dependence. The key strategies include: (a) higher density development around transit nodes, diversity of travel modes, street designs for mixed use and walkability and (b) a more compact urban form promotes transit, while well-designed transit promotes more compact development (thereby initiating a virtuous cycle).
� Such strategies can reduce not only transportation demand, but also a building’s energy use by a factor of 2 to 4 (UNEP, 2017b), thereby contributing to resource efficiency, air pollution reductions and GHG mitigation.
� In 2010, Delhi invested in developing the Metro rail and experi-mented with Bus Rapid Transit Systems to reduce energy use and air pollution. It is expected to offer longer term land-use intensifica-tion benefits in addition to trip reductions in the short term.
� Delhi’s experience offers insights to other cities – that a compre-hensive resource-focused approach to address land, biomass and fuel in multiple infrastructure sectors is essential for tackling the air pollution challenge.
Metrics to track progressAs cities embark on infrastructure transitions to achieve multiple SDGs, tracking progress through the metrics illustrated in the DPSIR framework becomes important to ensure that progress is being made . Figure 4 .9 provides a set of metrics that cities can track to indicate their rela-tionship with each of the SDGs . The examples of metrics shown here for Delhi can be replicated for various world cities, on the basis of individualized information to assess SDGco-benefitsandtradeoffsusinglocation-specificinfor-mation.Metricssuchasthoseshowninfigure4.9willbeanimportant part of multi-level and cross-sector policymaking .

ASSESSING GLOBAL RESOURCE USE
82
Special feature
FIGURE4.9 Drivers,pressures,impact,stateandresponseframeworkrelatedtotheSDGsforDelhi
Delhi, India (Year 2011) (Land area = 1484 km2)
Population:16.7MPopulationGrowthRate:~2%/yrMigration:7.65million1-10yrresidenceInpoverty:10%
PRES
SUR
E
AirPollutionFootprint
4.4KgPM2.5/capita
0.001KgPM2.5/GDP
GHGFootprint
4.2TonnesCO2e/capita
1.3KgCO2e/GDP
WaterFootprint
1086m3/capita
.34m3/GDP
RelatedSDGsR
esou
rce
Req
uire
men
ts &
Po
llutio
n Em
issi
on F
ootp
rints
TypeofEconomyA:
DRIV
ERS
Crea
ting
Dem
and
for
Urb
an In
fras
truc
ture
,Pr
oduc
tion
& Co
nsum
ptio
nWealth(GDP):53.4BUSDGDPGrowthRate:~16.7%/yr
Good Housing Electricity Clean CookingFuels
TreatedTapWater Sanitation Sewerage
4% 1% 10% 25% 19% 43%
Metrics for Infrastructure Provision to Households. Households without access to
• 0.7%primary• 10.8%secondary• 88.5%tertiary
Direct Infrastructure Use Intensity by Households, Business and IndustryBuiltArea End UseEnergy:Buildings TravelDemand
• 39 m2/HHD
• 4.8m2/worker• 1200kWh/HHD/yr• Economy:5.7MWhE/GDP
• 12 VKTC/capita/day• Motor VehicleOwnership:25%
Related Sustainable Development Goals
IMPA
CT &
STA
TE
Affe
ctin
g na
tura
l en
viro
nmen
ts a
nd w
ell-b
eing
FrequencyofExtremeClimateEvents(examplemetric)
AirPollutionConcentration
Prematuredeaths(per1000):
148𝝻𝝻gPM2.5/m3
0.98-2.44
GroundwaterOverdraft(withdrawal/recharge,drawdown)
Direct:137%,~3-4cm/yrIndirect:130.5%,~3-4cm/yr
1.6%ofdaysin2011withextremeheateventsF over43℃
RESPONSE
SustainableProductionandConsumptionInfrastructureTransformation
Polic
ies,
Inno
vatio
n&
Sy
stem
ic T
rans
form
atio
ns
A Primary is primary extraction, Secondary is industrial manufacturing, and Tertiary is commercial servicesB TBD: To be determined upon data availabilityC VKT: Vehicle Kilometers TraveledD HH: HouseholdsE MWH: Megawatt hoursF Extreme heat events over 43 C° are based on temperature thresholds for Ahmedabad due to limited data availability for Delhi.
Footprints of Infrastructure and Food Supply
Example metrics: • Carbon emissions for electricity
consumption:• Cooking Fuel: 90% clean• Walk/Bike/Bus/Rail to work: 75%• Fleet fuel economy: 29.4 VKT/L
Adoption of Sustainable Production and Consumption Activities, Programs and Policies
Sources:City Population. 2016. India: Delhi. Available: https://www.citypopulation.de/India-Delhi.html?cityid=2925Govt of NCT of Delhi. 2016. Delhi Statistical Handbook. Available: http://www.delhi.gov.in/wps/wcm/connect/doit_des/DES/Our+Services/Statistical+Hand+Book/ESOPB. 2016. Economical Statistical Organization Punjab. Central Statistical Organisation, New Delhi. Available: http://www.esopb.gov.inChavez et al 2012. Implementing Trans-Boundary Infrastructure-Based Greenhouse Gas Accounting for Delhi, India. Journal of Industrial Ecology, 16(6): 814-828. Ramaswami, A., Boyer, D., et al 2017. An urban systems framework to assess the trans-boundary food-energy-water nexus: implementation in Delhi, India. Environmental Research Letters, 12 (2). Delhi Air Quality Info. N.D. Ambient Monitoring Data in Delhi. Available: http://www.delhiairquality.info/monitoring-data/NRDC. 2017. Expanding Heat Resilience Across India. Available: https://www.nrdc.org/sites/default/files/india-heat-resilient-cities-ib.pdf.WU. (2017). Weather History for VIDP – January 2011 – December 2011. https://www.wunderground.com/history/airport/VIDP/2011/1/1/CustomHistory.html?dayend=1&monthend=12&yearend=2011&req_city=&req_state=&req_statename=&reqdb.zip=&reqdb.magic=&reqdb.wmo=.
Note that the examples are not exhaustive, and other drivers, pressures, states, impacts, and responses could be included in future assessments

A SYSTEMS APPROACH TO RESOURCE EFFICIENCY AND POLLUTION REDUCTION
83
Special feature
1
2
3
4
5
4.6 CaseStudy:Greenhousegas,airpollutionandhealthco-benefitsofcircular economy and urban-industrial symbiosis in Chinese cities
Purpose of case studyThis case study applies a resource-based systems approach to demonstrate the potential economic savings, energy savings, resource-savings, GHG and PM emission reductions and air quality improvements and associated healthco-benefitsthatmaybeachievedbyimplement-ing circular economy strategies in all 637 cities in China (Ramaswami et al ., 2017c) . The goal is to quantify the potentialco-benefitsofimplementingresource-efficienturban planning (including urban-industrial symbiosis strat-egies) in all 637 Chinese cities, with a view to achieving national GHG mitigation targets while providing local air pollutionandhealthbenefits.Adatabasewithbaselineenergy use and air pollution emissions data for of all 637 cities in China consistent with national energy use is devel-oped to achieve local-national scale energy supply-demand linkages (Ramaswami et al ., 2017c) .
Theurban-industrialsymbiosisstrategiesinclude:1) thereutilization of industrial waste heat in urban district energysystems,and2)beneficialreuseofwastemateri-als, such as steel slag and fly ash in lieu of cement in the construction sector (which is a heavy user of materials in urban areas) . Indeed, the material footprint of Asian cities (Singapore, Tianjin, Xiamen and Shanghai) shows the con-structionsectorcontributesmorethan40 percentofallmaterialusageonalifecyclebasisduetofinalconsump-tion in cities (Hu and Ramaswami, 2017) . Thus, reducing demand for construction materials can reduce the material footprint and reduce pollution associated with producing these materials .
FIGURE4.10 MaterialfootprintoffinalconsumptionforShanghai,Singapore,XiamenandTianjin,illustratingthedominantroleoftheconstructionsector)inmaterialuse(outofthe7keyinfrastructureandfoodprovisioningsectors)
MF of Final Consumption
Singapore Xiamen
Shanghai
Biomass (food) Biomass (non-food) Non-metallic Minerals Metals Fossil fuel
met
ric to
ns (i
n m
illio
ns)
met
ric to
ns (i
n m
illio
ns)
Cons
truct
ion
Ener
gy s
uppl
y
Food
sup
ply
Tran
spor
t
Wat
er s
uppl
y
Sani
tatio
n
Rest
of s
ecto
rs
Tran
spor
t
Wat
er s
uppl
y
met
ric to
ns (i
n m
illio
ns)
met
ric to
ns (i
n m
illio
ns)
Tianjin
050
100
150
200
250
300
350
400
0
0
510
15
2025
30
3540
100
200
300
400
500
600
700
0
50
100
150
200
250
300
Cons
truct
ion
Wat
er s
uppl
y
Sani
tatio
n
Rest
of s
ecto
rs
Food
sup
ply
Sani
tatio
n
Rest
of s
ecto
rs
Cons
truct
ion
Ener
gy s
uppl
y
Food
sup
ply
Sani
tatio
n
Rest
of s
ecto
rs
Tran
spor
t
Wat
er s
uppl
y
Ener
gy s
uppl
y
Cons
truct
ion
Tran
spor
t
Food
sup
ply
Ener
gy s
uppl
y
Source: Hu and Ramaswami, 2017 (in prep.).

ASSESSING GLOBAL RESOURCE USE
84
Special feature
Chinese cities are the focus of this case study because China is now the world’s largest user of fossil fuels globally,andabout80 percentoffossilfueluseinChinaoccurs in the industry sector, creating a source of unused waste heat that can displace fossil fuel use in individual stovesandboilersinhomes/businesses(whicharediffi-cult to regulate and are large contributors of PM pollution) (Liu et al ., 2016) . Furthermore, low-grade waste heat is not readily reused in industries, but can be cost effectively used to heat/cool buildings using new technologies (known as 4th generation district energy systems) (Lund et al ., 2014) . Thus, district energy systems – which are cost-effective in higher density areas in cities - provide an ideal sink for using ubiquitous waste heat generated in industries, while offering a cost-positive strategy to achieve monetary savings and environmental/health co-benefits . Indeed, the United Nations has identified districtenergyasonekeystrategytosignificantlyandcost effectively reduce energy use in cities; district energy systems that reuse industrial waste heat are almost zero-energy systems . Lastly, material substitutions – particularly in the infrastructure construction sector – are alsosignificantopportunitiestoreducemineralandmetalresource use because cities have high levels of construc-tion activity and large material footprints . The case study therefore illustrates how multiple strategies (such as denser high-rise building construction requiring fewer land resources) supported by district energy systems capable of reusing waste heat and construction sectors that reuse materials can combine to provide multiple economic, natural resource, environmental, and human healthco-benefits.
RelevanceThe cross-sectoral urban-industrial symbiosis and circu-lar economy strategies explored in this case study are relevant to Chinese cities, and to future urbanization in Asia and Africa where industrialization and urbanization are expected to co-occur . As new cities are developed and planned, infrastructure design for high-rise buildings with shared heating-cooling systems that utilize waste heat, and circular economy polices that promote beneficial exchange and reuse of materials, can be powerful tools that provide multiple co-benefits . Given that multiple sectors contribute to air pollution and that pollution prevention is better than control, such circular economy strategiesthatreduceresourceuseinthefirstplacecanbe an important part of arsenal in the mix of strategies needed to improve air quality in global cities .
Study detailsThe study was conducted as a collaboration among United States and Chinese scholars (details are in
Ramaswami et al ., 2017c) . The study modelled energy use in different sectors (residential, commercial, and industrial) in more than 630 Chinese cities in the 2010 baseline year, using a mix of bottom-up and top-down data consistent with China’s national and provincial energy use information, and drawing upon an air pollution emission database provided by Tsinghua University . A ‘What-If’ scenario model compared the impact of single sectorefficiencies(suchasimprovementsinbuildings,industriesandpowerplants)asnotedinChina’sfive-yearplan, with the novel cross-sectoral urban-industrial sym-biosisstrategiesdescribedabove.Co-benefitsassessedincluded: energy savings, materials savings, reduction in GHG and PM emissions, reduction in PM concentrations in air and the resulting health co-benefits in the 637 cities . Several circular economy strategies were evalu-ated involving the utilization of industrial waste heat of different grades (high-grade, medium-grade, and low-grade) in various reuse applications including electricity generation (of high-grade heat), reusing medium-grade heat in conventional district energy systems using steam and hot water and using low-grade heat in advanced 4th generation district energy systems that circulate lower temperature water . Key strategic material exchanges were modelled, such as the reutilization of fly ash and steel slag to displace cement (beyond current reuse levels) . Air pollution models evaluated PM2 .5 pollution concentrations in air considering the meteorological conditions . Health risk assessments were conducted using methods consistent with those used in the global burden of disease study (Burnett et al ., 2014) .
Key results and insights � GHG mitigation potential: Models indicate that the
cross-sectoral urban industrial symbiosis strategies - enabled by compact urban design and circular economy policies-contributedbetween15 percentand36 percent to additional national CO2 mitigation (compared with conventional single-sector strategies), thereby pointing to a new pathway toward de-carbonization in China and globally .
� Airpollutionandhealthco-benefits:Co-beneficiallyacross all cities, about 47,000 premature deaths (range 25,500-57,500) are estimated to be avoided annually through air pollution reductions from these strategies .
� Individuality of each city: GHG and health risk-reduc-tionsvaryfrom(<1 percent-37 percent)and(<1 percent-47 per cent), respectively, across individualcities . This shows the importance of detailed sys-tems modeling incorporating the specific economic structure, industrial structure, household/buildings

A SYSTEMS APPROACH TO RESOURCE EFFICIENCY AND POLLUTION REDUCTION
85
Special feature
1
2
3
4
5
characteristics, air pollution dispersion and population structure in individual cities .
� Economic payback: The circular economy strategies are cost effective, with payback periods estimated between 1 and 4 years for district heating systems that reuse waste heat in China . (Tong et al ., 2017) .
A whole systems approach that connects resources with infrastructure, new technologies and circular economy policies, can clearly play a significant role in providing
cost-effective solutions to the air pollution challenge . In particular, this case study demonstrates modelling of the collective impact of applying circular economy strategies in cities on national sustainability GHG targets, while also demonstratinglocalhealthco-benefitscustomizedtoeachcity’s situation . The distribution of carbon mitigation and healthriskbenefitsacrossthemodelledcitiesisshowninfigure4.12.Itpresentsmethodologicaladvancesinhealthco-benefitsassessment,aswellasamulti-scaletrans-boundary modelling approach with city data in accordance with national energy use statistics .
FIGURE 4.11 Environment,humanwell-beingandeconomicco-benefitsestimatedacrossall637Chinesecitiesinaresourceefficiencyandsymbiosisscenariocomparedtotheyear2010baseline
GHG EMISSIONS55M
ton-coal equivalent
PM2.5 AVOIDEDPremature
Mortality47,000
deaths/year
MONEY SAVED~$8B/year
FUEL AVOIDED 8-15%
~55.6Mton-coal
equivalent
AVOIDED MATERIALUse 5-15%
~55Mtons cement
Source: Ramaswami et al., 2017c.

ASSESSING GLOBAL RESOURCE USE
86
Special feature
FIGURE 4.12 PotentialreutilizationofindustrialwasteheatinurbandistrictenergysystemsandreuseofwastematerialsinmainlandChinaresultsinco-benefitreductionsinair-pollutionrelatedprematuremortalityandGHGemissions(dataandfigurefrommodelsinRamaswamietal.,2017c)
Source: Ramaswami et al., 2017c.
a. Direct CO2 reduction (million metric tonne) across 637 cities in mainland China grouped in What-If FYP-Efficiency-plus-Symbiosis scenario vs Base-Case (urban total=741 million metric tonnes)
b. Premature death avoided (person) across 637 cities in mainland China grouped in What-If FYP-Efficiency-plus-Symbiosis scenario vs Base-Case (urban total=47,230 persons)

A SYSTEMS APPROACH TO RESOURCE EFFICIENCY AND POLLUTION REDUCTION
87
Special feature
1
2
3
4
5
Policy enablersCircular economy policies in China have enacted urban planning guidelines to promote energy and material use efficiency in cities by encouraging increased reuse of materials and energy in pilot cities (State Council of the People’s Republic of China (PRC), 2013) . Using industrial waste heat in the residential sector has also been high-lightedbytheChineseGovernmentinits13thfive-yearplan period (2016-2020) to further reduce energy use in cities and improve air quality (People’s Republic of China (PRC), 2013; IEA, 2016) . Moreover, national policies have set industrial waste heat utilization targets in district heating systems, including replacing 50 million tons of raw coal through utilization of low-grade waste heat for sup-porting a 2 billion m2 heating area ( National Development
and Reform Commission, China (NDRC) and Ministry of Housing and Urban-Rural Development, China (MOHURD), 2015) . Financing strategies also support the implemen-tation of district energy systems in China . Currently, the capital cost of district energy systems as public infra-structure in China is mainly funded through governmental fiscalrevenue,investmentfromstate-ownedcompaniesand bonds (Wang et al ., 2011) . The State Government also encourages public-private partnership in the district energysector,whichcanrelievethefiscalburdenonlocalgovernment . These policies have resulted in district heat-ing systems, including advanced 4th generation district energy systems, becoming relatively prevalent in China and in many European cities (particularly in denser high-rise urban centres) (Werner, 2017) .
© S
hutt
erst
ock

© Icaro Cooke Vieira CIFOR / Flickr
88
ASSESSING GLOBAL RESOURCE USE
5. Conclusions and opportunities

A SYSTEMS APPROACH TO RESOURCE EFFICIENCY AND POLLUTION REDUCTION
89
Conclusions and opportunities
1
2
3
4
5
This report has shown that sustaining and managing resource use is a cornerstone of sustainable development, particularly in order to achieve both environmental and socio-economic SDGs . A systems approach considering material flows from raw material extraction through to production,consumption,recyclingandfinaldisposalisneeded to (a) understand the physical basis of societies and (b) to design effective measures across all sectors and levelsoftheeconomytopromoteresourceefficiencyandreduce pollution .
This report has shown that ‘business as usual’ will further increase global use of natural resources and environmen-tal impacts associated with extraction, production, con-sumption and disposal . All countries and world regions will face increased consequences, although the environmental burdensandeconomicbenefitswillcontinuetobedispro-portionally distributed . Currently, rich countries consume ten times more per person than low-income countries . These differences are measured by indicators such as the material footprint .
The material footprint measures the physical amount of natural resources extracted for further use . It determines the magnitude of material throughput of the economy (in different countries) and the resulting emissions (including pollutants)andfinalwastedisposalassociatedwithfinalconsumption of products and services .
Conventional pollution control by add-on technologies is bound to shift environmental problems and increase resource consumption . Effective measures are needed to keep natural resource use and associated impacts within safelimits.Thiscanonlybeachievedthroughsignificantincreases in resource efficiency within production and consumption systems, including a shift towards reuse andrecycling.Transformationstowardresource-efficienturbaninfrastructuresalsohavetheco-benefitofincreasingprogress toward multiple SDGs, especially those related to human health and well-being .
This report has pinpointed key strategies and instruments formakingresourceusemoreefficientandinclusiveforall.It has shown that some countries and cities have already undertakenfirststeps,forexampledevelopingnationalprogrammesfortheefficientandsustainableuseofnatu-ral resources . These seem to be particularly effective when they include the following elements:
� Monitoring resource use, in particular by footprint indi-cators (such as material footprint, to be complemented with land, water and GHG emission footprints)
� Providing orientation by target setting (such as increas-ing resource productivity and reaching more sustain-able levels of resource consumption)
� Communicating with stakeholders on how to improve performance (including through networks, information campaigns and leading by example through procure-ment practices)
� Enabling actors across sectors and levels to develop resourceefficientsolutions(suchasthroughskillstrain-ing, improved education programmes and consulting servicesbyresourceefficiencyagencies)
� Incentivizing actions for change (such as through price signals like a tax shift from labour to materials, through regulatory frameworks, including extended producer responsibility and by raising awareness) .
Altogether, transformational policies are needed to enhanceresourceefficiencyandsustainableresourceusethroughout the economy . An improved information base on resource use – which is reported regularly – would sup-port policy design and evaluation . Scenario analysis should be further pursued to look at the big levers of change for transforming production and consumption systems . Initial progress to establish instruments fostering a more sustainable use of natural resources in production and consumption systems, including infrastructure manage-ment, has been made . Nevertheless, the opportunities for the future are still enormous .

ASSESSING GLOBAL RESOURCE USE
90
ReferencesAkenji,L.(2012).GlobalOutlookonSCPPolicies:Asia-Pacific(Chapter5),InGlobalOutlookonSustainableConsumptionand
Production Policies: Taking Action Together . UNEP .
Ali, S .H ., Giurco, D ., Arndt, N ., Nickless, E ., Brown, G . et al . (2017) . Mineral supply for sustainable development requires resource governance (2017) . Nature 542: 367-372 .
Allen C .R ., Fontaine J .J ., Pope K .L ., Garmestani A .S . (2011) . Adaptive management for a turbulent future . Journal of Environmental Management, 92: 1339-1345 . DOI: 10 .1016/j .jenvman .2010 .11 .019 .
Allwood, J . M . and J . Cullen, M . (2012) . Sustainable materials - with both eyes open . Cambridge: Cambridge University Press .
American Lung Association (ALA) . (2017) . State of the Air 2016 . Available: http://www .lung .org/assets/documents/healthy-air/state-of-the-air/sota-2016-full .pdf .
Amman, M ., Purohit, P ., Bhanarkar, A ., Bertok I ., et al . (2017) . Managing future air quality in megacities: A case study for Delhi . Atmospheric Environment 161: 99-111 .
Angelakis, A ., and Snyder, S . (2015) . Wastewater treatment and reuse: past, present and future . Water, 7: 4887-4895 .
Anyadike-Danes, M, Bonner, K and Hart, M (2011) Job Creation and Destruction in the UK: 1998-2010, BIS Report, October 2011 .
The Australasian Procurement and Construction Council Inc (APCC) (2007) . Australian and New Zealand Government Framework for Sustainable Procurement . Australian Procurement and Construction Council .
Air Quality Management District (AQMD) (2014) . Clean Air Choices – Incentives for Clean Air Vehicles in the South Coast Basin . South Coast Air Quality Management District . Available At: www .aqmd .gov/home/prorams/community/clean-air-choices-incentives .
Arnold,R.D.,WadeJ.P.(2015):ADefinitionofSystemsThinking:ASystemsApproach.ProcediaComputerScience44,669-678.
Ashraf, M .A ., Maah, M . J ., Yusoff, I ., Wajid, A ., and Mahmood, K . (2011) . Sand mining effects, causes and concerns: a case study from BestariJaya,Selangor,PeninsularMalaysia.ScientificResearchandEssays6(6):1216-1231.
Ayres, R . U . and U . E . Simonis (1994) . Industrial Metabolism . Restructuring for Sustainable Development . Tokyo, New York, Paris: United Nations University Press .
Bahn-Walkowiak, B ., N . von Gries, H . Wilts, and S . Schefer (2014) . Comparing trends and policies of key countries: Report about barriersforresourceefficiencyandtheroleofnationalpolicies.PolfreeProjectReport.
Bai,X.,Surveyer,A.,Elmqvist,T.,Gatzweiler,F.W.,Güneralp,B.,etal.(2016).Definingandadvancingasystemsapproachforsustainable cities . Environmental Sustainability 23: 69-78 .
Barboza, T . (2016) . L .A . City Council adopts rules to ease health hazards in polluted neighborhoods . Los Angeles Times . Available at: www .latimes .com/local/lanow/la-me-pollution-protection-20160412-story .html .
Bartelmus, P . (2003) . Dematerialization and capital maintenance: two sides of the sustainability coin . Ecological Economics 46(1): 61-81 .
Bello, W . 2017 . The end of globalization . In The essential guide to critical development studies, edited by H . Velmeyer and P . Bowles . London: Routledge .
Bettencourt, L . (2013) . Origins of Scaling in Cities . Science, 340(6139): 1438-1441 .
Bhattacharya,A.(2016).Cropfireshad70 percentshareinpeakairpollution,saysgovtscientistGufranBeig.TheTimesofIndia.Available:http://timesofindia.indiatimes.com/india/Crop-fires-had-70-share-in-Delhis-peak-air-pollution-says-govt-scientist-Gufran-Beig/articleshow/55301918 .cms .
BioIS(BioIntelligenceService),ISEandSERI(2012).Assessmentofresourceefficiencyindicatorsandtargets.BIOIntelligenceService,Institute of Social Ecology, and Sustainable Europe Research Institute . Final report prepared for the European Commission, DG Environment .BioRegional and Peabody (2009) . BedZED seven years on: the impact of the UK’s best known eco-village and its residents . BioRegional solutions for sustainability .Birkeland, J . (2008) . Positive development – from vicious circles to virtuous cycles through built environment design . London: Earthscan .Bontoux, L . and Bengtsson, D . (2016) . Using scenarios to assess policymixesforresourceefficiencyandeco-innovationindifferentfiscalpolicyframeworks.Sustainability8(4):1-12.

A SYSTEMS APPROACH TO RESOURCE EFFICIENCY AND POLLUTION REDUCTION
91
References
Boston Consulting Group (2010) . Winning in Emerging Market Cities: A Guide to the World’s Largest Growth Opportunity . USA: BCG . 14 .
Bringezu, S . (2002) . Towards Sustainable Resource Management in the European Union . Wuppertal Papers 121 . Wuppertal: Wuppertal Institut . ISSN 0949-5266 . Available at: https://wupperinst .org/a/wi/a/s/ad/168/ .
Bringezu, S . (2015) . Possible Target Corridor for Sustainable Use of Global Material Resources . Resources (4): 25-54 .
Bringezu,S.,Potočnik,J.,Schandl,H.,Lu,Y.,Ramaswami,A.,Swilling,M.,andSuh,S.(2016).Multi-ScaleGovernanceofSustainableNatural Resource Use—Challenges and Opportunities for Monitoring and Institutional Development at the National and Global Level . Sustainability 8 (778): doi:10 .3390/su8080778 .
Bruckner, M ., S . Giljum, C . Lutz, and K . S . Wiebe (2012) . Materials embodied in international trade – Global material extraction and consumption between 1995 and 2005 . Global Environmental Change 22(3): 568-576 .
Burnett, R ., Pope, C ., Ezza, M ., et al . (2014) . An Integrated Risk Function for Estimating the Global Burden of Disease Attributable to Ambient Fine Particulate Matter Exposure . Environmental Health Perspectives, 122(4): 397-403 .
CopenhagenCentreonEnergyEfficiency(C2E2)(2015).AcceleratingEnergyEfficiency:InitiativesandOpportunities–SoutheastAsia.CopenhagenCentreonEnergyEfficiency,Copenhagen,Denmark.
Clean Air Action Plan (CAAP) (2016) . About the Plan . Clean Air Action Plan . Available at: www .cleanairactionplan .org/about-the-plan/ .
CE and BioIS (2014) . Study on modelling of the economic and environmental impacts of raw material consumption . Available from: http://ec.europa.eu/environment/enveco/resource_efficiency/pdf/RMC.pdf
Ceballos, G ., Ehrlich, P .R ., and Dirzo, R . (2017) . Biological annihilation via the ongoing sixth mass extinction signaled by vertebrate population losses and declines . PNAS 114(30): E6089-E6096 .
Chancerel, P ., Rotter, V .S . (2009) . Stoffstromanalyse für die Behandlung von Kleingeräten in Deutschland – Beispiel Gold . In: Bilitewski, B ./ Werner, P ./ Janz, A . (Hrsg .): Brennpunkt ElektroG . Conference Transcript . April 23, 2009 . Dresden . p . 43-54 .
Chavez, A ., Ramaswami, A . (2013) . Articulating a trans-boundary infrastructure supply chain greenhouse gas emission footprint for cities: Mathematical relationships and policy relevance . Energy Policy, 54: 376-384 .
Chavez, A ., Ramaswami, A ., Nath, D ., Guru, R ., Kumar, E . (2012) . Implementing Trans-Boundary Infrastructure-Based Greenhouse Gas Accounting for Delhi, India . Journal of Industrial Ecology, 16(6): 814-828 .
City Population . (2016) . India: Delhi . Available: https://www .citypopulation .de/India-Delhi .html?cityid=2925 .
CML-IA database, version 4 .8, last update August 2016 . Downloaded from https://www .universiteitleiden .nl/en/research/research-output/science/cml-ia-characterisation-factors .
Commonwealth Secretariat and ICMM (International Council on Minerals and Metals) (2009) . Minerals Taxation Regimes . A review of issues and challenges in their design and application . London: ICMM .
D’Amour, C ., Reitsma, F ., Baiocchi, G ., Barthel, S ., Guneralp, B ., Erb, K ., Haberl, H ., Creutzig, F ., Seto, K . (2016) . Future urban land expansion and implication for global croplands . Proceedings of the National Academy of Sciences of the United States of America . Available: https://doi .org/10 .1073/pnas .1606036114 .
Delhi Air Quality Info . (N .D .) Ambient Monitoring Data in Delhi . Available: http://www .delhiairquality .info/monitoring-data/ .
Deloitte (2016) . Construction and demolition waste management in United Kingdom: V2 Revised 27/1/16 . Bio by Deloitte .
Desai, S ., and Vanneman, R . (2015) . India Human Development Survey-II (IHD-II), 2011-2012 . ICPSR36151-v2 . Ann Arbor, MI: Inter-University Consortium for Political and Social Research, pg . 07-31 . Available: http://www .icpsr .umich .edu/icpsrweb/DSDR/studies/36151 .
Dobbs, R ., Smit, S ., Remes, J ., Manyika, F ., Roxburgh, C ., Restrepo, A . (2011) . Urban world: Mapping the economic power of cities . McKinsey Global Institute . Available: http://www .mckinsey .com/global-themes/urbanization/urban-world-mapping-the-economic-power-of-cities .
DGEnvironment(2011).EconomicAnalysisofResourceEfficiencyPolicies.FinalReportCOWI.
Doshi, V ., Schulman, G . & Gabaldon, D . (2007) . Light! Water! Motion! Strategy and Business 47: 39-53 .
DowntoEarth (2011) . How India Commutes to Work . DownToEarth, Available at: http://www .downtoearth .org .in/dte-infographics/commute_to_work .html .
Duhigg, C . (2012) . The Power of Habit: why we do what we do and how to change . New York: Random House .

ASSESSING GLOBAL RESOURCE USE
92
References
EuropeanCommission(EC)(2015).Closingtheloop–AnEUActionPlanfortheCircularEconomy,COM(2015)614final.Brussels:European Commission .
European Environment Agency (EEA) (1999) . Environmental indicators: Typology and overview . Prepared b E . Smeets and R . Weterings . EEA technical Report No 25 . Copenhagen, 19 pp .
European Environment Agency (EEA) (2008) . Effectiveness of environmental taxes and charges for managing sand, gravel and rock extraction in selected EU countries . EEA Report No . 2/2008, European Environment Agency, Copenhagen .
EuropeanEnvironmentAgency(EEA)(2011).ResourceEfficiencyinEurope:Policiesandapproachesin31EFAemberandcooperating countries . EEA Report No . 5 .
EuropeanEnvironmentAgency(EEA)(2016).Morefromless—materialresourceefficiencyinEurope:2015overviewofpolicies,instruments and targets in 32 countries . European Environment Agency .
European Environment Agency (EEA) (2017) . Environmental and labour taxation . European Environment Agency . Available online at: https://www.eea.europa.eu/airs/2016/resource-efficiency-and-low-carbon-economy/environmental-and-labour-taxation
Ehrlich, P . R . and J . P . Holdren (1971) . Impact of Population Growth . Science 171: 1212-1217 .
EcoInnovationObservatory(EIO)(2011).Resource-efficientconstruction.Theroleofeco-innovationfortheconstructionsectorin Europe . Eco-Innovation Observatory . Supported by the European Commission, Brussels . O’Brien, M ., Wallbaum, H ., and Bleischwitz, R . (eds) .
Ekins, P . and Salmons, R . (2010) . Making reform happen in environmental policy: Lessons from OECD Countries . Paris: 129-157 .
Ellen MacArthur Foundation (EMF) (2015) . Growth Within: a circular economy vision for a competitive Europe . Cowes, United Kingdom: Ellen MacArthur Foundation .
EuropeanStatisticalOffice(EUROSTAT)(2001).Economy-wide material flow accounts and derived indicators. A methodological guide . Luxembourg:EuropeanStatisticalOffice.
Fischer, S ., O’Brien, M ., Wilts, H ., Steger, S ., Schepelmann, P ., Jordan, N .D ., and Rademacher, B . (2015) . Waste Prevention in a “Leasing Society“ . International Journal of Waste Resources 5(1): 170 .
Feedback (2015) . Food waste in Kenya: uncovering food waste in the horticultural export supply chain . London: Feedback .
Garrity, D .P ., F .K . Akinnifesi, O .C . Ajayi, S .G . Weldesemayat, J .G . Mowo, A . Kalinganire, M . Larwanou, J . Bayala (2010) . Evergreen Agriculture: a robust approach to sustainable food security in Africa . Food Security 2: 197-214 .
Geels, F .W . and Schot, J ., (2007) . Typology of sociotechnical transition pathways . Research Policy 36(3): 399-417 .
Green Growth Knowledge Platform (GGKP) (2015) . Fiscal Policies and the Green Economy Transition: Generating Knowledge –Creating Impact . Green Growth Knowledge Platform - Third Annual Conference Report .
Giljum, S ., M . Bruckner and A . Martinez (2015) . Material footprint assessment in a global input-output framework . Journal of Industrial Ecology 19(5): 792-804 .
Giljum, S ., Wieland, H ., Lutter, S ., Bruckner, L ., Wood, R ., Tukker, A ., and Stadler, K . (2016) . Identifying priority areas for Eureopan resource policies: a MRIO-based material footprint assessment . Journal of Economic Structures 5: 17 . https://doi .org/10 .1186/s40008-016-0048-5 .
GovernmentOfficesofSweden(2016).Keyactsandordinancesenteringintoforcelate2016/early2017.Availableat: http://www .government .se/48e57f/contentassets/f1239a13d16641a39765ad3b52c5d9e7/key-acts-and-ordinances-entering-into-force-late-2016-early-2017 .pdf .
Government of the national Capital Territory of Delhi . (2016) . Delhi Statistical Handbook . Available: http://www .delhi .gov .in/wps/wcm/connect/doit_des/DES/Our+Services/Statistical+Hand+Book/ .
Guinée, J .B ., Gorrée, M .; Heijungs, R .; Huppes, G .; Kleijn, R .; Koning, A . de; Oers, L . van; Wegener Sleeswijk, A .; Suh, S .; Udo de Haes, H .A .; Bruijn, H . de; Duin, R . van; Huijbregts, M .A .J . (2002) . Handbook on life cycle assessment . Operational guide to the ISO standards . I:LCAinperspective.IIa:Guide.IIb:Operationalannex.III:Scientificbackground.KluwerAcademicPublishers,ISBN1-4020-0228-9, Dordrecht, 692 pp .
Gustavsson, J ., Cederberg, C ., Sonesson, U ., van Otterdijk, R ., Meybeck, A . (2011) . Global Food Losses and Food Waste . Extent, Causes and Prevention . FAO, Rome .
Guttikunda, S .K . and Calori, G . (2013) . A GIS based emissions inventory at 1 km× 1 km spatial resolution for air pollution analysis in Delhi,India. AtmosphericEnvironment 67:101-111.

A SYSTEMS APPROACH TO RESOURCE EFFICIENCY AND POLLUTION REDUCTION
93
References
Haidar, F . (2017) . Delhi govt to keep a watch over Dwarka flats allotted to slum dwellers . HindustanTimes . Available at: http://www .hindustantimes .com/delhi-news/delhi-govt-to-keep-a-watch-over-dwarka-flats-allotted-to-slum-dwellers/story-fx7uylAles2gPwIbEMa9CM .html .
Hatfield-Dodds,S.,H.Schandl,D.Newth,M.Obersteiner,Y.Cai,T.Baynes,J.West,andP.Havlik(2017).Assessingglobalresourceuseandgreenhouseemissionsto2050,withambitiousresourceefficiencyandclimatemitigationpolicies.JournalofCleanerProduction 144: 403-414 .
Häyhä, T ., Lucas, P .L ., van Vuuren, D .P ., Cornell, S .E ., Hoff, H . (2016) . From planetary boundaries to national fair shares of the global safe operating space—how can the scales be bridged . Global Environmental Change 40: 60-72 .
Hayward,S.(2013).AlmanacofEnvironmentalTrends:AirQuality.PacificResearchInstitute.Available:https://www.pacificresearch.org/fileadmin/documents/Studies/PDFs/2013-2015/AirQuality_F_web.pdf.
Healy, A ., Smith, M ., Regeczi, D ., Zane, E ., Klaassens, E ., Woodcraft, P ., Dodd, J ., Farrar, P . and Rademaekers, K . (2011) . Lags in the EU Economy’s Response to Change . Rotterdam: Ecorys .
High Level Panel of Experts on Food Security and Nutrition (HLPE) (2013) . Investing in smallholder agriculture for food security . A reportbytheHighLevelPanelofExpertsonFoodSecurityandNutritionoftheCommitteeonWorldFoodSecurity,Rome.
Hossain, M ., & Abdullah, A . M . (2012) . Securing the Environment: Potentiality of Green Brick in Bangladesh . . Bangladesh University of Professionals Journal, 1(1), 79-89 .
Hu, Y . & Ramaswami, A . (2017) . Material flow analysis of cities from consumption, production, infrastructure provision and total requirement perspective: a rapid approach (in preparation) .
Ibn-Mohammed, T ., Greenough, R ., Taylor, S ., Ozawa-Meida, L ., Acquaye, A . (2013) . Operational vs embodied emissions in buildings — A review of current trends . Energy and Buildings (66): 232-245 .
Institute for Climate Change and Adaptation, University of Nairobi (ICCA) (2016) . Report on climate change-induced conflicts and migration in Kenya . University of Nairobi, Institute for Climate Change and Adaptation . Funded by the Rosa Luxemburg Stiftung .
International Energy Association (IEA) (2016) . District Heating Business Models and Policy Solutions- Unlocking the Potential from low-grade industrial excess heat in China (draft) . Paris, France: OECD/International Energy Association .
InstituteforHealthMetricsandEvaluation(IHME). GlobalBurdenofDisease(GBD)ResultsTool.Seattle,WA:IHME,UniversityofWashington,2016.Availablefrom http://ghdx.healthdata.org/gbd-results-tool.
International Institute for Applied Systems Analysis (IIASA) (2015) . SSP Scenario Database . Laxenburg: International Institute for Applied Systems Analysis .
International Monetary Fund (IMF) (2016) . IMF World Economic Outlook (WEO) October 2016: Subdued Demand. Symptoms and Remedies . www .imf .org: International Monetary Fund .
Japan’s Ministry of the Environment (2013) . The Third Fundamental Plan for Establishing a Sound Material-Cycle Society, http://www .env .go .jp/en/recycle/smcs/3rd-f_plan .pdf .
Japan’sMinistryoftheEnvironment(2014).HistoryandCurrentStateofWasteManagementinJapan.OfficeofSoundMaterial-CycleSociety, Tokyo, Japan .
Kemp, R ., Loorbach, D ., Rotmans, J . (2007) Transition management as a model for managing processes of co-evolution towards sustainable development . International Journal of Sustainable Development & World Ecology 14(1): 78-91 .
Kennedy, C ., Steinberger, J ., Gasson, B ., Hansen, Y ., Hillman, T ., Havranek, M ., Pataki, D ., Phdungsilp, A ., Ramaswami, A ., Villalba Mendez, G . (2009) . Greenhouse Gas Emissions from Global Cities . Environmental Science and Technology, 43(19): 7297-7302 .
Krausmann, F ., Wiedenhofer, D ., Lauk, C ., Haas, W ., Tanikawa, H . et al . (2017) . Global socioeconomic material stocks rise 23-fold over the 20th century and require half of annual resource use . Proceedings of the National Academy of Sciences (PNAS) 114(8): 1880-1885 .
Lee, B ., Preston, F ., Kooroshy, J ., Bailey, R ., Lahn, G . (2013) . Resources Futures . Royal Institute of International Affairs, London, United Kingdom .
Lenzen, M ., D . Moran, K . Kanemoto, and A . Geschke (2013) . Building EORA: A global multi-region input-output database at high country and sector resolution . Economic Systems Research 25(1): 20-49 .
Lim S ., Vos, T ., Flaxman, et al . (2012) . A Comparative risk assessment of the burden of disease and injury attributable to 67 risk factors and risk factor clusters in 21 regions, 1990-2010: a systematic analysis for the Global Burden of Disease Study 2010 . The Lancet 380(9859): 2224-2260 .

ASSESSING GLOBAL RESOURCE USE
94
References
Lin M, Chen Y, Burne RT, Villeneuve PJ, Kerwski D . (2002) . The Influence of Ambient Coarse Particulate Matter on Asthma Hospitalization in Children: case-crossover and meta-series analyses . Environ Health Perspectives, 110: 575-581 .
Liu, J . et al . (2016) . Air pollutant emissions from Chinese households: A major and underappreciated ambient pollution source . Proceedings of the National Academy of Sciences 113: 7756-7761 .
Lombardi,D.R.andLaybourn,P.(2012).RedefiningIndustrialSymbiosis.JournalofIndustrialEcology,16:28–37.doi:10 .1111/j .1530-9290 .2011 .00444 .x .
Ludwig D . (2001) . The era of management is over . Ecosystems, 4: 758-764 . DOI: 10 .1007/s10021-001-0044-x .
Lund, H . et al . (2014) . 4th Generation District Heating (4GDH): Integrating smart thermal grids into future sustainable energy systems . Energy 68: 1-11 .
Machiba,T.(2010).Eco-innovationforenablingresourceefficiencyandgreengrowth:developmentofananalyticalframeworkandpreliminary analysis of industry and policy practices . International Economics and Economic Policy 7: 357–370 .
McKinsey Global Institute (2011) . Resource Revolution . Meeting the world’s energy, materials, food and water needs . Dobbs, R ., Oppenheim, J ., Thompson, F ., Brinkman, M ., Zornes, M . New York: McKinsey Global Institute . New York: McKinsey Global Institute .
Metro (2017) . Metro Rideshare/Shared Mobility . Los Angeles, Available at: www .metro .net/riding/rideshare/ .
Meyer, B ., Distelkamp, M ., & Beringer, T . (2015) . Report about integrated scenario interpretation: GINFORS/LPJml results . Deliverable D3.7afortheFP7projectPOLFREE(PolicyOptionsforaResource-EfficientEconomy).Availablefrom:http://www.polfree.eu/publications/ publications-2014/integrated- scenario-interpretation
Ministry of New and Renewable Energy, India (MNRE) (2016) . Solar/Green Cities . Government of India, Ministry of New and Renewable Energy . Available at: http://mnre .gov .in/schemes/decentralized-systems/solar-cities/ .Moss, T . (2010) . ‘Declining towns’, speech at The City is Alive seminar, City Factory, Hambourg, 6,7 and 8 April (available at: http://www .lafabriquedelacite .com/en/speech/declining-towns) .
Mudd, G . M . 2010 . The Environmental sustainability of mining in Australia: key mega-trends and looming constraints . Resources Policy 35(2): 98-115 .
Munshi, N . (2012) . Development Plan at Macro Level and Town Planning Scheme at Micro Level: Ahmedabad Urban Development Authority . Available: https://www .slideshare .net/transportsdufutur/ahmedabad-14863493 .
Murguia, D ., Bringezu, S ., and Schaldach, R . (2016) . Global direct pressures on biodiversity by large-scale metal mining: spatial distribution and implications for conservation . Journal of Environmental Management 180: 409-420 .
Nagpure, A ., Ramaswami A ., Russel, A . (2015) . Characterizing the Spatial and Temporal Patterns of Open Burning of Municipal Solid Waste (MSW) in Indian Cities . Environmental Science and Technology 49(21): 12904-12912 .
Nagpure, A ., Boyer, D ., Russell A ., Ramaswami, A . (2017a) . Greenhouse gases (GHG) and air pollution emission footprints of infrastructure use in three Indian cities: Equity within & beyond city boundaries Environmental Research Letters (Under Review) .
Nagpure, A ., Kruit, K ., Ramaswami, A . (2017b) . Inequalities in Infrastructure Provision and use in 343 Cities in India: Resource Implications for Inclusive Development (In Preparation) .
Nagpure, A ., Ramaswami, A . (2017c) . Indoor air pollution and health risk assessment in 500 Indian Cities (In Preparation) .
NationalDevelopmentandReformCommissionofP.R.China(2016).NotificationontheIssuanceofEvaluationIndicatorSystemofCircular Economy Development (2017 Edition) . http://www .sdpc .gov .cn/zcfb/zcfbtz/201701/t20170112_834922 .html .
National Development and Reform Commission, China (NDRC) and Ministry of Housing and Urban-Rural Development (MOHURD) . (2015) . Warming Program by Waste Heat . National Development and Reform Commission (NDRC), and Ministry of Housing and Urban-Rural Development (MoHURD) .
Ng . M . et al . (2014) . Global, regional, and national prevalence of overweight and obesity in children and adults during 1980–2013: a systematic analysis for the Global Burden of Disease Study 2013 . The Lancet .
National Institute of Health (NIH) . Cookstoves and Indoor Air . National Institute of Environmental Health Sciences . Available: https://www .niehs .nih .gov/research/programs/geh/cookstoves/index .cfm .
National Research Council (NRC) (2004) . Air Quality Management in the United States . National Research Council of the National Academies . Available at: https://www .nap .edu/catalog/10728/air-quality-management-in-the-united-states?onpi_newsdoc01292003= .

A SYSTEMS APPROACH TO RESOURCE EFFICIENCY AND POLLUTION REDUCTION
95
References
O’Brien, M ., Hartwig, F ., Schanes, K ., Kammerlander, M ., Omann, I ., Wilts, H ., Bleischwitz, R ., and Jäger, J . (2014) . Living with the safe operatingspace:avisionforaresourceefficientEurope.EuropeanJournalofFuturesResearch2:48-59.
O’Brien, M . and Bringezu, S . (2017) . What Is a Sustainable Level of Timber Consumption in the EU: Toward Global and EU Benchmarks for Sustainable Forest Use . Sustainability: 9(812): doi:10 .3390/su9050812 .
Organisation for Economic Co-operation and Development (OECD) (2008) . Measuring Material Flows and Resource Productivity . Paris: Organisation for Economic Co-operation and Development .
Organisation for Economic Co-operation and Development (OECD) (2011) . Resource Productivity in the G8 and the OECD – A Report in the Framework of the Kobe 3R Action Plan .
Organisation for Economic Co-operation and Development (OECD) (2014) . Smart Procurement . Going green: best practices for green procurement — Korea case study . Available at: http://www .oecd .org/gov/ethics/best-practices-for-green-procurement .htm.
Organisation for Economic Co-operation and Development (OECD) (2016) . The Economic Consequences of Outdoor Air Pollution . OECD Publishing, Paris .
O’Neill, B . C ., E . Kriegler, K . L . Ebi, E . Kemp-Benedict, K . Riahi, D . S . Rothman, B . J . van Ruijven, D . P . van Vuuren, J . Birkmann, K . Kok, M . Levy, and W . Solecki (2015) . The roads ahead: Narratives for shared socioeconomic pathways describing world futures in the 21st century . Global Environmental Change .
Peoples Republic of China (2013) . Air Pollution Prevention and Control Action Plan . State Council of the People’s Republic of China .
Press Trust of India (PTI) (2015) . No bins at Delhi Metro station due to terror threat HC not convinced . Available: http://www .newsmobile .in/articles/2015/05/01/no-bins-delhi-metro-station-due-terror-threat-hc-not-convinced/ .
Press Trus of India (PTI) (2016) . Government announces policy to make Delhi ‘solar city’ . The Economic Times . Available at: http://economictimes .indiatimes .com/industry/energy/power/government-announces-policy-to-make-delhi-solar-city/articleshow/52625910 .cms .
Ramaswami, A ., Hillman, T ., Janson, B ., Reiner, M ., Thomas, G . (2008) . A Demand-Centered Hybrid Life Cycle Methodology for City-Scale Greenhouse Gas Inventories . Environmental Science and Technology, 42(17): 6456-6461 .
Ramaswami, A ., Russell, A ., Culligan, P ., K . Sharma, et al . (2016) . Meta-principles for developing smart, sustainable, and healthy cities . Science 352(6288): 940-943 .
Ramaswami, A ., Boyer, D ., Nagpure, A ., Fang, A ., Bogra, S ., Bakshi, B ., Cohen, E ., Rao-Ghorpade A . (2017a) . An Urban Systems Framework to assess the transboundary food-energy-water nexus: Implementation in Delhi, India . Environmental Research Letters, 12(2): 1-14 .
Ramaswami, A ., Pelton, R ., Nagpure, A ., Boyer, D ., Flanegin, K . (2017b) . Advancing the World’s Sustainable Development Goals through a Focus on Urban Infrastructure . Journal of Cleaner Production (in preparation) .
Ramaswami, A ., Tong, K ., Fang, A ., Lal, R ., Nagpure, A ., Li, Y ., Yu, H ., Jiang, D ., Russel, A ., Shi, L ., Chertow, M ., Wang, Y ., Wang, S . (2017c) . UrbanCross-SectorActionsforCarbonMitigationwithLocalHealthCo-BenefitsinChina.NatureClimateChange(underreview).
Reeson, A . F ., T . G . Measham, and K . Hosking (2012) . Mining activity, income inequality and gender in regional Australia* . Australian Journal of Agricultural and Resource Economics 56(2): 302-313 .
Rockström, J ., W . Steffen, K . Noone, Å . Persson, F . S . I . Chappin, E . Lambin, T .M . Lenton, M . Scheffer, C . Folke, H . Schellnhuber, B . Nykvist, C .A . De Wit, T . Hughes, S . Van Der Leeuw, H . Rodhe, S . Sörlin, P .K . Snyder, R . Costanza, U . Svedin, M . Falkenmark, L . Karlberg, R . W . Corell, V . J . Hansen, B . Walker, D . Liverman, K . Richradson, P . Crutzen & J . Foley (2009), Planetary boundaries: exploring the safe operating space for humanity . Ecology and Society, 14 .
Rogelj, J ., M . Meinshausen, and R . Knutti (2012) . Global warming under old and new scenarios using IPCC climate sensitivity range estimates . Nature Climate Change 2(4): 248-253 .
Salat, S . (2011) . Cities and farms: on sustainable urbanism . Paris: Hermann .
Salat, S ., & Bourdic, L . (2011) . Factor 10: Multiplying by 10 resource productivity in the urban world Paper presented at the SB11 Helsinki World Sustainable Building Conference, Helsinki . https://http://www .irbnet .de/daten/iconda/CIB_DC22992 .pdf .
Saurat, M ., and Bringezu, S . (2008) . Platinum group metal flows of Europe, part I: Global supply, use in industry, and shifting of environmental impacts . Journal of Industrial Ecology 12(5/6): 754–767 .
Saurat, M . and Bringezu, S . (2009) . Platinum Group Metal Flows of Europe: PART II: Exploring the Technological and Institutional Potential for Reducing Environmental Impacts . Journal of Industrial Ecology 13 (3): 406-421 .

ASSESSING GLOBAL RESOURCE USE
96
References
Schandl,H.andJ.West(2010).ResourceuseandresourceefficiencyintheAsia-Pacificregion.GlobalEnvironmentalChange-Humanand Policy Dimensions 20(4): 636-647 .
Schandl, H . and J . West (2012) . Material Flows and Material Productivity in China, Australia, and Japan . Journal of Industrial Ecology 16(3): 352-364 .
Schoer, K ., J . Weinzettel, J . Kovanda, J . Giegrich and C . Lauwigi (2012) . Raw Material Consumption of the European Union – Concept, Calculation Method, and Results . Environmental Science & Technology 46, 8903-8909 .
Seto, K ., Fragkias, M ., Guneralp, B ., Reilly, M . (2011) . A Meta-Analysis of Global Urban Land Expansion . PLoS ONE 6(8): e23777 . Available: https://doi .org/10 .1371/journal .pone .0023777 .
Seto, K ., Guneralp, B ., Hutyra, L . (2012) . Global forecasts of urban expansion to 2030 and direct impacts on biodiversity and carbon pools . Proceedings of the National Academy of Sciences of the United States of America 109(40): 16083-16088 .
Shaji, J ., and Anilkuar, R . (2014) . Socio-Environmental impact of river sand mining: an example from Neyyar River, ThiruvananthapuramDistrictofKerala,India.InternationalOrganizationofScientificResearch(IOSR)Journalofhumanitiesandsocial science 19(1): 01-07 .
Sharma, S ., Rehman, I ., Ramanathan, V ., Balakrishnan, et al . (2016) . Breathing Cleaner Air: Ten Scalable Solutions for Indian Cities . Report for the World Sustainable Development Summit, DelhiDelhi, Oct . 6, 2016 . Available: http://www .ccacoalition .org/sites/default/files/resources/2016_Breathing-Cleaner-Air-Ten-Scalable-Solutions-for-Indian-Cities.pdf.
Society for Excellence in Habitat Development, Environment Protection and Employment Generation (India) (SHEE) (n .d) . Environment Friendly Indian Building Material Technologies for Cost Effective Housing . Society for Excellence in Habitat Development, EnvironmentProtection&EmploymentGeneration(SHEE).Available:https://www.unido.org/fileadmin/user_media/Publications/Pub_free/Environment_friendly_Indian_building_material_technologies_for_cost_effective_housing .pdf .
Smith, K . (2000) . National burden of disease in India from indoor air pollution . Proceedings of the National Academy of Sciences 97(24): 13286-13293 .
State Council of the PRC (2013) . Circular Economy Development Strategy and Immediate Plan of Action .
Steffen, W ., Richardson, K ., Rockström, J ., Cornell, S ., Fetzer, I ., et al . (2015) . Planetary Boundaries: Guiding human development on a changing planet . Science 347(6223): 1-10 .
Steinberger, J .K ., F . Krausmann and N . Eisenmenger (2010) . Global patterns of materials use: A socioeconomic and geophysical analysis . Ecological Economics 69: 1148-1158 .
Steinmann, Z .J .N ., Schipper, A .M ., Hauck, M ., and Huijbregts, M .A .J . (2016) . How many environmental impact indicators are needed in the evaluation of product life cycles? Environ . Sci . Technol . 50(7): 3913-3919 .
Stenmarck, A ., Jensen, C ., Quested, T ., and Moates, G . (2016) . Estimates of European food waste levels . Report of the FUSIONS project . Supported by the European Commission, Brussels .
Swilling, M . and Annecke, E . (2012) . Just transitions . Claremont, South Africa: UCT Press .
Takiguchi, H . and K . Takemoto (2008) . Japanese 3R policies based on material flow analysis . Journal of Industrial Ecology 12(5/6), pp .792-798
Tejpal, Mr, Jaglan, M .S ., and Chaudhary, Karnal, Haryana, B .S . (2014) . Geo-Environmental Consequences of Rivers Sand and Stone Mining: A case study of Narnaul Block, Haryana . Transaction 36(2): 217-234 .
Thomas, C . and Sharp, V . (2013) . Understanding the normalization of recycling behaviour and its implications for other pro-environmental behaviours: A review of social norms and recycling . Resources, Conservation and Recycling, 79: 11-20 .
Tong, K ., Zhao, Z ., Feiock, R ., Ramaswami, A . (2017) . Patterns and Variation of Capital Investment in Urban Infrastructure in Chinese Cities: An Explanation from the Political Market Framework . Urban Studies (in preparation) .
Tukker, A . and Tischner, U . (2006) . New business for old Europe: Product-service development, competitiveness and sustainability . Greenleaf publishing .
GermanFederalEnvironmentAgency(UBA)(2015).GesamtwirtschaftlicheZieleundIndikatorenzurRohstoffinanspruchnahme(Economy-wide targets and indicators to material resource demands) . ISSN: 2363-829X . German Federal Environment Agency .
United Nations (2010) . Gender Equality and Sustainable Urbanisation . WomenWatch, Inter-Agency Network on Women and Gender Equality (IANWGE) .
United Nations (2013) . A New Global Partnership: Eradicate Poverty And Transform Economies Through Sustainable Development . The Report of the High-Level Panel of Eminent Persons on the Post-2015 Development Agenda .

A SYSTEMS APPROACH TO RESOURCE EFFICIENCY AND POLLUTION REDUCTION
97
References
United Nations (2014) . World Urbanization Prospects: The 2014 Revision . Department of Economic and Social Affairs, Population Division . United Nations .
United Nations (2015) . World Population Prospects: The 2015 Revision, Key Findings and Advance Tables . ESA/P/WP .241 . United Nations, Department of Economic and Social Affairs, Population Division .
UnitedNationsEconomicandSocialCommissionforAsiaandthePacific(ESCAP)(2012).Integratingenvironmentalcoststotacklewater scarcity: Singapore’s water pricing policy . Case Study 41 in the Low Carbon Green Growth Roadmap for Asia and the Pacific.UnitedNationsEconomicandSocialCommissionforAsiaandthePacific.
United Nations Human Settlement Programme (UN Habitat) (2013) . State of women in cities in 2012-2013: Gender and the prosperity of cities .
United Nations Human Settlement Programme (UN Habitat) (2016) . Urbanization and Development: Emerging Futures, World Cities Report 2016 . United Nations Habitat for a Better Urban Future . Available: http://wcr .unhabitat .org/wp-content/uploads/2017/02/WCR-2016-Full-Report .pdf .
UnitedNationsDevelopmentProgramme(UNDP)Bangladesh(2010).GREENBrick(ImprovingKilnEfficiencyintheBrickMakingIndustry) Retrieved 29th April, 2016, from http://www .bd .undp .org/content/bangladesh/en/home/operations/projects/envir-onment_and_energy/improving-kiln-efficiency-in-brick-making-industry-.html. United Nations Development Programme .
United Nations Environment Programme (UNEP) (2009) . Capacity Building for Sustainable Public Procurement . UNEP, Division of Technology, Industry and Economics . United Nations Environment Programme .
United Nations Environment Programme (UNEP) (2011a) . Decoupling natural resource use and environmental impacts from economic growth, A Report of the Working Group on Decoupling to the International Resource Panel .
United Nations Environment Programme (UNEP) (2011b) . Global Outlook on SCP Policies. Taking Action Together . Paris: United Nations Environment Programme .
United Nations Environment Programme (UNEP) (2011c) . Towards a Green Economy: Pathways to Sustainable Development and Poverty Eradication . United Nations Environment Programme .
UnitedNationsEnvironmentProgramme(UNEP)(2012a).BuildingDesignandConstruction:forgingresourceefficiencyandsustainable development . The Sustainable Buildings and Climate Initiative . M . Comstock, C ., Garrigan and S . Pouffary .
United Nations Environment Programme (UNEP) (2012b) . Global Outlook on SCP Policies: Taking Action Together . UNEP: Paris, France .
United Nations Environment Programme (UNEP) (2012c) . Measuring Progress: Environmental Goals & Gaps . United Nations Environment Programme, Nairobi .
United Nations Environment Programme (UNEP) (2013a) . City-Level Decoupling: Urban resource flows and the governance of infrastructure transitions . A Report of the Working Group on Cities of the International Resource Panel . Swilling M ., Robinson B ., Marvin S . and Hodson M .
United Nations Environment Programme (UNEP) (2013b) . Environmental Risks and Challenges of Anthropogenic Metals Flows and Cycles, A Report of the Working Group on the Global Metal Flows to the International Resource Panel . van der Voet, E .; Salminen, R .; Eckelman, M . Mudd, G .; Norgate, T .; Hischier, R .
United Nations Environment Programme (UNEP) (2013c) . Metal recycling: opportunities, limits, infrastructure . A report of the Working Group on the Global Metal Flows to the International Resource Panel . Reuter, M .A ., Hudson, C ., van Schaik, A ., Heiskanen, K ., Meskers, C ., Hegeluken, C . Paris: United Nations Environment Programme .
United Nations Environment Programme (UNEP) (2014a) Assessing Global Land Use: Balancing Consumption with Sustainable Supply . A Report of the Working Group on Land and Soils of the International Resource Panel . Bringezu S ., Schütz H ., Pengue W ., O´Brien M ., Garcia F ., Sims R ., Howarth R ., Kauppi L ., Swilling M ., and Herrick J .
United Nations Environment Programme (UNEP) (2014b) . Decoupling 2: technologies, opportunities and policy options . A Report of the Working Group on Decoupling to the International Resource Panel . von Weizsäcker, E .U ., de Larderel, J ., Hargroves, K ., Hudson, C ., Smith, M ., Rodrigues, M .
United Nations Environment Programme (UNEP) (2014c) . Managing and conserving the natural resource base for sustained economic and social development: A reflection from the International Resource Panel on the establishment of Sustainable Development Goals aimed at decoupling economic growth from escalating resource use and environmental degradation . Report of the International Resource Panel .
United Nations Environment Programme (UNEP) (2015a) International Trade in Resources: A Biophysical Assessment . Report of the International Resource Panel .

ASSESSING GLOBAL RESOURCE USE
98
References
United Nations Environment Programme (UNEP) (2015b) . Policy Coherence of the Sustainable Development Goals: A Natural Resource Perspective . A report of the International Resource Panel .
United Nations Environment Programme (UNEP) (2016a) . Delivering on the environmental dimension of the 2030 Agenda for Sustainable Development . United Nations Environment Assembly of the United Nations Environment Programme .
United Nations Environment Programme (UNEP) (2016b) . Food Systems and Natural Resources . A Report of the Working Group on Food Systems of the International Resource Panel . Westhoek, H, Ingram J ., Van Berkum, S ., Özay, L ., and Hajer M .
United Nations Environment Programme (UNEP) (2016c) . Global Material Flows and Resource Productivity . An Assessment Study of the UNEP International Resource Panel . H . Schandl, M . Fischer-Kowalski, J . West, S . Giljum, M . Dittrich, N . Eisenmenger, A . Geschke, M . Lieber, H . P . Wieland, A . Schaffartzik, F . Krausmann, S . Gierlinger, K . Hosking, M . Lenzen, H . Tanikawa, A . Miatto, and T . Fishman . Paris, United Nations Environment Programme .
UnitedNationsEnvironmentProgramme(UNEP)(2017a).Resourceefficiency:potentialandeconomicimplications.AreportoftheInternational Resource Panel . Ekins, P ., Hughes, N ., et al .
United Nations Environment Programme (UNEP) (2017b) . Resource requirements of future urbanisation . A report for the International Resource Panel Cities Working Group . Swilling, M ., Hajer, M ., Robinson, B ., et al (in review) .
United Nations Environment Programme (UNEP) and SETAC (2016) . Global Guidance for Life Cycle Impact Assessment Indicators Volume 1, United Nations Environment Programme .
United Nations Industrial Development Organization (UNIDO) (2013) . Green growth: from labour to resource productivity – best practice examples, initiatives and policy options . United National Industrial Development Organization .
United Nations Industrial Development Organization (UNIDO) & United Nations Environment Programme (UNEP) (2015) . National CleanerProductionCentres-20yearsofachievement.Availableat:http://www.unido.org/fileadmin/user_media_upgrade/What_we_do/Topics/Resource-efficient__low-carbon_production/NCPC_20_years.pdf.
United States Environment Protection Agency (US EPA) . Green servicizing for a more sustainable US economy: Key concepts, tools and analyses to inform policy engagement . Environmental Protection Agency of the United States, EPA530-R-09-006 . Washington DC .
United States Environment Protection Agency (US EPA) . U .S . EPA Sustainable materials management program strategic plan: Fiscal year 2017-2022 . Environmental Protection Agency of the United States . Available at www .epa .gov .
United States Environment Protection Agency (US EPA) (2017) . Air Pollution: Current and Future Challenges . United States Environmental Protection Agency . Available at: https://www .epa .gov/clean-air-act-overview/air-pollution-current-and-future-challenges .
United States Geological Service (USGS) S (2013) . Minerals Yearbook of China . United States Geological Society . Available: https://minerals .usgs .gov/minerals/pubs/country/2013/myb3-2013-ch .pdf .
United States Geological Service (USGS) (2017) . Cement Statistics and Information . United States Geological Society . Available: https://minerals .usgs .gov/minerals/pubs/commodity/cement/ .
Wang, D ., Zhang, L ., Zhang, Z ., Zhao, S . (2011) . Urban Infrastructure Financing in Reform-era China . Urban Studies, 48: 2975-2998 .
West,J.andH.Schandl(2013).MaterialuseandmaterialefficiencyinLatinAmericaandtheCaribbean.EcologicalEconomics94:19-27 .
West,J.,H.Schandl,F.Krausmann,J.Kovanda,andT.Hak(2014).Patternsofchangeinmaterialuseandmaterialefficiencyinthesuccessor states of the former Soviet Union . Ecological Economics 105: 211-219 .
Werner, S . (2017) . International review of district heating and cooling . Energy (in press) .
World Health Organization (WHO) (2016a) . Ambient air pollution: A global assessment of exposure and burden of disease . World Health Organization . Available at: http://apps .who .int/iris/bitstream/10665/250141/1/9789241511353-eng .pdf .
World Health Organization (WHO) (2016b) . WHO Global Urban Ambient Air Pollution Database . World Health Organization . Available at: http://www .who .int/phe/health_topics/outdoorair/databases/cities/en/ .
Wiedinmyer, C ., Yokelson, R ., Gullet, B . (2014) . Global Emissions of Trace Gases, Particulate Matter, and Hazardous Air Pollutants from Open Burning of Domestic Waste . Environmental Science and Technology, 48(16): 9523-9530 .
Wiedmann, T .O ., H . Schandl, M . Lenzen, D . Moran, S . Suh, J . West and K . Kanemoto (2015) . The material footprint of nations . Proceedings of the National Academy of Sciences 112(20): 6271–6276 .
Wijkman,A.,andSkånberg,K.(2015).TheCircularEconomyandBenefitsforSociety.Winterthur:ClubofRome.

A SYSTEMS APPROACH TO RESOURCE EFFICIENCY AND POLLUTION REDUCTION
99
References
Wilting, H .C ., Schipper, A .M ., Bakkenes, M ., Meijer, J .R ., and Huijbregts, A .J . (2017) . Quantifying biodiversity losses due to human consumption: a global-scale footprint analysis . Environmental Science and Technology 51: 3298-3306 .
Wilts, H ., K . James, N . von Gries (2014) . Capturing status, trends and impacts by reuse — an analytical framework . Prepared for the European Topic Centre on Sustainable Consumption and Production .
World Bank (2010) . Climate Risks and Adaptation in Asian Coastal Megacities: A Synthesis Report . Available: http://siteresources .worldbank .org/EASTASIAPACIFICEXT/Resources/226300-1287600424406/coastal_megacities_fullreport .pdf .
WorldBank(2011).Addressingclimatechangewithlowcostgreenhousing:Identificationoflowcostgreenoptionsandtheirmacro-environmental impact . World Bank . Available: http://siteresources .worldbank .org/FINANCIALSECTOR/Resources/Low_Cost_Green_Housing_Project_Report .pdf .
Waste and Resources Action Programme, United Kingdom (WRAP) (2013) . Household food and drink waste in the United Kingdom 2012 . ISBN: 978-1-84405-458-9 . Report prepared by Quested, T ., Ingle, R . and Parry, A .
Water Research Foundation (WRF) (2017) . Blueprint for One Water. Water Research Foundation . Available at: www .waterrf .org/PublicReportLibrary/4660 .pdf
WU . (2017) . Weather history for VIDP – January 2011 – December 2011 . Available: https://www .wunderground .com/history/airport/VIDP/2011/1/1/CustomHistory .html?dayend=1&monthend=12&yearend=2011&req_city=&req_state=&req_statename=&reqdb .zip=&reqdb .magic=&reqdb .wmo= .
Xue,L.,Liu,G.,Parfitt,J.,Liu,X.,vanHerpen,E.,Senmark,A.,O’Connor,C.,Östergren,K.,andCheng,Sh.(2017).Missingfood,missingdata? A critical review of global food losses and food waste data . Environ. Sci. Technol. 51 (12): 6618–6633 .
Zhang, C ., Chen, W-Q ., Liu, G ., and Zhu, D .-J . (2017) . Economic growth and the evolution of material cycles: an analytical framework integrating material flow and stock indicators . Ecological Economics 140: 265-274 .


The way in which societies use and care for natural resources fundamentally shapes the well-being of humanity, the environment and the economy. Better and more efficient use of natural resources can be one of the most cost-efficient and effective ways to reduce impacts on the environment, while also achieving the socio-economic objectives of international sustainable development and climate goals. Viable pathways exist for society to undertake such decoupling of economic growth from natural resource use and environmental impacts. But how can we get there?
Environmental and sustainability policies require a new evidence base that makes it possible to monitor the scale of the physical economy, that is - the amount of material, energy, water and land used and emissions generated in making, using and providing goods, services and infrastructure systems. This publication provides an assessment of the state, trends and outlook of global natural resource use, with a focus on material resources as part of the evidence base for policymaking for sustainable consumption and production. The report pinpoints seven strategies for system-wide pollution reduction and more sustainable resource use throughout the economy, including consideration of appropriate policy instruments and good practice examples from cities and countries around the world. A special feature on the link between resource use, infrastructure, air pollution and human health in cities is included.
ISBN: 978-92-807-3677-9
For more information, contact:Secretariat of International Resource Panel (IRP) Economy DivisionUnited Nations Environment Programme 1 rue Miollis Building VII 75015 Paris, France Tel: +33 1 44 37 14 50Fax: +33 1 44 37 14 74Email: [email protected]: www.resourcepanel.org
DTI/2141/PA
ASSESSING GLOBAL RESOURCE USEA systems approach to resource efficiency and pollution reduction
ASSE
SSIN
G G
LOBA
L RE
SOU
RCE
USE
- A
syst
ems
appr
oach
to re
sour
ce e
ffici
ency
and
pol
lutio
n re
duct
ion