assessing effects of egovernment initiatives based on a public
TRANSCRIPT
H.J. Scholl et al. (Eds.): EGOV 2012, LNCS 7443, pp. 246–259, 2012. © IFIP International Federation for Information Processing 2012
Assessing Effects of eGovernment Initiatives Based on a Public Value Framework
Øyvind Hellang and Leif Skiftenes Flak
Center for eGovernment, Department of Information Systems, University of Agder, Kristiansand, Norway
{oyvind.hellang,leif.s.flak}@uia.no
Abstract. Assessing effects of eGovernment initiatives is considered an important but challenging endeavor. Assessments are, among other things, important to justify e-government investments. They are challenging because they are complex, often based on locally defined indicators, many times over-emphasizing financial effects, imprecise, faced with a number of contingencies and very seldom validated. Consequently, effect assessments can be seen as imprecise and difficult to compare across different initiatives. This paper addresses some of the challenges by attempting to assess effects based on a public value framework through an action design study with a Norwegian government agency. Based on our findings, we suggest 5 design principles for adapting and using performance indicators for assessing effects from eGovernment initiatives.
Keywords: e-government, performance indicators, public value, interpretive evaluation of IS, eGEP measurement framework, action design research.
1 Introduction
In spite of the massive focus on technology fuelled public sector reforms, accurate documentation of effects is scarce [1, 2]. This is problematic, as further investments need justification to in order for new technology to be developed and implemented. Further, eGovernment investments are often justified based on locally defined indicators that make aggregation of effects almost impossible as effects are likely to be inconsistent and too diverse to compare. Hence, there is a need for a shared effect model allowing different organizations and projects to adopt the same indicators and thereby facilitate development of comparable data.
Challenges of assessing and measuring effects of IT/IS is well documented in the general IS literature [3-5]. Consequently, traditional or analytical evaluations of these effects have focused on summative financial descriptions based on conventional accountancy frameworks [6-8]. Measurement techniques in this approach often include Return on Investment, Internal Rate of Return, Net Present Value and Payback. These traditional evaluation techniques tend to focus rather narrowly on monetary effects and profit. The focus on profitability in existing methods makes direct transfer across sectors problematic and resulting in a need for custom models for the public sector [8].
Assessing Effects of eGovernment Initiatives Based on a Public Value Framework 247
The public sector is characterized by a more complex value structure than the private sector [9, 10]. Where private sector organizations are primarily occupied with ensuring and increasing profitability, public sector organizations need to balance their focus between e.g. transparency and accountability, equal treatment of all service recipients, promoting democratic participation – all in a cost efficient and legal manner.
These fundamental differences between the sectors have spurred initiatives to establish public and even eGovernment effect models that can be used both in planning (justification) and evaluation of eGovernment investments. Examples of such models are the eGovernment Economics Project (eGep) measurement framework [11] and to some extent OECD´s model for core data for public efficiency [12]. Of these, eGep appears to be the most comprehensive with 92 performance indicators organized in three high-level value categories. However, eGep has received little validation and it´s practical applicability is therefore uncertain.
This paper reports from an effort to apply eGep in a practical eGovernment setting. Our research objective has been to gain experience with readily available public value based indicator set(s) in practical use.
The remainder of the paper is organized as follows. First we present the eGep model and discuss the model in relation to public value and recent developments in the IS evaluation literature. Then we present Action Design Research and show how we used this approach to support our research objective. Finally, we present and discuss results and draw conclusions and implications.
2 Background
Our normative stance is that eGovernment effect measures should be aligned with the ideals of public value as discussed in the public administration literature. In this section we briefly present the theoretical ideals of public value, and discuss how the eGep measurement framework encompasses key elements of public value.
2.1 Public Value
Public value has been subject for many scholarly articles over many years. Public value discussions originate from the public administration literature [13, 14], but are starting appear also within the eGovernment community [15]. A recent study summarizes the discussions from both public administration and eGovernment fields and proposes that public value can be understood in the form of four value drivers; administrative efficiency, service improvement, citizen engagement and foundational values [16].
According to Rose and Persson [16], administrative efficiency can be described as positive cost benefit and can be expressed by three E values; efficiency, effectiveness and economy. Service improvement represents customer orientation in various forms, e.g. cost savings for citizens, better access to information and shorter response times. Citizen engagement is in part a democratic value as it promotes issues such as
248 Ø. Hellang and L.S. F
participatory policymakinginclude issues such citizefoundational value represetransparency, accountabilityissues in the context of eGo
2.2 eGep
The eGep measurement freGovernment services [11national methodologies (e.methodology) and consideEurope.
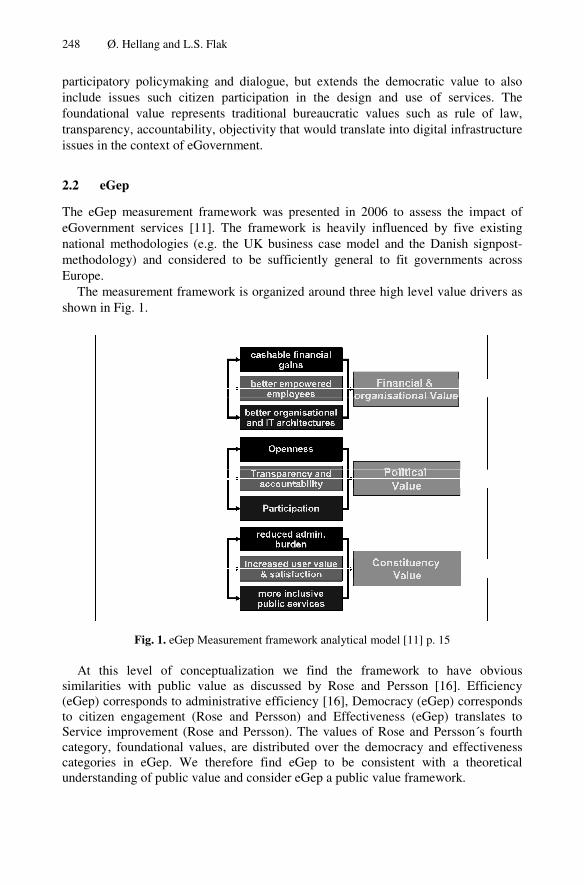
The measurement frameshown in Fig. 1.
Fig. 1. eGep M
At this level of concesimilarities with public va(eGep) corresponds to admto citizen engagement (RoService improvement (Roscategory, foundational valucategories in eGep. We tunderstanding of public val
Flak
g and dialogue, but extends the democratic value to an participation in the design and use of services. T
ents traditional bureaucratic values such as rule of ly, objectivity that would translate into digital infrastructovernment.
amework was presented in 2006 to assess the impact]. The framework is heavily influenced by five existg. the UK business case model and the Danish signpo
ered to be sufficiently general to fit governments acr
work is organized around three high level value driver
easurement framework analytical model [11] p. 15
eptualization we find the framework to have obvialue as discussed by Rose and Persson [16]. Efficie
ministrative efficiency [16], Democracy (eGep) correspoose and Persson) and Effectiveness (eGep) translatese and Persson). The values of Rose and Persson´s fouues, are distributed over the democracy and effectiventherefore find eGep to be consistent with a theoretlue and consider eGep a public value framework.
also The law, ture
t of ting ost-ross
s as
ious ency onds s to urth ness tical

Assessing Effects of eGovernment Initiatives Based on a Public Value Framework 249
3 Action Design Research Method
Our study was carried out as an Action Design Research (ADR) effort [17] as this approach is consistent with our ambition of influencing practice directly by trying out a public value based indicator set in a practical setting. ADR consists of four stages with seven principles (Fig. 2) that have guided our research and framed our discussion later. This participatory design research incorporates intervention through instantiations of a design artifact into organizational contexts. The information technology artifact in ADR is viewed as an ensemble artifact. ADR emphasizes the need to integrate intervention and evaluation in the organization when building the design artifact in an iterative cycle of Building, Intervention, and Evaluation (BIE).
Fig. 2. ADR method: Stages and Principles [17] pp. 41
Action Design Research incorporates the guided emergence of the artifact from interventions inspired by Action Research, without separating the actions of designing and intervening in different stages [17].
3.1 A Theory-Ingrained Artifact
The measured the state of, or the estimated future state of, any aspects of an organization’s value creation (e.g. processes, services, business units) can be described by performance indicators. Our empirical research is centered on an ensemble artifact of performance indicators (content), description of the eGovernment initiative (context), and their use in the assessment (process) of effects from eGovernment initiative [18].

250 Ø. Hellang and L.S. F
eGovernment indicator smaterial and organizationatechnology-based designs, innovation where performapolicies and work practic22].Following the principlingrained research for the rtheory in the artifact which efforts. Our research is motthe effects of eGovernmeframework can be seen as the public value framework
3.2 Organizational Dom
The nature of the ensembleof the problem domain, leadprocess of BIE, where thintervention (Sein et al. 201
Fig. 3. The Generic
Eventual problems are adof the artifact. Generalized iterations are formed from problems, and the specific sdesign effort is to formulcontext. Design principles process of building these solutions [17].
Flak
sets are viewed as ensemble design artifacts incorporatal features [17, 19]. They are not required to be purbut can have organizational intervention as the source
ance indicators and their influence on public organizatioes are viewed as an ensemble design artifact [17, les of ADR we emphasize the importance of practiresearch’s relevance to practice, and also the ingrainingis the basis for distinguishing ADR from traditional des
tivated by the expressed need from practitioners to measent initiatives. We argue that the eGep measurema theory ingrained artifact as it is seen as consistent w
k proposed by Rose and Persson [16].
minant BIE
e artifact, and need to instantiate the artifact in the contd us to choose an organizational dominant (Fig. 3) iterathe primary source of innovation is the organizatio11).
c Schema for Organization-Dominant BIE [17] pp. 43
ddressed by the iterative instantiations of different versioutcomes from the evaluation and reflection from the Bcasting the problems in this specific context into a classolutions into a class of solutions. Yet, the main goal of ate design principles from the specific solutions in are statements reflecting the knowledge gained from solutions, or other instances belonging to this class
ting rely e of ons, 20-ice-g of sign sure
ment with
text tive onal
ions BIE s of
f the this the
s of

Assessing Effects of eGovernment Initiatives Based on a Public Value Framework 251
4 ADR Case
Different digital solutions for receiving written correspondence from citizens and businesses have existed for several years, and some public organizations have also developed solutions for digital replies. The Norwegian government wanted to evaluate whether or not a shared digital solution supporting such to-way communication would be more socio-economically sound.
The Agency for Public Management and eGovernment (Difi) was in 2010 tasked by the Ministry of Government Administration, Reform and Church Affairs (FAD) to provide a business case comparing different alternatives for two-way digital communication between public organizations and citizens/businesses. The next section describes the case as it unfolded from 2010-2011 based on the ADR stages (Fig. 2).
5 ADR Stages – Assessing Effects of Public Digital communication
This ADR effort followed the stages with related principles outlined by the ADR method, that capture the underlying assumptions, beliefs, and values that have guided our research.
5.1 Stage 1 Problem Formulation
Difi wanted a methodical approach, including recommended performance indicators, to find and estimate the socio-economic effects of different alternatives for public digital communication. Research Council Norway has funded a project on the use of technology supporting interoperability in the public sector called Semicolon. One result from this project was a method for eGovernment socio-economic analyses including an adaptation of the eGep measurement framework to fit a Norwegian context, such as the Norwegian quality assurance approach [23] and general method for socio-economic analyses [24, 25]. This paper focuses on this performance indicator set and its use in this case as the original version of the ensemble design artifact.
Table 1. ADR team members and end-users, roles and activities

252 Ø. Hellang and L.S. Flak
Researchers and practitioners in this project were asked by Difi to use this adapted method and performance indicator set in a combined effort to create the necessary decision support documents requested by the ministry. An ADR team was formed (Table 1) consisting of two practitioners from Difi together with one supporting staff member from Semicolon, in addition to the authors.
The goal of the first stage was to determine the needs and possibilities regarding communication between public organizations and citizens/businesses. This was performed through a small set of survey questions to citizens and ten workshops covering eight state level agencies and two municipalities. One result from this investigation was the initial definition of three alternatives for public digital communications:
1. Message Hub: the government developing a new shared infrastructure 2. Private service: outsourcing similar functionality to private service providers 3. Status Quo: leave agencies and municipalities to develop their own solutions
This investigation into the needs and possibilities for public digital communications also identified benefits that the public organizations, and to some extent citizens and businesses wanted to see. The ADR team decided to use insights from the investigation to evaluate the performance indicators in the original Semicolon set.
The original Semicolon performance indicator set was based on a sub-set of the 92 indicators described in the eGep measurement framework. This adaptation of the eGep performance indicator set into 39 indicators still covered all three value drivers of the effect model and thus also still consistent with the public value framework proposed by Rose and Persson [16].
5.2 Stage 2 Building, Intervention, and Evaluation
Based on the evaluation of the findings in the Problem Formulation stage the ADR team chose to refine the original performance indicator set. The starting point of this stage was the original version 1 of the Semicolon performance indicator set, which was developed instantiated and evaluated in two iterations, resulting in an Alpha and a Beta version of the artifact (see Fig. 4).
1. Iteration: Alpha Version. The first BIE iteration started with the researchers in the ADR team evaluating the performance indicators compared to the eGovernment initiative, and the team’s understanding of the context from the problem formulation stage. Some changes were suggested based on the indicators relevance to the eGovernment initiative in the case, such as very specific indicators (e.g. indicators narrowly focused on chemical wastes). Five indicators were removed and five indicators had changes made to their description/definition. Difi provided an additional list over indicators compiled based on their earlier experience. The ADR team compared and in part accommodated this list with the coverage of performance indicators in the artifact.

Assessing Effects of eGovernment Initiatives Based on a Public Value Framework 253
At the same time the ADR team supported Difi’s work on detailing the alternatives for public digital communication, so that the end-users could relate better to the implications of the different alternatives. These activities helped the team to create a shared understanding of the different possible types of effects from the alternatives. The resulting Alpha version of the artifact, now with 35 performance indicators, needed to be instantiated with end-users to enhance the formative evaluation of the artifact. Consequently, a pilot in one municipality was carried out.
Difi provided a document describing the details in the three alternatives for public digital communication based on the input from the investigation in the Problem Formulation stage and inputs from the ADR team. This was sent together with the Alpha version of the performance indicator set in the format of a table in a spreadsheet and instructions on creating estimates for each indicator to one municipality.
This first instantiation of the Alpha version of the artifact (Fig. 4) was observed and transcribed by the ADR team. Three public communication professionals (ICT consultant, head of archives and vice-chief administrative officer) used a half-day workshop to discuss and attempt to create estimates in light of the three alternatives presented in the documents. This instantiation showed issues regarding unclear descriptions of the indicators, and issues concerning the amount of effort needed to create estimates even when only estimating a few service areas of the municipality. Both the number of indicators and the complexity of estimating effects were contributing to the end-users frustration. Even simple impacts of the alternatives for digital public communication on the daily mail handling routines led the participants to do simplified process analyses with a number of assumptions that were not covered by the detailed alternatives (e.g. security issues and non-repudiation). The end-users wanted more details on the changes that their organization would experience. “This is an aspect where the proposed alternatives have been simplified. This is unacceptable for us! We need to know how they expect us to solve this little part of the system.” – ICT consultant commented on integration with the local case handling system
The ADR team discussed the feedback from the end-users, which addressed these main points:
• Too many indicators • Unclear descriptions of indicators • Confusing table format and content in the description of the alternatives
The ADR team decided to refine the performance indicator set based on the evaluation during this first instantiation. The experiences from the pilot lead to a reassessment of the structure of the artifact, such as the scope of effects, the number of indicators, descriptions of indicators, and the existing table-based presentation format.
2. Iteration: Beta Version. Due to the complexity of the proposed alternatives for two-way public digital communication, the scope of the estimates was reduced to encompass only out-going messages from public organizations to citizens and

254 Ø. Hellang and L.S. Flak
businesses. The number of indicators was reduced to 13 indicators for expected effects for the public organizations and an additional 17 indicators for expected external effects for citizens and businesses. For this first large scale instantiation of the indicator sett, one indicator was obligatory and required an estimate. This main indicator was the number of out-going messages the agencies had today, and which communication channels were used for these messages.
This clear-cut and scoped selection of indicators had an emphasis on more easily measurable quantitative indicators was intended to provide an indication of possible effects from a digitalized channel of communication without encountering many of the issues experienced in the pilot. These changes were done to the Alpha version of the performance indicator set which was transferred from a table format to an online questionnaire format, resulting in a new Beta version of the artifact.
The Beta version was instantiated through a questionnaire sent to the contacts provided by Difi (e.g. CIOs and department heads for communication) for 14 public organizations including the original participating organizations from the problem formulation stage. The ADR team received full feedback from seven state agencies and supplemental feedback (e.g. number of out-going messages) from one agency.
Earlier estimates of the yearly number of out-going messages have been suggested to be 47 million in total [26]. Results from the questionnaire showed that there are over 70 million out-going messages sent by ordinary mail every year (not including e-mail or other channels) just from these eight respondents. The state level agencies in Norway number about 800 agencies in all [27].
The respondents were asked to evaluate the cost of each out-going message compared to the government’s average estimates of 2.7 EUR per ordinary postage and 0.4 EUR per electronic transfer [28]. Results from the questionnaire showed a mixed evaluation for the cost of ordinary postage, depending on the degree of process automation or outsourcing of handling and arrangements for postage. An estimate using the average numbers as-is indicates a saving in cost of 2.3 EUR per digitized out-going message. This shows a potential of over 160 million EUR a year when considering only the volume from the eight agencies. It is easy to assume that the total cost saving potential on the state level alone, with its 800 agencies, would be much higher.
Each respondent was also contacted by phone and was questioned about the process of creating estimates and their initial evaluation of the performance indicators. Half of the respondents reported that they had trouble providing estimates for the main indicator: number of out-going messages per year. This surprised the team as it was considered a tangible quantitative indicator. One main issue reported was the need to involve several people from different sub-departments, including archives, to get an overview over the different types of out-going messages and estimates for each type.
These results, and our experience with the use of the performance indicator set were reported to Difi for their use in the decision support documents to be sent to the ministry as the exit criteria of the BIE iterations. The scope of effects estimated with the performance indicator set was not comprehensible enough for Difi’s goal of a socio-economic analysis of the three approaches to digital communication. They did

Assessing Effects of eGovernment Initiatives Based on a Public Value Framework 255
not reach the objective of establishing necessary information for the ministry to reach a decision.
5.3 Stage 3 Reflection and Learning
The ADR team’s initial understanding of the context from the Problem Formulation stage and the evaluation of the iterations in the BIE stage followed a concurrent stage of Reflection and learning. The researchers in the team had an initial understanding of the performance indicator set as it related to the eGep framework. From the Problem Formulation stage we cast Difis problem with assessing different approaches to digital communication as an instance of assessing effects of eGovernment initiatives as a class of problems. The adaptation and use of the original Semicolon performance indicator sett based on eGep was a solution to the specific problem Difi was facing, cast as an instance of performance indicator sets for eGovernment effects as a class of solutions.
Inputs from practitioners for the Alpha version, such as the Difi list of indicators, were compared to the same eGep framework adjusting the indicator set to the context. The end-users in one municipality used the indicators and provided their perspectives on the artifact. This early evaluation of the Alpha version in the 1st iteration showed the ADR team the importance of a shared understanding of the performance indicators and the context in which these were to be applied.
This formative evaluation led to a major revision for the Beta version, including reducing the number of indicators in total, and requiring only an estimate for one main indicator (the number of out-going messages). Outcomes of this more summative evaluation showed that even an estimate for a tangible quantitative performance indicator required enough coordination efforts and time resulting in several agencies to opt out of contributing to the business case. Together with goals and scope changes in the assessment process changing over time, the resulting report was not enough to ensure a decision in the ministry.
5.4 Stage 4 Formalization of Learning
Reflection on the design efforts in the case uncovered several problems for this specific assessment of approaches to digital communication, which in turn can be related to the assessing the effects of eGovernment initiatives as a class of problems:
• Performance indicators had very general and unfamiliar definitions, which led to a difficulty in application of the indicators.
• The description of the suggested eGovernment initiative was lacking important details that lead to uncertain assumptions in the assessment.
• Performance indicators and the description of the eGovernment initiative were developed apart, and were not viewed as a whole until end-users were to assess the approaches.
• The assessment goals and scope changed over time and were not clearly communicated up-front, contributing to insufficiencies in the resulting decision documents.

256 Ø. Hellang and L.S. Flak
• End-users and managers did not have a shared understanding of the indicators, change context, and assessment process, leading to misunderstandings.
Our learning from experiencing these problems and trying to solve them using a performance indicator set can be related to performance indicator sets for eGovernment effects as a class of solutions. We have described this learning in the form of proposed design principles (Table 2) which are prescriptive statements for building this or other instances of the class of solutions [17].
Table 2. Design Principles
An overview of the BIE stage including start and exit criteria, summarizes the participatory design efforts and contributions of this case (Fig. 4). The contributions reflect learning from successes and mistakes of developing, instantiating and evaluating the ensemble artifact of performance indicators as content, change context description, and the assessment process including application of indicators and the use of the resulting measures [18].

Assessing Effects of eGovernment Initiatives Based on a Public Value Framework 257
Fig. 4. Organization-Dominant BIE in the Difi case (based on [17] pp. 43)
6 Conclusion
This paper has provided experiences from a Norwegian effort to use readily available performance indicator set(s) in a practical setting. Results from this effort uncovered several issues when applying a standardized set of performance indicators on very diverse public services. Based on our active involvement as part of an ADR team we formulated five design principles that can guide future design and instantiations of similar artifacts namely Simplicity, Precision, Pragmatism, Realism and Shared understanding. Further research can refine the proposed design principles or add additional principles based on the assessment of effects from eGovernment initiatives as the class of problems and performance indicator sets as the class of solutions.
Principles from the recently proposed ADR method guided our design and assessment of the indicator set together with practitioners from Difi and the validation through instantiations by public organizations in Norway. We found the method very useful for providing researchers and practitioners with the required structure to collaborate on practical problem solving and suggest that the method has a strong potential in a practical and interdisciplinary field such as eGovernment.
Acknowledgements. This research was part of the Semicolon II Project supported by Research Council of Norway.
References
1. Flak, L.S., Dertz, W., Jansen, A., Krogstie, J., Spjelkavik, I., Ølnes, S.: What is the value of eGovernment - and how can we actually realize it? Transforming Government: People, Process and Policy 3(3), 220–227 (2009)

258 Ø. Hellang and L.S. Flak
2. Jenner, S.: Realising Benefits from Government ICT Investment: a Fools Errand? Academic Publishing International Ltd. (2009)
3. Smithson, S., Hirschheim, R.: Analysing information systems evaluation: another look at an old problem. European Journal of Information Systems 7(3), 158 (1998)
4. Irani, Z., Love, P.E.D.: Developing a frame of reference for ex-ante IT/IS investment evaluation. European Journal of Information Systems 11(1), 74–82 (2002)
5. Irani, Z., Gunasekaran, A., Love, P.E.D.: Quantitative and qualitative approaches to information systems evaluation. European Journal of Operational Research 173(3), 951–956 (2006)
6. Serafeimidis, V., Smithson, S.: Information systems evaluation as an organizational institution – experience from a case study. Information Systems Journal 13(3), 251–274 (2003)
7. Stone, D.N.: Assumptions and Values in the Practice of Information Systems Evaluation. Journal of Information Systems 4(3), 1–17 (1990)
8. Irani, Z., Love, P.E.D., Elliman, T., Jones, S., Themistocleous, M.: Evaluating e-government: learning from the experiences of two UK local authorities. Information Systems Journal 15(1), 61–82 (2005)
9. Boyne, G.A.: Public and private management: What’s the difference? Journal of Management Studies 39(1), 97–122 (2002)
10. Bretschneider, S.: Management-Information-Systems in Public and Private Organizations - an Empirical-Test. Public Administration Review 50(5), 536–545 (1990)
11. Codagnone, C., Boccardelli, P.: eGovernment Economics Project (eGEP) - Measurement Framework Final Version, 2006, European Commission, p. 67 (2006)
12. Lonti, Z., Woods, M.: Towards government at a glance: Identification of core data and issues related to public sector efficiency. In: OECD Working Papers on Public Governance (2008)
13. Moore, M.H.: Public value as the focus of strategy. Australian Journal of Public Administration 53, 296–303 (1994)
14. Moore, M.H.: Creating public value: Strategic management in government. Harvard University Press (1995)
15. Persson, A., Goldkuhl, G.: Government Value Paradigms - Bureaucracy, New Public Management, and E-Government. Communications of the AIS 27, 45–62 (2010)
16. Rose, J., Persson, J.S.: E-government value priorities of Danish local authority managers. In: Rose, J., Persson, J.S., Kræmmergaard, P., Nielsen, P.A. (eds.) IT Management in Local Government: the DISIMIT Project. Software Innovation, Aalborg, pp. 27–56 (2012)
17. Sein, M.K., Henfridsson, O., Purao, S., Rossi, M., Lindgren, R.: Action design research. MIS Quarterly 35(1), 37–56 (2011)
18. Stockdale, R., Standing, C.: An interpretive approach to evaluating information systems: A content, context, process framework. European Journal of Operational Research 173(3), 1090–1102 (2006)
19. Orlikowski, W.J., Iacono, C.S.: Research Commentary: Desperately Seeking the IT in IT Research. A Call to Theorizing the IT Artifact. Information Systems Research 12(2), 121–134 (2001)
20. Boland, R.J.: Design in the Punctuation of Management Action. Managing as Designing: Creating a Vocabulary for Management Education and Research. In: Boland, R. (ed.) Frontiers of Management Workshop, Weatherhead School of Management, June 14-15 (2002)
21. Boland, R.J.: Design in the Punctuation of Management Action. In: Collopy, F., Bolland, R.J. (eds.) Managing as Designing. Stanford Business Books, Standford (2004)
Assessing Effects of eGovernment Initiatives Based on a Public Value Framework 259
22. Hevner, A.R., March, S.T., Park, J., Ram, S.: Design science in information systems research. MIS Quarterly 28(1), 75–105 (2004)
23. Ministry of Finance (Norway). Det sentrale styringsdokumentet (2008), http://www.concept.ntnu.no/Publikasjoner/Veileder/Veileder%20nr%201%20Det%20sentrale%20styringsdokumentet.pdf (cited March 2012)
24. SSØ - Senter for statlig økonomistyring, Håndbok for samfunnsøkonomiske analyser, Senter for statlig økonomistyring, Oslo (2010)
25. SSØ - Senter for statlig økonomistyring, Gevinstrealisering - En innføring i planlegging og oppfølging av gevinster, Senter for statlig økonomistyring, Oslo (2010)
26. Rambøll Management AS, Utredning – Offentlig Elektronisk Meldingsboks - Ref 70192482, Ministry of Government Administration, Reform and Church Affairs, Oslo (2008)
27. NSD - Norsk samfunnsvitenskapelig datatjeneste AS. Antall enheter per COFOG (2011), http://www.nsd.uib.no/polsys/data/forvaltning/cofog (cited March 2012)
28. Difi – Direktoratet for forvaltning og IKT, En felles meldingsboks - Rapport 2011: Agency for Public Management and eGovernment (Difi), Oslo (July 2011)