assessing differential health vulnerability of the slums in chandigarh,internationales asienforum...
TRANSCRIPT
1nternationales Asienforum. Vol. 43 (2012). No. 1-2. pp. 81-98
Assessing Differential Health Vulnerability
of the Slums in Chandigarh, India
SUBHAKANTA MOHAPATRA
Introduction
Urban health in developing countries is one of the most important global health issues of the 2 1 st century. Vlahov et. a!. cite three important trends which have a significant impact on urban health. These factors are: (i) more and more people will move to urban areas; (ii) slums will house a higher proportion of the world's poor - with profound implications for health and (iii) expanding megacities and conurbations have a deep impact on the environment and buman health (Vlabov et a!. 2007: 1 1 6). This hyper-urbanization in the developing world has outpaced the ability of governments to provide essential infrastructure. As a result, unplanned urbanization has led to a humanitarian crisis that has consequences for the health of all citizens in cities. However, in this crisis the urban poor suffer disproportionately. Unfortunately, the data on the health of urban populations is usually available only in an aggregated form: it is seldom disaggregated across different wards or townships. The statistics thus hide the health conditions of the urban poor and, in particular, people living in slums.
If we critically analyze the major determinants of health in urban settings - as analyzed by various researchers, health practitioners and administrators - we see that the remedies or solutions lie beyond the health sector. These underlying factors are also referred to as social determinants. They strongly influence health status and are often perceived as "causes behind the causes" (WHO 2005). These determinants include "the lifelong importance of health determinants in early childhood, and the effects of poverty, drugs, working conditions, unemployment, social support, good food and transport policy" (Marmot & Wilkinson 2003: 7). It has been aptly said that "Health inequities are the result of the circumstances in which people grow, live, work and age, and the health systems they can access -(health systems) which in turn are sbaped by broader political, social and economic forces" (WHO 20 I 0: XIII).
82 Subhakanta Mohapatra
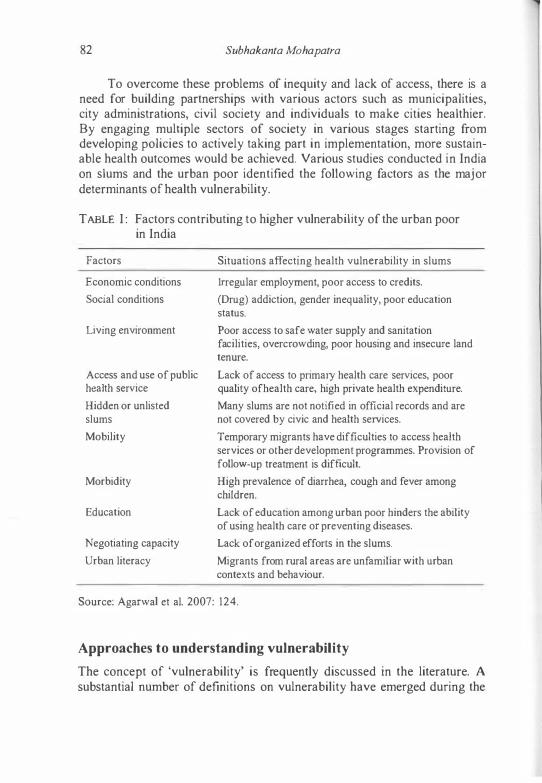
To overcome these problems of inequity and lack of access, there is a need for building partnerships with various actors such as municipalities, city administrations, civil society and individuals to make cities healthier. By engaging multiple sectors of society in various stages starting from developing policies to actively taking part in implementation, more sustainable health outcomes would be achieved. Various studies conducted in India on slums and the urban poor identified the following factors as the major determinants of health vulnerability.
T ABLE I : Factors contributing to higher vulnerability of the urban poor in India
Factors
Economic conditions
Social conditions
Living environment
Access and use of public health service
Hidden or unlisted slums
Mobility
Morbidity
Education
Negotiating capacity
Urban literacy
Situations affecting health vulnerability in slums
Irregular employment, poor access to credits.
(Drug) addiction, gender inequality, poor education status.
Poor access to safe water supply and sanitation facilities, overcrowding, poor housing and insecure land tenure.
Lack of access to primary health care services, poor quality ofheaith care, high private health expenditure.
Many slums are not notified in official records and are not covered by civic and health services.
Temporary migrants have difficulties to access health services or other development programmes. Provision of follow-up treatment is difficult.
High prevalence of diarrhea, cough and fever among children.
Lack of education among urban poor hinders the ability of using health care or preventing diseases.
Lack of organized efforts in the slums.
Migrants from rural areas are unfamiliar with urban contexts and behaviour.
Source: Agarwat et al. 2007: 124.
Approaches to understanding vulnerability
The concept of 'vulnerability' is frequently discussed in the literature. A substantial number of definitions on vulnerability have emerged during the

Assessing Differential Health Vulnerability of the Slums in Chandigarh 83
last three decades. Major contributions to the development of the concept of vulnerability have been made by Chambers, Downing, Bohle, Wisner, Adger, Turner and Cutter (see Cutter 1996). The term has different meanings not only across the discipline but also in respect to size and scale. Simultaneously, the concept of vulnerability has been evolved over the years from a unidimensional concept - of one internal risk factor - to a multi-structural and multi-dimensional concept (see Figure 1 in Birkmann & Wisner 2006: 1 1 ). Turner et a1. (2003) defined vulnerability as "the degree to which a system, subsystem or system component is likely to experience harm due to exposure to a hazard, either to a perturbation or stress or stressors." In the perspective of climate change research, the Third Assessment Report of the IPCC has defined it as, "The degree to which a system is susceptible to, or unable to cope with, adverse effects of climate change, including climatic variability and extremes. Vulnerability is a function of the charactcr, magnitude and rate of climate change and variation to which a system is exposed, its sensitivity, and its adaptive capacity" (McCarthy et aI., 200 1 : 995). The Human Development Report 2007 described 'vulnerability' in the context of climate change as, "an inability to manage risk". In a different context, geographers and demographers coined the term socio-demographic vulnerability.
Research has shown that this variant is useful in empirical studies at the local and regional level - particularly for neighborhoods, communities andlor cities. Their definition generally focuses on how socio-demographic characteristics reduce or enhance risk from various kinds of exposure. Therefore, family demographics such as the size of the family, the age, sex, migrant status, life cycle status, educational attainment, and mobility patterns of its members, as well as the social networks in which they live their lives, become central and generate opportunities for responding to environmental risk. Demographers stress three constitutive components of vulnerability: ( 1 ) the existence ofa risk; (2) the incapacity to respond to the risk; and (3) the inability to adapt to the hazard (Hogan & Marandola 2008: 44). This standpoint defines vulnerability as essentially negative i.e. it equates vulnerability with incapacity and inability. Other scientists, mostly geographers, prefer to concentrate on places instead of social groups. They perceive, define and analyze marginalized places as "critical" spaces. In short, among several demographers and geographers there has emerged an integrated concept - vulnerable people and critical spaces (Cutter Mitchell & Scott 2000; Turner et a1. 2003).
This makes it necessary to develop composite indicators of vulnerabilities which include bio-physical, socio-economic and institutional indicators. They are thus related to both people and places. "Indicators are nominally countable or ordinally-scaleable characteristics or properties that bear
84 Subhakanta Mohapatra
a functional relationship to the hazard, exposure of people or property or livelihoods, or the impacts of exposure. A proxy is likewise countable or scaleable, but does not bear a functional relationship to hazard, exposure or impact." (Birkmann & Wisner 2006: 16)
In this paper, health vulnerability is expressed as the likelihood of being affected by a situation or substance or both. This can happen either as a result of susceptibility to the effects of these situations, substances or as a result of excessive exposure.
Geographical background of the study area
This study was conducted at Chandigarh in the year 2009-2010. Chandigarh is a Union Territory (UT), located in the north-western part of India. In India, a Union Territory, like a state, is a sub-national administrative division. The only difference between a State and a UT is that states have their own elected governments, whereas Union Territories are directly governed by the Union Government of India. Chandigarh UT is a small and compact territory with an area of 1 14 sq. km and 900,635 people (78 percent in urban, 1 2 percent in slum, and 1 0 percent in rural areas) (Census of /ndia 200 I ). The city is surrounded by the state of Punjab from three sides and the state of Haryana from one side. Therefore, the city is compact and does not have any scope for further expansion which is very important as far as any planning is concerned. Chandigarh is also the capital of both the states of Punjab and Haryana. There are 56 city sectors, 1 5 slums, and 23 villages (Census of India 200 I). But today, according to the Chandigarh administration and other government documents, there are 1 3 slums. While collecting data for 201 1 , the Census of India recognized that there are 1 2 slums. Therefore, in this study, fieldwork was conducted on those 1 2 slums as recognized by the 201 1 Census of India (this information was obtained from Census officials in an informal discussion).
There have been conflicting reports about the number of slums and slum populations. Various reports (Municipality Corporation Chandigarh 2010; Rao & Thakur 2007) estimated that one-third of the urban popUlation of Chandigarh reside in slums, contrary to the Census of India (200 I) estimation of 12 percent. As per the available data, the number of people living below the poverty line was 94,485 as per census 200 I and most of them are residing in slums and squatter settlements. In the absence of a clear policy to address their problems, the slum populations suffer from many inadequacies in terms of the access to basic services and the fulfillment of socio-economic needs. This is in contrast to an ambitious declaration by the Chandigarh administration to make the city free of slums.
Assessing Differential Health Vulnerability of the Slums in Chandigarh 85
As far as health facilities are concerned, Chandigarh city has a wide network of public health facilities. These include three hospitals, two community health centers, one polyclinic, one employee state insurance hospital, 25 civil dispensaries, seven ayurvedic dispensaries, five homeopathic dispensaries and five urban family welfare centres. Nine dispensaries and 1 3 sub health centres are serving the rural areas of Chandigarh (Census of India 200 1). Apart from an Employee State Insurance Hospital and a Post Graduate Institute of Medical Education and Research (popularly known as PGI), all the other institutes are managed and administered by the Directorate of Health Services, Chandigarh administration. The Municipal Corporation Chandigarh controls the post of the Medical Officer of Health who looks after the public health and the environmental sanitation in the city. Urban slums are equally placed under the Municipal Corporation. There is also a strong presence of private and NGO health services (Municipality Corporation Chandigarh 2010).
Growth of slums and slum population in Chandigarh
Slum sertlements in Chandigarh have multiplied over the past six decades of its creation and the living conditions of the poor have continued to deteriorate over the years (Municipality Corporation Chandigarh 2010). Slums are scattered around the periphery of the city, with high population densities. It is estimated that more than 90 percent of these slums are on government land, and that the rest extend on lands belonging to various farmers. Environmental decline. vehicular pollution. inadequate basic services and infrastructure are some of the factors that hit the slum population the hardest (Municipality Corporation Chandigarh 20 I 0). "Colony No. 5" located in Sector 50 is the biggest slum area of the city having more than 10,000 houses. It is followed by Colony No. 4, Ambedkar Colony and Bapu Dham.
Socio-economic characteristics of slum population communities
The slum populations in Chandigarh are more or less homogeneous in terms of their religion, place of migration and language. Hindus constitute a majority - there is only a minority of Muslims, migrants from Uttar Pradesh and Bihar. The language predominantly spoken in the slums of Chandigarh is Hindi - not Punjabi. These people have migrated to Chandigarh from the east in search of jobs. They are mostly engaged as construction workers, masons, fitters, electricians, "helpers" and many other "infonnal sector workers".
The Chandigarh administration and Municipal Corporation has been making efforts from time to time to provide protected water supplies, common toilet blocks, sartitation etc. Every slum in Chandigarh is provided with
86 Subhakanta Mohapatra
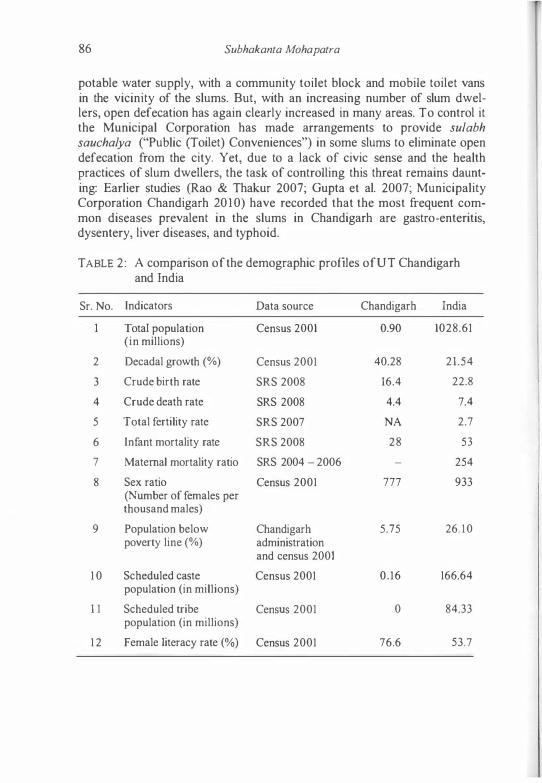
potable water supply, with a community toilet block and mobile toilet vans in the vicinity of the slums. But, with an increasing number of slum dwellers, open defecation has again clearly increased in many areas. To control it the Municipal Corporation has made arrangements to provide sulabh sauchalya ("Public (Toilet) Conveniences") in some slums to eliminate open defecation from the city. Yet, due to a lack of civic sense and the health practices of slum dwellers, the task of controlling this threat remains daunting: Earlier studies (Rao & Thakur 2007; Gupta et al. 2007; Municipality Corporation Chandigarh 20 I 0) have recorded that the most frequent common diseases prevalent in the slums in Chandigarh are gastro-enteritis, dysentery, liver diseases, and typhoid.
TABLE 2: A comparison of the demographic profiles of UT Chandigarh and India
Sr. No. Indicators Data source Chandigarh India
Total population Census 2001 0.90 1028.61 (in millions)
2 Decadal growth (%) Census 2001 40.28 21.54
3 Crude birth rate SRS 2008 16.4 22.8
4 Crude death rate SRS 2008 4.4 7.4
5 Total fertility rate SRS 2007 NA 2.7
6 Infant mortality rate SRS 2008 28 53
7 Maternal mortality ratio SRS 2004 - 2006 254
8 Sex ratio Census 2001 777 933 (Number of females per thousand males)
9 Population below Chandigarh 5.75 26. 10 poverty line (%) administration
and census 2001
1 0 Scheduled caste Census 2001 0.16 166.64 population (in millions)
1 1 Scheduled tribe Census 2001 0 84.33 population (in millions)
12 Female literacy rate (%) Census 2001 76.6 53.7
Assessing Differential Health Vulnerability oJ the Slums in Chandigarh 87
Ifwe look at the general demographic, socio-economic and health profile of Chandigarh as compared to India's national average, we can see that Chandigarh fairs better than the national average (see Table 2). However, these figures are misleading because we do not have segregated data for the slum population. Various studies conducted on different demographic, socioeconomic and health aspects revealed instead that Chandigarh is as worse as any other urban center of India (Rao & Thakur 2007; Gupta et al. 2007).
Database and methodology
This study was carried out in all the 1 2 slums of Chandigarh. The Chandigarh administration adopted the definition of slums as given in the 200 I Census: "a compact area of at least 300 population or about 60-70 households of poorly built, congested tenements in unhygienic environment usually with inadequate infrastructure and lacking proper sanitary and drinking water facilities - or a resettlement colony" (Census ofIndia 200 I).
A rapid survey method was used for "health vulnerability profiling" of the 12 slums. A questionnaire was developed to collect information for assessing the socio-demographic factors that make the slums vulnerable. Initially, the field investigator conducted interviews with selected households out of the total 1 2 slums. About 5 percent of the households were selected from each slum - except Colony No. 5 and 4. These are the two largest slums of Chandigarh. Here, only 3 percent of the total households were interviewed. The sample households were selected at random. A total number of 854 households were interviewed and surveyed.
Apart from this interview-based survey, intensive discussions were held with 50 key informants. Key informants were persons who had firsthand knowledge about their community. In this study key informants were local leaders, persons from the Health Department and the Municipality Corporation, NGO representatives, doctors and health workers. These informants, with their knowledge and understanding, provided insights into the nature of health problems and they could suggest various remedial measures. An open-ended interview schedule was also developed to record the discussions with the above mentioned key informants. Since the city is, for Indian standards, not very big and slums are few as well as accessible, the investigator himself visited all the slums several times over a two year period. He was thus able to observe and discuss with the various sections of the population. Therefore, participant observation was also employed in this study. In addition, documents published by various departments like the Municipality Corporation, the Health Department and documents related to
88 Subhakanta Mohapatra
the overall city plarming were also analyzed - to assess the gap between official rhetoric and everyday reality.
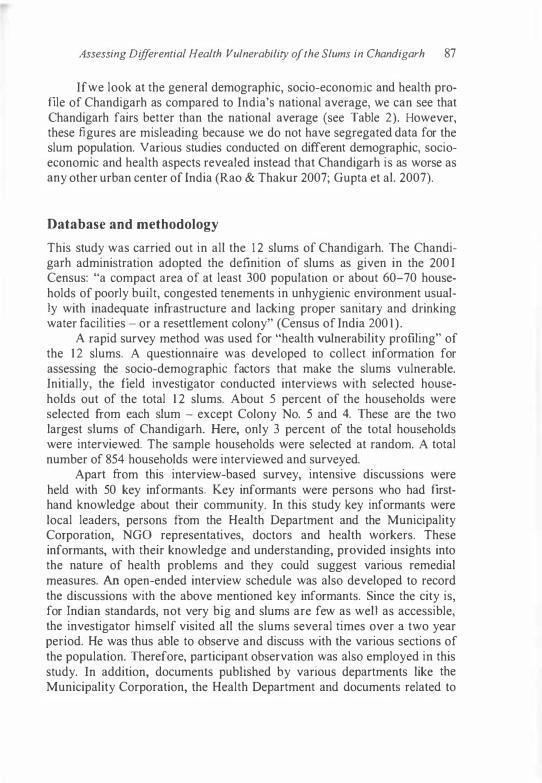
TABLE 3: Total and sample households in each slum ofChandigarh
Sr. No. Name of the slums Total no. of households No. of sample households
Bhaskar Colony 1084 52
2 LBS Colony 1037 51
3 Nehru Colony 1628 82
4 Colony No.4 5 168 155
5 Colony No.5 100 13 250
6 Bapu Dham 800 40
7 Adarsh Colony 202 10
8 SBS Colony 959 46
9 Sanjay Colony 856 43
10 Faidan 354 18
1 1 Ambedkar Colony 2382 1 1 9
12 Madrasi Colony 175 1 78
Total 26234 854
Source: Rapid survey and unpublished data collected from Directorate of Census Operations, Chandigarh.
Assessing Differential Health Vulnerability of the Slums in Chandigarh 89
Construction of a differential health vulnerability framework
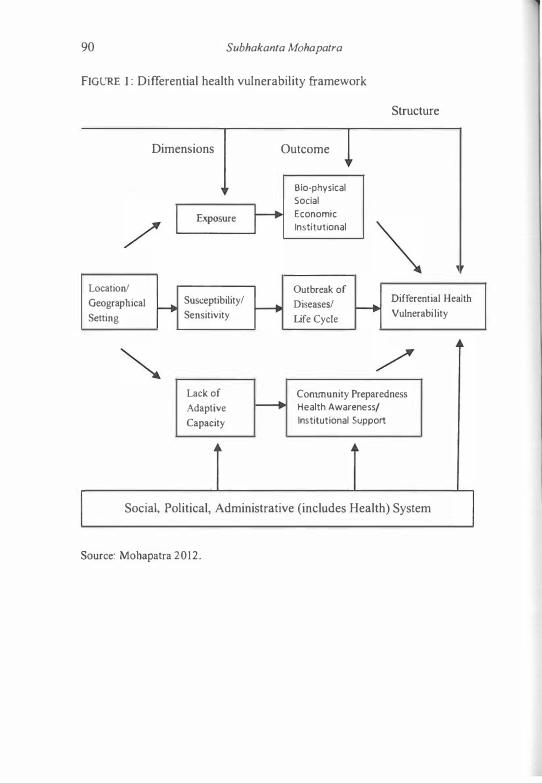
Vulnerability criteria have been developed on the basis of experience and through a critical review of the research. To construct the index, the general concept of vulnerability, its multiple structures and mUltiple dimensions have been taken into account. These determinants comprise susceptibility, exposure and adaptive capacity. They equally extended the various physical, social, economic, environmental and institutional frameworks of slum dwellers (Birkman 2006).
All the above mentioned structures and dimensions are influenced by the prevalent local, social, political and administrative system (which evidently includes the specific health system). The social and political context of a place includes political institutions and economic processes. It gives rise to socio-economic positions that correspond to social stratifications - with respect to income levels, education, professional status, gender, race/ ethnicity and many other factors (Vlahov et al. 2007; WHO 2005).
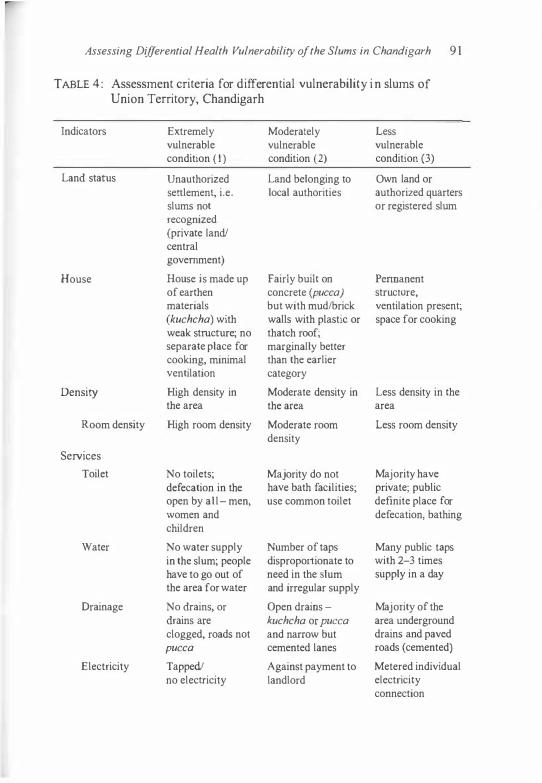
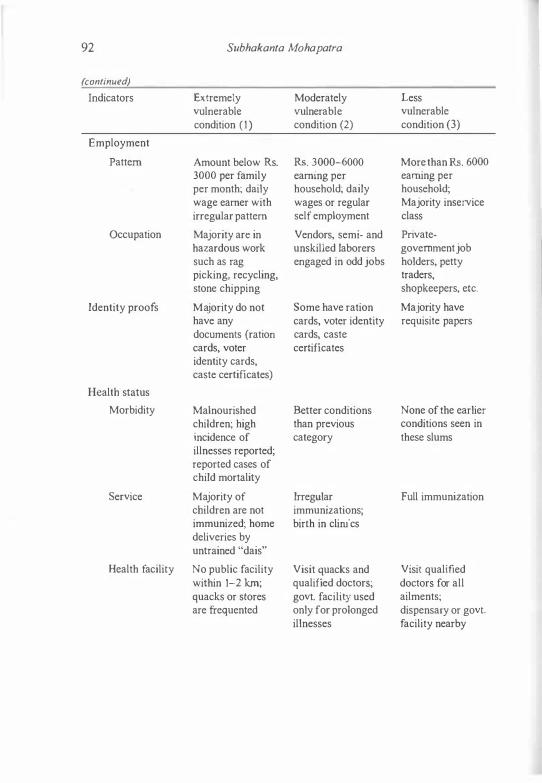
All in all, a total of 1 8 variables (under eleven subheadings) were considered for the construction of the Differential Health Vulnerability Index (adapted and modified from the study conducted by Agarwal & Taneja 2005). The detailed explanation for each variable is given in Table 4. Eaeh variable was assigned a score, and the cumulative score for each slum was calculated. For each variable, the maximum score assigned was 3, and the minimum score was I . Good conditions merited a score of 3, bad conditions of I . The details for assigning values are discussed in Table 4. According to this vulnerability criterion, a slum could fall between a maximum score of 54 and a minimum score of 1 8. The difference between the minimum and maximum value was thus 36 (54-18). This range, i.e. 36, was divided by three - high, moderate, low vulnerability. If the slum's score was below 30, it was categorized as highly vulnerable, 30-42 as moderately vulnerable and above 42 as hardly or less vulnerable.
90 Subhakanta Mohapatra
FIGURE I : Differential health vulnerability framework
Structure
Dimensions Outcome
Exposure � Bio-physical Sodal Economic Institutional
Location! Geographical f--t Setting
Susceptibility/ Sensitivity
Lack of
Adaptive Capacity
f---+ Outbreak of
Diseases! f--+ Differential Health
Life Cycle Vulnerability
Community Preparedness Health Awareness/ Institutional Support
I Social, Political, Administrative (includes Health) System
Source: Mohapatra 2012.
Assessing Differential Health Vulnerability of the Slums in Chandigarh 9 1
TABLE 4 : Assessment criteria for differential vulnerability in slums of Union Territory, Chandigarh
Indicators
Land status
House
Density
Room denSity
Services
Toilet
Water
Drainage
Electricity
Extremely vulnerable condition ( I ) Unauthorized senlement, i.e. slums not recognized (private land! central government)
House is made up of earthen materials (kuchcha) with weak structure; no separate place for cooking, minimal ventilation
High density in the area
High room density
No toilets; defecation in the open by all- men, women and children
No water supply in the slum; people have to go out of the area for water
No drains, or drains are clogged, roads not pucca
Tapped! no electricity
Moderately Less vulnerable vulnerable condition (2) condition (3)
Land belonging to Own land or local authorities authorized quarters
or registered slum
Fairly built on Pennanent concrete (pucca) structure, but with mudlbrick ventilation present; walls with plastic or space for cooking thatch roof; marginally better than the earlier category
Moderate density in Less density in the the area area
Moderate room Less room density density
Majority do not Majority have have bath facilities; private; public use common toilet definite place for
defecation, bathing
Number of taps Many public taps disproportionate to with 2-3 times need in the slum supply in a day and irregular supply
Open drains - Majority of the kuchcha or pucca area underground and narrow but drains and paved cemented lanes roads (cemented)
Against payment to Metered individual landlord electricity
connection
92 Subhakanta Mohapatra
(continued) Indicators Extremely Moderately Less
vulnerable vulnerable vulnerable condition (1) condition (2) condition (3)
Employment
Pattern Amount below Rs. Rs. 3000-6000 More than Rs. 6000 3000 per family earning per earning per per month; daily household; daily household; wage earner with wages or regular Majority inservice irregular pattern self employment class
Occupation Majority arc in Vendors, semi- and Private-hazardous work unskilled laborers government job such as rag engaged in odd jobs holders, petty picking, recycling, traders, stone chipping shopkeepers, etc.
Identity proofs Majority do not Some have ration Majority have have any cards, voter identity requisite papers documents (ration cards, caste cards, voter certificates identity cards, caste certificates)
Health status
Morbidity Malnourished Better conditions None of the earlier children; high than previous conditions seen in
incidence of category these slums illnesses reported; reported cases of child mortality
Service Majority of Irregular Full immunization children are not immunizations; immunized; home birth in clinics deliveries by untrained "dais"
Health facility No public facility Visit quacks and Visit qualified within 1-2 km; qualified doctors; doctors for all quacks or stores govt. facility used ailments; are frequented only for prolonged dispensary or govt.
illnesses facility nearby
Assessing Differential Health Vulnerability of the Slums in Chandigarh 93
(continued) Lndicators Extremely Moderately Less
vulnerable vulnerable vulnerable condition ( 1 ) condition (2) condition (3)
Support No govt. or noo- ICDS and other Relatively better Govt.INGOICBO government programs present supported by govt.
programs; limited but functioning and NGO efforts corrununity based irregularly; sectoral efforts presence ofNGO;
CBOs weak
Education
Children Majority of Children going to Majority of children out school but high children finishing of school and dropout rate and elementary working working education
Adults Illiteracy in adult Adult-functional Adult-completed population literacy elementary
education
Gender status Low gender status Some improvements Equitable gender (incidences of over the worst status domestic violence; category limited choices over fertility; no privacy for bathing and defecation)
Alcohol and Majority of the Better conditions Better conditions substance abuse male members and than previous than previous two
even children are category categories addicted to alcohol; substance abuse
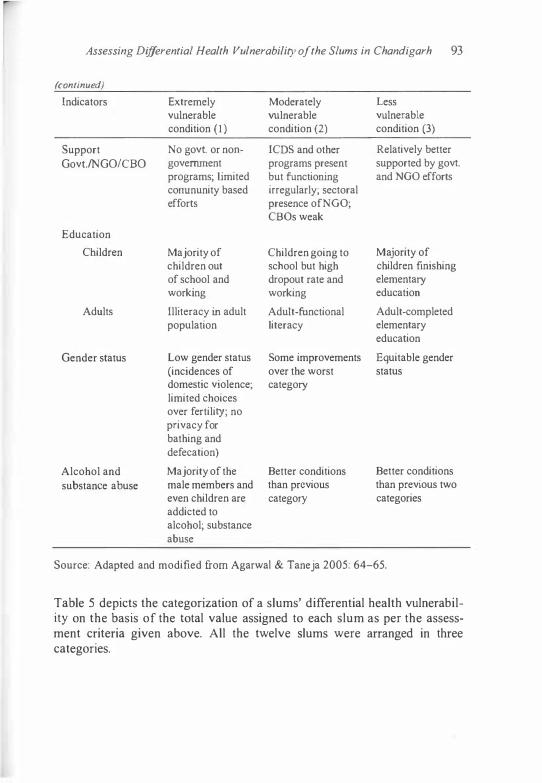
Source: Adapted and modified from Agarwai & Taneja 2005: 64-65.
Table 5 depicts the categorization of a slums' differential health vulnerability on the basis of the total value assigned to each slum as per the assessment criteria given above. All the twelve slums were arranged in three categories.

94 SubhakantG Mohapatra
TABLE 5: Categorization of slums on the basis of differential health vulnerability
Sr. No. Differential vulnerability
Highly vulnerable
2 Moderately vulnerable
3 Less vulnerable
Source: Own survey 2009-10.
Score
< 30
30--42
> 42
Name of the slums
Faidan, Colony No. 4 & 5, Lal Bahadur Shastri Colony
SBS Colony, Nehru Colony, Ambedkar Colony, Sanjay Colony
Madrasi Colony, Bhaskar Colony, Adarsh Colony, Bapu Dh.m
To substantiate the categorization of slums given in Table 5 , we tried to test Table 5 against some (slum) indicators that could be quantified. Table 6 demonstrates the overall reliability of the slum grading in Table 5.
TABLE 6: Results of the sample survey of the slums ofChandigarh (in percent)
Indicators
I . 00 nol have access to safe drinking water
2. Do not have basic sanitation
3. Alcohol & substance abuse
4. Households not having
any toilet facility
5. Occupation in hazardous work
6. Children completely immunized
7. Poor house building structure
Source: Own survey 2009-10.
Highly Moderately Less vulnerable vulnerable vulnerable slums slums slums
64.3 52.6 36.1
6 1 .6 53.2 4 1 .6
75.4 62.3 45.4
78.2 58.5 44.2
65.7 46.7 38.6
60.3 49.8 33.7
77.6 67.4 32.8

Assessing Differential Health Vulnerability oJthe Slums in Chandigarh 95
Major findings and suggestions
1 . The lack of basic infrastructural facilities and of individual quality of life creates the difference between highly and less vulnerable slums:
The above analysis (see Table 6) shows that the basic differences between the 3 types of slums are due to a lack of basic infrastructural facilities and of individual quality of life. Basic infrastructural facilities include housing structure, access to safe drinking water, poor drainage system, basic sanitation facilities (including toilet facilities) whereas individual quality of life includes type and nature of employment, health facilities (immunization, institutionalized delivery etc) and personal habits like alcoholism and substance abuse. In highly vulnerable slums more than 60 percent of the population suffers from the lack of these facilities and life quality indicators. For the case of building structure, toilet facility and alcohol and substance abuse, the percentage is above 75 percent. On the other hand, in less vulnerable slums, less than 45 percent of the population suffers from a lack of these facilities and indicators. Therefore, the gap between highly and less vulnerable slums is as high as 45 percent in the case of house building structures and as low as about 1 7 percent in the case of immunization programs.
2 . Gross deficiencies of basic infrastructure:
The deterioration of infrastructure created by investments under various slum improvement programs is mainly due to inadequate maintenance and finance in the post-project phase. This has resulted in the poor quality of services available to the residents in the slums: We speak of "non-functional" mobile toilet vans, choked drainage of sewerage, inadequate water supply, etc. Efforts were made to install mobile toilets in many of the 1 2 slums. In Colony No. 5 , there were only eight mobile toilets for a population of 40,OOO! Similarly, only six taps were installed outside the above mentioned slum. These numbers are grossly inadequate for such a large population, such as Colony No. 5. Apart from the fact that these toilets are not maintained, some toilets do not even have doors. They are also not cleaned properly and are not fit for women. Some of these toilets became "redundant" after some time. These conditions compel the slum population to open defecation. The garbage collection facilities are in similar shape. Officially, garbage bins are kept in each slum and sweepers are allocated to each slum - on paper. However, the bins are insufficient and most of them are placed outside the slums. All the slums do not have drains or contain only open drains, earthen drains. As far as the houses are concerned, houses are densely packed and poorly built with substandard or even inflammable materials.
96 Subhakanta Mohapatra
A majority of the surveyed houses (78 percent) are made of concrete but have mud or brick walls. They are covered with plastic or tin roofs and are without proper ventilation and without separate spaces for cooking. Not a single government health centre - out of 25 civil dispensaries in the city - is located in the vicinity of a slum.
3. A paradigm shift from an illness to a wellness approach:
As the first two findings show, many of the factors responsible for these health-related problems lie beyond the reach of the health professionals. To overcome these problems, multi-sectoral efforts are necessary that involve urban planners, engineers, politicians, doctors, health officials, public health specialists, NGOs, etc. Such efforts presuppose a paradigm shift in health intervention from an illness to a wellness approach. This means a shift from disease eradication to the well-being of an individual. This shift includes creating awareness of the building and maintaining of water, health, sanitation facilities, intensified care for all (especially women and children), the disabled and destitute, the aged and children in difficult circumstances and above all: the empowering of communities to handle their own health and life situation. The care giver/provider should turn into a facilitator, putting emphasis on the 'causes behind causes' rather than looking only at primary causes. Another implication is that we have to demystify the belief and practice that health-related problems are the exclusive responsibility of doctors and the health department.
4. The involvement and empowerment of communities:
Although many health programs are organized in the name of community empowerment, most government officials or concerned authorities remain skeptical. They are not convinced that the poor can monitor, manage or participate in their own health programs. The other side of the story is that officials are not very keen to loose power.
5. Lack of data:
There exists a lack of dependable data on the various aspects of slum life. This includes the number of slums, size of slum populations, access to services like water and sanitation, livelihood, morbidity patterns etc. Chandigarh, for instance, does not collect special statistics which would give a more accurate picture of the slums of Chandigarh. Specific statistics must be collected not only in tenns of slum location, but also in terms of gender, age, and socio-economic groups. The Health Department of the Chandigarh administration has been planning to develop a Health Management Information System (HMIS) for Chandigarh but, unfortunately, it has not

Assessing Differential Health Vulnerability of the Slums in Chandigarh 97
materialized until now. Therefore, there remains a need for the "Health Profiling" of each slum. The necessary money could be provided by the lawahadal Nehru Urban Renewal Mission (lNURM).
References
Agarwal, S. & S. Taneja (2005). All Slums are Not Equal: Child Health Conditions among the Urban Poor, in: Indian Pediatrics, Vol. 42, No. I , pp. 233-244.
Agarwal, S., Satyavad, A., Kaushik, S. & R. Kumar (2007). Urbanization, Urban Poverty and Health of the Urban Poor: Status, Challenges and the Way Forward, in: Demography India, Vol. 36, No. l , pp. 1 2 1-134.
Birkmann, J. & B. Wisner (2006). Measuring the Un-measurable: The Challenge of Vulnerability. Tokyo, New York & Paris: UNU Press.
Curter, S.L., Mitehell, 1.T. & M.S. Seon (2000). Revealing the Vulnerability of People and Places: A Case Study of Georgetown County, South Carolina, in: Annals of American Geographers, Vol. 90, NoA, pp. 7 13-737.
Census of India (2001) . Final Population Totals and Household Amenities Chandigarh. On line: http://www.census india.netlresults/catalogue/chndlpdf (30.06. 201 0).
Cutter, S. (1 996). Vulnerability to Environmental Hazards, in: Progress in Human Geography, Vol. 20, No. 4, pp. 529-539.
Gupta, M., Thakur, 1.S. & R. Kumar (2007). Reproductive and Child Health Inequities in Chandigarh Union Territory of India, in: JOllrnal of Urban Health: Bulletin of the New YvrkAcademy of Medicine, Vol. 85, No. 2, pp. 291-99.
Hogan, DJ. & E. Marandola Jr. (2008). Socio-Demographic Vulnerability to Environmental Hazards of the Metropolis, in: Towards Sustainable Global Health, SOURCE 1512011, Bonn: UNU-EHS.
Marmot, M. & R.G. Wilkinson (eds.) (2003). The Solid Facts (2nd ed.), Copenhagen: World Health Organisation.
McCarthy, J.J., Canziani, O.F., Leary, N.A., Dokken, DJ. & K.S. White (eds.) (200 I) . WC 11: Climate Change 200 I: Impacts. Adaptation and Vulnerability. Contribution of Working Group 1I to the Third Assessment Report of the Intergovernmental Panel on Climate Change. Cambridge: Cambridge University Press.
Municipality Corporation Chandigarh (2010). City Development Plan, Chandigarb. Online: hnp:llwww.mcchandigarh.gov.in/cdp.pdf(04.03. 20 1 1 ).
Rao, B.T. & 1S. Thakur (2007). Vulnerability Assessment in Slums of Union Territory, Chandigarh. in: Indian Journal of Community Medicine, Vo!. 32, No. I, pp. 189- 1 9 1 .
Turner 11, B.L., Kasperson, R.E., Matson. P.A., McCarthy, J.J., Corell, R.W., Christensen, L., Eckley, N., Kasperson, J.X . • Luerse, A., Martello, M.L., Polsky, c., Pulsipher, A. & A. Schiller (2003). A Framework for Vulnerability Analysis in Sustainability Science, in: Proceedings of the National Academy of Sciences of the United States of America (PNAS), Vol. 100, No. 14, pp. 8074-8079.
98 Subhakanta Mohapatra
UNDP (2007). Fighting Climate Change: Human Solidarity in a Divided World, in: Human Development Report 2007108. New York: UNDP.
lJN-HABIT AT (2003). The Challenge of Slums: Global Report on Human Selllements 2003. London: Earthscan Publications Ltd.
Vlahov, D., Freudenberg, N., Proietti, F., Ompad, D., Quinn, A., Vijay, N. & S. Galea (2007). Urban as a Determinant of Health, in: Journal a/Urban Health: Bulletin afthe New York Academy afMedicine, Vel. 84, No. 1 , pp. 16-26.
WHO (2010). Hidden Cities: Unmasking and Overcoming Health Inequities in Urban Settings. Geneva: WHO.
WHO (2005). Towards a Conceptual Framework for Analysis and Action on the Social Determinants of Health, Draft Discussion Paper. Geneva: WHOJCSDH.