assessing choice for public hospital patients€¦ · · 2017-05-22assessing choice for public...
TRANSCRIPT
CENTRE FOR THE HEALTH ECONOMY
Assessing choice for public hospital patients MAY 2017
Supported by

CENTRE FOR THE HEALTH ECONOMY
DISCLAIMER This report has been jointly funded by Macquarie University and the Commonwealth Bank of Australia in accordance with the terms of Macquarie University’s contract dated 2 August 2016.
Neither Macquarie University, nor its employees, undertake any responsibility for third party reliance placed on this report.
PREPARED BY This report was prepared by:
Dr Henry Cutler
Dr Yuanyuan Gu
Emma Olin
For further information on this report, or about MUCHE, please contact:
Dr Henry Cutler Director P: + 61 2 9850 2998 M: +61 409 770 946 E: [email protected] health-economy.mq.edu.au
FUNDING This project was funded through support from Macquarie University and an unconditional grant provided by the Commonwealth Bank of Australia.
ACKNOWLEDGEMENTS We would like to thank Chris Crawford for providing helpful comments on a previous draft of this report.
This project has been granted ethics approval by Macquarie University Faculty of Medicine and Health Sciences low risk ethics subcommittee.

CENTRE FOR THE HEALTH ECONOMY
THIS PAGE HAS BEEN LEFT BLANK

CENTRE FOR THE HEALTH ECONOMY
4
About MUCHE Macquarie University is recognised as one of Australia’s leading research universities, with an enviable reputation for excellence. While still relatively young, success of the past 50 years has positioned our distinctive approach to deliver ground-breaking research with world-changing impact.
Recently, we have invested heavily in infrastructure, with over $1 billion spent on facilities and buildings. We have also significantly expanded our teaching and research capacity in health, for example, with the development of a new Faculty of Medicine and Health Sciences, and relocation of the Australian Institute of Health Innovation from the University of NSW.
The University’s objectives are to accelerate world-leading research; to prepare world-ready higher degree research candidates; to actively engage externally as a world-recognised research collaborator and partner of choice. We believe collaborating with industries, governments, communities, professions and academic colleagues around the world is paramount to our success.
Macquarie University’s Centre for the Health Economy (MUCHE) was recently established as a strategic initiative to undertake innovative research on health, ageing and human services. Our vision is to create a world where decision makers are empowered with applied, trusted and influential research into health and human services policy and systems. Our mission is to deliver leading innovative research by operating professionally, collaboratively and sustainably.
To this end, we undertake research for government, business, and not-for-profit organisations, which is used to inform public debate, assist decision-making, and help formulate strategy and policy.
We are interested in investigating the Health Economy at the macro level, with particular focus on the interdependencies of these systems with each other, and the broader economy. This includes investigating factors beyond the health and human services sectors that impact the health and wellbeing of populations.
Our point of difference lies in our approach to research. While MUCHE primarily consists of specialist health economists, we recognise that researching the Health Economy requires many skill sets and experience. Solving problems within health and human services now requires teams with multi-disciplinary skills working closely together.
We therefore work collaboratively with our partners, and across the University, including the Faculty of Business and Economics, Faculty of Human Sciences, and the Faculty of Medicine and Health Sciences. We also work with Macquarie University’s world renowned research hubs, such as partners within the Australian Hearing Hub and the Australian Institute of Health Innovation.
We take pride in combining our professional approach to partner engagement, with our academic approach to methodology, to deliver innovative translational research.
Dr Henry Cutler Director Centre for the Health Economy Macquarie University
CENTRE FOR THE HEALTH ECONOMY
Contents Executive summary ........................................................................................................................ 1
Choice across Australian public hospitals ..................................................................................... 1
Seeking preferences for choice across public hospitals ................................................................. 2
Do Australians want more choice? ............................................................................................... 2
The value of quality versus convenience ....................................................................................... 3
Policy implications ....................................................................................................................... 4
1. Introduction .............................................................................................................................. 7
Access to hospitals ........................................................................................................................... 7
Waiting times for elective care in public hospitals ........................................................................... 8
Hospital performance ...................................................................................................................... 9
Current choice among elective care patients .................................................................................. 10
Choice with the public hospital sector ........................................................................................ 11
Existing restrictions on public hospital choice ........................................................................... 11
Towards greater choice in health care ............................................................................................ 12
A review of competition policy in Australia ................................................................................ 12
Introducing competition and informed user choice into human services ................................... 13
Study objectives ............................................................................................................................. 13
2. The value of choice .................................................................................................................. 14
Improving health outcomes through choice ................................................................................... 14
Making choices in health care ........................................................................................................ 15
Do patients want more choice? ...................................................................................................... 16
How is quality information used by patients? ................................................................................. 17
Interpretation of quality information ......................................................................................... 17
Attributes assessed by patients when choosing between hospitals ............................................. 17
Support in the patient decision-making process ........................................................................ 17
3. Methodology ............................................................................................................................. 19
Survey questions ............................................................................................................................ 19
Individual characteristics ........................................................................................................... 19
Attitudes towards the current health care system ...................................................................... 20
Discrete choice experiment ............................................................................................................ 20
CENTRE FOR THE HEALTH ECONOMY
6
A DCE for public hospital choice ................................................................................................ 20
Assessing DCE responses ........................................................................................................... 21
4. Attitudes towards public hospitals and choice ..................................................................... 24
Satisfaction with public hospitals ................................................................................................... 24
Use of hospital performance information ...................................................................................... 26
Desire for more public hospital choice ........................................................................................... 27
Approach to choosing public hospitals ........................................................................................... 28
Ability to trade-off hospital attributes ........................................................................................ 28
Desire for help when choosing between hospitals ...................................................................... 29
5. Preferences for hospital characteristics ................................................................................ 33
Preference results ........................................................................................................................... 33
Forced choice versus unforced choice ........................................................................................ 34
Semi-urgent versus non-urgent .................................................................................................. 39
Relative importance ....................................................................................................................... 41
Preference heterogeneity ............................................................................................................... 45
Gender ........................................................................................................................................ 46
Education ................................................................................................................................... 46
Location ...................................................................................................................................... 46
Past elective surgery experience ................................................................................................. 46
6. Policy implications ................................................................................................................... 47
Improve hospital quality information ............................................................................................ 48
Provide health care professional assistance to patients ................................................................. 49
Improving individual health literacy .......................................................................................... 50
Providing assistance to patients when making a choice ............................................................. 50
Reduce costs to exercising choice ................................................................................................... 51
Help hospitals respond to patient preferences for quality .............................................................. 52
References ...................................................................................................................................... 55
Appendix A – Survey administration ............................................................................................. 60
Pilot testing .................................................................................................................................... 60
Interviews ................................................................................................................................... 60
Pilot survey ................................................................................................................................. 60
Sampling strategy .......................................................................................................................... 60
Accessing respondents ................................................................................................................... 60
Appendix B- Sample characteristics ............................................................................................. 61
Appendix C – Development of the DCE ......................................................................................... 63
Attribute identification and selection ............................................................................................. 63

CENTRE FOR THE HEALTH ECONOMY
7
Experimental design and choice sets.............................................................................................. 64
Contextual information .................................................................................................................. 64
Presentation of choice sets ............................................................................................................. 64
Limitations ..................................................................................................................................... 65
CENTRE FOR THE HEALTH ECONOMY
1
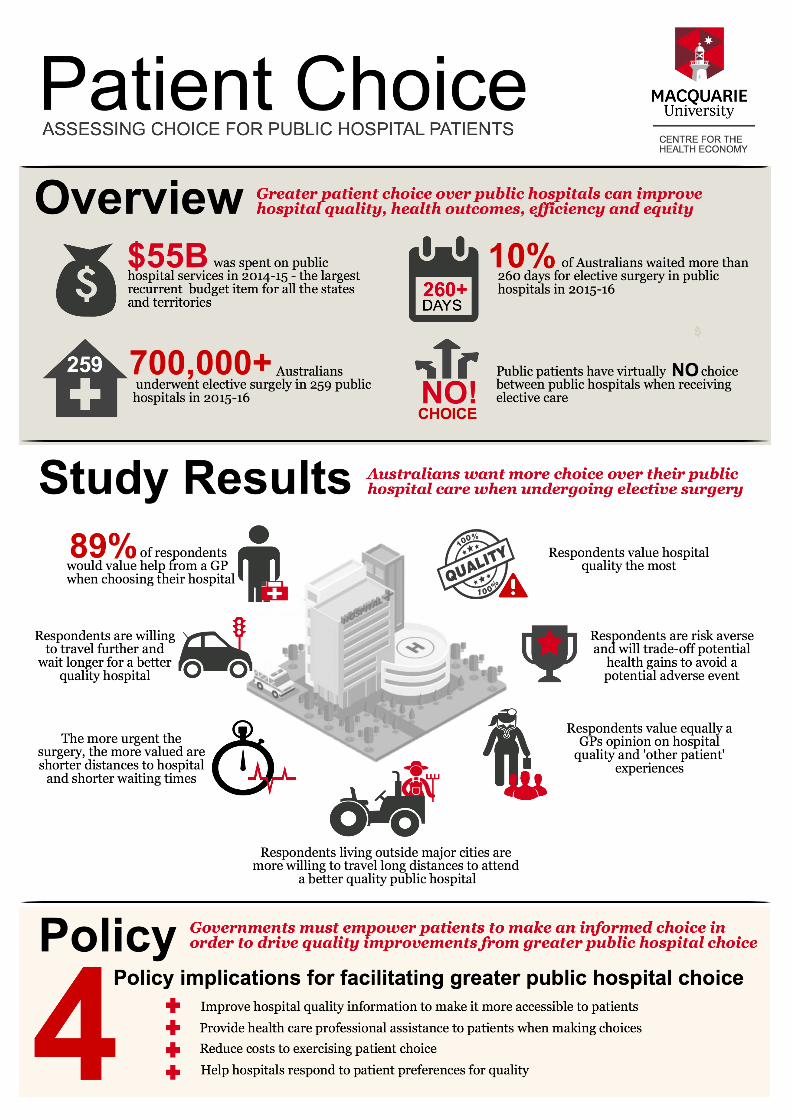
Executive summary Each year Australian governments expend around 25 per cent of their tax revenue on health care. Of this, around $55 billion was spent on public hospitals services (recurrent expenditure) in 2014-15. In total, recurrent expenditure on public hospital services is the largest budget items for states and territories, surpassing expenditure on primary and secondary education, disability services, police and justice. And expenditure continues to grow, with an average annual growth at 6.3 per cent between 2010-11 and 2013-14.
A large proportion of expenditure relates to elective care, which accounted for around 2.1 million hospital admissions in 2015-16, across both public and private hospitals. Of these, public hospitals accounted for 33.9 per cent, although for the most disadvantaged group of Australians public hospitals delivered around 50 per cent of elective care hospital admissions. Around 712,000 patients were admitted to elective care as a public patient in 2015-16.
While the median waiting time for public hospital elective surgery was 37 days in 2015-16, many Australians faced long waiting times to receive surgery. For example, 10 per cent waited longer than 260 days, and around 2 per cent waited longer than a year. And despite efforts to reduce waiting times by states and territory governments, many are waiting longer for their public hospital surgery compared to previous years. There are also inequities in access to public hospital care, with many patients living outside capital cities waiting longer for elective surgery compared to those living within capital cities.
Hospital quality also varies. Despite community expectations, a large proportion of health care workers are not delivering care based on established evidence or protocol. In some instances, hospitals can lead to patient harm, with around 5.6 per cent of all patients admitted to hospital experienced an adverse event and around 8.8 per cent of patients acquired another condition within the hospital in 2014-15.
These problems are not unique to the Australian health care system. Some countries (e.g., England and the Netherlands) have responded by offering greater hospital choice to patients in the hope that patients are better able to seek care suited to their preferences, and hospitals respond to demand side pressures by increasing quality. Empirical evidence suggests increased patient choice has led to increased hospital quality and improved health outcomes.
Choice across Australian public hospitals
In theory, public patients seeking elective surgery can choose any public hospital, with no formal barriers imposed by governments or funding systems. In practice, patients are directed by GPs towards their local hospital or specialist as a matter of convenience. Many public hospitals will reject a referral if the patient lives outside its catchment area.
Access to elective surgery is also restricted through waiting lists, with public patients treated in queue order. And despite variation in waiting list times across public hospitals, many GPs do not actively guide public patients towards public hospitals with shorter waiting times.1
1 Local health districts / networks and state governments often help patients to access alternative public hospitals (and potentially private hospitals) if they are at risk of waiting longer than clinical priority time frames.
CENTRE FOR THE HEALTH ECONOMY
2
There is also limited information on the comparative quality of public hospitals, which means any public hospital choice is based on incomplete information.
A lack of informed choice within the public health care system has not gone unnoticed. A review of Competition Policy completed in 2015 (the ‘Harper Review’) made several recommendations to promote further choice in human services sectors. The Productivity Commission is also exploring the potential to introduce greater competition and informed user choice into the human services sector, noting public hospital services as one of six areas for potential reform.
International research suggests patients want more choice over their health care. People feel empowered with choice, and when provided with choice, they exercise their right to choose. Yet demographic and socioeconomic status can impact willingness to choose. Some people find it difficult to interpret and use performance information. Others like the convenience of their local hospital, willing to trade off better quality for reduced travel.
While experience in other countries suggests greater hospital choice can improve hospital quality, this will only occur if patients value quality, are aware of their right to choose, and exercise that right using appropriate quality information. Given nearly half of all Australians have health insurance covering private hospital services, and that distances between public hospitals outside capital cities can be vast, Australians may choose ‘not to choose’. This would limit any benefit from increased choice in the public hospital sector.
Seeking preferences for choice across public hospitals
The objectives of this study were to assess whether Australians want more choice over their public hospital care for elective surgery, and to what extent they value hospital quality relative to convenience.
A representative sample of 1,000 Australians aged 50 to 75 years selected through Toluna Australia (a research panel company) were surveyed to collect information on attitudes towards the health care system, desire to receive greater choice over public hospitals, and potential difficulties in making choices between hospitals.
A discrete choice experiment (DCE) using the same representative sample was employed to measure the strength of preferences over seven attributes related to convenience, opinion of others, and hospital quality metrics.
Do Australians want more choice?
Survey results suggests that while respondents are mostly satisfied with the public hospital system, 51 per cent believe fundamental changes are needed. Around 10 per cent believed that the public hospital system has so much wrong with it that it needs to be completely rebuilt. Only 13 per cent of respondents were very satisfied with the amount of choice available in the public hospital system, and 27 per cent were not very satisfied or not satisfied at all. This suggests many respondents desire more public hospital choice.
Around 70 per cent of respondents believed choosing between two hypothetical public hospitals based on seven attributes was not difficult, and 60 per cent of those were able to consider all attributes carefully before choosing their hospital. This suggests around 40 per cent of respondents used heuristics when making their choice.
Low health literacy may be one reason for using choice heuristics. When respondents were asked if they were comfortable understanding health information or understanding advice from a health care
CENTRE FOR THE HEALTH ECONOMY
3
professional, around 34 per cent and 25 per cent respectively stated they were only somewhat comfortable, a little bit comfortable, or not at all comfortable.
Respondents were also asked if they would prefer a GP to help them choose a public hospital in ‘real life’. Around 85 per cent noted they would prefer a GP to help, while 11 per cent noted they would be comfortable choosing a hospital by themselves. Only 5 per cent noted they would prefer the GP to choose a hospital for them, without their input.
While reasons varied for seeking GP assistance, three dominant themes emerged. Many respondents thought a GP would hold additional information about hospital quality and the quality of specialists. Many also believed a GP would be useful as a sounding board to provide a second opinion. Finally, many respondents noted they would trust their GP to help them make the right choice.
The desire for seeking GP assistance may also be due to a lack of trust in government information on public hospital quality. This source was least trusted by survey respondents when compared to own experiences and those of family and friends, other patient’s experiences and a GP’s opinion.
The value of quality versus convenience
Respondents were asked to choose between two hypothetical public hospitals while imagining they required hip replacement surgery. Hospitals were described in terms of seven attributes, with four levels each. Attributes related to the following three categories.
Convenience, represented by:
o distance from hospital to home; and
o waiting time for surgery.
Opinion of others, represented by:
o GP’s opinion of hospital quality; and
o other patients’ overall rating of the hospital.
Hospital quality metrics, represented by:
o average health gain six months after surgery;
o rate of adverse events; and
o readmission rate within 28 days after surgery.
Two DCEs were undertaken, including one presented to 500 respondents under a semi-urgent elective surgery scenario (surgery within three months), and another presented to 500 other respondents under a non-urgent elective surgery scenario (surgery within 12 months). Each respondent made 12 choices, implicitly revealing their preference for hospital attributes.
Results suggest that respondents (on average) value all attributes when making their choices, and were willing to trade-off all attributes with each other. In summary, respondents:
valued hospital quality the most, as measured by reduced adverse events and unplanned hospital readmissions and potential health gains;
are willing to trade off potential health gains to avoid an adverse event or unplanned hospital readmission, suggesting respondents are risk-averse when choosing between hospitals;
value equally the GP’s opinion of hospital quality and other patient’s overall rating of the hospital; and
are willing to be inconvenienced for a better hospital quality, by travelling further distances and
CENTRE FOR THE HEALTH ECONOMY
4
waiting longer.
The urgency of elective surgery impacted the value of convenience attributes only. Respondents assigned to the semi-urgent elective surgery scenario valued shorter distances and shorter waiting times more than those assigned to the non-urgent elective surgery scenario. Elective surgery urgency had no impact on respondent preferences for hospital quality attributes.
Preferences for hospital attributes varied across respondents based on individual characteristics. In summary:
female respondents disliked hospitals more than male respondents when a GP rates the hospital as poor;
female respondents disliked hospitals more when the readmission rate was greater, suggesting females may be more risk averse when choosing a hospital;
respondents with a year 12 education or below were more willing to choose a hospital with potential lower health gain when elective surgery was semi-urgent;
respondents living outside major cities were more willing to travel longer distances to attend a better quality hospital; and
respondents with past elective surgery experience were more willing to choose a hospital with lower health gain.
In summary, respondents would like more choice across public hospitals. They can interpret hospital performance information, are willing and able to trade off hospital attributes when choosing, and highly value hospital quality over other attributes, such as distance from home to hospital and waiting times. This suggests greater choice for public patient elective surgery may provide the appropriate signal to public hospitals to improve quality.
Policy implications
The decision to pursue greater choice for public hospital elective surgery patients should account for social welfare and equity considerations, the interests of patients, and whether greater choice would result in cost effective outcomes.
While greater choice may improve public hospital quality, and will be intrinsically valued by patients, a significant cost will be associated with reorganising the public hospital system, investing in infrastructure to support choice, marketing and awareness campaigns, and potential ongoing costs to ensure patients receive professional support when making their choice.
Benefits from greater choice will depend on patient willingness to choose a public hospital based on quality, and hospital response to patient preferences for quality. There are four policy directions government could pursue to facilitate greater choice, including the following.
Improve hospital quality information to make information more accessible to patients.
Provide health care professional assistance to patients when making choices.
Reduce costs to exercising patient choice.
Help hospitals respond to patient preferences for quality.
Improve hospital quality information
The amount and type of quality information presented to public patients must be purposefully determined, relevant, and valued by patients. Quality indictors should reflect poor hospital performance. Patients want to avoid bad hospitals rather than pursue good ones. Patient outcome
CENTRE FOR THE HEALTH ECONOMY
5
measures should be risk adjusted to account for differences in patient population characteristics impacting outcomes. Governments must also be aware of potential perverse incentives associated with publishing only a limited set of quality indicators for choice.
Provide health care professional assistance to patients when making a choice
While the majority of respondents did not find choosing a hospital difficult within the DCE, a choice with more than two hospitals would increase the cognitive burden on patients due to the additional trade-offs required. The more complex a choice, the greater a patient will rely on choice heuristics. Furthermore, choosing hospitals in ‘real life’ may be less clear cut compared to a hypothetical scenario, given the patient may seek access to additional information (e.g., experience of family and friends and reputation of the local hospital).
Some choice difficulties experienced by respondents were related to low health literacy. Within an environment of low health literacy, restricting choice to a select number of public hospitals may generate the desired quality signal but not place undue cognitive burden on patients, although this may dampen the potential benefits from greater choice. Governments may also need to invest in further developing the individual health literacy of patients specifically related to public hospital choice.
While patients may seek GP assistance when making a public hospital choice, there is no guarantee the GP will help if remuneration does not compensate the additional time required to discuss public hospital options with patients. An education program may also be required to help GPs understand the methods used to develop quality information, how to interpret quality information, what variation in quality across public hospitals means for the patient, and what role the GP should play in the patient decision making process.
The employment of other health care professionals to help patients make a public hospital choice could also be explored by government.
Reduce costs to exercising patient choice
Choosing a public hospital may not be costless to a patient. Patients choosing a hospital outside their local area may face increased travel costs, and reduced visits from family and friends. Patients choosing a hospital with longer waiting times will face an extended period in poor health, and potential opportunity cost associated with reduced leisure time or lost income if their condition impacts their ability to work.
If patients face large costs associated with increased travel distances and longer waiting times they will be less inclined to choose a hospital based on quality. This could mute the signal to public hospitals that patients value quality.
One way to stimulate choice based on quality is to reduce costs associated with exercising patient choice. This could include subsidised travel and accommodation to patients willing to choose a hospital outside their local area. Travel and accommodation assistance is already available in Australia to public hospital patients.
Another way to stimulate choice based on quality is to reduce public hospital elective surgery waiting times. This may reduce the value patients place on waiting times relative to quality given the waiting time cost is reduced, and allow the patient to focus more on hospital quality differences.
CENTRE FOR THE HEALTH ECONOMY
6
Help hospitals respond to patient preferences for quality
While introducing greater public hospital choice would provide an intrinsic value to patients, it will only increase quality if public hospitals:
have the capacity to analyse and interpret changes in patient demand due to choice;
receive a clear signal from patients that they value quality over other attributes;
understand where and how quality can be improved; and
are incentivised to increase quality in response to patient preferences.
Public hospitals must also have the capacity to accommodate any shift in patient demand. Good quality hospitals may need to treat more elective surgery patients, and public hospitals may face an increase in demand from patients that would have otherwise sought surgery within a private hospital. Given most Australian public hospitals are already at full elective surgery capacity (as evidenced through long waiting times), it may be problematic for hospitals to accommodate additional patients.
Increasing hospital quality is a complex task, especially in large hospitals, and hospital wide quality indicators may not reflect quality ‘black spots’ within a hospital. Government may need to introduce more detailed performance evaluation frameworks within hospitals, down to the ward and specialist levels.
Barriers to improved public hospital quality may also exist that would not be addressed by public hospital choice. And many hospitals currently have limited capacity to improve quality due to financial, workforce, or other constraints. Current activity based funding (ABF) arrangements may create a disincentive for hospitals to improve hospital quality because attracting additional patients may put pressure on their budget.
Governments may therefore be required to undertake further investment in infrastructure and workforce. There may also be a role for government to refine hospital funding models, and facilitate greater collaboration between public hospitals within and across local health districts / networks, for example, to help hospitals better manage changes in patient demand for elective surgery.
CENTRE FOR THE HEALTH ECONOMY
7
1. Introduction The Australian hospital sector consists of public and private hospitals. Public hospitals are managed by state and territory governments, and private hospitals are managed by either private or not-for-profit organisations.[1]
In 2014-15 there were 698 public acute hospitals operating in Australia, of which 678 were public acute hospitals and 20 were public psychiatric hospitals. There were also 624 private hospitals, comprised of 342 free-standing day hospital facilities, and 282 other private hospitals.[1]
In total, public and private hospitals operated 92,100 beds and provided services within 10.2 million hospital episodes of care. Around 41 per cent of these hospitalisations were undertaken by people aged 65 years and over, who account for only 15 per cent of Australia’s population.[1] This reflects the greater need for health care as the population ages.
Around $55 billion was spent on public hospitals services (recurrent expenditure) in 2014-15, with an average annual growth in nominal recurrent expenditure at 6.3 per cent between 2010-11 and 2013-14. Another $12.3 billion was spent on private hospital services in 2014-15, with an average annual growth in nominal recurrent expenditure at 6.5 per cent between 2010-11 and 2014-15.[2]
The public hospital system is primarily funded by state and territory governments, comprising around 54.2 per cent of all funding. Other sources include the Australian Government (36.8 per cent), health insurance funds (2.1 per cent), individuals (2.9 per cent) and other funding sources (4.0 per cent).[2] Hospital expenditure is the largest health expenditure item for all state and territory governments, while hospital services accounts for the second largest health expenditure item for the Australian Government (behind medical services and benefits).
Access to hospitals On average, there are around 3.9 public and private hospital beds per 1,000 population in Australia, although this rate differs across states and territories. For example, in 2014-15 South Australia had the highest rate of public hospital beds at 2.9 per 1,000 population, while Western Australia had the lowest at 2.2 beds per 1,000 population.
Compared to other Organisation for Economic Co-operation and Development (OECD) countries, Australia has a lower rate than the average of 4.8 beds per 1,000 population.[2] While there is no consensus on what the optimum rate should be, many countries (including Australia) are trying to keep people out of hospital through the use of integrated care programs, given hospital care is generally more expensive.
The rate of public hospital beds in Australia differs across remoteness area, with major cities having the lowest rate at 2.5 beds per 1,000 population. Relative to population numbers, remote areas have the highest average available beds across Australia, at 3.3 beds per 1,000 population.
However, rural populations do not have greater access to hospital services, and equitable access to hospital services is still a concern. Rural hospitals generally have less specialised service units and access to elective surgery. Furthermore, populations living outside major cities have a higher prevalence
CENTRE FOR THE HEALTH ECONOMY
8
of some long term health conditions, are more likely to be overweight or obese, and have increased rates of risky health behaviours.[3] People living in very remote areas were 1.6 times more likely to be hospitalised in 2014-15.[1]
Waiting times for elective care in public hospitals Public hospitals provide several types of services to the Australia population. These are grouped into non-admitted care, such as emergency department services and outpatient clinics, and admitted patient care, including emergency and planned (elective) care, maternity services, and medical and surgical services.[1]
The national definition of elective care consists of at least one procedure undertaken in a hospital that can be delayed for at least 24 hours. In contrast, emergency care requires admission within 24 hours. In actual practice, elective care is generally considered a procedure that can be managed by placing a patient on a waiting list.[4]
Elective care is categorised into three clinical urgency categories, based on the clinically indicated time frame determined by the treating clinician. These categories include:
Category 1: Procedure to be undertaken within 30 days
Category 2: Procedure to be undertaken within 90 days
Category 3: Procedure to be undertaken within 365 days.
While these categories apply across all states and territories, differences in approaches to categorising patients by clinicians has generated variability in the proportion of patient admissions from waiting lists in each category for the same procedure. For example, in 2011-12 NSW admitted 64 per cent of orthopaedic surgery patients from Category 3, whereas in the ACT it was only 16 per cent.[4]
Elective care accounted for around 2.1 million hospital admissions in 2015-16, across both public and private hospitals. Of these, public hospitals accounted for 33.9 per cent,[4] although for the most disadvantaged group of Australians public hospitals delivered around 50 per cent of elective care hospital admissions.
Only 38.2 per cent of public hospitals provided elective surgery in 2015-16. Within those public hospitals that do provide elective surgery, there were around 712,000 patients admitted to elective care in 2015-16. Since 2011-12, the annual growth in public hospital admissions from elective surgery waiting lists has been around 2.4 per cent, although annual growth has been around 3.8 per cent since 2014-15.[5]
While some of this growth in elective care is due to population growth, the proportion of Australians undertaking elective care has also been increasing. Since 2011-12, the average annual growth in admissions from public hospital elective surgery waiting lists has increased by 0.8 per cent, but grew by 2.4 per cent since 2014-15.[5]
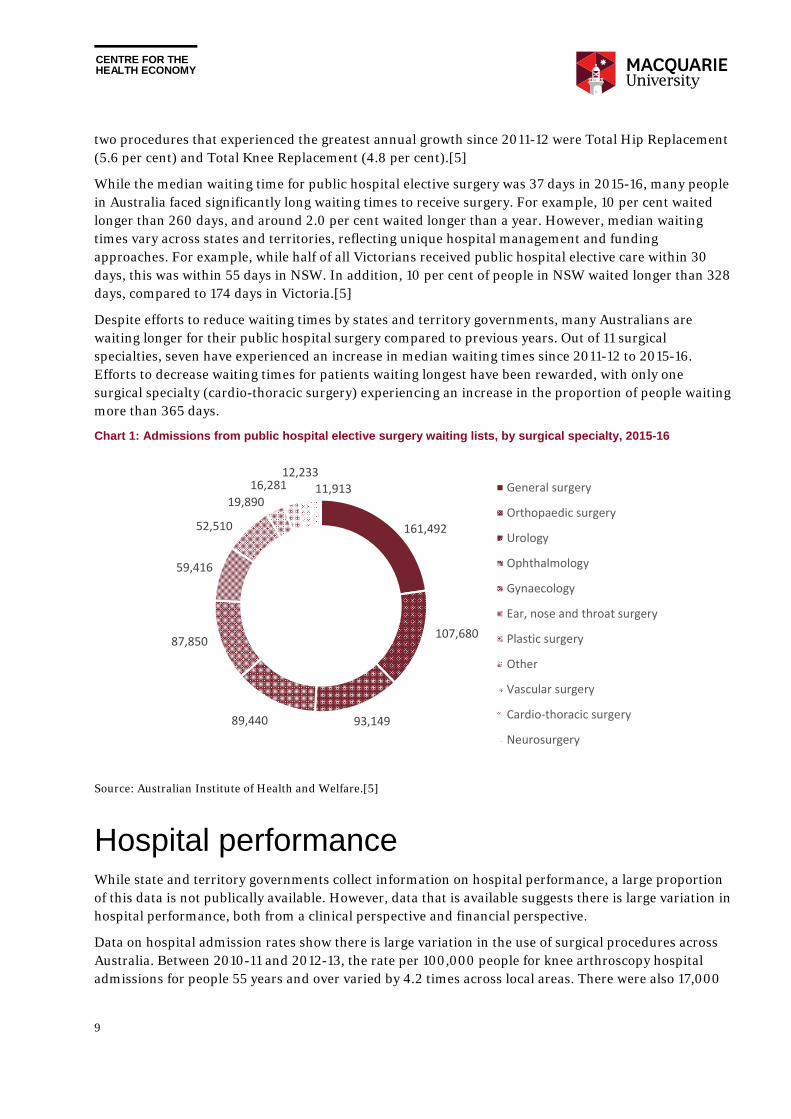
In 2015-16, the most common surgical specialty for patients admitted from public hospital waiting lists was General Surgery (surgery on organs of the abdomen), followed by Orthopaedic surgery (see Chart 1). The most common elective surgical procedure was Cataract Extraction, followed by Cystoscopy. The
CENTRE FOR THE HEALTH ECONOMY
9
two procedures that experienced the greatest annual growth since 2011-12 were Total Hip Replacement (5.6 per cent) and Total Knee Replacement (4.8 per cent).[5]
While the median waiting time for public hospital elective surgery was 37 days in 2015-16, many people in Australia faced significantly long waiting times to receive surgery. For example, 10 per cent waited longer than 260 days, and around 2.0 per cent waited longer than a year. However, median waiting times vary across states and territories, reflecting unique hospital management and funding approaches. For example, while half of all Victorians received public hospital elective care within 30 days, this was within 55 days in NSW. In addition, 10 per cent of people in NSW waited longer than 328 days, compared to 174 days in Victoria.[5]
Despite efforts to reduce waiting times by states and territory governments, many Australians are waiting longer for their public hospital surgery compared to previous years. Out of 11 surgical specialties, seven have experienced an increase in median waiting times since 2011-12 to 2015-16. Efforts to decrease waiting times for patients waiting longest have been rewarded, with only one surgical specialty (cardio-thoracic surgery) experiencing an increase in the proportion of people waiting more than 365 days.
Chart 1: Admissions from public hospital elective surgery waiting lists, by surgical specialty, 2015-16
Source: Australian Institute of Health and Welfare.[5]
Hospital performance While state and territory governments collect information on hospital performance, a large proportion of this data is not publically available. However, data that is available suggests there is large variation in hospital performance, both from a clinical perspective and financial perspective.
Data on hospital admission rates show there is large variation in the use of surgical procedures across Australia. Between 2010-11 and 2012-13, the rate per 100,000 people for knee arthroscopy hospital admissions for people 55 years and over varied by 4.2 times across local areas. There were also 17,000
161,492
107,680
93,14989,440
87,850
59,416
52,510
19,890
16,28112,233
11,913 General surgery
Orthopaedic surgery
Urology
Ophthalmology
Gynaecology
Ear, nose and throat surgery
Plastic surgery
Other
Vascular surgery
Cardio‐thoracic surgery
Neurosurgery
CENTRE FOR THE HEALTH ECONOMY
10
lumbar spine surgery admissions on average each year (including spinal fusion procedures), despite little evidence to suggest this surgery helps painful degenerative back conditions.[6]
Despite community expectations, a large proportion of health care workers are not delivering care based on established evidence or protocol. Across 22 common conditions in Australia, the CareTrack study found that Australians receive care in health care practices or hospitals that is consistent with evidence or consensus based guidelines in only 57 per cent of encounters (on average). Compliance ranged from 13 per cent (for alcohol dependence) to 90 per cent (for coronary artery disease) across conditions. Appropriate care for surgical site infection was only followed in 38 per cent of encounters.[7]
Data also show that hospitalisation can lead to patient harm. In 2014-15, around 5.6 per cent of all patients admitted to hospital experienced an adverse event and around 8.8 per cent of patients acquired another condition within the hospital.[8] Data from the Australian Institute of Health and Welfare suggest there is large variance in hospital quality. For example, out of 443 public hospitals reporting healthcare associated Staphylococcus aureus bloodstream infections in 2013-14, the infection rate ranged from 0 per 10,000 bed days to 2.89 per 10,000 bed days.
Given variability in hospital quality across hospitals of the same peer group, there is potential for quality improvement in Australian hospitals through benchmarking and matching best practice, despite differences in patient populations.
Current choice among elective care patients The Australian hospital sector is a mixed public private system offering a number of choices to patients. Patients can receive elective surgery in a public hospital as a public patient and receive treatment without any co-payments. Alternatively, patients can enter a public hospital as a private patient and receive treatment with, or without, co-payments depending on the ‘gap’ arrangement with their private health insurer and negotiations with the public hospital.
Patients can also access elective surgery through a private hospital as a private patient and receive treatment with, or without, co-payments depending on their ‘gap’ arrangement with their private health insurer. The majority of people using private hospitals have hospital cover, although patients can also self-fund their care, and some patients are funded by other means, such as workers compensation schemes. The Repatriation Private Patient Principles 2004 allow Department of Veterans Affairs entitled persons to be admitted to public or private hospitals as private patients with the specialist of their choice.[9]
If a patient is treated privately, they can choose their hospital (including some public hospitals), their surgeon and will usually have access to better room facilities (e.g., television). In contrast, if a patient is treated publically, they have limited choice over which hospital they will attend, and which specialist will treat them. Their room is often shared with others and access to additional room facilities can be purchased at their own cost.
In some states and territories patients can receive care in a private hospital as a public patient, which is typically undertaken when the public patient cannot receive care within the maximum waiting time associated with the assigned clinical category. One example is the Competitive Elective Surgery Funding Initiative (CESFI) in Victoria. However, this is not a choice offered to a public patient, instead dictated by a referral system managed by either a public hospital or government.
CENTRE FOR THE HEALTH ECONOMY
11
Choice with the public hospital sector
Accessing elective surgery care in public hospitals is similar across states and territories. In general, the patient first sees a GP and may receive a script for medication and diagnostic test referral. Based on diagnostic test results, the GP may refer the patient to a specialist for further opinion. The GP will usually provide the patient with several options, and may ask the patient whether they would like to be treated as a public or private patient.
The pathway to a specialist as a public patient will differ according to where a person lives. In NSW a GP typically refers the patient to an outpatient clinic attached to a hospital, which determines which specialist (from their surgical team) is allocated to the patient. The patient has no choice over the specialists and may not know who is operating until the day of surgery. While there is no co-payment, patients generally face long waiting times for an initial consultation.
Alternatively, a GP can refer a public patient to a specialist located anywhere in NSW, although to receive care within a particular hospital the specialist must be contracted and appropriately qualified with the local health district (LHD), and have admitting rights to the hospital. Most patients will make a co-payment for the initial consultation if treated as a private patient as few specialists bulk bill.
A patient is generally directed to a specialist attached to the patient’s local public hospital as a matter of patient convenience. While GPs seek high quality specialists for their patients, there is no formal performance information on specialists that can be drawn upon when making a choice. Usually, the GP refers from a shortlist of specialists that have an established relationship with the GP, and provides a number of specialists contact details given some specialists have longer consultation waiting times than others.
If the specialist decides the patient requires elective care, the patient will be referred back to the hospital with an assigned clinical priority category. The hospital manages the planned admission date based on the clinical priority and hospital capacity.
If the referring specialist does not have enough operating time to undertake the surgery within the maximum waiting time for the assigned category, the patient will be transferred onto another specialist waiting list with a shorter waiting time, or another hospital within the same LHD.
In other states and territories, the GP will typically refer the patient to the nearest hospital or central triage location based on the patient’s residential postcode (e.g., in Victoria and Western Australia).[10, 11] If the referral is deemed appropriate, the patient will be placed on a wait list for an outpatient consultation with a specialist. Neither the patient nor GP has a choice over which specialist is assigned to the patient by the local surgical team. While GPs can refer patients to other hospitals outside the patient’s catchment area, in practice these referrals are often rejected and sent back to GPs, with directions to refer the patient to the public hospital within the patient’s catchment area.
Existing restrictions on public hospital choice
In theory, public patients seeking elective surgery in Australia can choose any public hospital. In practice, patients are generally directed by GPs towards their local hospital as a matter of convenience, and in the case of hospital outpatient clinics and central triage, are assigned a surgical team based on resource availability. Often public hospitals will reject a referral if the patient lives outside the hospital catchment area.
Access to elective surgery for public patients is also restricted through the use of waiting lists, with patients treated in queue order within each clinical urgency category. And despite variation in waiting
CENTRE FOR THE HEALTH ECONOMY
12
list times across public hospitals for the same surgical procedure, many GPs do not actively guide public patients towards public hospitals with shorter waiting times. However, local health districts / networks and state governments often help patients at the risk of waiting longer than clinical priority time frames to access alternative public hospitals (and potentially private hospitals) with shorter waiting times.
There is also limited information on the comparative performance of public hospitals, and no formal metrics on the comparative performance of specialists. This means any choice of public hospital or specialist is not an informed choice.
Some state and territory governments make a limited set of hospital performance information publically available, but up-to-date indicators relevant for elective surgery generally relate to waiting times and hospital infection rates only. There is no systematic data collection on health outcomes made publically available, and while patient satisfaction is collected across public hospitals through surveys, up-to-date results are generally made available to health departments and health services only, with the public having to rely on delayed survey results.
Towards greater choice in health care In recent years there has been a greater focus on the use of competition to improve choice and productivity within the Australian economy. The Australian Government completed a review of Competition Policy in 2015,[12] and has subsequently tasked the Productivity Commission to further explore areas within health and human services that could benefit from greater competition.[13]
State and territory governments are also pursuing greater competition, through the use of commissioning and contestability for public service provision. The objectives are primarily to improve public service quality and increase efficiencies.[14]
A review of competition policy in Australia
A review of Competition Policy was completed in 2015. Known as the ‘Harper Review’, the objective was to review the current competition landscape within Australia, including policy and legislation, to provide recommendations to support economic growth and social wellbeing.
Recommendations included the need to change legislative frameworks and government policies that unnecessarily restrict competition, and for governments to promote informed consumer choice when funding, procuring or providing goods and services. This also included retaining the public interest test presented within Clause 1(3) of the Competition Principles Agreement, such that decisions on restricting competition should only be undertaken if benefits outweigh costs.[12]
The Review Panel identified human services (health, education and community services) as an area for immediate competition reform. It suggested that small benefits derived from improved competition could have a significant effect on the economy given the size of the human services sector.[12] This point was reiterated in relation to health care by the Productivity Commission.[13]
The Review Panel made several recommendations to adopt choice and competition principles in human services sectors. In particular, the Review Panel recommended that ‘User choice should be placed and the heart of service delivery’ within human services sectors, suggesting that consumers are best placed to decide which service they prefer. This should be coupled with quality services, access to relevant information, low switching costs, and advisors that can help people choose in sectors where choice is difficult to make.[12]
CENTRE FOR THE HEALTH ECONOMY
13
Introducing competition and informed user choice into human services
Following the completion of the Competition Policy review, the Australian Government asked the Productivity Commission to further explore the potential to introduce greater competition and informed user choice into the human services sector.
An initial report identified services that are ‘best suited’ to generate benefits from greater choice.[13] Public hospital services were noted as one of six areas for potential reform. The Productivity Commission suggested that greater competition and contestability could improve patient choice for the most disadvantaged groups and improve outcomes through a reduction in the variability of quality across providers.
The Productivity Commission is still seeking information from the public on what type of public hospital services are best suited to greater choice and competition, how to deliver greater choice, and the information required to ensure patients are informed when choosing.[15] It is due to provide recommendations to the Australian Government on policy for increasing informed user choice in public hospitals towards the end of 2017.
Study objectives International research suggests patients want more choice over their health care. People feel empowered with choice, and when provided with choice, they exercise their right to choose. Yet demographic and socioeconomic status can impact willingness to choose. Some people find it difficult to interpret and use performance information. Others like the convenience of their local hospital, willing to trade off better quality for reduced travel distance.
While international research suggests greater choice within a public hospital system can improve hospital quality and health outcomes,[16, 17] this will only occur in Australia if patients value quality and exercise their right to choose. Given nearly half of all Australians have health insurance covering private hospital services, and that distances between public hospitals outside capital cities can be vast, Australians may choose ‘not to choose’. This would limit the benefits of any pro-choice policy introduced into the public hospital sector.
The objectives of this study were to assess whether Australians want more choice over their public hospital care for elective surgery, and to what extent they value hospital quality relative to convenience. A discrete choice experiment was employed, surveying 1,000 Australians aged 50 to 75 years.
Additional questions were asked of respondents to explore whether patients may have difficulties interpreting and using hospital performance information when choosing between alternative public hospitals for elective surgery, whether difficulties in making choice may be heterogeneous across socio-demographic characteristics, and whether patients will seek help when choosing between hospitals.
Better understanding whether public patients will exercise their choice across public hospitals given the opportunity will provide state and territory governments with an indication on whether they should pursue greater choice within the public hospital system. It will also provide insight into whether competitive markets should be structured around the patient, or whether a more wholesale approach should be used, for example whereby governments allow hospitals to contest for blocks of patients without allowing patients to choose.
CENTRE FOR THE HEALTH ECONOMY
14
2. The value of choice There are two potential benefits to patients from allowing them to choose a public hospital for elective surgery based on performance information. These include patient empowerment and improved health outcomes.
However, providing greater hospital choice to patients is fraught with difficulties. While patients value choice, several barriers have restricted informed hospital choice in practice, such as access to appropriate information, low health literacy, low participation from GPs in helping patients choose, political and economic barriers, trust and equity concerns.[18, 19]
This chapter describes the value of choice in health care, first discussing empirical research on benefits derived from increasing hospital choice in other health care systems (primarily NHS England). It then explores how choices are made in practice, exploring whether patients want more choice given healthcare decisions can be complex, and how quality information is used by patients to make an informed choice. The chapter concludes by discussing patient choice constraints found in other health care systems.
Improving health outcomes through choice Australia has a long history of competition in health care to varying degrees, such as between public and private hospitals, and within primary care and diagnostic sectors. Yet there is limited evidence on the impact of competition on outcomes. Two studies that have investigated the role of competition in the Victorian hospital sector suggest that competition can improve efficiency and quality, but this depends on the measures of quality and competition used.[20, 21]
Over the last 25 years England has been experimenting with greater choice and competition within the English National Health Service (NHS). One significant change that increased choice within the hospital sector started in 2006. Patients undergoing elective surgery were provided information on the quality, timeliness and distance to care and offered the choice of at least five hospitals by their GP, including one private hospital. This was managed through a ‘Choose and book’ system. By 2008, patients could choose any public or private hospital covered by NHS England. Prior to 2006, public patients could not choose their hospital, instead being directed by the GP to their local hospital.
These reforms were introduced alongside other changes. Prices for elective surgery were centrally set, and hospitals received funding based on the number and type of diagnosis treated, similar to activity based funding based on Diagnosis Related Groups (DRGs) found in Australia. There was substantial growth in the NHS budget, greater autonomy to managers of high performing hospitals, introduction of financial incentives to reduce waiting times, and stronger performance management through rewards and sanctions around targets.[22, 23]
Empirical evidence suggests greater hospital choice led to improved outcomes. There was a changing pattern of care, with patients in areas with greater hospital competition choosing to receive elective care in hospitals with lower mortality rates and lower mean length of stay. This had saved lives by reducing
CENTRE FOR THE HEALTH ECONOMY
15
the risk of dying without raising costs.[24] Patients demanded hospitals with greater quality in areas that offer more choice.[24]
Death rates from heart attacks also decreased quicker in areas with greater hospital competition, with the reforms leading to 300 fewer deaths per year.[16] Competition for elective patients increased quality across the entire hospital through measures such as undertaking clinical audits, improving governance and management, and investing in new technology.[16]
Similar results were found for Coronary Artery Bypass Graft (CABG) surgery, with patients becoming more responsive overall to hospital quality when making choices, with the effect stronger for less healthy and lower income patients. Hospitals in areas where patients valued quality relatively more than other patients experienced the greatest mortality rate reductions.[17]
Public hospitals also increased their efficiency through reduced length of stay, without any evidence of people leaving worse off or hospitals avoiding sicker patients.[25] But private hospitals started treating healthier patients and leaving public hospitals with costly patients. This highlights the importance of getting regulation and funding models right to drive appropriate behaviours.
While research suggested the English NHS hospital choice reforms led to improved quality, one concern was the potential for inequitable outcomes.[23] It was thought competition could lead to cream skimming, with hospitals avoiding patients that are more costly to treat, such as those with several comorbidities or poorer people. It was also thought that competition could motivate hospital managers around their own self-interest rather than pursuing more social objectives, leading to some managers removing resources allocated to services used by sicker or poorer patients. Lower socioeconomic groups may also face greater barriers to accessing and using quality information, and have their choice restricted because they were less willing to travel.
Empirical evidence suggests there was a slight increase in the use of hospital services in deprived areas, while there was no change in non-deprived areas. Competition had improved access to care for those most in need. [25] Another study found that hospitals in more competitive areas treated a greater proportion of patients with less wealth.[25]
While these results are specific to the English NHS hospital choice reforms, increased competition and choice within health care has been pursued elsewhere (including the US, Denmark, the Netherlands, Germany and Sweden) as governments seek to reform their health care systems to improve hospital efficiency.[17] Research suggests competition can lead to worse health outcomes, particularly if providers compete on price and quality, although the majority of recent literature suggests increased hospital choice has improved hospital quality and health outcomes.[26, 27]
Making choices in health care Improved hospital quality derived from greater patient choice will only occur if patients exercise their right to choose. However, most patients find it difficult to make an informed choice. Often patients are not aware of what information is important, do not have access to all relevant information, and have limited cognitive abilities to confidently process performance information for their own needs. This reduces their willingness to choose.[25]
Patients also often perceive hospital quality information as complex and imperfect. Patient advocacy groups have suggested patients require greater data transparency on hospital quality to decrease
CENTRE FOR THE HEALTH ECONOMY
16
information asymmetry between providers and patients, thereby empowering patients to better participate in health care choices.[28, 29]
Risk adjustment is often required to enable appropriate comparison between hospitals given some hospitals treat sicker patients.[29] Patients may make suboptimal choices if quality information is not available or simple to interpret, or does not meet patient preferences.[30]
In countries that have introduced greater patient hospital choice (e.g., England and the Netherlands), GPs play a key role in the decision making process, helping patients interpret performance information within the context of their needs. However, large variation in patient choice still exists, with many patients either not receiving a choice, or not participating in discussions with their GP around hospital quality when making a choice.[31] To some extent this is due to limited appropriate performance information, forcing some patients to base their decisions on imperfect information.[32]
While governments and providers do collect a myriad of performance information, political and economic factors can restrict transparent public reporting.[33] And while patients value performance information, some patients lack trust in using government sourced hospital performance information, which limits their willingness to use this information when making a hospital choice.[34]
Do patients want more choice? Providing hospital choice does not necessarily mean patients will choose or use quality information to inform their choice.[35] Some patients do not question the quality of their local hospital, some are sceptical towards performance information, and some do not value choice. Others are limited by the degree of choice due to low health literacy, limited access to transportation to alternative hospitals and long waiting times.[29, 33]
Publicly disclosed hospital quality information coupled with choice can allow patients to become more involved in their care process if desired. Given the choice, many patients are willing to choose their health care provider.[36] A European survey found that 86 per cent of consumers would like to choose their hospital,[37] although some patients would still rely on health care professionals to make their choice, particularly if they require urgent care.[38]
But willingness to choose between alternative hospitals varies across patient characteristics. A study investigating the English hospital choice reforms introduced in 2006 found that patients aged 51 to 80 years, from non-white backgrounds, female, those with no qualifications and those with a bad past experience of their local hospital placed more importance on receiving a hospital choice.[39] Other studies have also found willingness for greater choice depends on patient characteristics and socioeconomic status.[40] Higher education is positively associated with involvement in hospital choice,[41] while increased age and lower socioeconomic status are negatively associated with patient choice and ability to travel beyond their nearest hospital.[42]
Health literacy levels may also impact whether patients exercise their right to choose. Those with low levels of health literacy may need support to make an informed decision.[30] Some have argued that people without internet access require additional support, otherwise they are more likely to default to their local provider.[39]
CENTRE FOR THE HEALTH ECONOMY
17
How is quality information used by patients?
Interpretation of quality information
As websites with health care quality information gain momentum, patients will have an increasing amount of information to make a choice. While there is a proliferation of these websites in other countries, such as the US, awareness and use of information contained within these websites is still limited, although patients with high health care utilisation tend to use them more.[43]
While governments and various stakeholders invest heavily in providing health care information, more research is required on how this information is best presented, and how patients use it within their decision-making process. There is a risk that complex hospital quality information causes patient confusion.[44] Some argue performance information is rarely used by patients when making a choice as they already have an opinion about alternative hospitals prior to quality information becoming publicly available.[45]
Patients often find performance information difficult to interpret relative to their personal context.[40] Two implicit assumptions must be made by the patient when using performance information for choice. Past performance must reflect expected future performance (stability), and the reported patient population must be similar to the patient making the choice (applicability).[33] Performance information must also be timely to ensure patients believe its validity.
While these assumptions may be incorrect within some circumstances, they generally hold. A US study found two year old hospital quality data can strongly predict future performance.[46] Furthermore, risk adjusted patient reported outcomes have been used to successfully indicate which hospitals lead to better health outcomes in England.[47]
Attributes assessed by patients when choosing between hospitals
Patients often need to assess hospital quality, clinicians’ interpersonal skills and health outcomes when making a hospital choice, among other dimensions.[45] Preferences for these dimensions differ across patients depending on disease groups, age groups and socioeconomic groups.[29] Preferences are also driven by unobserved patient characteristics, and some random component.
There is a vast literature on which attributes patients value when making an informed hospital choice. The distance from home to hospital has been identified as the most valued by patients.[48, 49] A recent study in England found that patients are willing to travel to hospitals with better health outcomes, and that traditional quality measures, such as mortality, were less important to patients.[50]
While patients value technical quality attributes and interpersonal skills of staff,[51] satisfaction with prior hospital admissions and hospital reputation are other attributes valued by patients.[45] A study in the Netherlands reported that patients find information based on other patients’ experience as useful as hospital-based information.[52] This is supported by several studies showing the important influence of previous personal experience and experiences of family and friends.[52, 53]
Support in the patient decision-making process
Decision-making processes vary across patients, along with their preferred level of involvement in making hospital choices.[44] Patients have different support requirements in their decision-making

CENTRE FOR THE HEALTH ECONOMY
18
processes depending on socio-economic background and care needs. They also require education and support to improve their health literacy to better interpret hospital quality information.[54] Furthermore, data needs to be presented in a way that support elderly and lower-skilled individuals.[40]
Some governments have provide assistance to disadvantaged groups to facilitate the uptake of patient choice and promote equitable access to hospitals.[55] Within the English NHS, choice has been facilitated by free transport for patients on low incomes and those requiring transport due to medical need.[56] Other policy suggestions include identifying and addressing special needs for choice regarding disability and language, helping patients book providers and navigate the system, and supporting patients to increase their ability to self-manage their own health.[55]
CENTRE FOR THE HEALTH ECONOMY
19
3. Methodology The objectives of this study were to assess whether Australians want more choice over their public hospital care for elective surgery, and to what extent they value hospital quality relative to convenience.
A representative sample of 1,000 Australians aged 50 to 75 years selected through Toluna Australia (a research panel company) were surveyed to collect information on attitudes towards the health care system, desire to receive greater choice over public hospitals, and potential difficulties in making choices between hospitals.2
A discrete choice experiment (DCE) using the same representative sample was employed to measure the strength of preferences over attributes related to convenience (waiting times and distance from home to hospital) and hospital quality represented by hospital performance metrics, potential health gain, GP opinion and other patient experiences.3
The development of the survey and discrete choice experiment were informed through interviews undertaken with 20 public members, and a pilot undertaken with 100 Australians selected through Toluna Australia.4
This chapter provides an overview of the survey questions asked of respondents, including their individual characteristics, and attitudes towards the current health care system. It also provides a summary of the discrete choice experiment approach.
Survey questions Respondents were asked a number of questions within the survey to collect information on their individual characteristics and attitudes towards the current health care system. These were used to test whether preferences for alternative hospital attributes are impacted by these factors.
Individual characteristics
A number of questions were included in the survey to collect information on respondents’ individual characteristics. These included age, gender, education level, postcode, employment status, household income, private health insurance status, self-rated health, self-rated health literacy, past elective surgery experience, and usage of Australian websites providing hospital quality information.
2 See Appendix A for more information on survey administration and Appendix B for more information on sample characteristics.
3 See Appendix C for more information on development of the DCE. 4 Ethics was provided by Macquarie University in accordance with the National Health and Medical Research Council's (NHMRC) National Statement on Ethical Conduct in Human Research (2007) and the CPMP/ICH Note for Guidance on Good Clinical Practice.
CENTRE FOR THE HEALTH ECONOMY
20
Attitudes towards the current health care system
Four questions were included in the survey to explore respondents’ attitudes towards the current health care system. These include their view of reform needed within the current public hospital system, rating of the quality of health received in the last 12 months, satisfaction with the amount of choice available in the public hospital system as a public patient, and preferences between more choice over public hospitals versus more choice over surgeons in public hospitals.
Discrete choice experiment To understand patients’ preferences when choosing public hospitals is fundamental for the design and evaluation of any pro-choice policy in public hospitals. As choice is currently limited for public patients, there is no revealed preference data to explore how patients would choose a public hospital given they had greater choice.
A discrete choice experiment (DCE) is a survey technique for eliciting preferences that can be used in the absence of revealed preference data. It provides hypothetical scenarios with at least two choices of a service or product described by various attributes and levels, and asks respondents to choose their most preferred option.
DCEs were originally developed in the marketing literature to determine how individuals choose between alternative products or services with unobserved choice, for example, with products or services that have not been released into the market.
They are based on the theory of consumer demand, which states that people consider the combination of all product (or service) attributes and their levels when choosing their most preferred.[57] Respondents are assumed to choose the product (or service) they value the most, thereby implicitly revealing their individual preferences for alternative attributes and their levels.
A DCE for public hospital choice
A DCE was employed to measure preferences for alternative public hospital attribute levels for public patients undergoing elective surgery. Two hypothetical scenarios were developed that asked each respondent to assume they were advised by a specialist to undergo total hip replacement surgery.5
Respondents were also asked to imagine a health score associated with their condition using a visual analogue scale. The health score was based on the average score of similar patients’ self-rated health state before undergoing elective hip surgery in England. Respondents were also informed about patients’ average score without hip problems.
Further information was given to respondents on the expected length of hospitalisation post-surgery. This information was provided to help respondents position themselves in the hypothetical situation, given their ability to imagine the severity of the health condition is crucial to the external validity of their stated choices. It also controlled for potential confounding factors, by minimising the additional assumptions respondents need to make.
5 See Appendix C for further information on development of the DCE, and limitations with a DCE approach.
CENTRE FOR THE HEALTH ECONOMY
21
The two hypothetical scenarios differed in terms of urgency levels between semi-urgent (surgery needed within 90 days) and non-urgent (surgery needed within 365 days). This allowed the impact of surgical urgency on preferences for public hospital characteristics to be tested. Another key difference between the two scenarios was the waiting time attribute, with levels reflecting each urgency category.
Total hip replacement surgery was used for each scenario because it is one of the most common elective surgeries Australians undertake each year, costing Australian governments over $1 billion annually. Furthermore, total hip replacement surgery is mostly classified as semi-urgent or non-urgent, which would provide patients with time to choose their public hospital given the choice.
The target population was Australians between 50 to 75 years of age. This age group was chosen based on their expected need for elective surgery in the immediate future, and their perceived capacity to undertake the survey and DCE via the Internet.
Toluna Australia was employed to recruit 1,000 eligible respondents, targeted by age and gender. Respondents were randomised into two alternative DCEs and asked to imagine two hypothetical settings.
Hospitals were described using seven attributes, with each attribute further described using four levels (see Table 1). Within the DCE, each choice set contained two options labelled “Hospital A” and “Hospital B”. Each hospital was described using seven attributes, with their levels changing across each choice set. Respondents were asked to choose their most preferred hospital across 12 choice sets in total. An example of one choice set is presented in Figure 1.
Assessing DCE responses
The analysis of the choice data was based on the framework provided by random utility theory where the utility that respondent derives from choosing alternative in choice set is given by
; 1, … ,500; 1, … , 12;
where is a vector of variables representing attributes of alternative and is a vector of coefficients.
For the forced choice model, 1,2; for the unforced choice model, 1,2,3.
The conditional logit model was used given the errors were assumed to be independently and
identically distributed as type 1 extreme value. All models were estimated in STATA 14.
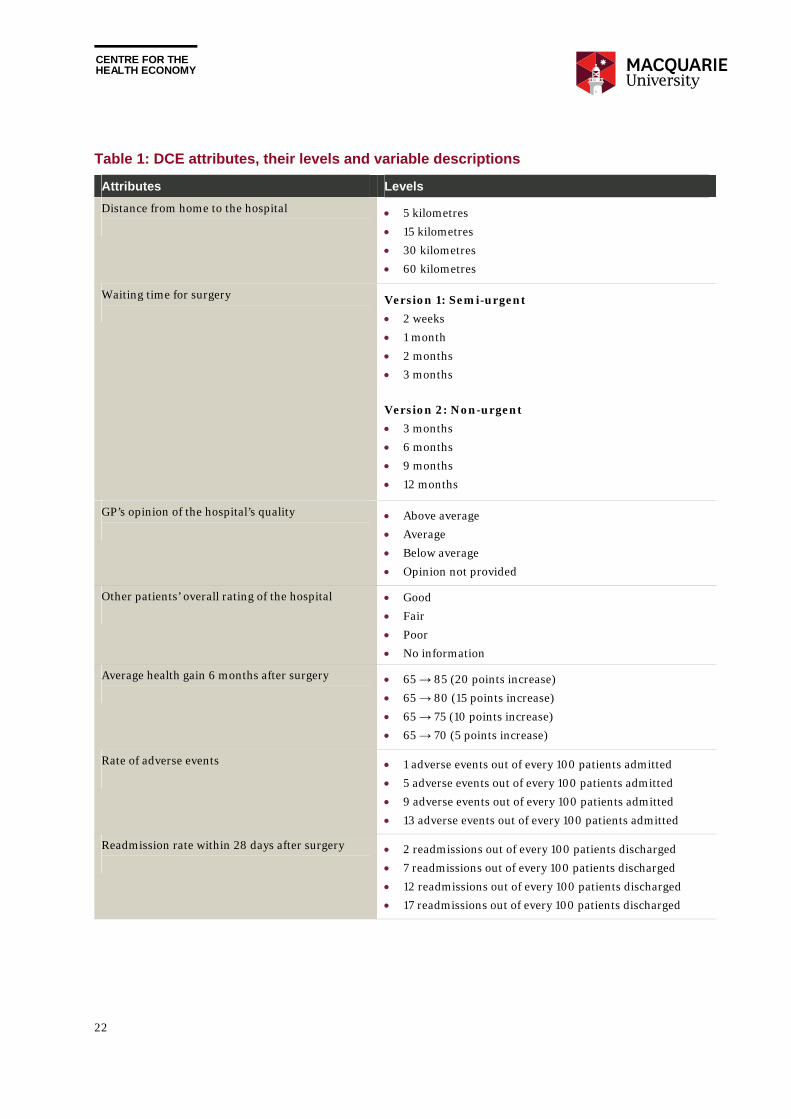
CENTRE FOR THE HEALTH ECONOMY
22
Table 1: DCE attributes, their levels and variable descriptions
Attributes Levels
Distance from home to the hospital
5 kilometres
15 kilometres
30 kilometres
60 kilometres
Waiting time for surgery
Version 1: Semi-urgent
2 weeks
1 month
2 months
3 months
Version 2: Non-urgent
3 months
6 months
9 months
12 months
GP’s opinion of the hospital’s quality
Above average
Average
Below average
Opinion not provided
Other patients’ overall rating of the hospital
Good
Fair
Poor
No information
Average health gain 6 months after surgery
65 → 85 (20 points increase)
65 → 80 (15 points increase)
65 → 75 (10 points increase)
65 → 70 (5 points increase)
Rate of adverse events
1 adverse events out of every 100 patients admitted
5 adverse events out of every 100 patients admitted
9 adverse events out of every 100 patients admitted
13 adverse events out of every 100 patients admitted
Readmission rate within 28 days after surgery
2 readmissions out of every 100 patients discharged
7 readmissions out of every 100 patients discharged
12 readmissions out of every 100 patients discharged
17 readmissions out of every 100 patients discharged
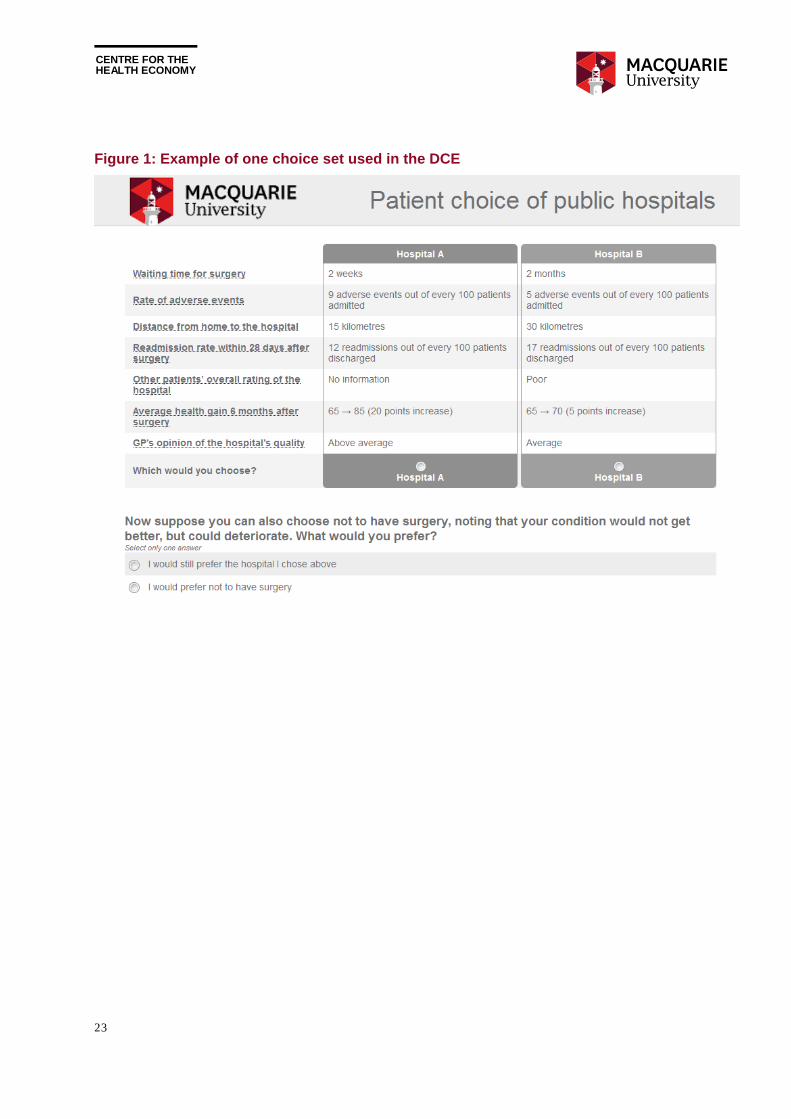
CENTRE FOR THE HEALTH ECONOMY
23
Figure 1: Example of one choice set used in the DCE
CENTRE FOR THE HEALTH ECONOMY
24
4. Attitudes towards public hospitals and choice
Research suggests that patients want more choice over their health care provider. However, their willingness to choose, and the value patients place on alternative attributes of care differs depending on their socioeconomic and demographic status, their experience with the health care system, and their attitudes towards the health care system and choice.
This chapter presents summary results from survey questions presented to a representative sample of 1,000 Australians aged 50 to 75 years selected through Toluna Australia. It discusses current satisfaction with public hospitals and the health care system, use of hospital performance information publically available in Australia, the desire for more choice, and the approach used for choosing between two hypothetical hospitals presented in the discrete choice experiment.
Satisfaction with public hospitals Respondents were asked a number of questions regarding their attitudes towards the Australian health care system and public hospitals in particular. Overall, while many respondents are satisfied with the health care system and public hospitals, others are less than satisfied, and desire fundamental change to the way public hospital systems operate.
Respondents who had been admitted to a hospital for elective surgery were asked about their level of satisfaction with their most recent hospital experience (see Chart 2). Around 65 per cent of respondents were very satisfied with their experience, while 34 per cent were either somewhat satisfied, not very satisfied, or not satisfied at all. Around 1 per cent did not know their level of satisfaction.
Respondents were also asked to rate the quality of health care they had received in the last 12 months. Of those receiving care within the last 12 months, around 90 per cent thought they had received either good, very good, or excellent care (see Chart 3). Only six per cent and three per cent of respondents believed their health care received in the last 12 months was fair or poor respectively.
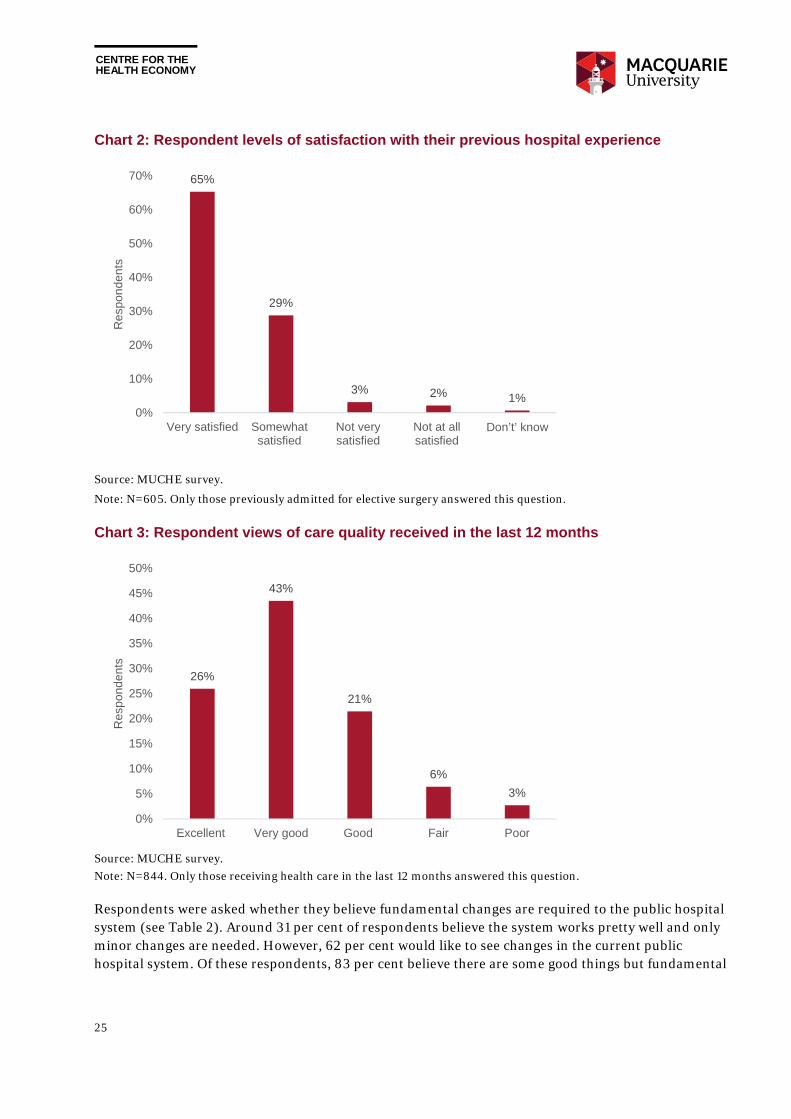
CENTRE FOR THE HEALTH ECONOMY
25
Chart 2: Respondent levels of satisfaction with their previous hospital experience
Source: MUCHE survey.
Note: N=605. Only those previously admitted for elective surgery answered this question.
Chart 3: Respondent views of care quality received in the last 12 months
Source: MUCHE survey.
Note: N=844. Only those receiving health care in the last 12 months answered this question.
Respondents were asked whether they believe fundamental changes are required to the public hospital system (see Table 2). Around 31 per cent of respondents believe the system works pretty well and only minor changes are needed. However, 62 per cent would like to see changes in the current public hospital system. Of these respondents, 83 per cent believe there are some good things but fundamental
65%
29%
3% 2% 1%0%
10%
20%
30%
40%
50%
60%
70%
Very satisfied Somewhatsatisfied
Not verysatisfied
Not at allsatisfied
Don’t’ know
Re
spo
nd
ents
26%
43%
21%
6%
3%
0%
5%
10%
15%
20%
25%
30%
35%
40%
45%
50%
Excellent Very good Good Fair Poor
Res
po
nde
nts
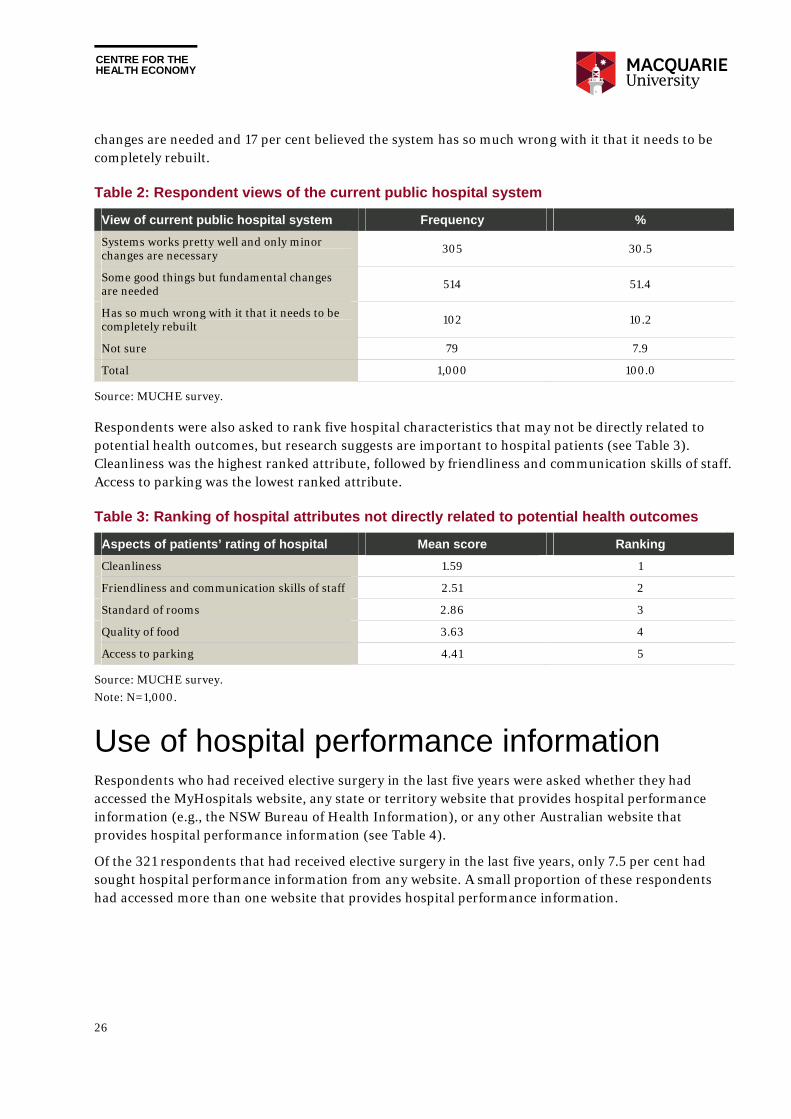
CENTRE FOR THE HEALTH ECONOMY
26
changes are needed and 17 per cent believed the system has so much wrong with it that it needs to be completely rebuilt.
Table 2: Respondent views of the current public hospital system
View of current public hospital system Frequency %
Systems works pretty well and only minor changes are necessary 305 30.5
Some good things but fundamental changes are needed 514 51.4
Has so much wrong with it that it needs to be completely rebuilt 102 10.2
Not sure 79 7.9
Total 1,000 100.0
Source: MUCHE survey.
Respondents were also asked to rank five hospital characteristics that may not be directly related to potential health outcomes, but research suggests are important to hospital patients (see Table 3). Cleanliness was the highest ranked attribute, followed by friendliness and communication skills of staff. Access to parking was the lowest ranked attribute.
Table 3: Ranking of hospital attributes not directly related to potential health outcomes
Aspects of patients’ rating of hospital Mean score Ranking
Cleanliness 1.59 1
Friendliness and communication skills of staff 2.51 2
Standard of rooms 2.86 3
Quality of food 3.63 4
Access to parking 4.41 5
Source: MUCHE survey.
Note: N=1,000.
Use of hospital performance information Respondents who had received elective surgery in the last five years were asked whether they had accessed the MyHospitals website, any state or territory website that provides hospital performance information (e.g., the NSW Bureau of Health Information), or any other Australian website that provides hospital performance information (see Table 4).
Of the 321 respondents that had received elective surgery in the last five years, only 7.5 per cent had sought hospital performance information from any website. A small proportion of these respondents had accessed more than one website that provides hospital performance information.
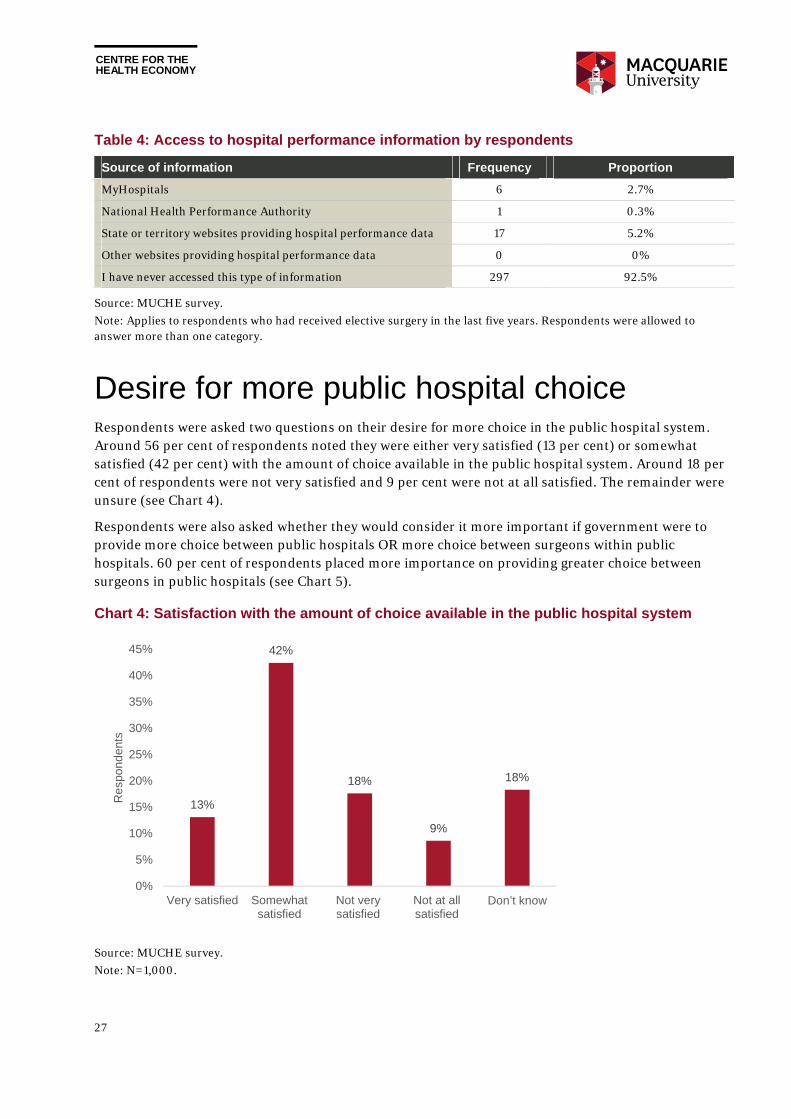
CENTRE FOR THE HEALTH ECONOMY
27
Table 4: Access to hospital performance information by respondents
Source of information Frequency Proportion
MyHospitals 6 2.7%
National Health Performance Authority 1 0.3%
State or territory websites providing hospital performance data 17 5.2%
Other websites providing hospital performance data 0 0%
I have never accessed this type of information 297 92.5%
Source: MUCHE survey.
Note: Applies to respondents who had received elective surgery in the last five years. Respondents were allowed to answer more than one category.
Desire for more public hospital choice Respondents were asked two questions on their desire for more choice in the public hospital system. Around 56 per cent of respondents noted they were either very satisfied (13 per cent) or somewhat satisfied (42 per cent) with the amount of choice available in the public hospital system. Around 18 per cent of respondents were not very satisfied and 9 per cent were not at all satisfied. The remainder were unsure (see Chart 4).
Respondents were also asked whether they would consider it more important if government were to provide more choice between public hospitals OR more choice between surgeons within public hospitals. 60 per cent of respondents placed more importance on providing greater choice between surgeons in public hospitals (see Chart 5).
Chart 4: Satisfaction with the amount of choice available in the public hospital system
Source: MUCHE survey.
Note: N=1,000.
13%
42%
18%
9%
18%
0%
5%
10%
15%
20%
25%
30%
35%
40%
45%
Very satisfied Somewhatsatisfied
Not verysatisfied
Not at allsatisfied
Don’t know
Re
spo
nd
ents
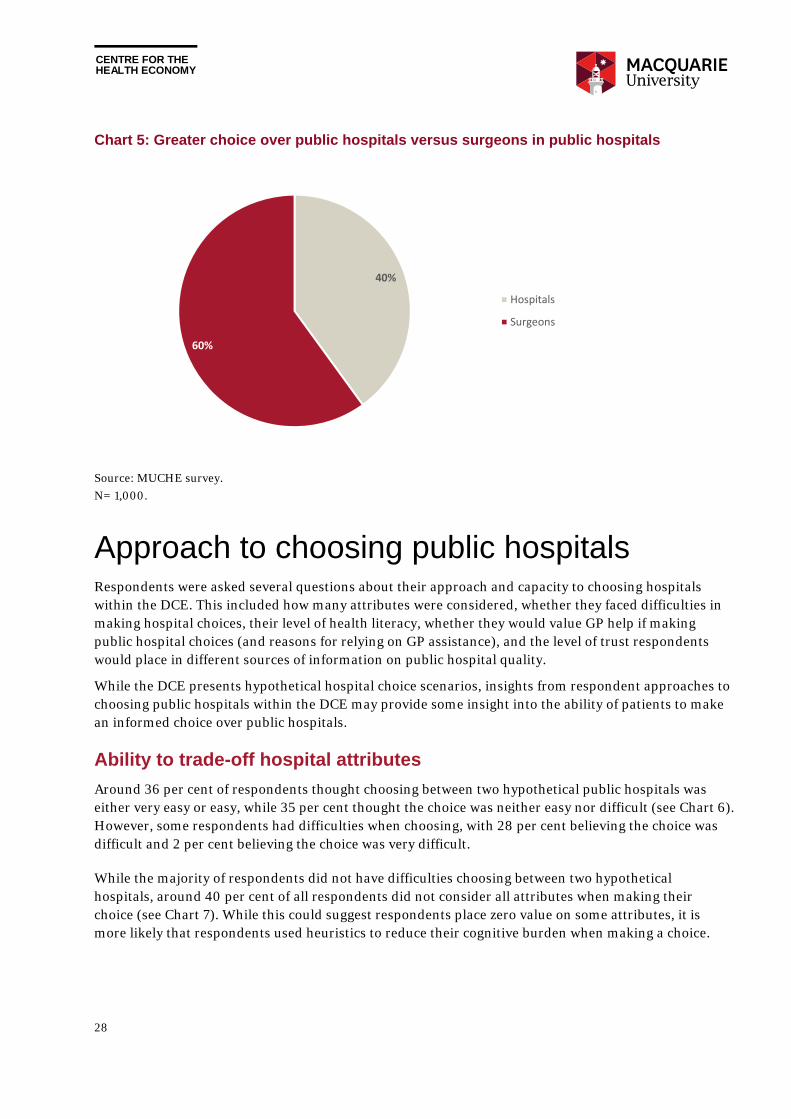
CENTRE FOR THE HEALTH ECONOMY
28
Chart 5: Greater choice over public hospitals versus surgeons in public hospitals
Source: MUCHE survey.
N= 1,000.
Approach to choosing public hospitals Respondents were asked several questions about their approach and capacity to choosing hospitals within the DCE. This included how many attributes were considered, whether they faced difficulties in making hospital choices, their level of health literacy, whether they would value GP help if making public hospital choices (and reasons for relying on GP assistance), and the level of trust respondents would place in different sources of information on public hospital quality.
While the DCE presents hypothetical hospital choice scenarios, insights from respondent approaches to choosing public hospitals within the DCE may provide some insight into the ability of patients to make an informed choice over public hospitals.
Ability to trade-off hospital attributes
Around 36 per cent of respondents thought choosing between two hypothetical public hospitals was either very easy or easy, while 35 per cent thought the choice was neither easy nor difficult (see Chart 6). However, some respondents had difficulties when choosing, with 28 per cent believing the choice was difficult and 2 per cent believing the choice was very difficult.
While the majority of respondents did not have difficulties choosing between two hypothetical hospitals, around 40 per cent of all respondents did not consider all attributes when making their choice (see Chart 7). While this could suggest respondents place zero value on some attributes, it is more likely that respondents used heuristics to reduce their cognitive burden when making a choice.
40%
60%
Hospitals
Surgeons
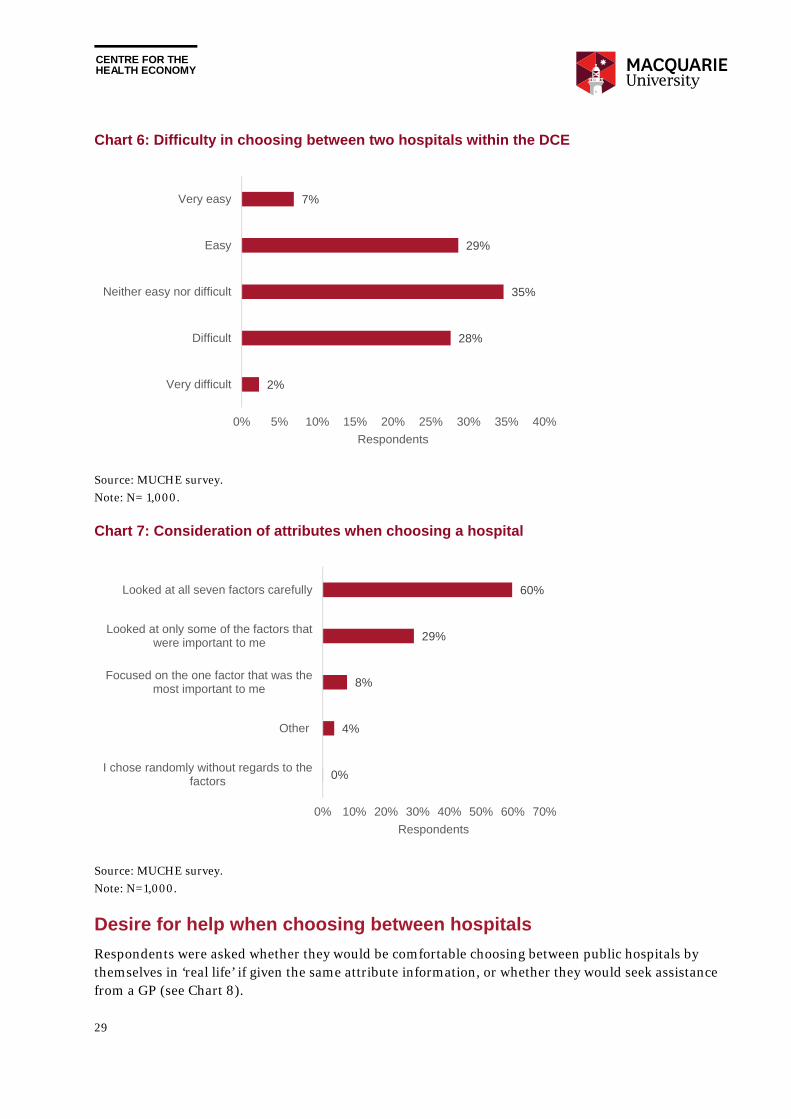
CENTRE FOR THE HEALTH ECONOMY
29
Chart 6: Difficulty in choosing between two hospitals within the DCE
Source: MUCHE survey.
Note: N= 1,000.
Chart 7: Consideration of attributes when choosing a hospital
Source: MUCHE survey.
Note: N=1,000.
Desire for help when choosing between hospitals
Respondents were asked whether they would be comfortable choosing between public hospitals by themselves in ‘real life’ if given the same attribute information, or whether they would seek assistance from a GP (see Chart 8).
2%
28%
35%
29%
7%
0% 5% 10% 15% 20% 25% 30% 35% 40%
Very difficult
Difficult
Neither easy nor difficult
Easy
Very easy
Respondents
0%
4%
8%
29%
60%
0% 10% 20% 30% 40% 50% 60% 70%
I chose randomly without regards to thefactors
Other
Focused on the one factor that was themost important to me
Looked at only some of the factors thatwere important to me
Looked at all seven factors carefully
Respondents

CENTRE FOR THE HEALTH ECONOMY
30
Chart 8: Desire for help from GP if choosing a hospital, and reasons why
Source: MUCHE survey.
Note: While responses to ‘other’ varied, three dominant themes emerged, including providing more information not publically available, providing a second opinion, and trusting the GPs advice.
Around 85 per cent noted they would prefer a GP to discuss the options with them and then choose a hospital together. Around 11 per cent noted they would be comfortable choosing a hospital by themselves, while only 5 per cent noted that they would prefer the GP to choose a hospital for them, without their input.
Those respondents that indicated they would prefer a GP to help them choose a public hospital were also asked why they would prefer GP input. Around 56 per cent noted they prefer to rely on the opinion of the GP, while 14 per cent believed they would find it difficult to choose between public hospitals. However, 26 per cent stated they had other reasons for relying on help from a GP when choosing between hospitals. This was further explored using the free text question respondents were asked to complete if they chose ‘other’.
While reasons varied, three dominant themes emerged. Many respondents thought the GP would hold additional information about the quality of each hospital and specialists working within those hospitals. They believed GPs would have access to information that is not publically available, derived from their network of medical professionals, and the experiences of their patients.
Many respondents also believed a GP can be used as a sounding board. Some respondents believed a GP would take a different perspective when thinking about hospital choice, which was valued by respondents, although many stated they would ensure the final hospital choice decision remained theirs.
Finally, many respondents noted the trust they place in their GP, and would therefore discuss their public hospital choices with the GP, knowing their GP would help them make the right choice.
85%
11%
5%
Would prefer a GP to discuss the options with me, andthen choose the hospital together
Would be comfortable choosing between alternativehospitals
Would prefer GP to choose the hospital for me, withoutmy input
N = 1,000
56%29%
14%
Prefer to rely on the opinion of a GP
Other
Found it difficult to choose between alternative hospitals
N = 892

CENTRE FOR THE HEALTH ECONOMY
31
Respondents desire for GP assistance when choosing between public hospitals may also be a reflection of poor health literacy. When respondents were asked if they were comfortable understanding written health information or understanding verbal advice from a health care professional, around 34 per cent and 25 per cent respectively stated they were only somewhat comfortable, a little bit comfortable, or not at all comfortable (see Chart 9).
Chart 9: Subjective self-reported health literacy of respondents
Source: MUCHE survey.
Note: N=1,000.
Alternatively, the desire for GP assistance may be due to a lack of trust with government information on public hospital quality. When respondents were asked which source of information they would trust to help them choose between public hospitals, 61 per cent would put absolute trust in their own previous experience. Respondents also put high levels of trust in the GP’s opinion, and the hospital experience of and family and friends. The least trusted source of public hospital quality information was government information, with around 12 per cent of respondents noting they had no trust at all, and only four per cent noting they had absolute trust (see Chart 10).
21%
45%
28%
5%1%
27%
49%
21%
4%1%
0%
10%
20%
30%
40%
50%
60%
Extremely Quite a bit Somewhat A little bit Not at all
Re
spo
nd
en
ts
Understanding written health information
Understanding verbal advice from a health care professional
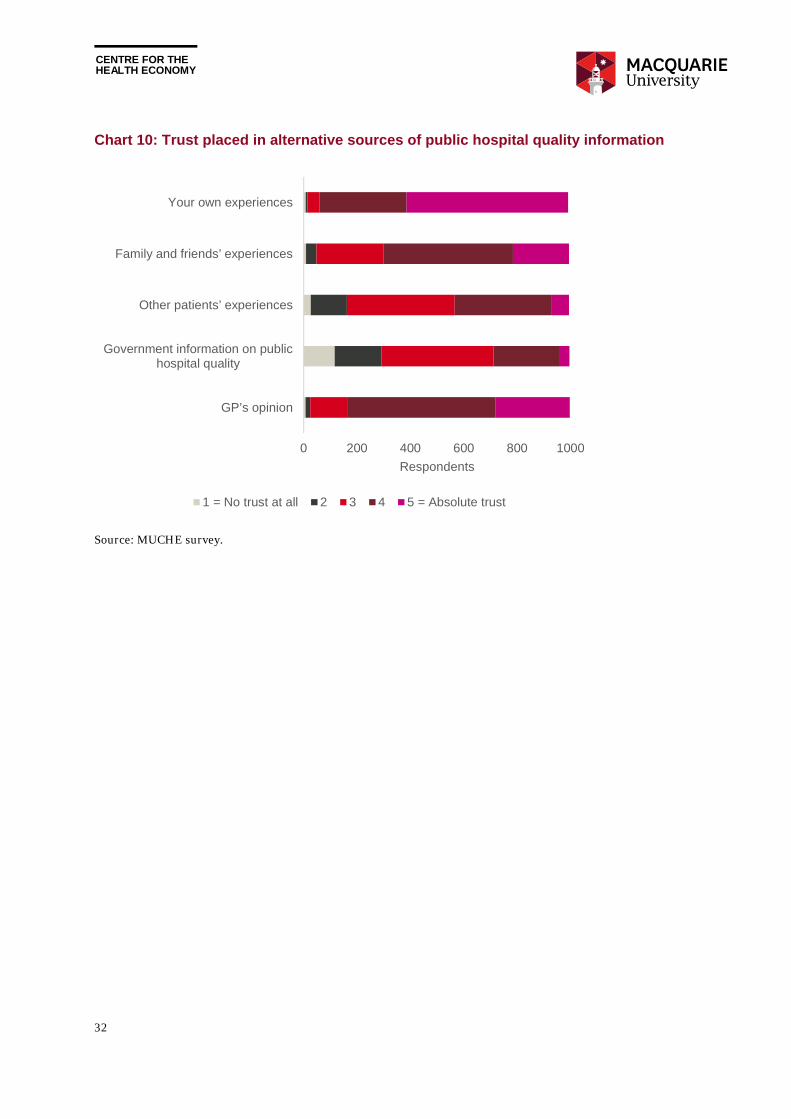
CENTRE FOR THE HEALTH ECONOMY
32
Chart 10: Trust placed in alternative sources of public hospital quality information
Source: MUCHE survey.
0 200 400 600 800 1000
GP’s opinion
Government information on publichospital quality
Other patients’ experiences
Family and friends’ experiences
Your own experiences
Respondents
1 = No trust at all 2 3 4 5 = Absolute trust
CENTRE FOR THE HEALTH ECONOMY
33
5. Preferences for hospital characteristics
The theory of consumer demand suggests utility from choosing one hospital over another would be derived from individual hospital attributes, rather than the hospital as a whole. Patients would choose the hospital where expected outputs based on those attributes are valued most. The patient would therefore aim to maximise their expected utility when making their choice.
A discrete choice experiment (DCE) was employed to replicate public hospital choice within a hypothetical scenario. By presenting hospital attributes to respondents and asking them to choose their most preferred hospital, respondents implicitly revealed the value they place on those attributes. Attributes were then ranked in terms of respondent importance, thereby providing guidance on whether respondents value quality over convenience, for example, and whether they would be willing to choose an alternative public hospital for elective surgery based on quality, if given the choice.
Respondent choice between each hypothetical public hospital within the DCE depends on three components, including:
observable levels attached to each attribute for each hospital alternative;
observable characteristics of the respondent; and
unobservable respondent characteristics, such as individual behaviour rules.
This chapter presents results from two DCEs presented to respondents, including one presented to 500 respondents under a semi-urgent elective surgery scenario, and another presented to 500 other respondents under a non-urgent elective surgery scenario. Three main questions were answered.
1. What are respondents’ preferences for choosing hospitals?
2. What hospital attributes are more important to respondents?
3. How do respondent preferences for hospital attributes differ across their characteristics?
While results separate choices made based on observable levels attached to each attribute, and observable characteristics of respondents, the impact of unobservable respondent characteristics has not been separated. This may impact the value of attributes, to the extent that unobservable characteristics impact choice.
Preference results Within the DCEs, hospitals were described using seven attributes, each having four levels. The aim was to estimate the weights respondents assigned to these levels. Each weight represents the marginal utility respondents would gain or lose when the attribute changes from the base level to another level. If the weight is negative, the base level is favoured; if positive, the other attribute level is favoured.
CENTRE FOR THE HEALTH ECONOMY
34
The size of the weight suggests the relative strength of the preference (i.e. how much a particular level is favoured against a chosen base level). In the analysis, the first level was chosen as the base level for each attribute. Preference weights for the two DCEs are reported in Table 5 and Table 6. Two sets of estimates are reported for each DCE, one from the forced choice model (choice between two hypothetical hospitals) and the other from the unforced choice model (choice among two hypothetical hospitals and the option of not attending hospital).
The results suggest that on average respondents value all attributes when making their choices, and the worse the hospital attribute becomes, the less they prefer that hospital. For example, distance2, distance3, and distance4 have negative preference weights with increasing magnitude, suggesting the hospital becomes less desirable as the distance from home increases. The alternative specific constant measures the preference strength from choosing to not choosing (i.e. opt-out). The positive sign suggests that on average respondents prefer to choose between two public hospitals rather than not attending a public hospital.
It is worth mentioning that hospitals without a patient quality rating are preferred over hospitals rated by other patients as ‘fair’, suggesting respondents may have interpreted the unavailable rating data as a signal of ‘not bad’ quality (rated between ‘fair’ and ‘good’). This is not the case for GP’s opinion of hospital quality where ‘no opinion’ is rated between ‘average’ and ‘below average’.
Forced choice versus unforced choice
Preference estimates of the forced choice and unforced choice models were compared. Estimates are overall similar and the largest difference occurs for the estimate of “patient4” for the semi-urgent DCE and of “gp2” for the non-urgent DCE. The unforced choice model was used for the analysis as it represents a closer approximation to reality (i.e., patients can always choose not to attend elective surgery).
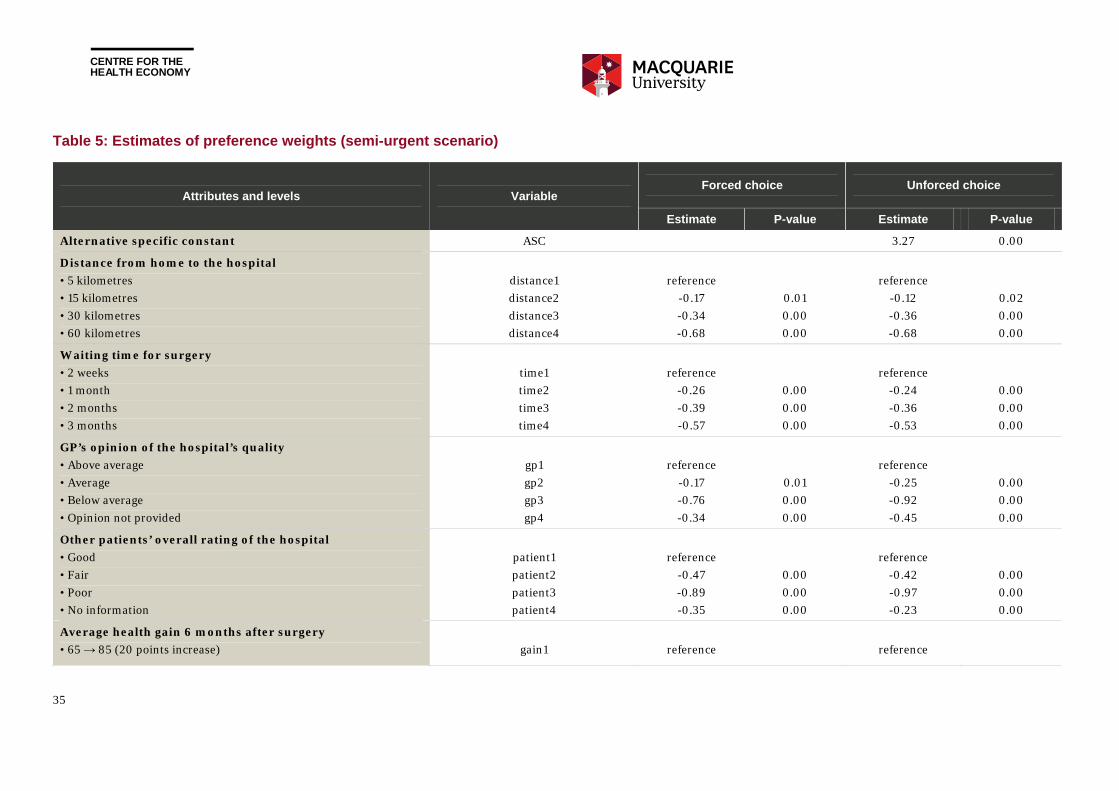
CENTRE FOR THE HEALTH ECONOMY
35
Table 5: Estimates of preference weights (semi-urgent scenario)
Attributes and levels Variable Forced choice Unforced choice
Estimate P-value Estimate P-value
Alternative specific constant ASC 3.27 0.00
Distance from home to the hospital
• 5 kilometres
• 15 kilometres
• 30 kilometres
• 60 kilometres
distance1
distance2
distance3
distance4
reference
-0.17
-0.34
-0.68
0.01
0.00
0.00
reference
-0.12
-0.36
-0.68
0.02
0.00
0.00
Waiting time for surgery
• 2 weeks
• 1 month
• 2 months
• 3 months
time1
time2
time3
time4
reference
-0.26
-0.39
-0.57
0.00
0.00
0.00
reference
-0.24
-0.36
-0.53
0.00
0.00
0.00
GP’s opinion of the hospital’s quality
• Above average
• Average
• Below average
• Opinion not provided
gp1
gp2
gp3
gp4
reference
-0.17
-0.76
-0.34
0.01
0.00
0.00
reference
-0.25
-0.92
-0.45
0.00
0.00
0.00
Other patients’ overall rating of the hospital
• Good
• Fair
• Poor
• No information
patient1
patient2
patient3
patient4
reference
-0.47
-0.89
-0.35
0.00
0.00
0.00
reference
-0.42
-0.97
-0.23
0.00
0.00
0.00
Average health gain 6 months after surgery
• 65 → 85 (20 points increase)
gain1
reference
reference

CENTRE FOR THE HEALTH ECONOMY
36
• 65 → 80 (15 points increase)
• 65 → 75 (10 points increase)
• 65 → 70 (5 points increase)
gain2
gain3
gain4
-0.43
-0.67
-0.98
0.00
0.00
0.00
-0.40
-0.78
-1.05
0.00
0.00
0.00
Rate of adverse events
• 1 adverse events out of every 100 patients admitted
• 5 adverse events out of every 100 patients admitted
• 9 adverse events out of every 100 patients admitted
• 13 adverse events out of every 100 patients admitted
adverse1
adverse2
adverse3
adverse4
reference
-0.51
-0.76
-1.35
0.00
0.00
0.00
reference
-0.41
-0.68
-1.30
0.00
0.00
0.00
Readmission rate within 28 days after surgery
• 2 readmissions out of every 100 patients discharged
• 7 readmissions out of every 100 patients discharged
• 12 readmissions out of every 100 patients discharged
• 17 readmissions out of every 100 patients discharged
readmin1
readmin2
readmin3
readmin4
reference
-0.46
-0.80
-1.23
0.00
0.00
0.00
reference
-0.44
-0.76
-1.28
0.00
0.00
0.00
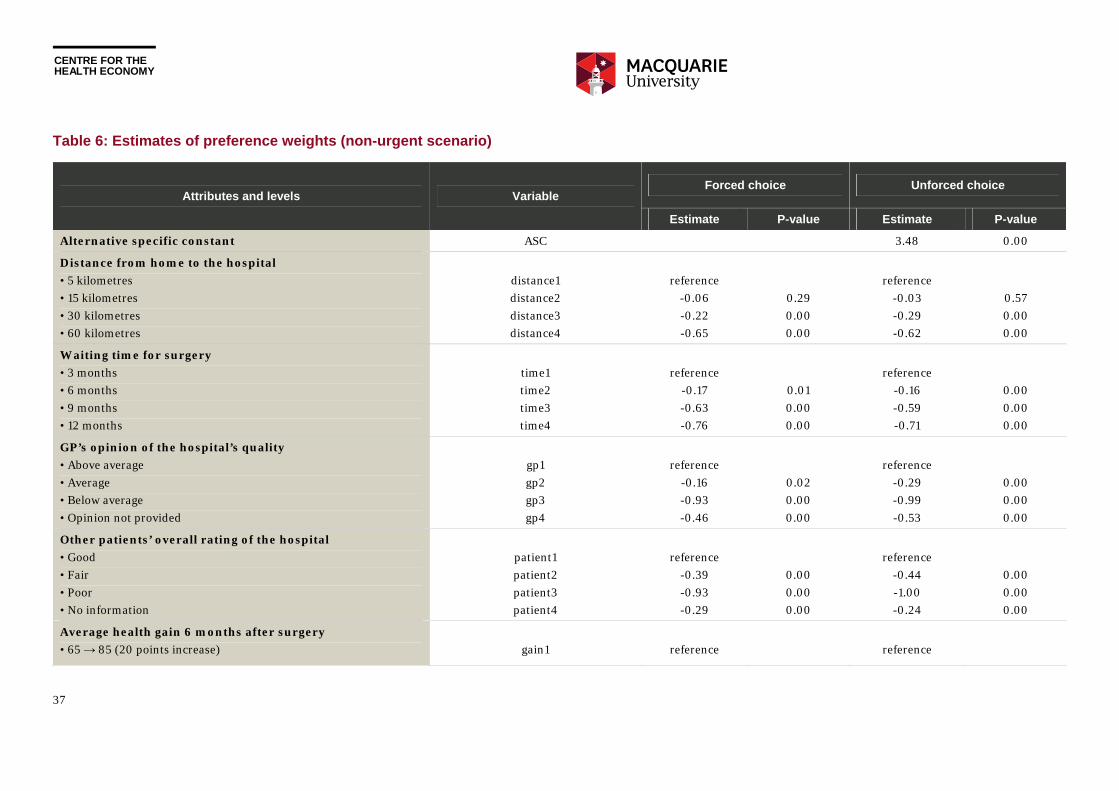
CENTRE FOR THE HEALTH ECONOMY
37
Table 6: Estimates of preference weights (non-urgent scenario)
Attributes and levels Variable Forced choice Unforced choice
Estimate P-value Estimate P-value
Alternative specific constant ASC 3.48 0.00
Distance from home to the hospital
• 5 kilometres
• 15 kilometres
• 30 kilometres
• 60 kilometres
distance1
distance2
distance3
distance4
reference
-0.06
-0.22
-0.65
0.29
0.00
0.00
reference
-0.03
-0.29
-0.62
0.57
0.00
0.00
Waiting time for surgery
• 3 months
• 6 months
• 9 months
• 12 months
time1
time2
time3
time4
reference
-0.17
-0.63
-0.76
0.01
0.00
0.00
reference
-0.16
-0.59
-0.71
0.00
0.00
0.00
GP’s opinion of the hospital’s quality
• Above average
• Average
• Below average
• Opinion not provided
gp1
gp2
gp3
gp4
reference
-0.16
-0.93
-0.46
0.02
0.00
0.00
reference
-0.29
-0.99
-0.53
0.00
0.00
0.00
Other patients’ overall rating of the hospital
• Good
• Fair
• Poor
• No information
patient1
patient2
patient3
patient4
reference
-0.39
-0.93
-0.29
0.00
0.00
0.00
reference
-0.44
-1.00
-0.24
0.00
0.00
0.00
Average health gain 6 months after surgery
• 65 → 85 (20 points increase)
gain1
reference
reference
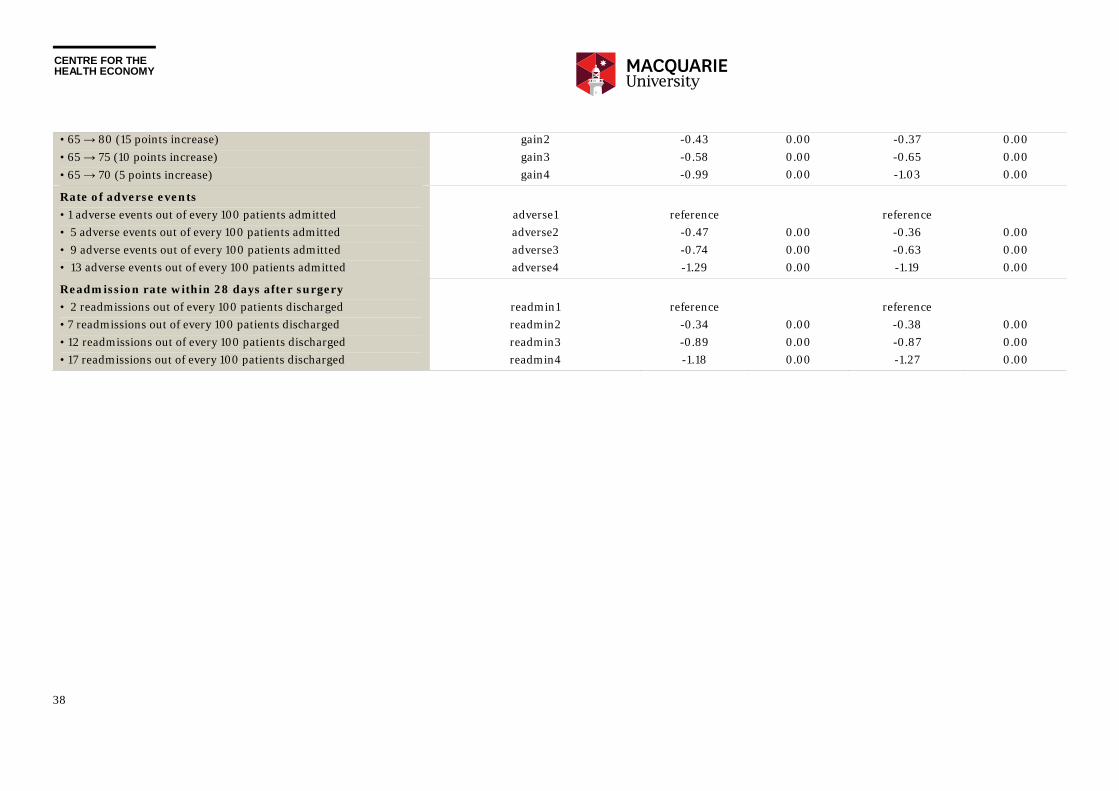
CENTRE FOR THE HEALTH ECONOMY
38
• 65 → 80 (15 points increase)
• 65 → 75 (10 points increase)
• 65 → 70 (5 points increase)
gain2
gain3
gain4
-0.43
-0.58
-0.99
0.00
0.00
0.00
-0.37
-0.65
-1.03
0.00
0.00
0.00
Rate of adverse events
• 1 adverse events out of every 100 patients admitted
• 5 adverse events out of every 100 patients admitted
• 9 adverse events out of every 100 patients admitted
• 13 adverse events out of every 100 patients admitted
adverse1
adverse2
adverse3
adverse4
reference
-0.47
-0.74
-1.29
0.00
0.00
0.00
reference
-0.36
-0.63
-1.19
0.00
0.00
0.00
Readmission rate within 28 days after surgery
• 2 readmissions out of every 100 patients discharged
• 7 readmissions out of every 100 patients discharged
• 12 readmissions out of every 100 patients discharged
• 17 readmissions out of every 100 patients discharged
readmin1
readmin2
readmin3
readmin4
reference
-0.34
-0.89
-1.18
0.00
0.00
0.00
reference
-0.38
-0.87
-1.27
0.00
0.00
0.00
CENTRE FOR THE HEALTH ECONOMY
39
Semi-urgent versus non-urgent
The purpose of undertaking two DCEs within two scenarios that differed in respect to the urgency of elective surgery was to determine whether urgency impacted the value respondents placed on hospital attributes. Differences in attribute values could have policy implications, for example, by allowing government to target a subset of patients that value hospital quality the most, or facilitating greater convenience if valued more. Estimated preference weights for the two DCEs are presented in (Chart 11).
As preferences are cofounded by scales,[58] the size of preference weights cannot be directly compared. Hence, only the qualitative preference patterns were compared, which are similar between the two DCEs. However there were two key differences.
Respondents allocated to the scenario that included non-urgent surgery did not differentiate the short distance levels as much as respondents from the semi-urgent surgery scenario, suggesting respondents may value shorter distances more when the surgery is more urgent.
Respondents from the semi-urgent version were also more sensitive to shorter waiting time levels – they preferred 2 weeks over 1 month more strongly than they preferred 1 month over 2 months or 2 months over 3 months. By contrast, respondents from the non-urgent surgery scenario were most sensitive to the middle levels. They preferred 6 months over 9 months more strongly than they preferred 3 months over 6 months and 9 months over 12 months.
This suggests elective surgery urgency categories may only affect respondents’ preference for distance and waiting time, and have no impact on their preferences for quality of care indicators. Further analysis was undertaken of preferences for quality attributes across both urgency groups, with findings suggesting preferences are the same across the two groups.6
6 To further investigate this, formal poolability tests of the two samples were undertaken. The first hypothesis is that respondents have homogenous preferences for all attributes (excluding waiting time) under two urgency levels. Following Swait and Louviere (1993), a grid search approach was adopted to find the maximum likelihood estimate (MLE) of the relative scale between two samples, which is 0.925. The Chi-square test suggests a rejection of the hypothesis, meaning that the two samples cannot be pooled over all the attributes (excluding the waiting time). The second hypothesis is that respondents have homogenous preference for all attributes (excluding distance and waiting time) under two urgency levels. The poolability test were undertaken again by excluding both the distance and waiting time attributes. The MLE of the relative scale between two samples was 0.955. The Chi-square test suggests the preference homogeneity hypothesis cannot not rejected, suggesting preferences for attributes other than waiting times and distance are the same across urgency categories.
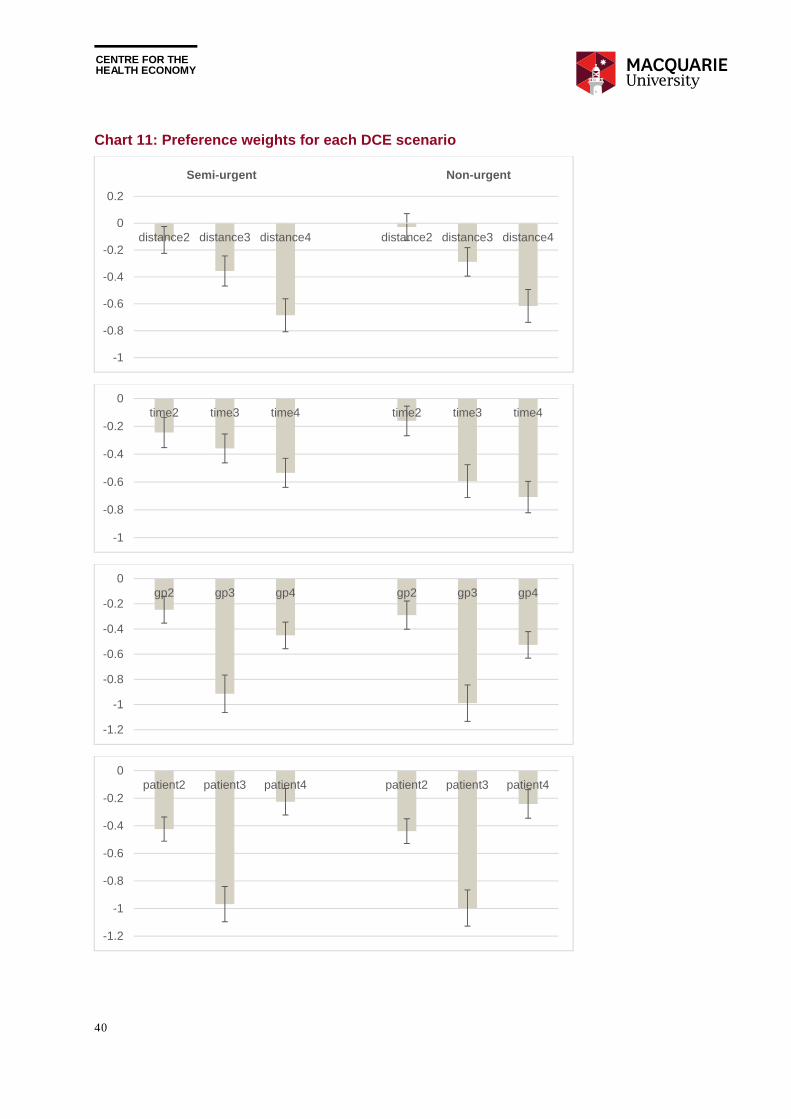
CENTRE FOR THE HEALTH ECONOMY
40
Chart 11: Preference weights for each DCE scenario
-1
-0.8
-0.6
-0.4
-0.2
0
0.2
distance2 distance3 distance4 distance2 distance3 distance4
Semi-urgent Non-urgent
-1
-0.8
-0.6
-0.4
-0.2
0time2 time3 time4 time2 time3 time4
-1.2
-1
-0.8
-0.6
-0.4
-0.2
0gp2 gp3 gp4 gp2 gp3 gp4
-1.2
-1
-0.8
-0.6
-0.4
-0.2
0patient2 patient3 patient4 patient2 patient3 patient4
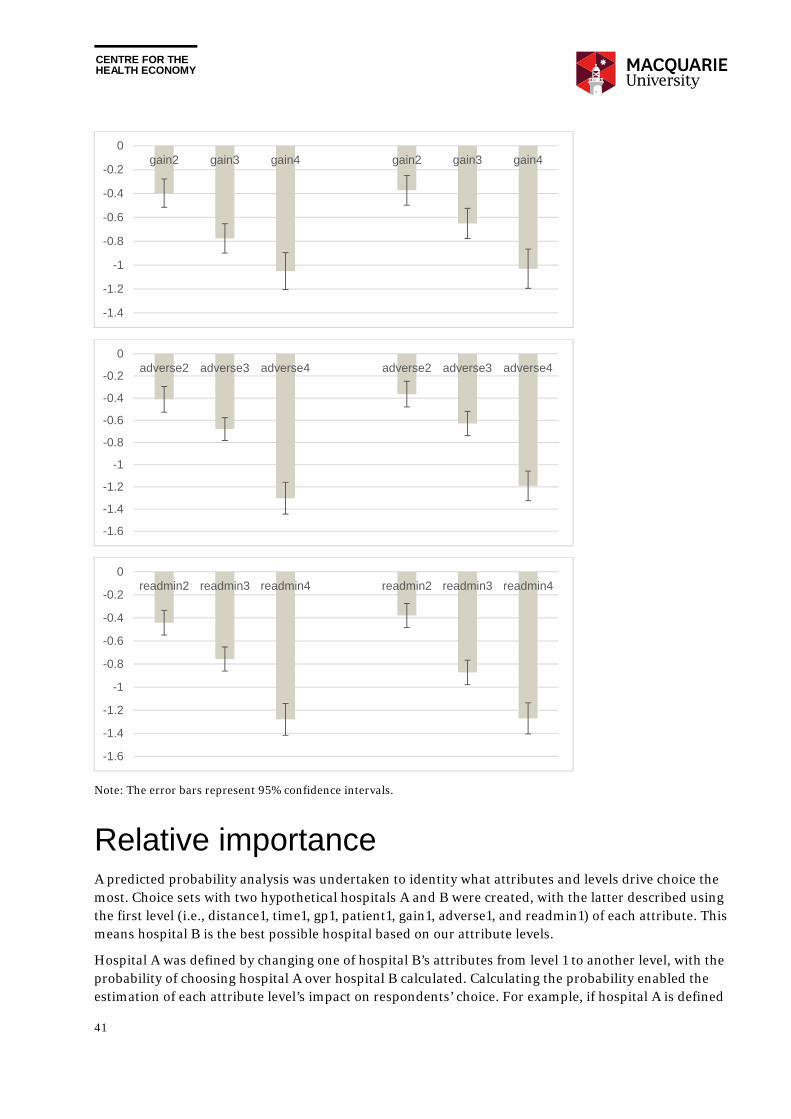
CENTRE FOR THE HEALTH ECONOMY
41
Note: The error bars represent 95% confidence intervals.
Relative importance A predicted probability analysis was undertaken to identity what attributes and levels drive choice the most. Choice sets with two hypothetical hospitals A and B were created, with the latter described using the first level (i.e., distance1, time1, gp1, patient1, gain1, adverse1, and readmin1) of each attribute. This means hospital B is the best possible hospital based on our attribute levels.
Hospital A was defined by changing one of hospital B’s attributes from level 1 to another level, with the probability of choosing hospital A over hospital B calculated. Calculating the probability enabled the estimation of each attribute level’s impact on respondents’ choice. For example, if hospital A is defined
-1.4
-1.2
-1
-0.8
-0.6
-0.4
-0.2
0gain2 gain3 gain4 gain2 gain3 gain4
-1.6
-1.4
-1.2
-1
-0.8
-0.6
-0.4
-0.2
0adverse2 adverse3 adverse4 adverse2 adverse3 adverse4
-1.6
-1.4
-1.2
-1
-0.8
-0.6
-0.4
-0.2
0readmin2 readmin3 readmin4 readmin2 readmin3 readmin4
CENTRE FOR THE HEALTH ECONOMY
42
as distance2, time1, gp1, patient1, gain1, adverse1, and readmin1, then we can examine how increasing distance from distance1 to distance2 would impact the choice through its impact on the probability of choosing hospital A.
Since there are seven attributes, each with four levels, 21 choice sets were created along with 21 predicted probabilities corresponding to 21 attribute levels. The impact of each attribute level was measured by “0.5-predicted probability” where 0.5 represents the best possible chance of choosing hospital A over hospital B. This measure is not confounded by scale so results between the two DCEs can be directly compared. These measures are presented in Table 7 and Table 8, and also plotted in Chart 12.
For both DCEs the most important attributes are those related to hospital quality, including unplanned readmission rate, rate of adverse events, and potential health gain. For attribute levels, some of the largest impacts on probability occur when the readmission rate increases from 2 percent to 17 percent or the rate of adverse events increases from 1 percent to 13 percent.
Attributes of less importance (albeit still significant) are the GP’s opinion of hospital quality and other patients’ overall rating of the hospital, suggesting respondents value opinions sourced from others. Moreover, results suggest that the two sources of information are valued similarly.
Interestingly, a GP not providing an opinion was valued negatively by respondents (compared to an above average rating), although had less negative impact on the probability of choosing a hospital compared to a poor rating from a GP. No information on other patient’s overall rating of the hospital was also valued negatively (compared to a good rating), although this had less negative impact on the probability of choosing a hospital compared to a rating of fair or poor.
Distance and waiting time are also valued, but appear to be least important relative to quality attributes. Waiting time, especially the longer ones, has a larger impact on choice in the non-urgent scenario than in the semi-urgent scenario, likely because the waiting time is described using a narrower range in the former case.
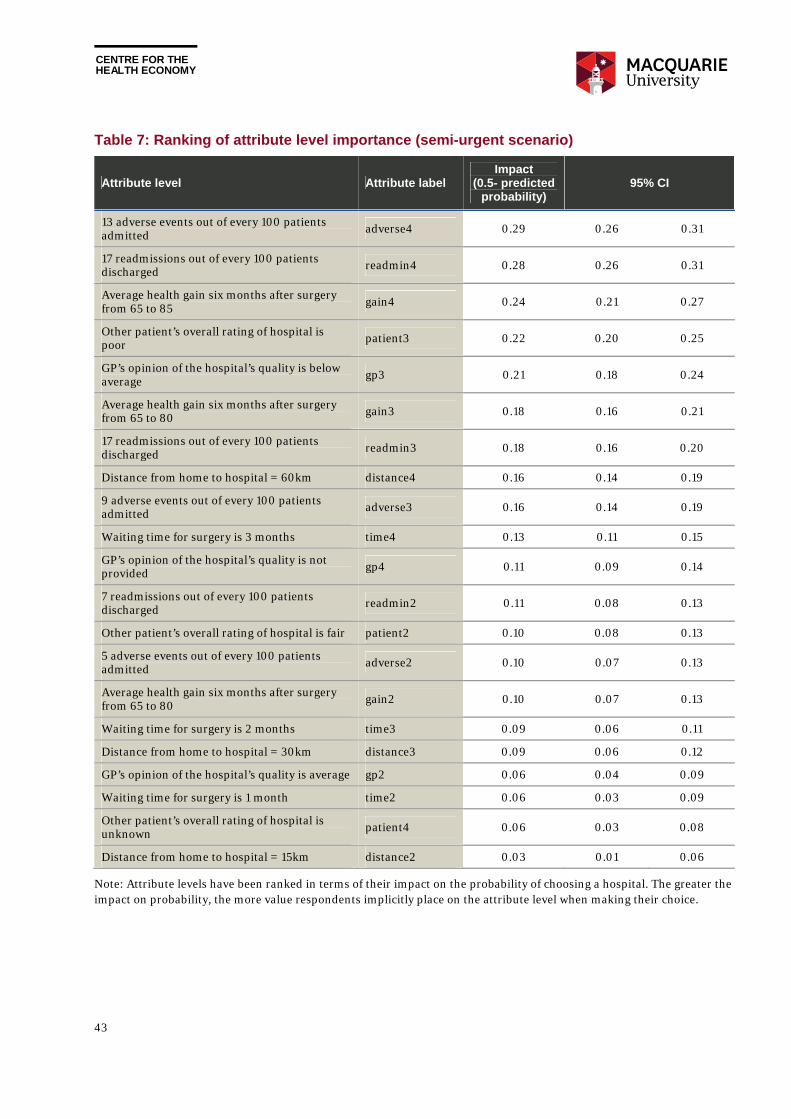
CENTRE FOR THE HEALTH ECONOMY
43
Table 7: Ranking of attribute level importance (semi-urgent scenario)
Attribute level Attribute label Impact
(0.5- predicted probability)
95% CI
13 adverse events out of every 100 patients admitted
adverse4 0.29 0.26 0.31
17 readmissions out of every 100 patients discharged readmin4 0.28 0.26 0.31
Average health gain six months after surgery from 65 to 85
gain4 0.24 0.21 0.27
Other patient’s overall rating of hospital is poor patient3 0.22 0.20 0.25
GP’s opinion of the hospital’s quality is below average gp3 0.21 0.18 0.24
Average health gain six months after surgery from 65 to 80 gain3 0.18 0.16 0.21
17 readmissions out of every 100 patients discharged readmin3 0.18 0.16 0.20
Distance from home to hospital = 60km distance4 0.16 0.14 0.19
9 adverse events out of every 100 patients admitted adverse3 0.16 0.14 0.19
Waiting time for surgery is 3 months time4 0.13 0.11 0.15
GP’s opinion of the hospital’s quality is not provided gp4 0.11 0.09 0.14
7 readmissions out of every 100 patients discharged
readmin2 0.11 0.08 0.13
Other patient’s overall rating of hospital is fair patient2 0.10 0.08 0.13
5 adverse events out of every 100 patients admitted adverse2 0.10 0.07 0.13
Average health gain six months after surgery from 65 to 80 gain2 0.10 0.07 0.13
Waiting time for surgery is 2 months time3 0.09 0.06 0.11
Distance from home to hospital = 30km distance3 0.09 0.06 0.12
GP’s opinion of the hospital’s quality is average gp2 0.06 0.04 0.09
Waiting time for surgery is 1 month time2 0.06 0.03 0.09
Other patient’s overall rating of hospital is unknown patient4 0.06 0.03 0.08
Distance from home to hospital = 15km distance2 0.03 0.01 0.06
Note: Attribute levels have been ranked in terms of their impact on the probability of choosing a hospital. The greater the impact on probability, the more value respondents implicitly place on the attribute level when making their choice.
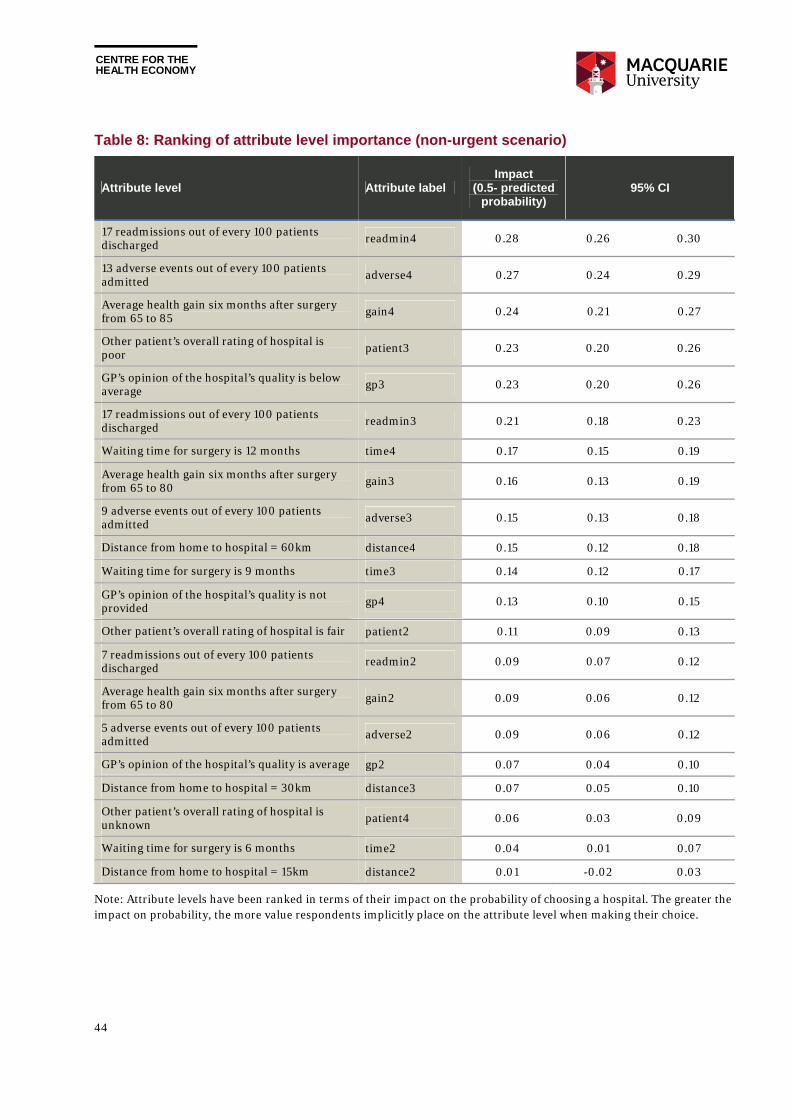
CENTRE FOR THE HEALTH ECONOMY
44
Table 8: Ranking of attribute level importance (non-urgent scenario)
Attribute level Attribute label Impact
(0.5- predicted probability)
95% CI
17 readmissions out of every 100 patients discharged readmin4 0.28 0.26 0.30
13 adverse events out of every 100 patients admitted adverse4 0.27 0.24 0.29
Average health gain six months after surgery from 65 to 85 gain4 0.24 0.21 0.27
Other patient’s overall rating of hospital is poor patient3 0.23 0.20 0.26
GP’s opinion of the hospital’s quality is below average gp3 0.23 0.20 0.26
17 readmissions out of every 100 patients discharged readmin3 0.21 0.18 0.23
Waiting time for surgery is 12 months time4 0.17 0.15 0.19
Average health gain six months after surgery from 65 to 80 gain3 0.16 0.13 0.19
9 adverse events out of every 100 patients admitted adverse3 0.15 0.13 0.18
Distance from home to hospital = 60km distance4 0.15 0.12 0.18
Waiting time for surgery is 9 months time3 0.14 0.12 0.17
GP’s opinion of the hospital’s quality is not provided gp4 0.13 0.10 0.15
Other patient’s overall rating of hospital is fair patient2 0.11 0.09 0.13
7 readmissions out of every 100 patients discharged readmin2 0.09 0.07 0.12
Average health gain six months after surgery from 65 to 80 gain2 0.09 0.06 0.12
5 adverse events out of every 100 patients admitted adverse2 0.09 0.06 0.12
GP’s opinion of the hospital’s quality is average gp2 0.07 0.04 0.10
Distance from home to hospital = 30km distance3 0.07 0.05 0.10
Other patient’s overall rating of hospital is unknown
patient4 0.06 0.03 0.09
Waiting time for surgery is 6 months time2 0.04 0.01 0.07
Distance from home to hospital = 15km distance2 0.01 -0.02 0.03
Note: Attribute levels have been ranked in terms of their impact on the probability of choosing a hospital. The greater the impact on probability, the more value respondents implicitly place on the attribute level when making their choice.
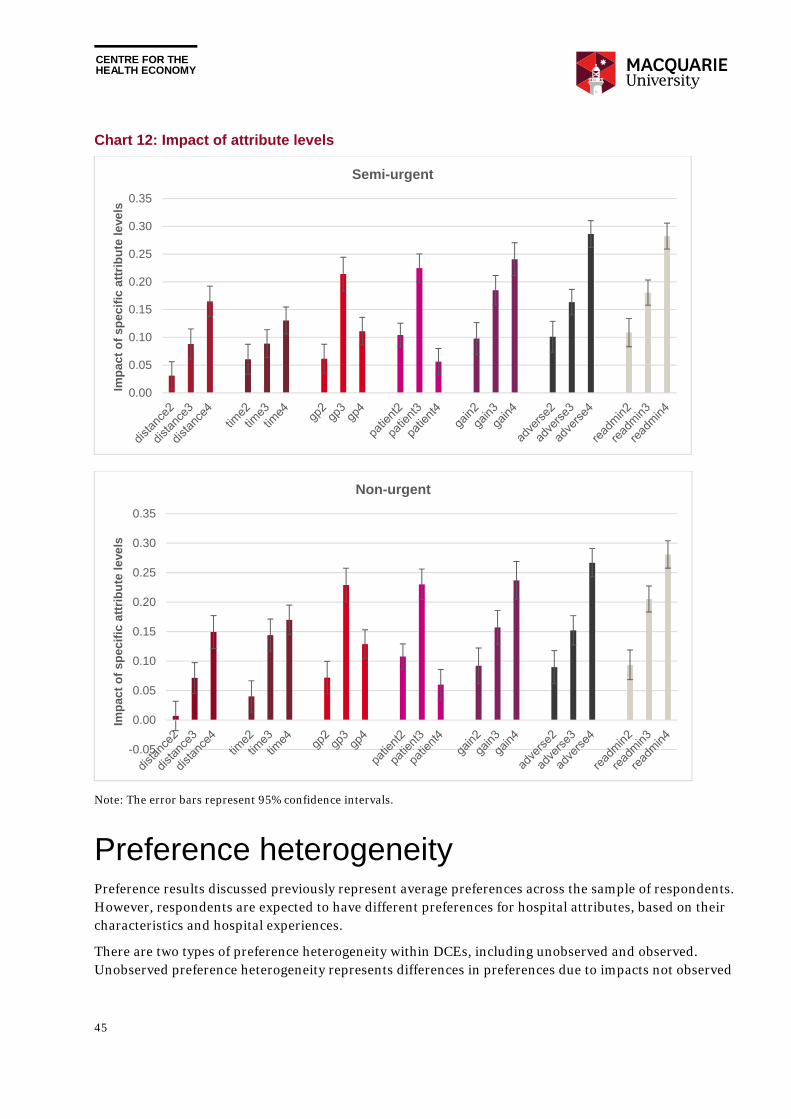
CENTRE FOR THE HEALTH ECONOMY
45
Chart 12: Impact of attribute levels
Note: The error bars represent 95% confidence intervals.
Preference heterogeneity Preference results discussed previously represent average preferences across the sample of respondents. However, respondents are expected to have different preferences for hospital attributes, based on their characteristics and hospital experiences.
There are two types of preference heterogeneity within DCEs, including unobserved and observed. Unobserved preference heterogeneity represents differences in preferences due to impacts not observed
0.00
0.05
0.10
0.15
0.20
0.25
0.30
0.35
Imp
act
of
spec
ific
att
rib
ute
leve
ls
Semi-urgent
-0.05
0.00
0.05
0.10
0.15
0.20
0.25
0.30
0.35
Imp
act
of
spec
ific
att
rib
ute
leve
ls
Non-urgent
CENTRE FOR THE HEALTH ECONOMY
46
by the researcher. For example, access to transport may impact the value respondents placed on distance from hospital to the home, but this information was not collected within the survey.
Observed preference heterogeneity typically relates to the impacts of observable individual characteristics on preferences. To test whether respondent characteristics impacted the value attributes, dummy variables representing individual characteristics were interacted with preference weights. This essentially splits the sample into two groups with group-specific preference weights to be estimated. The statistical significance of the coefficients of the interaction terms were used to test the preference homogeneity assumption between two groups.
Gender
Female respondents dislike a hospital more when a GP rates the hospital as poor, suggesting females are more likely to be affected by their GP’s negative opinion when making a hospital choice. Female respondents also dislike the hospital more when the readmission rate increases, suggesting females may be more risk averse when choosing a hospital.
Education
Respondents with education levels at year 12 or below are more willing to choose a hospital with lower health gain in the semi-urgent scenario. This suggests people with higher education levels may have a greater expectation of health gain from elective surgery. This effect is not significant in the non-urgent case.
Location
Respondents living outside a major city are more willing to travel longer distances to attend a better quality hospital. This location effect is more significant in the semi-urgent case than in the non-urgent case.
Past elective surgery experience
Respondents with past elective surgery experience are more willing to choose a hospital with lower health gain, suggesting those without elective surgery experience may have a somewhat higher expectation of the gain from elective surgery.
CENTRE FOR THE HEALTH ECONOMY
47
6. Policy implications The Productivity Commission is currently exploring the potential to introduce greater choice within public hospitals to empower patients, improve hospital quality and generate better health outcomes. State and territory governments are also interested in greater competition for public hospital services, although to date governments have primarily focused on commissioning and contestability of non-clinical services.
One public hospital function that may benefit from increased choice is elective surgery, whereby public patients are provided with information on public hospital attributes, and can choose their preferred hospital based on attributes they value most.
For patient choice to improve public hospital quality, patients must value quality, be aware of their right to choose, and exercise that right using appropriate quality information. Patients choosing better quality hospitals will implicitly signal to public hospitals their preferences for quality.
However, providing quality information to patients does not necessarily create an informed choice. While a positive, statistically significant relationship between performance reporting and consumer response has been found internationally (i.e., better quality increases market share), the effect is sometimes small,[59] and consumers face several barriers to making an informed choice.7
Results from this study suggests Australians aged between 50-75 years would like more public hospital choice. They can interpret hospital performance information, are willing and able to trade off alternative hospital attributes when making their choice, and highly value quality over convenience.
Yet government may need to facilitate choice and ensure hospitals respond to patient preferences. Four potential areas where government may intervene include the following.
Improve hospital quality information to make information more accessible to patients.
Provide health care professional assistance to patients when making public hospital choices.
Reduce costs to exercising patient choice.
Help hospitals respond to patient preferences for quality.
Despite respondents wanting more choice, any government decision on whether to improve public hospital choice should be framed within a public interest test.
One example of a public interest test for competition is outlined within the National Competition Policy (NCP) and supported by the recent Competition Policy Review (Harper Review). [12] Clause 1(3) of the Competition Principles Agreement suggests several factors should be investigated when balancing the benefits and costs of government policy, determining the appropriateness of a policy, or assessing the most effective means of achieving a policy objective within the NCP environment. Some of these factors include:
7 Small effects may have resulted from mis-specified models that do not account for an asymmetric consumer response to quality data. This includes a reduction in volume for poor performing providers but no increase in volume for outperforming providers. [63]
CENTRE FOR THE HEALTH ECONOMY
48
social welfare and equity considerations, including community service obligations;
government legislation and policies relating to matters such as occupational health and safety, industrial relations, access and equity;
the interests of consumers generally, or of a class of consumers; and
the efficient allocation of resources. [60]
Potential benefits from greater public hospital choice primarily relate to improved health outcomes through improved public hospital quality. For these benefits to materialise, patients must choose public hospitals based on quality, and public hospitals must respond to these choices. Not all patients will be required to choose to signal to hospitals they value quality. Experience in the English NHS hospital choice reforms suggests improved hospital quality was driven by greater choice despite less than half of patients being offered a choice, and only 29 per cent of those patients attending a non-local hospital. [61]
Other benefits could accrue through greater public hospital choice. Patients value choice intrinsically, because it allows them to be treated at their most preferred hospital. Around 75 per cent of patients surveyed in England valued having a public hospital choice. [61]
Greater public hospital choice could also improve equitable access to hospital care. Around 47 per cent of Australians are covered by private health insurance, [62] providing them with hospital choice and shorter waiting times to receive elective surgery. Public hospital patient choice may provide greater access to shorter waiting times, and greater access to better quality care.
Policy decisions must also consider the potential substantial costs associated with improved public hospital choice. Public hospitals may need assistance to ensure they can respond to changes in patient demand (e.g., a more flexible workforce may be required). Governments will need to invest in infrastructure to support choice (e.g., information and booking systems), marketing and awareness campaigns, and potentially ongoing cost to provide patients with support when making a choice (e.g., through consultation with a GP or other health professional). There would also be search costs for patients who exercise their right to choose.
Whether improved public hospital choice would lead to improved social welfare, once all benefits and costs are considered, is a topic for further research.
Improve hospital quality information Websites currently dedicated to publically available hospital performance information, such as MyHospitals and the NSW Bureau of Health Information, contain performance information that were not developed for the purpose of providing information for hospital choice. Providing greater choice to public patients for elective surgery will require the development of a purpose built website.
The amount and type of quality information presented to public patients must be purposefully determined, relevant, and valued by patients. DCE respondents valued other patient experiences equally to advice provided by a GP on hospital quality. Including measures of other patient experiences within the performance information set may increase a patient’s ability and willingness to choose.
While state governments already collect patient satisfaction scores, there is some delay between data collection and publishing output, suggesting current patient information collection, analysis and publication processes may require further investment.
CENTRE FOR THE HEALTH ECONOMY
49
Results from the DCE, and public interviews undertaken to develop the DCE attributes, suggests any quality information set should reflect poor hospital performance, such as adverse events and readmissions. Research on the introduction of report cards for US hospitals and cardiothoracic surgeons found patients more likely to avoid poor performing hospitals rather than seek outperforming hospitals.[63, 64]
Further research is needed on the most appropriate set of attributes for public hospital choice in Australia, and how to best present them to patients. A literature review undertaken to develop the DCE within this study found 51 different attributes used to describe hospital choice. Most of these attributes represented quality. Patient ability to comprehend and use comparative health care information is increased when cognitive burden is reduced, when the patient better understands what their choice will mean in reality, and when information meaning is highlighted.[65]
Presenting more attributes may not be the answer, with respondents already experiencing difficulties trading off seven attributes across two hospitals within the DCE. A large number of attributes may force patients to rely more on simplifying heuristics, thereby masking some of the value they place on attributes, and undermining the purpose of providing more choice. Research in the US suggests ‘less is more’ when presenting patients with comparative hospital performance information for the purpose of making a choice, particularly for those with low numeracy skills.[66]
In determining what attributes matter most to public patients, governments must also consider the potential for public hospitals to focus on achieving quality measures, while shirking on others, to the detriment of patients. Several other potential adverse consequences from publishing public hospital quality metrics should be considered, such as hospital managers pursuing quality indicators as measured rather than intended, and a narrow focus on quality metrics at the expense of focusing on broader strategic objectives.[67]
One purpose of introducing greater choice is to incentivise hospitals to change behaviours and improve quality. However, perverse incentives may also occur, leading to sub-optimal outcomes from a societal perspective. Under more choice, public hospitals may select healthier patients to increase their performance measures and attract more patients. This is known as ‘cream skimming’, and has been found in hospital sectors using report cards in the US in relation to CABG surgery,[68] and in the UK in relation to private hospitals.[16] Any published patient outcome measures should be risk adjusted to account for differences in patient population characteristics impacting outcomes.
Provide health care professional assistance to patients Results from the choice modelling survey suggest many Australians want greater public hospital choice when receiving elective surgery. And while 70 per cent of respondents did not find choosing between two hospitals difficult, 28 per cent found it difficult, and two per cent found it very difficult. Around 40 per cent of respondents did not consider all attributes when making their choice, suggesting some choice heuristics were used.
While the majority of respondents did not find choosing a hospital difficult, this was in the context of choosing between only two hospitals. Providing respondents with more than two hospitals would have increased difficulty due to the additional trade-offs required by respondents. The more complex a choice, the greater likelihood a patient will rely on choice heuristics.
CENTRE FOR THE HEALTH ECONOMY
50
Some difficulties experienced by respondents may be related to health literacy. A significant correlation was found within the survey data between self-reported health literacy and the level of difficulty in making a hospital choice, and between self-reported health literacy and the number of attributes considered when making a choice.
The Australian Commission on Safety and Quality in Health Care (ACSQHC) considers the level of health literacy in Australia as sub-optimal for the development of effective relationships between patients and health care providers.[69] In 2006 around 60 per cent of Australian did not have adequate levels of health literacy, with the level of health literacy decreasing for older Australians, lower levels of income and education.[70] People with these characteristics are less likely to own private health insurance, and more likely to use the public hospital system.
Improving individual health literacy
Increased choice complexity associated with more hospitals and attributes within a choice set has important policy implications. Introducing greater choice across public hospitals may increase the demands on patients when seeking care, by asking them to collect and interpret often unfamiliar hospital information within a potentially emotional and uncertain time in their life.
Within an environment of low health literacy, restricting choice to a select number of public hospitals may generate the desired quality signal but not place undue burden on patients. Effectively, government may have a role in managing the choice set in the interests of public patients. Being presented with too many hospitals may render the choice so complex that either patients choose not to choose, or focus on only a subset of attributes, even though all attributes are valued. This may mute the signal to hospitals and government on the importance of quality attributes.
Governments may also need to invest in further developing the individual health literacy of patients specifically related to public hospitals. According to the ACSQHC this includes “the skills, knowledge, motivation and capacity of a person to access, understand, appraise and apply information to make effective decisions about health and health care and take appropriate action”. Increasing health literacy along with introducing greater choice could promote informed choice, and may increase the willingness of patients to exercise their choice.
Providing assistance to patients when making a choice
Even when patients understand hospital quality information, some may have trouble interpreting this information within their own context. When choosing a hospital, patients must interpret hospital attributes relative to their own preferences, potentially make trade-offs across attributes, and be comfortable with assuming the risk associated with making the ‘wrong’ choice.
Many patients may be reluctant to choose between alternative public hospitals by themselves. Around 85 per cent of survey respondents in this study noted they would involve a GP in their decision, despite only 30 per cent noting they thought choosing between hospitals was either difficult or very difficult.
A similar desire for GP help when choosing between hospitals has been found internationally. In a survey of 513 patients in the Netherlands, 81 per cent thought it was important that a GP provided advice on which hospital to attend, or specialists to see. Around 25 per cent thought it important that the GP made the decision for them.[71]
While patients may seek GP assistance when choosing a public hospital, some GPs may not be willing to help. Providing assistance will extend the consultation length, and if not adequately compensated, the incentive to help patients choose will be diminished. Government may therefore need to ensure
CENTRE FOR THE HEALTH ECONOMY
51
remuneration reflects the additional time required to discuss public hospital options with patients, which has occurred in England and the Netherlands.[72]
Other barriers may also limit GP involvement in helping patients choose a hospital. While hospital choice has been provided to patients in the Netherlands, in practice patients had little input into referral decisions, with the majority of GPs making decisions for them. Many GPs did not actively support their role in choosing a health care provider.[31] Research in the Netherlands suggests hospital performance information played no role in hospital referrals within a sample of 70 GPs. Around 94 per cent had not searched for hospital performance information, and patients had not initiated a discussion around hospital quality during consultations. GPs were also indecisive about their role in supporting patient choice.[73]
A similar experience has also been found in England. While all patients referred to a specialist consultation should have received a choice of hospital, only 49 per cent of patients had recalled been given a choice by their GP in 2010, and only 54 per cent of patients were aware they should be given a choice.[74] Of those offered a choice, many patients did not use performance information to select their hospital, instead relying on past experience or advice from their GP.[75]
There are several policy options to circumvent a reluctance by GPs to help patients choose their hospital. An education program may be required to help GPs understand the methodology in developing performance information, how to interpret performance information, what variation across hospitals means for the patient, and what role the GP should play in the patient decision making process. An awareness campaign could also help ensure GPs are aware patients have choice over their public hospital, and GPs know where to access hospital quality information.
The systems through which patients are referred to hospital can also impact choice. Research on electronic hospital referral systems used by GPs in the Netherlands and England found systems mediate the process of choice based on the information and options presented to GPs.[72] This has important implications for the design and use of any GP electronic referral system to assist with patient hospital choice. A cumbersome referral system may reduce the incentive for GPs to offer hospital choice to patients. Utilisation of the National Health Service (NHS) e- Referral System in England ranges from 20 per cent to 85 per cent across Area Teams, despite the system (and its predecessor ‘Choose and Book’) being in place for over 10 years.[76]
Other health care professionals trained in helping patients make a public hospital choice could also be explored by government, which may be a more cost effective way of providing assistance. Around 9 per cent of English NHS patients consulted a telephone booking line advisor when making their choice. [75]
And assistance may not be requested by patients for those with a good public hospital experience. Survey results from this project, and a survey of English NHS patients, [75] suggest a patient’s own experience may be most relied upon when making a hospital choice. Consequently, patients may be less reliant on hospital quality information for any subsequent hospital choice.
Reduce costs to exercising choice Patients may face alternative costs associated with their public hospital choices. As distances to hospital become larger, patients may experience increased travel costs. Similarly, longer waiting times also impose an additional cost on patients, through increased time with poor health, and a potential opportunity cost associated with reduced leisure activities, or reduced income through absenteeism if the condition affects their work capacity.
CENTRE FOR THE HEALTH ECONOMY
52
The value of shorter distances and shorter waiting times will be determined (in part) by the avoided cost of having to travel further or wait longer (i.e., the cost of inconvenience). Effectively, some patients may face an implicit budget constraint when making a choice. For example, they may not choose a better quality hospital outside their local area if they cannot afford the travel costs. Others may consider the cost to family and friends to visit and the reduced likelihood of their support if choosing a hospital far from home. Some patients may be constrained to choosing a hospital with the shortest waiting time, despite worse quality, because it enables them to return to work quicker.
One way to stimulate greater choice based on quality could be though government assistance to cover travel and accommodation expenses for those patients willing to choose a non-local hospital. This could reduce the cost of travel for the patient and potentially increase the relative value of hospital quality within a choice.
Subsidised travel and accommodation has been used in some European countries to manage hospital waiting times.[77] Travel and accommodation assistance is also currently available in Australia. For example, the NSW Government’s Isolated Patients Travel and Accommodation Scheme (IPTAAS) is offered to residents within NSW that live more than 100 kilometres from the nearest treating specialist, or when combined trips to and from a specialist are expected to exceed 200 kilometres per week.
Whether subsidies are introduced should depend on whether patient choice is constrained by travel distance. Research on the English NHS hospital choice reforms suggest low income patients were not disadvantaged in their choice, and were willing to travel.[23]
Another option to promote choice based on hospital quality is to reduce elective surgery waiting times across the public hospital sector. Results from the DCE and experience in other countries suggests shorter waiting times are valued by patients. [78] Empirical evidence from the English NHS hospital choice reforms suggests a longer waiting time reduces patient demand. [79]
Reducing waiting times would reduce patient cost associated with extended poor health, lost leisure time and lost income. This may allow patients to concentrate on differences in hospital quality when choosing a public hospital. For example, waiting times were found to be less important within a DCE on hospital choice in New Zealand compared to other studies, with the authors suggesting this reflected the relatively short waiting times for elective surgery in the public sector (more than four months is uncommon). [80]
Help hospitals respond to patient preferences for quality While introducing greater public hospital choice may provide an intrinsic value to public patients, it will only increase public hospital quality if public hospitals:
have the capacity to analyse and interpret changes in patient demand due to choice;
receive a clear signal from patients that they value quality over other attributes;
understand where and how quality can be improved; and
are incentivised to increase quality in response to patient preferences. [19]
CENTRE FOR THE HEALTH ECONOMY
53
Research on the English NHS hospital choice reforms suggest greater choice for public patients led to improved hospital quality and improved health outcomes without disadvantaging low income patients.[22]
However, these reforms were introduced alongside other changes, including substantial growth in the NHS budget, greater autonomy to managers of high performing hospitals, introduction of financial incentives to reduce waiting times, and stronger performance management through rewards and sanctions around targets.[22, 23]
Research also suggests some impacts were driven by better management practices, and areas that experienced greater hospital competition in England improved management quality, and subsequently hospital quality. In particular, better management scores resulted in reduced deaths from heart attacks, lower elective surgery waiting lists and lower Methicillin Resistant Staphylococcus Aureus (MRSA) infection rates.[81]
Evidence from waiting time management suggests that combining rewards and penalties to change hospital behaviour work best.[77] For example, successful policies to reduce waiting times in England between 2001 and 2008 employed a policy of penalising senior management for missing waiting time targets, greater autonomy for well performing hospital managers, and greater focus on measuring the overall performance of each hospital.[82]
Public hospitals must have the capacity to accommodate any shift in patient demand. Good quality hospitals will need to treat more elective surgery patients without compromising quality and waiting times. Public hospitals may also experience an increase in demand from patients that would have otherwise sought surgery in a private hospital.
Given most Australian public hospitals are already at full elective surgery capacity (as evidenced through long waiting times), there may be little capacity for hospitals to accommodate additional patients. The incentive for hospitals in the English NHS to attract more patients was reduced, given they were operating at or near capacity, and were already required to meet 18 week waiting time targets for elective surgery. This highlights the potential for any choice policy to be crowded out by other policy objectives set by government. [19]
Increasing hospital quality is a complex task, especially in large hospitals, and hospital wide quality indicators may not reflect quality ‘black spots’ within a hospital. Consequently, government may also need to introduce more detailed performance evaluation frameworks within hospitals, down to the ward and specialist levels to facilitate quality improvement programs.
Barriers to improved public hospital quality may also exist that would not be addressed through public hospital choice. Many public hospitals already know their performance relative to their hospital peers, and hospital managers are already motivated to increase quality, often through formal performance frameworks and the desire to provide good hospital services to their local population. Yet many hospitals have limited capacity to improve quality due to financial, workforce, or other constraints.
Under current activity based funding (ABF) arrangements, public hospitals may also face financial barriers to accommodating patient choice. For example, under ABF arrangements in NSW, the Ministry of Health purchases an annual level of activity negotiated with the local health district, which is generally based on historical activity, with some adjustments (e.g., for population growth). This funding model may provide a disincentive for hospitals to improve hospital quality because attracting additional patients may put pressure on their budget.
Governments will therefore be required to undertake further investment in infrastructure and workforce to ensure good quality hospitals continue, and poor quality hospitals improve their quality.

CENTRE FOR THE HEALTH ECONOMY
54
There may be a role for government to refine hospital funding models, and facilitate greater collaboration between public hospitals within and across local health districts / networks, for example, to help hospitals better manage changes in patient demand for elective surgery. After the introduction of the English NHS hospital choice reforms, hospitals collaborated to reduce duplication, manage their workforce, and enable strategic reconfigurations. [19]
CENTRE FOR THE HEALTH ECONOMY
55
References
1. Australian Institute of Health and Welfare. Australian hospitals 2014-2015 at a glance. Canberra: AIHW; 2016.
2. Australian Institute of Health and Welfare. Hospital resources 2014–15: Australian hospital statistics. Canberra: AIHW; 2016.
3. Australian Bureau of Statistics. Health outside major cities. Canberra: ABS; 2011.
4. Australian Institute of Health and Welfare and the Royal Australasian College of Surgeons. National definitions for elective surgery urgency categories: proposal for the Standing Council on Health. AIHW; 2013.
5. Australian Institute of Health and Welfare. Elective surgery waiting times 2015-16: Australian hospital statistics. Canberra: AIHW; 2016.
6. Australian Commission on Safety and Quality in Health Care and National Health Performance Authority. Australian atlas of healthcare variation. Sydney: ACSQHC; 2015.
7. Runciman WB, Hunt TD, Hannaford NA, Hibbert PD, Westbrook JI, Coiera EW, et al. CareTrack: assessing the appropriateness of health care delivery in Australia. Med J Aust. 2012;197(2):100-5.
8. Australian Institute of Health and Welfare. Admitted patient care 2014–15: Australian hospital statistics. Canberra: AIHW; 2016.
9. Department of Veterans Affairs. Hospitals, Day Procedure Centres and Mental Health Private Hospitals 2015 [cited 2015 21 June]. Available from: http://www.dva.gov.au/providers/hospitals-day-procedure-centres-and-mental-health-private-hospitals.
10. Department of Health WA. Elective Joint Replacement Service Model of Care. Perth: Health Networks Branch, Department of Health, Western Australia; 2010.
11. Department of Health. Specialist clinics in Victorian public hospitals, Access policy. Melbourne: Health Service Programs Branch, Victorian Government, Department of Health; 2013.
12. Harper I, Anderson P, McCluskey S, QC MOB. Competition Policy Review. Final report 2015 [cited 2016 25 November]. Available from: http://competitionpolicyreview.gov.au/final-report/.
13. Productivity Commission. Introducing competition and informed user choice into human services: identifying sectors of reform. Preliminary findings report 2016 [cited 2016 23 November]. Available from: http://www.pc.gov.au/inquiries/current/human-services/identifying-reform/preliminary-findings/human-services-identifying-reform-preliminary-findings.pdf.
14. Sturgess GL. Contestability in public services: An alternative to outsourcing Melbourne: Australian and New Zealand School of Government; 2015 [cited 2016 28 November]. Available from: https://www.anzsog.edu.au/media/upload/publication/150_Sturgess-Contestability-in-Public-Services.pdf.
CENTRE FOR THE HEALTH ECONOMY
56
15. Productivity Commission. Reforms to Human Services 2016 [cited 2016 23 December]. Available from: http://www.pc.gov.au/inquiries/current/human-services/reforms/issues/human-services-issues.pdf.
16. Cooper Z, Gibbons S, Jones S, McGuire A. Does Hospital Competition Save Lives? Evidence from the English NHS Patient Choice Reforms. Econ J (London). 2011;121(554):F228-f60.
17. Gaynor M, Propper C, Seiler S. Free to Choose? Reform, Choice, and Consideration Sets in the English National Health Service. American Economic Review. 2016;106(11):3521-57.
18. Berwick DM, James B, Coye MJ. Connections between Quality Measurement and Improvement. Medical Care. 2003;41(1):I30-I8.
19. Dixon A, Robertson R, Appleby J, Burge P, Devlin N, Magee H. Patient choice: How patients choose and how providers respond. London: 2010.
20. Chua CL, Palangkaraya A, Yong J. Hospital Competition, Technical Efficiency and Quality. Economic Record. 2011;87(277):252-68.
21. Palangkaraya A, Yong J. Effects of competition on hospital quality: an examination using hospital administrative data. Eur J Health Econ. 2013;14(3):415-29.
22. Propper C. Competition, incentives and the English NHS. Health Econ. 2012;21(1):33-40.
23. Cookson R, Laudicella M, Li Donni P. Does hospital competition harm equity? Evidence from the English National Health Service. J Health Econ. 2013;32(2):410-22.
24. Gaynor M, Moreno-Serra R, Propper C. Death by market power: reform, competition and patient outcomes in the National Health Service. Working Paper 16164. 2010.
25. Cooper Z, Gibbons S, Jones S, McGuire A. Does Competition Improve Public Hospitals' Efficiency? Evidence from a Quasi-Experiment in the English National Health Service London: 2012.
26. Gaynor M, Ho K, Town R. The industrial organisation of health care markets. Working paper 19800, January. 2014.
27. Gaynor M, Town R. Competition in health care markets. Working Paper 17208, July. 2011.
28. Schattner A, Bronstein A, Jellin N. Information and shared decision-making are top patients' priorities. BMC Health Serv Res. 2006;6:21.
29. Victoor A, Delnoij DM, Friele RD, Rademakers JJ. Determinants of patient choice of healthcare providers: a scoping review. BMC Health Serv Res. 2012;12:272.
30. Damman OC, Spreeuwenberg P, Rademakers J, Hendriks M. Creating compact comparative health care information: what are the key quality attributes to present for cataract and total hip or knee replacement surgery? Med Decis Making. 2012;32(2):287-300.
31. Victoor A, Noordman J, Sonderkamp JA, Delnoij DM, Friele RD, van Dulmen S, et al. Are patients' preferences regarding the place of treatment heard and addressed at the point of referral: an exploratory study based on observations of GP-patient consultations. BMC Fam Pract. 2013;14:189.
32. Varkevisser M, van der Geest SA, Schut FT. Do patients choose hospitals with high quality ratings? Empirical evidence from the market for angioplasty in the Netherlands. J Health Econ. 2012;31(2):371-8.
33. Berwick DM, James B, Coye MJ. Connections between quality measurement and improvement. Med Care. 2003;41(1 Suppl):I30-8.
CENTRE FOR THE HEALTH ECONOMY
57
34. Marshall MN, Shekelle PG, Leatherman S, Brook RH. The public release of performance data: what do we expect to gain? A review of the evidence. Jama. 2000;283(14):1866-74.
35. Birk HO, Gut R, Henriksen LO. Patients' experience of choosing an outpatient clinic in one county in Denmark: results of a patient survey. BMC Health Serv Res. 2011;11:262.
36. Dealey C. The factors that influence patients' choice of hospital and treatment. Br J Nurs. 2005;14(10):576-9.
37. Coulter A. What price choice? Health Expect. 2004;7(3):185-6.
38. Fotaki M. Is patient choice the future of health care systems? Int J Health Policy Manag. 2013;1(2):121-3.
39. Robertson R, Burge P. The impact of patient choice of provider on equity: analysis of a patient survey. J Health Serv Res Policy. 2011;16 Suppl 1:22-8.
40. Zwijnenberg NC, Hendricks M, Damman OC, Bloemendal E, Wendel S, de Jong JD, et al. Understanding and using comparative healthcare information; the effect of the amount of information and consumer characteristics and skills. BMC Medical Informatics & Decision Making. 2012;12(1):101-11.
41. Fotaki M, Roland M, Boyd A, McDonald R, Scheaff R, Smith L. What benefits will choice bring to patients? Literature review and assessment of implications. J Health Serv Res Policy. 2008;13(3):178-84.
42. Aggarwal A, Lewis D, Mason M, Sullivan R, van der Meulen J. Patient Mobility for Elective Secondary Health Care Services in Response to Patient Choice Policies: A Systematic Review. Med Care Res Rev. 2016.
43. Emmert M, Meier F, Pisch F, Sander U. Physician choice making and characteristics associated with using physician-rating websites: cross-sectional study. J Med Internet Res. 2013;15(8):e187.
44. Gebele C, Tscheulin DK, Lindenmeier J, Drevs F, Seemann AK. Applying the concept of consumer confusion to healthcare: development and validation of a patient confusion model. Health Serv Manage Res. 2014;27(1-2):10-21.
45. Jung K, Feldman R, Scanlon D. Where would you go for your next hospitalization? J Health Econ. 2011;30(4):832-41.
46. Glance LG, Dick AW, Mukamel DB, Li Y, Osler TM. How well do hospital mortality rates reported in the New York State CABG report card predict subsequent hospital performance? Med Care. 2010;48(5):466-71.
47. Gutacker N, Bojke C, Daidone S, Devlin N, Street A. Hospital variation in patient-reported outcomes at the level of EQ-5D dimensions: evidence from England. Med Decis Making. 2013;33(6):804-18.
48. Montefiori M. Spatial competition for quality in the market for hospital care. Eur J Health Econ. 2005;6(2):131-5.
49. Propper C, Damiani M, Leckie G, Dixon J. Impact of patients' socioeconomic status on the distance travelled for hospital admission in the English National Health Service. J Health Serv Res Policy. 2007;12(3):153-9.
50. Gutacker N, Siciliani L, Moscelli G, Gravelle H. Choice of hospital: Which type of quality matters? Journal of Health Economics. 2016;50:230-46.
CENTRE FOR THE HEALTH ECONOMY
58
51. Groenewoud S, Van Exel NJ, Bobinac A, Berg M, Huijsman R, Stolk EA. What Influences Patients' Decisions When Choosing a Health Care Provider? Measuring Preferences of Patients with Knee Arthrosis, Chronic Depression, or Alzheimer's Disease, Using Discrete Choice Experiments. Health Serv Res. 2015;50(6):1941-72.
52. de Groot IB, Otten W, Dijs-Elsinga J, Smeets HJ, Kievit J, Marang-van de Mheen PJ. Choosing between hospitals: the influence of the experiences of other patients. Med Decis Making. 2012;32(6):764-78.
53. Huppertz JW, Carlson JP. Consumers' use of HCAHPS ratings and word-of-mouth in hospital choice. Health Serv Res. 2010;45(6 Pt 1):1602-13.
54. Magee H, Davis LJ, Coulter A. Public views on healthcare performance indicators and patient choice. J R Soc Med. 2003;96(7):338-42.
55. Dixon A, Le Grand J. Is greater patient choice consistent with equity? The case of the English NHS. J Health Serv Res Policy. 2006;11(3):162-6.
56. Department of Health. Choose & Book – Patient’s Choice of Hospital and Booked Appointment. London: Department of Health; 2004.
57. Lancaster KJ. A New Approach to Consumer Theory. Journal of Political Economy. 1966;74(2):132-57.
58. Swait J, Louviere J. The Role of the Scale Parameter in the Estimation and Comparison of Multinomial Logit Models. Journal of Marketing Research. 1993;30(3):305-14.
59. Werner RM, Norton EC, Konetzka RT, Polsky D. Do consumers respond to publicly reported quality information? Evidence from nursing homes. J Health Econ. 2012;31(1):50-61.
60. Commonwealth of Australia. Competition Principles Agreement. 1995.
61. Robertson R, Dixon A. Choice at the point of referral. Report, The King’s Fund, London. 2009.
62. Australia Prudential Regulatory Authority (APRA). Private health insurance quarterly statistics, December 2016, Sydney 2017.
63. Dranove D, Sfekas A. Start spreading the news: a structural estimate of the effects of New York hospital report cards. J Health Econ. 2008;27(5):1201-7.
64. Wang J, Hockenberry J, Chou SY, Yang M. Do bad report cards have consequences? Impacts of publicly reported provider quality information on the CABG market in Pennsylvania. J Health Econ. 2011;30(2):392-407.
65. Hibbard JH, Peters E. Supporting informed consumer health care decisions: data presentation approaches that facilitate the use of information in choice. Annual Review of Public Health. 2003;24(1):413-33.
66. Peters E, Dieckmann N, Dixon A, Hibbard JH, Mertz C. Less is more in presenting quality information to consumers. Medical Care Research and Review. 2007;64(2):169-90.
67. Goddard M, Mannion R, Smith PC. The NHS performance framework: Taking account of economic behaviour. Discussion Paper 158. 1998.
68. Dranove D, Kessler D, McClellan M, Satterthwaite M. Is More Information Better? The Effects of “Report Cards” on Health Care Providers. Journal of Political Economy. 2003;111(3):555-88.
69. Australian Commission on Safety and Quality in Health Care. Health literacy: Taking action to improve safety and quality. Sydney: ACSQHC; 2014.
CENTRE FOR THE HEALTH ECONOMY
59
70. Australian Bureau of Statistics. Australian social trends 2009. Canberra: ABS; 2009.
71. Berendsen AJ, de Jong GM, Schuling J, Bosveld HE, de Waal MW, Mitchell GK, et al. Patient's need for choice and information across the interface between primary and secondary care: a survey. Patient Educ Couns. 2010;79(1):100-5.
72. Dixon A, Robertson R, Bal R. The experience of implementing choice at point of referral: a comparison of the Netherlands and England. Health Econ Policy Law. 2010;5(3):295-317.
73. Ketelaar NA, Faber MJ, Elwyn G, Westert GP, Braspenning JC. Comparative performance information plays no role in the referral behaviour of GPs. BMC Fam Pract. 2014;15:146.
74. Department of Health. Report on the National Patient Choice Survey – February 2010 England. London: Department of Health; 2010.
75. Robertson R, Dixon A. Choice at the point of referral: Early results of a patient survey. London: 2009.
76. NHS. eRS Weekly Utilisation Report for week ending 25 December 2016 2016 [cited 2017 27 January ]. Available from: http://content.digital.nhs.uk/referrals/reports/weeklyutilisation.
77. Siciliani L, Borowitz M, Moran V. Waiting time policies in the health sector: What works? : OECD Publishing; 2013. Available from: http://www.quotidianosanita.it/allegati/allegato2476022.pdf.
78. Siciliani L, Iversen T. Waiting times and waiting lists. In: Jones A, editor. The Elgar Companion to Health Economics. Cheltenham, UK: Edward Elgar Publishing; 2012. p. 259-67.
79. Sivey P. The effect of waiting time and distance on hospital choice for English cataract patients. Health Economics. 2012;21(4):444-56.
80. Brown P, Panattoni L, Cameron L, Knox S, Ashton T, Tenbensel T, et al. Hospital sector choice and support for public hospital care in New Zealand: Results from a labeled discrete choice survey. Journal of health economics. 2015;43:118-27.
81. Bloom N, Propper C, Seiler S, Reenen JV. The impact of competition on management quality: Evidence form public hospitals. Discussion Paper No. 983, May. 2010.
82. Propper C, Sutton M, Whitnall C, Windmeijer F. Did ‘targets and terror’ reduce waiting times in England for hospital care? Working Paper No. 07/179. 2007.
83. Johnson R, Orme B. Getting the most from CBC. Sawtooth software research paper series. 2003;81.
84. Pearmain D, Swanson J, Kroes E. Stated preference techniques: a guide to practice. 2nd ed: Steer Davies Gleave and Hague Consulting Group; 1991.
85. Fifer S, Rose J, Greaves S. Hypothetical bias in Stated Choice Experiments: Is it a problem? And if so, how do we deal with it? Transportation research part A: policy and practice. 2014;61:164-77.
CENTRE FOR THE HEALTH ECONOMY
60
Appendix A – Survey administration
Pilot testing
Interviews
Twenty face-to-face interviews were undertaken to test a draft survey with a focus on whether the choice context, attributes and their levels, and choice tasks were understood as intended. Respondents provided detailed feedback on each part of the survey and ranked the seven attributes based on their importance, along with suggesting other attributes they would consider in their choices. Responses were used to finalise the survey and discrete choice experiment.
Pilot survey
An online pilot survey was undertaken to further test the survey and discrete choice experiment. In particular, respondents were asked about the clarity of the survey and difficulty of the choice tasks and the reason why they felt it was unclear and the task was difficult.
Sampling strategy The final survey and discrete choice experiment was provided to 1,000 respondents accessed through Toluna Australia, and administered via the Internet.
Based on established methodology, the estimated minimal sample size for the DCE study is 104 respondents. [83] Another rule of thumb suggests that, for DCE designs, sample sizes over 100 are able to provide a basis for modelling preference data. [84] Past experiences also suggest that for estimating the main effects sample sizes over 100 would be sufficient.
However, in this project the individual covariates related preference heterogeneity were also sought, which require more respondents. A sample size of 500 for each DCE was therefore chosen.
Accessing respondents Participants for the interviews were recruited by placing an advertisement in the Macquarie University newsletter and other channels. They were compensated with a voucher worth $30. Recruiting for the online surveys was undertaken through an online panel provider Toluna Australia, which is in partnership with SurveyEngine, the group that undertook the survey programming for this study. Participants earned points upon completing surveys. These points are automatically redeemed as vouchers.
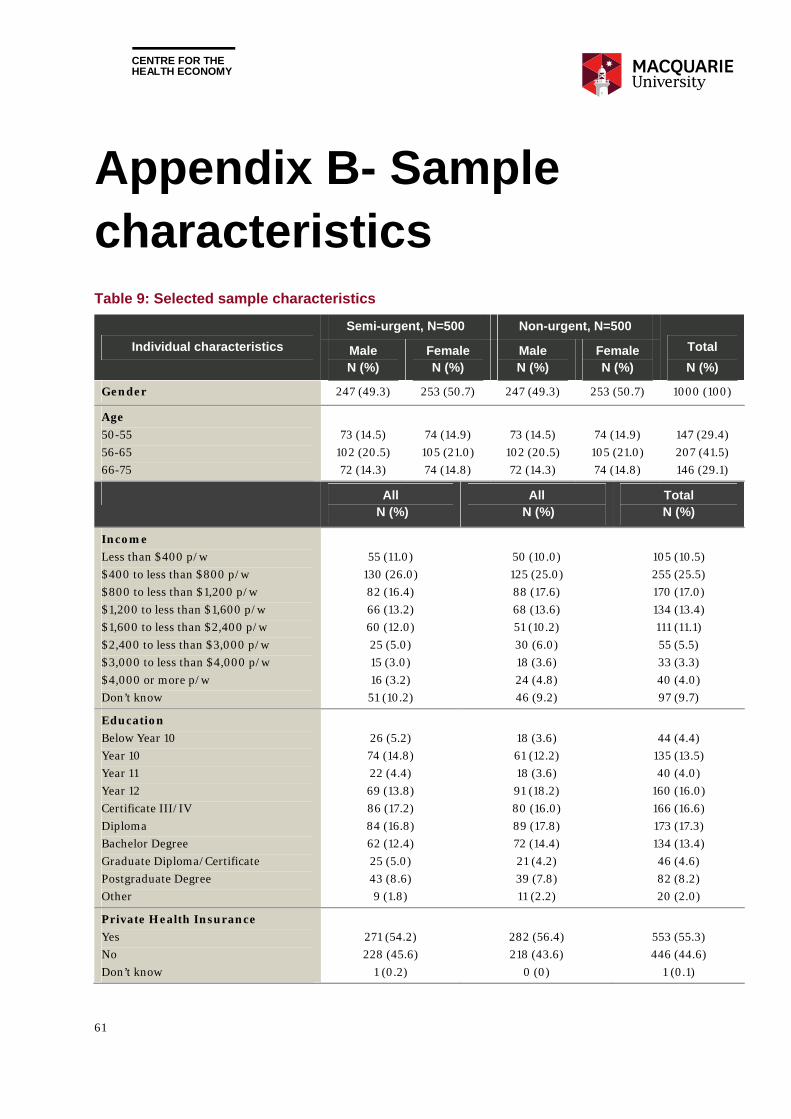
CENTRE FOR THE HEALTH ECONOMY
61
Appendix B- Sample characteristics Table 9: Selected sample characteristics
Individual characteristics
Semi-urgent, N=500 Non-urgent, N=500
Total
N (%) Male N (%)
Female N (%)
Male N (%)
Female N (%)
Gender 247 (49.3) 253 (50.7) 247 (49.3) 253 (50.7) 1000 (100)
Age
50-55
56-65
66-75
73 (14.5)
102 (20.5)
72 (14.3)
74 (14.9)
105 (21.0)
74 (14.8)
73 (14.5)
102 (20.5)
72 (14.3)
74 (14.9)
105 (21.0)
74 (14.8)
147 (29.4)
207 (41.5)
146 (29.1)
All N (%)
All N (%)
Total N (%)
Income
Less than $400 p/w
$400 to less than $800 p/w
$800 to less than $1,200 p/w
$1,200 to less than $1,600 p/w
$1,600 to less than $2,400 p/w
$2,400 to less than $3,000 p/w
$3,000 to less than $4,000 p/w
$4,000 or more p/w
Don’t know
55 (11.0)
130 (26.0)
82 (16.4)
66 (13.2)
60 (12.0)
25 (5.0)
15 (3.0)
16 (3.2)
51 (10.2)
50 (10.0)
125 (25.0)
88 (17.6)
68 (13.6)
51 (10.2)
30 (6.0)
18 (3.6)
24 (4.8)
46 (9.2)
105 (10.5)
255 (25.5)
170 (17.0)
134 (13.4)
111 (11.1)
55 (5.5)
33 (3.3)
40 (4.0)
97 (9.7)
Education
Below Year 10
Year 10
Year 11
Year 12
Certificate III/IV
Diploma
Bachelor Degree
Graduate Diploma/Certificate
Postgraduate Degree
Other
26 (5.2)
74 (14.8)
22 (4.4)
69 (13.8)
86 (17.2)
84 (16.8)
62 (12.4)
25 (5.0)
43 (8.6)
9 (1.8)
18 (3.6)
61 (12.2)
18 (3.6)
91 (18.2)
80 (16.0)
89 (17.8)
72 (14.4)
21 (4.2)
39 (7.8)
11 (2.2)
44 (4.4)
135 (13.5)
40 (4.0)
160 (16.0)
166 (16.6)
173 (17.3)
134 (13.4)
46 (4.6)
82 (8.2)
20 (2.0)
Private Health Insurance
Yes
No
Don’t know
271 (54.2)
228 (45.6)
1 (0.2)
282 (56.4)
218 (43.6)
0 (0)
553 (55.3)
446 (44.6)
1 (0.1)
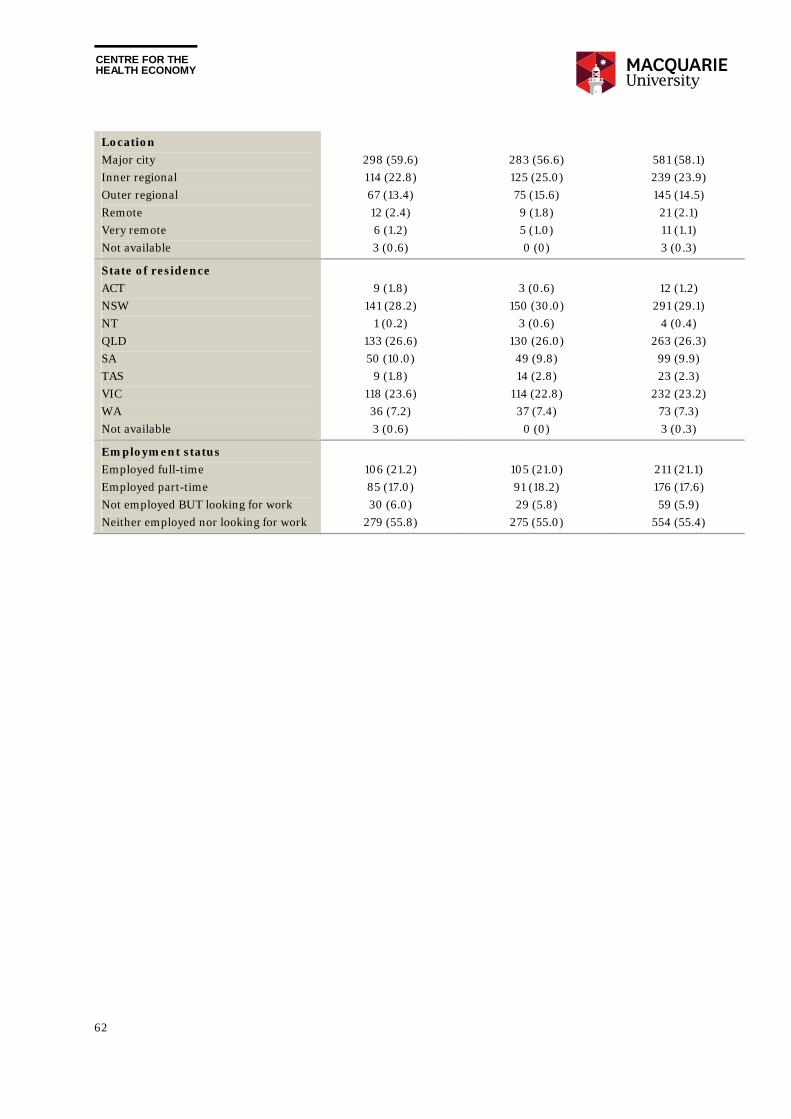
CENTRE FOR THE HEALTH ECONOMY
62
Location
Major city
Inner regional
Outer regional
Remote
Very remote
Not available
298 (59.6)
114 (22.8)
67 (13.4)
12 (2.4)
6 (1.2)
3 (0.6)
283 (56.6)
125 (25.0)
75 (15.6)
9 (1.8)
5 (1.0)
0 (0)
581 (58.1)
239 (23.9)
145 (14.5)
21 (2.1)
11 (1.1)
3 (0.3)
State of residence
ACT
NSW
NT
QLD
SA
TAS
VIC
WA
Not available
9 (1.8)
141 (28.2)
1 (0.2)
133 (26.6)
50 (10.0)
9 (1.8)
118 (23.6)
36 (7.2)
3 (0.6)
3 (0.6)
150 (30.0)
3 (0.6)
130 (26.0)
49 (9.8)
14 (2.8)
114 (22.8)
37 (7.4)
0 (0)
12 (1.2)
291 (29.1)
4 (0.4)
263 (26.3)
99 (9.9)
23 (2.3)
232 (23.2)
73 (7.3)
3 (0.3)
Employment status
Employed full-time
Employed part-time
Not employed BUT looking for work
Neither employed nor looking for work
106 (21.2)
85 (17.0)
30 (6.0)
279 (55.8)
105 (21.0)
91 (18.2)
29 (5.8)
275 (55.0)
211 (21.1)
176 (17.6)
59 (5.9)
554 (55.4)
CENTRE FOR THE HEALTH ECONOMY
63
Appendix C – Development of the DCE
Attribute identification and selection An initial set of attributes were generated through a literature review of published and grey literature including journal articles, working papers, policy documents and government reports. Attributes aligned to what is currently being measured within NSW public hospitals were also considered.
The candidate attributes and their levels, along with texts to describe them were tested first with a clinician working at a public hospital and then through 20 face-to-face interviews with 10 female and 10 male Australians aged from 5o to 75. Further validation was undertaken through a pilot survey with 100 eligible respondents who provided feedback on attributes and levels. The final selection includes seven attributes, as listed below.
1. Distance from home to the hospital.
2. Waiting time for surgery describing how long patients have to wait after they have registered with the hospital until they undergo surgery at the hospital.
3. GP’s opinion of the hospital’s quality describing GP’s personal view of the hospital’s effectiveness in delivering care based on patient need.
4. Other patients’ overall rating of the hospital based on their experience with the hospital, including cleanliness, standard of rooms, quality of food, friendliness and communication skills of staff, and access to parking.
5. Average health gain six months after surgery as reported by other patients with a similar condition described within the scenario.
6. Rate of adverse events which describes the proportion of unintended incidents due to medical mismanagement within the hospital that led to patient harm (e.g., hospital acquired infections, falls and medication mismanagement).8
7. Readmission rate within 28 days after surgery which describes the proportion of patients going back to hospital unexpectedly for treatment within 28 days after surgery, due to care received within the hospital.9
The first two attributes broadly measure convenience, while the remainder measure quality from difference sources, including GPs, other patients, and government data. The last three attributes
8 Further context was provided that the average rate of adverse events across all Australian hospitals was 7 adverse events out of every 100 patients admitted in 2014-2015. 9 Further context was provided that the average readmission rate across all Australian hospitals was 9 readmissions out of every 100 patients discharged in 2014-2015.
CENTRE FOR THE HEALTH ECONOMY
64
measure quality of care, one of them representing potential health benefits from elective surgery, while the other two representing potential risks for obtaining the health gain.
Experimental design and choice sets The DCE was designed using Ngene 1.1.2. The levels of the attributes varied between two hypothetical treatments in the choice sets according to a D-efficient design. The design was generated to accommodate two conditional logit models simultaneously. The first model does not consider the opt-out option while the second model does. A weighted efficiency measure was computed and optimised with weights 1 and 2 placed on the two models respectively.
The final design consisted of 24 different choice sets, which were blocked into 2 versions of the questionnaire, each containing 12 choice sets. Each respondent faced one version of the 12 choice sets plus a “rationality test” choice set where hospital A dominates hospital B across all aspects.
Based on the design, Ngene reported a D error of 0.42 for model 1 and 0.53 for model 2 and thus the weighted D error was 1.49. Levels of the attributes overall balance well. For all seven attributes, each attribute level appears at least once in each block.
Contextual information A “cheap talk” text was provided to improve consequentiality. Respondents were told that results from this survey may inform government policy and the future of the Australian public hospital system could be affected by the choices they make so they need to consider their choices carefully.
Detailed information was given in the context regarding the patient’s health condition and surgery condition. A 0-100 metric was also used to help respondents imagine their health conditions. The DCE intended to elicit people’s preferences for choosing public hospital as public patients (where the choice of surgeon is not available) which was emphasized in the choice context.
As there are potentially many other factors that may affect respondent preferences, it was also stated in the context that the two public hospitals are identical in all respects except those differences stated in each scenario. As an example, the choice context for the “semi-urgent” DCE is provided in Figure 2.
Presentation of choice sets The order of attributes was randomised across respondents so the potential order effect (i.e. focusing on only a few attributes due to the order of presentation) was evened out.
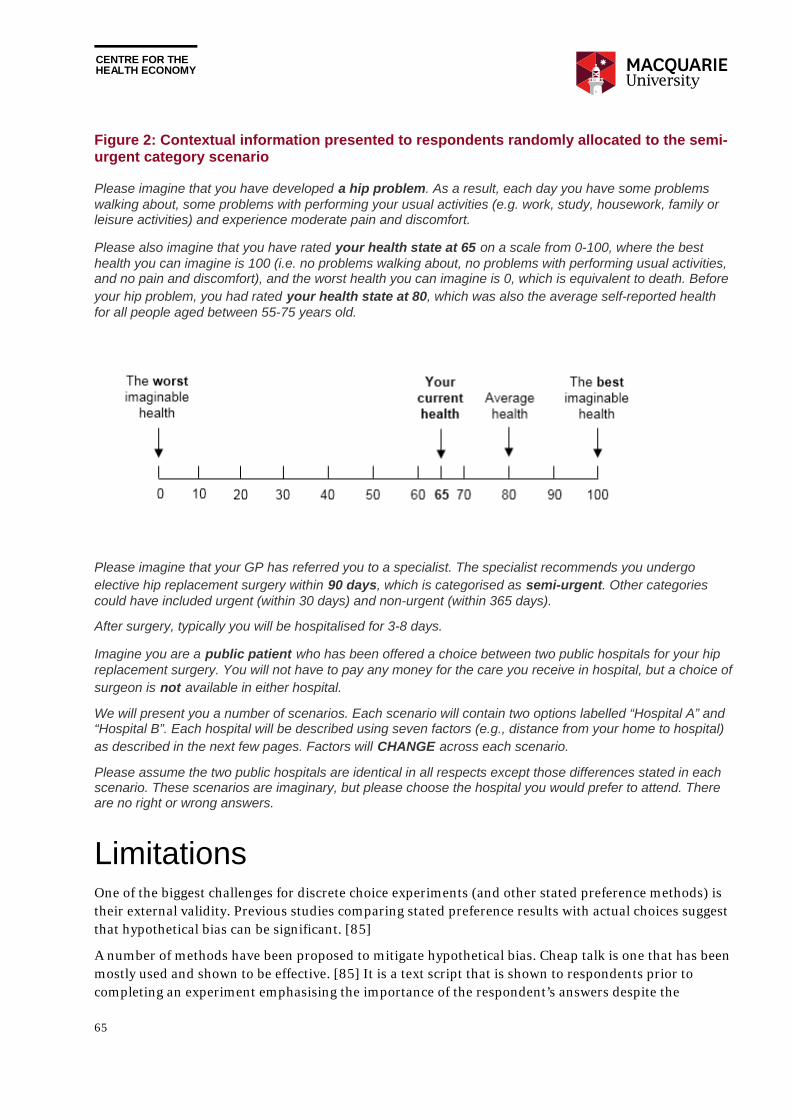
CENTRE FOR THE HEALTH ECONOMY
65
Figure 2: Contextual information presented to respondents randomly allocated to the semi-urgent category scenario
Please imagine that you have developed a hip problem. As a result, each day you have some problems walking about, some problems with performing your usual activities (e.g. work, study, housework, family or leisure activities) and experience moderate pain and discomfort.
Please also imagine that you have rated your health state at 65 on a scale from 0-100, where the best health you can imagine is 100 (i.e. no problems walking about, no problems with performing usual activities, and no pain and discomfort), and the worst health you can imagine is 0, which is equivalent to death. Before your hip problem, you had rated your health state at 80, which was also the average self-reported health for all people aged between 55-75 years old.
Please imagine that your GP has referred you to a specialist. The specialist recommends you undergo elective hip replacement surgery within 90 days, which is categorised as semi-urgent. Other categories could have included urgent (within 30 days) and non-urgent (within 365 days).
After surgery, typically you will be hospitalised for 3-8 days.
Imagine you are a public patient who has been offered a choice between two public hospitals for your hip replacement surgery. You will not have to pay any money for the care you receive in hospital, but a choice of surgeon is not available in either hospital.
We will present you a number of scenarios. Each scenario will contain two options labelled “Hospital A” and “Hospital B”. Each hospital will be described using seven factors (e.g., distance from your home to hospital) as described in the next few pages. Factors will CHANGE across each scenario.
Please assume the two public hospitals are identical in all respects except those differences stated in each scenario. These scenarios are imaginary, but please choose the hospital you would prefer to attend. There are no right or wrong answers.
Limitations One of the biggest challenges for discrete choice experiments (and other stated preference methods) is their external validity. Previous studies comparing stated preference results with actual choices suggest that hypothetical bias can be significant. [85]
A number of methods have been proposed to mitigate hypothetical bias. Cheap talk is one that has been mostly used and shown to be effective. [85] It is a text script that is shown to respondents prior to completing an experiment emphasising the importance of the respondent’s answers despite the

CENTRE FOR THE HEALTH ECONOMY
66
hypothetical nature of the task. Cheap talk was used in this DCE design and the fact that only twelve respondents failed the rationality test implies a high level of incentive compatibility was achieved.
Another type of bias is that hypothetical choice scenarios tend to simplify the real world where patients may need to choose between many hospitals based on a much larger number of factors. Cheap talk cannot mitigate this bias and thus cautions need to be taken when applying the results presented in this report to other settings. In the meantime, the stated difficulty in making choices and the need for the GP’s assistance from the survey highlight the potential challenges of patient choice in reality.
Finally, unobserved heterogeneity has not been taken into account in the modelling which may lead to bias in the preference estimation. In addition, the survey sample was not representative of the whole Australian population, and people not aged between 50 to 75 years may have different attribute preferences.