assessing biomass maps in europe with harmonized statistics and...
TRANSCRIPT

Assessing biomass maps in Europe with harmonized statistics and plots
Valerio Avitabile, Andrea CamiaJRC - Bio-Economy Unit (D1)

Overview
• Context: the JRC BIOMASS study
• Data:
• Statistics and plots
• Biomass maps
• Comparison:
• Maps vs. statistics
• Maps vs. plots
• Conclusions and next steps
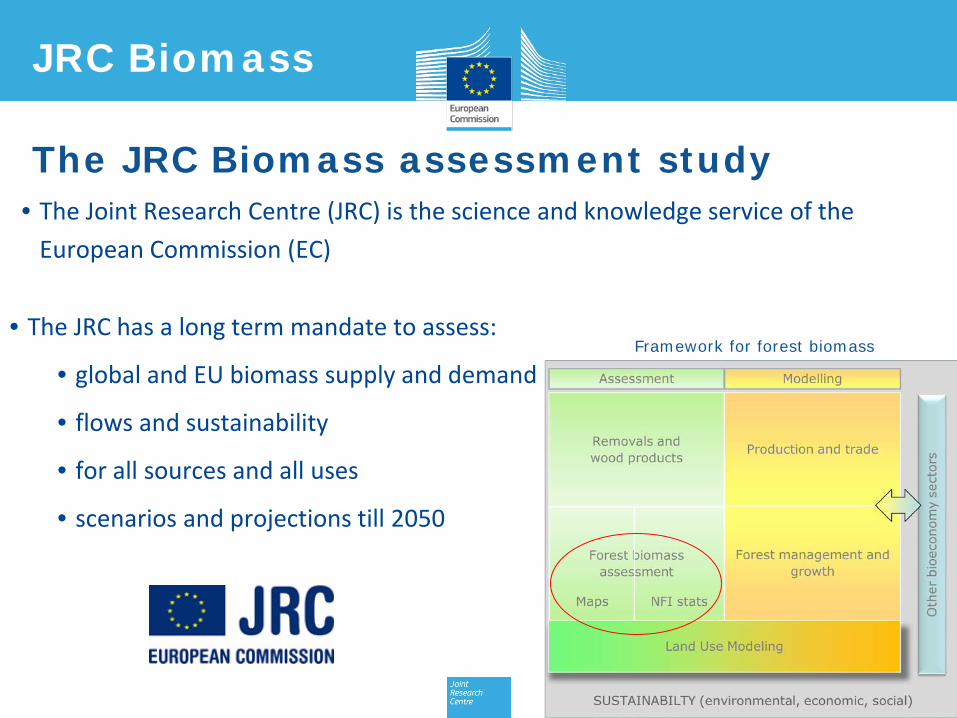
The JRC Biomass assessment study• The Joint Research Centre (JRC) is the science and knowledge service of the
European Commission (EC)
• The JRC has a long term mandate to assess:
• global and EU biomass supply and demand
• flows and sustainability
• for all sources and all uses
• scenarios and projections till 2050
Framework for forest biomass
JRC Biomass

Harmonized data
The harmonized forest biomass datasetCollaboration with European NFIs (26 countries) to develop comparable forest biomass data, using:
• Harmonized definition• Common estimator
26 countries with harmonized data
Harmonized Biomass definition

Total biomass stock (Tg)
National definition Harmonized definition Difference definition (%)
National estimator 16,234 16,907 4.1%
Common estimator 16,213 16,846 3.9%
Difference estimator (%) -0.13% -0.36% 3.8%
Harmonized biomass
Statistics:• Based on ~500,000 plots• Provide: Mean & Total Biomass (±SE)
• By species group• At sub-national level
• Harmonized stats: • Total stock: +4% than national stats• Signif. difference for 14 countries
Plots:• Subset of 22,166 plots• Geolocation @ 1km
Harmonized plots
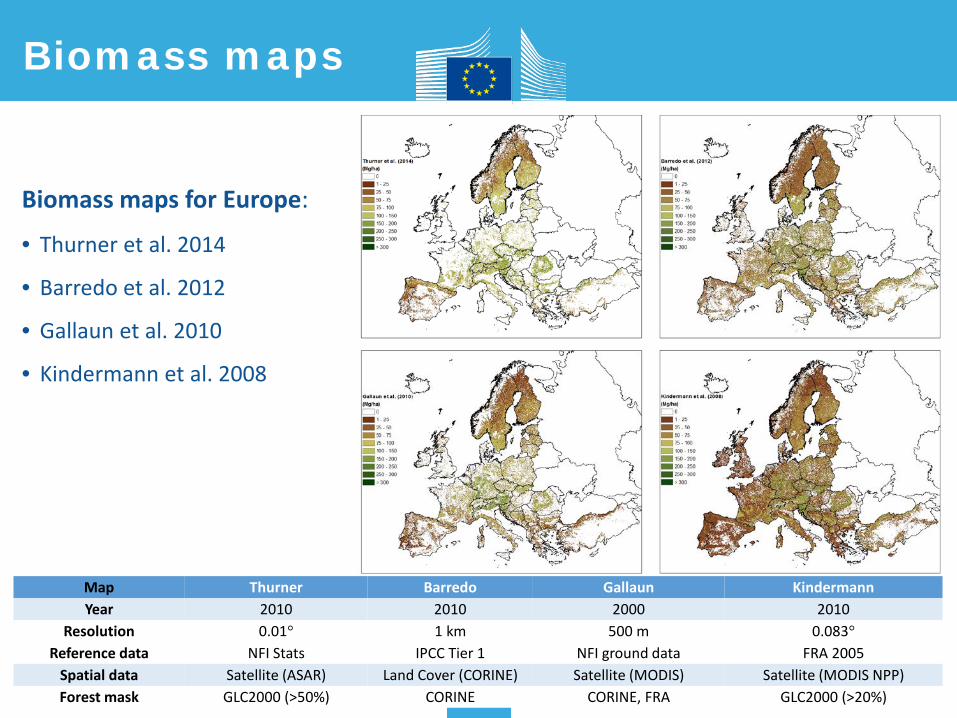
Map Thurner Barredo Gallaun KindermannYear 2010 2010 2000 2010
Resolution 0.01° 1 km 500 m 0.083°Reference data NFI Stats IPCC Tier 1 NFI ground data FRA 2005
Spatial data Satellite (ASAR) Land Cover (CORINE) Satellite (MODIS) Satellite (MODIS NPP)Forest mask GLC2000 (>50%) CORINE CORINE, FRA GLC2000 (>20%)
Biomass maps for Europe:
• Thurner et al. 2014
• Barredo et al. 2012
• Gallaun et al. 2010
• Kindermann et al. 2008
Biomass maps

Maps vs. Stats
AT
BE
BG
CH
CY
CZ
DE
DK
ES
FI
HRHU
IE
IT
LTLV
NL
NO
PL
PT
RO
SE
SKSRB
FR
0
500
1.000
1.500
2.000
2.500
- 500 1.000 1.500 2.000 2.500
Biom
ass m
aps (
Tg)
Harmonized statistics (Tg)
Total biomass at national level
Barredo Gallaun Kindermann Thurner
Barredo Gallaun Kindermann ThurnerNational
Bias (Tg) -8 -150 -17 -101r2 0.98 0.91 0.98 0.83
RMSE (Tg) 94 254 97 280Rel RMSE (%) 14% 39% 15% 43%
0
100
200
300
400
500
600
700
800
900
1.000
- 200 400 600 800 1.000
Biom
ass m
aps (
Tg)
Harmonized statistics (Tg)
Total biomass at sub-national level
Barredo Gallaun Kindermann Thurner
Barredo Gallaun Kindermann ThurnerSub-national
Bias (Tg) -1 -13 -2 -10r2 0.95 0.93 0.97 0.89
RMSE (Tg) 22 28 16 33Rel RMSE (%) 37% 48% 28% 56%
Avitabile & Camia (in review)

Maps vs. Stats
Barredo Gallaun Kindermann ThurnerNational
Bias (Tg) -8 -150 -17 -101r2 0.98 0.91 0.98 0.83
RMSE (Tg) 94 254 97 280Rel RMSE (%) 14% 39% 15% 43%
Barredo Gallaun Kindermann ThurnerNational
Bias (Tg) -29.9 -42.8 -37.7 -22.7r2 0.83 0.77 0.79 0.79
RMSE (Tg) 37.5 50.5 45.0 36.2Rel RMSE (%) 30% 40% 36% 29%
ATBEBG
CH
CY
CZDE
DK
ES
FI
HRHU
IEIT
LTLV NL
NO
PL
PT
RO
SE
SK
SRBFR
0
50
100
150
200
250
0 50 100 150 200 250
Biom
ass m
aps (
Mg/
ha)
Harmonized statistics (Mg/ha)
Mean biomass at national level
Barredo Gallaun Kindermann Thurner
0
50
100
150
200
250
300
- 50 100 150 200 250 300
Biom
ass m
aps (
Mg/
ha)
Harmonized statistics (Mg/ha)
Mean biomass at sub-national level
Barredo Gallaun Kindermann Thurner
Barredo Gallaun Kindermann ThurnerSub-national
Bias (Tg) -31 -44 -42 -29r2 0.71 0.66 0.68 0.73
RMSE (Tg) 46 57 54 52Rel RMSE (%) 36% 45% 43% 41%
Avitabile & Camia (in review)

Plots
Spatial mismatch• NFI plot area: < 1 ha• NFI released: 1 Km• Biomass maps: 1 Km
Remove plots:a. in heterogeneous pixels (tree cover)b. not representative of the pixel
Differences between plots and pixels
Temporal mismatch• NFI plots cycle: 2001 - 2013• Biomass maps: 2000 or 2010
Update plot biomass:a. Use IPCC growth rates (Mg/ha/yr)b. Update to the year of the maps
Maps vs. Plots

Relevance of plot screening
Maps vs. Plots
Avi
tab
ile &
Cam
ia (
in r
evie
w)
Maps accuracy selected vs. all plots
Bias -58%
RMSE -19%
Rel. RMSE -27%
R2 +44%
Accuracy improvements
• Remove plots not representative of the pixels• Increase the accuracy statistics• Maintain the properties of the original dataset:
• Spatial distribution• Frequency distribution
Frequency distribution
Harmonized plots
Spatial distribution
Harmonized plots

Barredo Gallaun Kindermann ThurnerSelected plots
N. plots 501 356 502 405Bias (Mg/ha) -12 -6 -17 -25
RMSE (Mg/ha) 87 82 88 89Rel RMSE (%) 63% 72% 64% 64%
Maps vs. Plots
Avitabile & Camia (in review)

Towards a spatially-explicit, harmonized biomass assessment in EU
• NFI data• Key source of data, reliable stats up to sub-national level• Plots: large amounts, statistical sampling• Country-specific design, usually provide only growing stock volume• Plots: Large amounts, small area, usually not released
• Harmonized data• Derived from NFI data for 26 countries• Harmonized biomass stats and plots at sub-national scale • Temporal differences among countries (NFI cycles)• Plots: Subset, geolocation @ 1km, not released
Summary (1)

• Biomass maps• Total stocks similar (but lower) compared to statistics• Overestimation at low biomass - Underestimation at high biomass • Likely due to calibration with mean values, limited sensitivity of satellite signal• Differences increase National -> Sub-national -> Pixel
• Next steps / needs: Better integration of NFI data with biomass maps
• Spatially: maps with higher resolution (1 ha), plots with precise location• Temporally: adjust data to a reference year• Thematically: consistent forest and biomass definitions
Towards a biomass map consistent with NFI Statistics Relevance of mapping forest available for wood supply
Summary (2)

Thanks