assessing atmospheric emissions from amine based co2 · pdf file3.6 solvent distributor design...
TRANSCRIPT
ENERGY FLAGSHIP
Assessing Atmospheric Emissions from Amine-based CO2 Post-combustion Capture
Processes and their Impacts on the Environment – A Case Study
Volume 1
Measurement of emissions from a monoethanolamine-based post-combustion CO2 capture pilot plant
Final Report
Merched Azzi, Anne Tibbett, Brendan Halliburton, Adrian Element, Yuli Artanto, Erik Meuleman, Paul Feron
May 2014
Global Carbon Capture and Storage Institute (Global CCS Institute)

Energy Flagship
Citation
Azzi M., Tibbett A., Halliburton B., Element A., Artanto Y., Meuleman E., Feron P. (2014)
Assessing Atmospheric Emissions from Amine-based CO2 Post-combustion Capture Processes and their Impacts on the Environment – A Case Study. Volume 1: Measurement of emissions from a monoethanolamine-based post-combustion CO2 capture pilot plant. CSIRO, Australia.
Copyright and disclaimer
© Global Carbon Capture and Storage Institute Limited 2014 Melbourne. To the extent permitted by law, all rights are reserved and no part of this publication covered by copyright may be reproduced or copied in any form or by any means except with the written permission of the Global CCS Institute and CSIRO.
Important disclaimer
CSIRO advises that the information contained in this publication comprises general statements based on scientific research. The reader is advised and needs to be aware that such information may be incomplete or unable to be used in any specific situation. No reliance or actions must therefore be made on that information without seeking prior expert professional, scientific and technical advice. To the extent permitted by law, CSIRO (including its employees and consultants) excludes all liability to any person for any consequences, including but not limited to all losses, damages, costs, expenses and any other compensation, arising directly or indirectly from using this publication (in part or in whole) and any information or material contained in it.
This document is published on the Global CCS Institute’s website in the interest of information exchange. The Global CCS Institute does not give any representation or warranty as to the reliability, accuracy or completeness of the information, nor does it accept any responsibility arising in any way (including by negligence) for errors in, or omissions from, the information.

Assessing Atmospheric Emissions from Amine-based CO2 Post-Combustion Capture Processes and their Impacts on the Environment – A Case Study
Volume 1: Measurement of emissions from a monoethanolamine-based post-combustion capture pilot plant | i
Contents Glossary ......................................................................................................................................................... v
Acknowledgments ....................................................................................................................................... vii
Project Overview ........................................................................................................................................ viii
Executive Summary ...................................................................................................................................... ix
Background to Carbon Capture and Storage and its Environmental Implications ....................................... xi
Project Component 1: 1
Measurement of emissions from a monoethanolamine-based post-combustion capture pilot plant 1
1 Introduction .................................................................................................................................... 2
2 The Post-Combustion CO2 Capture Pilot Plant ................................................................................ 3
2.1 Pilot plant description ........................................................................................................... 3
2.2 Pilot plant operation ............................................................................................................. 6
3 Sampling Points ............................................................................................................................. 16
3.1 Criteria for representative sampling ................................................................................... 16
3.2 Sampling requirements for the Loy Yang Pilot Plant .......................................................... 16
3.3 Installation of the sampling plane at the water wash exit ................................................. 17
3.4 Installation of the sampling plane at the absorber exit ...................................................... 18
3.5 Gas flow in post-combustion capture pilot plant – computational fluid dynamic analyses ......................................................................................................................................... 18
3.6 Solvent distributor design study ......................................................................................... 19
3.7 New solvent distributor design ........................................................................................... 20
4 Sampling Methodology ................................................................................................................. 22
4.1 Sampling port interfacing ................................................................................................... 22
4.2 Stack sampling apparatus ................................................................................................... 26
4.3 Validation of sampling methods ......................................................................................... 31
4.4 Sampling review and conclusions ....................................................................................... 42
5 Analytical Methodologies ............................................................................................................. 43
5.1 Monoethanolamine and diethanolamine ........................................................................... 45
5.2 Ammonia ............................................................................................................................. 49
5.3 Alkylamines ......................................................................................................................... 52
5.4 Amides ................................................................................................................................ 56
5.5 Nitrosamines ....................................................................................................................... 56
5.6 Carbonyls (aldehydes and ketones) .................................................................................... 61
5.7 Anions ................................................................................................................................. 62
5.8 Metals ................................................................................................................................. 63
5.9 Summary performance of the analytical methods for PCC process assessment ............... 64
5.10 Analytical conclusions and recommendations ................................................................... 68
6 Emissions Results .......................................................................................................................... 69
7 Concluding Remarks ...................................................................................................................... 73

Assessing Atmospheric Emissions from Amine-based CO2 Post-Combustion Capture Processes and their Impacts on the Environment – A Case Study
ii | Volume 1: Measurement of emissions from a monoethanolamine-based post-combustion capture pilot plant
References .................................................................................................................................................. 74
Appendix A Water Wash Simulation using ProTreat simulator ............................................................. 76
Appendix B Analytical Technical Reports ............................................................................................... 79

Assessing Atmospheric Emissions from Amine-based CO2 Post-Combustion Capture Processes and their Impacts on the Environment – A Case Study
Volume 1: Measurement of emissions from a monoethanolamine-based post-combustion capture pilot plant | iii
Figures Figure 1. Process flow diagram of the CSIRO post-combustion capture pilot plant operating without process gas pre-treatment ........................................................................................................................... 3
Figure 2. Process parameters affecting CO2 recovery and reboiler heat duty as a function of operating time ............................................................................................................................................................... 7
Figure 3. Monoethanolamine loss distribution for 0–300 and 300–800 hours ......................................... 10
Figure 4. CO2 balance, CO2 concentrations (gas phase) and monoethanolamine (MEA) concentration (liquid phase) around the plant .................................................................................................................. 11
Figure 5. Gas and liquid sampling locations in the CSIRO post-combustion capture pilot plant ............... 12
Figure 6. Typical CO2 balance during the CSIRO post-combustion capture pilot plant operation ............. 13
Figure 7. Heat-stable salt (HSS) concentration in combined campaigns: Tarong and Loy Yang pilot plant ............................................................................................................................................................ 15
Figure 8. Pressure drop and flow rates during the experimental campaign at Loy Yang pilot plant ......... 15
Figure 9. Identified sample points at the Loy Yang post-combustion capture pilot plant. A, process gas inlet after initial cooling and condensation removal; B, Absorber Column 2 after absorption before the water-wash section; C, process gas return line .......................................................................................... 16
Figure 10. Sampling port at the outlet of the Loy Yang pilot plant, identified as point ‘C’. ....................... 17
Figure 11. Solvent distributor in Column 1 ................................................................................................. 18
Figure 12. Computational fluid dynamic modelling results at 158 m3/hr gas flow rate of the existing solvent distributor (left), and the effect of grip-type flow straighteners: long (top right) and short (bottom left) ............................................................................................................................................... 19
Figure 13. Solvent distributor design study (left) and computational fluid dynamic modelling results at 158 m3/hr gas flow rate (right) ................................................................................................................... 20
Figure 14. New solvent distributor design (left) and computational fluid dynamic modelling results at 158 m3/hr gas flow rate (right) ................................................................................................................... 20
Figure 15. Standard showerhead type distributor (left) and flow straightener and new custom-made distributor (right) after installation ............................................................................................................ 21
Figure 16. Old demister being replaced with a new improved demister ................................................... 21
Figure 17. Diagrammatic representation of the sampling plug installed at each sampling port (perspective view) ...................................................................................................................................... 22
Figure 18. Diagrammatic representation of the sampling plug installed at each sampling port (top, plan view and bottom, elevation view) .............................................................................................................. 23
Figure 19. Source sampling apparatus installed into the outlet sampling port at Loy Yang pilot plant, showing glass impinger train ...................................................................................................................... 24
Figure 20. Sampling port at the outlet of the Loy Yang pilot plant. The heated probe, the additional curved section of heated sampling probe and ball valve can also be seen ............................................... 24
Figure 21. Sampling port located at the inlet to the water-wash section at the Loy Yang pilot plant....... 25
Figure 22. APEX Instruments (North Carolina USA) model XC-572 source sampling system .................... 26
Figure 23. Diagram of the impinger assembly and heated probe used during Loy Yang pilot plant sampling measurements ............................................................................................................................ 27
Figure 24. Diagram of the impinger assembly with inserted condenser and heated probe used during Loy Yang pilot plant sampling measurements .................................................................................................. 28
Assessing Atmospheric Emissions from Amine-based CO2 Post-Combustion Capture Processes and their Impacts on the Environment – A Case Study
iv | Volume 1: Measurement of emissions from a monoethanolamine-based post-combustion capture pilot plant
Figure 25. Mass captured for each impinger relative to impinger placement in the sampling train, spiked sample ........................................................................................................................................................ 36
Figure 26. Mass captured for each impinger relative to impinger placement in the sampling train, non-spiked sample ............................................................................................................................................. 37
Figure 27. Mass captured for each impinger relative to impinger placement in the sampling train for the modified USEPA Methods 0011 (organic phase), non-spike sample ......................................................... 41
Tables Table 1. Post-combustion capture pilot plant design information .............................................................. 5
Table 2. Typical process gas properties from AGL Loy Yang Power plant received by the CSIRO Loy Yang pilot plant ..................................................................................................................................................... 6
Table 3. Monoethanolamine (MEA) loss determination ............................................................................ 10
Table 4. Overview of process conditions during the campaign at CSIRO Loy Yang pilot plant .................. 14
Table 5. Analyte contact surfaces during sampling .................................................................................... 26
Table 6. Sampling methods followed during measurements at Loy Yang pilot plant ................................ 28
Table 7. Collection efficiencies and recoveries of USEPA Method 0011 and USEPA 8315A ...................... 29
Table 8. Treatments used to stabilise compounds within the impinger train ........................................... 31
Table 9. Sample background, transport and storage stability and impinger collection efficiency assessment ................................................................................................................................................. 32
Table 10. Carbonyl impinger results from the first sampling campaign .................................................... 34
Table 11. Dependence of the number of impingers and collection efficiency .......................................... 35
Table 12. Validation of USEPA Method 0011 ............................................................................................. 38
Table 13. Validation of 2,4-dinitrophenylhydrazine (DNPH)/organic phase sample collection ................. 40
Table 14. Method detection limits (MDLs) for ion chromatography methodology for monoethanolamine (MEA) and diethanolamine (DELA) in process liquids, and as the equivalent gas-phase concentration under nominal sampling parameters ......................................................................................................... 47
Table 15. Analytical methodologies and sensitivity limits for priority compounds in post-combustion capture process solutions from Phase 2 assessment ................................................................................ 65
Table 16. Analytical methodologies implemented and their applicability to post-combustion capture process assessment of priority compounds ............................................................................................... 67
Table 17. Concentrations of priority compounds in process liquors and in process gas streams ............. 69

Assessing Atmospheric Emissions from Amine-based CO2 Post-Combustion Capture Processes and their Impacts on the Environment – A Case Study
Volume 1: Measurement of emissions from a monoethanolamine-based post-combustion capture pilot plant | v
Glossary
Analyte Substance or chemical constituent that is of interest in an analytical procedure
Alkylamines
Methylamine (MA)
Ethylamine (EA)
Dimethylamine (DMA)
Diethylamine (DEA)
Decomposition products from amine-based post-combustion capture operations
Computational fluid dynamics (CFD) Branch of fluid mechanics that uses numerical methods and algorithms to solve and analyse problems involving fluid flows
Counter flow When one fluid (gas) is moving in the opposite direction to a second fluid (liquid)
Diethanolamine (DELA) Impurity or decomposition product from amine-based post-combustion capture operations
Detection limit (DL) or method detection limit (MDL)
A statistically derived measure of sensitivity of a specific aspect of the method, or as an equivalent for combined aspects of the methodology
2,4-dinitrophenylhydrazine (DNPH) Agent used to derivatise carbonyl compounds, specifically aldehydes and ketones
Electrostatic particle precipitator (ESP)
Particle removal device that uses high voltage to separate particles from a gas stream
Flue gas stream Exhaust gas stream within an industrial process that exits to the atmosphere
Gas-phase chromatography with tandem mass spectrometry (GCMSMS)
Technique that combines the physical separation capabilities of gas phase chromatography with the mass analysis capabilities of mass spectrometry (GCMS). MSMS uses two stages of mass spectrometry to provide additional mass analysis data
Heat exchanger Device used to transfer heat from one fluid stream to another
Heat-stable salts A range of stable salts produced in a post-combustion capture solvent during operation
Ion chromatography (IC) Technique that allows the separation of ions and polar molecules based on their charge
Impinger Vessel that collects analytes during stack sampling operations
Isokinetic sampling The process of collecting aerosol in a moving stream that moves at the same velocity in the sampling nozzle as elsewhere in the stream
Knock-out drum Separator for separating liquid and solid phases from a gas stream
Liquid-phase chromatography with tandem mass spectrometry (LCMSMS)
Technique that combines the physical separation capabilities of liquid chromatography with the mass analysis capabilities of mass spectrometry (LCMS). MSMS uses two stages of mass spectrometry to provide additional mass analyses data
Monoethanolamine (MEA) The most commonly used solvent for CO2 post-combustion capture
MEA 600+ Solvent used in this study, aged for 600 hours at the CSIRO Tarong pilot plant
Multiple reaction monitoring (MRM) Mass spectrometry (MS) technique that delivers a characteristic fragment ion that can be monitored and quantified in the midst of a complicated matrix
N-Nitrosodiethanolamine (NDELA) Product formed from the nitrosation of diethanolamine
N-Nitrosodiethylamine (NDEA) Product formed from the nitrosation of diethylamine
N-Nitrosodimethylamine (NDMA) Product formed from the nitrosation of dimethylamine
N-Nitrosomorpholine Product formed from the nitrosation of morpholine
Nm³ Gas volume in cubic metres at 20 °C and 1 atmosphere pressure
Post-combustion capture (PCC) Removal of CO2 from power station flue gas prior to its compression, transportation and storage in suitable geological formations, as part of carbon capture and storage (CCS)
Process gas stream Any gas stream within an industrial process: in the context of this report, this is the post-combustion capture plant
Reclaimer Section of a post-combustion capture plant where heat-stable salts are removed from a solvent
Relative percent difference (RPD) The difference between numbers based as a percent of their average
An indicator of precision from duplicate measurements

Assessing Atmospheric Emissions from Amine-based CO2 Post-Combustion Capture Processes and their Impacts on the Environment – A Case Study
vi | Volume 1: Measurement of emissions from a monoethanolamine-based post-combustion capture pilot plant
Relative Standard Deviation (RSD, %) The standard deviation of replicate measurements as a percent of their mean
An indicator of precision from replicate measurements
‘Spike’ (in the context of target analytes)
An accurately known addition of target added to a solution, such as an impinger liquid or a solution for analysis, to measure recoveries and validate sample collection and analytical methods
Sampling Extracting target compounds from a fluid system
Sampling point The position in a process gas stream where sampling operations are undertaken
Sampling plane The fluid plane over which sampling operations are undertaken within a process fluid pipe or duct. Usually undertaken orthogonal to the fluid flow
Solvent (in the process context) The liquid phase used to absorb CO2 in a post-combustion capture plant
Stack Chimney and flue ductwork transporting exhaust gases from a combustion furnace
Stripper Section of a post-combustion capture plant where CO2 is released from the solvent
Titration The process of determining the concentration of a substance in solution by adding to it a standard reagent of known concentration in carefully measured amounts until a reaction of definite and known proportion is completed. The equivalence, or end point, is often determined by a colour change or by electrical measurement, and then calculating the unknown concentration
Wet scrubbing The process of removing a target gas or gases from a gas stream using a liquid phase

Assessing Atmospheric Emissions from Amine-based CO2 Post-Combustion Capture Processes and their Impacts on the Environment – A Case Study
Volume 1: Measurement of emissions from a monoethanolamine-based post-combustion capture pilot plant | vii
Acknowledgments
The authors wish to acknowledge financial assistance provided through Global Capture and Storage Institute. We also extend our acknowledgement for the financial assistance of the CSIRO Energy Transformed Flagship.
We would like to thank James Jansen, Owen Farrell, Aaron Cottrell, Hoda Javanmard and Scott Morgan from CSIRO for their technical efforts.
We would like to extend our thanks to Rama Nimmagadda from Advanced Analytical Australia (AAA), and to Phil Bridgen from AsureQuality NZ for their expertise in securing high-level analytical performance in the methods developed for this project. Mark Lewin from AAA, Vince Verheyen and Alicia Reynolds from Monash University and the personnel at SGS Leeder Consulting are also thanked for their considerable attention to the analytical effort.

Assessing Atmospheric Emissions from Amine-based CO2 Post-Combustion Capture Processes and their Impacts on the Environment – A Case Study
viii | Volume 1: Measurement of emissions from a monoethanolamine-based post-combustion capture pilot plant
Project Overview
The Global Carbon Capture and Storage (CCS) Institute commissioned CSIRO to investigate atmospheric emissions from amine-based CO2 post-combustion capture (PCC) processes, and evaluate the potential environmental impact of these emissions using a case study approach. The outcome of this study is the assessment of these environmental and human health impacts within the context of the commercialisation and widespread deployment of amine-based PCC.
Working towards improving PCC technology and accelerating the global deployment of commercial-scale CCS projects, the Global CCS Institute brings together projects, policy makers and researchers to underpin major challenges related to CCS deployment. It uses lessons learnt from CCS projects around the world to provide information to a broad audience and improve our understanding of the technical, economic, financial, commercial and engagement issues faced by CCS.
The research comprised three separate but interlinking components:
1. Quantifying emissions of an amine-based PCC process, which is the focus of this report. The CSIRO PCC pilot plant located at AGL Loy Yang coal-fired power station was selected as the test facility, using the most common or benchmark amine, monoethanolamine (MEA).
2. Evaluating photochemical mechanisms associated with selected amine systems, using the CSIRO Smog Chamber facility.
3. Assessing the risk associated with future deployment of amine-based PCC plants, using air quality modelling to predict the atmospheric fate and environmental risk of selected PCC-generated compounds. The modelling experiments included measured PCC process data, as well as smog chamber mechanistic and kinetic results.
The findings from Component 1 are presented in Volume 1 of the project report, The measurement of emissions from a monoethanolamine-based post-combustion capture pilot plant, and are the subject of this document. Components 2 and 3 are presented in Volume 2 of the report, Atmospheric chemistry of monoethanolamine and 3D air quality modelling of emissions from the Loy Yang post-combustion capture plant.

Assessing Atmospheric Emissions from Amine-based CO2 Post-Combustion Capture Processes and their Impacts on the Environment – A Case Study
Volume 1: Measurement of emissions from a monoethanolamine-based post-combustion capture pilot plant | ix
Summary
A comprehensive experimental investigation of emissions concentrations of selected PCC liquors and process gas streams has been completed at the AGL Loy Yang Power Station using the CSIRO Loy Yang pilot-scale post-combustion capture (PCC) plant (LYPP). The benchmark solvent, monoethanolamine (MEA), was used to capture CO2 from the process gas of the Loy Yang coal-fired power plant. This experimental study has focused on applying, evaluating and, where required, further developing current stack sampling and analytical techniques to identify the major chemical components existing in the process.
The target compounds and respective sampling methods were selected based on our knowledge of likely degradation products from a MEA solvent-based process, the emissions pathways through a PCC system, the flow characteristics of the plant, and on grounds relating to the release of these compounds to the environment. More than thirty organic and inorganic species were prioritised for quantitative measurement, and included MEA, diethanolamine, ammonia, and a range of alkylamines, amides, nitrosamines, carbonyls, anions and metal species. These groups of compounds exhibit significant differences in their chemical and physical nature, and consequently, in their behaviour in the environment under test and under the analytical procedures employed for their determination. A wide range of techniques was therefore used to quantitatively assess these compounds in the PCC system.
A range of sampling procedures, based on standard regulatory methods for stationary source testing, were optimised to the conditions encountered in PCC plant operation. Solvent and wash water liquids and samples from selected points in the process gas stream were collected. Various techniques for analyte collection in the gas phase were implemented and developed for the specific requirements of PCC process assessment.
The analytical tasks were undertaken by a number of analytical facilities. These facilities performed rigorous and informed method evaluations, in both the application of standard techniques to process samples or in the development of new or modified methodologies specifically applicable to the range of matrices and disparate constituent concentrations encountered in PCC process solutions. A wide range of preparative and analytical techniques were evaluated, with the most appropriate techniques used to analyse the LYPP samples. These results formed the basis for reviewing the suitability of each methodology for assessing PCC processes.
This study revealed significant challenges in ensuring the efficiency of sample collection and analysis when measuring PCC systems. The wide-ranging chemistry of PCC analytes, and the different matrices in which they are present, must be addressed in all aspects of their collection, preparative and instrumental methodologies, to ensure that quantitative assessments are stable, sensitive, selective and accurate. The results of these evaluations are presented in this report. Overall, the sampling and analytical work has proven successful in most aspects of the assessment. Sensitivity at the parts-per-trillion (by volume) level in the gas phase was achieved for certain determinations. Further validation, or in certain cases, development, of the methodologies is recommended to ensure their on-going performance under all PCC process conditions.
The study has shown that the dominant emission from PCC operations is ammonia, with a concentration in the order of 250 mg/Nm3 in the LYPP process exit gas stream. Measured emissions of acetaldehyde, at around 1 mg/Nm3, suggest that acetaldehyde may also penetrate through the water-wash section of a PCC plant. Nitrosodiethanolamine was quantified in small concentrations in the solvent liquor, but was not detected in the water wash or in process gas emissions from the pilot plant. Its precursor, diethanolamine, was also found in the degraded solvent. Nitrosomorpholine was the only target nitrosamine that was quantified in the solvent, water-wash section and emission stream from the pilot plant; concentrations in the low ng/Nm3 (pptv) level were detected in the exit flue gas.
Assessing Atmospheric Emissions from Amine-based CO2 Post-Combustion Capture Processes and their Impacts on the Environment – A Case Study
x | Volume 1: Measurement of emissions from a monoethanolamine-based post-combustion capture pilot plant
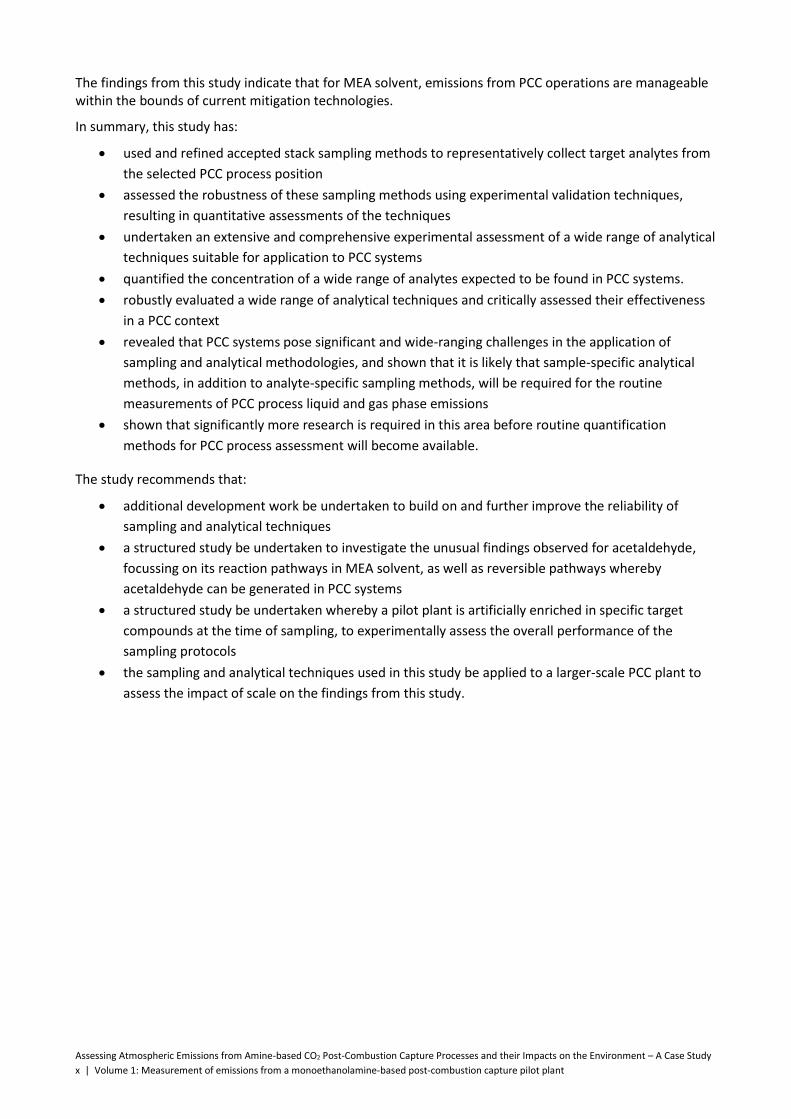
The findings from this study indicate that for MEA solvent, emissions from PCC operations are manageable within the bounds of current mitigation technologies.
In summary, this study has:
used and refined accepted stack sampling methods to representatively collect target analytes from
the selected PCC process position
assessed the robustness of these sampling methods using experimental validation techniques,
resulting in quantitative assessments of the techniques
undertaken an extensive and comprehensive experimental assessment of a wide range of analytical
techniques suitable for application to PCC systems
quantified the concentration of a wide range of analytes expected to be found in PCC systems.
robustly evaluated a wide range of analytical techniques and critically assessed their effectiveness
in a PCC context
revealed that PCC systems pose significant and wide-ranging challenges in the application of
sampling and analytical methodologies, and shown that it is likely that sample-specific analytical
methods, in addition to analyte-specific sampling methods, will be required for the routine
measurements of PCC process liquid and gas phase emissions
shown that significantly more research is required in this area before routine quantification
methods for PCC process assessment will become available.
The study recommends that:
additional development work be undertaken to build on and further improve the reliability of
sampling and analytical techniques
a structured study be undertaken to investigate the unusual findings observed for acetaldehyde,
focussing on its reaction pathways in MEA solvent, as well as reversible pathways whereby
acetaldehyde can be generated in PCC systems
a structured study be undertaken whereby a pilot plant is artificially enriched in specific target
compounds at the time of sampling, to experimentally assess the overall performance of the
sampling protocols
the sampling and analytical techniques used in this study be applied to a larger-scale PCC plant to
assess the impact of scale on the findings from this study.
Assessing Atmospheric Emissions from Amine-based CO2 Post-Combustion Capture Processes and their Impacts on the Environment – A Case Study
Volume 1: Measurement of emissions from a monoethanolamine-based post-combustion capture pilot plant | xi
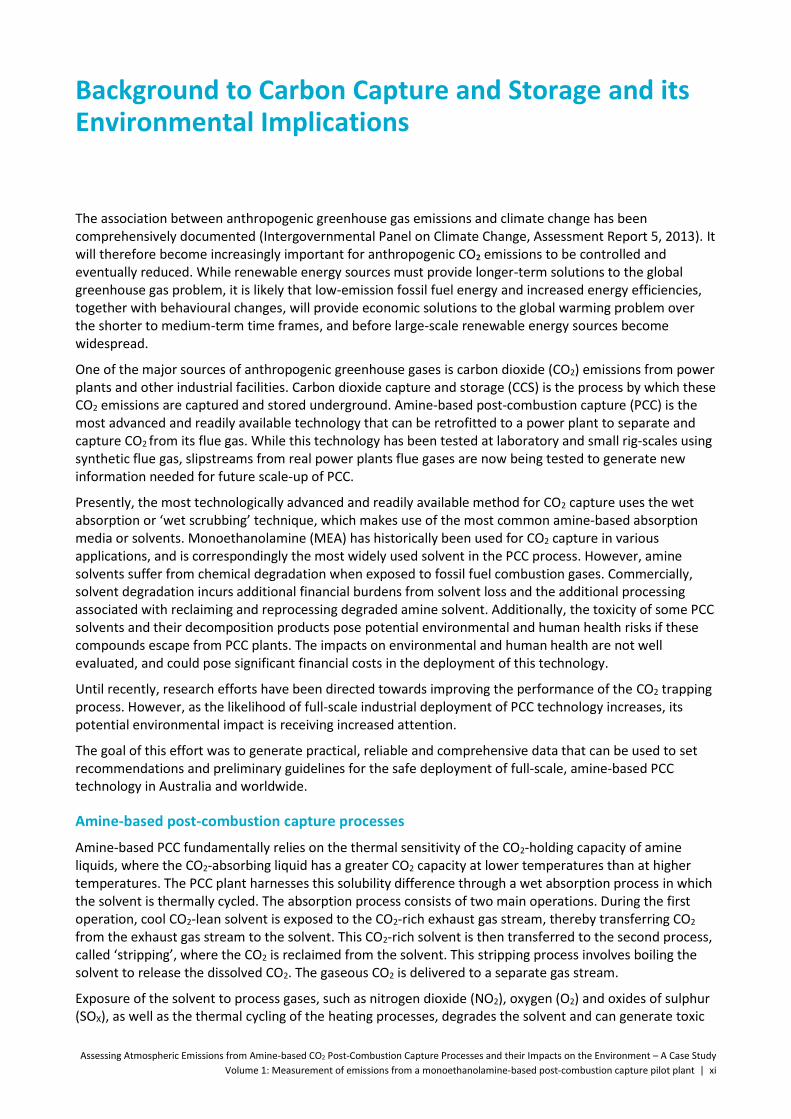
Background to Carbon Capture and Storage and its Environmental Implications
The association between anthropogenic greenhouse gas emissions and climate change has been comprehensively documented (Intergovernmental Panel on Climate Change, Assessment Report 5, 2013). It will therefore become increasingly important for anthropogenic CO₂ emissions to be controlled and eventually reduced. While renewable energy sources must provide longer-term solutions to the global greenhouse gas problem, it is likely that low-emission fossil fuel energy and increased energy efficiencies, together with behavioural changes, will provide economic solutions to the global warming problem over the shorter to medium-term time frames, and before large-scale renewable energy sources become widespread.
One of the major sources of anthropogenic greenhouse gases is carbon dioxide (CO2) emissions from power plants and other industrial facilities. Carbon dioxide capture and storage (CCS) is the process by which these CO2 emissions are captured and stored underground. Amine-based post-combustion capture (PCC) is the most advanced and readily available technology that can be retrofitted to a power plant to separate and capture CO2 from its flue gas. While this technology has been tested at laboratory and small rig-scales using synthetic flue gas, slipstreams from real power plants flue gases are now being tested to generate new information needed for future scale-up of PCC.
Presently, the most technologically advanced and readily available method for CO2 capture uses the wet absorption or ‘wet scrubbing’ technique, which makes use of the most common amine-based absorption media or solvents. Monoethanolamine (MEA) has historically been used for CO2 capture in various applications, and is correspondingly the most widely used solvent in the PCC process. However, amine solvents suffer from chemical degradation when exposed to fossil fuel combustion gases. Commercially, solvent degradation incurs additional financial burdens from solvent loss and the additional processing associated with reclaiming and reprocessing degraded amine solvent. Additionally, the toxicity of some PCC solvents and their decomposition products pose potential environmental and human health risks if these compounds escape from PCC plants. The impacts on environmental and human health are not well evaluated, and could pose significant financial costs in the deployment of this technology.
Until recently, research efforts have been directed towards improving the performance of the CO2 trapping process. However, as the likelihood of full-scale industrial deployment of PCC technology increases, its potential environmental impact is receiving increased attention.
The goal of this effort was to generate practical, reliable and comprehensive data that can be used to set recommendations and preliminary guidelines for the safe deployment of full-scale, amine-based PCC technology in Australia and worldwide.
Amine-based post-combustion capture processes
Amine-based PCC fundamentally relies on the thermal sensitivity of the CO2-holding capacity of amine liquids, where the CO2-absorbing liquid has a greater CO2 capacity at lower temperatures than at higher temperatures. The PCC plant harnesses this solubility difference through a wet absorption process in which the solvent is thermally cycled. The absorption process consists of two main operations. During the first operation, cool CO2-lean solvent is exposed to the CO2-rich exhaust gas stream, thereby transferring CO2 from the exhaust gas stream to the solvent. This CO2-rich solvent is then transferred to the second process, called ‘stripping’, where the CO2 is reclaimed from the solvent. This stripping process involves boiling the solvent to release the dissolved CO2. The gaseous CO2 is delivered to a separate gas stream.
Exposure of the solvent to process gases, such as nitrogen dioxide (NO2), oxygen (O2) and oxides of sulphur (SOX), as well as the thermal cycling of the heating processes, degrades the solvent and can generate toxic

Assessing Atmospheric Emissions from Amine-based CO2 Post-Combustion Capture Processes and their Impacts on the Environment – A Case Study
xii | Volume 1: Measurement of emissions from a monoethanolamine-based post-combustion capture pilot plant
decomposition products. If the deployed emission control technologies are ineffective to capture the pollutants of concerns, these compounds may be released into the environment.
Amine degradation
Amine solvents can degrade from exposure to the oxidising gas components of process gases, as well as through thermal cycling of the solvent in the absorption and stripping processes. Their degradation can also be accelerated by exposure to catalytic metals, such as vanadium, iron and copper, which are either present in the process gas or as contact surfaces within the plant itself. Existing literature related to oxidative degradation is historically based on laboratory-scale experiments, the up-scaling of which may not be representative of the degradation products present at the pilot or demonstration scales. Major degradation products expected from amine PCC operations include ammonia, organic acids and aldehydes. Most commercial operators use oxidation inhibitors to limit oxidative degradation of amine solvents.
The rate of amine degradation is particularly sensitive to NO2 concentration. Consequently, even though NO2 is normally only a small fraction of the total oxides of nitrogen (NOx) emissions, it is generally scrubbed from the process gas stream entering the amine absorber. To minimise solvent degradation arising from NO2 reactions, it is generally recognised that NO2 concentrations should be kept below 10 ppm. However, nitrogen monoxide (NO), which is the major component of the NOx emissions from fossil fuel combustion, can be oxidised to NO2 at the absorber inlet. Additionally, NO is not scrubbed before entering the amine absorber. Thus, NO2 formed from the oxidation of NO at the inlet of the amine absorber can react with amines and amine degradation components to form additional degradation products, including ammonia and nitrosamines.
Oxides of sulphur (i.e. SO2, SO3) will react with amines to produce heat-stable salts. It is recommended to limit the levels of SOx entering the absorber below 10 ppm to minimise solvent degradation. SO3 is also expected to promote the formation of mists in the absorber, which will entrain the solvent from the absorber into the stack. Thus, controlling SO3 before its entry to the absorber column can reduce the loss of amine through entrainment pathways.
A wide range of PCC solvent degradation products have been identified and reported in the literature. The products of particular interest from an environmental and health perspective include ammonia, aldehydes, alkylamines, amides, nitrosamines and nitramines. These latter two compound classes are of particular concern, from both an environmental and health perspective, due to their toxicity. However, although primary amines such as MEA may not directly produce nitroso compounds without undergoing intermediate chemical transformations, MEA may contain secondary amine components as impurities, or they may be generated from the process itself. Many reaction mechanisms will be responsible for the formation processes of these degradation products – particularly nitrosamines and nitramines – making this a complex and emerging area of science.
PCC emission transformations in the atmosphere
Emissions of amines and other degradation products to the atmosphere will produce secondary products, such as ammonia, ozone and aerosols. These products are formed as a result of complex chemical reactions between the emitted pollutants and other chemical compounds in the air in the presence of sunlight. The atmospheric lifetime of amines and their derivatives will range from a few minutes to much longer periods, depending on the reactivity of the selected amines. The longer-lived species may be transported over long distances and can slowly degrade to form other secondary products. Amines may also be deposited on the ground by wet and dry deposition processes.
Air quality modelling is required to predict the types of pollutants and their corresponding concentrations resulting from their chemical and physical interactions in the atmosphere.
The amines and their degradation products that reach the atmosphere may change the reactivity of the surrounding air and affect the composition of the background air. Major gaps exist in the knowledge related to the kinetics of atmospheric degradation of amines, and the latest chemical mechanisms published in the literature are empirical schemes that require further development and research.

Assessing Atmospheric Emissions from Amine-based CO2 Post-Combustion Capture Processes and their Impacts on the Environment – A Case Study
Volume 1: Measurement of emissions from a monoethanolamine-based post-combustion capture pilot plant | xiii
Smog chamber studies can provide mechanistic data for atmospheric models and can provide information regarding the atmospheric fate of amines that would otherwise be unobtainable. Smog chamber data can also be used to validate proposed chemical mechanisms used to describe the atmospheric degradation of MEA. For example, it has been reported that nitrosamines and nitramines could form in the atmosphere under selected environmental conditions. These compounds can be readily photolysed when exposed to sunlight. Smog chamber studies can be used to determine the mechanisms controlling the formation and destruction of these chemicals.
Future air quality regulations and licensing for the operation of a PCC plant would require the use of appropriate chemical mechanisms to assess the air quality over downwind areas. The assessment would include scenarios for business-as-usual scenarios, and for the anticipated worst-case scenario of emissions from the plant. The potential deployment of this technology will therefore be assessed not only in terms of CO2 capture, but also for any unwanted trade-offs regarding air quality of the selected area.
Environmental standards for amines from post-combustion capture operations
Regulatory frameworks and human exposure thresholds are in place for a number of amines used as PCC solvents and their degradation products. The United States Code of Federal Regulations (CFR), United States Environmental Protection Agency (USEPA), United States Occupational Safety and Health Administration (OSHA), National Institute for Occupational Health and Safety (NIOSH) and other regulatory agencies provide detailed guidelines and databases of exposure limits for a number of PCC-derived compounds. In addition, comprehensive reviews of the environmental guidelines for nitrosamines (Lag et al., 2011) and for nitramines (Selin, 2011) have been made in a PCC context. Substantial data are already available, or can be derived from existing applications, to set emissions exposure limits in the PCC context. However, gaps exist in this information for some specific PCC-derived compounds with respect to human exposure limits, toxicology and methods of quantification. The development of new PCC solvents will also provide challenges for regulators, because the degradation products may not be sufficiently characterised and their decomposition chemistry and toxicity may be unknown. Thus, to provide robust environmental and human health protection measures, further research will be required to fill the gaps in our knowledge of PCC-derived compounds and allow new information to feed into existing regulatory frameworks. On the basis of the existing and emerging science of PCC emissions, the optimal settings for environmental standards can be discussed in the context of measurability, techno-economical feasibility of mitigation measures, potential environmental impact and solvent characteristics.


Project Component 1:
Measurement of
emissions from a
monoethanolamine-
based post-combustion
capture pilot plant

Assessing Atmospheric Emissions from Amine-based CO2 Post-Combustion Capture Processes and their Impacts on the Environment – A Case Study
2 | Volume 1: Measurement of emissions from a monoethanolamine-based post-combustion capture pilot plant
1 Introduction
The most advanced greenhouse gas control technology to capture carbon dioxide (CO2) emissions from fossil-fuel combustion sources employs aqueous alkanolamine-based systems. Laboratory and pilot plant measurements have shown that amine solvents may undergo a range of complex degradation processes when exposed to typical combustion process gases. These reactions produce a mosaic of by-products and intermediate compounds, with solvent matrices generally increasing in chemical complexity as exposure time to process gases increases. Additionally, the parent amines and by-products of PCC processes frequently have environmental or health impacts. It is therefore essential to clearly understand the environmental and health risks associated with post-combustion capture (PCC) emissions before this technology’s widespread deployment.
Regulators will also require an environmental performance assessment of PCC emissions before widespread deployment. The measurement framework for the current, emerging PCC industry is at an early stage, with many important PCC by-products yet to be reliably characterised and quantified. Questions remain regarding analyte sampling systems, measurement representatives, analyte conservation, analytical sensitivity, interferences and repeatability for the wide range of prevailing PCC matrix conditions.
To understand more about the environmental implications of PCC technology, the first component of the project – the subject of this report – addresses the measurement of emissions from an amine-based PCC process. To undertake these measurements, the CSIRO PCC pilot plant located at AGL Loy Yang Power (LYP) facility was selected as the test facility and the benchmark amine monoethanolamine (MEA) was used as the solvent for CO2 capture. More than thirty organic and inorganic species were prioritised for quantitative measurement, including MEA and the major and minor process products: ammonia, diethanolamine, alkylamines, amides, aldehydes, nitrosamines, anions and metal species.
The activities associated with Component 1 of the project aimed to:
monitor parameters associated with routine plant operations
develop and implement sampling procedures for the extraction of representative samples from
selected points of the PCC process plant
develop and implement methods to capture and conserve target compounds in process liquids and
solutions
develop and implement analytical procedures to isolate and quantify major components and trace
products from the various sample matrices.
This report provides a description of these activities and a discussion of outcomes relevant to the requirements of PCC process assessment. It includes sections addressing plant operation, sampling points and plant modifications for sample collection, sampling methodologies, analytical methodologies and the results from the sampling campaign undertaken at the LYP PCC plant.

Assessing Atmospheric Emissions from Amine-based CO2 Post-Combustion Capture Processes and their Impacts on the Environment – A Case Study
Volume 1: Measurement of emissions from a monoethanolamine-based post-combustion capture pilot plant | 3
2 The Post-Combustion CO2 Capture Pilot Plant
2.1 Pilot plant description
The process gas used for PCC operations at the CSIRO Loy Yang pilot plant (LYPP) is drawn directly from the exhaust gas stream of LYPP. The LYPP uses four 560-MWe generators, which are powered by brown coal combustion. Electrostatic precipitator (ESP) particle cleaning technology is used for particle emissions control. Although flue gas Denitrification (DeNOx) and flue gas desulphurisation (FGD) technologies are widely used overseas to control NOx and SOx emissions, they are not installed at Loy Yang. Therefore, this study can be considered as a “worst case scenario” for emissions from a PCC plant.
A detailed process description of the LYPP has been reported elsewhere (Artanto et al., 2012). The pilot plant was designed to capture CO2 from process gases at a rate of 50 kg/h using 30 wt% aqueous MEA solution, which is identified as ‘solvent’ in Figure 1. LYPP consists of one absorber column for the control of acidic process gas species before CO2 removal, two absorber columns to capture CO2, and a separate column for removing CO2 from the solvent. A typical process flow sheet of the LYPP is given in Figure 1.
Figure 1. Process flow diagram of the CSIRO post-combustion capture pilot plant operating without process gas pre-treatment
The process gas for PCC operations is taken from LYP exhaust ductwork from a location after the ESP filter, and then allowed to cool within this transfer pipe-work before it reaches LYPP. The process gas then moves to a separator, identified as the ‘knock-out drum’ in Figure 1. The knock-out drum further cools the process gas in addition to separating liquid and particle phases from the process gas. The process gas leaving the knock-out drum is then drawn into the first of the PCC adsorption columns. This first column is identified as the ‘pre-treatment’ column in Figure 1. In the pre-treatment column, a caustic solution (pH 9) is circulated in a counter-flow direction to the gas process flow. Within this pre-treatment column, SOx, NO2 and fine particulate matter are further removed from the process gas. The process gas is then pumped by way of a

Assessing Atmospheric Emissions from Amine-based CO2 Post-Combustion Capture Processes and their Impacts on the Environment – A Case Study
4 | Volume 1: Measurement of emissions from a monoethanolamine-based post-combustion capture pilot plant
speed controlled ‘blower’ through an orifice plate flow meter and into the first of two separate CO2-absorbing columns. The fan speed of the blower is automatically controlled on the basis of the volumetric flow rate through the orifice plate meter, thus maintaining stable and controlled gas flow through LYPP.
Following process gas cleaning and flow control, the process gas is pumped to the CO2 absorber section. This section consists of two columns that are connected in series with the process gas passing successively through the inlet and outlet of each column. This arrangement, in which the absorber is broken into two separate shorter sections, was chosen to maintain sufficient absorber length for PCC operations while allowing the pilot plant to be transported on a normal Australian road-going semi-trailer. To facilitate transportation, the absorber pipework and other apparatus are contained within a transportable steel structure that supports the plant during both transportation and PCC operations. The two absorbers are labelled in the direction of solvent flow in Figure 1. The solvent stream to ‘Absorber 1’ (abbreviated as ABS 1), identified as ‘cold lean solvent’, is taken from the separate solvent holding tank, which is identified as the ‘solvent make-up tank’. This tank includes sensors that allow the level of solvent to be measured while the plant is in operation. Absorber 1 contains random packing arranged as two separate absorption segments, each of which are 1.35 m in height. The solvent leaving the solvent make-up tank enters Absorber 1 by way of a spray distributor, which sits above the uppermost layer of packing and evenly distributes the solvent liquor over the absorber column. The CO2-rich solvent leaving Absorber 1 enters the second absorber, where additional CO2 is absorbed. ‘Absorber 2’ (abbreviated as ABS 2), also contains random packing arranged as two separate absorption segments, each of which are 1.35 m in height.
A series of heat exchangers are used to control and transfer heat within the PCC process. The CO2-rich solvent contained in the bottom of Absorber 2, called ‘cold rich solvent’ in Figure 1, is pumped through a heat exchanger, where it is heated by the exiting flow of hot CO2-lean solvent from the stripper (identified as ‘hot lean solvent’ in Figure 1). Following pre-heating, the cold rich solvent is pumped into the top of the stripper for CO2 removal. The hot lean solvent leaving the stripper is cooled by passing successively through two heat exchangers before it reaches a suitable temperature to enter the make-up tank. The first of these heat exchangers is the same as that used to heat the cold rich solvent, while the second heat exchanger is water-cooled and maintains the solvent at the operational temperature of absorber. In the stripper column, water vapour and CO2 separate from the solvent through an endothermic desorption process. The heat required for CO2 desorption is supplied from a boiler and heat exchanger system, which is identified as the ‘reboiler’ in Figure 1. The reboiler system uses condensing steam to maintain stripper bottom temperatures around 110–115 °C.
Process gas flow is in the reverse direction to the solvent flow. Process gas enters Absorber 2 in an upwards direction counter-current to the downward-flowing solvent. The gas exiting the top of Absorber 2 is connected through stainless steel pipework to the lower section of Absorber 1. The gas flow within Absorber 1 is similar to the flow direction of Absorber 2, with the process gas flowing upwards and in a counter-current direction to the downward-flowing solvent The CO2-lean process gas exiting Absorber 1 passes into a separate cleaning section, where the gas is scrubbed of soluble impurities. This final absorption section is identified as the ‘wash column’ in Figure 1 and consists of a column containing random packing arranged to packed height of 1.05 m. Within this section, water is sprayed and re-circulated in a counter-current direction over the upward-flowing process gas. The treated gas is finally released from the top of the wash column, where it is returned to the LYPP process gas stream at a position further downstream of the initial inlet point to LYPP.
Specific operational and design information for the pilot plant are given in Table 1.

Assessing Atmospheric Emissions from Amine-based CO2 Post-Combustion Capture Processes and their Impacts on the Environment – A Case Study
Volume 1: Measurement of emissions from a monoethanolamine-based post-combustion capture pilot plant | 5
Table 1. Post-combustion capture pilot plant design information
PARAMETER DESIGN VALUE
Process gas flow rate
Blower
Inlet temp for blower
CO2 absorption degree
Max solvent flow rate
Max stripper pressure
Max. 204 Nm³/h
Positive displacement (Hibon-type PD blower). Includes 4-kW motor
Max. 70 °C
85–95%
15 L/min
170 kPa
Process gas pre-treatment column:
Material
Inner diameter
Column height
Packing height
Packing type
Packing size
Specific area
Packing factor
304L SS 300DN SHD 10
313 mm
520 cm
100 cm
Pall ring
16 mm
338 m²/m³
306 1/m
Absorber column (1 and 2):
Material
Inner diameter
Column height
Packing height
Packing type
Packing size
Specific area
Packing factor
304L SS 200DN stainless steel
211 mm
940 cm
135 cm (x 2 beds)
Pall ring
16 mm
338 m²/m³
306 1/m
Water wash section:
Material
Inner diameter
Demister
Packing height
Packing type
Packing size
Specific area
Packing factor
304L SS 200DN stainless steel
211 mm
Rhine Ruhr 200-mm-thick Dynamesh DM9030L2
1150 mm
Pall ring
16 mm
338 m²/m³
306 1/m
Stripper column:
Material
Inner diameter
Column height
Packing height
Packing type
Packing size
Specific area
Packing factor
304L SS 150DN stainless steel
161 mm
690 cm
390 cm
Pall ring
16 mm
338 m²/m³
306 1/m

Assessing Atmospheric Emissions from Amine-based CO2 Post-Combustion Capture Processes and their Impacts on the Environment – A Case Study
6 | Volume 1: Measurement of emissions from a monoethanolamine-based post-combustion capture pilot plant
2.2 Pilot plant operation
The pilot plant has been modified to accommodate emission measurements. Plant modifications only relate to the installation of sampling planes, and are described in detail in Section 4 of this report.
Table 2 shows an example of typical process gas composition from LYP during the period of the experimental campaign. The process gas contains significant amounts of SO2 and NOx.
Table 2. Typical process gas properties from AGL Loy Yang Power plant received by the CSIRO Loy Yang pilot plant
ELEMENT RANGE COMPOSITION (31 JULY 2012 – 10 MAY 2013)
H2O (vol% – wet) 12–13
CO2 (vol% – wet) 10–12
O2 (vol% – wet) 5–10
Impurities (wet ppm volume)
SO2 50–300
NOx (~99% NO, balance NO2) 100–250
Temperature (°C) 125–150
Optimised operating conditions were selected on the basis of balancing a suite of boundary conditions to best support the main aims of the project. The boundaries were:
30 wt% MEA in water with a preferred range between 29–31% and an accepted range between 28–33%
CO2 recovery of 90% kept steady at an accepted range between 85–95% through variation of the liquid flow rate, while having a steady process gas flow rate
constant gas flow velocity within the operational bounds of the pilot plant
maintain plant operation within the designed operational parameters
minimise solvent loss within the bounds of the plant design.
The process gas entering Absorber 2 is typically around 25–30 °C. From this gas entry temperature, absorber temperatures increase until a maximum temperature of 49–59 °C is reached approximately halfway along the column. CO2-lean process gas exits Absorber 2 and enters Absorber 1, with a temperature between 50 and 51 °C. The cold lean solvent enters Absorber 1 with a temperature controlled to 40 °C. Temperatures within Absorber 1 reach a maximum of around 68–70 °C approximately halfway along the column.
The water balance over the plant is maintained by the temperature difference between the process gas inlet and the process gas outlet. Water is condensed from the process gas within the water wash circuit, which dilutes the concentration of MEA and other components. The process gas exiting the water-wash section is typically 20–25 °C, where the 5 °C difference between the process gas inlet and the process gas outlet has been typically found to be adequate for maintaining the water balance. The temperature in the absorption section is normally maintained 20–30 °C higher than the washing section. The overflow of water wash, which contains MEA from the water wash process, is returned to the feed-tank, allowing the mass balance of the MEA to be conserved over the process. Thus, the only MEA loss pathway – excluding plant failures – is from process gas outlet emissions from the plant.
The PCC pilot plant at LYP was operated with a previously aged MEA solvent. This solvent had been exposed to normal PCC conditions for 639 hours at the Tarong power station pilot plant from December 2010 to June 2011. This solvent has been designated as MEA 600+. The use of this solvent ensured that solvent degradation was already underway before PCC operations at the Loy Yang pilot plant. We therefore expected that degradation products would be observed in the solvent within a much shorter time compared with a new solvent. The MEA 600+ was stored at Tarong Power Station and LYP for

Assessing Atmospheric Emissions from Amine-based CO2 Post-Combustion Capture Processes and their Impacts on the Environment – A Case Study
Volume 1: Measurement of emissions from a monoethanolamine-based post-combustion capture pilot plant | 7
approximately 12 months before use under sunlight-exclusive conditions to minimise photochemical reactions.
The experimental campaign at LYPP began on 31 July 2012, with the plant generally operating for approximately 12 hours per day. At the end of December 2012, the solvent had been exposed to about 810 additional hours of PCC operation, resulting in a total of almost 1500 operational hours of PCC. The absorption liquid flow rate ranged between 5 and 7 L/min. With a typical 150–180 L of solvent inventory, the solvent cycle rate through the plant was in the order of 20–30 minutes.
Figure 2 describes the effect of selected process parameters of the pilot plant operation on CO2 recovery and reboiler heat duty during the LYPP operating time of 1120 hours (period of the evaluation tests from 31 July until 10 May 2013).
Figure 2. Process parameters affecting CO2 recovery and reboiler heat duty as a function of operating time
Figure 2 shows that in general, changing the liquid to gas (L/G) ratio from 5.5 to 4.3 and then reducing it to 4.0 did not significantly change CO2 recovery or reboiler heat duty. Reboiler heat duty for the regeneration of CO2-loaded solvent was determined by completing an energy balance between the reboiler and/or the stripper column. Two approaches can be used to determine reboiler heat duty. In the first approach, the measured reboiler heat duty was determined by a manual measurement of steam condensed flow and the steam pressure supplied to the reboiler. However, this actual reboiler heat duty includes additional uncertainty due to heat loss to ambient air. The actual reboiler heat duty is expressed per amount of CO2 absorbed. In the second approach, the calculated reboiler heat duty is divided into three contributors (Artanto et al., 2012): the heat required for evaporating water, the heat required to increase solvent temperature to that of the reboiler temperature (Qsh), and the heat of CO2 desorption (Qdes). The heat required to evaporate the water is equivalent to the latent heat of water condensation, which can be measured directly around the condenser (Qcond). The equation can be represented as follows:

Assessing Atmospheric Emissions from Amine-based CO2 Post-Combustion Capture Processes and their Impacts on the Environment – A Case Study
8 | Volume 1: Measurement of emissions from a monoethanolamine-based post-combustion capture pilot plant
22COCO
ΔH m )top
- Tbottom
(Tp
cs
m w
ΔHw
m
desQ
shQ
condQ
desorptionQ
atsolvent heQ
condenser Q
reboilerQ
where reboilerQ is the reboiler heat duty; wm is the amount of water flowing into the condenser; wΔH is the
latent heat of water condensation; sm is the solvent flow rate; pc is the heat capacity of the solvent;
bottomT is the temperature of hot lean solvent leaving the bottom of stripper column;
topT is the
temperature of hot rich solvent entering the top of stripper column; 2COm is the amount of CO2 produced
from the stripper column; and 2COΔH is the enthalpy of CO2 desorption. The difference between the
calculated and the measured reboiler heat duties was not significant over the campaign period, which may indicate that heat loss was kept to a minimum during plant operation.
The CO2 recovery data presented in Figure 2 show that there were two operational days where CO2 recovery fell below 70%. These periods of low recovery were due to operational problems with the blower control systems, which were rectified over the duration of the experimental program.
The MEA solvent concentration was monitored by daily acid–base titrations. Data from the titrations were used to adjust LYPP operating parameters to maintain MEA concentration within the prescribed concentration range (Figure 2). MEA concentration was maintained within a range of 29–32% from the first 30 hours of operation up until 1120 hours of operation. However, the equivalence point of the titration became less distinct as the solvent aged, producing increased variation in the determination of MEA concentration over this period. During the early operation period, the large initial L/G ratio of 5.5 L/Nm³ resulted in both a larger reboiler heat duty (7.9–8.8 MJ/kg CO2) and CO2 recovery (93%) despite a normal MEA concentration of 30%.
The measured reboiler heat duty (Figure 2) shows an increase of approximately 8.8 MJ/kg CO2 (8.0 MJ/kg CO2 for calculated heat duty) at 467 hours operating time. This is likely due to the stripper bottom temperature increasing to reduce solvent lean loading (below 0.20 mol CO2/mol MEA) and maintain CO2 recovery at a constant value. For a reboiler heat duty greater than 7 MJ/kg CO2, a similar condition was typically observed.
During the experimental campaign, the MEA balance in the pilot plant was maintained by adjusting the wash water rate. Process simulations undertaken using Pro Treat (the details of which are in Appendix A ) indicated that with a wash water flow rate of 11 L/min and a temperature of 30 °C, the MEA concentration in the process gas would reduce to 0.1 ppm. Under these conditions, these data represent a negligible loss of solvent. Pro Treat simulations also suggested no improvement in solvent loss with water flows between 15 and 20 L/min.
The retained MEA volume in the plant is calculated on the basis of the MEA concentration of the solvent, and the volume of MEA measured in the storage feed tank. On this basis, the MEA loss rate over the duration of the study was estimated to be 0.06 L/hr. However, the methodology used to determine the remaining volume of MEA in the plant includes significant data scatter and uncertainty. During the initial LYPP operational period, these MEA volume data, while uncertain, suggested that the MEA loss rate increases at water flow rates of less than 10 L/min. This tended to concur with corresponding Pro Treat data.
After the first 300 hours of operation, the technique used to estimate the volume of MEA remaining in the plant continued to display substantial scatter and uncertainty. After 880 hours of operation, it was apparent from the loss rate estimates that insufficient MEA was available in the plant to complete the second sampling campaign. From these MEA plant volume and loss rate data, we calculated that approximately 30 L of additional MEA solvent would be required to allow the final measurements to be completed. This addition was carefully considered, and the volume of MEA added included additional MEA to allow for an initial preconditioning period to be undertaken. During this period, the solvent was exposed
Assessing Atmospheric Emissions from Amine-based CO2 Post-Combustion Capture Processes and their Impacts on the Environment – A Case Study
Volume 1: Measurement of emissions from a monoethanolamine-based post-combustion capture pilot plant | 9
to process gas before measuring emission samples. The additional preconditioning period was included to allow the concentration of reactive and volatile compounds to recover to concentrations approaching those measured during the first sampling campaign, and thus to minimise dilution artefacts.
Following this initial dilution of the aged MEA solvent, it became necessary to remove the solvent from the plant for approximately one month. During this period the MEA solvent was stored in an airtight container and excluded from light.
Following the return of the aged MEA to LYPP, it was planned to undertake a period of solvent reconditioning to account for losses of reactive and/or volatile compounds arising from storage and dilution. However, after returning the MEA solvent to LYPP and completing an initial day of PCC operation, we identified that insufficient MEA was available to complete the second sampling campaign. At the operating time of 940 hours, a further 90 L of Tarong MEA 600+ solvent was therefore added to the plant to enable the second sampling campaign to be undertaken. We expected that this additional dilution would further modify the MEA solvent matrix from that measured during the first campaign. In addition, during the initial day of plant operation following the return of the aged solvent to the plant, a large MEA loss rate was again observed. This loss rate, combined with the time constraints of completing the sampling measurements, meant it was not possible to undertake both solvent preconditioning and the sampling measurements. Hence, sampling began after one day of solvent reconditioning. Following the second MEA addition, and after one day of sampling, a line failure in LYPP resulted in MEA loss from the plant. A fraction of the solvent leakage (approximately 35 L) was recovered from the steam tank circuit and returned to the plant storage tank. This recovery occurred after 1040 hours operation time. Following this incident, MEA leakage was identified within the reboiler lines of the plant. Replacement of these lines significantly reduced MEA losses, and we suspect that the increased loss rate observed during this study was a result of line leakage. Due to the history of the aged solvent, which includes significant dilution, we expect that the analytical results from the second sampling campaign will substantially differ from those of the first campaign.
The volume of MEA in the plant is derived from the manual acid–base titration method for determining the MEA concentration in the solvent and the solvent feed tank level. The MEA loss rate for the duration of the study was 0.06 L/hr. The MEA mass balance is estimated by the following equation:
lossMEA
initial MEA
planttheinMEA
However, due to the identification of a leak in the MEA fluid lines near the end of the sampling campaign, the loss rate from the plant is a combination of the loss rate arising from fluid leakage and the loss rate arising from PCC emissions. Thus, the loss rate is estimated by:
leakageMEA
emissions MEA
lossMEA
The loss rate from plant leakage is unknown, as is also the time at which the MEA line leakage commenced. Thus, this leakage will need to be calculated on the basis of the difference between the loss rate as determined from the rate of loss of MEA from plant storage tank and the measured emissions from the plant.

Assessing Atmospheric Emissions from Amine-based CO2 Post-Combustion Capture Processes and their Impacts on the Environment – A Case Study
10 | Volume 1: Measurement of emissions from a monoethanolamine-based post-combustion capture pilot plant
Excluding plant leakage, MEA loss can occur in the following ways:
• MEA emitted via Absorber 1 (after the water-wash section)
• MEA emitted via stripper upper product after the condenser and knock-out tank
• MEA degraded product via NH3 formation, which is detected after the wash section
• liquid sampling, which was intermittently taken for analysis, i.e. 100–150 mL
• unexpected loss due to gas sampling, leakage through joints and pumps.
The comparison of MEA loss obtained via measurement and calculation is tabulated in Table 3.
Table 3. Monoethanolamine (MEA) loss determination
CALCULATED FROM FEED TANK LEVEL MEASUREMENT CALCULATED FROM GASMET MEASUREMENT
0 to 300 hours 0 to 300 hours
MEA volume in the plant = 64.9 kg Average MEA loss rate = 0.069 kg/h
MEA loss = 86.9 – 64.9 = 22.0 kg
MEA loss rate = 0.075 kg/h
CO2 absorption rate = 19.3 kg/h
MEA loss per CO2 absorbed = 3.9 kg/tCO2
MEA loss = 0.069 x 296 = 20.4 kg
CO2 absorption rate = 19.3 kg/h
MEA loss per CO2 absorbed = 3.6 kg/tCO2
300 to 800 hours 300 to 800 hours
MEA volume in the plant = 55.9 kg
MEA loss = 64.9 – 55.9 = 9.0 kg
MEA loss rate = 0.017 kg/h
CO2 absorption rate = 17.5 kg/h
MEA loss per CO2 absorbed = 1.0 kg/tCO2
Average MEA loss rate = 0.020 kg/h
MEA loss = 0.020 x 510 = 10.3 kg
CO2 absorption rate = 17.5 kg/h
MEA loss per CO2 absorbed = 1.1 kg/tCO2
Figure 3. Monoethanolamine loss distribution for 0–300 and 300–800 hours
Figure 3 shows that MEA loss emitted from Absorber 1 is significantly lower than the loss from other sources, such as samples removed for liquid analysis, formation of degradation products and leakage through joints and connections. During the period of 0–300 hours and 300–800 hours, MEA loss accounted for 0.46 and 0.26 kg/tCO2, respectively.
13%
87%
0-300
Emitted from ABS 1 Others
22%
78%
300-800
1 2Emitted from absorber 1 Others

Assessing Atmospheric Emissions from Amine-based CO2 Post-Combustion Capture Processes and their Impacts on the Environment – A Case Study
Volume 1: Measurement of emissions from a monoethanolamine-based post-combustion capture pilot plant | 11
The plant is considered to be in a stable condition if the temperature profile through the absorber and stripper columns remains relatively constant (fluctuating within the range of 5%), and if CO2 recovery remains at a constant value. Gas and liquid sampling was carried out after the pilot plant was operated at steady-state conditions for at least 1 hour.
The CO2 balance for the LYPP over the period of this study is shown in Figure 4.
Figure 4. CO2 balance, CO2 concentrations (gas phase) and monoethanolamine (MEA) concentration (liquid phase) around the plant
Figure 4 shows variations in CO2 concentration in the incoming process gases before entering Absorber 2.
The CO2 balance varied between ±10%. The plant’s performance is also influenced by the variability in ambient conditions, due to the limited thermal capacity and inertia of the plant.
Throughout all PCC operations, CO2 balance has been used to measure the performance of MEA LYPP operating conditions. Over the period of a sampling measurement (up to three hours for the first sampling campaign), pilot plant operation could achieve a constant CO2 balance. Thus, constant conditions were maintained over sampling measurement. For the infrequent cases in which CO2 balance could not be achieved or the plant became unstable, sampling measurements were terminated and the sampling was repeated. The CO2 mass balance within the plant is calculated on the basis of the CO2 data obtained from gas and liquid analyses, as well as the volumetric flow rate through the plant. The location of gas and liquid sampling locations are shown in Figure 5. Gas phase analyses for this calculation are undertaken at:
the inlet to the absorber at a position just after the blower unit (GA02 in Figure 5)
the exit from the outlet of the plant (GA04 in Figure 5)
the outlet CO2 from the stripper (GA05 in Figure 5).
The mass flow of the process gas through the plant is measured by an orifice plate flow meter located after the blower and before Absorber 1, while the CO2 flow leaving the stripper is monitored by a Coriolis flow meter installed in the CO2 outlet line. The CO2 balance is determined by the CO2 mass difference between
-15%
-10%
-5%
0%
5%
10%
15%
20%
25%
0
10
20
30
40
0 100 200 300 400 500 600 700 800 900 1000 1100
CO
2b
alan
ce
MEA
co
nce
ntr
atio
n (
%)
and
CO
2m
ass
flo
w (
kg/h
)
Operating time (Hour)
CO2 into ABS 2 CO2 exit ABS 1 CO2 exit STR [MEA] in liquid CO2 balance

Assessing Atmospheric Emissions from Amine-based CO2 Post-Combustion Capture Processes and their Impacts on the Environment – A Case Study
12 | Volume 1: Measurement of emissions from a monoethanolamine-based post-combustion capture pilot plant
the CO2 process gas inlet (GA02) and outlet (GA04), which is considered balanced when this difference is equal to the CO2 mass flow exiting the stripper (GA05). The fraction of inlet process gas CO2 recovered from the stripper is called the CO2 recovery.
For the liquid phase analyses, the CO2 concentration of the cold lean solvent flowing to Absorber 1 is measured (LA04). The total CO2 absorbed in the absorber is calculated by the difference between CO2 in the cold lean solvent (LA04) and the cold rich solvent (LA02). The difference in CO2 between the cold rich solvent and the hot lean solvent (LA03) is the CO2 released from the stripper, and is called the CO2 recovery. A CO2 balance, based on liquid phase, is defined to be achieved if the CO2 difference between the cold rich solvent (LA02) and cold lean solvent (LA04) is equal to the difference between the cold rich solvent (LA02) and hot lean solvent (LA03).
Figure 5. Gas and liquid sampling locations in the CSIRO post-combustion capture pilot plant
In this study, the CO2 absorbed and CO2 recovery from gas analysis is used to determine process performance.
The typical CO2 balance from an operating day is shown in Figure 6. The CO2 mass balance was maintained within +/–10% of the required CO2 recovery over this period of operation.
Steam
Condensate
Reboiler (plate type)
Stripper
Absorber 1Absorber 2
Solvent
make-up
Tank
Make-up
Flue gas
Treated flue gas
CO2 product
Make-up NaOH
Spent NaOH recycled
Knock-out drum
Blower
Condensates and
Particulates
Flue Gas
pre-treatment
Wash column
Cold rich solvent
Hot lean solvent
Hot rich solvent
Cold lean solvent
To solvent
make-up tank
Gas sampling
Liquid sampling
GA01
GA02
GA03GA04
GA05
LA01
LA02 LA03
LA04

Assessing Atmospheric Emissions from Amine-based CO2 Post-Combustion Capture Processes and their Impacts on the Environment – A Case Study
Volume 1: Measurement of emissions from a monoethanolamine-based post-combustion capture pilot plant | 13
Figure 6. Typical CO2 balance during the CSIRO post-combustion capture pilot plant operation
Table 4 summarises the most relevant parameters for the experimental campaign. CO2 recovery was maintained within the target boundaries during the campaign. The reboiler duty values are larger than normal, which is possibly a consequence of either operating the stripper at excessive temperature, operating at a greater than normal L/G ratio, or thermodynamic effects of operating with the aged solvent.
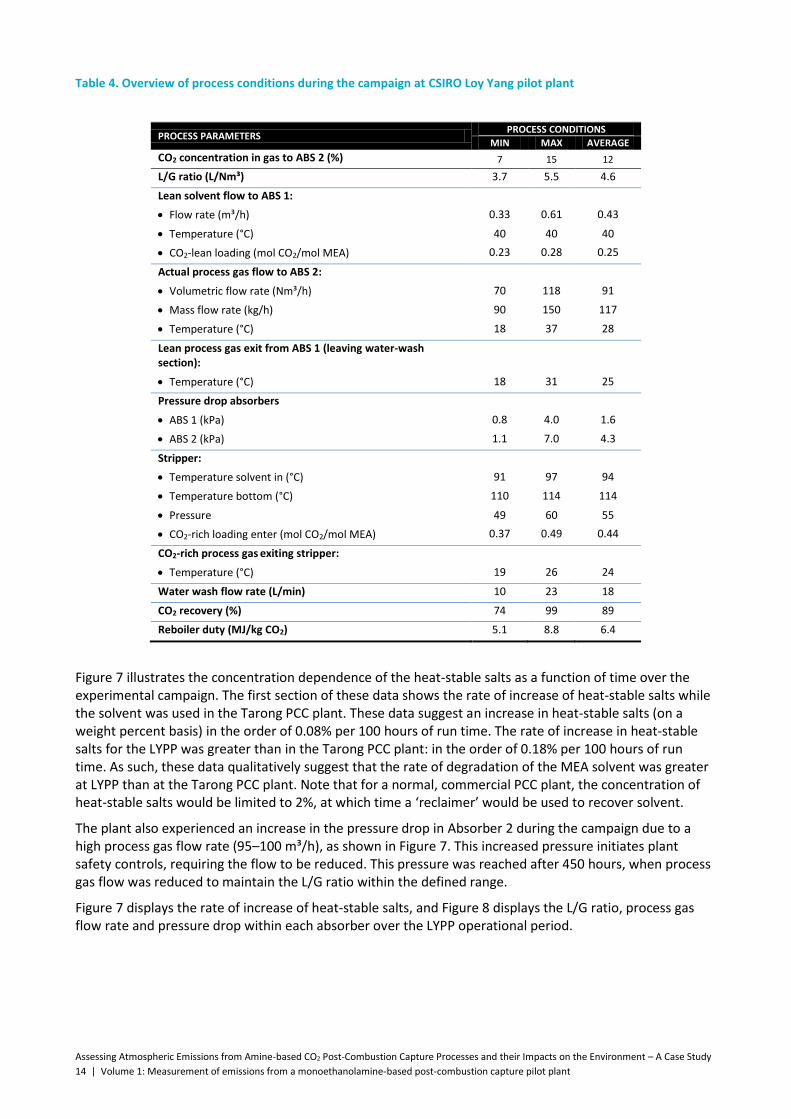
Assessing Atmospheric Emissions from Amine-based CO2 Post-Combustion Capture Processes and their Impacts on the Environment – A Case Study
14 | Volume 1: Measurement of emissions from a monoethanolamine-based post-combustion capture pilot plant
Table 4. Overview of process conditions during the campaign at CSIRO Loy Yang pilot plant
PROCESS PARAMETERS PROCESS CONDITIONS
MIN MAX AVERAGE
CO2 concentration in gas to ABS 2 (%) 7 15 12
L/G ratio (L/Nm³) 3.7 5.5 4.6
Lean solvent flow to ABS 1:
Flow rate (m³/h) 0.33 0.61 0.43
Temperature (°C)
CO2-lean loading (mol CO2/mol MEA)
40
0.23
40
0.28
40
0.25
Actual process gas flow to ABS 2:
Volumetric flow rate (Nm³/h) 70 118 91
Mass flow rate (kg/h) 90 150 117
Temperature (°C) 18 37 28
Lean process gas exit from ABS 1 (leaving water-wash section):
Temperature (°C) 18 31 25
Pressure drop absorbers
ABS 1 (kPa) 0.8 4.0 1.6
ABS 2 (kPa) 1.1 7.0 4.3
Stripper:
Temperature solvent in (°C) 91 97 94
Temperature bottom (°C) 110 114 114
Pressure
CO2-rich loading enter (mol CO2/mol MEA)
49
0.37
60
0.49
55
0.44
CO2-rich process gas exiting stripper:
Temperature (°C) 19 26 24
Water wash flow rate (L/min) 10 23 18
CO2 recovery (%) 74 99 89
Reboiler duty (MJ/kg CO2) 5.1 8.8 6.4
Figure 7 illustrates the concentration dependence of the heat-stable salts as a function of time over the experimental campaign. The first section of these data shows the rate of increase of heat-stable salts while the solvent was used in the Tarong PCC plant. These data suggest an increase in heat-stable salts (on a weight percent basis) in the order of 0.08% per 100 hours of run time. The rate of increase in heat-stable salts for the LYPP was greater than in the Tarong PCC plant: in the order of 0.18% per 100 hours of run time. As such, these data qualitatively suggest that the rate of degradation of the MEA solvent was greater at LYPP than at the Tarong PCC plant. Note that for a normal, commercial PCC plant, the concentration of heat-stable salts would be limited to 2%, at which time a ‘reclaimer’ would be used to recover solvent.
The plant also experienced an increase in the pressure drop in Absorber 2 during the campaign due to a high process gas flow rate (95–100 m³/h), as shown in Figure 7. This increased pressure initiates plant safety controls, requiring the flow to be reduced. This pressure was reached after 450 hours, when process gas flow was reduced to maintain the L/G ratio within the defined range.
Figure 7 displays the rate of increase of heat-stable salts, and Figure 8 displays the L/G ratio, process gas flow rate and pressure drop within each absorber over the LYPP operational period.

Assessing Atmospheric Emissions from Amine-based CO2 Post-Combustion Capture Processes and their Impacts on the Environment – A Case Study
Volume 1: Measurement of emissions from a monoethanolamine-based post-combustion capture pilot plant | 15
Figure 7. Heat-stable salt (HSS) concentration in combined campaigns: Tarong and Loy Yang pilot plant
Figure 8. Pressure drop and flow rates during the experimental campaign at Loy Yang pilot plant
During pilot plant operation, MEA balance closure was achieved with the assumption of a constant plant leakage rate at LYPP. The MEA solvent was aged at LYPP to 1120 hours, of which approximately 600 hours were completed beforehand at the Tarong pilot plant.

Assessing Atmospheric Emissions from Amine-based CO2 Post-Combustion Capture Processes and their Impacts on the Environment – A Case Study
16 | Volume 1: Measurement of emissions from a monoethanolamine-based post-combustion capture pilot plant
3 Sampling Points
3.1 Criteria for representative sampling
The PCC process gas stream possesses a complex multiphase flow structure, in which different phases can display different physical behaviours in PCC fluids. PCC target analytes can also have widely ranging chemical properties with complex chemical formation and reaction pathways. To generate representative emission data, sampling protocols must therefore be carefully considered and evaluated, and the most appropriate methods applied.
The criteria necessary for selecting acceptable sampling locations for emission measurements are defined in numerous internationally accepted methods, such as USEPA Method 1 and 2, AS 4323.1-1995, ASTM D3154-00 (re-approved 2006), BS EN 15259 (2007) and VDI 2099 Part 1. In addition, Halliburton et al. (2010) have reviewed these methods with respect to their application to PCC plant installations, as well as describing the situations where ‘straight flow’ fluid flow and ‘isokinetic extraction’ are (or are not) necessary. At LYPP, it is likely that the aerosol suspended in the outlet fluid stream will be comprised of very small diameter droplets, and thus it is highly likely that isokinetic collection will be unnecessary. However, since the size distribution of the aerosol at LYPP is currently unknown, USEPA standard isokinetic sampling methods have been adopted for this study. This section outlines the methods and guidelines used to assign sampling positions and ports.
3.2 Sampling requirements for the Loy Yang Pilot Plant
Three sampling positions are required to meet the objectives of the project. These sampling locations are in the areas of:
process gas inlet (identified as point ‘A’)
after absorption bed of ABS-COL1 and before water wash (identified as point ‘B’)
process gas return line i.e. after the water wash (identified as point ‘C’)
Figure 9 illustrates the location of the sampling points A, B and C at LYPP.
Figure 9. Identified sample points at the Loy Yang post-combustion capture pilot plant. A, process gas inlet after initial cooling and condensation removal; B, Absorber Column 2 after absorption before the water-wash section; C, process gas return line
USEPA Method 2 defines the criteria needed for selecting and assessing representative stack sampling planes. Of the three selected locations, the process gas inlet was the only location that allowed representative sampling conditions without significant modification to the existing pipework. Sampling points ‘B’ and ‘C’ both required modifications to the process gas piping to provide a well-formed gas flow over the selected sampling plane. The modifications required to create representative sampling conditions are discussed in the following sections.
B A C

Assessing Atmospheric Emissions from Amine-based CO2 Post-Combustion Capture Processes and their Impacts on the Environment – A Case Study
Volume 1: Measurement of emissions from a monoethanolamine-based post-combustion capture pilot plant | 17
3.3 Installation of the sampling plane at the water wash exit
The inclusion of additional sections of piping at the outlet of the water wash made it possible to produce an acceptable sampling plane according to USEPA Method 2. However, due to the limited space at this location, it was necessary to bend the pipe and locate the sampling port as shown in Figure 10 (a) and Figure 10 (b).
(a) (b)
(c)
Figure 10. Sampling port at the outlet of the Loy Yang pilot plant, identified as point ‘C’.
Sampling port
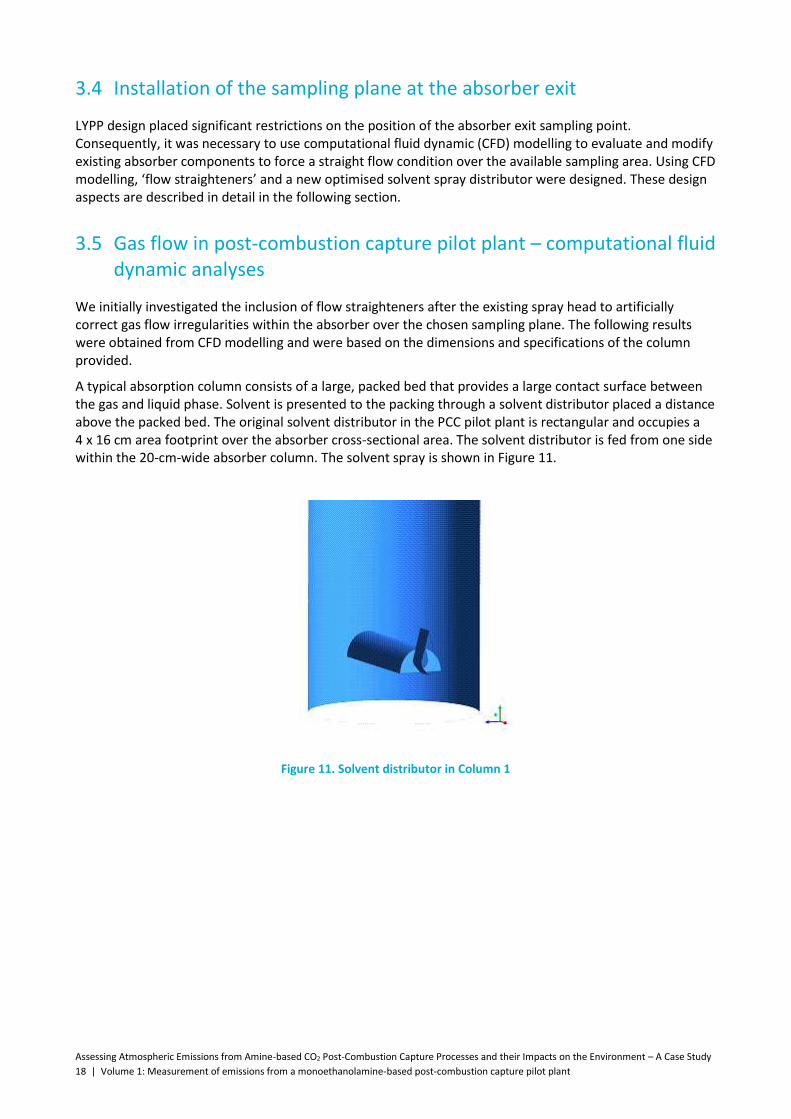
Assessing Atmospheric Emissions from Amine-based CO2 Post-Combustion Capture Processes and their Impacts on the Environment – A Case Study
18 | Volume 1: Measurement of emissions from a monoethanolamine-based post-combustion capture pilot plant
3.4 Installation of the sampling plane at the absorber exit
LYPP design placed significant restrictions on the position of the absorber exit sampling point. Consequently, it was necessary to use computational fluid dynamic (CFD) modelling to evaluate and modify existing absorber components to force a straight flow condition over the available sampling area. Using CFD modelling, ‘flow straighteners’ and a new optimised solvent spray distributor were designed. These design aspects are described in detail in the following section.
3.5 Gas flow in post-combustion capture pilot plant – computational fluid dynamic analyses
We initially investigated the inclusion of flow straighteners after the existing spray head to artificially correct gas flow irregularities within the absorber over the chosen sampling plane. The following results were obtained from CFD modelling and were based on the dimensions and specifications of the column provided.
A typical absorption column consists of a large, packed bed that provides a large contact surface between the gas and liquid phase. Solvent is presented to the packing through a solvent distributor placed a distance above the packed bed. The original solvent distributor in the PCC pilot plant is rectangular and occupies a 4 x 16 cm area footprint over the absorber cross-sectional area. The solvent distributor is fed from one side within the 20-cm-wide absorber column. The solvent spray is shown in Figure 11.
Figure 11. Solvent distributor in Column 1
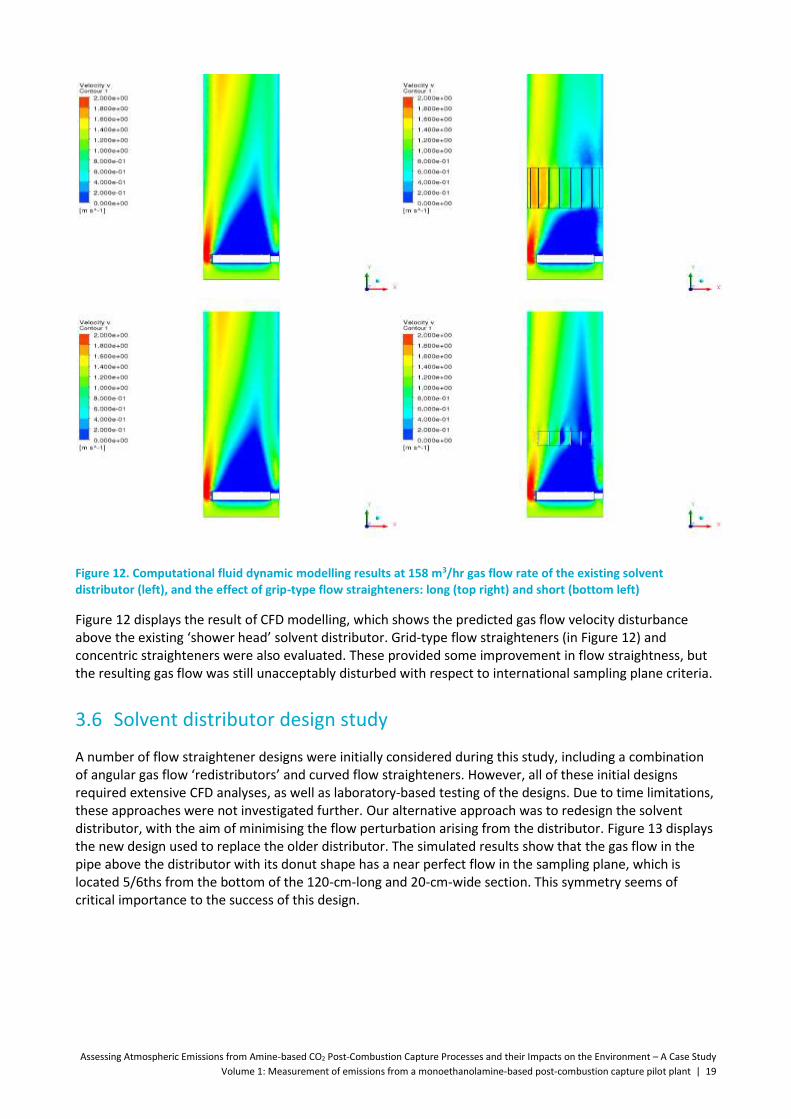
Assessing Atmospheric Emissions from Amine-based CO2 Post-Combustion Capture Processes and their Impacts on the Environment – A Case Study
Volume 1: Measurement of emissions from a monoethanolamine-based post-combustion capture pilot plant | 19
Figure 12. Computational fluid dynamic modelling results at 158 m3/hr gas flow rate of the existing solvent distributor (left), and the effect of grip-type flow straighteners: long (top right) and short (bottom left)
Figure 12 displays the result of CFD modelling, which shows the predicted gas flow velocity disturbance above the existing ‘shower head’ solvent distributor. Grid-type flow straighteners (in Figure 12) and concentric straighteners were also evaluated. These provided some improvement in flow straightness, but the resulting gas flow was still unacceptably disturbed with respect to international sampling plane criteria.
3.6 Solvent distributor design study
A number of flow straightener designs were initially considered during this study, including a combination of angular gas flow ‘redistributors’ and curved flow straighteners. However, all of these initial designs required extensive CFD analyses, as well as laboratory-based testing of the designs. Due to time limitations, these approaches were not investigated further. Our alternative approach was to redesign the solvent distributor, with the aim of minimising the flow perturbation arising from the distributor. Figure 13 displays the new design used to replace the older distributor. The simulated results show that the gas flow in the pipe above the distributor with its donut shape has a near perfect flow in the sampling plane, which is located 5/6ths from the bottom of the 120-cm-long and 20-cm-wide section. This symmetry seems of critical importance to the success of this design.
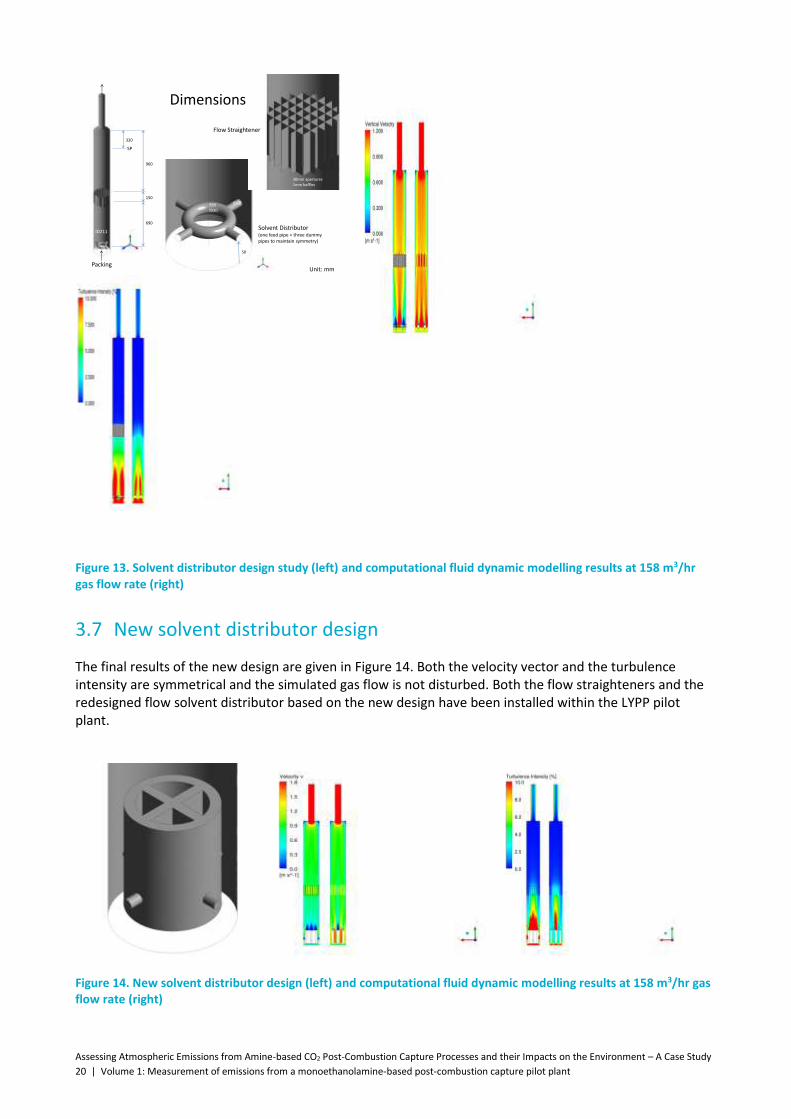
Assessing Atmospheric Emissions from Amine-based CO2 Post-Combustion Capture Processes and their Impacts on the Environment – A Case Study
20 | Volume 1: Measurement of emissions from a monoethanolamine-based post-combustion capture pilot plant
Dimensions
690
150
960
Packing
R50ID30
ID20
50
Unit: mm
Solvent Distributor(one feed pipe + three dummypipes to maintain symmetry)
Flow Straightener
30mm apertures1mm baffles
320
SP
ID211
Figure 13. Solvent distributor design study (left) and computational fluid dynamic modelling results at 158 m3/hr gas flow rate (right)
3.7 New solvent distributor design
The final results of the new design are given in Figure 14. Both the velocity vector and the turbulence intensity are symmetrical and the simulated gas flow is not disturbed. Both the flow straighteners and the redesigned flow solvent distributor based on the new design have been installed within the LYPP pilot plant.
Figure 14. New solvent distributor design (left) and computational fluid dynamic modelling results at 158 m3/hr gas flow rate (right)

Assessing Atmospheric Emissions from Amine-based CO2 Post-Combustion Capture Processes and their Impacts on the Environment – A Case Study
Volume 1: Measurement of emissions from a monoethanolamine-based post-combustion capture pilot plant | 21
Figure 15 displays both the old solvent distributor and the new solvent distributor and flow straighteners installed into the absorption column. Figure 16 displays the demister as it is being installed at the outlet from the pilot plant.
Figure 15. Standard showerhead type distributor (left) and flow straightener and new custom-made distributor (right) after installation
In addition to the inclusion of the improved solvent distributor and flow straighteners, an improved demister was also installed at the outlet from the plant. This new demister eliminated the problem of ‘channelling’ of the aerosol through the demister unit, an artefact likely to occur while using the older demister unit.
Figure 16. Old demister being replaced with a new improved demister
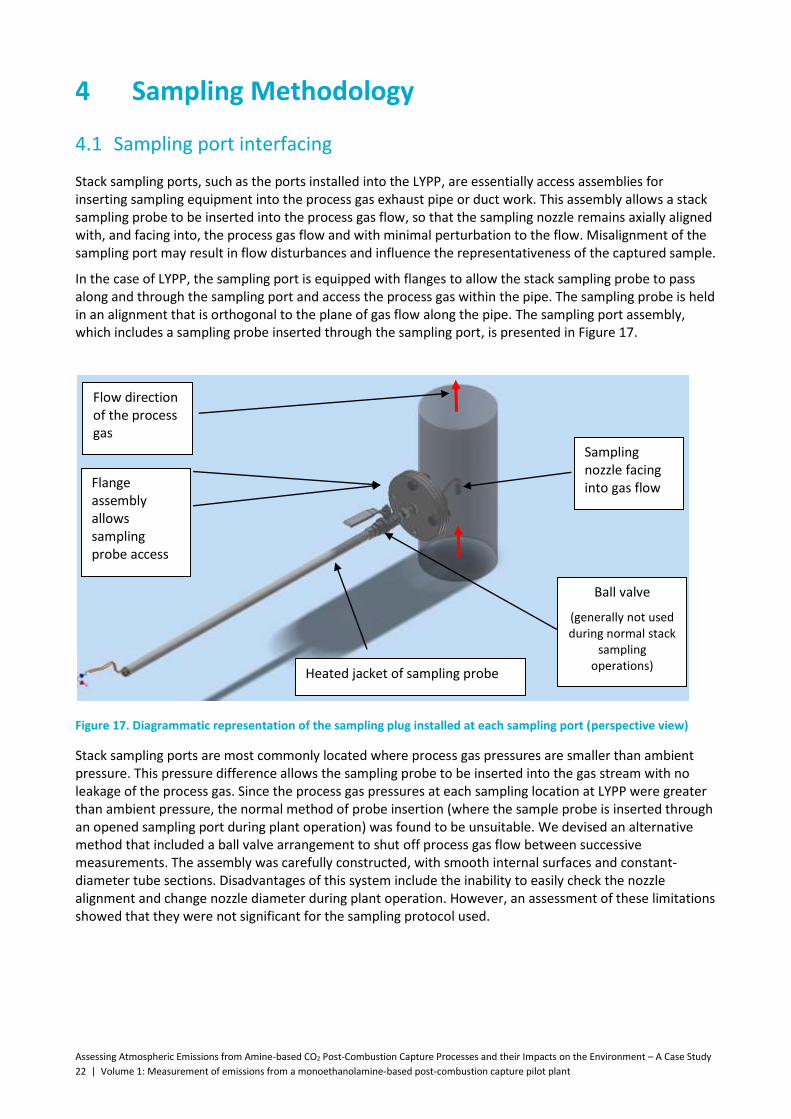
Assessing Atmospheric Emissions from Amine-based CO2 Post-Combustion Capture Processes and their Impacts on the Environment – A Case Study
22 | Volume 1: Measurement of emissions from a monoethanolamine-based post-combustion capture pilot plant
4 Sampling Methodology
4.1 Sampling port interfacing
Stack sampling ports, such as the ports installed into the LYPP, are essentially access assemblies for inserting sampling equipment into the process gas exhaust pipe or duct work. This assembly allows a stack sampling probe to be inserted into the process gas flow, so that the sampling nozzle remains axially aligned with, and facing into, the process gas flow and with minimal perturbation to the flow. Misalignment of the sampling port may result in flow disturbances and influence the representativeness of the captured sample.
In the case of LYPP, the sampling port is equipped with flanges to allow the stack sampling probe to pass along and through the sampling port and access the process gas within the pipe. The sampling probe is held in an alignment that is orthogonal to the plane of gas flow along the pipe. The sampling port assembly, which includes a sampling probe inserted through the sampling port, is presented in Figure 17.
Figure 17. Diagrammatic representation of the sampling plug installed at each sampling port (perspective view)
Stack sampling ports are most commonly located where process gas pressures are smaller than ambient pressure. This pressure difference allows the sampling probe to be inserted into the gas stream with no leakage of the process gas. Since the process gas pressures at each sampling location at LYPP were greater than ambient pressure, the normal method of probe insertion (where the sample probe is inserted through an opened sampling port during plant operation) was found to be unsuitable. We devised an alternative method that included a ball valve arrangement to shut off process gas flow between successive measurements. The assembly was carefully constructed, with smooth internal surfaces and constant-diameter tube sections. Disadvantages of this system include the inability to easily check the nozzle alignment and change nozzle diameter during plant operation. However, an assessment of these limitations showed that they were not significant for the sampling protocol used.
Flow direction of the process gas
Flange assembly allows sampling probe access
Sampling nozzle facing into gas flow
Heated jacket of sampling probe
Ball valve
(generally not used during normal stack
sampling operations)

Assessing Atmospheric Emissions from Amine-based CO2 Post-Combustion Capture Processes and their Impacts on the Environment – A Case Study
Volume 1: Measurement of emissions from a monoethanolamine-based post-combustion capture pilot plant | 23
Figure 18 presents the sampling port assembly installed into a small pipe as plan and elevation views.
Figure 18. Diagrammatic representation of the sampling plug installed at each sampling port (top, plan view and bottom, elevation view)
To minimise flow disturbances over the sampling planes, a close-fitting plug was custom fabricated to fill the void that remains when the sampling port tube is welded into the process gas pipe. This plug maintains smooth gas flow within the process gas pipe over the sampling plane, reducing changes to the gas from the inclusion of the sampling port.
Sampling port plugs were used at each sampling port. In the case of the inlet and outlet ports, these were fabricated with a 50-mm radius curve. The plug after the absorber was fabricated with a 100-mm radius curve.
At the outlet sampling port, it was also necessary to redirect the sampling flow direction to 90 degrees, due to the limited space available. The sampling probe, when inserted into the sampling port at the outlet of the pilot plant, is shown in Figure 19 and Figure 20. The heated section of the curved sampling probe tubing, as well as the bulkhead connections for process gas temperature and pressure measurements, can also be observed in Figure 20.
Direction of gas flow
Sampling nozzle
Process gas pipe work
Sampling port assembly
‘Plug’ installed within the sampling port

Assessing Atmospheric Emissions from Amine-based CO2 Post-Combustion Capture Processes and their Impacts on the Environment – A Case Study
24 | Volume 1: Measurement of emissions from a monoethanolamine-based post-combustion capture pilot plant
Figure 19. Source sampling apparatus installed into the outlet sampling port at Loy Yang pilot plant, showing glass impinger train
Figure 20. Sampling port at the outlet of the Loy Yang pilot plant. The heated probe, the additional curved section of heated sampling probe and ball valve can also be seen
Flow direction of flue gas
Modified section of the sampling probe
Thermocouple manometer ports

Assessing Atmospheric Emissions from Amine-based CO2 Post-Combustion Capture Processes and their Impacts on the Environment – A Case Study
Volume 1: Measurement of emissions from a monoethanolamine-based post-combustion capture pilot plant | 25
The sampling ports at the inlet to the water-wash section had a similar sampling port assembly to that used at the outlet of the absorber, except that curved extension of the sampling probe was not used. The sampling port assembly installed at the inlet to the water-wash section is shown in Figure 21. The heated probe and ball valve can also be seen, in addition to the temperature sensor and pressure manometer. The direction of process gas flow within the absorber is also indicated. At this sampling port, a short straight section of tubing was used to connect the ball valve assembly to the sampling nozzle.
Figure 21. Sampling port located at the inlet to the water-wash section at the Loy Yang pilot plant
Flow direction of flue gas
Thermocouple manometer ports
Apex source sampler unit
Heated sampling probe
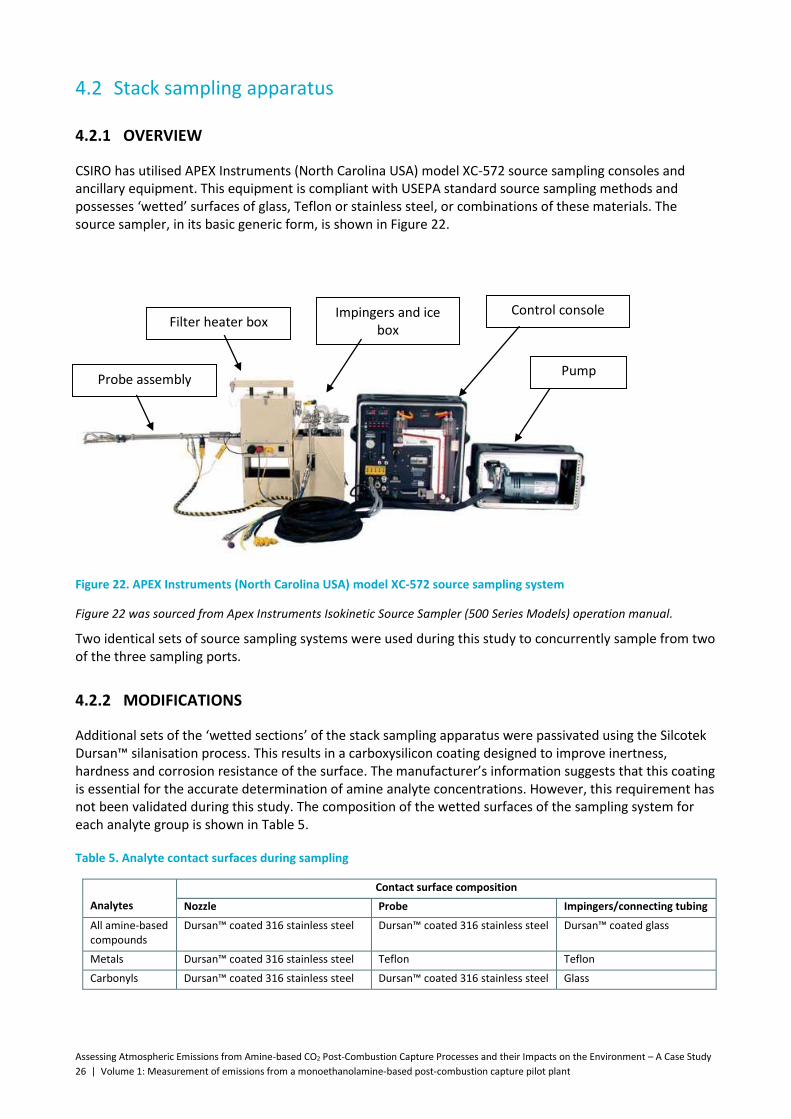
Assessing Atmospheric Emissions from Amine-based CO2 Post-Combustion Capture Processes and their Impacts on the Environment – A Case Study
26 | Volume 1: Measurement of emissions from a monoethanolamine-based post-combustion capture pilot plant
4.2 Stack sampling apparatus
4.2.1 OVERVIEW
CSIRO has utilised APEX Instruments (North Carolina USA) model XC-572 source sampling consoles and ancillary equipment. This equipment is compliant with USEPA standard source sampling methods and possesses ‘wetted’ surfaces of glass, Teflon or stainless steel, or combinations of these materials. The source sampler, in its basic generic form, is shown in Figure 22.
Figure 22. APEX Instruments (North Carolina USA) model XC-572 source sampling system
Figure 22 was sourced from Apex Instruments Isokinetic Source Sampler (500 Series Models) operation manual.
Two identical sets of source sampling systems were used during this study to concurrently sample from two of the three sampling ports.
4.2.2 MODIFICATIONS
Additional sets of the ‘wetted sections’ of the stack sampling apparatus were passivated using the Silcotek Dursan™ silanisation process. This results in a carboxysilicon coating designed to improve inertness, hardness and corrosion resistance of the surface. The manufacturer’s information suggests that this coating is essential for the accurate determination of amine analyte concentrations. However, this requirement has not been validated during this study. The composition of the wetted surfaces of the sampling system for each analyte group is shown in Table 5.
Table 5. Analyte contact surfaces during sampling
Analytes
Contact surface composition
Nozzle Probe Impingers/connecting tubing
All amine-based compounds
Dursan™ coated 316 stainless steel Dursan™ coated 316 stainless steel Dursan™ coated glass
Metals Dursan™ coated 316 stainless steel Teflon Teflon
Carbonyls Dursan™ coated 316 stainless steel Dursan™ coated 316 stainless steel Glass
Probe assembly
Filter heater box Impingers and ice
box
Control console
Pump

Assessing Atmospheric Emissions from Amine-based CO2 Post-Combustion Capture Processes and their Impacts on the Environment – A Case Study
Volume 1: Measurement of emissions from a monoethanolamine-based post-combustion capture pilot plant | 27
USEPA Method 5 ‘Determination of Particulate Matter Emissions from Stationary Sources’ was used as a fundamental basis of procedures for extracting samples from the sampling ports. While this method is mainly directed towards sampling particulate matter, it has generic application to sampling in multiphase flow systems where gas and liquid phases exist. During this study, liquid and gas phases were trapped using an impinger train, with each impinger vessel charged with the appropriate volume of trapping solution to collect and stabilise the analyte. The volume of trapping solution used is a compromise between maintaining a sufficient volume of solution in the impinger to efficiently trap the analyte, and the dilution effect of the analyte due to the additional liquid. During initial sampling measurements, the simplest impinger train arrangement was used, and this is shown generically in Figure 23.
Figure 23. Diagram of the impinger assembly and heated probe used during Loy Yang pilot plant sampling measurements
Figure 23 displays a four-impinger sampling train. Up to eight impingers were used during sampling for this LYPP study, depending upon the target analyte and aims of the experimental task. The first impingers of the impinger train were charged with solutions to collect and stabilise the target analyte. The final two impingers consisted of one uncharged impinger, followed by a separate impinger charged with dry silica gel desiccant. The dry impinger was used to assess and intercept liquid carryover from the charged impingers while the fifth impinger was used for moisture determinations. Figure 23 also displays the filter assembly that is located within the ‘heated filter box’. During the limited number of gravimetric particle measurements, a Teflon™-bound GFA glass microfibre filter was installed as shown in Figure 23 (Pallflex™ EMFAB TX40). During gravimetric measurements, which were undertaken separately to the target analyte measurements, impinger samples were not collected. During impinger collections the filter assembly was not installed but replaced with either a glass or Teflon™ tube that linked the probe outlet to the impinger assembly. This tube is shown inserted into the sampling train in Figure 23. For the Teflon™ surface case, the Teflon™ tubing extended up to the connection between the heated probe and the ball valve shown in Figure 17.
For all impinger measurements, the impingers were maintained at ~0 °C during sampling and up to the time of transfer into the sample bottles. In addition, the sample bottles were refrigerated during storage and transportation. However, during initial measurements, sample condensate was observed to carry over from the first to the second impinger. To address this problem, an additional, remotely chilled glass condenser was placed upstream (but connecting directly to the top) of the first impinger. This assembly rapidly cooled the sample to ~0 °C just before the sample reached the stabilising solution of the first impinger. After the inclusion of this condenser, no further condensate carryover was observed. A diagram of the impinger assembly with the inserted condenser is shown in Figure 24.
Filter assembly

Assessing Atmospheric Emissions from Amine-based CO2 Post-Combustion Capture Processes and their Impacts on the Environment – A Case Study
28 | Volume 1: Measurement of emissions from a monoethanolamine-based post-combustion capture pilot plant
.
Figure 24. Diagram of the impinger assembly with inserted condenser and heated probe used during Loy Yang pilot plant sampling measurements
4.2.3 STACK SAMPLING PROCEDURES AND MODIFICATIONS
Table 6 lists the standard methods that have been used during sampling campaigns at LYPP.
Table 6. Sampling methods followed during measurements at Loy Yang pilot plant
USEPA Method 4 Determination of Moisture Content in Stack Gases Moisture
USEPA Method 5 Determination of Particulate Matter Emissions from Stationary Sources
All target compounds (adapted according to target analyte)
USEPA SW846 M0011
Sampling for Selected Aldehyde and Ketone Emissions from Stationary Sources
Aldehyde and ketones
Each of these sampling methods is highly prescriptive, with a comprehensive and detailed explanation of the procedures involved. The reader is directed to the USEPA Emissions Measurement Centre (http://www.epa.gov/ttn/emc); this report will only discuss deviations from these methods.
4.2.3.1 SELECTION OF USEPA SW846 M0011
USEPA SW846 M0011 is a standard stack sampling method, specifically developed for formaldehyde and acetaldehyde. These two carbonyl analytes were selected on the basis of current published research, which shows that these compounds are products of MEA degradation processes and are likely to be present in an aged solvent (Voice et al., 2012). In addition, each of these compounds present human toxicity and environmental risks in their own right. Acetone was additionally included at the request of project reviewers during the initial project development phase. With the inclusion of acetone, CSIRO correspondingly considered it prudent to monitor for acrolein, since acetone can co-elute with acrolein if the chromatography is not effectively optimised. While acetone and acrolein are not specified analytes of USEPA SW846 M0011, one of the commercial analytical laboratories (SGS Leeder Consulting Pty Ltd) had quantitatively extended USEPA SW846 M0011 to include these analytes.
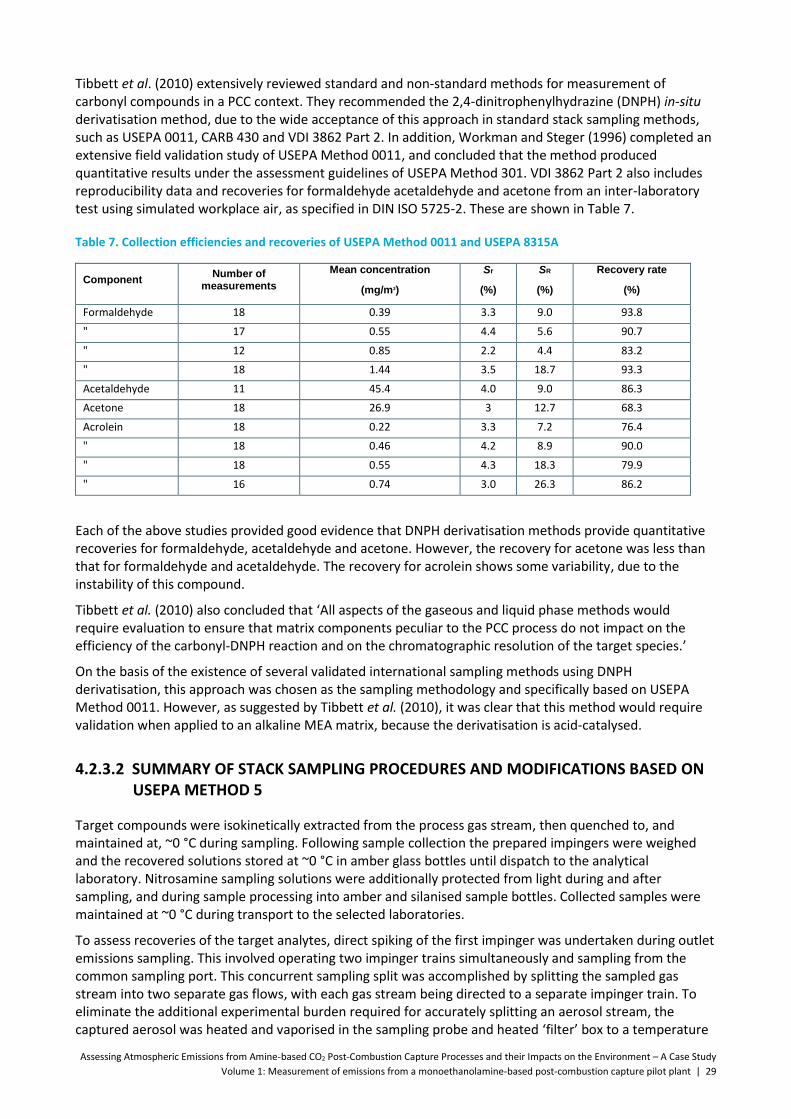
Assessing Atmospheric Emissions from Amine-based CO2 Post-Combustion Capture Processes and their Impacts on the Environment – A Case Study
Volume 1: Measurement of emissions from a monoethanolamine-based post-combustion capture pilot plant | 29
Tibbett et al. (2010) extensively reviewed standard and non-standard methods for measurement of carbonyl compounds in a PCC context. They recommended the 2,4-dinitrophenylhydrazine (DNPH) in-situ derivatisation method, due to the wide acceptance of this approach in standard stack sampling methods, such as USEPA 0011, CARB 430 and VDI 3862 Part 2. In addition, Workman and Steger (1996) completed an extensive field validation study of USEPA Method 0011, and concluded that the method produced quantitative results under the assessment guidelines of USEPA Method 301. VDI 3862 Part 2 also includes reproducibility data and recoveries for formaldehyde acetaldehyde and acetone from an inter-laboratory test using simulated workplace air, as specified in DIN ISO 5725-2. These are shown in Table 7.
Table 7. Collection efficiencies and recoveries of USEPA Method 0011 and USEPA 8315A
Component Number of
measurements
Mean concentration
(mg/m3)
Sr
(%)
SR
(%)
Recovery rate
(%)
Formaldehyde 18 0.39 3.3 9.0 93.8
" 17 0.55 4.4 5.6 90.7
" 12 0.85 2.2 4.4 83.2
" 18 1.44 3.5 18.7 93.3
Acetaldehyde 11 45.4 4.0 9.0 86.3
Acetone 18 26.9 3 12.7 68.3
Acrolein 18 0.22 3.3 7.2 76.4
" 18 0.46 4.2 8.9 90.0
" 18 0.55 4.3 18.3 79.9
" 16 0.74 3.0 26.3 86.2
Each of the above studies provided good evidence that DNPH derivatisation methods provide quantitative recoveries for formaldehyde, acetaldehyde and acetone. However, the recovery for acetone was less than that for formaldehyde and acetaldehyde. The recovery for acrolein shows some variability, due to the instability of this compound.
Tibbett et al. (2010) also concluded that ‘All aspects of the gaseous and liquid phase methods would require evaluation to ensure that matrix components peculiar to the PCC process do not impact on the efficiency of the carbonyl-DNPH reaction and on the chromatographic resolution of the target species.’
On the basis of the existence of several validated international sampling methods using DNPH derivatisation, this approach was chosen as the sampling methodology and specifically based on USEPA Method 0011. However, as suggested by Tibbett et al. (2010), it was clear that this method would require validation when applied to an alkaline MEA matrix, because the derivatisation is acid-catalysed.
4.2.3.2 SUMMARY OF STACK SAMPLING PROCEDURES AND MODIFICATIONS BASED ON USEPA METHOD 5
Target compounds were isokinetically extracted from the process gas stream, then quenched to, and maintained at, ~0 °C during sampling. Following sample collection the prepared impingers were weighed and the recovered solutions stored at ~0 °C in amber glass bottles until dispatch to the analytical laboratory. Nitrosamine sampling solutions were additionally protected from light during and after sampling, and during sample processing into amber and silanised sample bottles. Collected samples were maintained at ~0 °C during transport to the selected laboratories.
To assess recoveries of the target analytes, direct spiking of the first impinger was undertaken during outlet emissions sampling. This involved operating two impinger trains simultaneously and sampling from the common sampling port. This concurrent sampling split was accomplished by splitting the sampled gas stream into two separate gas flows, with each gas stream being directed to a separate impinger train. To eliminate the additional experimental burden required for accurately splitting an aerosol stream, the captured aerosol was heated and vaporised in the sampling probe and heated ‘filter’ box to a temperature

Assessing Atmospheric Emissions from Amine-based CO2 Post-Combustion Capture Processes and their Impacts on the Environment – A Case Study
30 | Volume 1: Measurement of emissions from a monoethanolamine-based post-combustion capture pilot plant
approximately ~10 °C above the dew point of the sample stream. Samples were heated during all sampling measurements to eliminate condensation and aerosol deposition before the sample reached the impinger train. During the “spiked” runs, the first impinger of one of the two parallel and identical sampling trains was injected with a known aliquot of target analyte. This was then followed by sampling in the normal manner. While this is not a true representation of the gas collection method, it was a functional method that did not require modification of the stack sampling apparatus. Further work will be undertaken to more accurately assess sample recovery, using a system whereby the analyte is added to the sampled gas stream in a gaseous form.
Due to the large number of samples required to complete this work, the intensive rate at which successive measurements were undertaken, as well as the distance between the pilot plant and CSIRO laboratories, it was not possible to return sampling glassware to CSIRO laboratories for intensive cleaning. Therefore, it was necessary to clean and re-prepare impinger apparatus between successive sampling measurements. The ‘industrial’ nature of the environments of both the coal-fired power station and pilot plant posed significant challenges with respect to sample contamination. To assess the efficiency of the cleaning and preparation routines, ‘blank’ samples were regularly taken, and rinse solutions from impinger surfaces were analysed.
USEPA Method 5 identifies acetone as a rinsing agent for glassware. Since acetone was included as a reviewer’s request as one of the compounds of interest, this compound was not used as cleaning solvent. Acetone was substituted with 2-propanol as the final cleaning solvent. As trace-level analysis was necessary in this work, a strict water and detergent washing and rinsing protocol was followed before multiple propanol rinsing. The apparatus was hot-air dried and oven-baked overnight at 120 °C.
Isokinetic sampling requires accurate measurements of the flow rate of the process gas. USEPA Method 5 generally uses a Pitot tube and manometer system to measure the gas flow rate, and subsequently set the gas sampling rate of the stack sampler to maintain isokinetic conditions at the sampling nozzle inlet. Due to the reduced flow rates at the pilot plant, and especially within the absorber (~1 m/s), the use of Pitot tubes and manometers that are normally used for stack sampling proved difficult. An alternative method was therefore developed to determine the flow at each of the sampling points. This used the orifice plate flow meter, which is installed into the pilot plant after the blower and is used to control and maintain constant volumetric flow in the plant. The orifice plate flow meter is a precision meter that has been calibrated by the manufacturer. During sampling, the flow data from the orifice plate flow meter, together with temperature, pressure and gas compositional data at the orifice flow meter and as close as possible to each sampling point, were combined to determine process gas velocities at each sampling point. Ambient barometric pressure was monitored by a barometric standard (Paroscientifc Model 765-16B High Accuracy Portable Barometric Standard).
4.2.4 INSTRUMENT CALIBRATION
Reference stack sampling instrumentation, such as the reference barometer, manometers, reference dry gas meter and temperature meters, were calibrated on an annual basis. The stack sampling system was validated to these reference instruments on a six-monthly basis. In addition, Apex instruments critical orifice flow reference devices were used on a fortnightly basis to monitor stack sampler flow meters. Stack samplers were recalibrated if flow deviations were identified with the routine orifice flow measurements.
4.2.5 STABILISATION OF TARGET ANALYTES
Stabilisation of target compounds in the PCC process solution poses significant challenges from a source sampling perspective, since most of the targets are reactive in this matrix. While certain measures can be implemented for a particular compound, in the PCC case this would have had adverse affects on other target, or non-targeted, species. Hence, it was necessary to sample for each class of compound individually, to ensure each was efficiently captured and stabilised. Artefactual formation of the target analyte from co-components in the sample was also considered (e.g. in the case of in-situ nitrosamine formation).

Assessing Atmospheric Emissions from Amine-based CO2 Post-Combustion Capture Processes and their Impacts on the Environment – A Case Study
Volume 1: Measurement of emissions from a monoethanolamine-based post-combustion capture pilot plant | 31
Table 8. Treatments used to stabilise compounds within the impinger train
Target Analytes Impinger treatment Comments
Nitrosodiethanolamine
Nitrosomorpholine
0.1M sulfamic acid + 0.1M sulphuric acid and acidified to pH 2a
Light excluded from impingers. Impingers wrapped in aluminium foil and black cloth. Stored in amber glass sample bottles
Ammonia
Methylamine
Ethylamine
Dimethylamine
Diethylamine
Sulphuric acid + Milli Q Water acidified to ~pH 5
Sulphuric acid treatment to reduce vapour pressure of the target analytes
Formaldehyde
Acetaldehyde
2,4-dinitrophenylhydrazine (2,4-DNPH) solution
Derivatisation of analytes according to USEPA Method 0011
Monoethanolamine, diethylamine, formate, sulphate
Milli-Q water
Metals Milli-Q water Samples collected in Teflon-based impingers
a Dai et al. (2012)
The use of normal stack sampling apparatus and using individual sampling for analytes proved to be an arduous task, requiring samples of different analyte groups to be taken at different times. Ideally, all analytes should be sampled concurrently, and this methodology will be used during further PCC sampling operations.
4.3 Validation of sampling methods
4.3.1 BACKGROUND, STABILITY AND IMPINGER SAMPLING EFFICIENCY
Due to the industrial nature of the impinger handling area and sampling location, the control and assessment of sample contamination was continuously undertaken. Throughout each sampling campaign samples were collected and analysed to determine background and concentrations for each class of analyte. To maintain blank sample representativeness, these ‘background’ samples were prepared in exactly the same manner as the impingers used for collecting target analytes. The results of the analyses are summarised in Table 9.
The stability of the target compounds under transport and storage was also assessed. A known quantity of the target analyte was injected or ‘spiked’ directly into an impinger that had been prepared in the normal manner for the particular target analyte. This impinger was not exposed to the PCC process, but was processed, stored and analysed in the same manner as other impinger samples.
The efficiency of the impinger sampling method for capturing target analytes was assessed by determining the recovery from a quantified inoculation of analyte to Impinger 1, as well as the level of carryover to Impinger 2 (as outlined in Section 4.2.3.2). This was achieved by quantitatively inoculating the first impinger of a separate, but concurrently sampling, impinger train. These assessments were undertaken for ammonia, MEA, diethanolamine (DELA), N-Nitrosodiethanolamine (NDELA), N-Nitrosomorpholine (NMor) and the alkylamines. Validation of the sampling method for formaldehyde and acetaldehyde is discussed as a special case in the sections that follow. The results of these assessments are presented in Table 9.
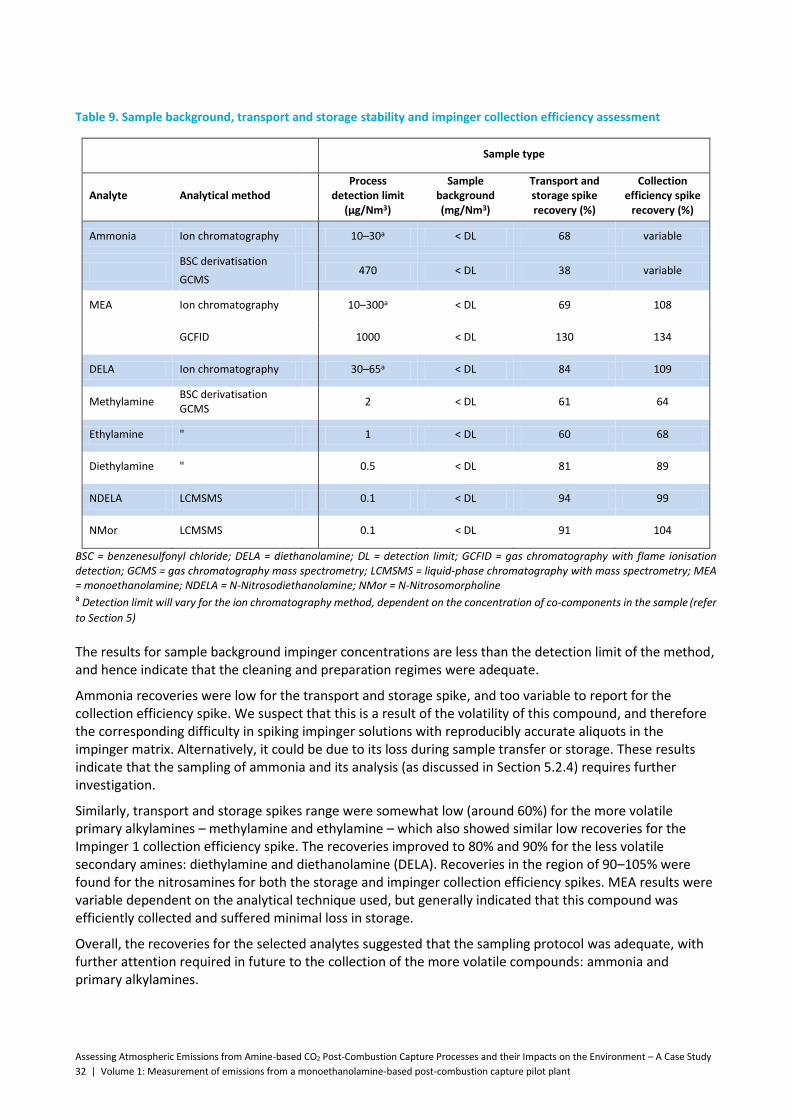
Assessing Atmospheric Emissions from Amine-based CO2 Post-Combustion Capture Processes and their Impacts on the Environment – A Case Study
32 | Volume 1: Measurement of emissions from a monoethanolamine-based post-combustion capture pilot plant
Table 9. Sample background, transport and storage stability and impinger collection efficiency assessment
Sample type
Analyte Analytical method Process
detection limit (µg/Nm3)
Sample background (mg/Nm3)
Transport and storage spike recovery (%)
Collection efficiency spike
recovery (%)
Ammonia Ion chromatography 10–30a < DL 68 variable
BSC derivatisation
GCMS 470 < DL 38 variable
MEA Ion chromatography 10–300a < DL 69 108
GCFID 1000 < DL 130 134
DELA Ion chromatography 30–65a < DL 84 109
Methylamine BSC derivatisation GCMS
2 < DL 61 64
Ethylamine " 1 < DL 60 68
Diethylamine " 0.5 < DL 81 89
NDELA LCMSMS 0.1 < DL 94 99
NMor LCMSMS 0.1 < DL 91 104
BSC = benzenesulfonyl chloride; DELA = diethanolamine; DL = detection limit; GCFID = gas chromatography with flame ionisation detection; GCMS = gas chromatography mass spectrometry; LCMSMS = liquid-phase chromatography with mass spectrometry; MEA = monoethanolamine; NDELA = N-Nitrosodiethanolamine; NMor = N-Nitrosomorpholine a Detection limit will vary for the ion chromatography method, dependent on the concentration of co-components in the sample (refer
to Section 5)
The results for sample background impinger concentrations are less than the detection limit of the method, and hence indicate that the cleaning and preparation regimes were adequate.
Ammonia recoveries were low for the transport and storage spike, and too variable to report for the collection efficiency spike. We suspect that this is a result of the volatility of this compound, and therefore the corresponding difficulty in spiking impinger solutions with reproducibly accurate aliquots in the impinger matrix. Alternatively, it could be due to its loss during sample transfer or storage. These results indicate that the sampling of ammonia and its analysis (as discussed in Section 5.2.4) requires further investigation.
Similarly, transport and storage spikes range were somewhat low (around 60%) for the more volatile primary alkylamines – methylamine and ethylamine – which also showed similar low recoveries for the Impinger 1 collection efficiency spike. The recoveries improved to 80% and 90% for the less volatile secondary amines: diethylamine and diethanolamine (DELA). Recoveries in the region of 90–105% were found for the nitrosamines for both the storage and impinger collection efficiency spikes. MEA results were variable dependent on the analytical technique used, but generally indicated that this compound was efficiently collected and suffered minimal loss in storage.
Overall, the recoveries for the selected analytes suggested that the sampling protocol was adequate, with further attention required in future to the collection of the more volatile compounds: ammonia and primary alkylamines.

Assessing Atmospheric Emissions from Amine-based CO2 Post-Combustion Capture Processes and their Impacts on the Environment – A Case Study
Volume 1: Measurement of emissions from a monoethanolamine-based post-combustion capture pilot plant | 33
4.3.2 CARBONYL COMPOUNDS – A SPECIAL CASE
Aldehyde target analytes are water soluble and highly reactive. Accordingly, USEPA Method 0011 uses in-situ derivatisation with DNPH to trap and stabilise these compounds. The DNPH derivative also serves to provide a high level of sensitivity for analysis of the derivatised carbonyl, as a chromophoric hydrazone, by high-performance liquid chromatography (HPLC) using ultraviolet (UV) or diode array detection.
As the reaction is acid catalysed, it is important that the solution remain acidic during the sampling. This requirement can present certain challenges under MEA-based sampling situations, due to the buffering of the MEA in addition to the large concentration of ammonia in the PCC process gas outlet. For all sampling campaigns, DNPH solutions were prepared using an additional concentration of acid, and the acidity was confirmed at the conclusion of each measurement. The additional concentration of acid was found to be sufficient to sustain the acidity of the solution over the sampling periods used.
Certain irregularities were observed in the results from DNPH impinger collection of carbonyls compounds in the process gas streams, which could not be explained by normal validation testing of sampling and analytical procedures. The observed effects therefore appeared to be due to the nature of the process gas and its constituents, and prompted a thorough investigation into this methodology as applied to the PCC process. The results of that investigation follow.
4.3.2.1 SUMMARY OF FINDINGS FROM THE FIRST SAMPLING CAMPAIGN
Emission measurements completed during the first sampling campaign focused on assessing the influence of the MEA matrix upon the selected sampling and analytical method. Carbonyl analyses from the first sampling campaign were completed according to USEPA Method 0011 protocols using impinger-loaded DNPH liquid collection and USEPA Method 8315 for HPLC analysis. During the first sampling campaign, two commercial analytical laboratories were engaged to supply derivatisation solutions and to undertake analyses: EML Pty Ltd and SGS Leeder Consulting Pty Ltd. Each laboratory uses similar analytical methods, and thus also allowed inter-laboratory comparison of the analytical procedures. However, while EML Pty Ltd reported a slightly improved reporting limit compared to SGS Leeder Consulting Pty Ltd, EML Pty Ltd was unable to complete acetone analyses. Thus, it was necessary to engage SGS Leeder Consulting to undertake carbonyl analyses during the second campaign.
Analyses of carbonyl results from the first sampling campaign identified a number of unexpected findings with respect to carbonyl sampling efficiency and the concentration of carbonyl compounds measured at various stages through the pilot plant process. The first finding suggested that while formaldehyde was apparently efficiently captured, other target analytes were captured less efficiently. These results are shown in Table 10. In this table, the impingers for each measurement are assembled in numerical order, with Impinger 1 being the first impinger in the sampling train and the first impinger exposed to the process gas.
The data shown in Table 10 indicate that the concentration of formaldehyde in the solvent was less than the reporting limit of the analytical method. This was an unexpected finding, since both of these compounds were found at detectable and reproducible concentrations in the water wash liquid as well as in the samples taken before and after the water-wash section. Similar trends were observed for analyses completed by the second analytical laboratory, EML Pty Ltd. Samples provided to each laboratory were taken separately and independently and on different days using DNPH solutions provided by the respective laboratory. Given that two separate measurements reported identical data trends, we expect that these analytical data were robust. While Table 10 shows that formaldehyde is nearly completely isolated in the first impinger, this is not the case for acetaldehyde, of which a large fraction apparently penetrated all impinger vessels. Table 10 also reports a greater acetaldehyde concentration at the outlet of the water-wash section of the pilot plant than that of the inlet to the water-wash section. This finding was also unexpected, and differs from the comparative data displayed in Table 10 for formaldehyde. To investigate these unexpected results, an assessment of the collection method was initiated and is reported in the following sections.
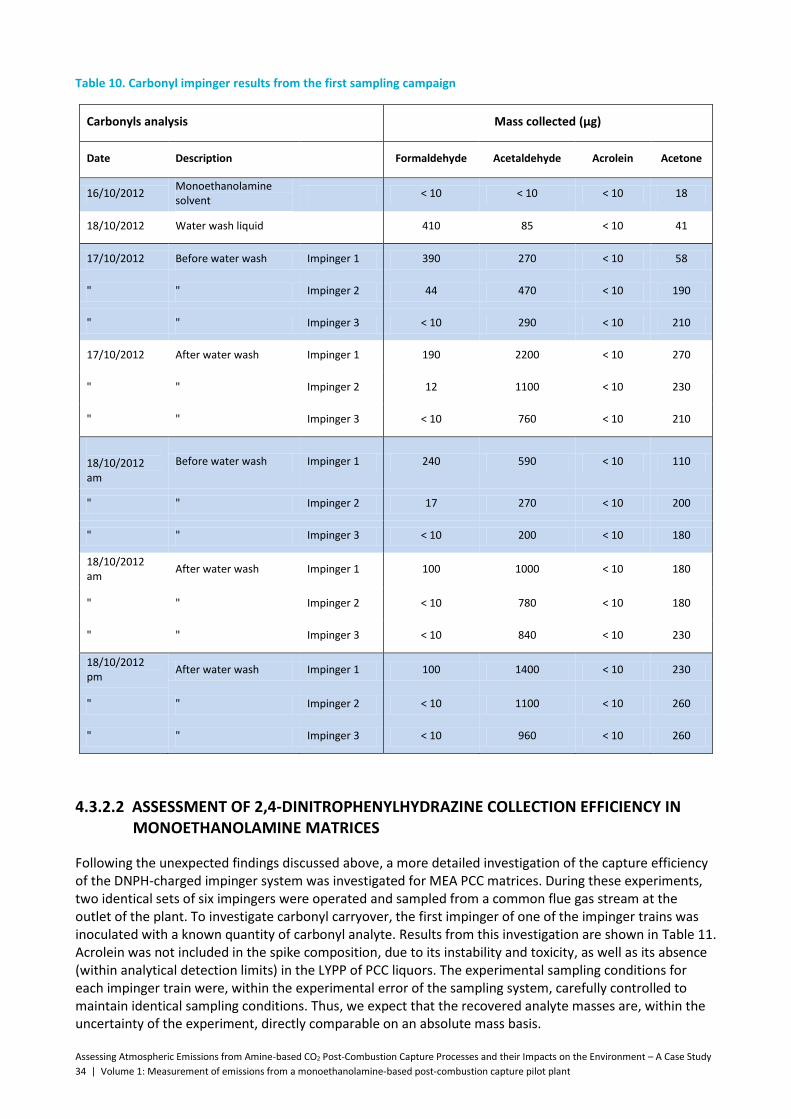
Assessing Atmospheric Emissions from Amine-based CO2 Post-Combustion Capture Processes and their Impacts on the Environment – A Case Study
34 | Volume 1: Measurement of emissions from a monoethanolamine-based post-combustion capture pilot plant
Table 10. Carbonyl impinger results from the first sampling campaign
Carbonyls analysis Mass collected (µg)
Date Description Formaldehyde Acetaldehyde Acrolein Acetone
16/10/2012 Monoethanolamine solvent
< 10 < 10 < 10 18
18/10/2012 Water wash liquid 410 85 < 10 41
17/10/2012 Before water wash Impinger 1 390 270 < 10 58
" " Impinger 2 44 470 < 10 190
" " Impinger 3 < 10 290 < 10 210
17/10/2012 After water wash Impinger 1 190 2200 < 10 270
" " Impinger 2 12 1100 < 10 230
" " Impinger 3 < 10 760 < 10 210
18/10/2012 am
Before water wash Impinger 1 240 590 < 10 110
" " Impinger 2 17 270 < 10 200
" " Impinger 3 < 10 200 < 10 180
18/10/2012 am
After water wash Impinger 1 100 1000 < 10 180
" " Impinger 2 < 10 780 < 10 180
" " Impinger 3 < 10 840 < 10 230
18/10/2012 pm
After water wash Impinger 1 100 1400 < 10 230
" " Impinger 2 < 10 1100 < 10 260
" " Impinger 3 < 10 960 < 10 260
4.3.2.2 ASSESSMENT OF 2,4-DINITROPHENYLHYDRAZINE COLLECTION EFFICIENCY IN MONOETHANOLAMINE MATRICES
Following the unexpected findings discussed above, a more detailed investigation of the capture efficiency of the DNPH-charged impinger system was investigated for MEA PCC matrices. During these experiments, two identical sets of six impingers were operated and sampled from a common flue gas stream at the outlet of the plant. To investigate carbonyl carryover, the first impinger of one of the impinger trains was inoculated with a known quantity of carbonyl analyte. Results from this investigation are shown in Table 11. Acrolein was not included in the spike composition, due to its instability and toxicity, as well as its absence (within analytical detection limits) in the LYPP of PCC liquors. The experimental sampling conditions for each impinger train were, within the experimental error of the sampling system, carefully controlled to maintain identical sampling conditions. Thus, we expect that the recovered analyte masses are, within the uncertainty of the experiment, directly comparable on an absolute mass basis.

Assessing Atmospheric Emissions from Amine-based CO2 Post-Combustion Capture Processes and their Impacts on the Environment – A Case Study
Volume 1: Measurement of emissions from a monoethanolamine-based post-combustion capture pilot plant | 35
Table 11. Dependence of the number of impingers and collection efficiency
Carbonyls analysis Mass collected (µg)
Date Description Formaldehyde Acetaldehyde Acrolein Acetone
Analyte mass in blank samples
< 10 < 10 < 10 27
Analyte mass in prepared spike 500 500 NA 500
24/01/2013 Monoethanolamine (MEA) solvent
< 10 < 10 < 10 13
MEA solvent (repeat) < 10 12 < 10 33
24/01/2013 MEA solvent + spike < 10 13 < 10 440
MEA solvent + spike (repeat)
< 10 94 < 10 430
Spike recovery compared to prepared concentration
(%) 0 8 NA 83
18/10/2012 Water wash liquid 300 47 < 10 20
Water wash liquid + spike
720 510 < 10 570
Spike recovery compared to prepared concentration
(%) 91 107 NA 95
24/01/2013 ‘A’ After water wash Impinger 1 140 2200 < 10 150
" " Impinger 2 22 1500 < 10 270
" " Impinger 3 < 10 1000 < 10 230
" " Impinger 4 < 10 1100 < 10 240
" " Impinger 5 < 10 4700 < 10 280
" " Impinger 6 < 10 1400 < 10 230
24/01/2013 ‘B’ After water wash Impinger 1 + spike
440 9800 < 10 460
" " Impinger 2 28 1600 < 10 350
" " Impinger 3 < 10 560 < 10 290
" " Impinger 4 < 10 350 < 10 350
" " Impinger 5 < 10 330 < 10 310
" " Impinger 6 < 10 380 < 10 290
Spike recovery compared to ‘blank + Spike’
(%) 66 259 NA 112
Table 11 shows results for the DNPH-charged ‘blank’ impinger. This sample exhibits only a small mass of acetone contamination, and provides evidence of the effectiveness of the impinger cleaning and preparation techniques for carbonyl compounds. This small concentration of acetone is considered negligible. The results for the solvent solutions shown in Table 11 display carbonyl masses that are close to or less than the limit of reporting. Comparing the recovered carbonyl masses of the inoculated MEA solvent

Assessing Atmospheric Emissions from Amine-based CO2 Post-Combustion Capture Processes and their Impacts on the Environment – A Case Study
36 | Volume 1: Measurement of emissions from a monoethanolamine-based post-combustion capture pilot plant
with those of the non-inoculated solvent, a number of differences can be observed. First, the formaldehyde results suggest that the 500 µg of formaldehyde added to the MEA solvent is either not present or not available to react with the DNPH solution. Conversely, the corresponding acetone results suggest that within the reporting limits of the analyses, most of the added acetone is available to react with the DNPH. The corresponding acetaldehyde results display recoveries between those for formaldehyde and acetone, and also exhibit more variable spike recoveries. While these are unusual findings, these data suggest that chemical differences between these carbonyl compounds influence the availability of carbonyl functional groups to react with the DNPH. We suspect that these results arise from competing reactions being available in the MEA matrix. These may include pathways such as Schiff base formation or other alternative equilibrium reactions. The presence of such chemical pathways may also provide an explanation for changes in carbonyl analytes within different MEA matrices of the PCC plant. Table 11 includes an acidified water wash sample as well as an inoculated wash water sample. For the wash water samples, within the uncertainty of the analyses, almost all of the added analyte is available to react with the DNPH solution. This observation provides further evidence for the availability of different chemistry pathways to carbonyl compounds in different MEA matrices.
Collected carbonyl mass as a function of impinger position in the sampling train is presented in Figure 25. The mass of analyte collected by each impinger is shown as a column plot, with impingers numerically identified in placement order in the sampling train, commencing with Impinger 1. Indicative trend lines for these data are also displayed.
Figure 25. Mass captured for each impinger relative to impinger placement in the sampling train, spiked sample
Figure 25 also includes an inoculation of analyte to Impinger 1. The formaldehyde data exhibit behaviour that would be considered consistent with ‘normal’ impinger analyte capture for an efficiently operating impinger system. For the formaldehyde data, the first impinger captures the major fraction of analyte, with only a small fraction carrying over to Impinger 2 and negligible mass being detected in Impinger 3. The acetaldehyde data, however, show significantly different behaviour, and the collection mass of the last four impingers tend to level out to a relatively constant mass recovery. This capture behaviour is unusual and suggests the impinger collection efficiency has reached a rate-limiting condition with respect to impinger capture efficiency. The acetone data suggest a similar trend, except for impinger four. There are a number of possible explanations for this behaviour in capture efficiency. One hypothesis is explored in the following text.
Considering that acetaldehyde is not available for DNPH derivatisation in the MEA solvent, but is found at large concentrations at the outlet from the water-wash section (and absorber section), then these data suggest that the parent carbonyl compound exists as intermediate compound in the MEA solvent. In addition, this intermediate must exist in a form not reactive to DNPH. If the stability of this intermediate

Assessing Atmospheric Emissions from Amine-based CO2 Post-Combustion Capture Processes and their Impacts on the Environment – A Case Study
Volume 1: Measurement of emissions from a monoethanolamine-based post-combustion capture pilot plant | 37
compound is also a function of MEA concentration, then the parent carbonyl compound would be released in accordance with the prevailing MEA concentration of the trapping solution of PCC matrix. These behaviours are observed in acetaldehyde and acetone data displayed in Figure 25 and in Table 10.
Figure 26 displays data similar to those displayed in Figure 25, but this time for the non-spiked case.
Figure 26. Mass captured for each impinger relative to impinger placement in the sampling train, non-spiked sample
The formaldehyde ‘B’ results in Figure 26 show a similar trend in the capture efficiency to those for the spiked case, with all analyte captured in the first two impingers and negligible analyte mass carrying over to the third impinger. However, the first impinger for both acetaldehyde ‘B’ and acetone ‘B’ tend to show different behaviour to those displayed in Figure 25, with these data displaying a more constant captured mass by each impinger. This is likely a result of operator error, where impingers ‘B’ experienced reduced cooling efficiency over the duration of the sampling period, since only ice and not the normal ice/water slurry mixture was in contact with the glass surface of the impinger. However, while experimentally in error, these observations show that the rate of cooling within the impingers, and especially in the first impinger, influences the capture efficiency of these analytes. Following these observations, the externally cooled condenser system displayed in Figure 24 was used for all impinger-based sampling operations. In addition, as a result of the unusual recovery results for acetaldehyde and acetone (shown in Figure 25), further investigations of the DNPH collection methodology for MEA PCC conditions were undertaken.
Form
ald
eh
yde
an
d a
ceto
ne
mas
s (μ
g)
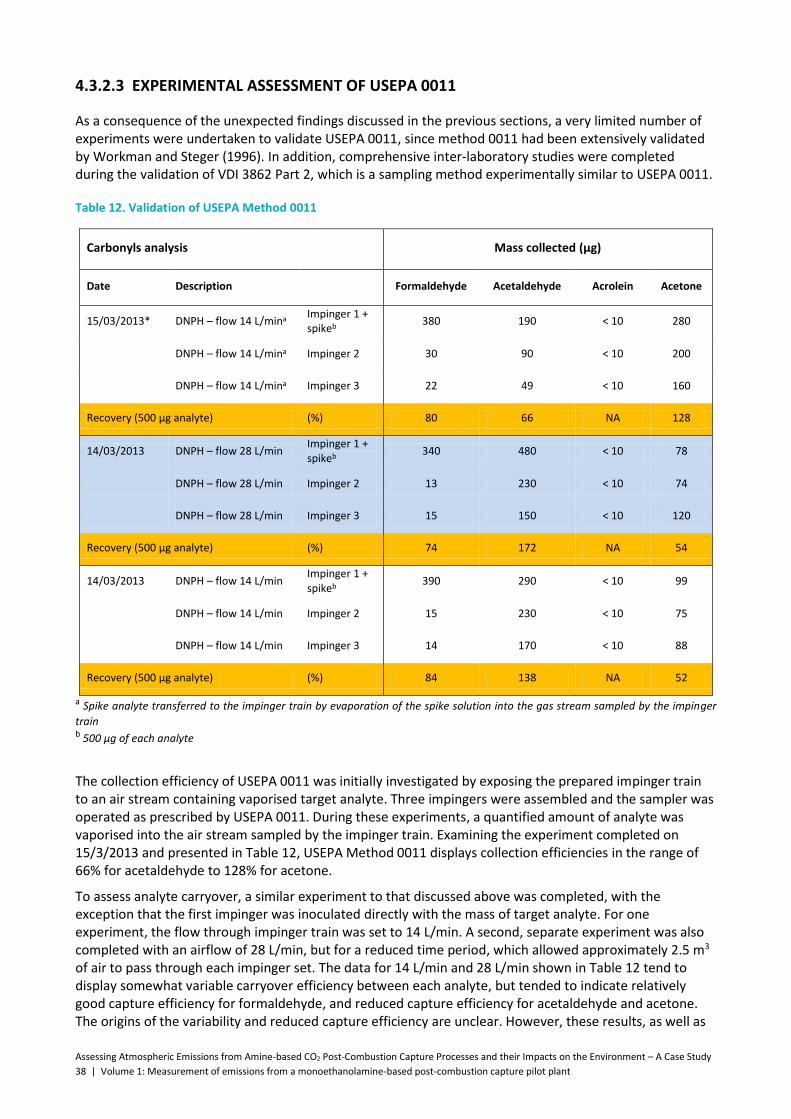
Assessing Atmospheric Emissions from Amine-based CO2 Post-Combustion Capture Processes and their Impacts on the Environment – A Case Study
38 | Volume 1: Measurement of emissions from a monoethanolamine-based post-combustion capture pilot plant
4.3.2.3 EXPERIMENTAL ASSESSMENT OF USEPA 0011
As a consequence of the unexpected findings discussed in the previous sections, a very limited number of experiments were undertaken to validate USEPA 0011, since method 0011 had been extensively validated by Workman and Steger (1996). In addition, comprehensive inter-laboratory studies were completed during the validation of VDI 3862 Part 2, which is a sampling method experimentally similar to USEPA 0011.
Table 12. Validation of USEPA Method 0011
Carbonyls analysis Mass collected (µg)
Date Description Formaldehyde Acetaldehyde Acrolein Acetone
15/03/2013* DNPH – flow 14 L/mina Impinger 1 + spikeb
380 190 < 10 280
DNPH – flow 14 L/mina Impinger 2 30 90 < 10 200
DNPH – flow 14 L/mina Impinger 3 22 49 < 10 160
Recovery (500 μg analyte) (%) 80 66 NA 128
14/03/2013 DNPH – flow 28 L/min Impinger 1 + spikeb
340 480 < 10 78
DNPH – flow 28 L/min Impinger 2 13 230 < 10 74
DNPH – flow 28 L/min Impinger 3 15 150 < 10 120
Recovery (500 μg analyte) (%) 74 172 NA 54
14/03/2013 DNPH – flow 14 L/min Impinger 1 + spikeb
390 290 < 10 99
DNPH – flow 14 L/min Impinger 2 15 230 < 10 75
DNPH – flow 14 L/min Impinger 3 14 170 < 10 88
Recovery (500 μg analyte) (%) 84 138 NA 52
a Spike analyte transferred to the impinger train by evaporation of the spike solution into the gas stream sampled by the impinger
train b 500 μg of each analyte
The collection efficiency of USEPA 0011 was initially investigated by exposing the prepared impinger train to an air stream containing vaporised target analyte. Three impingers were assembled and the sampler was operated as prescribed by USEPA 0011. During these experiments, a quantified amount of analyte was vaporised into the air stream sampled by the impinger train. Examining the experiment completed on 15/3/2013 and presented in Table 12, USEPA Method 0011 displays collection efficiencies in the range of 66% for acetaldehyde to 128% for acetone.
To assess analyte carryover, a similar experiment to that discussed above was completed, with the exception that the first impinger was inoculated directly with the mass of target analyte. For one experiment, the flow through impinger train was set to 14 L/min. A second, separate experiment was also completed with an airflow of 28 L/min, but for a reduced time period, which allowed approximately 2.5 m3 of air to pass through each impinger set. The data for 14 L/min and 28 L/min shown in Table 12 tend to display somewhat variable carryover efficiency between each analyte, but tended to indicate relatively good capture efficiency for formaldehyde, and reduced capture efficiency for acetaldehyde and acetone. The origins of the variability and reduced capture efficiency are unclear. However, these results, as well as
Assessing Atmospheric Emissions from Amine-based CO2 Post-Combustion Capture Processes and their Impacts on the Environment – A Case Study
Volume 1: Measurement of emissions from a monoethanolamine-based post-combustion capture pilot plant | 39
those presented in Section 5.3.2.4, indicate that further refinements will be required to efficiently capture all carbonyl target analytes under MEA PCC conditions.
Grosjean and Fung (1982) investigated the collection efficiencies of DNPH absorption cartridges and DNPH-charged microimpingers for sampling aldehydes in ambient air. Cartridges consisted of 100-mm long x 6-mm internal diameter glass tubes packed with 20-mesh, HF-etched glass beads impregnated with DNPH reagent. They report a collection efficiency for formaldehyde of ~86% for absorption tube sampling of humid air, and >90% for aqueous, acidic, DNPH-charged impingers. For acetaldehyde, significantly smaller recoveries were reported for absorption tubes, while for impingers, ‘recoveries of 60% were typically obtained in both dry and humid air, but individual results showed a large variability not clearly related to acetaldehyde loadings or other experimental parameters’. In broad terms, Grosjean and Fung's data show similarities for the formaldehyde data shown in Table 12. However, this was not the case for the experiments in which the impingers were directly treated with analyte. The origins of these differences are currently unknown and require further investigation.
4.3.2.4 IMPROVED CARBONYL COLLECTION USING IMPINGER-BASED 2,4-DINITROPHENYLHYDRAZINE AND ORGANIC PHASE EXTRACTION
Grosjean and Fung (1982) used a 9:1 mixture of cyclohexane and isooctane to increase the efficiency of DNPH-based acetaldehyde capture. The method involved charging impingers with both acidified aqueous DNPH and the mixture of hydrocarbons. The authors proposed that the inclusion of the organic phase resulted in three additional processes during carbonyl collection. First, the inclusion of the organic layer reduced the liquid surface tension and thus improved air and liquid mixing. Second, the presence of the organic phase provided an alternative solvent for carbonyl dissolution. Third, the bubbling action of the DNPH with the organic phase facilitated the in-situ solvent extraction of carbonyl analytes dissolved in the organic phase into the aqueous acidified DNPH. Grosjean and Fung (1982) reported good impinger recoveries for formaldehyde (96%) and acetaldehyde (98%).
For the case of the MEA carbonyl system, we suspected that the addition of an organic phase would provide additional capture advantages for carbonyl compounds and carbonyl intermediates, such as an imine, Schiff base, oxazolidine, or any other species present. In the case of an oxazolidine intermediate, this compound exhibits reduced molecular polarity and thus would have reduced affinity for polar solvents. However, once dissolved, these compounds would undergo acid-catalysed hydrolysis to form MEA and the parent carbonyl. Thus, during the second sampling campaign, an ‘in-house’ impinger collection method, which was based on USEPA method 0011 but included organic phase extraction, was used for carbonyl capture.
Table 13 presents the results of the validation experiments for the modified USEPA method 0011 sampling method, which includes organic-phase supplementary sample collection. Results for these ‘blank’ data show the small target analyte concentrations in the order of the detection limit.
Data for the transport and storage ‘spike’ measurements are also included in Table 13. These data reveal good recoveries, with greater than 90% recovery for formaldehyde and acetaldehyde, and nearly 90% recovery for acetone. This suggests that the storage and transport regime used in this study is satisfactory.
Table 13 also presents the collection efficiency for the ‘matrix spike’ experiment. These data show good recovery for formaldehyde for the first impinger, but reduced recovery for acetaldehyde and acetone. However, when all impingers are considered, the recoveries of acetaldehyde and acetone increase, with acetaldehyde approaching 100% and acetone exceeding 100%. These data may suggest that a fraction of the spike has migrated from the spike impinger. Alternatively, these data may arise from uncertainty and variability in the measurements of these two analytes.

Assessing Atmospheric Emissions from Amine-based CO2 Post-Combustion Capture Processes and their Impacts on the Environment – A Case Study
40 | Volume 1: Measurement of emissions from a monoethanolamine-based post-combustion capture pilot plant
Table 13. Validation of 2,4-dinitrophenylhydrazine (DNPH)/organic phase sample collection
Carbonyls analysis Mass collected (µg)
Date Description Formaldehyde Acetaldehyde Acrolein Acetone
9/05/2013 Blank < 10 10 < 10 31
9/05/2013 Transport and storage spikea
521 470 < 10 476
Recovery (500 μg analyte) (%) 104 92 NA 89
8/05/2013 DNPH Impinger 1 + spikea
564 1530 < 10 812
DNPH Impinger 2 15 398 < 10 336
DNPH Impinger 3 0 153 < 10 197
0 41 < 10 131
8/05/2013 DNPH Impinger 1 87 1224 < 10 484
DNPH Impinger 2 13 265 < 10 180
13 122 < 10 115
DNPH Impinger 3 < 10 25 < 10 45
Spike recovery of Impinger 1 (%) 96 61 NA 66
Spike recovery of all impingers (%) 93 97 NA 130
Fraction of total analyte captured in fourth impinger non-spike
0 2 NA 9
Fraction of total analyte captured in fourth impinger
0 2 NA 6
Fraction of total analyte captured in fourth impinger (average)
0 2 NA 8
NA = not applicable
a 500μg of each analyte
The results for both the spiked and non-spiked sample indicate that the inclusion of an organic phase into the DNPH sampling train has significantly improved the capture efficiency of the DNPH technique. The fraction of total analyte migrating to, and being captured by, the fourth impinger in these experiments is extremely small – in the order of 2% for acetaldehyde and 8% for acetone. These collection efficiencies are graphically presented in Figure 27, and suggest that this modified method is adequate for sampling the target analytes within the MEA PCC outlet matrices.
This modified USEPA Method 0011 as outlined by Grosjean and Fung (1982) was used for carbonyl analyte collection during the second sampling campaign.

Assessing Atmospheric Emissions from Amine-based CO2 Post-Combustion Capture Processes and their Impacts on the Environment – A Case Study
Volume 1: Measurement of emissions from a monoethanolamine-based post-combustion capture pilot plant | 41
Figure 27. Mass captured for each impinger relative to impinger placement in the sampling train for the modified USEPA Methods 0011 (organic phase), non-spike sample
A limited study was also undertaken to assess the correlation between DNPH impinger-based measurements, DNPH-based absorption tubes, and absorption methods, using 2-hydroxymethylpyridine (HMP)-coated XAD-2 resin absorption tubes analysed using OHSA Methods 52 and 68. XAD resin was selected due to absence of an acidic capture medium. We suspected that this XAD method may reduce acid-catalysed hydrolysis of carbonyl intermediates if these compounds were present in the sample stream. However, SGS Leeder Consulting advised that these latter two methods were not preferred for carbonyl analyses, due to higher backgrounds from HMP-coated XAD-2 tubes and correspondingly higher reporting limits. In addition, carbonyls-HMP derivative reference materials are not commercially available and thus need to be prepared using blank XAD-2 tubes. This aspect may cause inconsistency from batch to batch. The results from these measurements proved variable and difficult to interpret, and suggested that these absorption approaches required further development before they can be applied to the MEA PCC solvent matrix.

Assessing Atmospheric Emissions from Amine-based CO2 Post-Combustion Capture Processes and their Impacts on the Environment – A Case Study
42 | Volume 1: Measurement of emissions from a monoethanolamine-based post-combustion capture pilot plant
4.4 Sampling review and conclusions
A number of aspects of this work provided new insights into attaining representative and accurate quantitative emissions measurements from PCC pilot plants. The installation of sampling planes and ports was carefully considered and completed using internationally accepted selection methods, and a detailed understanding of the flow condition at each position and sampling operations was carefully gained. While manual stack sampling operations were based upon internationally accepted methods, these methods required validation, and in some cases optimisation, for the range of MEA matrix conditions prevailing at LYPP. A significant sampling and analytical emphasis was placed on the assessment of sample collection efficiency and stability in the various collection media. This aspect required significant cooperation and coordination between the analytical laboratories and sampling operators. An iterative approach was used in which the knowledge from analytical method development flowed back to stack sampling operations, so that the analyte samples taken were optimised for each analytical laboratory. This assessment and validation is an important and valuable aspect of this current work.
While our comprehensive validation testing has assessed the various aspects of sample collection, storage and analytical assessment, a measure of the sample extraction efficiency from LYPP has not been experimentally determined. This is a challenging undertaking, both in resourcing and the plant operational time required for statistically relevant measurements. However, it is worthwhile, and would be possible at a pilot-scale plant. This style of measurement, in which the plant is dosed with a known concentration of an analyte or of a surrogate representative of the analyte, would provide a measure of the uncertainty associated with sample extractions and provide additional confidence in the sampling outcomes.
The sampling approach that was used for this study, which involved the sequential collection of samples of each target analyte, placed significant time demands on personnel. We recommend that when sampling operations involve a number of different collection streams and media, these should be undertaken concurrently. While this approach increases the complexity of the sampler system, this will be more than offset by reduced time demands on personnel. In addition, this approach would produce more comparable concentration results.
We have identified a number of limitations of stack sampling methods in this work. This was especially the case for the collection efficiencies for carbonyl compounds. The understanding of carbonyl compounds in PCC environments requires further work to explain the unusual behaviour observed for this class of compounds. Observations from this work suggest that this class of compounds undergoes complex chemistry, which is dependent on the MEA matrix. It is likely that this chemistry influences the effectiveness of collection technique used.
Significant knowledge has been gained from the experimental work undertaken in this study. This has improved our understanding of emissions measurements from PCC operations.

Assessing Atmospheric Emissions from Amine-based CO2 Post-Combustion Capture Processes and their Impacts on the Environment – A Case Study
Volume 1: Measurement of emissions from a monoethanolamine-based post-combustion capture pilot plant | 43
5 Analytical Methodologies
A suite of compounds have been prioritised for analysis from samples collected from selected points in the PCC process stream. The target compounds were selected based on knowledge of likely degradation products from a MEA solvent-based process and those from process slip, which are of possible concern if released as liquid or gaseous emissions to the environment.
The suite of compounds selected for assessment follows. Some of these are grouped based on their chemical characteristics for ease of identification.
Monoethanolamine (MEA)
Diethanolamine (DELA)
Ammonia
Alkylamines Methylamine (MA), Ethylamine (EA), Dimethylamine (DMA), Diethylamine (DEA)
Amides Formamide, Acetamide
Nitrosamines N-Nitrosodimethylamine (NDMA), N-Nitrosodiethylamine (NDEA), N-Nitrosomorpholine (NMor), N-Nitrosodiethanolamine (NDELA)
Carbonyls Formaldehyde, Acetaldehyde, Acrolein, Acetone
Anions Formate, Oxalate, Glycolate, Acetate, Propionate, Sulphate, Nitrate, Chloride, Fluoride
Metals Aluminum, Calcium, Chromium, Copper, Iron, Nickel, Phosphorous, Sulphur, Silicon, Vanadium, Zinc
These groups of compounds exhibit significant differences in their chemical and physical nature, and consequently, in their behaviour in the environment under test and under the analytical procedure employed for their determination. As such, specific collection methodologies were required, which addressed the maintenance of compound integrity and stability under sampling and storage, and also considered the analytical procedure to be employed. In turn, specific analytical methodologies are required that are selective to the target compound(s) and amenable to a complex sample matrix. There is usually a need to manipulate the sample to prepare it for instrumental analysis, either in the form of simple dilution or filtration, or more complex transformations, isolations and clean-up procedures.
PCC process sample matrices hold various bulk and trace-level components originating from the process itself, along with agents used to quench and stabilise the analytes. These components will be both inorganic and organic in nature, and their relative concentrations will vary significantly in samples from the various points in the process stream. The methods must therefore be suitable for analysis of these matrices and of all process sample types, including MEA solvent solution, water wash liquids, and impinger solutions used for gas-phase collections.
For most of the compounds targeted in the evaluation of a PCC process, sampling and analytical procedures fulfilling the specific requirements described above are not available as standard methodologies. This is because the analysis of these compounds is typically validated for waters, and at worst, wastewaters; or, for gaseous emissions from combustion or waste facilities. These environments and the resulting samples hold very different properties to most PCC process samples. As such, the performance of the standard methodologies required evaluation using actual PCC process samples to evaluate their suitability.

Assessing Atmospheric Emissions from Amine-based CO2 Post-Combustion Capture Processes and their Impacts on the Environment – A Case Study
44 | Volume 1: Measurement of emissions from a monoethanolamine-based post-combustion capture pilot plant
The large volume of work required in fulfilling this task required contracting external analytical facilities in addition to those of CSIRO. The laboratories that undertook the analytical work for this project were:
CSIRO Analytical Facility, North Ryde, New South Wales
Monash University Consulting and R&D Services, Churchill, Victoria
Advanced Analytical Australia (AAA) Pty Ltd, North Ryde, New South Wales
AsureQuality Limited, Wellington Laboratories, New Zealand
SGS Leeder Consulting Ltd, Mitcham, Victoria
EML Air Pty Ltd, Melbourne, Victoria
University of New South Wales Mark Wainwright Analytical Centre, Kensington, New South Wales
Some of these facilities were advised to develop specific methodologies, and others implemented methodologies normally applicable to aqueous or gaseous sampling and analysis. The aim was to achieve some cross-over between laboratories, so that the same sample/compounds would be analysed using different methodologies. Thus, we endeavoured to ensure that a valid method would be available for analysis of process samples and to provide an extra level of confidence in the results. The results from Phase 1 of the sampling campaign were reviewed for their validity from the analytical perspective, with either the more applicable methods being selected, or new methods suggested for development by the relevant laboratories for analysis of samples from Phase 2.
The following sections describe the methods developed and implemented by the various analytical facilities for the determination of targeted compounds in samples from the PCC process. Data from method proficiency testing are also summarised. The sensitivity of the analytical methodologies is expressed as both an instrumental detection limit, and as that in the process sample itself, in units of mass/L. To provide relevancy to process emissions, the minimum gas stream concentrations are also provided in units of mass/Nm3. A gas phase concentration of milligram/Nm3 is in the order of parts-per-million by volume (ppmv) as a mixing ratio, microgram/Nm3 is in the order of parts-per-billion by volume (ppbv) and nanogram/Nm3 is in the order of parts-per-trillion by volume (pptv), after the inclusion of molar volumes for each analyte.
Nominal gas sampling parameters are used in the conversion of liquid concentrations to the gas phase; a gas collection volume of 2.6 Nm3 and a final impinger volume of 350 mL at the absorber outlet, and 1.5 Nm3 / 150 mL for samples taken at the water wash outlet. The gas volume unit, Nm3, is that at normal temperature and pressure of 20 °C and 1 atmosphere pressure. To provide clarity of description in the following sections, an average of the absorber outlet and water wash outlet nominal sampling parameter may be used, because this is within 15% of the individual conditions.
Sections 5.1 to 5.8 evaluate the results from the sampling campaigns for each group of compounds listed above, and review the methodologies to determine their worthiness in this area of testing. Suggestions are also made for future analytical application to PCC process assessment. A tabulated summary of the methodologies, sensitivity data and review is presented in Section 5.9.

Assessing Atmospheric Emissions from Amine-based CO2 Post-Combustion Capture Processes and their Impacts on the Environment – A Case Study
Volume 1: Measurement of emissions from a monoethanolamine-based post-combustion capture pilot plant | 45
5.1 Monoethanolamine and diethanolamine
A method for the analysis of monoethanolamine (MEA) and diethanolamine (DELA) in process solutions was developed by the CSIRO analytical laboratories at their North Ryde facility. Monash Consulting Services also provided MEA determinations, and Advanced Analytical was asked to include the analysis of DELA with their method for nitrosodiethanolamine (NDELA). The methods implemented by each facility and aspects of method optimisation and proficiency testing are described and reviewed below.
5.1.1 CSIRO ANALYTICAL FACILITY – DETERMINATION OF MONOETHANOLAMINE AND DIETHANOLAMINE BY ION CHROMATOGRAPHY
An ion chromatographic (IC) method was developed for the analysis of the cations monoethanolamine (MEAH+) and diethanolamine (DELAH+) in process solutions. The method was also developed for the analysis of the ammonium cation (NH4
+), because this will also be present in process samples and the chromatography, therefore needed to be optimised accordingly. The ammonium analysis is treated separately, because it is determined from an acidified collection medium, whereas MEA and DELA are collected into untreated MilliQ water. As such, pH conditions are very different for the two analyses. Ammonium analysis is discussed in Section 5.2.2.
The instrumental method uses reagent-free IC, which combines electrolytic eluent generation with self-generating suppression (Dionex® ICS-5000, Thermo Fisher Scientific Inc.). Chromatographic separation of the cations was achieved using a Dionex® IonPac CS19 (2mm x 250mm) cation-exchange column with a guard column under a methanesulfonic acid gradient elution. Cation detection and quantification used conductivity detection, operated under the suppressed conductivity approach. Mass spectrometry, operated under electrospray ionisation mode, was used to confirm analyte identity (MSQ™ Plus, Thermo Fisher Scientific Inc.).
Process gas samples for MEA and DELA analysis were collected into impingers charged with MilliQ water, while samples for MEA and DELA in wash water and solvent were untreated, as described in Section 4. Despite the lower efficiency for collection of ammonia in non-acidified aqueous solution, the method required development to include ammonia, because this would be present in significant concentrations in certain samples. The chromatographic separation of MEAH+ and DELAH+ cations in the presence of NH4
+ was problematic, dependent on the relative concentrations of the three species and consequent ionic strength of the solution. This impacted adversely on retention time stability and peak resolution in the chromatographic analysis, and on response under conductivity detection.
The development work therefore focused on the issue of resolving MEA and DELA from the high levels of ammonia encountered in certain process samples, and in the case of high levels of MEA, in achieving a chromatographic separation of DELA with minimum sample dilution. Consequently, the method used a very low-eluent gradient, from 0 mM to 1 mM methanesulfonic acid, over 35 minutes. For high ionic strength samples, there is less interaction between the analytes and the stationary phase. Thus, the respective analyte peaks become less resolved and the tailing of the proceeding peak affects the detection of the analyte of interest, together with some shifting of peak elution times. The simplest sample treatment that solved this issue was further dilution to minimise excessive ion activity. In process samples where ammonia concentrations reached 1500 ppm (such as a water wash outlet sample), dilutions of up to 30-fold were used to determine low levels of MEA (maximum NH4
+ 50 mg/L). For MEA solvent samples, the chromatography dictated that a 500-fold dilution was necessary to see DELA on the tail of the MEA peak (maximum MEA ~0.65% v/v). In typical process solutions, lower dilutions were used; up to 3-fold dilutions were required at 1500 ppm MEA when ammonia concentrations were lower. The requirement for dilution inherently decreases method sensitivity, and raises the detection limit proportionally. The level of dilution was therefore optimised for each sample type, requiring in some cases specific analysis and calibration for each analyte. Under ideal analyte relative concentrations, baseline separation of the NH4
+, MEAH+ and DELAH+ cations was achieved, and other interfering species in process samples were also adequately resolved.

Assessing Atmospheric Emissions from Amine-based CO2 Post-Combustion Capture Processes and their Impacts on the Environment – A Case Study
46 | Volume 1: Measurement of emissions from a monoethanolamine-based post-combustion capture pilot plant
Method validation and proficiency testing was undertaken using process samples from Phase 2 of the sampling campaign and produced the following results. An instrumental precision of ±2% MEA and ±7% DELA was determined as relative standard deviation (RSD) over six replicate analyses of a standard solution, at a nominal concentration of 20–50x the detection limit. Analytical precision as relative percent difference (RPD) for duplicate analysis of two separately prepared sample solutions was ±15% RPD for both MEA and DELA. Linearity was determined from external standard calibration over the concentration range 0.5 to 10 mg/L, with r2 correlation coefficient >0.98 from the regression.
An instrumental detection limit of 0.1 mg/L (ppm) for MEA and 0.2 mg/L DELA was determined at the 99% confidence interval for 6 replicate analyses of standard solution prepared at minimum concentration. The instrumental detection limit is calculated through to a sample-specific method detection limit (MDL), given as concentration in the process liquids as received: i.e., after dilution requirements for certain sample types are taken into account. Further, the impinger sampling parameters are accounted for to provide the MDL as the concentration in the gas phase; in this case, in units of µg/Nm3 (representing ppbv mixing ratios when compound-specific molecular weight and molar volumes are included in the calculation).
The method detection limit as a gas phase concentration is based on nominal gas phase sampling parameters of 2.6 Nm3 gas collection volume and a final impinger volume of 350 mL at the absorber outlet and 1.5 Nm3 / 150 mL for process gas samples taken at the water wash outlet. The MDL data for MEA and DELA are detailed in Table 14. The change in MDL for process samples with low and high concentrations of ammonia and MEA as co-collected species is presented for each target analyte. The limit of reporting (LOR) is taken as 5-fold higher than the stated MDL.
Review of the ion chromatography methodology for analysis of MEA and DELA in process samples
The results from IC analysis of MEA in process samples were within 30% of those analysed using gas chromatography with flame ionisation detection (GCFID) methodology, a finding which gives some level of confidence in the results from two very different techniques. The results from analysis of DELA from field spike samples delivered recoveries that were also indicative of analytical accuracy.
The IC method has proven successful for monitoring MEA at levels typically found in process solutions, and achieves adequate detection limits for this purpose. The presence of ammonia reduces MEA chromatographic resolution, as does MEA on DELA resolution: in addition, the requirement for dilution inherently affects sensitivity for analysis of low-level process samples. In any case, the method relies on a level of consistency in the ionic strength of the matrix and this aspect must be carefully controlled. The method offers value when implemented specifically for monitoring low ppm levels of MEA as part of the sampling protocol, and in low ppbv gas-phase monitoring for ongoing process efficiency studies.
As DELA is expected as an MEA impurity and a process degradation product, it is expected to be present at very low ppm or ppb levels in process solutions. As such, the IC method for DELA in the presence of MEA and ammonia is best suited to low ppm screening of process samples. For assessment at levels of DELA below ppm in liquids and low µg/Nm3 in process gases, the liquid-phase chromatography with mass spectrometry (LCMSMS) method (described in Section 5.1.3) would be required.
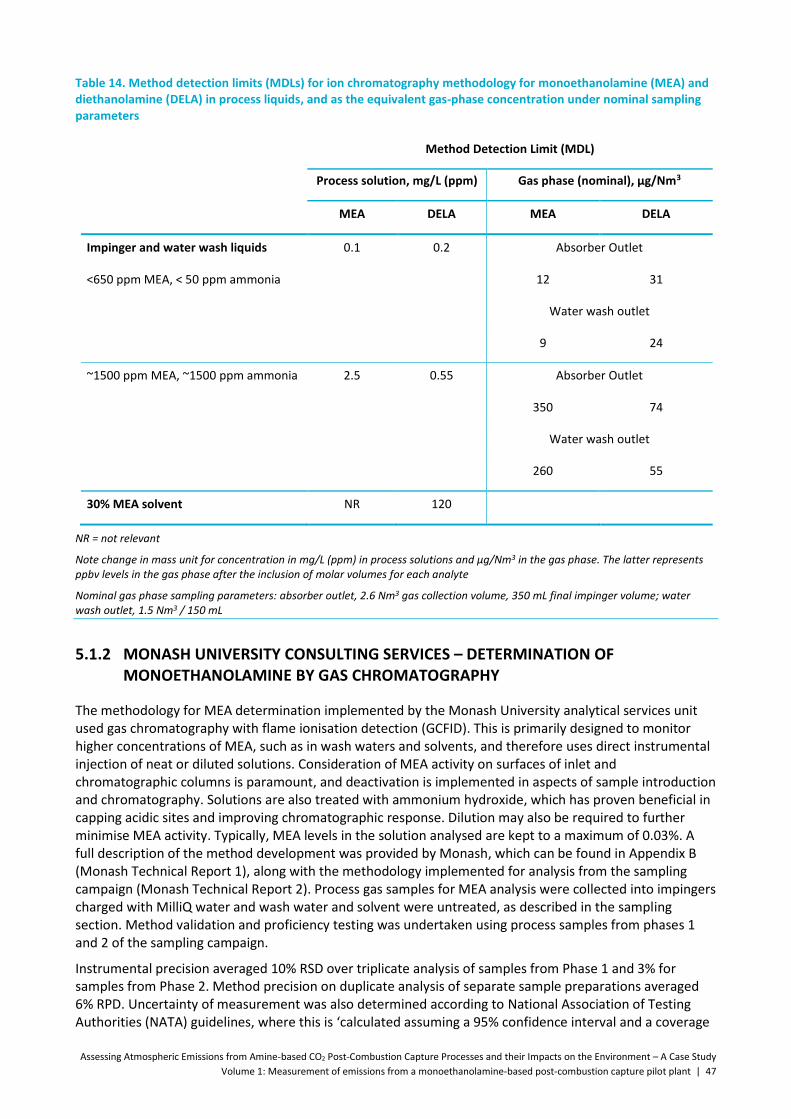
Assessing Atmospheric Emissions from Amine-based CO2 Post-Combustion Capture Processes and their Impacts on the Environment – A Case Study
Volume 1: Measurement of emissions from a monoethanolamine-based post-combustion capture pilot plant | 47
Table 14. Method detection limits (MDLs) for ion chromatography methodology for monoethanolamine (MEA) and diethanolamine (DELA) in process liquids, and as the equivalent gas-phase concentration under nominal sampling parameters
Method Detection Limit (MDL)
Process solution, mg/L (ppm) Gas phase (nominal), µg/Nm3
MEA DELA MEA DELA
Impinger and water wash liquids 0.1 0.2 Absorber Outlet
<650 ppm MEA, < 50 ppm ammonia 12 31
Water wash outlet
9 24
~1500 ppm MEA, ~1500 ppm ammonia 2.5 0.55 Absorber Outlet
350 74
Water wash outlet
260 55
30% MEA solvent NR 120
NR = not relevant
Note change in mass unit for concentration in mg/L (ppm) in process solutions and µg/Nm3 in the gas phase. The latter represents ppbv levels in the gas phase after the inclusion of molar volumes for each analyte
Nominal gas phase sampling parameters: absorber outlet, 2.6 Nm3 gas collection volume, 350 mL final impinger volume; water wash outlet, 1.5 Nm3 / 150 mL
5.1.2 MONASH UNIVERSITY CONSULTING SERVICES – DETERMINATION OF MONOETHANOLAMINE BY GAS CHROMATOGRAPHY
The methodology for MEA determination implemented by the Monash University analytical services unit used gas chromatography with flame ionisation detection (GCFID). This is primarily designed to monitor higher concentrations of MEA, such as in wash waters and solvents, and therefore uses direct instrumental injection of neat or diluted solutions. Consideration of MEA activity on surfaces of inlet and chromatographic columns is paramount, and deactivation is implemented in aspects of sample introduction and chromatography. Solutions are also treated with ammonium hydroxide, which has proven beneficial in capping acidic sites and improving chromatographic response. Dilution may also be required to further minimise MEA activity. Typically, MEA levels in the solution analysed are kept to a maximum of 0.03%. A full description of the method development was provided by Monash, which can be found in Appendix B (Monash Technical Report 1), along with the methodology implemented for analysis from the sampling campaign (Monash Technical Report 2). Process gas samples for MEA analysis were collected into impingers charged with MilliQ water and wash water and solvent were untreated, as described in the sampling section. Method validation and proficiency testing was undertaken using process samples from phases 1 and 2 of the sampling campaign.
Instrumental precision averaged 10% RSD over triplicate analysis of samples from Phase 1 and 3% for samples from Phase 2. Method precision on duplicate analysis of separate sample preparations averaged 6% RPD. Uncertainty of measurement was also determined according to National Association of Testing Authorities (NATA) guidelines, where this is ‘calculated assuming a 95% confidence interval and a coverage

Assessing Atmospheric Emissions from Amine-based CO2 Post-Combustion Capture Processes and their Impacts on the Environment – A Case Study
48 | Volume 1: Measurement of emissions from a monoethanolamine-based post-combustion capture pilot plant
of 2’, and therefore used two standard deviations obtained from triplicate measurements. The uncertainty of the measurement was determined for all process samples from phases 1 and 2 of the campaigns. The level of uncertainty tended to increase with concentration, as exemplified by ±1.5–2.5 in 25 mg/L, ±4–13 in 200 mg/L, ±90 in 400 mg/L, ±60–115 in 1500 mg/L and ±720 in 5000 mg/L, indicating a consistent %RSD. Data pertaining to method proficiency have been provided by Monash and can be found in Appendix B (Technical Report 3). Average recovery of standard compound spiked to samples from Phase 2 was 85% determined at a spike concentration: around 25% higher than the native sample concentration.
An instrumental detection limit of 10 mg/L is achieved, which provides an MDL of 10–50 mg/L in process solution (dependent on the dilution requirements of the sample) and 50 mg/L in water wash liquids. In 30% MEA solutions, a detection limit for the solvent is not relevant. Using nominal sampling parameters as described in the introductory paragraphs of Section 5, the concentration of the process solution equates to a detection limit in the gas phase of 4 mg/Nm3 at the absorber outlet and 1 mg/Nm3 at the water wash outlet.
Review of the GCFID methodology for analysis of monoethanolamine in process samples
The GCFID method has proven successful for determination of high-percentage MEA in solvent solutions through to the low-mid ppm level in process solutions. As such, the method was seen as useful in the initial evaluation of the sampling protocol or in solvent evaluation. The results have also compared well with those obtained from CSIRO's IC methodology, as can be seen in the results listing in Section 4. However, this method suffers up to 100-fold higher instrument detection limits, and up to 20-fold higher gas-phase detection limits than the IC methodology. This is due to both the requirement for dilution and MEA's ill-effect on chromatography, which is due to its basicity and inherent activity when exposed to various components of the GC system. The method has the advantage of straightforward sample preparation and GC technique, and it is therefore regarded as suitable for screening purposes.
5.1.3 ADVANCED ANALYTICAL AUSTRALIA – DETERMINATION OF DIETHANOLAMINE BY LIQUID-PHASE CHROMATOGRAPHY WITH TANDEM MASS SPECTROMETRY
Diethanolamine is likely to be present as either an impurity in MEA solutions or a process degradation product. Hence, its concentration in process liquids is likely to be low. Additionally, the detection of nitrosodiethanolamine in samples from Phase 1 of the sampling campaign dictated that a trace-level method for the precursor was required.
Advanced Analytical Australia (AAA) undertook to develop their LCMSMS method implemented for the determination of non-volatile nitrosamines (as detailed in Section 5.5.3) for simultaneous determination of DELA. This provided a direct comparison of DELA with its product of nitrosation using the same analytical method, which offered obvious advantages in process evaluation. The method followed the protocol described in Section 5.5.3, with inclusion of multiple reaction monitoring (MRM) transitions for detection and quantitation of DELA. Method modifications are described in the addendum of AAA Technical Report 2 in Appendix B . All tests related to the assessment of matrix effects on MS ion response described for the nitrosamines methodology were also undertaken for DELA to ensure accuracy. Process solutions and wash water liquids were analysed directly. The high proton affinity of an MEA matrix was found to suppress the signal for the target analyte. Consequently, the solvent solution required dilution to a level of 0.3% MEA.
Precision of the analysis was provided as that based on duplicate sample analysis and replicate analysis of the standard. DELA was not detected in process solutions, and the precision for duplicate analysis of solvent solution averaged ±28% RPD for DELA (n=3). An average of ±5% RSD was obtained for replicate analysis of standard solutions. All process samples were spiked with DELA to determine the accuracy of the analysis as recovery from the sample matrix. Similar recoveries were obtained for process solutions and solvent, and an average 92% recovery was found (n=12). Recoveries ranged from 72–115%, indicating some uncertainty in the result. For any technique, this is considered acceptable. In fact, it indicates high proficiency of the analysis by LCMS, in which matrix effects can significantly affect the results, and is a consequence that is not always ameliorated by the use of isotopically labelled internal standards.
Assessing Atmospheric Emissions from Amine-based CO2 Post-Combustion Capture Processes and their Impacts on the Environment – A Case Study
Volume 1: Measurement of emissions from a monoethanolamine-based post-combustion capture pilot plant | 49
The method delivered an instrumental detection limit of 1 µg/L (ppb) DELA, which directly relates to that in process solutions, because these are analysed without dilution. The detection limit of DELA in MEA solvent is 100 µg/L, after the required dilution is taken into account. For impinger solutions, a gas-phase method detection limit of 0.13 µg/Nm3 at the absorber outlet and 0.10 µg/Nm3 at the water wash outlet was obtained under nominal conditions of sampling (as detailed in the introductory paragraphs of Section 5). AAA reports at a limit of 2.5x that of the MDL.
Review of the LCMSMS methodology for analysis of diethanolamine in process samples
The LCMSMS method developed by AAA offered a high level of sensitivity for analysis of DELA in solutions where trace-level (low ppb) determinations are required. Importantly, it also offered guidance as to DELA's role in the generation of nitrosodiethanolamine, because both compounds could be measured with confidence from the same analysis.
5.1.4 SUMMARY REVIEW OF METHODS FOR THE DETERMINATION OF MONOETHANOLAMINE AND DIETHANOLAMINE
The GCFID-based method for determination of MEA carries quite high detection limits but its ease of sample preparation and analysis makes it useful for screening purposes.
The IC method, which carries higher sensitivity and provides simultaneous analysis of DELA, is preferable for routine process assessment. The limitation of the IC method for analysis of process liquids is the high and variable ionic strength of the sample matrix, which makes monitoring at ppb levels more challenging. For stack emissions assessments where levels are dictated by low-level environmental guidelines, a more sensitive method that incorporates IC with MS and/or a preparative step by which to isolate and concentrate MEA and DELA may be necessary. The use of MS detection comes with higher complexity and associated cost, and the preparative aspect comes with the requirement for selectivity of the isolation technique used in the presence of competing components, as well as the risk of low recoveries. These aspects can reduce accuracy unless stringent checks are incorporated to accurately quantify and adjust for the extent of loss of each analyte.
Another consideration is the use of two-dimensional ion chromatography. This system combines two different chemistries in two dimensions to provide selectivity not possible in single chemistry dimensions. This can eliminate matrix effects, while the use of a smaller concentrator column increases sensitivity.
The LCMSMS method implemented by Advanced Analytical Australia successfully addressed many of these issues, and for determination of diethanolamine, provided high sensitivity suitable for process efficiency and environmental assessments.
5.2 Ammonia
The methods for determination of ammonia were investigated from the strategy of screening, for high level process determinations, and as those which use more sophisticated techniques for application to low level emissions assessment. The former application used a spectrophotometric method and was investigated by Leeder Consulting. The latter was investigated by CSIRO's North Ryde analytical facility, which used IC in a manner similar to that employed for MEA and DELA cation analysis, and by AsureQuality, which included the analysis of ammonia with the alkylamine suite using derivatisation and gas phase chromatography with mass spectrometry (GCMS).
The sampling protocol for collection of ammonia required that impinger charge solutions were H2SO4-acidified, to reduce volatility and maximise the efficiency of collection. Water wash samples were acidified post-collection and the solvent solutions were untreated, as described in Section 4. The methodologies implemented by Leeder, CSIRO and AsureQuality are described in the following sections.

Assessing Atmospheric Emissions from Amine-based CO2 Post-Combustion Capture Processes and their Impacts on the Environment – A Case Study
50 | Volume 1: Measurement of emissions from a monoethanolamine-based post-combustion capture pilot plant
5.2.1 SGS LEEDER CONSULTING – SPECTROPHOTOMETRIC DETERMINATION OF AMMONIA
As ammonia is a major degradation product of MEA, a method for screening this compound in solutions can be appropriate for certain levels of process assessment. These types of method generally do not offer high selectivity, because other compounds of similar chemistry can interfere or be included in the result. In the PCC process, for example, alkylamines may interfere; but, as their concentration would be orders of magnitude lower, it was thought that a screening technique for high-level ammonia would still provide useful information.
Leeder Consulting investigated the use of a spectrophotometric method that is normally employed for analysis of ammonia in industrial stack gases. This is a colorimetric analysis using the Berthelot reaction to form indophenol blue. Both flow injection analysis and HPLC analysis with post-column derivatisation were tested. Both trials were unable to yield reasonable recoveries of ammonia, due to interferences from MEA. Even at levels of 100 mg/L (ppm) MEA, the ammonia peak was not discernible from either analytical technique. We therefore decided therefore to abandon further work in this direction and concentrate analytical effort towards more specific methods of ammonia analysis.
5.2.2 CSIRO ANALYTICAL FACILITY – DETERMINATION OF AMMONIA BY ION CHROMATOGRAPHY
Ammonia was measured as the ammonium cation (NH4+) using ion exchange chromatography and
electrochemical detection, by the same instrumental method used for determination of MEA and DELA described in Section 5.1.1. Modifications to the method were mainly made to address an acidified sample matrix used to efficiently collect ammonia (whereas MEA and DELA are in an untreated aqueous matrix). For certain samples, a specific level of dilution was required dependent on the relative concentrations of ammonia and MEA to optimise the ionic strength of the sample and improve the chromatography (for reasons described in Section 5.1.1). Chromatographic conditions were optimised to maximise the separation of all three components, and therefore limit the degree of dilution required and enhance ammonium detection limits. However, in some samples, such as the water wash solutions, the level of MEA necessitated large dilutions to effectively resolve the ammonium cation from the MEA peak. The maximum preferable concentration of MEA in the solution analysed was 650 mg/L (< 0.1% v/v). The ammonium ion presented its own detection issues, and it was empirically found that at concentrations in excess of ~50 mg/L (using a 10 µL injection), ammonium had sufficient ionic strength to cause significant peak broadening and tailing, which rendered it unquantifiable. The sample was further diluted to a nominal value of 10 mg/L: a value that tended to produce optimum peak shape and reproducibility.
As the efficient sampling of ammonia requires its collection into an acidic medium, the effect of pH on the chromatography and on analyte response was also investigated. A sample pH of 1–2 produced an unstable baseline, and adjustment to higher pH using calcium hydroxide was initially tested. However, this technique required filtration of the consequent precipitate, and we determined that the risk of analyte losses, particularly at trace level, was unacceptably high. We found that the IC analysis tolerated a pH of 3–5, which dictated the pH to be used for the impinger collection. This pH was considered to be low enough to protonate the ammonia molecule and preclude its volatilisation.
Another issue affecting ammonium analysis is the presence of sodium cations, which elute as a distinct peak immediately before ammonium. Samples that had contacted glass vessels used to collect and store both the acidified impinger samples and the alkaline MEA solvent and water wash samples were all affected by high sodium contamination. This caused some interference to resolving the ammonium peak for low concentration ammonium samples, i.e. at a level <~0.5 mg/L. High-density polyethylene vials had been used to store impinger samples collected for the analysis of chloride and fluoride in this project, and these samples were analysed and found to be free of sodium contamination. The use of these containers for acidified collection needs to be investigated, as does the level of plasticiser background, which may reduce their suitability for ion chromatography using MS detection. For low-level ammonia analysis, the use of polymer vessels for both collection and storage may provide a superior approach.

Assessing Atmospheric Emissions from Amine-based CO2 Post-Combustion Capture Processes and their Impacts on the Environment – A Case Study
Volume 1: Measurement of emissions from a monoethanolamine-based post-combustion capture pilot plant | 51
Method validation and proficiency testing were undertaken using standard solutions of ammonium chloride and from ammonia samples from Phase 2 of the sampling campaign. An instrumental precision of ±3% was determined as RSD over six replicate analyses of a standard solution at nominal concentration (20–50x the detection limit). Analytical precision as RPD for duplicate analysis of two separately prepared sample solutions was ±5% RPD; this was for samples where MEA interference was low. Linearity was determined from external standard calibration over the concentration range 0.5–10 mg/L with an r2 correlation coefficient >0.98 determined from the regression analysis.
An instrumental detection limit of 0.1 mg/L (ppm) for ammonium was determined at the 99% confidence interval for six replicate analyses of standard solution prepared at minimum concentration. The sample-specific MDL in water wash was 4 mg/L due to dilution for high levels of ammonia, and 60 mg/L in solvent due to dilution for MEA in these liquids. MDL as concentration in impinger solutions moves from 0.1 mg/L through to around 0.3 mg/L, dependent on the required sample dilution. The associated MDL for ammonia in the process gas under nominal sampling parameters therefore ranges between 14 and 33 µg/Nm3 (ppbv) (using an average absorber and water wash nominal condition). The LOR is taken as 5-fold higher than the MDL.
Review of the ion chromatography methodology for analysis of ammonia in process samples
Phase 2 of the sampling campaign implemented acidified collection for samples of ammonia and alkylamines, which were analysed using IC. In all samples, apart from those at the inlet before the absorber, ammonia was found at significant concentrations well above the detection limit of the method. As such, the method delivered meaningful concentration data when applied to the analysis of both liquids and process solutions.
A disparity in results was seen, however, when the ammonia data were compared with that from the determination using the GCMS method implemented by AsureQuality (discussed in Section 5.3.3). In most samples, the result from GCMS was higher, but the extent of difference appeared to be dependent on sample type; this indicated a correlation with absolute ammonia levels and/or co-collected MEA. Up to 2-fold higher results were obtained by GCMS for Impinger 1 samples (high ammonia/low MEA) and up to 7-fold higher for solvent samples (high MEA/low ammonia). For Impinger 2 samples, where levels of ammonia were significantly lower (and MEA was not detected), the two methods delivered more comparative results.
The effect of co-components, and the acidity of the sample matrix on accuracy of response, chromatographic behaviour, integration and calibration, all require further proficiency testing. In addition, the results from Phase 2 have raised questions about ammonia sampling, as mentioned in Section 4.3.1 and summarised in Section 5.2.4.
5.2.3 ASUREQUALITY – DETERMINATION OF AMMONIA BY DERIVATISATION AND GAS CHROMATOGRAPHY WITH MASS SPECTROMETRY
The determination of ammonia was incorporated into the volatile amines method developed by AsureQuality using benzenesulfonyl chloride (BSC) derivatisation and GCMS analysis. This method is described in Section 5.3.3 and hence will not be elaborated upon here.
The method achieved a detection limit of 80 mg/L ammonia in solvent liquid and 4 mg/L in wash water liquid and impinger solutions. The gas-phase concentration of the MDL under nominal parameters for process gas sampling is determined as 0.47 mg/Nm3 ammonia (using an average sampling condition for process gas at the absorber outlet inlet and water wash outlet). The LOR was stated as 5-fold higher than the MDL. The method precision calculated from four replicate analyses of the ammonia aqueous recovery standards averaged 8.2%. Recovery from these solutions averaged 106%.
Review of the GCMS methodology for analysis of ammonia in process samples
Levels of ammonia were well above the detection limit in all samples where ammonia was expected, despite this method’s lower sensitivity than IC (around 10-fold lower for process gas). As such, the method

Assessing Atmospheric Emissions from Amine-based CO2 Post-Combustion Capture Processes and their Impacts on the Environment – A Case Study
52 | Volume 1: Measurement of emissions from a monoethanolamine-based post-combustion capture pilot plant
delivered acceptable data for general process assessment. The GCMS method has the added advantage of simultaneous analysis of alkylamines. The large differences in relative concentration between ammonia and trace-level alkylamines reduces the sensitivity of the method for the alkylamines if both are analysed from the same sample preparation. Sample preparation specific to each analyte achieved 500-fold higher sensitivity for the alkylamines, as discussed in Section 5.3.3.
5.2.4 SUMMARY REVIEW OF METHODS FOR THE DETERMINATION OF AMMONIA
Both IC and GCMS-based methods offer acceptable sensitivity for analysis of ammonia in process solutions, and each has advantages and limitations with respect to sample preparation and method complexity. However, the extent of rigorous testing required to assess the credibility of a single analytical method is clearly demonstrated by the results from the IC and GCMS methods for ammonia determination, as tabulated in Section 4. While each method delivered adequate results under method proficiency testing and each may be valid for comparing different samples analysed within a method, the certainty in the absolute value of the result requires further work. The large difference in the makeup of process samples makes the analytical task considerably more complex.
The variability in the results may also be due to variability in analyte integrity and stability under the conditions of collection. There was also some indication, based on limited results from field quality assurance samples, of the presence of an ammonia artefact. Further investigation of the sampling conditions, the efficiency and integrity of ammonia collection, and the effect of the acidified matrix on analyte integrity in the presence of MEA is required.
5.3 Alkylamines
Alkylamines are compounds exhibiting high volatility, basicity and activity. As such, they are challenging compounds to efficiently collect and analyse and this is made more so by the likely presence of MEA and ammonia in high concentrations. Three laboratories were contracted to develop applicable methods and/or test the validity of their standard methods for process solutions. Each laboratory used a different approach, as described in the following sections.
5.3.1 MONASH CONSULTING SERVICES – DETERMINATION OF PRIMARY ALKYLAMINES BY DERIVATISATION AND GAS CHROMATOGRAPHY WITH MASS SPECTROMETRY
Monash Consulting Services developed a method to determine primary alkylamines; methylamine (MA) and ethylamine (EA) in process solutions by GCMS after their derivatisation and liquid extraction. The method was based on Avery and Junk (1985) and used pentafluorobenzaldehyde (PFBAY) to form the pentafluorobenzene imine (PFB imine) derivative of each amine. This method was found to be suitable for the primary alkylamines, and was applied to impinger-collected process gas samples, water wash solutions and diluted MEA solvent solutions. The method was unable to quantify the target secondary amines dimethylamine (DMA) and diethylamine (DEA).
Various other methods had been investigated by Monash, including direct injection and headspace analysis, but these proved unreliable in the presence of MEA and due to the activity of the alkylamines themselves when exposed to various components of the GC introduction and chromatographic systems. The method also needs to be suitable for analysis of acidified solutions, as required for the efficient impinger collection of these compounds in the gas phase. The derivatisation method was further developed for this matrix. The methodology is described with full account of developmental findings in the Technical Reports 1 and 2 provided by Monash Consulting Services, which can be found in Appendix B .
Method proficiency, determined under the method development protocol using samples from Phase 1, found an instrumental precision of ±10% RSD (average) from replicate sample analysis and ±16% RPD based on analysis of duplicate sample preparations. Spike recoveries to sample solution averaged 70%. An instrument detection limit of 0.08 mg/L for MA and 0.02 mg/L for EA was reported when the method was

Assessing Atmospheric Emissions from Amine-based CO2 Post-Combustion Capture Processes and their Impacts on the Environment – A Case Study
Volume 1: Measurement of emissions from a monoethanolamine-based post-combustion capture pilot plant | 53
applied to solvent solutions (refer Monash Technical Report 2, Appendix B ). In Phase 2 analyses, a sample-specific MDL of 0.03–0.06 mg/L for MA and 0.004–0.008 mg/L for EA was reported for impinger and water wash solutions, dependent on dilution. The MDL for solvent solutions was 1.5 mg/L MA and 0.4 mg/L EA. The LOR was stated as 5x MDL. Under nominal parameters used for impinger sampling, this equates to a process gas detection limit of 5 µg/Nm3 (average) for MA and 0.7 µg/Nm3 for EA, using a nominal gas phase sampling parameter average for absorber outlet and water wash outlet (as this is within 15% of those under exact sampling parameters).
Review of the GCMS methodology for analysis of alkylamines in process samples
The analysis of process samples from Phase 1 found levels of MA and EA generally well above the detection limit for the solvent, water wash and absorber outlet samples. As these samples were collected into an aqueous matrix, the nil detection of alkylamines in process gas samples was not unexpected. At this stage, the recovery from sample spikes provided a level of confidence in the analysis, and it appeared that the method would be useful for examining the generation of these compounds in the solvent and the efficacy of their scrubbing to the wash water. The method was considered suitable for general process assessment in Phase 2, where acidified collection would also be implemented.
Analysis of Phase 2 samples was not as successful. Proficiency at the levels seen under Phase 1 testing was not achieved in the analytical work undertaken for Phase 2. Recovery from spike solutions was extremely variable (18% for MA and 92% for EA in solvent solutions) through to extremely high recoveries in process solutions (up to 1100%). The main difference in the process samples from phases 1 and 2 were that the latter were from an H2SO4-acidified collection (pH 3–5). The solvent used in Phase 2 was marginally different to that in Phase 1. Evaluation of the results for the various sample types found little comparison with those received from AsureQuality (as discussed in Section 5.3.3). Additionally, the absolute values did not provide a logical argument with what may be expected from the various points of the process, nor did they return values that were meaningful in the interpretation of field spike recoveries. As such, the Monash results are not presented in a formal manner in this report.
Monash has provided the following evaluation: ‘The matrices associated with acidified waters from the impingers and degraded MEA solvent presented unique challenges for the analyst. This was particularly the case in the use of PFB-imine formation (derivatisation) reactions to analyse for alkyl amines. Interferences resulted in both positive and negative impacts on internal standard/surrogate standard response. Calibrating in reagent grade water and MEA solutions gave consistent results, however in the process samples, the impact of MEA degradation products and corrosion by-products resulted in uncertainty. Variable levels of ammonia, formates, oxalates, glycolates and heat-stable salts (e.g. organic complexes with sulphate and nitrate, and corrosion metals such as iron) would all contribute to the difficulties observed. Given the targets (amines and amides) are suspected MEA degradation products, disturbances caused by sample workup and GCMS analysis to the ‘equilibrium conditions’ in the as-received samples can also impact on data quality.’
Comprehensive further testing of this method is required by Monash Consulting Services to determine their method’s suitability for application to PCC process assessment. Alternatively, a new, more amenable analytical approach using an alternative derivatisation agent or other technique would need to be applied.
5.3.2 ADVANCED ANALYTICAL AUSTRALIA – DETERMINATION OF 1° AND 2° ALKYLAMINES BY DERIVATISATION, SOLID-PHASE MICRO-EXTRACTION AND GAS CHROMATOGRAPHY WITH MASS SPECTROMETRY
AAA undertook to develop a method based on derivatisation of the target alkylamines coupled with headspace solid-phase micro-extraction (SPME) and analysis using GCMS. Derivatisation produces a compound more amenable to GCMS analysis and, in this case, enables selectivity towards primary alkylamines. SPME concentrates the analyte to improve the sensitivity of the method, which is particularly important in improving detection limits for trace-level analytes, as is the case for these compounds in PCC process samples. The specific derivatisation procedure and SPME techniques selected were based on work

Assessing Atmospheric Emissions from Amine-based CO2 Post-Combustion Capture Processes and their Impacts on the Environment – A Case Study
54 | Volume 1: Measurement of emissions from a monoethanolamine-based post-combustion capture pilot plant
published by Pan et al. (1997) and Llop et al. (2003), which had been applied to alkylamine analysis in waters and waste waters. The work used PFBAY derivatisation to convert polar primary amines into their less polar and more volatile imines for headspace SPME collection. A detailed description of the method, its development and findings is detailed in the report prepared by AAA (AAA Technical Report 1), which can be found in Appendix B . Despite lengthy testing and the use of alternative approaches, the method ultimately proved unsuccessful when applied to solutions containing MEA, even after dilution to minimise MEA concentration.
AAA advised that further method development would be required, and suggested a number of alternative derivatisation and extraction methodologies that could be tested towards achieving a viable method, or methods, for determination of both primary and secondary amines in process solutions. However, the extent of the analytical development required was not considered to be within the scope of the current project and effort was directed towards the technique implemented by AsureQuality, as discussed in Section 5.3.3.
5.3.3 ASUREQUALITY – DETERMINATION OF VOLATILE AMINES BY GAS CHROMATOGRAPHY WITH MASS SPECTROMETRY
AsureQuality investigated two analytical techniques for the determination of volatile amines; the first being applicable to 1° and 2° alkylamines, and the second including the determination of ammonia, as described below.
1° and 2°alkylamines by headspace analysis and GCMS
AsureQuality undertook to determine both primary and secondary alkylamine compounds using an in-house method based on headspace analysis of the aqueous solution for determination by GCMS. A description of the procedural parameters associated with this method were not forthcoming. A review of results from their analysis of samples from Phase 1 using this methodology follows. This instigated the requirement for an alternative approach, and a new method was implemented for use in the analysis of Phase 2 process samples as described below.
Review of the headspace-GCMS methodology for analysis of alkylamines in process samples
The headspace GCMS method provided detection limits of 30, 10, 10 and 2 mg/L (ppm) for methylamine, ethylamine, dimethylamine and diethylamine respectively in the as-received sample. All samples from the first sampling campaign were below the concentration of the detection limit. Subsequently, information on the efficiency of the analysis was sought, because the method relies on the efficient transfer of the alkylamines from solution into the headspace and then to the GC, and hence requires that MEA does not adversely affect these transfers. The method proficiency testing showed low and variable recovery from process solutions spiked with the target amines.
The variable recoveries and high detection limit suffered by the headspace GCMS methodology was considered inadequate in the context of PCC process efficiency or emissions assessment. For these reasons, AsureQuality undertook to test an alternative technique for the analysis of alkylamines in process solutions, as described below.
Ammonia and 1° and 2°alkylamines by derivatisation and GCMS
The new technique developed by AsureQuality enabled the inclusion of ammonia along with 1° and 2° alkylamines. The method used BSC derivatisation of the sample in the liquid phase, followed by extraction of derivatised analytes and their analysis by GCMS. This method intends to serve the purposes of improving recovery by avoiding the transfer issues associated with the headspace technique, and by improving detection limits by isolating the derivatised analytes in a more concentrated solution. The methodology is described as follows using information supplied by AsureQuality.
The procedure was based on published work for the determination of 1° and 2° amines in aqueous samples (Sacher et al., 1997). The acidified medium used for collection of ammonia and alkylamines was basified
Assessing Atmospheric Emissions from Amine-based CO2 Post-Combustion Capture Processes and their Impacts on the Environment – A Case Study
Volume 1: Measurement of emissions from a monoethanolamine-based post-combustion capture pilot plant | 55
using 30% sodium hydroxide with the addition of an isotopically labelled standard (dimethylamine-D6) as an internal standard. The solution was derivatised with BSC. Following neutralisation with pH5.8 buffer and 5 M hydrochloric acid, the sample was extracted with dichloromethane, and the organic extract was analysed by GCMS using a Restek®Rtx-35 amine column. A four-level calibration curve was set up using aqueous recovery standards over the range of 500–2500 µg/mL, with an average response factor being used for RSD<10%; otherwise, a whole curve was applied. Quantification was by internal standards using Agilent MS ChemStation™ software.
Data relating to the evaluation of precision and recovery was supplied by AsureQuality and is interpreted as follows. The method precision calculated from four replicate analyses of the aqueous recovery standards averaged ±1.8% RSD for the alkylamines (average MA, EA, DMA, and DEA) and ±8.2% for ammonia. Recovery averaged 92% (89–97% across each alkylamine) and 106% for ammonia.
The instrumental detection limit was not stated. Results are reported to the LOR, which is stated as signal/noise >10:1. This indicates an MDL of LOR/5. For reasons of uniformity and to enable comparison with other methods, the MDL is determined from the LOR to provide the following detection limits: solvent liquid, 80 mg/L ammonia, 0.4 mg/L MA, 0.16 mg/L EA and 0.08 mg/L DMA and DEA; wash water liquid and impinger solutions, 4 mg/L ammonia, 0.02 mg/L MA, 0.008 mg/L EA and 0.004 mg/L DMA and DEA. The gas-phase concentration of the MDL, calculated under nominal parameters for process gas sampling, is 470 µg/Nm3 ammonia, 2.3 µg/Nm3 methylamine, 0.9 µg/Nm3 ethylamine and 0.5 µg/Nm3 for DMA and DEA (using a sampling average condition for process gas at the absorber outlet inlet and water wash outlet). The LOR is taken as 5-fold higher than the MDL.
Review of the derivatisation GCMS methodology for analysis of ammonia and alkylamines in process samples
Where a number of approaches to the analysis of alkylamines in process solutions have been unsuccessful, the method implemented by AsureQuality has provided a sensitive technique which, under initial quality assurance testing, also shows adequate levels of precision and accuracy. Further method proficiency testing based on process samples would confirm this view. The ammonia analysis can be compared with that from the IC method implemented in this project. Here, some variation in results was seen from analyses of the same sample, as tabulated in Section 4. This engenders a lack of confidence in one or other of the techniques, as was discussed in Section 5.2.4. It is therefore evident that further validation of both the collection and analytical techniques for ammonia is required. The GCMS methodology offers high sensitivity for trace-level analysis of 1° and 2° alkylamines (low ppbv in the gas phase), making it suitable for both process and environmental assessments.

Assessing Atmospheric Emissions from Amine-based CO2 Post-Combustion Capture Processes and their Impacts on the Environment – A Case Study
56 | Volume 1: Measurement of emissions from a monoethanolamine-based post-combustion capture pilot plant
5.4 Amides
The amide compounds of interest in this project were formamide and acetamide. Monash University Consulting Services undertook this determination.
5.4.1 MONASH CONSULTING SERVICES – DETERMINATION OF AMIDES BY GAS CHROMATOGRAPHY WITH MASS SPECTROMETRY
The Monash analytical facility developed a GCMS method that has proven successful for the analysis of formamide and acetamide in aqueous solutions by direct-injection-GCMS. Direct injection avoids the requirement for complex sample preparative methods, such as solid-phase extraction, which can become unreliable in the presence of high levels of MEA. While this is an advantage of direct injection, particularly for PCC process samples, it comes at a cost of higher detection limits, particularly as samples containing high levels of MEA required dilution to around 3% MEA. The various considerations required for successful instrumental analysis of nitrogen compounds in MEA solutions is described in the Monash Technical Reports 1–3, which can be found in Appendix B .
The method delivered a detection limit of 5 mg/L formamide and 3 mg/L acetamide in solvent liquids, and 0.5 mg/L formamide and 0.3 mg/L acetamide in water wash and impinger process solutions samples from the Phase 1 and 2 sampling campaigns. In impinger solution,, this would equate to an average gas-phase MDL of around 0.05 mg/Nm3 for these compounds under nominal conditions of process gas collection. Recoveries of standard compound spiked to the process solutions as low as 26% formamide and 62% acetamide were found in Phase 1. This aspect was addressed in Phase 2, to achieve recoveries averaging 85% (range 82–98%) for formamide and 100% (range 91–110%) for acetaldehyde. Spike recovery to a solvent liquid was 57%. Precision, which was based on triplicate analysis of spiked solutions, averaged ±15% RSD.
Review of the GCMS methodology for analysis of amides in process samples
Results from analysis of process samples from phases 1 and 2 were nil detected for all solutions. Amides are present as degradation products and hence will be at trace levels in process solutions. Unfortunately, the high detection limits delivered by direct analysis did not provide confidence as to whether amides were present in the samples. In addition, a field sample spiked with amides at a level well above the MDL did not return a value at all close to the expected result.
Overall, this method requires significant further development – or a new method should be considered – to address the level of confidence in the data, and importantly, the minimum concentration requirements for its intended use for process assessment.
5.5 Nitrosamines
The nitrosamine compounds targeted in this project were N-nitrosodimethylamine (NDMA), N-nitrosodiethylamine (NDEA), N-nitrosomorpholine (NMor) and N-nitrosodiethanolamine (NDELA). These nitrosamines fall into categories based on their volatility and their associated analytical requirements. NDMA and NDEA are classed as volatile, NMor as semi-volatile, and NDELA as non-volatile. As such, GC is preferable for analysis of NDMA, NDEA and NMor, while LC is better for analysis of NDELA, and is also suitable for NMor. In all cases, MS is used for identification and quantification of these compounds, because it offers the high sensitivity and specificity required for trace level analysis. Each instrumental method also requires different preparative techniques, or matrices, which are suitable for presentation to the instrument. A number of different methods based on either GCMS or LCMS were used by CSIRO and the other three contract laboratories that performed this analysis.

Assessing Atmospheric Emissions from Amine-based CO2 Post-Combustion Capture Processes and their Impacts on the Environment – A Case Study
Volume 1: Measurement of emissions from a monoethanolamine-based post-combustion capture pilot plant | 57
5.5.1 CSIRO ANALYTICAL FACILITY – DETERMINATION OF N-NITROSOMORPHOLINE AND N-NITROSODIETHANOLAMINE BY LIQUID CHROMATOGRAPHY MASS SPECTROMETRY
CSIRO investigated the determination of NMor and NDELA by LCMS at the North Ryde facilities. This work used a recently commissioned Dionex® Ultimate 3000 LC coupled with a Thermo Scientific™ Q-Exactive Benchtop Quadrupole-Orbitrap Mass Spectrometer. This instrument offers extremely high accuracy and efficiency in its level of mass resolution, and hence provides high-level selectivity and sensitivity for analysis of trace analytes in complex matrices. This is an important factor in LCMS analysis, where matrix effects are commonly the cause of incorrect findings or inaccurate quantification.
The facility at CSIRO Newcastle laboratories was also contracted to perform NDELA analysis in process samples. Being a lower-resolution instrument, their methodology used IC and MS rather than reverse-phase LC, because previous work had shown that IC was more suitable in a MEA matrix. Severe signal suppression had been experienced under reverse-phase conditions when greater than 0.3% MEA was present in the sample matrix. This was thought to be a consequence of inadequate separation of the analyte from the matrix using organic gradients and the high proton affinity of the matrix. Under IC conditions, the methodology allows for the determination of NDELA only. Multiple reaction monitoring over three mass transitions was used for MS analysis and quantitation.
Review of the LCMS methodology for analysis of N-nitrosomorpholine and N-nitrosodiethanolamine in process samples
Development work at the Lucas Heights facility continued using the high-resolution LCMS instrument to analyse samples from Phase 1 of the sampling campaign. However, it became apparent that to overcome the effect of the matrix on analyte quantitation, high sample dilution was required. This rendered the method unsuitable for the trace-level analysis necessary for effective evaluation of process samples. As such significant further work was necessary, we terminated this aspect of the analytical program, especially because methodologies implemented by some of the other contract laboratories were showing success. Funding was therefore directed towards further method developments by these facilities.
The analysis of NDELA in Phase 1 samples by CSIRO's Newcastle facility using ICMSMS methodology showed inconsistent results. Low and variable recoveries were found for process samples spiked with NDELA, yet higher than expected native concentrations of NDELA were found in other samples. The former was indicative of signal suppression, which appeared from this limited data to be related to MEA concentration. The latter, which was based on work performed by AAA, was due to the presence of an unresolved, unknown compound, which may have been included in the NDELA result as a false positive. This compound showed similar chromatographic retention and MS characteristics as NDELA under the conditions used by AAA, who implemented high-resolution chromatography to overcome this issue and its impact on NDELA response (as described in Section 5.5.3). The AAA method also achieved lower detection limits. All of these issues combined to render the AAA method the most suitable for further optimisation of analysis of samples from Phase 2 of the sampling campaign.
5.5.2 MONASH CONSULTING SERVICES – DETERMINATION OF VOLATILE NITROSAMINES BY GAS CHROMATOGRAPHY MASS SPECTROMETRY
The method developed by Monash used direct injection to GCMS for determination of the target volatile nitrosamines: NDMA, NDEA, and NMor. As described in Section 5.4.1, direct injection has the advantage of avoiding complex preparative methods, but comes at a cost of higher detection limits, due to the 10-fold dilution required for samples containing high levels of MEA. Direct injection also requires that the sample cannot contain large concentrations of mineral acids or alkalis, which means that sulfamic acid treatment and H2SO4 acidification cannot be used for sample collection. This is considered necessary to eliminate nitrite compounds present in PCC process samples, thereby protecting the sample from in-situ artefactual formation of nitrosamines. Since MEA systems do not have large precursor concentrations of the required secondary amines, it was considered that this was of lesser concern, particularly if the method proved

Assessing Atmospheric Emissions from Amine-based CO2 Post-Combustion Capture Processes and their Impacts on the Environment – A Case Study
58 | Volume 1: Measurement of emissions from a monoethanolamine-based post-combustion capture pilot plant
suitable as a screening technique. As a precaution, samples were transported and analysed as soon as possible after sampling. Whether artefact formation is occurring under these conditions requires further investigation. Procedures used to minimise the effect on chromatography of direct injection of water to the GC system were also implemented as described in Technical Report 1 provided by Monash (Appendix B ).
Review of the GCMS methodology for analysis of volatile nitrosamines in process samples
The method achieved detection limits for the target nitrosamine compounds of around 100 µg/L (ppb) for water wash and impinger solutions, and 1 mg/L (ppm) for solvent. The limit of reporting was 5x MDL (0.5 mg/L and 5 mg/L, respectively). These limits are considered too high to be meaningful for effective process assessment. For process gases, where the concentration of volatile nitrosamines is expected to be very low, these limits would equate to around 10 µg/Nm3. This is above that required for general process assessment, and well above that required for trace-level emissions assessment.
Results for analysis of samples from the Phase 1 LYPP sampling campaign showed a lower level of precision than that obtained in the method development phase, with RSD on replicate injections of samples of 10–60%, dependent on sample type.
Further investigation into the impact of the matrix on instrumental precision is required, as is an improvement in detection limits suitable for process assessment. Importantly, the method would also be required to deliver under a matrix containing sulfamic acid used for treatment of impinger samples. We therefore decided that the additional funding required to support new method developments was outside the scope of the current project, and hence that other contract laboratories would be used to complete the nitrosamines analytical requirement in Phase 2.
5.5.3 ADVANCED ANALYTICAL AUSTRALIA – DETERMINATION OF N-NITROSOMORPHOLINE AND N-NITROSODIETHANOLAMINE BY LIQUID CHROMATOGRAPHY TANDEM MASS SPECTROMETRY
AAA were contracted to develop a method for the determination of NMor and NDELA in process solutions using LCMSMS. Their method was based on Zhao et.al (2006) for LC-tandem-MS analysis of nitrosamines in drinking water. Various solid-phase extraction techniques were tested by AAA in the initial stages of the development to improve trace-level detectability, but recoveries in the presence of MEA were unsatisfactory, particularly for the more volatile compounds NDMA and NDEA. The final methodology was directed towards the less volatile nitrosamines (NMor and NDELA) and used direct injection of aqueous samples, with dilution for high MEA concentrations, for determinations by LCMSMS. The instrumental systems incorporated both low and high-resolution instruments (Varian 212 LC with Varian-320 triple quadrupole LCMSMS and Agilent ultra-high pressure LC coupled to an ABSCIEX QTRAP 5500 triple quadrupole–linear ion trap mass spectrometer). The latter system (UPLCMSMS) provided higher levels of chromatographic resolution, sensitivity and mass accuracy. These systems were operated using electrospray ionisation in positive ionisation mode and tandem mass spectrometry (MSMS) was used to monitor characteristic ion transitions under MRM experiments. Isotopically labelled internal standards of each target analyte were added to all samples and used for quantitation.
AAA’s validation work was comprehensive and aspects of this are discussed in the review that follows. They also covered a number of analytical aspects affecting analyte stability, such as bulk MEA, pH, storage temperature, light and storage vial materials. The full report of their work can be found in AAA Technical Report 2 in Appendix B .
Review of the LCMSMS methodology for analysis of N-nitrosomorpholine and N-nitrosodiethanolamine in process samples
Results from UPLCMSMS analysis supplied by AAA for NMor and NDELA in samples from Phase 1 were reviewed regarding the method’s amenability to process sampling. Matrix effects are a commonly recognised limitation of LCMS techniques, due to signal enhancement or suppression that affects its qualitative and quantitative accuracy. Testing and monitoring for matrix effects were undertaken

Assessing Atmospheric Emissions from Amine-based CO2 Post-Combustion Capture Processes and their Impacts on the Environment – A Case Study
Volume 1: Measurement of emissions from a monoethanolamine-based post-combustion capture pilot plant | 59
throughout the method development using samples from Tarong PCC plant, and in the Phase 1 analytical work from the LYPP sampling campaign. Matrix effects were found to affect recoveries when the sample matrix was spiked with the target compounds in the early stages of work for both NDELA and NMor, and are described in AAA's Technical Report 2 included in Appendix B .
Additionally, an unknown compound present in a particular sample had a similar elution time to NDELA, and under MRM, also had similar transitions. Various LC and MS iterations were used to determine if adduct formation was occurring, and to positively confirm the existence of this compound and its mass, as detailed in AAA's Technical Report 2 (Appendix B ). Without this rigorous validation and informed observation, a false positive or overly high result for the target analytes could be inaccurately ascertained. The use of HPLC, high-resolution MS, isotopically labelled internal standards, analyte spikes, careful evaluation of MRM transitions, an awareness of sample complexity and of interactions under electrospray ionisation all assisted in addressing this issue and ensured quantitative accuracy of the LCMSMS technique.
Results from Phase 1 recovery testing, using native standard spikes added post-sampling, were around 100% for NDELA. This indicated that matrix effects had been overcome and that the MRM transition used for quantitation of NDELA was accurate. However, this was not the case for analysis of NMor, where 5–7-fold higher spike concentrations were initially found. Due to the low pH from sulfamic acid and H2SO4 treatment during collection, the samples were adjusted to higher pH and reanalysed. Improved (but still high) recoveries were obtained, indicating that pH adjustment may also play a part. The use of a second MRM transition was also checked, and this result was consistent with that from previous MRM quantification. On the basis that ions in the matrix were causing signal enhancement, a 10-fold dilution was tested, returning recoveries to around 100%. This indicated that adduct formation was occurring in undiluted liquids, due to treatment components or other components (e.g. ammonia) in the samples, or their combination in the mobile phase. Further testing revealed that signal suppression was occurring at the mass used for quantitation of the labelled internal standard, which did not affect the mass used for the analyte. Further work was undertaken to evaluate this problem in sulfamic acid-treated, untreated, and ammonia-affected samples from LYPP. Along with the required level of dilution, a standard spike methodology was implemented that routinely tested for this issue, as described in Technical Report 2 provided by AAA (Appendix B ). Results from Phase 2 sampling, which included field spike testing, further confirmed the accuracy of the LCMSMS methodology.
Results from method proficiency testing undertaken during analysis of Phase 2 samples determined a sample precision of ±10–20% RPD from duplicate analysis of sample preparations. This was dependent on sample type and analyte, with a precision around 5–10% obtained for some samples. The highest RPD tended to be found for solvent solutions (average ±37% RPD for NDELA; n=3) and is likely to be due to the inherent effect of the matrix on LCMS response. This somewhat affects reproducibility in actual samples. Higher precision, around ±5% RSD, was obtained for replicate analysis of standard solutions. An isotopically labelled internal standard was used for each compound, to correct for response difference due to matrix effects in the sample compared with the standard solution and to improve the accuracy of the result. Standard spikes of a native compound were added to every sample to determine analyte recovery and assess method accuracy. Similar recoveries were obtained for process solutions and solvent, so the average is reported here (n=12); 80% recovery for NMor and 98% for NDELA, which was considered acceptable. However, recoveries ranged from 60–91% for NMor and 72–140% for NDELA, indicating a level of uncertainty in the result. This is not unexpected when variable matrices are exposed to the LCMS technique, and is a consequence not always ameliorated by the use of isotopically labelled internal standards, particularly when the sample is not amenable to a purification step.
Further optimisation of the methodology improved its sensitivity from that obtained during Phase 1. In Phase 2, elimination of the requirement for MEA dilution meant that an MDL of 1 µg/L for NMor and NDELA applied to the process solutions: an improvement of 2-fold in impinger solutions and 50-fold for water wash solutions. Solvent solution was established at a level of 100 µg/L after accounting for dilution. The limit of reporting is stipulated at 2.5x that of the MDL. Under nominal conditions of sampling, the MDL for impinger solutions equates to a detection limit of 0.1 µg/Nm3 (ppbv) for NMor and NDELA in the gas phase. (For simplicity, an average gas-phase detection limit is reported, because this is within 15% of that under exact sampling parameters used at the absorber outlet and water wash outlet.)

Assessing Atmospheric Emissions from Amine-based CO2 Post-Combustion Capture Processes and their Impacts on the Environment – A Case Study
60 | Volume 1: Measurement of emissions from a monoethanolamine-based post-combustion capture pilot plant
Overall, this method achieved a high level of sensitivity and proven accuracy for analysis of higher nitrosamines in various types of process solution. This renders it a highly acceptable method, which provides results that cater well for the intended use of the data in the evaluations undertaken in this project and allows assessment of process gas emissions to the atmosphere at the pptv level. In solvent solution, where DELA was found in quite high concentrations, NDELA was also seen at lower and consistent relative concentrations. This demonstrates the usefulness of this method for simultaneous analysis of these often-related compounds in the PCC process scenario.
5.5.4 ASUREQUALITY – DETERMINATION OF VOLATILE NITROSAMINES BY GAS CHROMATOGRAPHY MASS SPECTROMETRY
AsureQuality is NATA-accredited for the determination of volatile nitrosamines by GCMS using US EPA standard method 521 for ‘Determination of nitrosamines in drinking water and using high resolution GC and tandem mass spectrometry (GCMSMS)’. The method is applicable to the full suite of US EPA priority volatile nitrosamines, which includes the volatile nitrosamines targeted in this study (NDMA, NDEA and NMor). NDELA is not applicable to this method of analysis, due to its lower volatility and higher polarity. While AsureQuality maintained that the method would be suitable for application to PCC process solutions, specific method proficiency testing over and above that routinely implemented was recommended for inclusion with the analysis of the process samples.
A description of the methodology used for analysis of Phase 1 samples is included in Appendix B (AsureQuality Technical Report), along with its optimisation specific to the requirements of PCC process samples. In brief, sample analytes were isolated from the aqueous sample using the technique of solid-phase extraction, followed by their extraction and concentration into a solvent suitable for analysis using GC-high-resolution-MS. As with other methods, the high levels of MEA in the sample matrix proved challenging, and dilution was required for certain samples to ensure efficiency of both the solid-phase extraction and instrumental procedures. All efforts were focused on maximising the sensitivity of the methodology.
Review of the GCMS methodology for analysis of volatile nitrosamines in process samples
In proficiency testing using process samples from Phase 1, the method delivered sample-specific detection limits of 1–5 µg/L (ppb) for NDMA and NDEA and 10–20 µg/L for NMor, with a qualification that ‘matrix interferences may affect the quantification limits obtained’. Nitrosamine results from analysis of Phase 1 samples showed that levels of NMor in solvent samples were close to the detection limit. Consequently, impinger and other process solutions showed levels less than the detection limit. NDEA was also not detected, and NDMA was seen at similar levels in most process and solvent solutions, which indicated the presence of a background artefact. Method proficiency data also showed recoveries as low as 20% for the isotopically labelled internal standards. On request for further information, AsureQuality revealed that variable recoveries of native standard spikes were also apparent, despite correction using the internal standard.
Based on these rather inadequate results, AsureQuality undertook to improve their methodology to eliminate background contamination and increase the efficiency and sensitivity of the method. This work is described in their Technical Report in Appendix B . The low recoveries encountered in the iteration of the methodology used in Phase 1 were found to be related to the extraction phase, and modification of the volume of solid-phase extraction elution solvent improved recoveries. This modification in turn required confirmation that the additional elution volume did not significantly affect the background levels of analytes. This was undertaken using samples from Phase 2, when sufficient sample volume could be supplied, using various sample types (Impinger 1, Impinger 3, water wash and solvent). While the recovery of the internal standard is not critical for this method, because the isotope dilution technique corrects for recovery, it is advantageous to optimise the efficiency of all aspects of the technique. The improved methodology was shown to deliver a recovery of 50 to 80%, dependent on process solution and analyte.
The sensitivity of the methodology was also improved. A reduction in the dilution requirement for solvent yielded a limit of detection of 100 µg/L for NDMA and NDEA and 200 µg/L for NMor. In process solutions,

Assessing Atmospheric Emissions from Amine-based CO2 Post-Combustion Capture Processes and their Impacts on the Environment – A Case Study
Volume 1: Measurement of emissions from a monoethanolamine-based post-combustion capture pilot plant | 61
20–100-fold improvements in sensitivity provided detection limits of 0.05 µg/L for NDMA and NDEA, and 0.1 µg/L for NMor. From impinger solutions, these levels deliver 6 ng/Nm3 for NDMA and NDEA, and 12 ng/Nm3 NMor (~pptv) detection limits for the process gas, under nominal sampling conditions (averaged for absorber outlet and water wash outlet).
The high level of sensitivity provided by the AsureQuality methodology for volatile nitrosamines is considered more than adequate in meeting the requirements of trace-level analysis for process and environmental assessment in this project.
5.6 Carbonyls (aldehydes and ketones)
5.6.1 SGS LEEDER CONSULTING – DETERMINATION OF CARBONYL COMPOUNDS BY IN-SITU DERIVATISATION AND LIQUID CHROMATOGRAPHY
The collection and determination of aldehydes (formaldehyde, acetaldehyde and acrolein) and ketones (acetone) was made according to standard US EPA protocols for impinger-loaded liquid collection (US EPA Method 0011) incorporating in-situ 2,4 dinitrophenylhydrazine (DNPH) derivatisation and analysis using high performance liquid chromatography (HPLC) (US EPA Method 8315). EML Pty Ltd were initially contracted to supply reagent solutions and perform the analysis. The inclusion of acetone as a target analyte by the review team required that SGS Leeder Consulting were also contracted, and their analysis was used in phases 1 and 2. The analysis of acrolein was included purely on the basis that its chromatographic resolution from acetone was assured.
The aldehyde compounds are water soluble and highly reactive, so the method uses in-situ derivatisation to trap and stabilize these compounds. The agent used for derivatisation is DNPH, which provides high-level sensitivity for analysis of the derivatised carbonyl compound, as a chromophoric hydrazone, using UV or diode array detection. The derivatives are extracted from DNPH-treated solutions using dichloromethane and solvent exchanged into acetonitrile in preparation for reverse-phase HPLC analysis.
Review of DNPH derivatisation HPLC methodology for analysis of carbonyls in process samples
The analysis of carbonyl compounds in samples from Phase 1 of the campaign revealed some irregularities in the results from a sampling perspective. Leeder subsequently performed a range of testing to investigate these irregularities, which are discussed fully in Section 4.3.2. As part of the development of the sampling protocol, an organic phase was included in the impinger charge solution to improve the collection efficiency of the US EPA 0011 method, as also described in Section 4.3.2.
Based on the method proficiency data provided by Leeder in Phase 1, the method delivered adequate analytical precision and spike recoveries for the target compounds. Precision of ± 6% RPD was determined based on duplicate preparations of a method blank spiked with the target compounds, and an average ±20% RPD was determined for analysis of duplicate preparations of an impinger sample. Spike recoveries into blank sample solution were close to 100%. Leeder reported to a practical quantitation limit of 10 µg as the mass collected to the impinger which, for comparative purposes, is equivalent to 2 µg as a detection limit based on a 5-fold difference. In the samples taken for analysis in Phase 2, this provided a detection limit of around 60 mg/L in solvent and 30 mg/L in process solutions. For impinger solutions, this provided a detection limit in the process gas of 1.3 µg/Nm3 under nominal sampling parameters. From an analytical perspective, the DNPH/HPLC method provided acceptable levels of proficiency and a level of sensitivity that made it suitable for process assessment and its continued use into Phase 2.
One important aspect of in-situ capture using DNPH derivatisation is the maintenance of an acidic medium during collection, because the derivatisation reaction is acid catalysed. As such, the efficiency of reaction will be compromised under alkaline conditions. The impinger solutions were therefore maintained under acidic pH; however, this requirement can present challenges under the conditions of MEA buffering and ammonia basicity to which the solutions are exposed under PCC process conditions, as is discussed in Section 4.3.2.

Assessing Atmospheric Emissions from Amine-based CO2 Post-Combustion Capture Processes and their Impacts on the Environment – A Case Study
62 | Volume 1: Measurement of emissions from a monoethanolamine-based post-combustion capture pilot plant
The use of an acid buffer in place of direct acidification as a component of the impinger charge solution is an analytical development for consideration in future work. A second item for future consideration is developments using a capture solution in which the derivatisation agent is amenable to highly alkaline conditions.
Yet another issue for PCC process collection is the maintenance of analyte integrity and stability under acidified conditions. As discussed in Section 4.3.2, the in-situ generation of aldehydes in the presence of imine degradation products of MEA is an issue of importance using the acidified DNPH technique. Until this aspect of the collection and analytical methodologies is fully investigated, analyte integrity under these conditions is in question. Hence, we cannot know whether the measured concentrations accurately reflect the original concentrations in the liquid and gas phase.
5.7 Anions
5.7.1 CSIRO ANALYTICAL FACILITY – DETERMINATION OF ANIONS BY ION CHROMATOGRAPHY
As mentioned in the Interim report, CSIRO laboratories at Newcastle had previously developed an IC method for the analysis of anions in aqueous MEA matrices. However, it became apparent that they were no longer able to provide assistance in this aspect of the work.
Accordingly, the North Ryde facility undertook to commission a method for the determination of anions using their IC instrumentation. The anion of priority in this project is formate; however, the previous method reported this compound combined with acetate, glycolate and propionate. Method development therefore focused on this separation as well as including a broader suite of anions relevant to those likely to be found in a PCC process. The method used an instrumental system as described for cation analysis in Section 5.1.1, with components specific to the anion methodology. These changes were the use of an AS11-HC (2 mm x 250 mm) anion-exchange column operated under a gradient elution of potassium hydroxide mobile phase. The method successfully separated formate from other species, and a further suite of anions were determined: glycolate (plus acetate), propionate, formate, nitrate, fluoride, chloride, sulphate and oxalate.
The optimum pH of samples for the anion analysis was found to be within the range of 7–10. Minimisation of cations in solution is required for efficient operation of the continuously regenerating cation trap. Where these conditions were met, samples were analysed directly, or diluted in the case where high levels of MEA or ammonia were expected. Typically, a 50-fold dilution was used for MEA solvent solutions. Analytes were quantified by the external standard technique using standards prepared from pure compound over the calibration range of 0.1–20 mg/L. Linearity was determined for each compound from least squares regression analysis, which resulted in a value for the square of the correlation coefficient, r2, of >0.99 (average for all compounds).
The method achieved an instrument detection limit of 0.1 mg/L, which for undiluted impinger samples, is equivalent to 13 µg/Nm3 at the absorber outlet and 9 µg/Nm3 at the water wash outlet under nominal gas phase sampling parameters. The detection limit for anions measured in the diluted solvent solution was 5 mg/L. Instrumental precision of ±7% RSD was determined from replicate injection of standard compounds (average of all compounds) at a nominal concentration of 10–50x the detection limit. Analytical precision, based on duplicate analysis of two separate sample preparations of solvent solution, ranged from 2–13% dependent on compound and averaged ±9% RPD.
Review of the ion chromatography methodology for analysis of anions in process samples
Levels of most anions were low in process samples, the most significant being formate. Some irreproducibility is expected at such low levels. Solvent solutions contained higher concentrations, enabling the full suite of anions to be determined. Due to the limited data set, no useful comment can be made on

Assessing Atmospheric Emissions from Amine-based CO2 Post-Combustion Capture Processes and their Impacts on the Environment – A Case Study
Volume 1: Measurement of emissions from a monoethanolamine-based post-combustion capture pilot plant | 63
the robustness of the method for process samples. However, it generally appears that the IC method provides useful information, with adequate sensitivity for process assessment.
5.8 Metals
5.8.1 UNIVERSITY OF NEW SOUTH WALES ANALYTICAL SERVICES CENTRE – DETERMINATION OF METALS BY INDUCTIVELY COUPLED PLASMA OPTICAL EMISSION SPECTROSCOPY
The Analytical Services Centre at the University of New South Wales (UNSW) were contracted for the analysis of trace metals (elements) in PCC solvent and liquids using inductively coupled plasma optical emission spectroscopy (ICP-OES). The elements of interest were Al, Ca, Cr, Cu, Fe, Ni, P, S, Si, V, and Zn. Little information was provided by the UNSW laboratory as to their methodology, and what was available was of a generic nature, and is outlined as follows. The samples were analysed using a Perkin Elmer Optima 7300 ICP-OES, which is able to detect more than 5000 emissions lines from 167 to 782 nm, and performs simultaneous background measurement for around 60 elements. Precision of around 2% RSD is typically obtained. The ICP-OES instrumental analysis is considered a ‘linear’ technique with detection limits in the high ppb/low ppm range. As such, single-point external standard calibration was performed for the compounds of interest using National Institute of Standards and Technology traceable standard solutions.
Samples from Phase 2 campaign were collected and immediately acidified with nitric acid at a concentration that held the pH to <2 for all sample types. Highly alkaline solutions will attack glass and cause artefactual formation of some elements, particularly silica and also sodium and calcium. Samples were therefore stored in polycarbonate vials to ensure sample integrity. All process solutions and the water wash liquid were analysed undiluted. Solvent was diluted 10-fold to reduce the viscosity of the solution and provide consistent nebulisation to ensure a clean and reproducible signal.
The possible impact of the process sample matrix on the quality of the result was assessed using a standard spike to each process sample. For the 12 target species measured in the process solutions, an average recovery of 100.4% was obtained with %RSD on the recovery of ±1 %. In water wash and solvent liquids, an average 98.8% recovery was obtained with slightly higher RSD of ±5.8%. Instrumental detection limits of 0.02 to 0.1 mg/L (ppm) were obtained, dependent on element, which also applied as the MDL in undiluted impinger solutions and water wash. This equates to a gas phase MDL of 2.3 to 12 µg/Nm3 (5 µg/Nm3 average all elements) under nominal sampling conditions (absorber outlet and water wash outlet parameters are within 15% of the average). An MDL of 0.2 to 1 mg/L applied to MEA solvent solutions. The limit of reporting is stated at 10x MDL.
Review of the ICP-OES methodology for analysis of metals in process samples
The method proficiency data provided by UNSW, although limited, indicated that the ICP-OES method was suitable for analysis of trace metals in these matrices. The results showed levels in solvent well above the MDL, and as such, the method provided useful information for this solvent assessment. Concentrations in process solutions were close to, or below, the MDL for most elements. Therefore, a more sensitive ICP method could be considered. ICP with MS would provide 1000x higher sensitivity (ppt level) under ideal circumstances; however, this technique may be more significantly affected by the MEA matrix.
Assessing Atmospheric Emissions from Amine-based CO2 Post-Combustion Capture Processes and their Impacts on the Environment – A Case Study
64 | Volume 1: Measurement of emissions from a monoethanolamine-based post-combustion capture pilot plant
5.9 Summary performance of the analytical methods for PCC process assessment
The analytical methods implemented for the target compounds monitored in Phase 2 of the PCC process assessment are listed in Table 15. The sensitivity limits of each method are tabulated as: an instrumental detection limit, a concentration in the various process liquids, and, for impinger collected samples, a concentration in the process gas stream. Based on the method's sensitivity, selectively and accuracy, as has been discussed in the previous sections, the overall performance of each method for application to PCC process assessment is summarised in Table 16.
For most methods, sensitivity limits suitable for process assessment were achieved (determined as ppm (mg/L) in the liquid phase and ppbv (µg/Nm3) in the gas phase). The lower sensitivity of the GC method for MEA, and IC method for diethanolamine, rendered them suitable for screening assessment only. In the case of amides, the method implemented was too insensitive to make it useful in any assessment of process samples.
Of superior performance were the methods developed by Advanced Analytical Australia (AAA) for diethanolamine and the higher nitrosamines (N-nitrosodiethanolamine and N-nitrosomorpholine), and by AsureQuality for alkylamines and the volatile nitrosamines. The pptv (ng/Nm3) sensitivity limits in the process gas make these methods suitable for trace level environmental assessment.

Table 15. Analytical methodologies and sensitivity limits for priority compounds in post-combustion capture process solutions from Phase 2 assessment
Process detection limits (nominal)
Compound Instrumental and preparative methodologies
Max. MEA concentration
(% v/v)
Instrument detection limit
(mg/L)
Limit of reporting
Solvent liquid (mg/L)
Water wash liquid (mg/L)
Gas stream (µg/Nm3) (~ppbv)
Monoethanolamine IC – Direct 0.1 0.1 5x DL Not relevant 2.5 10–300
GCFID - Direct 0.03 10 5x DL Not relevant 50 1000–4000
Diethanolamine IC – Direct 0.1 0.2 5x DL 120 0.55 30–65
LCMSMS - Direct 0.3 0.001 2.5x DL 0.1 0.001 0.1
Ammonia IC – Direct 0.1 0.1 5x DL 60 4.0 10–30
GCMS - BSC Derivatisation 1.5 Not stated 5x DL 80 4.0 470
Alkylamines GCMS PFBAY Derivatisation
1.5 MA 0.08 EA 0.02
5x DL MA 1.5 EA 0.4
MA 0.06 EA 0.008
MA 5 EA 0.7
GCMS BSC Derivatisation
3 Not stated 5x DL MA 0.4 EA 0.16
DMA, DEA 0.08
MA 0.02 EA 0.008
DMA, DEA 0.004
MA 2 EA 1
DMA, DEA 0.5
Amides GCMS - Direct 3 FA 0.5 AC 0.3
5x DL FA 5 AC 3
FA 0.5 AC 0.3
FA 60 AC 40
Carbonyls HPLC - DNPH Derivatisation
Not relevant Not stated 5x DL All targets 60 All targets 30 All targets 1
Anions IC – Direct 0.6 0.1 5x DL All targets 5 All targets 0.1 All targets 11
Metals ICPOES - Direct Not relevant 0.02–0.1 10x DL 0.2–1 0.02–0.1 2–12
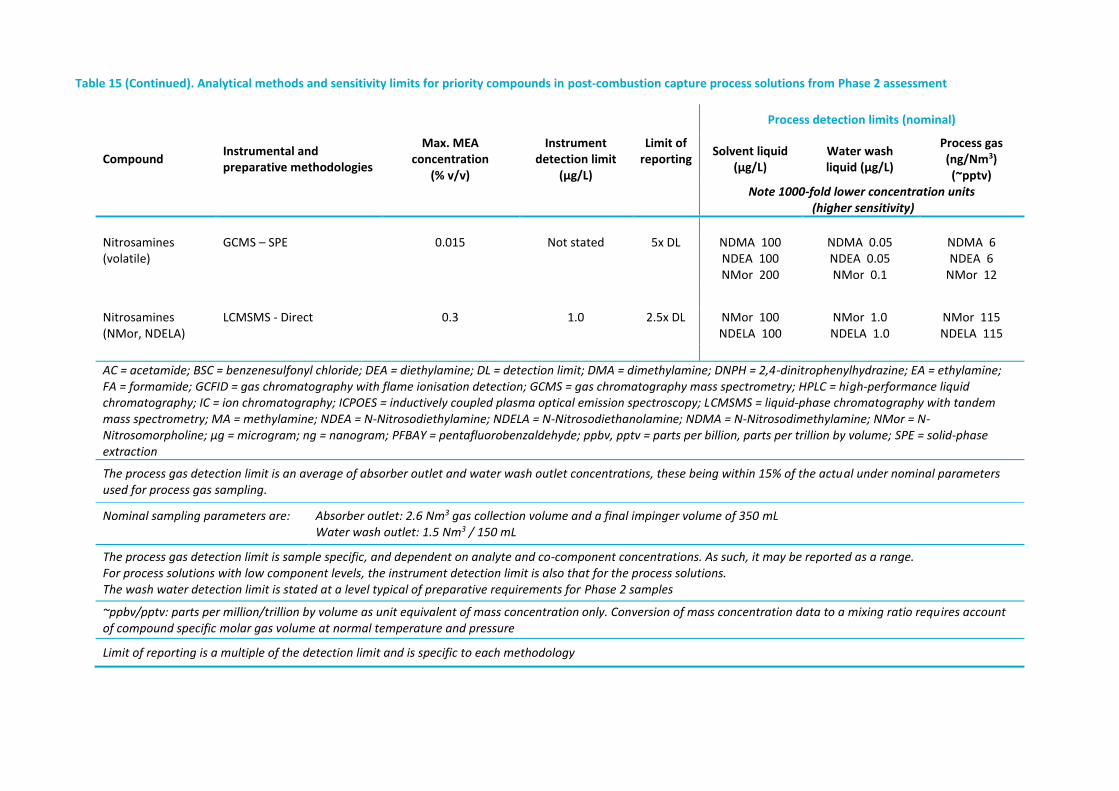
Table 15 (Continued). Analytical methods and sensitivity limits for priority compounds in post-combustion capture process solutions from Phase 2 assessment
Process detection limits (nominal)
Compound Instrumental and preparative methodologies
Max. MEA concentration
(% v/v)
Instrument detection limit
(µg/L)
Limit of reporting
Solvent liquid (µg/L)
Water wash liquid (µg/L)
Process gas (ng/Nm3) (~pptv)
Note 1000-fold lower concentration units
(higher sensitivity)
Nitrosamines (volatile)
GCMS – SPE 0.015 Not stated 5x DL NDMA 100 NDEA 100 NMor 200
NDMA 0.05 NDEA 0.05 NMor 0.1
NDMA 6 NDEA 6
NMor 12
Nitrosamines (NMor, NDELA)
LCMSMS - Direct 0.3 1.0 2.5x DL NMor 100 NDELA 100
NMor 1.0 NDELA 1.0
NMor 115 NDELA 115
AC = acetamide; BSC = benzenesulfonyl chloride; DEA = diethylamine; DL = detection limit; DMA = dimethylamine; DNPH = 2,4-dinitrophenylhydrazine; EA = ethylamine; FA = formamide; GCFID = gas chromatography with flame ionisation detection; GCMS = gas chromatography mass spectrometry; HPLC = high-performance liquid chromatography; IC = ion chromatography; ICPOES = inductively coupled plasma optical emission spectroscopy; LCMSMS = liquid-phase chromatography with tandem mass spectrometry; MA = methylamine; NDEA = N-Nitrosodiethylamine; NDELA = N-Nitrosodiethanolamine; NDMA = N-Nitrosodimethylamine; NMor = N-Nitrosomorpholine; µg = microgram; ng = nanogram; PFBAY = pentafluorobenzaldehyde; ppbv, pptv = parts per billion, parts per trillion by volume; SPE = solid-phase extraction
The process gas detection limit is an average of absorber outlet and water wash outlet concentrations, these being within 15% of the actual under nominal parameters used for process gas sampling.
Nominal sampling parameters are:
Absorber outlet: 2.6 Nm3 gas collection volume and a final impinger volume of 350 mL Water wash outlet: 1.5 Nm3 / 150 mL
The process gas detection limit is sample specific, and dependent on analyte and co-component concentrations. As such, it may be reported as a range. For process solutions with low component levels, the instrument detection limit is also that for the process solutions. The wash water detection limit is stated at a level typical of preparative requirements for Phase 2 samples
~ppbv/pptv: parts per million/trillion by volume as unit equivalent of mass concentration only. Conversion of mass concentration data to a mixing ratio requires account of compound specific molar gas volume at normal temperature and pressure
Limit of reporting is a multiple of the detection limit and is specific to each methodology
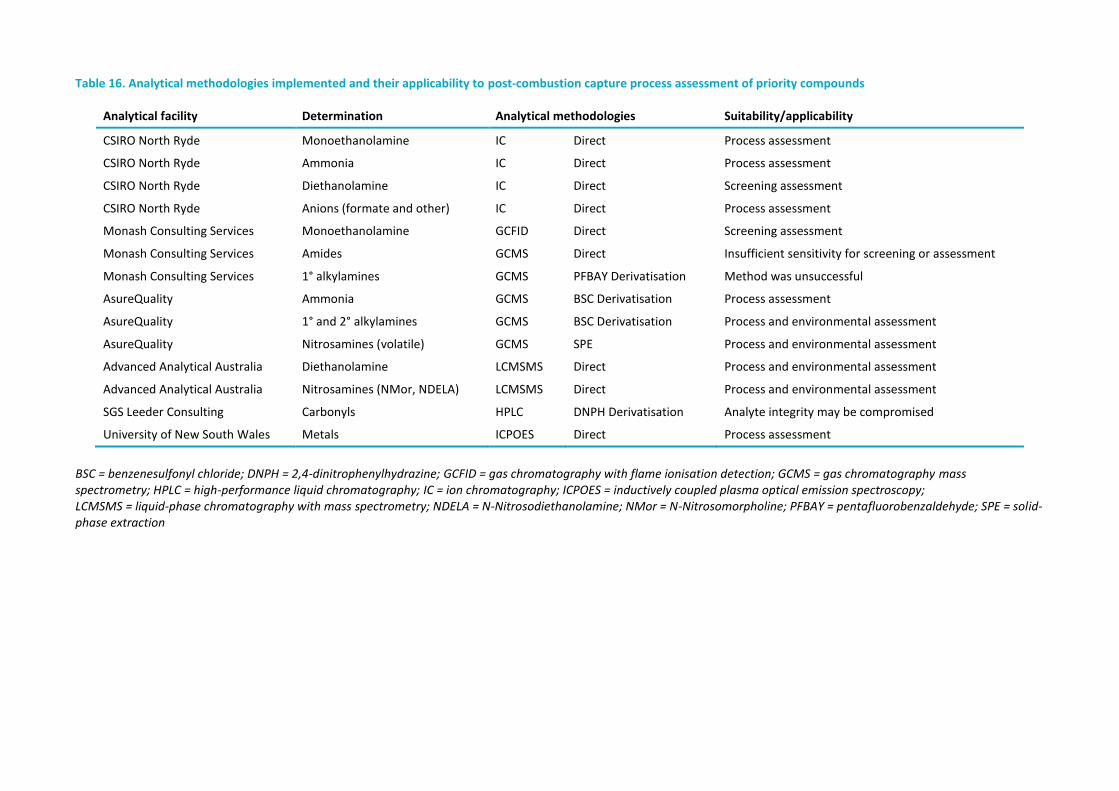
Table 16. Analytical methodologies implemented and their applicability to post-combustion capture process assessment of priority compounds
Analytical facility Determination Analytical methodologies Suitability/applicability
CSIRO North Ryde Monoethanolamine IC Direct Process assessment
CSIRO North Ryde Ammonia IC Direct Process assessment
CSIRO North Ryde Diethanolamine IC Direct Screening assessment
CSIRO North Ryde Anions (formate and other) IC Direct Process assessment
Monash Consulting Services Monoethanolamine GCFID Direct Screening assessment
Monash Consulting Services Amides GCMS Direct Insufficient sensitivity for screening or assessment
Monash Consulting Services 1° alkylamines GCMS PFBAY Derivatisation Method was unsuccessful
AsureQuality Ammonia GCMS BSC Derivatisation Process assessment
AsureQuality 1° and 2° alkylamines GCMS BSC Derivatisation Process and environmental assessment
AsureQuality Nitrosamines (volatile) GCMS SPE Process and environmental assessment
Advanced Analytical Australia Diethanolamine LCMSMS Direct Process and environmental assessment
Advanced Analytical Australia Nitrosamines (NMor, NDELA) LCMSMS Direct Process and environmental assessment
SGS Leeder Consulting Carbonyls HPLC DNPH Derivatisation Analyte integrity may be compromised
University of New South Wales Metals ICPOES Direct Process assessment
BSC = benzenesulfonyl chloride; DNPH = 2,4-dinitrophenylhydrazine; GCFID = gas chromatography with flame ionisation detection; GCMS = gas chromatography mass spectrometry; HPLC = high-performance liquid chromatography; IC = ion chromatography; ICPOES = inductively coupled plasma optical emission spectroscopy; LCMSMS = liquid-phase chromatography with mass spectrometry; NDELA = N-Nitrosodiethanolamine; NMor = N-Nitrosomorpholine; PFBAY = pentafluorobenzaldehyde; SPE = solid-phase extraction

Assessing Atmospheric Emissions from Amine based CO2 PCC Process and their Impacts on the Environment – A Case Study
68 | Volume 1: Measurement of emissions from a MEA-based PCC pilot plant
5.10 Analytical conclusions and recommendations
Method proficiency testing is an important component of new method development, especially when an existing validated method is applied to new sample types. The extensive development and validation work required for this project has made it apparent that standard methodologies cannot be simply applied to PCC process samples. The various analytical facilities undertook rigorous and informed method evaluations, and some provided extensive accounts of their developments, optimisations and the validation data obtained. The precision of the analysis was normally provided as a statistical determination from replicate standard analysis, as that from duplicate sample analysis, and from analysis of samples spiked with standard compounds; the latter also provided a level of accuracy assessment. In some laboratories, these determinations made the inadequacies of the method obvious when it was applied to PCC process samples. For certain compounds, the use of more than one methodology for determinations from the same sample provided valuable information over and above that concluded from proficiency testing. Areas of particular concern are the sampling conditions and analytical methodologies used for collection and determination of ammonia and of carbonyl compounds, where inconsistencies and irregularities were observed. The methodology implemented for amide determination was found unsuitable for trace-level analysis in MEA matrices, and an alternative method requires development.
For most methods, sensitivity limits suitable for process assessment were achieved (determined as ppm in the liquid phase and ppbv (µg/Nm3) in the gas phase). Of superior performance were the methods developed by Advanced Analaytical Australia (AAA) for diethanolamine and the higher nitrosamines, and by AsureQuality for alkylamines and the volatile nitrosamines, where pptv (ng/Nm3) sensitivity limits in the process gas make these methods suitable for trace-level environmental assessment.
We also requested the measurement of analytical uncertainty. Some laboratories complied with this request; others required further financing due to the requirement for extensive further testing for newly developed methods to obtain statistically relevant data. It must be stressed that the analytical aspect is only one component of the full method of uncertainty measurements for projects of this kind, where the accumulation of error from all components must be accounted for, including those associated with both sampling methodology and plant operation. Variation in these latter elements generally far outweighs analytical error and contributes significantly to total uncertainty of the results obtained.
Overall, a comprehensive set of analytical techniques have been assessed for the determination of a large suite of priority compounds in PCC process solutions using samples collected from the AGL LYPP. These analytes, and the matrices in which they must be analysed, have proven challenging in all aspects of their collection, preparative and instrumental methodologies to ensure stable, sensitive, selective and accurate quantitative assessment. While the analytical work has proven successful in most applications, we recommend further validation of these methods, using both process and synthetic samples. This will help fully complete a suite of methodologies that effectively and efficiently address the large number of compounds targeted, the complexity of the various sample matrices, and in turn, the analytical and instrumental techniques applied. The consideration of ‘fit-for-purpose’ is important in projects of this kind, where the intended use and relevance of analytical data is fully ascertained so that methodology can effectively target a specific goal.
The knowledge and experience gained from this work has been extensive, and significantly improves the status of analytical approaches to PCC process assessment.

Assessing Atmospheric Emissions from Amine based CO2 PCC Process and their Impacts on the Environment – A Case Study
Volume 1: Measurement of emissions from a MEA-based PCC pilot plant | 69
6 Emissions Results
This section presents the concentrations of target compounds measured in process liquors and gas streams, collected as described in Section 4 and analysed as described in Section 5, for Phase 2 of the sampling campaign at LYPP. These data are significantly influenced by the operational issues of the pilot plant at the time, as identified in Section 2. As a result, it was necessary to add 120 litres of MEA 600+ solvent to LYPP to maintain plant operation. The 600+ solvent was from the same bulk storage container that was initially used to charge the plant. We expect that the addition of this solvent has significantly diluted the concentration of target analytes prevailing in the solvent before the plant failures.
Table 17 presents the measured concentrations of target compounds in process liquors and at the sampled points of the process gas stream.
Table 17. Concentrations of priority compounds in process liquors and in process gas streams
Concentration
mg/L mg/Nm3
Compound Laboratory/analytical methodology
Solvent liquor
Water wash liquor
Inlet gas stream
Absorber outlet
Water wash outlet
Monoethanolamine
CSIRO North Ryde
IC 28% w/v 4753 ND 269 ND
Monash Univ. Consulting
GCFID 26% w/w 4800 ND 356 ND
Diethanolamine CSIRO North Ryde
IC ND ND ND 0.5 ND
Advanced Analytical Aust.
LCMSMS 14 ND ND ND ND
Ammonia CSIRO North Ryde
IC 125 778 ND 116 180
AsureQuality
Derivatisation - GCMS 757 2000 ND 291 320
Methylamine AsureQuality
Derivatisation - GCMS ND ND ND 1.3 0.068
Ethylamine " ND ND ND 0.12 0.009
Dimethylamine " ND ND ND 0.026 0.003
Diethylamine " ND ND ND ND ND
Nitrosodimethylamine AsureQuality
SPE GCMS ND 1.1 µg/L ND ND ND
Nitrosodiethylamine " ND ND ND ND ND
Nitrosomorpholine AsureQuality
SPE GCMS 16 µg/L 6.4 µg/L ND 0.32 µg/Nm3 0.04 µg/Nm3
Advanced Analytical Aust.
LCMSMS ND ND ND 0.36 µg/Nm3 ND
Nitrosodiethanolamine " 2.8 mg/L ND ND ND ND

Assessing Atmospheric Emissions from Amine based CO2 PCC Process and their Impacts on the Environment – A Case Study
70 | Volume 1: Measurement of emissions from a MEA-based PCC pilot plant
Concentration
mg/L mg/Nm3
Compound Laboratory/analytical methodology
Solvent liquor
Water wash liquor
Inlet gas stream
Absorber outlet
Water wash outlet
Formaldehyde SGS Leeder Consulting
DNPH HPLC ND 2.2 ND 0.1 0.08
Acetaldehyde " 0.4 0.5 ND 0.8 1.1
Acrolein " ND ND ND ND ND
Acetone " ND 0.2 ND 0.4 0.6
Formamide Monash Univ. Consulting
GCMS ND ND ND ND ND
Acetamide " ND ND ND ND ND
Glycolate + Acetate " 132 0.36 ND ND ND
Propionate " 799 ND ND ND ND
Formate " 1485 ND ND 0.9 0.2
Nitrate " 656 ND ND ND ND
Fluoride " 4.0 ND ND ND ND
Chloride " 70 0.21 ND ND ND
Sulphate " 637 2.8 ND ND ND
Oxalate " 374 ND ND ND ND
Aluminium Univ. of NSW Analytical
ICPOES ND 2.3 0.009 ND ND
Calcium " 0.1 37 0.03 0.008 ND
Chromium " ND 3.8 ND ND ND
Copper " ND 2.1 ND ND ND
Iron " 0.13 205 0.03 ND ND
Nickel " ND 5.2 ND ND ND
Phosphorus " 0.1 9.5 0.03 0.02 ND
Sulphur " 1.0 888 5.1 0.04 ND
Silicon " ND 5.6 0.02 0.09 0.02
Vanadium " ND 0.5 ND ND ND
Zinc " 0.06 16.6 0.004 0.005 ND
DNPH = 2,4-dinitrophenylhydrazine; GCFID = gas chromatography with flame ionisation detection; GCMS = gas chromatography mass spectrometry; HPLC = high-performance liquid chromatography; IC = ion chromatography; ICPOES = inductively coupled plasma optical emission spectroscopy; LCMSMS = liquid-phase chromatography with tandem mass spectrometry; ND = Not detected at a concentration above the detection limit; SPE = solid-phase extraction
Detection limits are methodology and sample specific and are tabulated for each compound in the Analytical Performance Section 5.9.

Assessing Atmospheric Emissions from Amine based CO2 PCC Process and their Impacts on the Environment – A Case Study
Volume 1: Measurement of emissions from a MEA-based PCC pilot plant | 71
The dominant emission released from PCC operations at LYPP was ammonia, where concentrations in the order of 250 mg/Nm3 (ppmv) were determined in the process exit gas stream. Ammonia has been well documented as a product arising from MEA degradation, and its occurrence at larger concentrations is not unexpected, due to the operating conditions of LYPP. These ammonia data suggest that the deployed MEA solvent has degraded in the process. These results display a 10-fold increase in ammonia emissions compared with other studies, such as Knudsen et al. (2009), in which ammonia concentrations of 25 mg/Nm3 were observed during the ‘CASTOR’ project. However, the level of ammonia measured at LYPP is considered reasonable, due to the large O2 fraction (~10%) in the process gas. We expect that this level of O2 would increase the decomposition rate of MEA, resulting in greater ammonia concentrations. In addition, the small differences in ammonia concentrations before and after the water-wash section indicate that the water wash provided a negligible reduction in ammonia emissions. The LYPP does not run an acidified water wash. These data suggest that for ammonia emission control, additional or alternative clean-up technology that specifically targets ammonia will be required.
MEA concentrations of pilot plant liquors and emissions were determined using two different methods, as discussed in Section 5.1. Both MEA solvent and wash water results show good correlations between the two laboratories. The MEA solvent concentration was measured at 28% and 26% w/v, which is similar to the minimum prescribed MEA concentration for this project of 28% MEA w/w. The small difference in the results may be due to normal variation in sample collection and analysis, or as the result of increased uncertainty and variance in the day-to-day MEA determinations at the LYPP. These determinations, which involved an acid–base titration, became more difficult as the solvent aged, due to reduced sharpness in the equivalence point of the titration. This measurement, as well as the difficulty in operating the plant with a solvent of progressively increasing density and viscosity, proved to be a significant challenge for LYPP operations over the later period of this project.
MEA concentrations measured at the inlet to the water wash were in the order of 300 mg/Nm3. These results fall within the range of MEA concentrations measured by Kolderup et al. (2013), and provide confidence in the measurement and analytical techniques used in this study. MEA emissions at the outlet from the water wash showed a concentration less than the detection limit of ~0.3 mg/Nm3 (ppmv). This is a similar order of concentration to those of Kolderup et al. (2013) for the ‘CASTOR’ plant exit gas emissions. The LYPP results suggest that the plant’s water-wash section, which incorporates a demister, was operating efficiently during the sampling operation and can mitigate MEA emissions from PCC plants when the technology is optimised. The measured concentration of MEA in the exiting process gas stream is similar to measurements of Fujita et al. (2013) in which an amine concentration (for an unspecified amine solvent) in the order of 0.9 ppmv was measured using both manual sampling and proton transfer reaction-MS techniques.
DELA is often present as an impurity in MEA, but also can form during NOx oxidation of MEA (Fostås et al., 2011). These authors found similar concentrations of DELA in MEA samples exposed to NOx and O2 in the Amino™ test absorption rig to those found in the degraded solvent used in this study (14 mg/L). Note that the DELA result reported at ‘<DL’ (Table 17) was due to the significantly higher detection limit from IC methodology compared with that achieved using LCMSMS implemented by AAA (refer Section 5.9). DELA was not detected in the water wash, but its presence was indicated at the outlet of the absorber. It was not found after the water wash, indicating its effective removal before its emission from the exit flue.
The presence of DELA also provided a formation pathway for the generation of NDELA. While NDELA was found in the solvent liquor sample (at 2.8 mg/L), it was measured to be less than the detection limit in the water wash (<1µg/L) and both before and after the water wash positions (<0.1 µg/Nm3). The NDELA concentrations are also significantly lower than those reported by Kolderup et al. (2013). While the levels of nitrosamine are known to be dictated by the plant operating conditions and the age of the recycled solvent, the concentrations measured at LYPP may have been significantly influenced by solvent dilution. Although NDELA was less than the reported detection limits in the process gas emissions, this was not the case for NMor. NMor was measured at detectable, though small, concentrations after the water wash (0.04 µg/Nm3), and was also found in the solvent, water wash and at the absorber outlet. Since NMor is a more volatile, less soluble compound than NDELA, these results are not unexpected, and may suggest that the water-wash section is less effective in mitigating NMor emissions than NDELA emissions. The volatile

Assessing Atmospheric Emissions from Amine based CO2 PCC Process and their Impacts on the Environment – A Case Study
72 | Volume 1: Measurement of emissions from a MEA-based PCC pilot plant
nitrosamines, NDMA and NDEA, were generally not detected in the process liquors and the exit flue gas (< ppt level). This is not unexpected, because only negligible levels of their precursor alkylamines were measured.
The results presented in Table 17 show that MA, EA and DMA exist at measurable levels in both the before and after water wash gas streams, albeit at low ppbv levels. However, these analytes are not observed in either the MEA solvent or water wash liquor. This result suggests that these three compounds experience minimal retention within the PCC plant liquors and penetrate through the PCC process. This is not unexpected, since these compounds, while soluble in aqueous solutions, have low vapour pressures. Smaller concentrations of these compounds are observed at the outlet from the water-wash section than at the inlet. This observation, in addition to these compounds not being detected in the water wash liquor, suggests that the primary loss mode for these compounds may not be through the process gas pathway, but through pathways such as the stripper circuit. Further research is required to correctly define the loss pathway of these compounds.
The anions formate, oxalate and propionate, as well as glycolate and acetate, are decomposition products from PCC operation and can be observed in measureable concentrations in the MEA solvent. Formate, which is an important decomposition product from MEA degradation, is observed to be the dominant product (1500 mg/L in degraded solvent). Formate was present at low concentration in the gas stream from the absorber outlet (0.9 mg/Nm3). It was not detected in the water wash solution however some reduction was indicated by its presence in the exit gas stream at 0.2 mg/Nm3.
Metals are found at concentrations of less than the detection limit at the outlet of the absorber for all elements except silicon, the concentration of which (0.02 mg/Nm3) is considered negligible.
Measured emissions of acetaldehyde (around 1 mg/Nm3) suggest that it may penetrate through the water-wash section of a PCC plant. As discussed in Section 4.3.2, efficiently capturing carbonyl compounds using commercially available stack sampling impingers proved to be a challenging exercise. The development of a method to effectively capture acetaldehyde in an impinger train is considered pioneering work in the PCC area, and it is likely that these results will be widely applicable for carbonyl measurements at PCC plants. While the results for formaldehyde in Table 17 show that the water-wash section mitigates this analyte, this is not the case for acetaldehyde, suggesting that acetaldehyde is being formed or released in the water-wash section. This observation possibly arises from a shift in chemical equilibrium, which may be driven by the lowering of the MEA concentration in the water-wash section. Reaction pathways such as Schiff base formation may give rise to these results; however, significantly more research is needed in this area.
A number of potential air quality limits for commonly used amines for CO2 capture and for the produced nitrosamines have been proposed by (Lag et al., 2011). These values that are given below will be subject for more revision and validation when additional data will be made available.
MEA 10 µg/m3 MDEA 120 µg/m3
PZ 5 µg/m3 Nitrosamines 0.3 ng/ m3
AMP 6 µg/m3 Nitramines 0.3 ng/ m3
In the broader context of wider PCC deployment, more research in this area will iteratively progress and improve analytical techniques, as well as define robust standard methods for assessing emissions from PCC operations. However, the results from this study suggest that the emissions from PCC operations are manageable within the bounds of current mitigation technologies. Other than ammonia and acetaldehyde, all target species were found at concentrations as low as ppbv and pptv levels in the emission gas stream.
This project has significantly added to the body of sampling and analytical chemistry knowledge for PCC process assessment in Australia.

Assessing Atmospheric Emissions from Amine based CO2 PCC Process and their Impacts on the Environment – A Case Study
Volume 1: Measurement of emissions from a MEA-based PCC pilot plant | 73
7 Concluding Remarks
Emissions of the common CO2 capture solvent, MEA, have been measured at the Loy Yang PCC facility at the AGL Loy Yang coal-fired power plant. The development, implementation and refinement of sampling and analytical methodologies have been described, and their performance evaluated on a basis relevant to the PCC process. The levels of target species in process liquors and in process gas streams have been determined, and the process gas emissions exiting the plant have been assessed.
Sampling protocols for the location of sampling points and the withdrawal of gaseous samples were generally well defined and, with attention to specific flow characteristics of the plant, representative sample collection was mainly successful. However, we have identified a number of limitations in the methodologies for analyte collection, especially for the collection efficiencies for ammonia and the carbonyl compounds. The understanding of carbonyl compounds in PCC environments requires significant further work to explain the unusual behaviour observed for this class of compounds: a behaviour that may influence the effectiveness of the collection technique.
A fully validated sampling methodology would also include the assessment of sampling efficiency using in-line and gas-phase inoculation of each target compound, or of a surrogate compound that closely represents the chemical characteristics of the compound under test. In this way, and using multiple runs, a statistically relevant uncertainty assessment could also be obtained. This undertaking, which would be complex and require robust plant operation and a high level of resourcing, is a consideration in future activities addressing plant efficiency and environmental assessment.
A comprehensive set of analytical methodologies has been developed for the quantitative determination of more than 30 organic and inorganic species targeted for process assessment. The various analytical facilities undertook rigorous and informed method evaluations and proficiency testing to ensure specific applicability to the range of matrices and disparate constituent concentrations encountered in PCC process solutions. In most applications, the analytical methodologies provided a level of performance commensurate with the requirements of process assessment, and also achieved ppbv sensitivity in process gas streams. Two methods of analysis were unsuccessful. The method for amides was too insensitive to make it useful at any level of process sample assessment, and an alternative approach is required. In addition, the PFBAY derivatisation method for alkylamines did not perform when applied to the analysis of process samples. However, this was overcome using an alternative method, which proved extremely successful for the analysis of these compounds in process solutions.
Of superior performance were the methods developed by AAA for diethanolamine (DELA) and the higher nitrosamines, and by AsureQuality for alkylamines and the volatile nitrosamines, where pptv (ng/Nm3) sensitivity limits in the process gas make these methods suitable for trace-level environmental assessment of PCC process emissions.
The overall objectives of this project have largely been achieved. The outcomes from this component of the
project have generated the following recommendations.
Additional development work should be undertaken to build on and further improve the reliability of sampling and analytical techniques.
A structured study should be undertaken to investigate the unusual findings observed for acetaldehyde, focusing on its reaction pathways in MEA solvent, as well as reversible pathways whereby it can be generated in PCC systems.
A structured study should be undertaken whereby a pilot plant is artificially enriched in specific target compounds at the time of sampling to experimentally assess the overall performance of the sampling protocols.
Sampling and analytical techniques should be applied to larger-scale PCC plant to assess the impact of scale on the findings from this study.

Assessing Atmospheric Emissions from Amine based CO2 PCC Process and their Impacts on the Environment – A Case Study
74 | Volume 1: Measurement of emissions from a MEA-based PCC pilot plant
References
Artanto, Y., Jansen, J., Pearson, P., Do, T., Cottrell, A., Meuleman, E., Feron, P. (2012). Performance of MEA and amine-blends in the CSIRO PCC pilot plant at Loy Yang Power in Australia. Fuel, 101, 264–275.
Avery, M.J., Junk, G.A. (1985). Gas Chromatography/Mass Spectrometry Determination of Water-Soluble Primary Amines as Their Pentafluorobenzaldehyde Imines. Analytical Chemistry, 57, 790–792.
Dai, N., Shah, A., Hu, L., Plewa, M.J., McKague, B., Mitch, W.A. (2012). Measurements of nitrosamine and nitramine formation from NOx reactions with amines during amine-based carbon dioxide capture for post-combustion carbon sequestration. Environmental Science and Technology, 46, 9793–9801.
Fostås, B., Gangstad, A., Nenseter, B., Pedersen, S., Sjøvoll, M., Sørensen, L. (2011). Effects of NOx in the flue gas degradation of MEA. Energy Procedia 4, 1566–1573.
Fujita, K., Muraoka, D., Ogawa, T., Kitamura, H., Suzuki, K., Saita, S. (2013). Evaluation of amine emissions from the post-combustion CO2 capture pilot plant. Energy Procedia 37, 727–734.
Grosjean, D., Fung, K. (1982). Collection Efficiencies of Cartridges and Microimpingers for Sampling of Aldehydes in Air as 2,4-Dinitrophenylhydrazones. Analytical Chemistry 54, 1221–1224.
Halliburton, B., Day, S., Lavrencic, S., Riley, K., Azzi, M. (2010). CO2 Capture Mongstad - Project A - Establishing sampling and analytical procedures for potentially harmful components from post-combustion amine based CO2 capture, Task 1: design of sampling points for treated flue gas. CSIRO report to Gassnova SF, Norway. http://www.gassnova.no/frontend/files/CONTENT/Rapporter/Designofemissionsamplingpoints_CSIRO.pdf (accessed September 2013).
Knudsen, J. N., Jensen, J. N., Vilhelmsen, P., Biede, O., (2009) Experience with CO2 capture from coal flue gas in pilot-scale: Testing of different amine solvents. Energy Procedia 1, 783–790.
Kolderup, H., Khjarbo, H, W., Mejdell, T., Huizinga, A., Tuinman, I., Zahlsen, K., Vernstad, K., Hyldbakk, A., Holten, T., Kvamsdal, H. M., van Os, P., da Silva, E. F., Goetheer, E., Khakharia, P. (2012). Emission studies at the Maasvlakte CO2 capture pilot plant. In University of Texas Conference on CO2 capture and storage.
Lag, M., Lindemann, B., Instanes, C., Brunborg, G., Schwarze, P. (2011). Health effects of amines and derivatives associated with CO2 capture. Norwegian Institute of Public Health, Oslo.
Llop, A., Pocurull E., Borrull F. (2010) Automated determination of aliphatic primary amines in wastewater by simultaneous derivatisation and headspace solid-phase microextraction followed by gas chromatography–tandem mass spectrometry. Journal of Chromatography A, 1217, 575–581.
Pan, J.L., Chong, M., Pawliszyn J. (1997). Determination of amines in air and water using derivatisation combined with solid-phase microextraction. Journal of Chromatography A, 773, 249–260.
Sacher, F., Lenz S., Brauch H-J. (1997). Analysis of primary and secondary aliphatic amines in waste water and surface water by gas chromatography-mass spectrometry after derivatization with 2,4-dinitrofluorobenzene or benzenesulfonyl chloride. Journal of Chromatography A, 764, 85–93.
Selin, N.E. (2011). Environmental Guidelines and Regulations for Nitramines: A Policy Summary. Prepared for CO2 Technology Centre Mongstad. Final Report, 10 July 2011.
Tibbett, A., Day, S., Azzi, M. (2010). CO2 Capture Mongstad - Project A - Establishing sampling and analytical procedures for potentially harmful components from post-combustion amine based CO2 capture, Task 4: Literature survey of analytical procedures and recommendations. CSIRO report to Gassnova SF, Norway. http://www.gassnova.no/frontend/files/CONTENT/Rapporter/Literaturesurveyanalyticalprocedures_CSIRO.pdf (accessed September 2013).

Assessing Atmospheric Emissions from Amine based CO2 PCC Process and their Impacts on the Environment – A Case Study
Volume 1: Measurement of emissions from a MEA-based PCC pilot plant | 75
Voice, A. K., Wei, D., Rochelle, G. T. (2012). Sequential Degradation of Aqueous Monoethanolamine for CO2 Capture. Recent Advances in Post-Combustion CO2 Capture Chemistry, American Chemical Society. ISBN13: 9780841226210
Workman, G. S., Steger, J. S. (1996). Field Validation of the DNPH Method for Aldehydes and Ketones, USEPA Project Summary Report number EPA/600/SR-96/050. April 1996.
Zhao, Y.Y., Boyd, J., Hurdey, S., Li, X.F (2006). Characterization of New Nitrosamines in Drinking Water Using Liquid Chromatography Tandem Mass Spectrometry. Environmental Science and Technology, 40, 7636–7641.
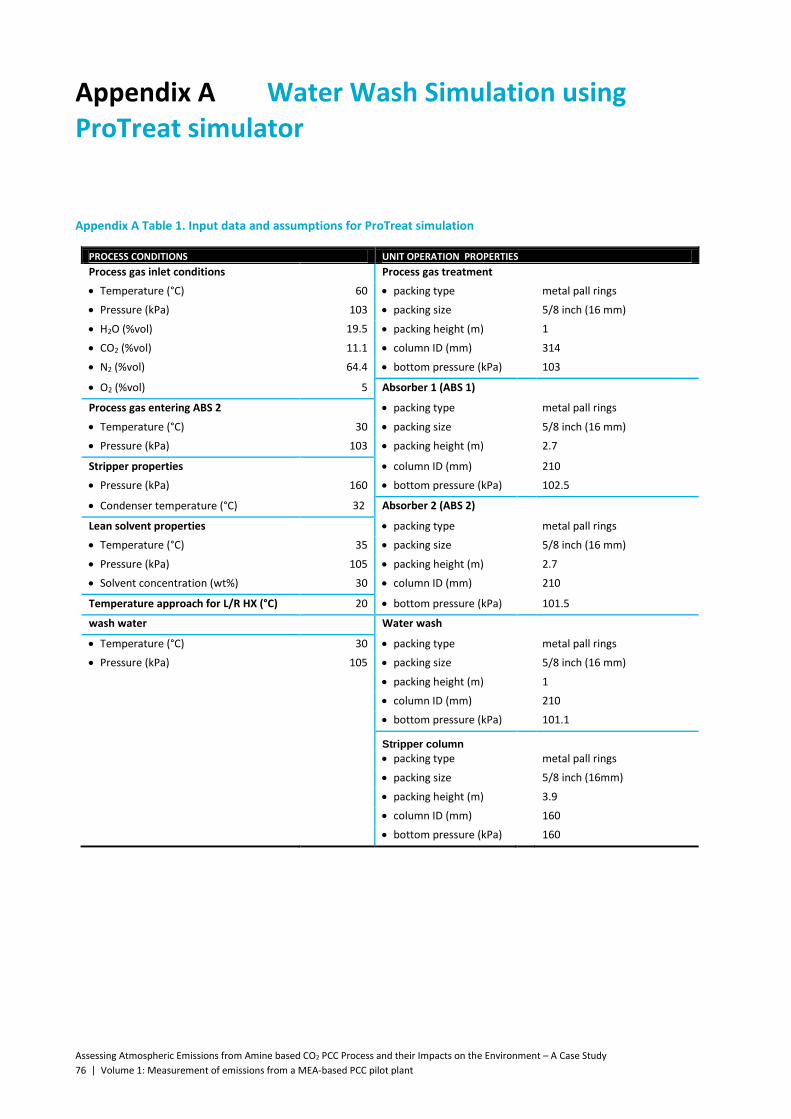
Assessing Atmospheric Emissions from Amine based CO2 PCC Process and their Impacts on the Environment – A Case Study
76 | Volume 1: Measurement of emissions from a MEA-based PCC pilot plant
Appendix A Water Wash Simulation using ProTreat simulator
Appendix A Table 1. Input data and assumptions for ProTreat simulation
PROCESS CONDITIONS UNIT OPERATION PROPERTIES
Process gas inlet conditions Process gas treatment
Temperature (°C) 60 packing type metal pall rings
Pressure (kPa) 103 packing size 5/8 inch (16 mm)
H2O (%vol) 19.5 packing height (m) 1
CO2 (%vol) 11.1 column ID (mm) 314
N2 (%vol) 64.4 bottom pressure (kPa) 103
O2 (%vol) 5 Absorber 1 (ABS 1)
Process gas entering ABS 2 packing type metal pall rings
Temperature (°C) 30 packing size 5/8 inch (16 mm)
Pressure (kPa) 103 packing height (m) 2.7
Stripper properties column ID (mm) 210
Pressure (kPa) 160 bottom pressure (kPa) 102.5
Condenser temperature (°C) 32 Absorber 2 (ABS 2)
Lean solvent properties packing type metal pall rings
Temperature (°C) 35 packing size 5/8 inch (16 mm)
Pressure (kPa) 105 packing height (m) 2.7
Solvent concentration (wt%) 30 column ID (mm) 210
Temperature approach for L/R HX (°C) 20 bottom pressure (kPa) 101.5
wash water Water wash
Temperature (°C) 30 packing type metal pall rings
Pressure (kPa) 105 packing size 5/8 inch (16 mm)
packing height (m) 1
column ID (mm) 210
bottom pressure (kPa) 101.1
Stripper column
packing type metal pall rings
packing size 5/8 inch (16mm)
packing height (m) 3.9
column ID (mm) 160
bottom pressure (kPa) 160

Appendix A Figure 1. Process flow scheme used in ProTreat simulation

Assessing Atmospheric Emissions from Amine based CO2 PCC Process and their Impacts on the Environment – A Case Study
78 | Volume 1: Measurement of emissions from a MEA-based PCC pilot plant
Appendix A. Summary of simulation result derived by ProTreat
Calculations
Flue gas inlet properties Lean solvent entering ABS-1 Reboiler properties
Temperature 60 C Temperature 35 C Temperature 112.5 C
Pressure 103 kPa Pressure 105 kPa bottom pressure 160 kPa
Flow rate 100.0 cum/hr Flow rate 7.00 L/min reboiler duty 21.7 kW
~ 89.5 NCMH MEA conc 30.1 w t% 4.8 MJ/kgCO2
104.5 kg/hr loading 0.300 mol/mol
Composition Gas leaving stripping column
H2O 19.5 mol% Lean solvent entering ABS-2 Temperature 32 C
CO2 11.1 mol% Temperature 74.0 C Pressure 160 kPa
N2 64.4 mol% Pressure 105 kPa Flow rate 6.03 cum/hr
O2 5.0 mol% Flow rate 7.58 L/min 16.6 kg/hr
MEA conc 28.3 w t% Composition
Flue gas entering ABS-2 loading 0.355 mol/mol H2O 3.0 mol%
Temperature 30.1 C CO2 97.0 mol%
Pressure 103 kPa Rich solvent leaving ABS-2 N2 0.0 mol%
Flow rate 77.1 cum/hr Temperature 52.1 C O2 0.0 mol%
~ 75.8 NCMH Pressure 102.5 kPa MEA 0.65 ppm
94.2 kg/hr Flow rate 7.08 L/min
Composition MEA conc 28.9 w t% Capture
H2O 5.0 mol% loading 0.466 mol/mol CO2 entering pilot plant 18.1 kg/hr
CO2 13.1 mol% CO2 leaving ABS w ash 1.8 kg/hr
N2 76.0 mol% Rich solvent entering STR CO2 capture ABS 16.3 kg/hr
O2 5.9 mol% Temperature 92.5 C CO2 capture STR 16.4 kg/hr
Pressure 162 kPa CO2 capture LIQ 16.3 kg/hr
Flue gas entering ABS-1 TH 20.0 C average 16.3 kg/hr
Temperature 73.7 C TC 22.5 C efficiency 90.1 %
Pressure 102.1 kPa
Flow rate 114.9 cum/hr absorber w ash
~ 97.9 NCMH CW flow (41) 11.0 L/min
104.5 kg/hr CW temp 30 C
Composition pressure 105 kPa
H2O 32.5 mol% MEA 0.28 mol%
CO2 4.0 mol% CO2 0.23 mol%
N2 58.8 mol%
O2 4.6 mol% bleed stream (44)
flow 0.02 L/min
Flue gas entering ABS w ash 1.43 kg/hr
Temperature 37.5 C temp 31.5 C
Pressure 101.1 kPa MEA 0.28 mol%
Flow rate 72.1 cum/hr CO2 0.23 mol%
78.6 kg/hr
Composition MEA balance
H2O 6.9 mol% MEA out abs 1.35E-02 kg/hr
CO2 1.5 mol% MEA out str 1.52E-05 kg/hr
N2 85.0 mol% Total MEA lost 1.35E-02 kg/hr
O2 6.6 mol% MEA added CB 0.000003751 kg/s
MEA 78.1 ppm 1.35E-02 kg/hr
difference 0.2 %
Flue gas leaving ABS w ash
Temperature 30.0 C MEA in 15 1.35E-02 kg/hr
Pressure 101 kPa MEA out 42 1.77E-05 kg/hr
Flow rate 68.4 cum/hr MEA out 44 1.35E-02 kg/hr
~ 66.0 NCMH
77.1 kg/hr difference -0.18 %
Composition
H2O 4.2 mol%
CO2 1.5 mol%
N2 87.4 mol%
O2 6.8 mol%
MEA 0.11 ppm

Assessing Atmospheric Emissions from Amine based CO2 PCC Process and their Impacts on the Environment – A Case Study
Volume 1: Measurement of emissions from a MEA-based PCC pilot plant | 79
Appendix B Analytical Technical Reports
Technical reports detailing the rationale for method selection, development and validation received from Monash University and Advanced Analytical Australia are reproduced below, along with a description of methodologies used by AsureQuality. These technical reports include the initial stage of the method developments and that performed after evaluation of results from Phase 1 of the sampling campaign.
MONASH UNIVERSITY TECHNICAL REPORT 1
METHOD DEVELOPMENT FOR THE ANALYSIS OF ALKYLAMINES, AMIDES AND NITROSAMINES
Reproduced in full with the permission of Vince Verheyen, Monash University
1209001 Optimisation of GC/MS techniques for the analysis of amine based PCC samples at Monash Gippsland - Phase 2 Analytical
20 September 2012 Prepared for: Anne Tibbett CSIRO Energy Technology P.O. Box 52 North Ryde NSW 1670
EXECUTIVE SUMMARY
Introduction
This report covers Phase 2 of Contract Research Services to CSIRO – agreement 2012030976. It involves the development of selected GC/MS sample preparation and analysis techniques for synthetic MEA solvent systems similar to that used at the Loy Yang pilot plant. This phase involved the optimisation of the chromatography for select amine, amide and nitrosamine compounds outlined in our proposal (7/02/2012) which was appended to the contract. Their detection limits and uncertainties are also presented.
Results
Methods for the three target classes of nitrogen compound namely amines, amides and nitrosamines were developed separately. The low molecular weight and high reactivity/corrosivity of the target nitrogen compounds combined with the massive background concentration of aqueous monoethanolamine (MEA) created a challenging environment in terms of their analysis by GC/MS. This had already been alluded to in the Gassnova program and the learning’s from its various reports were used as a basis for this present study. The amines therefore required derivatisation and they were converted to their Penta Fluoro Benzene (PFB) imines (Avery and Junk, 1985).
The amides and nitroso compounds were analysed in their original form without any extraction or pre-concentration steps. Standard statistical methods were used to calculate the method detection and practical quantitation limits for the target compounds. All the data is presented in an ‘as injected’ form and the dilution ratio from the synthetic 30%aq. MEA is also given to afford the likely sensitivity in Loy Yang pilot plant solvent.

Assessing Atmospheric Emissions from Amine based CO2 PCC Process and their Impacts on the Environment – A Case Study
80 | Volume 1: Measurement of emissions from a MEA-based PCC pilot plant
Instrument detection limits
Target compound Dilution ratio from 30% MEA
Method Detection Limit (ppb) as injected
Practical Quantization Limit (ppb) as injected
Methyl amine 1:20 75 380
Ethyl amine 1:20 19 95
Dimethyl amine 1:20 10000# n/a
Formamide 1:10 500 2500
Acetamide 1:10 340 1700
N-nitrosodimethylamine 3:20 85 430
N-nitrosodiethylamine 3:20 120 600
Nitrosomorpholine 3:20 94 470
# as a secondary amine, DMA was not amenable to imine formation resulting in poor sensitivity.
Summary
The results from direct injection revealed respectable detection limits for most of the target compounds with good linearity over the concentration ranges investigated. Ion trap spectrometers are known for their sensitivity and attempts to improve this via selected ion storage routines did not prove successful. MS/MS techniques, given the small size of the key ions in the targets were not thought to offer significant improvement.
The focus here instead turned to the chromatography, by maximising the peak height and shape to provide optimum sensitivity. The use of ammonia as a means of improving the peak response for the basic compounds proved successful and is in accord with the specialised commercial amine columns which are also basic in nature. Given the direct aqueous injection approach water management was also critical to the optimisation of GC performance. The minimal interaction between the relatively non polar liquid phase and the N compounds was mitigated by the use of the thickest film columns available which met MS inlet background performance criteria. The use of a 60m column was trialled but its improved separation was not considered worth the retention time penalty associated with its extra length.
The PFB imine formation of the primary alkyl amines proved very successful with no deterioration in chromatographic performance observed despite largish batches of samples being analysed over several months. If required the sensitivity of this method could be improved by the separation and concentration of the dichloromethane extract.
Recommendations
Given the demonstrated ability to perform direct injection analysis of synthetic MEA solvent mixes it is critical that any real pilot plant samples be received in a form compatible with this analytical approach. The use of mineral acids to stabilise basic nitrogen compounds must be avoided to prevent GC/MS damage due to the build up of inorganic salts. The possibility of chemical alteration due to side reactions under extreme pH adjustment conditions is also a factor to be considered. Organic acids such as formic acid are suggested as a suitable alternative for fixing volatile amine systems. Given the close proximity of our location to Loy Yang a degradation study would be opportune to determine just how necessary the standard stabilisation procedures are.
Vince Verheyen PhD Senior Research Fellow
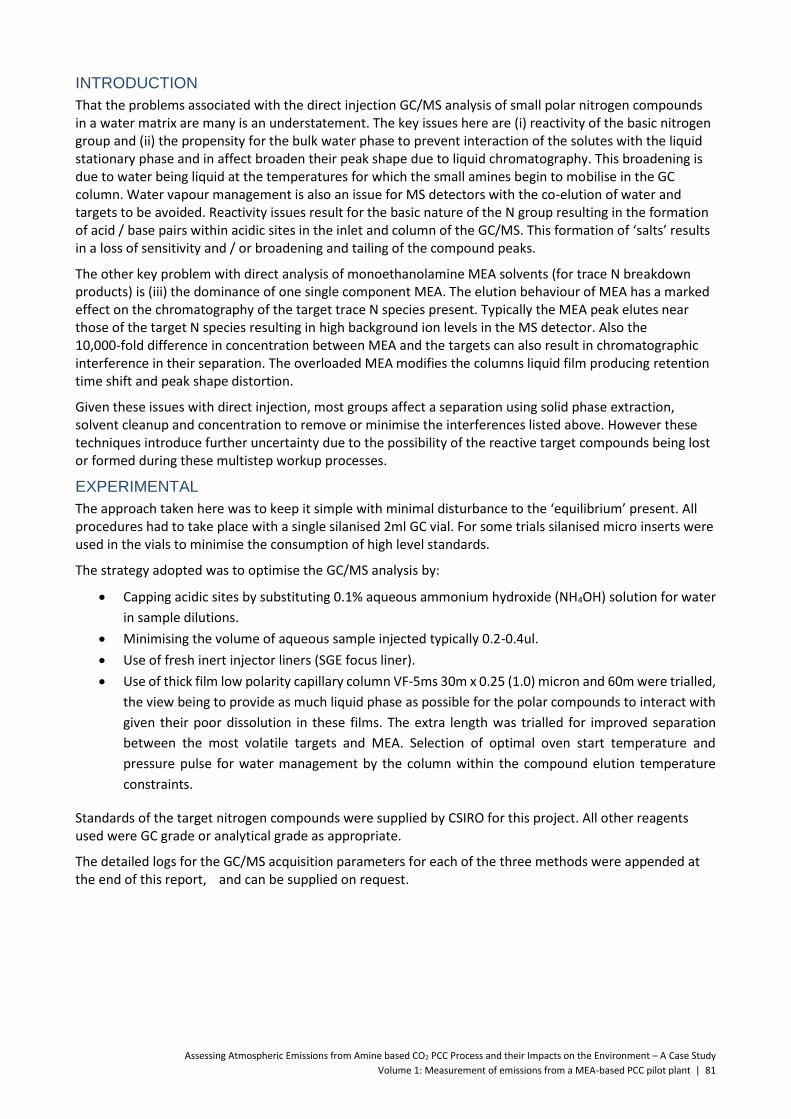
Assessing Atmospheric Emissions from Amine based CO2 PCC Process and their Impacts on the Environment – A Case Study
Volume 1: Measurement of emissions from a MEA-based PCC pilot plant | 81
INTRODUCTION
That the problems associated with the direct injection GC/MS analysis of small polar nitrogen compounds in a water matrix are many is an understatement. The key issues here are (i) reactivity of the basic nitrogen group and (ii) the propensity for the bulk water phase to prevent interaction of the solutes with the liquid stationary phase and in affect broaden their peak shape due to liquid chromatography. This broadening is due to water being liquid at the temperatures for which the small amines begin to mobilise in the GC column. Water vapour management is also an issue for MS detectors with the co-elution of water and targets to be avoided. Reactivity issues result for the basic nature of the N group resulting in the formation of acid / base pairs within acidic sites in the inlet and column of the GC/MS. This formation of ‘salts’ results in a loss of sensitivity and / or broadening and tailing of the compound peaks.
The other key problem with direct analysis of monoethanolamine MEA solvents (for trace N breakdown products) is (iii) the dominance of one single component MEA. The elution behaviour of MEA has a marked effect on the chromatography of the target trace N species present. Typically the MEA peak elutes near those of the target N species resulting in high background ion levels in the MS detector. Also the 10,000-fold difference in concentration between MEA and the targets can also result in chromatographic interference in their separation. The overloaded MEA modifies the columns liquid film producing retention time shift and peak shape distortion.
Given these issues with direct injection, most groups affect a separation using solid phase extraction, solvent cleanup and concentration to remove or minimise the interferences listed above. However these techniques introduce further uncertainty due to the possibility of the reactive target compounds being lost or formed during these multistep workup processes.
EXPERIMENTAL
The approach taken here was to keep it simple with minimal disturbance to the ‘equilibrium’ present. All procedures had to take place with a single silanised 2ml GC vial. For some trials silanised micro inserts were used in the vials to minimise the consumption of high level standards.
The strategy adopted was to optimise the GC/MS analysis by:
Capping acidic sites by substituting 0.1% aqueous ammonium hydroxide (NH4OH) solution for water
in sample dilutions.
Minimising the volume of aqueous sample injected typically 0.2-0.4ul.
Use of fresh inert injector liners (SGE focus liner).
Use of thick film low polarity capillary column VF-5ms 30m x 0.25 (1.0) micron and 60m were trialled,
the view being to provide as much liquid phase as possible for the polar compounds to interact with
given their poor dissolution in these films. The extra length was trialled for improved separation
between the most volatile targets and MEA. Selection of optimal oven start temperature and
pressure pulse for water management by the column within the compound elution temperature
constraints.
Standards of the target nitrogen compounds were supplied by CSIRO for this project. All other reagents used were GC grade or analytical grade as appropriate.
The detailed logs for the GC/MS acquisition parameters for each of the three methods were appended at the end of this report, and can be supplied on request.
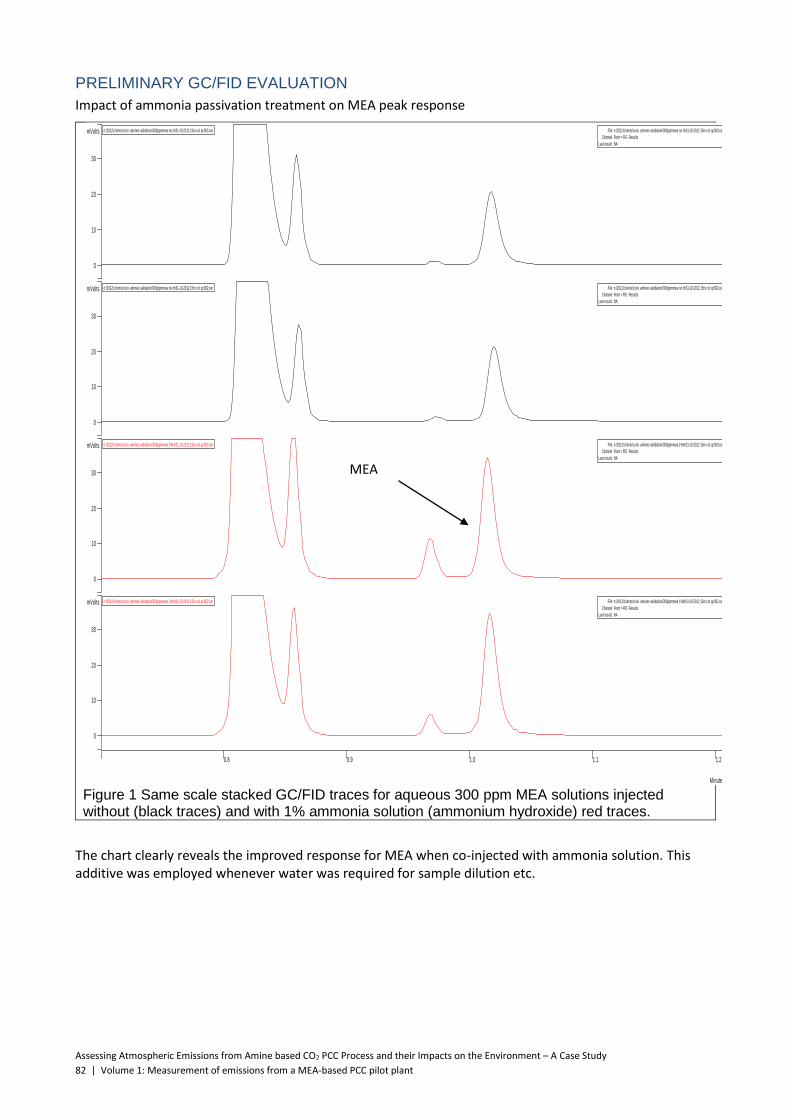
Assessing Atmospheric Emissions from Amine based CO2 PCC Process and their Impacts on the Environment – A Case Study
82 | Volume 1: Measurement of emissions from a MEA-based PCC pilot plant
PRELIMINARY GC/FID EVALUATION
Impact of ammonia passivation treatment on MEA peak response
Figure 1 Same scale stacked GC/FID traces for aqueous 300 ppm MEA solutions injected without (black traces) and with 1% ammonia solution (ammonium hydroxide) red traces.
The chart clearly reveals the improved response for MEA when co-injected with ammonia solution. This additive was employed whenever water was required for sample dilution etc.
0.8 0.9 1.0 1.1 1.2
Minutes
0
10
20
30
mVolts n:\2012\clients\csiro -amines validation\300ppmmea no nh31-10-2012 15m col qc003.run File:
Channel:
Last recalc:
n:\2012\clients\csiro -amines validation\300ppmmea no nh31-10-2012 15m col qc003.run
Front = FID Results
NA
0
10
20
30
mVolts n:\2012\clients\csiro -amines validation\300ppmmea no nh31-10-2012 15m col qc002.run File:
Channel:
Last recalc:
n:\2012\clients\csiro -amines validation\300ppmmea no nh31-10-2012 15m col qc002.run
Front = FID Results
NA
0
10
20
30
mVolts n:\2012\clients\csiro -amines validation\300ppmmea 1%nh31-10-2012 15m col qc003.run File:
Channel:
Last recalc:
n:\2012\clients\csiro -amines validation\300ppmmea 1%nh31-10-2012 15m col qc003.run
Front = FID Results
NA
0
10
20
30
mVolts n:\2012\clients\csiro -amines validation\300ppmmea 1%nh31-10-2012 15m col qc002.run File:
Channel:
Last recalc:
n:\2012\clients\csiro -amines validation\300ppmmea 1%nh31-10-2012 15m col qc002.run
Front = FID Results
NA
MEA

Assessing Atmospheric Emissions from Amine based CO2 PCC Process and their Impacts on the Environment – A Case Study
Volume 1: Measurement of emissions from a MEA-based PCC pilot plant | 83
GC/MS RESULTS
ALKYLAMINES – AS THEIR PFB- IMINE PRODUCTS
Figure 1A. GC/MS total ion chromatogram for the dichloromethane layer in the PFBA treated MEA sample which had been spiked with target amines.
Figure 1A illustrates the relatively clean dichloromethane (CH2Cl2) extract afforded by the pentafluorobenzaldehyde PFBA imines. The mass spectrometer acquisition conditions were detuned (see Appendix 4 of this report) to minimise the ion current for PFBA and the PFB-MEA imine product. The sensitivity for the target amine products could be enhanced further by concentrating the CH2Cl2 after extraction. A stacked plot of the selected ions used for the target imines is presented in Figure 1B.
The imine preparation technique is only applicable to primary amines such as methyl and ethyl amines and MEA. The imine of dimethyl amine (DMA) was not detected. Static headspace injection on a 60M column was the most promising approach for DMA (as found by other laboratories) but this was only possible here as a manual injection given our equipment limitations. We did trial liquid injections incorporating aqueous MEA but found it impossible to reduce the DMA peak broadening to a level were spikes less than 1000 ppb could be detected.
A key measure of success for our imine approach to analysing the problematic amines was to have a slight excess of PFBA remaining in the sample with no detectable MEA. The enormous MEA loading ensured that should it be completely converted to its imine then the target trace amines should also have been successfully transformed. An internal standard - isobutyl amine was added at trace level to the MEA solvent before any target addition and its imine conversion provided an independent check on the derivatisation procedure.
Target imines region see Fig.1B
Imine of MEA
PFBA reagent
PFBA adduct
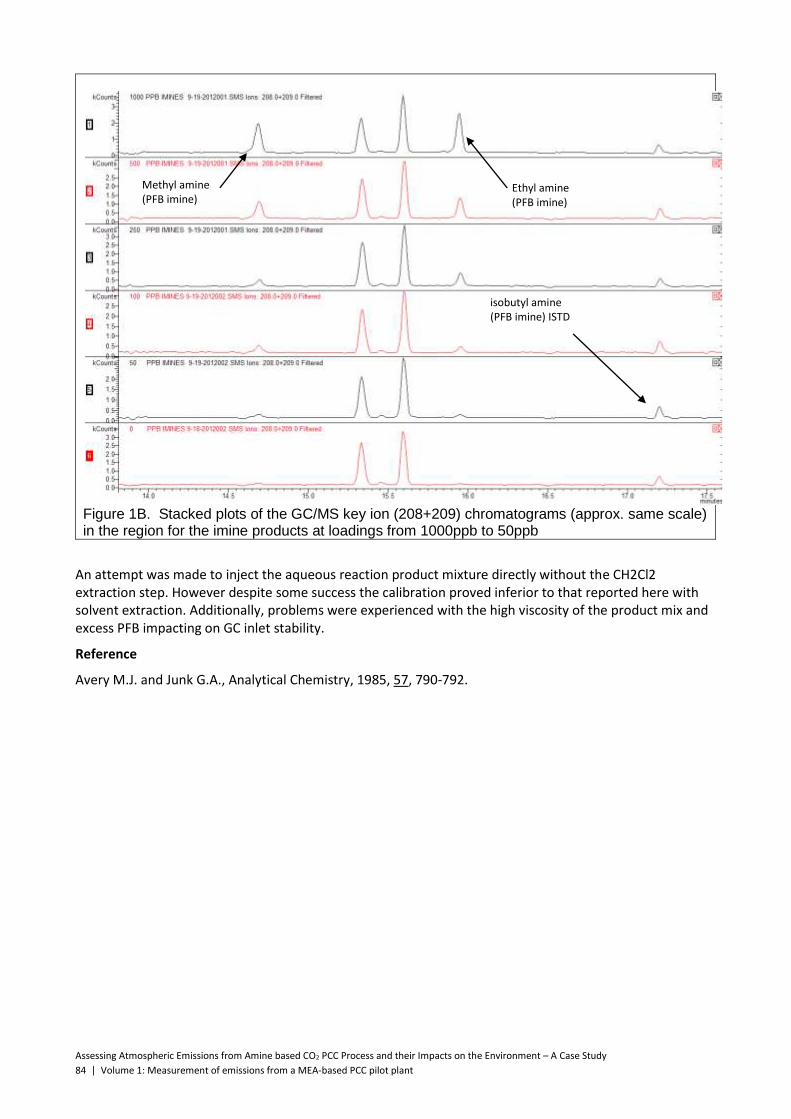
Assessing Atmospheric Emissions from Amine based CO2 PCC Process and their Impacts on the Environment – A Case Study
84 | Volume 1: Measurement of emissions from a MEA-based PCC pilot plant
Figure 1B. Stacked plots of the GC/MS key ion (208+209) chromatograms (approx. same scale) in the region for the imine products at loadings from 1000ppb to 50ppb
An attempt was made to inject the aqueous reaction product mixture directly without the CH2Cl2 extraction step. However despite some success the calibration proved inferior to that reported here with solvent extraction. Additionally, problems were experienced with the high viscosity of the product mix and excess PFB impacting on GC inlet stability.
Reference
Avery M.J. and Junk G.A., Analytical Chemistry, 1985, 57, 790-792.
isobutyl amine (PFB imine) ISTD
Methyl amine (PFB imine)
Ethyl amine (PFB imine)

Assessing Atmospheric Emissions from Amine based CO2 PCC Process and their Impacts on the Environment – A Case Study
Volume 1: Measurement of emissions from a MEA-based PCC pilot plant | 85
AMIDES
Figure 2A. GC/MS total ion chromatogram for the direct injection of synthetic solvent (aqueous MEA ) which had been spiked with target amides and deuterated pyridine and toluene internal stds
The key issue for the amides separation was to maximise the separation between the massive MEA peak and that of formamide. Careful adjustment of GC conditions (Appendix 4 of this report) resulted in an adequate separation (Figure 2). MEA appears to interact with the amides resulting in a non Gaussian peak shape.
It was not expected to be possible to produce an imide from the amides given the amide carbonyl group but an attempt was made to form the PFB imines. This was not successful and the reaction despite its conversion of the MEA, it did not result in improved amide sensitivity.
The direct injection method was still favoured for its simplicity and the sensitivity may be still further improved with further optimisation of the GC injection/inlet conditions. One could investigate further dilution of the MEA solvent to reduce its impact on the amide chromatography.
Acetamide
Peaks either side are ISTD’s
MEA
Formamide

Assessing Atmospheric Emissions from Amine based CO2 PCC Process and their Impacts on the Environment – A Case Study
86 | Volume 1: Measurement of emissions from a MEA-based PCC pilot plant
Figure 2B. Stacked GC/MS m/e 45+59 extracted ion chromatograms for formamide and acetamide spikes in synthetic solvent (aqueous MEA) which had been spiked with a concentration range (100ppm- 100ppb).
Formamide Acetamide

Assessing Atmospheric Emissions from Amine based CO2 PCC Process and their Impacts on the Environment – A Case Study
Volume 1: Measurement of emissions from a MEA-based PCC pilot plant | 87
NITROSAMINES
Figure 3A. Typical GC/MS total ion chromatogram for the direct injection of synthetic solvent (aqueous MEA) which had been spiked with target nitrosamines and deuterated pyridine and toluene istds. The nitroso compounds 1000PPB are not visible here – see Fig. 3B
The nitrosamines proved less reactive than the amides under our direct MEA solvent injection conditions. The peaks were typically much more symmetrical affording greater sensitivity. The 521 and Method IX mixes were trialled with good results although here only the targets have been reported.
Reference
Avery M.J. and Junk G.A. Anal.Chem. 1985, 57, 790-792.
Urea surrounded by istds
MEA
Urea adduct

Assessing Atmospheric Emissions from Amine based CO2 PCC Process and their Impacts on the Environment – A Case Study
88 | Volume 1: Measurement of emissions from a MEA-based PCC pilot plant
MONASH UNIVERSITY TECHNICAL REPORT 2
METHODOLOGY FOR THE ANALYSIS OF ALKYLAMINES, AMIDES AND NITROSAMINES AND MEA IN PCC PROCESS SAMPLES
Reproduced in full with the permission of Vince Verheyen, Monash University
EXPERIMENTAL METHOD
GC/MS ANALYSIS OF NITROGENOUS DEGRADATION PRODUCTS FROM
AQUEOUS AMINE BASED PCC SOLVENT SYSTEMS SCOPE AND APPLICATION This is a gas chromatography mass spectrometric (GC/MS) method applicable to the determination of nitrogen containing degradation products in aqueous monoethanolamine (MEA) matrices such as PCC 30% MEA solvent systems. Specifically, this method covers the determination of the following compounds:
Table 1
Target compound Dilution ratio from 30% MEA
Method Detection Limit (ppb)
as injected
Practical Quantification Limit (ppb)
as injected
Methyl amine 1:20 75 380
Ethyl amine 1:20 19 95
Formamide 1:10 500 2500
Acetamide 1:10 340 1700
N-nitrosodimethylamine 3:20 85 430
N-nitrosodiethylamine 3:20 120 600
Nitrosomorpholine 3:20 94 470
Monoethanolamine 1:1000 10 50
The method detection limit (MDL) for each analyte of interest is listed in Table 1. The MDL for a specific process sample may differ from those listed, depending upon the nature of interferences in the sample matrix. This method has been tested for linearity of recovery from spiked aqueous 30% MEA and has been demonstrated to be applicable for the concentration range from 4 x MDL to 100 x MDL.
SUMMARY OF METHOD
The premise behind the technique was to minimise the risk of target compound loss due to extraneous reactions likely to occur during selective extraction and cleanup of these reactive species. The method focused on single vial workup approaches were possible and the use of additional ammonia for passivation of reactive surfaces within the vials and the GC/MS
Amides and nitrosamines
A measured volume of MEA sample is transferred to a silanised GC vial and diluted with 0.1% NH4OH solution (made up in reagent grade water). Individually tailored GC/MS conditions are described which permit the separation and measurement of the target compounds in each class directly by aqueous injection.
Primary alkylamines
The 0.1% NH4OH diluted MEA sample (and any other primary amines) are derivatised to their corresponding PFB imines using pentafluorobenzaldehyde (PFBA) at 60C. The imines are isolated via

Assessing Atmospheric Emissions from Amine based CO2 PCC Process and their Impacts on the Environment – A Case Study
Volume 1: Measurement of emissions from a MEA-based PCC pilot plant | 89
solvent extraction with methylene chloride after a water quench. The methylene chloride layer is sampled directly from the GC vial via the autosampler syringe and analysed by GC/MS. Gas chromatographic conditions are described which permit the separation and measurement of the imine compounds in the extract.
This method provides gas chromatographic conditions for the detection of ppb concentrations of target compounds. A 0.4µL aliquot of the sample is injected into a GC via an autosampler using a pressure pulse split technique, and compounds in the GC effluent are detected by a mass spectrometric detector (MS).
Monoethanolamine
Internal standard (25 mg/L d5-pyridine) and 0.1% ammonium hydroxide were added to each sample except the solvent (ca 30% MEA). The solvent was diluted 1:1000 (1:10 (by mass) and 1:100 (by volume)) in 0.1% ammonium hydroxide containing 25 mg/L d5-pyridine. The sample is analysed directly using gas chromatography and flame ionisation detection (GC/FID).
INTERFERENCES Matrix interferences may be caused by contaminants that are co-extracted from the sample. Active sites on surfaces within the glassware and GC/MS leading to irreversible adsorption or mineralisation of targets are also to be considered. Low level background contamination by the targets within the laboratory may also a concern given their ubiquitous nature. Vials were 2 mL, silanised amber glass with polytetrafluoroethylene (PTFE)-lined screw-cap
APPARATUS AND MATERIALS Amides, nitrosamines and alkylamines were analysed using a Varian 3800 GC fitted with 8400 autosampler and 1177 split/splitless injector with an SGE focus liner insert. The optimisation of injection volume, injector temperature, oven start temperature and pressure pulse for water management by the column within the compound elution / degradation temperature constraints was conducted. Separation of analytes was achieved using a thick film low polarity GC Column VF-5ms 30x0.25, 1.0 micron and detection used a Varian Saturn 2200 Ion Trap mass spectrometer (GCMS).
MEA was quantified by GC and flame ionisation detection (GC/FID) using a temperature programmed 5% phenyl 95% dimethylsiloxane column (15 m. x 0.53 mm I.D. 1.5 um thickness) and helium carrier gas. A standard Varian 1177 split/splitless injector, fitted with a SGE Focus liner, was operating at 260ºC in split mode with a split of ratio 10:1.
SAMPLE COLLECTION, PRESERVATION AND HANDLING The samples must be stored in a refrigerator at 4C and protected from light in amber glass vials. The samples are considered toxic and potentially carcinogenic with all procedures conducted in a fume cupboard with appropriate PPE.
PROCEDURE Amides and Nitrosamines
Direct Injection of the aqueous as received samples after dilution with 0.1% NH4OH.
Alkylamines
Their PFB Imines were formed according to the method of Avery and Junk Anal.Chem 1985 57 790-792. The scale was reduced to enable the complete reaction and workup within a 2ml GC vial.
Monoethanolamine
Direct injection of the aqueous as received sample with dilution to 0.03% MEA where necessary with 0.1% NH4OH and addition of IS as described above.
QUALITY CONTROL Each sample batch includes the analysis of QC samples including a method blank, matrix spike, a duplicate, and a laboratory control sample (LCS)

Assessing Atmospheric Emissions from Amine based CO2 PCC Process and their Impacts on the Environment – A Case Study
90 | Volume 1: Measurement of emissions from a MEA-based PCC pilot plant
All samples were spiked with custom mixtures which were effectively dilution reagents incorporating internal standards and surrogates. These are either #181 (for solvent samples) or #188 (for aqueous samples) reagents.
The dilution reagents comprised:
#177 being 240ppm D8 Toluene and 250ppm D5 pyridine in methanol
#181 being 1ml of #177 diluted to 100ml with 0.1% NH4OH (in MQ water) i.e. 2.4 ppm and 2.5 ppm
#188 being 2ml of #177 diluted to 5 ml with 0.1% NH4OH (in MQ water) i.e. 40 times concentrated
dilution reagent.
The universal use of both a neutral hydrocarbon and an aromatic amine (in their deuterated form) provided good markers for GC/MS system performance and sample extraction / isolation efficiency.
Spikes were prepared fresh from the parent standards (Restek, ChemService and TCI Analytical) with:
the nitrosamines diluted with methanol
the amides diluted with 0.1% NH4OH
the amines diluted with 0.1% NH4OH
MEA diluted with 0.1% NH4OH
The spikes were added prior to sample extraction/isolation/derivatisation
The effect of the matrix is covered by including the analysis of at least one matrix spike and one duplicate unspiked sample or one matrix spike/matrix spike duplicate pair. The matrix was spiked with the target compound at 1-5 times the MDL.
UNCERTAINTY OF MEASUREMENT Refer Appendix 1 (of this technical report) for data related to measurement of uncertainty for alkylamine analysis and Appendix 2 for amide and nitrosamine analysis.
Target compound Target value
(ppb)
Measured value
(ppb)
Uncertainty of
measurement* (ppb)
Methyl amine 100 105 ± 16
Ethyl amine 50 41 ± 8
Dimethyl amine n/a n/a n/a
Formamide 1000 1040 ± 200
Acetamide 1000 996 ± 400
N-nitrosodimethylamine 500 508 ± 54
N-nitrosodiethylamine 100 105 ± 74
Nitrosomorpholine 100 102 ± 60
*Uncertainty of measurement is calculated as 2 standard deviations of seven replicate measurements,
giving the 95% confidence interval.
^The high uncertainties for N-nitrosodiethylamine and nitrosomorpholine are the result of measuring
standards below the PQL – refer Appendix 2.

Assessing Atmospheric Emissions from Amine based CO2 PCC Process and their Impacts on the Environment – A Case Study
Volume 1: Measurement of emissions from a MEA-based PCC pilot plant | 91
PRECISION AND DETECTION LIMITS Refer Appendix 2 (this technical report 2) for data related to the determination of instrument detection limit and precision based.
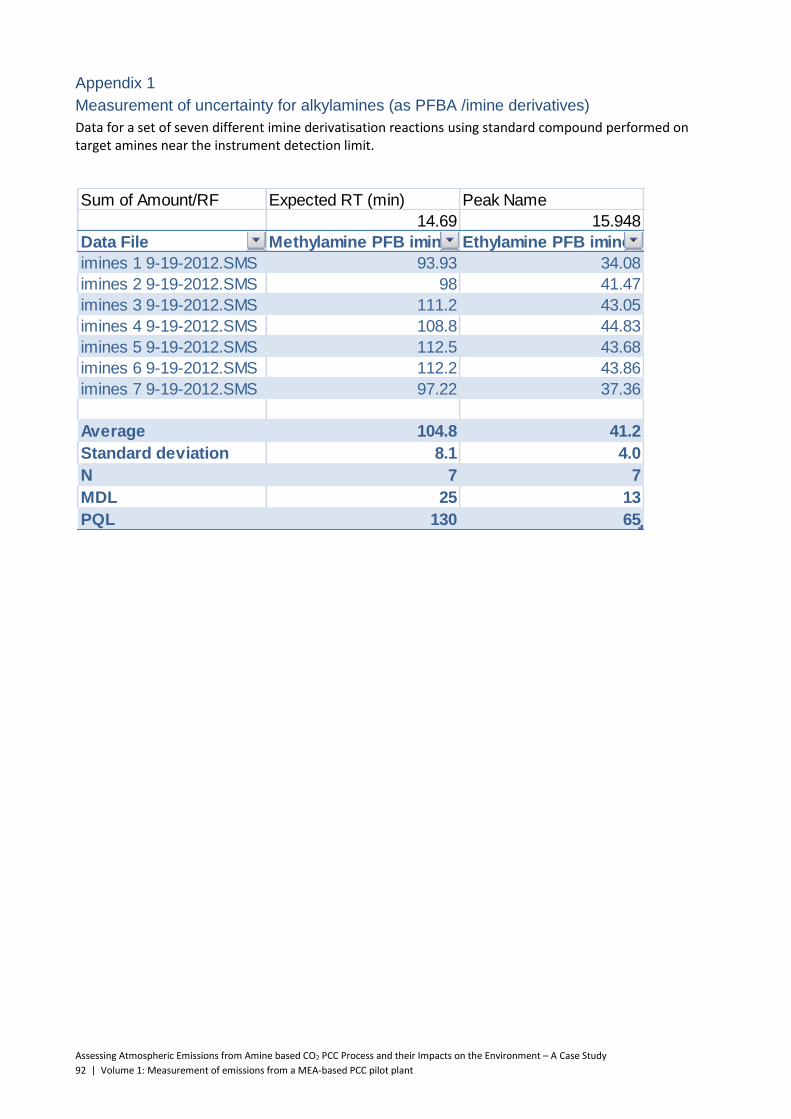
Assessing Atmospheric Emissions from Amine based CO2 PCC Process and their Impacts on the Environment – A Case Study
92 | Volume 1: Measurement of emissions from a MEA-based PCC pilot plant
Appendix 1
Measurement of uncertainty for alkylamines (as PFBA /imine derivatives)
Data for a set of seven different imine derivatisation reactions using standard compound performed on target amines near the instrument detection limit.
Sum of Amount/RF Expected RT (min) Peak Name
14.69 15.948
Data File Methylamine PFB imine Ethylamine PFB imine
imines 1 9-19-2012.SMS 93.93 34.08
imines 2 9-19-2012.SMS 98 41.47
imines 3 9-19-2012.SMS 111.2 43.05
imines 4 9-19-2012.SMS 108.8 44.83
imines 5 9-19-2012.SMS 112.5 43.68
imines 6 9-19-2012.SMS 112.2 43.86
imines 7 9-19-2012.SMS 97.22 37.36
Average 104.8 41.2
Standard deviation 8.1 4.0
N 7 7
MDL 25 13
PQL 130 65
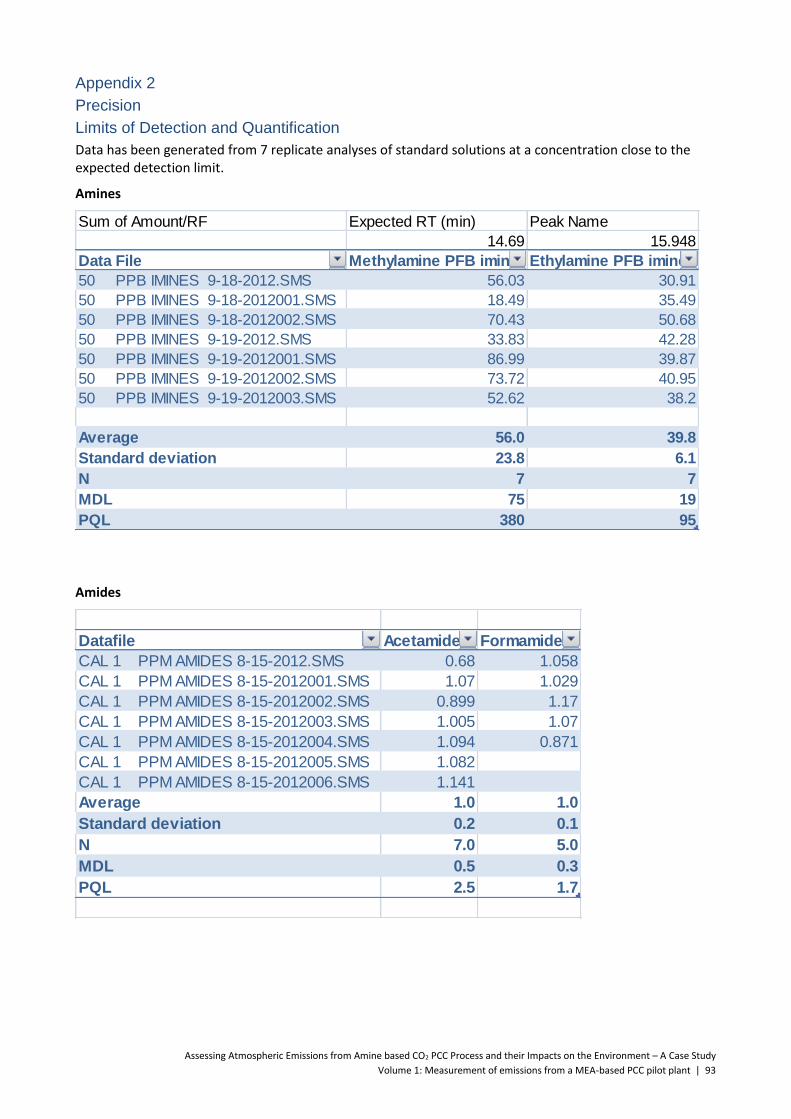
Assessing Atmospheric Emissions from Amine based CO2 PCC Process and their Impacts on the Environment – A Case Study
Volume 1: Measurement of emissions from a MEA-based PCC pilot plant | 93
Appendix 2
Precision
Limits of Detection and Quantification
Data has been generated from 7 replicate analyses of standard solutions at a concentration close to the expected detection limit.
Amines
Amides
Sum of Amount/RF Expected RT (min) Peak Name
14.69 15.948
Data File Methylamine PFB imine Ethylamine PFB imine
50 PPB IMINES 9-18-2012.SMS 56.03 30.91
50 PPB IMINES 9-18-2012001.SMS 18.49 35.49
50 PPB IMINES 9-18-2012002.SMS 70.43 50.68
50 PPB IMINES 9-19-2012.SMS 33.83 42.28
50 PPB IMINES 9-19-2012001.SMS 86.99 39.87
50 PPB IMINES 9-19-2012002.SMS 73.72 40.95
50 PPB IMINES 9-19-2012003.SMS 52.62 38.2
Average 56.0 39.8
Standard deviation 23.8 6.1
N 7 7
MDL 75 19
PQL 380 95
Datafile Acetamide Formamide
CAL 1 PPM AMIDES 8-15-2012.SMS 0.68 1.058
CAL 1 PPM AMIDES 8-15-2012001.SMS 1.07 1.029
CAL 1 PPM AMIDES 8-15-2012002.SMS 0.899 1.17
CAL 1 PPM AMIDES 8-15-2012003.SMS 1.005 1.07
CAL 1 PPM AMIDES 8-15-2012004.SMS 1.094 0.871
CAL 1 PPM AMIDES 8-15-2012005.SMS 1.082
CAL 1 PPM AMIDES 8-15-2012006.SMS 1.141
Average 1.0 1.0
Standard deviation 0.2 0.1
N 7.0 5.0
MDL 0.5 0.3
PQL 2.5 1.7

Assessing Atmospheric Emissions from Amine based CO2 PCC Process and their Impacts on the Environment – A Case Study
94 | Volume 1: Measurement of emissions from a MEA-based PCC pilot plant
Nitrosamines
Replicate
N-Nitrosodimethylamine (at
500 ppb)
Ethanamine, N-ethyl-N-
nitroso- (at 100 ppb)
Morpholine, 4-nitroso-
(at 100 ppb)
1 532.6 142.5 80.82
2 488.8 127.6 96.47
3 455.2 93.23 60.19
4 522.1 45.63 138.7
5 513.7 102.4 125.6
6 513.1 149.6 80.82
7 528.5 77.01 130
Average 508 105 102
Standard deviation 27 37 30
N 7 7 7
MDL 85 120 94
PQL 430 600 470

Assessing Atmospheric Emissions from Amine based CO2 PCC Process and their Impacts on the Environment – A Case Study
Volume 1: Measurement of emissions from a MEA-based PCC pilot plant | 95
MONASH UNIVERSITY TECHNICAL REPORT 3
SAMPLING CAMPAIGN 1 - RESULTS REVIEW
Reproduced in full with the permission of Vince Verheyen, Monash University
Technical Report 1209001 Optimisation of GC/MS techniques for the analysis of amine based PCC samples at Monash Gippsland - Phase 3
26 February 2013 Anne Tibbett CSIRO Energy Technology P.O. Box 52 North Ryde NSW 1670
EXECUTIVE SUMMARY
Introduction
This report covers Phase 3 of the Contract Research Services to CSIRO – agreement 2012030976. It involves the application of GC/MS sample and preparation techniques developed in Phase 2 to actual LY pilot plant samples supplied by CSIRO. The samples were specially sampled in MQ grade water for Monash and comprised a range of impinger, water wash, rinses and MEA solvent. Only the priority samples were analysed given time and budget constraints. This Phase in the program should be considered an initial trial of the minimalist workup methodology developed in Phase 2 for synthetic high level MEA matrices on real pilot plant samples.
Results
Samples were analysed separately for the three target classes of nitrogen compounds namely nitrosamines, amides and amines (as imines). In addition, the samples’ MEA concentration was also measured directly by a routine in-house GC FID technique. No nitrosamines or amides were detected in any of the samples, whilst alkyl amines were detected at ppm levels. The amine levels and standard spike recoveries for all the target compounds were found to be matrix dependent. The MEA solvent samples proved the most problematic matrix, - reporting higher uncertainties as expected given their higher burden of interfering components such as heat stable salts.
Summary
For the three MEA degradation product types investigated here only alkylamines were detected at ppm levels. The recoveries for all classes were found to be matrix dependent with high MEA loadings proving beneficial in terms of increasing their yields (of amides in particular) albeit at the price of higher uncertainty. These initial trial results reveal considerable scope for improvement in detection limits and uncertainty values. We are now aware that acidified sample collection protocols are mandatory and this will entail including a solvent extraction step such as in US EPA Meth.8070A and possibly the doping of samples with additional chemicals to improve extraction efficiency.
Vince Verheyen PhD Senior Research Fellow

Assessing Atmospheric Emissions from Amine based CO2 PCC Process and their Impacts on the Environment – A Case Study
96 | Volume 1: Measurement of emissions from a MEA-based PCC pilot plant
EXPERIMENTAL
The pilot plant samples were all supplied by CSIRO in amber glass vials and refrigerated. Analysis typically took place within 5 days of receipt.
The experimental protocol used here for GCMS determination of nitrosamines, amides, alkylamines and MEA was detailed in the Phase 2 report s (Technical reports 1 and 2). All samples for these analyses were spiked with in house dilution reagent mixtures either #181 (for solvent samples) or #188 (for aqueous samples) reagents, as follows.
The dilution reagents comprised:
#177 being 240ppm D8 Toluene and 250ppm D5 pyridine in methanol
#181 being 1ml of #177 diluted to 100ml with 0.1% NH4OH (in MQ water) i.e. 2.4 ppm and 2.5 ppm
#188 being 2ml of #177 diluted to 5 ml with 0.1% NH4OH (in MQ water) i.e. 40 times concentrated
dilution reagent.
The universal use of both a neutral hydrocarbon and an aromatic amine (in their deuterated form) provided good markers for GCMS system performance and sample extraction / isolation efficiency.
Spikes were prepared fresh from the parent standards with:
the nitrosamines diluted with methanol
the amides diluted with 0.1% NH4OH
the amines diluted with 0.1% NH4OH
the MEA diluted with 0.1% NH4OH
The spikes were added prior to sample extraction/isolation/derivatisation as per the methods in Technical report 2.
Data Analysis
MS DataReview (Varian Inc. California) was used to identify, integrate and quantify all target compounds. All identifications and integrations were manually verified.
All samples were prepared and analysed in triplicate by GC/MS or GC/FID i.e. the same sample vial analysed 3 times. A second aliquot of this sample (‘sample repeat’) was prepared separately and analysed to calculate repeatability of the analytical procedure. A third aliquot (‘sample spike’) representing each different sample matrix was spiked with a known amount of selected target compounds prior to preparation and analysis.
The following equations were used to calculate percent relative standard deviation (%RSD), percent relative difference (%RPD), spike recovery and uncertainty of measurement.
%𝑅𝑆𝐷 =𝑠𝑡𝑎𝑛𝑑𝑎𝑟𝑑 𝑑𝑒𝑣𝑖𝑎𝑡𝑖𝑜𝑛
𝑎𝑣𝑒𝑟𝑎𝑔𝑒 × 100
%𝑅𝑃𝐷 =
12 |𝐶𝑜𝑛𝑐𝑒𝑛𝑡𝑟𝑎𝑡𝑖𝑜𝑛 𝑜𝑓 𝑠𝑎𝑚𝑝𝑙𝑒 𝑟𝑒𝑝𝑒𝑎𝑡 − 𝐴𝑣𝑒𝑟𝑎𝑔𝑒 𝑐𝑜𝑛𝑐𝑒𝑛𝑡𝑟𝑎𝑡𝑖𝑜𝑛 𝑜𝑓 𝑠𝑎𝑚𝑝𝑙𝑒𝑠|
𝐴𝑣𝑒𝑟𝑎𝑔𝑒 𝑐𝑜𝑛𝑐𝑒𝑛𝑡𝑟𝑎𝑡𝑖𝑜𝑛 𝑜𝑓 𝑠𝑎𝑚𝑝𝑙𝑒𝑠 × 100
% 𝑅𝑒𝑐𝑜𝑣𝑒𝑟𝑦 = 𝐶𝑜𝑛𝑐𝑒𝑛𝑡𝑟𝑎𝑡𝑖𝑜𝑛 𝑜𝑓 𝑠𝑎𝑚𝑝𝑙𝑒 𝑠𝑝𝑖𝑘𝑒 − 𝐴𝑣𝑒𝑟𝑎𝑔𝑒 𝑐𝑜𝑛𝑒𝑛𝑡𝑟𝑎𝑡𝑖𝑜𝑛 𝑜𝑓 𝑠𝑎𝑚𝑝𝑙𝑒𝑠
𝑆𝑝𝑖𝑘𝑒 𝑐𝑜𝑛𝑐𝑒𝑛𝑡𝑟𝑎𝑡𝑖𝑜𝑛 × 100
𝑈𝑛𝑐𝑒𝑟𝑡𝑎𝑖𝑛𝑡𝑦 𝑜𝑓 𝑚𝑒𝑎𝑠𝑢𝑟𝑒𝑚𝑒𝑛𝑡 = 2 × 𝑠𝑡𝑎𝑛𝑑𝑎𝑟𝑑 𝑑𝑒𝑣𝑖𝑎𝑡𝑖𝑜𝑛

Assessing Atmospheric Emissions from Amine based CO2 PCC Process and their Impacts on the Environment – A Case Study
Volume 1: Measurement of emissions from a MEA-based PCC pilot plant | 97
Where:
Uncertainty of measurement is calculated assuming a confidence level of 95% and a coverage factor of 2. (NATA publication ‘Assessment of uncertainties of measurement’ R R Cook 2nd edn 2002)
Standard deviation is the standard deviation of (usually 3) injections of a solution (i.e. primary sample or sample spike)
Average concentration of samples is the average of (usually 3) injections of a primary sample
Concentration of sample repeat is the concentration of the target compound measured in the ‘repeat sample’.
Concentration of sample spike is the measured concentration of the ‘sample spike’. The measured concentration is the sum of the spiked concentration and the concentration of the target compound originally present in the sample.
Spike concentration is the concentration of a target compound added to a ‘spiked sample’.
RESULTS
Please refer to the following Tables:

NITROSAMINES
Table 15 Nitrosamines concentrations analysed by GC/MS
Sample ID Sample description
As received concentration
N-nitrosodimethylamine N-nitrosodiethylamine N-nitrosomorpholine Units
5041 Run 8 Impinger 1 Monash <87 <120 <96 µg/L
5041 repeat <87 <120 <96 µg/L
5041 spike <88 170 150 µg/L
<88 120 160 µg/L
<88 110 67 µg/L
Average 133 126 µg/L
Uncertainty of measurement* ± 64 ± 102 µg/L
Recovery 130 130 %
%RSD 24 41 %
5042 Run 8 Impinger 2 Monash <87 <120 <96 µg/L
5043 Run 8 Impinger 3 Monash <87 <120 <96 µg/L
5047 Run 9 Impinger 1 Monash <87 <120 <96 µg/L
5047 repeat <87 <120 <96 µg/L
5047 spike <88 87 77 µg/L
<88 49 82 µg/L
<88 77 92 µg/L
Average 71 84 µg/L
Uncertainty of measurement* ± 39 ± 15 µg/L
Recovery 71 84 %
%RSD 28 9.1 %
5048 Run 9 Impinger 2 Monash <87 <120 <96 µg/L
5049 Run 9 Impinger 3 Monash <87 <120 <96 µg/L
5134 W20_9 wash water Monash <87 <120 <96 µg/L
5134 repeat <87 <120 <96 µg/L
5134 spike <88 44 93 µg/L
<88 110 120 µg/L

Sample ID Sample description
As received concentration
N-nitrosodimethylamine N-nitrosodiethylamine N-nitrosomorpholine Units
<88 98 180 µg/L
Average 84 131 µg/L
Uncertainty of measurement* ± 70 ± 89 µg/L
Recovery 84 130 %
%RSD 42 34 %
5190 S20_9 solvent Monash <850 <1200 <930 µg/kg
5190 repeat <830 <1200 <920 µg/kg
5190 spike <820 1400 830 µg/kg
<830 350 550 µg/kg
<830 700 1900 µg/kg
Average 817 1093 µg/kg
Uncertainty of measurement* ± 1069 ± 1425 µg/kg
Recovery 83 110 %
%RSD 47 60 %
5150 W25_7 rinse washings Monash <87 <120 <96 µg/L
--- Laboratory blank <87 <120 <96 µg/L
--- Matrix spike <88 170 81 µg/L
<88 150 87 µg/L
<88 47 100 µg/L
Average 122 89 µg/L
Uncertainty of measurement* ± 132 ± 19 µg/L
Recovery 120 89 %
%RSD 54 11 %
* Uncertainty of measurement represents the 95% confidence interval and was calculated two standard deviations of triplicate measurements. Uncertainty of measurement is reported for spiked samples only as native samples are all below the PQL.

Assessing Atmospheric Emissions from Amine based CO2 PCC Process and their Impacts on the Environment – A Case Study
100 | Volume 1: Measurement of emissions from a MEA-based PCC pilot plant
MEA
Table 16. MEA concentrations analysed by GC FID
Sample ID Sample description MEA concentration Units
5041 Run 8 Impinger 1 Monash <50 mg/L
5041 repeat <50 mg/L
5042 Run 8 Impinger 2 Monash <10 mg/L
5043 Run 8 Impinger 3 Monash <10 mg/L
5047 Run 9 Impinger 1 Monash 390 mg/L
510 mg/L
480 mg/L
Average 460 mg/L
Uncertainty of measurement* ± 125 mg/L
%RSD 14
5047 repeat 430 mg/L
480 mg/L
440 mg/L
Average 450 mg/L
Uncertainty of measurement* ± 53 mg/L
%RSD 6
5048 Run 9 Impinger 2 Monash <50 mg/L
5049 Run 9 Impinger 3 Monash <50 mg/L
5134 W20_9 wash water Monash 1600 mg/L
1600 mg/L
1500 mg/L
Average 1600 mg/L
Uncertainty of measurement* ± 115 mg/L
%RSD 4
5134 spike 210 mg/L
210 mg/L
210 mg/L
Average 210 mg/L
Uncertainty of measurement* ± 6 mg/L
%RSD 1
Recovery (50 mg/L spike) 107
5190 S20_9 solvent Monash 26 % (w/w)
28 % (w/w)
26 % (w/w)
Average 27 % (w/w)
Uncertainty of measurement* ± 2.3 % (w/w)
%RSD 4
5150 W25_7 rinse washings Monash <10 mg/L
0000 Laboratory blank <10 mg/L
* Uncertainty of measurement represents the 95% confidence interval and was calculated two standard deviations of triplicate measurements.

Assessing Atmospheric Emissions from Amine based CO2 PCC Process and their Impacts on the Environment – A Case Study
Volume 1: Measurement of emissions from a MEA-based PCC pilot plant | 101
AMIDES
Table 17. Amide concentrations analysed by GC/MS
Sample ID Sample description Formamide Acetamide Units
5041 Run 8 Impinger 1 Monash <0.5 <0.3 mg/L
<0.5 <0.3 mg/L
<0.5 <0.3 mg/L
5041 repeat <0.5 <0.3 mg/L
5041 spike 2.3 1.7 mg/L
2.3 1.8 mg/L
2.1 1.7 mg/L
Average 2.2 1.7 mg/L Uncertainty of measurement^ ± 0.2 ± 0.1 mg/L
Spike concentration 10 10 mg/L
Recovery 22 17 %
%RSD 5 3 %
5042 Run 8 Impinger 2 Monash <0.5 <0.3 mg/L
5043 Run 8 Impinger 3 Monash <0.5 <0.3 mg/L
5047 Run 9 Impinger 1 Monash <0.5 <0.3 mg/L
<0.5 <0.3 mg/L
<0.5 <0.3 mg/L
5047 repeat <0.5 <0.3 mg/L
5047 spike 3 3.2 mg/L
2.6 2.9 mg/L
2.3 2.4 mg/L
Average 2.6 2.8 mg/L Uncertainty of measurement^ ± 0.7 ± 0.8 mg/L
Spike concentration 10 10 mg/L
Recovery 26 28 %
%RSD 13 14 %
5048 Run 9 Impinger 2 Monash <0.5 <0.3 mg/L
5049 Run 9 Impinger 3 Monash <0.5 <0.3 mg/L
5134 W20_9 wash water Monash <0.5 <0.3 mg/L
<0.5 <0.3 mg/L
<0.5 <0.3 mg/L
5134 repeat <0.5 <0.3 mg/L
5134 spike 3 3.5 mg/L
3.1 3.9 mg/L
2.9 3.9 mg/L
Average 3.0 3.8 mg/L Uncertainty of measurement^ ± 0.2 ± 0.5 mg/L
Spike concentration 10 10 mg/L
Recovery 30 38 %
%RSD 3 6 %
5150 W25_7 rinse washings
Monash <0.5 <0.3 mg/L

Assessing Atmospheric Emissions from Amine based CO2 PCC Process and their Impacts on the Environment – A Case Study
102 | Volume 1: Measurement of emissions from a MEA-based PCC pilot plant
5190 S20_9 solvent Monash <5 <3 mg/kg
<5 <3 mg/kg
<5 <3 mg/kg
5190 repeat <5 <3 mg/kg
5190 spike <25* 47 mg/kg
<25* 85 mg/kg
<25* 87 mg/kg
Average n/a 73 mg/L Uncertainty of measurement^ n/a ± 45 mg/L
Spike concentration 100 mg/kg
Recovery 73 %
%RSD 31 %
* Formamide peak visible but not quantifiable
^ Uncertainty of measurement represents the 95% confidence interval and was calculated two standard deviations of triplicate measurements. Uncertainty of measurement is not reported for samples because they are all below the PQL.

Assessing Atmospheric Emissions from Amine based CO2 PCC Process and their Impacts on the Environment – A Case Study
Volume 1: Measurement of emissions from a MEA-based PCC pilot plant | 103
ALKYLAMINES
Table 18. Methylamine and ethylamine concentrations analysed as their pentafluorobenzene imines by GC/MS
Sample ID Sample description Methylamine Ethylamine Units
5041 Run 8 Impinger 1 Monash <0.36 0.75 mg/L 5041 <0.36 0.43 mg/L 5041 <0.36 0.51 mg/L
Average n/a 0.56 mg/L Uncertainty of measurement* n/a ± 0.33 mg/L
5041 repeat <0.36 0.40 mg/L 5041 spike <0.36 3.0 mg/L 5041 spike <0.36 2.8 mg/L 5041 spike <0.36 3.1 mg/L
Average n/a 3.0 mg/L Uncertainty of measurement* n/a ± 0.31 mg/L
Spike concentration 3.3 mg/L %RSD 30 % %RPD 16 %
% recovery 74 % 5042 Run 8 Impinger 2 Monash <0.36 <0.095 mg/L 5043 Run 8 Impinger 3 Monash <0.36 <0.095 mg/L 5047 Run 9 Impinger 1 Monash 12 0.37 mg/L 5047 14 0.58 mg/L 5047 12 0.64 mg/L
Average 13 0.53 mg/L Uncertainty of measurement* ± 2.3 ± 0.28 mg/L
5047 repeat 12 0.36 mg/L %RSD 27 % %RPD 17 % 5048 Run 9 Impinger 2 Monash <0.36 <0.095 mg/L 5049 Run 9 Impinger 3 Monash <0.36 <0.095 mg/L 5134 W20_9 wash water Monash 16 0.68 mg/L 5134 17 0.55 mg/L 5134 18 0.55 mg/L
Average 17 0.59 mg/L Uncertainty of measurement* ± 2.0 ± 0.15 mg/L
5134 repeat 17 0.41 mg/L 5134 spike 18 2.5 mg/L 5134 spike 16 2.3 mg/L 5134 spike 17 2.4 mg/L
Average 17 2.4 mg/L Uncertainty of measurement* ± 2.0 ± 0.20 mg/L
Spike concentration 3.3 mg/L %RSD 13 % %RPD 17 %
% recovery 56 % 5150 W25_7 rinse washings Monash <0.36 <0.095 mg/L 5190 S20_9 solvent Monash 6.3 0.29 mg/L 5190 5.1 0.20 mg/L 5190 4.9 0.22 mg/L
Average 5.43 0.24 mg/L Uncertainty of measurement* ± 1.5 ± 0.09 mg/L
5190 repeat 5.5 0.22 mg/L 5190 spike 5.5 3.0 mg/L 5190 spike 5.7 2.3 mg/L 5190 spike 5.1 2.7 mg/L
Average 5.43 2.7 mg/L Uncertainty of measurement* ± 0.61 ± 0.70 mg/L

Assessing Atmospheric Emissions from Amine based CO2 PCC Process and their Impacts on the Environment – A Case Study
104 | Volume 1: Measurement of emissions from a MEA-based PCC pilot plant
Spike concentration 3.3 mg/L %RSD 20 % %RPD 4 %
% recovery 74 %
* Uncertainty of measurement represents the 95% confidence interval and was calculated two standard deviations of triplicate measurements.
%RSD calculated for 3 replicate injections
%RPD calculated from the difference between the average of 3 replicate injections and 1 injection of the repeat sample
% recovery calculated as difference between the average of all 4 sample injections and the 3 spiked sample injections

Assessing Atmospheric Emissions from Amine based CO2 PCC Process and their Impacts on the Environment – A Case Study
Volume 1: Measurement of emissions from a MEA-based PCC pilot plant | 105
ADVANCED ANALYTICAL AUSTRALIA (AAA) - TECHNICAL REPORT 1
METHOD DEVELOPMENT FOR THE DETERMINATION OF ALKYLAMINES
Reproduced in full with the permission of Attila Tottszer, Business & Development Manager, AAA
Progress Report on the Analysis of Primary and Secondary Amines in Monoethanolamine Solutions
Report No: A12/2284-B
Report for Anne Tibbett, CSIRO
Prepared by Grant Wyllie and Mark Lewin
Friday 26th October, 2012
Summary
Effort in the development of an analytical method for methylamine, ethylamine, and dimethylamine in monoethanolamine solutions based on derivatisation and solid phase micro extraction (SPME) gas chromatography mass spectrometry (GCMS) has been undertaken.
Derivatisation using perfluorobenzaldehyde (PFBAY) have posed significant challenges with regard to reproducibility and sensitivity. Extractions of primary amine PFBAY derivatives based on SPME techniques have been found unreliable and less sensitive than initially expected.
Liquid-liquid extraction of PFBAY derivatives has been shown to be a more robust approach and has been demonstrated to approach a limit of quantitation of 1 µg/L for methylamine and ethylamine in water. Analysis of monoethanolamine solutions has been less successful and preliminary results suggest significant development effort is required.
Analysis of dimethylamine without derivatisation using SPME and liquid-liquid extraction techniques has been unsuccessful.
Method Development based on SPME
The methodology developed by Pan1 and in particular Llop2 was used as the basis for this investigation.
In summary the method involved adding specific amounts of standard target amines to 10mL of deionised water adjusted to pH 12 in a 20mL glass headspace vial fitted with a septum. The reagent PFBAY was added and the vial incubated at 40 °C for 15 minutes then the SPME fibre inserted manually and the headspace sampled for a further 15 minutes before analysis by GCMS in the SIM mode. In some cases, to test the affect of the sample matrix, monoethanolamine (MEA) was added to the vial at specified concentrations.
The results of analysing simple sample mixtures in water matrix over a range of concentrations were promising; see figures 1 and 2 for chromatograms of amines at 2000 and 20 µg/L.

Assessing Atmospheric Emissions from Amine based CO2 PCC Process and their Impacts on the Environment – A Case Study
106 | Volume 1: Measurement of emissions from a MEA-based PCC pilot plant
Figure 1: SPME-GCMS of amines in deionised water, 2000 µg/L
Figure 2: SPME-GCMS of amines in deionised water, 20 µg/L
As method reliability and reproducibility were tested it became clear that these aspects of the method were not satisfactory. For example, when a set of replicates were prepared and the reagent added to each at time zero and then these were analysed successively throughout the day the results showed a significant and non reproducible downward trend. On the assumption that the derivatives were decomposing with time the tests were repeated with the reagent being added just before analysis. This improved results to some extent but at low concentrations the variability was still not acceptable. Since there were some reports in the literature that amines interacted with glass surfaces the experiments were repeated using silanised glass vials. No significant improvement was found.

Assessing Atmospheric Emissions from Amine based CO2 PCC Process and their Impacts on the Environment – A Case Study
Volume 1: Measurement of emissions from a MEA-based PCC pilot plant | 107
Seven replicates of 1000 µg/L propylamine in silanised glass vials, treated with the reagent directly before analysis were measured. The responses obtained for each sample are plotted against time from initial preparation in figure 3.
Figure 3: Propylamine response as a function of time.
The reasons for the decline in response are not apparent but may be a result of variability in the activity of the SPME needle with use. This level of reliability is not acceptable. An internal standard was used in an attempt overcome this problem.
For the results graphed below the vials were silanised, the reagent added directly before the analysis step, an internal standard (propylamine) was added and all temperatures and timing closely controlled. Figures 4, 5, and 6 show calibration data for three separate calibration sets ranging in concentration from 20 to 2000 µg/L of methylamine and ethylamine.
0
5000000
10000000
15000000
20000000
25000000
0 50 100 150 200 250
Are
a R
esp
on
se
Time (min)
Response of Seven samples of 1.0ppm Propylamine with Time
Propylamineresponse
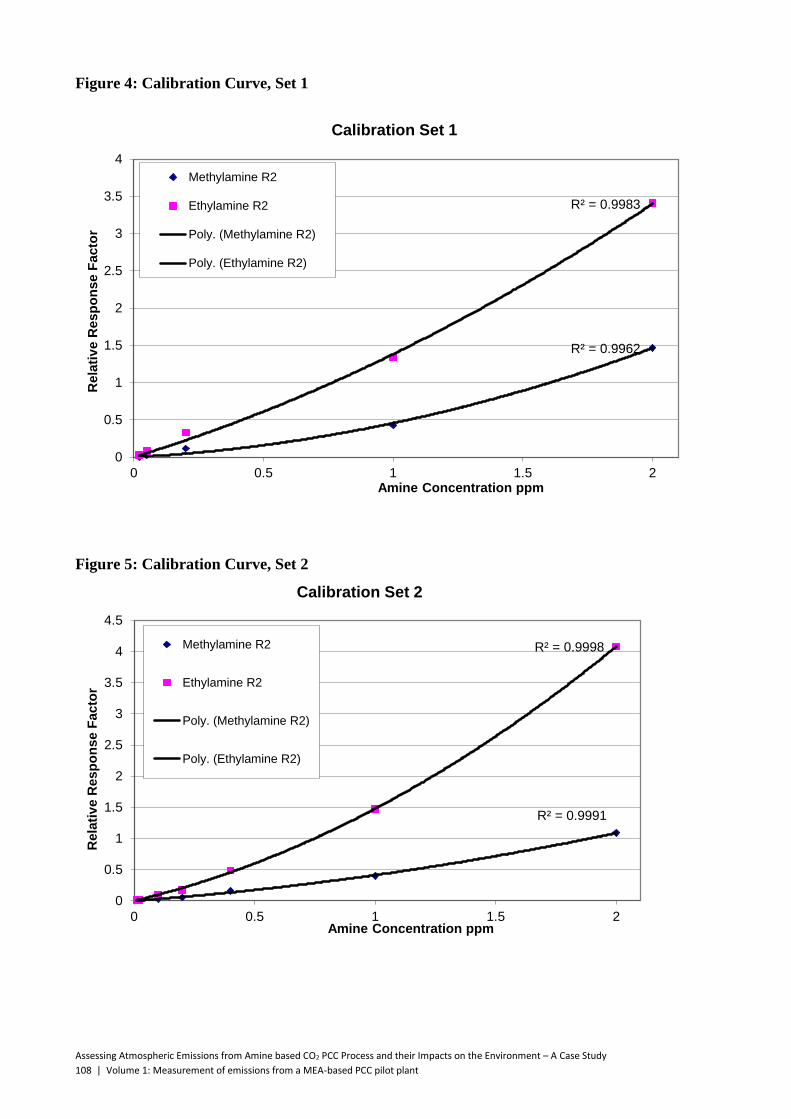
Assessing Atmospheric Emissions from Amine based CO2 PCC Process and their Impacts on the Environment – A Case Study
108 | Volume 1: Measurement of emissions from a MEA-based PCC pilot plant
Figure 4: Calibration Curve, Set 1
Figure 5: Calibration Curve, Set 2
R² = 0.9962
R² = 0.9983
0
0.5
1
1.5
2
2.5
3
3.5
4
0 0.5 1 1.5 2
Rela
tiv
e R
esp
on
se F
acto
r
Amine Concentration ppm
Calibration Set 1
Methylamine R2
Ethylamine R2
Poly. (Methylamine R2)
Poly. (Ethylamine R2)
R² = 0.9991
R² = 0.9998
0
0.5
1
1.5
2
2.5
3
3.5
4
4.5
0 0.5 1 1.5 2
Rela
tiv
e R
esp
on
se F
acto
r
Amine Concentration ppm
Calibration Set 2
Methylamine R2
Ethylamine R2
Poly. (Methylamine R2)
Poly. (Ethylamine R2)

Assessing Atmospheric Emissions from Amine based CO2 PCC Process and their Impacts on the Environment – A Case Study
Volume 1: Measurement of emissions from a MEA-based PCC pilot plant | 109
Figure 6: Calibration Curve, Set 3
Although the calibration curves obtained for each set using the internal standard gave acceptable quadratic curve fits, the percent standard deviation between the Relative Response factors for the analytes between sets ranged from 10-29%. This variability, most marked at low concentrations, means that this method is not acceptable for measurements of the target analytes at the required concentrations. Additionally we were not able to reproduce the detection limits reported in the literature in our laboratory and thus the option of diluting the sample to reduce the matrix interference is very limited.
An effort in exploring the use of negative ion chemical ionization (NCI) and positive ion chemical ionization (PCI) detection techniques did not provide sufficient gains in analyte sensitivity and were not pursued using SPME techniques.
Investigation of Monoethanolamine in the Sample Matrix Monoethanolamine (MEA), a primary amine, will react with the PFBAY reagent in competition with the target analytes hence the relative reactivities of the components and amount of reagent will be important factors to consider.
Preliminary tests showed that methylamine and ethylamine could be readily detected at a concentration of 2000 µg/L in the presence of 3% MEA with a large peak due to the MEA derivative also being found, illustrated in figure 7. However the quantitation limit was now 200 rather than 20 µg/L. To lower this limit, among other things, would require the addition of considerable amounts of PFBAY reagent which both adds to the background interferences and was not explored further.
R² = 0.9978
R² = 0.9988
0
0.5
1
1.5
2
2.5
3
3.5
0 0.5 1 1.5 2
Rela
tiv
e R
esp
on
se F
acto
r
Amine Concentration ppm
Calibration Set 3
Methylamine R2
Ethylamine R2
Poly. (Methylamine R2)
Poly. (Ethylamine R2)

Assessing Atmospheric Emissions from Amine based CO2 PCC Process and their Impacts on the Environment – A Case Study
110 | Volume 1: Measurement of emissions from a MEA-based PCC pilot plant
Figure 7: Primary amine analysis in the presence of 3% MEA
A calibration curve for the target analytes, shown in figure 8, and determined in 1% MEA, gave acceptable relationships in the range 20 - 2000 µg/L but is subject to the same reliability concerns expressed in deionised water.
Figure 8: Calibration curves of primary amines in the presence of 1% MEA.
Although the PFBAY derivatisation and SPME approach gave some reasonable results, the method did not exhibit sufficient reliability and robustness to recommend that it be adopted as a technique for the analysis of methylamine and ethylamine at the concentration levels required.
R² = 0.9998
R² = 0.9991
0
1
2
3
4
5
6
7
8
0.00 0.50 1.00 1.50 2.00
Re
lati
ve R
esp
on
se F
acto
r
Amine Concentration ppm
Methylamine and Ethylamine Calibration in 1% Ethanolamine
Methylamine RF
Ethylamine RF
Poly. (Methylamine RF)
Poly. (Ethylamine RF)

Assessing Atmospheric Emissions from Amine based CO2 PCC Process and their Impacts on the Environment – A Case Study
Volume 1: Measurement of emissions from a MEA-based PCC pilot plant | 111
Analysis of Dimethylamine Literature reports that the use of this technique for the analysis of the non derivatised dimethylamine will not meet the specified sensitivity requirements have been confirmed and an alternative approach will need to be developed.
Method Development based on Liquid-Liquid Extraction To determine if PFBAY derivative stability under the extraction conditions and/or the performance of the SPME fibre were limiting factors in the work described above, a liquid-liquid extraction (LLE) method was developed. The extraction and analysis was performed on methylamine, ethylamine, and propylamine. The extraction method and GCMS conditions are described below.
LLE Extraction Method
Adjust the pH of the sample to pH 12 using NaOH.
Weigh 3.6 g NaCl into a 40 mL screw cap vial.
Measure 10 mL of sample into the 40 mL screw cap vial.
Spike the sample with primary amines as required.
Add 2 mL of hexane.
Add 100 µL of 4000 mg/L PFBAY in acetonitrile.
Cap and shake for 5 minutes.
Allow the sample to settle and the phases to separate for 1 minute.
Remove approximately 1mL of hexane extract and dry over 1g anhydrous sodium sulfate.
Transfer the extract into a GC vial for analysis.
GCMS Conditions GCMS analysis was performed on a Varian CP3800 gas chromatograph fitted with a Phenomenex ZB-5MSi 30 m × 0.25 mm × 0.25 µm capillary column, a 1079 PTV inlet, a Varian 1200 mass spectrometer, and an ATAS Focus autosampler. Instrument parameters are summarized in table 1.
Table 1.
Parameter Setting
Injection Volume 2 µL
Inlet Temperature Program 55 oC, hold for 0.05 min, then ramp at 200 oC/min to 280 oC, hold until end of run.
Split Flow Program Splitless, hold for 1.00 min, then 100:1 split ratio for 3 minutes, then 10:1 split ratio until end of run.
Column Flow 1.2 mL/min, constant flow, He carrier, OR 1.6 mL/min, constant flow, H2 carrier.
Column Oven Program 45 oC, hold for 1.10 min, then ramp at 100 oC/min to 85 oC, then ramp at 25 oC/min to 170 oC, then ramp at 100 oC/min to 320 oC, hold for 2.50 min. Total run time is 8.90 minutes.
Transfer Line Temperature 280 oC
Ion Source Temperature 280 oC (positive EI) OR 150 oC (negative CI)
Electron Energy 70 eV (positive EI) OR 150 eV (negative CI)
Positive EI Monitored Ions 181, 208, 209. 50 ms dwell time each ion.

Assessing Atmospheric Emissions from Amine based CO2 PCC Process and their Impacts on the Environment – A Case Study
112 | Volume 1: Measurement of emissions from a MEA-based PCC pilot plant
Negative CI Monitored Ions 209, 223, 237. 50 ms dwell time each ion.
Negative CI Gas Methane, 10 Torr source pressure.
Results Chromatographic conditions were established using helium carrier gas and positive electron ionisation. Ions 181, 208, ad 209 were common to PFBAY derivatives of methylamine, ethylamine, and propylamine and were also the most intense ions. Samples were spiked at between 1 and 100 µg/L. Examples of the chromatography and sensitivity under these conditions are shown in figures 9 and 10.
Figure 9: Positive EI chromatogram of ion 208, 100 µg/L
Figure 10: Positive EI chromatogram of ion 208, 1 µg/L
The linearity of all three amines over the range 1 - 100 µg/L was acceptable; however the sensitivity at 1 µg/L was close to the limit of detection. It is important to note that the sensitivity of each amine is similar, in contrast to the SPME experiments where propylamine is more intense than methylamine and ethylamine. This result suggests significant discrimination is experienced by the SPME fibre for the amines of interest.
As the stability of the PFBAY derivatives was a concern during the SPME experiments, the initial extracts were stored at room temperature for 24 hours and subsequently re-analysed. The excellent agreement with the original analysis (shown in figures 11 and 12) demonstrate that the PFBAY derivatives are stable under the chosen extraction conditions. It is not clear from the results whether exposure to high pH for extended times, as experienced during SPME experiments, is the cause of degradation of the derivatives. Derivatives during LLE are exposed to pH 12 conditions for significantly less time, and extraction into hexane and drying over sodium sulphate minimise residual high pH water in the final extracts.
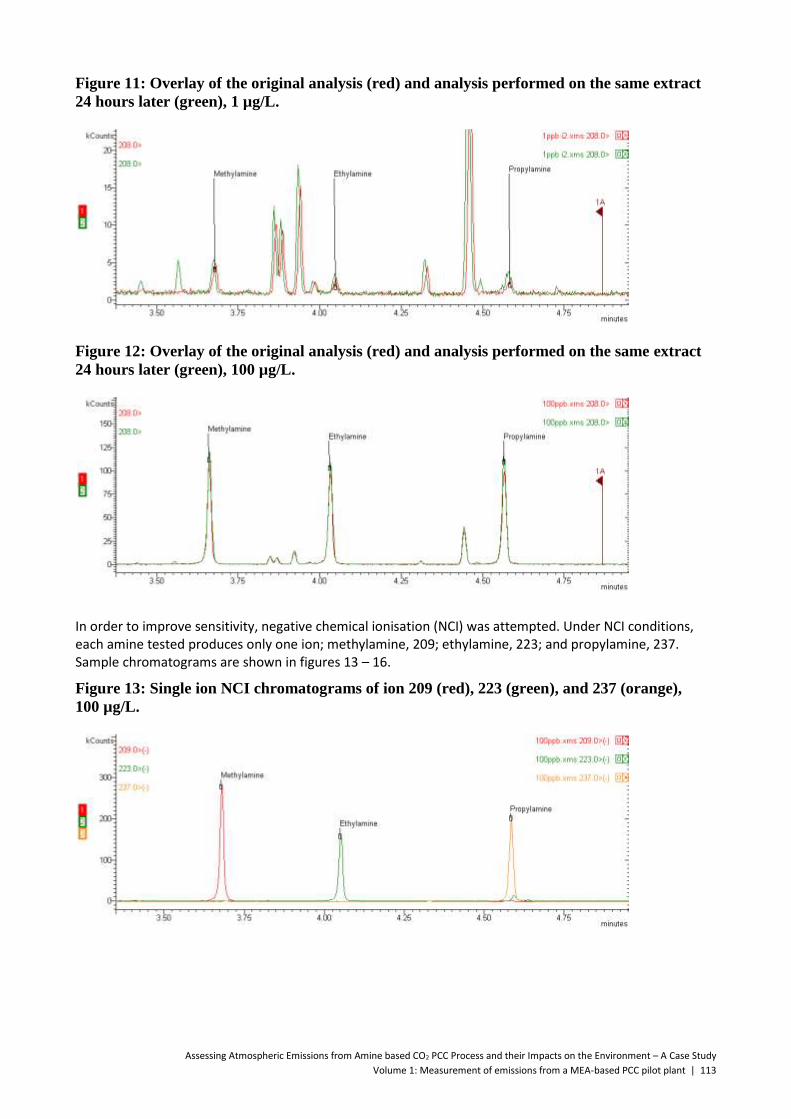
Assessing Atmospheric Emissions from Amine based CO2 PCC Process and their Impacts on the Environment – A Case Study
Volume 1: Measurement of emissions from a MEA-based PCC pilot plant | 113
Figure 11: Overlay of the original analysis (red) and analysis performed on the same extract
24 hours later (green), 1 µg/L.
Figure 12: Overlay of the original analysis (red) and analysis performed on the same extract
24 hours later (green), 100 µg/L.
In order to improve sensitivity, negative chemical ionisation (NCI) was attempted. Under NCI conditions, each amine tested produces only one ion; methylamine, 209; ethylamine, 223; and propylamine, 237. Sample chromatograms are shown in figures 13 – 16.
Figure 13: Single ion NCI chromatograms of ion 209 (red), 223 (green), and 237 (orange),
100 µg/L.

Assessing Atmospheric Emissions from Amine based CO2 PCC Process and their Impacts on the Environment – A Case Study
114 | Volume 1: Measurement of emissions from a MEA-based PCC pilot plant
Figure 14: Single ion NCI chromatogram of ion 209 (methylamine), 1 µg/L.
Figure 15: Single ion NCI chromatogram of ion 223 (ethylamine), 1 µg/L.
Figure 16: Single ion NCI chromatogram of ion 237 (propylamine), 1 µg/L.
Sensitivity using NCI was found superior to positive EI, with an estimated 1 µg/L quantitation limit. Overall sensitivity gains for NCI were approximately 2 to 5 times greater than positive EI. Hydrogen carrier gas was also tested as some compounds can exhibit higher sensitivity with hydrogen than with helium using NCI. An example chromatogram is shown in figure 17; further sensitivity improvements were not evident. No attempt was made to adjust the chromatography for hydrogen carrier gas.

Assessing Atmospheric Emissions from Amine based CO2 PCC Process and their Impacts on the Environment – A Case Study
Volume 1: Measurement of emissions from a MEA-based PCC pilot plant | 115
Figure 17: Chromatogram recorded using hydrogen carrier gas and NCI, 1 µg/L.
Linearity using NCI was considerably poorer than when employing positive EI for all tested amines; an example of calibration curve comparison is shown in figure 18. The cause for this behaviour has not been investigated at this time.
Figure 18: Calibration curves for methylamine under positive EI and NCI conditions.
Investigation of Monoethanolamine in the Sample Matrix The presence of monoethanolamine during liquid-liquid extraction, and subsequent analysis using negative chemical ionisation was investigated and found to have a detrimental effect on sensitivity. Figure 19 illustrates this loss in sensitivity when MEA is present at 3%; the peak area for methylamine is reduced to 8% of the equivalent extraction without MEA present, ethylamine is reduced to 12%, and propylamine to 16%.
R² = 0.994
R² = 0.9878
0.E+00
5.E+04
1.E+05
2.E+05
2.E+05
3.E+05
3.E+05
0 20 40 60 80 100
Pe
ak A
rea
Sample Concentration (ug/L)
Methylamine Calibration Curves
EI NCI Linear (EI) Linear (NCI)
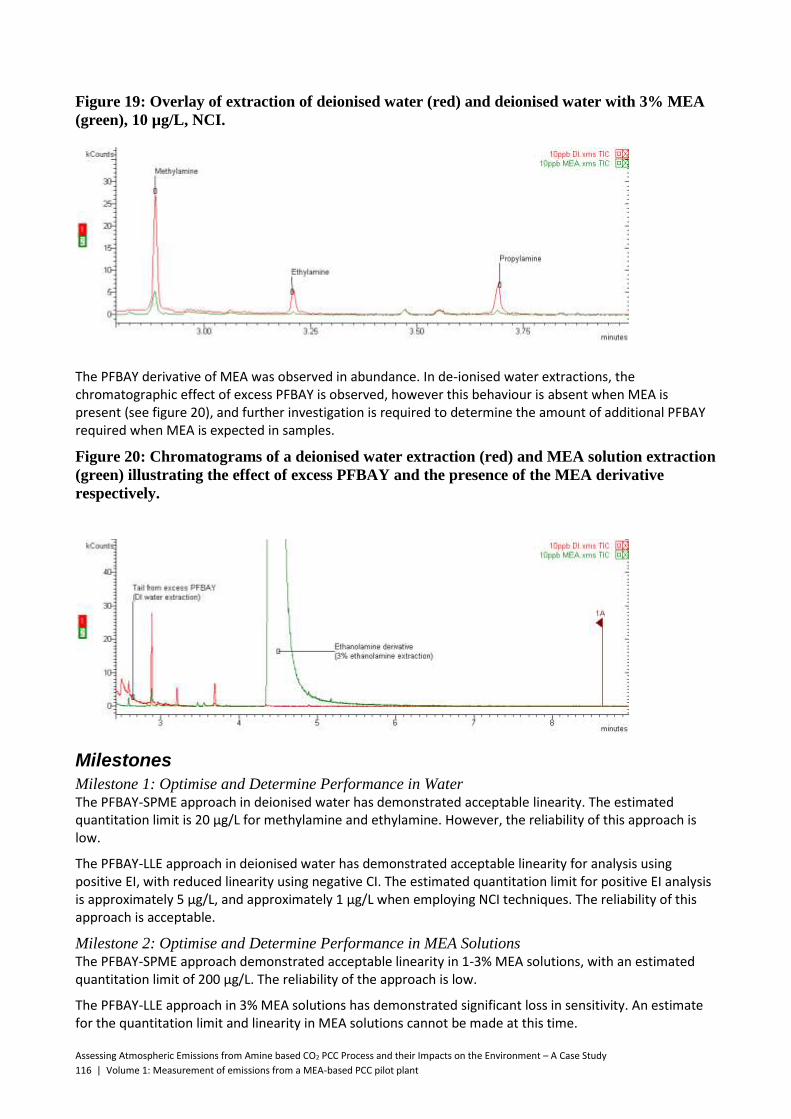
Assessing Atmospheric Emissions from Amine based CO2 PCC Process and their Impacts on the Environment – A Case Study
116 | Volume 1: Measurement of emissions from a MEA-based PCC pilot plant
Figure 19: Overlay of extraction of deionised water (red) and deionised water with 3% MEA
(green), 10 µg/L, NCI.
The PFBAY derivative of MEA was observed in abundance. In de-ionised water extractions, the chromatographic effect of excess PFBAY is observed, however this behaviour is absent when MEA is present (see figure 20), and further investigation is required to determine the amount of additional PFBAY required when MEA is expected in samples.
Figure 20: Chromatograms of a deionised water extraction (red) and MEA solution extraction
(green) illustrating the effect of excess PFBAY and the presence of the MEA derivative
respectively.
Milestones
Milestone 1: Optimise and Determine Performance in Water The PFBAY-SPME approach in deionised water has demonstrated acceptable linearity. The estimated quantitation limit is 20 µg/L for methylamine and ethylamine. However, the reliability of this approach is low.
The PFBAY-LLE approach in deionised water has demonstrated acceptable linearity for analysis using positive EI, with reduced linearity using negative CI. The estimated quantitation limit for positive EI analysis is approximately 5 µg/L, and approximately 1 µg/L when employing NCI techniques. The reliability of this approach is acceptable.
Milestone 2: Optimise and Determine Performance in MEA Solutions The PFBAY-SPME approach demonstrated acceptable linearity in 1-3% MEA solutions, with an estimated quantitation limit of 200 µg/L. The reliability of the approach is low.
The PFBAY-LLE approach in 3% MEA solutions has demonstrated significant loss in sensitivity. An estimate for the quantitation limit and linearity in MEA solutions cannot be made at this time.

Assessing Atmospheric Emissions from Amine based CO2 PCC Process and their Impacts on the Environment – A Case Study
Volume 1: Measurement of emissions from a MEA-based PCC pilot plant | 117
Recommendation for Further Investigation
The SPME based approach used experienced significant issues with reliability and sensitivity and it is recommended that further SPME method development is not undertaken at this time.
The Liquid-Liquid extraction based approach has demonstrated excellent extract stability and sufficient sensitivity for experiments conducted in deionised water. The presence of excess PFBAY, and/or MEA, are components of the method which are recommended for further investigation.
It is recommended that further investigation into the suitability of PFBAY and LLE for the analysis of methylamine and ethylamine in MEA solutions be performed, to assess the reliability of the approach and to improve the sensitivity.
It is recommended that the additional derivatisation reagents N-succinimidyl benzoate and N-succinimidyl pentafluorobenzoate be investigated. This recommendation is based on literature3 which suggests that N-succinimidyl benzoate can be used successfully for the analysis of the primary and secondary amines of concern. The pentafluoro equivalent is expected to allow sensitivity enhancement when employing NCI.
It is recommended that the additional derivatisation reagent pentafluorobenzoyl chloride be investigated. This recommendation is based on literature4 which suggests that this derivatisation agent is suitable for the analysis of primary amines in complex water samples such as river water and trade waste water.
The analysis of dimethylamine using SPME was unsuccessful and was not attempted during as part of the LLE investigations. A suitable method for dimethylamine will require further investigation.
Dr Mark Lewin
Senior Research and Development Chemist
Advanced Analytical Australia Pty. Ltd.
References Journal of Chromatography A, 773 (1997) 249-260
Journal of Chromatography A, 1016 (2003) 575-581
Journal of Chromatography A, 1021 (2003) 175-181
Journal of Chromatography A, 1218 (2011) 5683-5687

Assessing Atmospheric Emissions from Amine based CO2 PCC Process and their Impacts on the Environment – A Case Study
118 | Volume 1: Measurement of emissions from a MEA-based PCC pilot plant
ADVANCED ANALYTICAL AUSTRALIA (AAA) - TECHNICAL REPORT 2
METHOD DEVELOPMENT FOR THE DETERMINATION OF NDELA AND NMOR NITROSAMINES
Reproduced in full with the permission of Attila Tottszer, Business & Development Manager, AAA
Analysis of
N-Nitrosodiethanolamine and
N-Nitrosomorpholine in Ethanolamine Solutions
Document Number
A12-4540
Issue
01
Issue Description Date Approved Author Approved by
01 Analysis of N-nitrosodiethanolamine and N-nitrosomorpholine in ethanolamine solutions
R.Nimmagadda

Assessing Atmospheric Emissions from Amine based CO2 PCC Process and their Impacts on the Environment – A Case Study
Volume 1: Measurement of emissions from a MEA-based PCC pilot plant | 119
1. INTRODUCTION
The primary aim of the project was to improve the limits of reporting and to optimize the previously reported analytical method (see report A12-2284A) for the analysis of NMOR and NDELA in three different matrices. These matrices include solutions of 30% ethanolamine, 1% ethanolamine and DI water. In addition to optimizing the analytical conditions for the detection of NDELA and NMOR, the other goals of the project were; quantification of NDELA using isotopic labelled internal standard; to obtain information on the unknown impurity detected in the previous study (A12-2284A); improving chromatographic separation for NDELA from the unknown impurities detected in Tarong samples reported in the previous study (A12-2284A); and comparing the analysis of a Tarong sample on a relatively low resolution triple quadrupole LCMSMS compared to UPLCMSMS-QTRAP, to check if the unknown peak and NDELA were co-eluting.
2. DEFINITIONS
NA Nitrosamines
NDELA N-nitrosodiethanolamine
NMOR N-nitrosomorpholine
UPLC Ultra performance Liquid Chromatography
ESI Electrospray Ionisation
LCMSMS Liquid Chromatography coupled with triple Quadrupole Mass Spectrometry
QTRAP triple Quadrupole –Linear Ion Trap Mass Spectrometer
MRM Multiple Reaction Monitoring
MSDS Material Safety Data Sheet
DI water De-ionized Water
LOR Limit of Reporting
v/v Volume by Volume
3. HAZARDS / PRECAUTIONS
In addition to the safe laboratory practices recommended in Australian Standard (AS2243: Safety in
Laboratories), gloves, laboratory coats and safety glasses should be worn at all times when handling
hazardous materials. Refer to Material Safety Data Sheets (MSDS’s) for further information prior to
commencement of work.
Caution: NA solutions are toxic and possible carcinogenic agents. Avoid ingestion or contact with the skin.
Laboratory personnel should follow normal laboratory safety precautions and have ready access to material
safety data sheets (MSDS) for all hazardous substances used in the test procedure, should work in a well-
ventilated environment, and be pr9999ovided with appropriate safety protection, including clothing, gloves and
eyewear.

Assessing Atmospheric Emissions from Amine based CO2 PCC Process and their Impacts on the Environment – A Case Study
120 | Volume 1: Measurement of emissions from a MEA-based PCC pilot plant
4. EXPERIMENTAL
4.1 General
Unless otherwise specified, deionised water (organic-free) should be used and all reagents should be of analytical reagent grade or better.
4.2 Specific Reagents
4.2.1 Milli-Q water (Filtered water through 0.22 µm membrane)
4.2.2 Methanol HPLC grade (CAS: 67-56-1)
4.2.3 Ammonium formate HCO2NH4 (CAS: 540-69-2)
4.2.4 Formic acid 98-100% (CAS: 64-18-6)
4.2.5 Ammonia (CAS: 7664-41-7)
4.3 Reference Materials and Standards
4.3.1 EPA 8270 Appendix IX Nitrosamine Mix 2000 mg/L; Supelco (lot no.LB78693)
(N-nitrosodimethylamine (NDMA); N-nitrosomethylethylamine (NMEA); N-nitrosopyrrolidine (NPyr); N-nitrosopiperidine (NPip); N-nitrosomorpholine (NMOR); N-nitrosodi-n-propylamine (NPrA); N-nitrosodi-n-butylamine (NBuA) and N-nitrosodiphenylamine (NPhA).
4.3.2 N-nitrosodiethanolamine 1000 mg/L; Restek (lot no.A086098)
4.3.3 N-Nitrosomorpholine-d8 (NMOR-d8) 99.10%; cdn isotopes (lot no.r659p29)
4.3.4 N-nitrosodiethanolamine-d8 (NDELA-d8) 98.90%; cdn isotopes (lot no.M404P2)
4.4 Apparatus
These specific apparatus are required for the analysis:
4.4.1 ABSCIEX QTRAP 5500; consisting of hybrid triple quadrupole–linear ion trap mass spectrometer equipped with positive & negative ESI source 4.4.2 Agilent 1290 HPLC system equipped with autosampler, column oven and binary solvent pumps 4.4.3 Varian -320 LCMSMS 4.4.4 Alltima HP C18 column (150mmx 2.1 mm i.d x 3 µm particle size) These general apparatus or their equivalents are required by the analysis
4.4.5 Analytical balance (e.g. Shimadzu AX 200 or equivalent) 4.4.6 Ultra sonicator (e.g. Ultrasonic or equivalent) 4.4.7 Vortex mixer 4.4.8 Adjustable and calibrated automatic pipettes covering the range of 10 µL to 1000 µL 4.4.9 Membrane filters: methanol compatible, pore size 0.22 µm 4.4.10 Syringe driven methanol compatible 0.22 µm membrane filters (e.g. PVDF durapore) 4.4.11 Plastic syringes; 1-2 mL 4.4.12 Vials suitable for the LCMSMS equipment 4.4.13 2 mL glass amber vials 4.4.14 2 mL glass clear vials 4.4.15 2 mL plastic vials 4.4.16 Calibrated volumetric flasks (5 mL) 4.4.17 Measuring cylinders (10 mL to 1000 mL) 4.4.18 Calibrated glass syringes ranging from 5 µL to 1000 µL
4.5 Handling of Standards
4.5.1 When reference standards are purchased, details are recorded in the Standards Registry.
4.5.2 When working mixed solutions are prepared, the details are recorded in Standard Solution Preparation Registry.

Assessing Atmospheric Emissions from Amine based CO2 PCC Process and their Impacts on the Environment – A Case Study
Volume 1: Measurement of emissions from a MEA-based PCC pilot plant | 121
4.5.3 Prior to opening, each ampoule should be allowed to warm to room temperature. Once the ampoule has been opened, accurate aliquots should be removed using calibrated volumetric equipment and transferred to an amber container for dilution and/or analysis as soon as possible.
4.5.4 Transfer all prepared standards to amber glass bottles and store in the refrigerator with the labels containing the following information: standard identification (reference number), standard name, standard concentration, analyst initials and expiry date
Note: The above standards are used for the preparation of calibration standards as well as for spiking control samples used in the spike recovery studies.
4.6 Reagents preparation
4.6.1 5 mM Ammonium formate in DI water Dissolve 315 mg of ammonium formate (4.2.3) in 900 mL of DI water, mix well and further dilute to 1000 mL using DI water and then filter through 0.22 μm membrane. The solution is stable for 1 week at room temperature. 4.6.2 5 mM Ammonium formate in DI water and pH adjusted to approximately 3.5 Dissolve 315 mg of ammonium formate (4.2.3) in 900 mL of DI water, mix well and further dilute to 1000 mL with DI water and add formic acid (4.2.4) until the pH is approximately 3.5, then filter through 0.22 μm membrane.
The solution is stable for 1 week at room temperature.
4.6.3 5 mM Ammonium formate in DI water pH adjusted to approximately 7.0 Dissolve 315 mg of ammonium formate (4.2.3) in 900 mL of DI water, mix well and further dilute to 1000 mL with DI water and add ammonia (4.2.5) until the pH is approximately 7, then filter through 0.22 μm membrane.
The solution is stable for 1 week at room temperature.
4.7 Standards preparation
4.7.1 EPA 8270 Appendix IX Nitrosamine Mix stock standard preparation at a concentration of 400 mg/L: 1 mL of 2000 mg/L EPA 8270 Appendix IX Nitrosamine Mix standard (4.3.1) was transferred into a 5 mL volumetric flask and the volume was made up to the mark with methanol.
4.7.2 NDELA stock standard preparation at a concentration of 100 mg/L: 0.5 mL of 1000 mg/L NDELA standard (4.3.2) was transferred into a 5 mL volumetric flask and the volume was made up to the mark with methanol.
4.7.3 NDELA stock standard preparation at a concentration of 10 mg/L 0.5 mL of 100 mg/L NDELA standard (4.7.2) was transferred into a 5 mL volumetric flask and the volume was made up to the mark with methanol.
4.7.4 NDELA stock standard preparation at a concentration of 1 mg/L 0.5 mL of 10 mg/L NDELA standard (4.7.3) was transferred into a 5 mL volumetric flask and the volume was made up to the mark with methanol.
4.7.5 NDELA and NAs standard preparation at a concentration of 10 mg/L Individual standards for NDELA and NAs were mixed using following volumes to prepare a mix standard at a concentration of 10 mg/L.
Analyte Concentration
(mg/L)
Volume of standard used
(mL)
Final volume with DI water (mL)
Final concentration
(mg/L)
NAs mix 400 (4.7.1) 0.125 5
10 NDELA
100 (4.7.2) 0.5
4.7.6 NDELA and NAs standard preparation at a concentration of 1 mg/L 0.5 ml of 10 mg/L mix standard (4.7.5) is transferred into a 5 mL volumetric flask and volume was made up to the mark using DI water.
4.7.7 NDELA and NAs standard preparation at a concentration of 0.1 mg/L 0.5 ml of 1 mg/L mix standard (4.7.6) is transferred into a 5 mL volumetric flask and volume was made up to the mark using DI water.
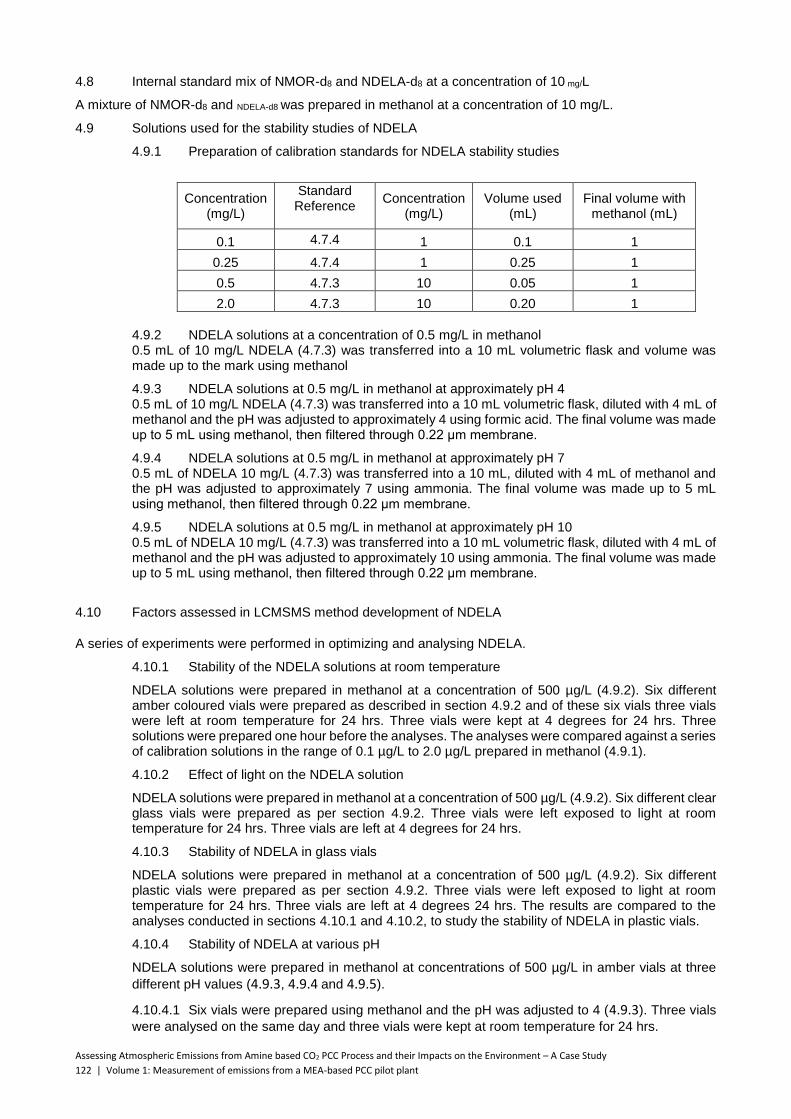
Assessing Atmospheric Emissions from Amine based CO2 PCC Process and their Impacts on the Environment – A Case Study
122 | Volume 1: Measurement of emissions from a MEA-based PCC pilot plant
4.8 Internal standard mix of NMOR-d8 and NDELA-d8 at a concentration of 10 mg/L
A mixture of NMOR-d8 and NDELA-d8 was prepared in methanol at a concentration of 10 mg/L.
4.9 Solutions used for the stability studies of NDELA
4.9.1 Preparation of calibration standards for NDELA stability studies
Concentration (mg/L)
Standard Reference
Concentration (mg/L)
Volume used (mL)
Final volume with methanol (mL)
0.1 4.7.4 1 0.1 1
0.25 4.7.4 1 0.25 1
0.5 4.7.3 10 0.05 1
2.0 4.7.3 10 0.20 1
4.9.2 NDELA solutions at a concentration of 0.5 mg/L in methanol 0.5 mL of 10 mg/L NDELA (4.7.3) was transferred into a 10 mL volumetric flask and volume was made up to the mark using methanol
4.9.3 NDELA solutions at 0.5 mg/L in methanol at approximately pH 4 0.5 mL of 10 mg/L NDELA (4.7.3) was transferred into a 10 mL volumetric flask, diluted with 4 mL of methanol and the pH was adjusted to approximately 4 using formic acid. The final volume was made up to 5 mL using methanol, then filtered through 0.22 μm membrane.
4.9.4 NDELA solutions at 0.5 mg/L in methanol at approximately pH 7 0.5 mL of NDELA 10 mg/L (4.7.3) was transferred into a 10 mL, diluted with 4 mL of methanol and the pH was adjusted to approximately 7 using ammonia. The final volume was made up to 5 mL using methanol, then filtered through 0.22 μm membrane.
4.9.5 NDELA solutions at 0.5 mg/L in methanol at approximately pH 10 0.5 mL of NDELA 10 mg/L (4.7.3) was transferred into a 10 mL volumetric flask, diluted with 4 mL of methanol and the pH was adjusted to approximately 10 using ammonia. The final volume was made up to 5 mL using methanol, then filtered through 0.22 μm membrane.
4.10 Factors assessed in LCMSMS method development of NDELA
A series of experiments were performed in optimizing and analysing NDELA.
4.10.1 Stability of the NDELA solutions at room temperature
NDELA solutions were prepared in methanol at a concentration of 500 µg/L (4.9.2). Six different amber coloured vials were prepared as described in section 4.9.2 and of these six vials three vials were left at room temperature for 24 hrs. Three vials were kept at 4 degrees for 24 hrs. Three solutions were prepared one hour before the analyses. The analyses were compared against a series of calibration solutions in the range of 0.1 µg/L to 2.0 µg/L prepared in methanol (4.9.1).
4.10.2 Effect of light on the NDELA solution
NDELA solutions were prepared in methanol at a concentration of 500 µg/L (4.9.2). Six different clear glass vials were prepared as per section 4.9.2. Three vials were left exposed to light at room temperature for 24 hrs. Three vials are left at 4 degrees for 24 hrs.
4.10.3 Stability of NDELA in glass vials
NDELA solutions were prepared in methanol at a concentration of 500 µg/L (4.9.2). Six different plastic vials were prepared as per section 4.9.2. Three vials were left exposed to light at room temperature for 24 hrs. Three vials are left at 4 degrees 24 hrs. The results are compared to the analyses conducted in sections 4.10.1 and 4.10.2, to study the stability of NDELA in plastic vials.
4.10.4 Stability of NDELA at various pH
NDELA solutions were prepared in methanol at concentrations of 500 µg/L in amber vials at three
different pH values (4.9.3, 4.9.4 and 4.9.5).
4.10.4.1 Six vials were prepared using methanol and the pH was adjusted to 4 (4.9.3). Three vials
were analysed on the same day and three vials were kept at room temperature for 24 hrs.
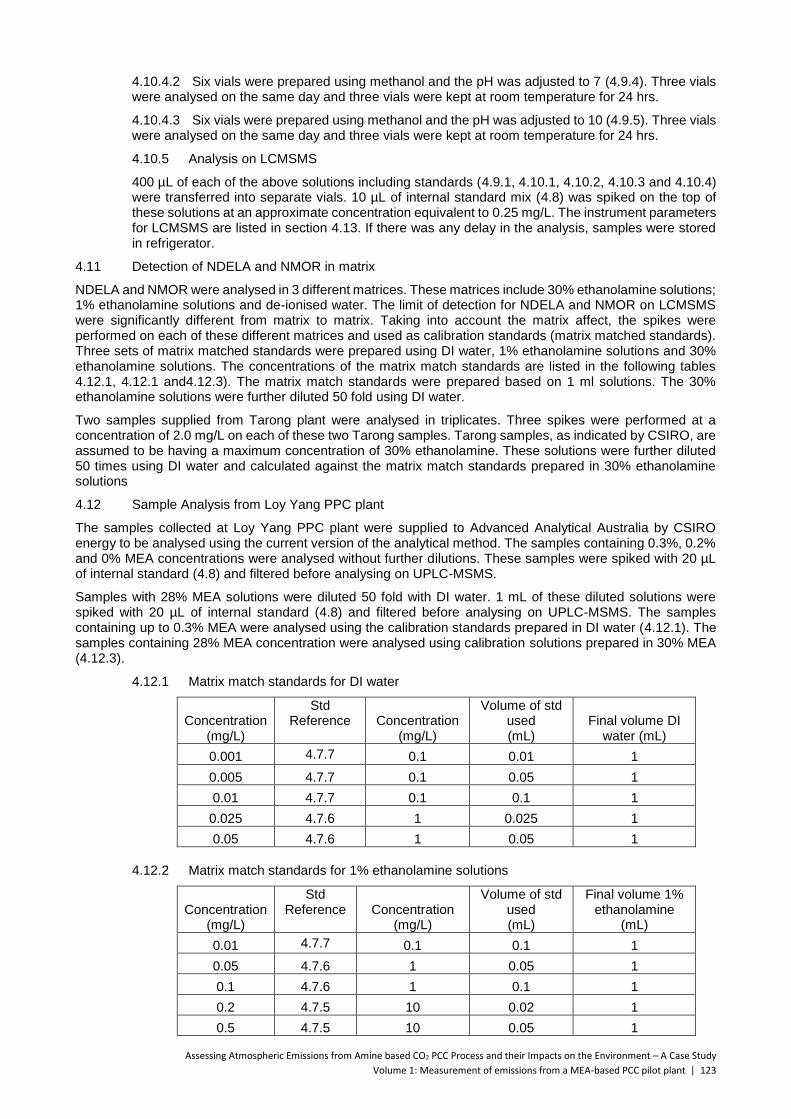
Assessing Atmospheric Emissions from Amine based CO2 PCC Process and their Impacts on the Environment – A Case Study
Volume 1: Measurement of emissions from a MEA-based PCC pilot plant | 123
4.10.4.2 Six vials were prepared using methanol and the pH was adjusted to 7 (4.9.4). Three vials were analysed on the same day and three vials were kept at room temperature for 24 hrs.
4.10.4.3 Six vials were prepared using methanol and the pH was adjusted to 10 (4.9.5). Three vials were analysed on the same day and three vials were kept at room temperature for 24 hrs.
4.10.5 Analysis on LCMSMS
400 µL of each of the above solutions including standards (4.9.1, 4.10.1, 4.10.2, 4.10.3 and 4.10.4) were transferred into separate vials. 10 µL of internal standard mix (4.8) was spiked on the top of these solutions at an approximate concentration equivalent to 0.25 mg/L. The instrument parameters for LCMSMS are listed in section 4.13. If there was any delay in the analysis, samples were stored in refrigerator.
4.11 Detection of NDELA and NMOR in matrix
NDELA and NMOR were analysed in 3 different matrices. These matrices include 30% ethanolamine solutions; 1% ethanolamine solutions and de-ionised water. The limit of detection for NDELA and NMOR on LCMSMS were significantly different from matrix to matrix. Taking into account the matrix affect, the spikes were performed on each of these different matrices and used as calibration standards (matrix matched standards). Three sets of matrix matched standards were prepared using DI water, 1% ethanolamine solutions and 30% ethanolamine solutions. The concentrations of the matrix match standards are listed in the following tables 4.12.1, 4.12.1 and4.12.3). The matrix match standards were prepared based on 1 ml solutions. The 30% ethanolamine solutions were further diluted 50 fold using DI water.
Two samples supplied from Tarong plant were analysed in triplicates. Three spikes were performed at a concentration of 2.0 mg/L on each of these two Tarong samples. Tarong samples, as indicated by CSIRO, are assumed to be having a maximum concentration of 30% ethanolamine. These solutions were further diluted 50 times using DI water and calculated against the matrix match standards prepared in 30% ethanolamine solutions
4.12 Sample Analysis from Loy Yang PPC plant
The samples collected at Loy Yang PPC plant were supplied to Advanced Analytical Australia by CSIRO energy to be analysed using the current version of the analytical method. The samples containing 0.3%, 0.2% and 0% MEA concentrations were analysed without further dilutions. These samples were spiked with 20 µL of internal standard (4.8) and filtered before analysing on UPLC-MSMS.
Samples with 28% MEA solutions were diluted 50 fold with DI water. 1 mL of these diluted solutions were spiked with 20 µL of internal standard (4.8) and filtered before analysing on UPLC-MSMS. The samples containing up to 0.3% MEA were analysed using the calibration standards prepared in DI water (4.12.1). The samples containing 28% MEA concentration were analysed using calibration solutions prepared in 30% MEA (4.12.3).
4.12.1 Matrix match standards for DI water
Concentration (mg/L)
Std Reference
Concentration
(mg/L)
Volume of std used (mL)
Final volume DI water (mL)
0.001 4.7.7 0.1 0.01 1
0.005 4.7.7 0.1 0.05 1
0.01 4.7.7 0.1 0.1 1
0.025 4.7.6 1 0.025 1
0.05 4.7.6 1 0.05 1
4.12.2 Matrix match standards for 1% ethanolamine solutions
Concentration (mg/L)
Std Reference
Concentration
(mg/L)
Volume of std used (mL)
Final volume 1% ethanolamine
(mL)
0.01 4.7.7 0.1 0.1 1
0.05 4.7.6 1 0.05 1
0.1 4.7.6 1 0.1 1
0.2 4.7.5 10 0.02 1
0.5 4.7.5 10 0.05 1

Assessing Atmospheric Emissions from Amine based CO2 PCC Process and their Impacts on the Environment – A Case Study
124 | Volume 1: Measurement of emissions from a MEA-based PCC pilot plant
4.12.3 Matrix match standards for 30% ethanolamine solutions
1 mL of 30% ethanolamine solutions were spiked with standards using the following volumes and further diluted 50 fold using DI water.
Concentration (mg/L)
Std Reference
Concentration (mg/L)
Volume of std used
(mL)
Concentration after dilution
(mg/L)
0.1 4.7.6 1 0.1 0.002
0.5 4.7.6. 1 0.5 0.01
1.0 4.7.5 10 0.1 0.02
2.0 4.7.5 10 0.2 0.04
5.0 4.7.50 10 0.5 0.1
4.12.2 Analysis on LCMSMS. To 1 mL of the above solutions including the calibration standards, 50 fold diluted Tarong samples and spikes, 20 µL (4.8) of internal standard was added. The approximate concentration of the internal standard added was equivalent to 0.2 mg/L. All the solutions were filtered before analysing on UPLC-MSMS. The instrument parameters for LCMSMS are listed in section 4.13. If there is any delay in the analysis, samples need to be stored in the refrigerator.
4.13 Instrument parameters
Table 1: Agilent 1290 LC Pump Method Properties for NDELA and NMOR Analyses
Column Alltech Alltima C18 (150 x 2.1 x 3 µm or equivalent) column temperature at ~35 degrees.
Mobile Phase A: Milli-Q water with 5 mM ammonium formate pH adjusted to ~7 (4.6.3)
B: Methanol (4.2.2)
LC Program Time (min:sec)
%A %B
0:00 1:00 5:00 10:00 11:00 15:00
90 90 0 0 90 90
10 10 100 100 10 10
Flow 300 µL/min.
Run time 15.0 min
Acquisition time 0.5 min to 12.5 min
Injection volume 5 µL
Column temperature 35 oC
Table 2: ABSCIEX QTRAP 5500 MS parameters
MS Parameters
Ion Source (ESI) Electrospray ionisation
Temperature (TEM) 300 degrees centigrade
Collision Gas (CAD) Medium
Scan Width 0.7 amu
Ionisation mode Positive
Needle voltage 4500 V,
Curtain Gas 20 psi
CAD Medium
Gas 1(GS1) 20
Gas 2 (GS2) 20
Entrance potential (EP) v 10

Assessing Atmospheric Emissions from Amine based CO2 PCC Process and their Impacts on the Environment – A Case Study
Volume 1: Measurement of emissions from a MEA-based PCC pilot plant | 125
Table 3: MS/MS fragmentation conditions for NDELA and NMOR using a QTrap 5500
Compound Q1 Q3 msec DP(v) CE(v) CXP(v)
NDELA_104 135 104 100 60 7 10
NDELA_56 135 56 100 60 30 6
NDELA_74 135 74 100 60 17 8
NMOR_87 117 87 100 50 20 8
NMOR_57 117 57 100 50 20 8
NMOR_41 117 41 100 50 33 6
NMORd8_95 125 95 50 96 17 8
NMORd8_49 125 49 50 96 23 6
NDELAd8_80 143 80 50 116 9 10
NDELAd8_46 143 111 116 66 9 10
ESI = Electro spray ionization; Q1 = m/z in the first quadrupole; Q3 = m/z in the third quadrupole; msec= dwell time (ms);
DP (v) = declustering potential; CE (v) =collision energy and CXP (v) = collision cell exit potential
5. INTERFERENCES
5.1 Contaminants and interferences during sample preparation
Solvents, reagents, glassware and other sample processing hardware may yield artefacts and/or interferences to sample analysis. All these materials must be demonstrated to be free from interferences under the conditions of the analysis by analysing method blanks. Specific selection of reagents of high purity is necessary.
A method blank is performed to identify all possible interferences.
5.2 Contaminants and interferences during instrument analysis
Contamination by carryover can occur whenever high-concentration and low-concentration samples are analysed in sequence. To reduce the potential for carryover, the sample syringe or purging device must be rinsed out between samples with an appropriate solvent. Whenever an unusually concentrated sample is encountered, the next sample in the sequence should be re-injected, preferably diluted, to ensure that there is no cross contamination or matrix effect.
6. RESULTS AND DISCUSSION
6.1 Comparative analysis of Tarong sample on UPLCMSMS QTRAP vs LCMSMS
In the previous studies, one of the factors contributing for the inconsistent spike recoveries of NAs might be due to the matrix interference from ethanolamine solutions. In the previous study (A12-2284A) for the analysis of Tarong samples on UPLCMSMS QTRAP, it was identified that there were unknown compounds having similar MRM transitions to that of NDELA and NMOR. These compounds were closely eluting to NDELA and NMOR and the identity of these compounds were not established. These unknown compounds might be attributing the varying recoveries for NDELA and NMOR.
In the current study, the analysis of NDELA in Tarong sample was performed on Varian LCMSMS to see the chromatographic separation of the unknown impurity and NDELA. The Varian 320 MS was installed with Varian 212 LC pumps and Varian 320 mass spectrometer. Unlike Agilent 1290 ultra high performance liquid chromatographic pumps; these Varian 212 pumps cannot handle high back pressures and have low precision in pumping the solvents compared to UPLC. In addition, the Varian 320 mass spectrometer is having low sensitivity and resolution power compared to ABSciex QTRAP 5500.
The analytical method developed on UPLC -QTRAP was modified to be able to be adapted on Varian 320 LCMSMS. In order to achieve better sensitivity and separation of NDELA and the unknown impurity the method was modified for different analytical and instrument conditions. These include variation in the solvent gradients, flow rates and mass spec parameters. However, the separation of these two compounds remained a challenge. For example, the sample spiked at 2 mg/L and further diluted 50 fold with DI water, was used for the comparative studies on Varian 320 LCMSMS. This sample was able to be detected for NDELA and the unknown peak on UPLCMSMS QTRAP. However, on Varian 320 LCMSMS NDELA was not detected for MRM

Assessing Atmospheric Emissions from Amine based CO2 PCC Process and their Impacts on the Environment – A Case Study
126 | Volume 1: Measurement of emissions from a MEA-based PCC pilot plant
transitions, 135->74 (Figure 1) and 135-> 56. This can be attributed to the low sensitivity of the Varian 320 MS and the poor chromatographic resolution between the unknown impurity and NDELA.
Further, the samples were spiked at 50 mg/L to be able to see the difference between the sample and the spike. At this concentration the difference between the spike and the sample was established for only one of the MRM transitions, 135->104 (Figure 2). Although there was clear distinction between the sample and the 50 mg/L spike for this transition, the peak shape was poor for the spike.
To confirm that Varian 320 LCMSMS can detect NDELA and to show that the sample has matrix interference, the analysis of a blank 30% ethanolamine solution and a spike at 20 mg/L on this blank solution was performed. These solutions were further diluted 50 times using DI water. As there was no interference in 30% ethanolamine solutions, 20 mg/L spike on 30%ethanolamine solution was clearly distinct to the unspiked 30% ethanolamine solution (Figure 3). This indicates that Varian 320 LCMSMS can detect NDELA at higher concentrations but not capable of separating NDELA from its co-eluting impurities.
To have an estimate of how much of the unknown impurity could contribute to the concentration of NDELA in the samples, the samples with unresolved chromatographic peaks were compared against the standards. The area response for the interference in the Tarong samples after 50 times dilution was approximately half the response of the 4 mg/L undiluted standard (Figure 4). This indicates that an approximate concentration of at least 1000 mg/L of the unknown impurity can be contributing to the NDELA concentration if it was not separated from NDELA (Figure 4). All the above experiments prove the importance of using isotopically labelled internal standards, high resolution chromatography and mass spectrometry.
Figure 1: Overlayed chromatograms for Tarong sample, Tarong sample spike at 20 mg/L and Tarong sample spike at 50 mg/L for MRM transition 135->74
2.5 5.0 7.5 10.0
minutes
0.0
2.5
5.0
7.5
10.0
12.5
MCounts 135.0>74.0 [-10.0V] A12-2884.xms135.0>74.0 [-10.0V] A12-2884 Spk.xms
135.0>74.0 [-10.0V] A12-2884 Spk001.xms

Assessing Atmospheric Emissions from Amine based CO2 PCC Process and their Impacts on the Environment – A Case Study
Volume 1: Measurement of emissions from a MEA-based PCC pilot plant | 127
Figure 2: Overlayed chromatograms for Tarong sample, Tarong sample spike at 20 mg/L and Tarong sample spike at 50 mg/L for MRM transition 135->104
Figure 3: 30%ethanolamine solution unspiked (blank) and spiked at 20 mg/L of NDELA.
2.5 5.0 7.5 10.0minutes
0
50
100
150
200
250
kCounts 135.0>104.0 [-10.0V] A12-2884.xms135.0>104.0 [-10.0V] A12-2884 Spk.xms
135.0>104.0 [-10.0V] A12-2884 Spk001.xms
50 mg/L NDELA spike
20 mg/L NDELA Spike
Sample
2.5 5.0 7.5 10.0minutes
0
1
2
3
4
5
6
7
8
MCounts 135.0>74.0 [-10.0V] EA.xms135.0>74.0 [-10.0V] EA spk .xms
Blank
20 mg/L NDELA Spike

Assessing Atmospheric Emissions from Amine based CO2 PCC Process and their Impacts on the Environment – A Case Study
128 | Volume 1: Measurement of emissions from a MEA-based PCC pilot plant
Figure 4: Total ion chromatogram of 4 mg/L standard compared TIC of 50 times diluted Tarong sample and its spike.
6.2 Stability of NDELA
A single MRM for each of the analyte was used for the quantification purposes. For example, MRM 135->104 for NDELA and MRM 117->87 for NMOR were used for quantification. The NMOR concentrations were calculated using the deuterated internal standard (NMOR-d8) and the results were reported in the previous study (A12-2284-A). However, in the previous study NDELA concentrations were inconsistent when kept at room temperature. The inconsistency is attributed to matrix effect and the fact that NDELA was not measured against an isotopic labelled internal standard which would eliminate the signal enhancement or suppression due to the matrix affect. In this study, the determination of stability of NDELA was repeated using a deuterated internal standard and the results are incorporated in the following (table 4). The concentrations were calculated against standards prepared in methanol (4.9.1). The recoveries are calculated for NDELA and NMOR and are represented in table 4.
Table 4: Analyses of NDELA and NMOR
Sample (500 µg/L)
NDELA
(%)
NDELA
(%)*
NMOR
(%)
NMOR
(%)*
After 4 hr Amber at room temperature 128 120 89 80
After 24 hrs at 4 degrees in amber 110 103 95 82
After 24 hrs at 4 degrees in clear 109 103 78 75
After 24 hrs at 4 degrees in plastic 111 105 68 70
After 24 hrs at room temperature in Amber 102 97 91 80
After 24 hrs at room temperature in clear 104 99 91 82
After 24 hrs at room temperature in plastic 96 91 84 68
After 4 hrs at pH 4 in amber 87 83 90 74
After 4 hrs at pH 7 in amber 88 84 84 75
After 4 hrs at pH 10 in amber 91 86 99 85
After 24 hrs at pH 4 in amber 136 127 93 83
After 24 hrs at pH 7 in amber 83 79 77 93
After 24 hrs at pH 10 in amber 114 108 87 85
* After the initial analyses all the samples were analysed again after leaving them at room temperature for further 24 hrs.
The values represented in the above table are a mean of three experiments
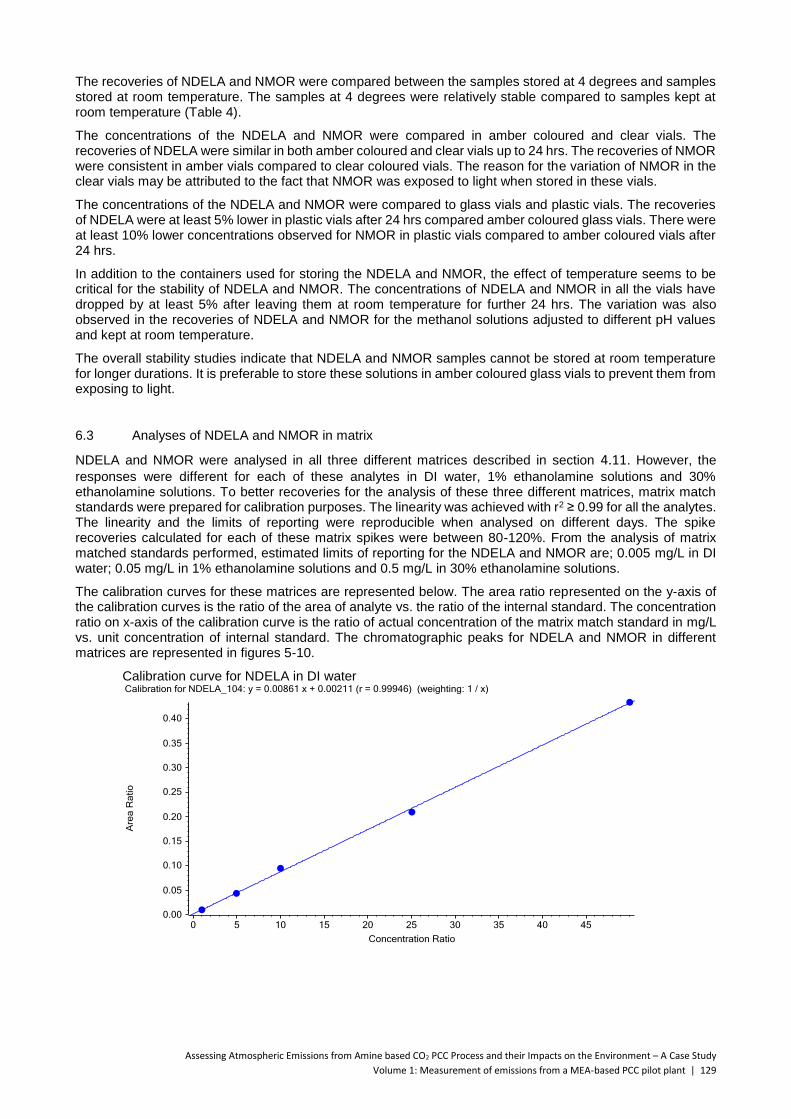
Assessing Atmospheric Emissions from Amine based CO2 PCC Process and their Impacts on the Environment – A Case Study
Volume 1: Measurement of emissions from a MEA-based PCC pilot plant | 129
The recoveries of NDELA and NMOR were compared between the samples stored at 4 degrees and samples stored at room temperature. The samples at 4 degrees were relatively stable compared to samples kept at room temperature (Table 4).
The concentrations of the NDELA and NMOR were compared in amber coloured and clear vials. The recoveries of NDELA were similar in both amber coloured and clear vials up to 24 hrs. The recoveries of NMOR were consistent in amber vials compared to clear coloured vials. The reason for the variation of NMOR in the clear vials may be attributed to the fact that NMOR was exposed to light when stored in these vials.
The concentrations of the NDELA and NMOR were compared to glass vials and plastic vials. The recoveries of NDELA were at least 5% lower in plastic vials after 24 hrs compared amber coloured glass vials. There were at least 10% lower concentrations observed for NMOR in plastic vials compared to amber coloured vials after 24 hrs.
In addition to the containers used for storing the NDELA and NMOR, the effect of temperature seems to be critical for the stability of NDELA and NMOR. The concentrations of NDELA and NMOR in all the vials have dropped by at least 5% after leaving them at room temperature for further 24 hrs. The variation was also observed in the recoveries of NDELA and NMOR for the methanol solutions adjusted to different pH values and kept at room temperature.
The overall stability studies indicate that NDELA and NMOR samples cannot be stored at room temperature for longer durations. It is preferable to store these solutions in amber coloured glass vials to prevent them from exposing to light.
6.3 Analyses of NDELA and NMOR in matrix
NDELA and NMOR were analysed in all three different matrices described in section 4.11. However, the
responses were different for each of these analytes in DI water, 1% ethanolamine solutions and 30% ethanolamine solutions. To better recoveries for the analysis of these three different matrices, matrix match standards were prepared for calibration purposes. The linearity was achieved with r2 ≥ 0.99 for all the analytes. The linearity and the limits of reporting were reproducible when analysed on different days. The spike recoveries calculated for each of these matrix spikes were between 80-120%. From the analysis of matrix matched standards performed, estimated limits of reporting for the NDELA and NMOR are; 0.005 mg/L in DI water; 0.05 mg/L in 1% ethanolamine solutions and 0.5 mg/L in 30% ethanolamine solutions.
The calibration curves for these matrices are represented below. The area ratio represented on the y-axis of the calibration curves is the ratio of the area of analyte vs. the ratio of the internal standard. The concentration ratio on x-axis of the calibration curve is the ratio of actual concentration of the matrix match standard in mg/L vs. unit concentration of internal standard. The chromatographic peaks for NDELA and NMOR in different matrices are represented in figures 5-10.
Calibration curve for NDELA in DI water

Assessing Atmospheric Emissions from Amine based CO2 PCC Process and their Impacts on the Environment – A Case Study
130 | Volume 1: Measurement of emissions from a MEA-based PCC pilot plant
Calibration curves for NMOR in DI water
Calibration curve for NDELA in 1% ethanolamine solutions
Calibration curve for NMOR in 1% ethanolamine solutions

Assessing Atmospheric Emissions from Amine based CO2 PCC Process and their Impacts on the Environment – A Case Study
Volume 1: Measurement of emissions from a MEA-based PCC pilot plant | 131
Calibration curve for NDELA in 30%ethanolamine solutions
Calibration curve for NMOR in 30%ethanolamine solutions

Assessing Atmospheric Emissions from Amine based CO2 PCC Process and their Impacts on the Environment – A Case Study
132 | Volume 1: Measurement of emissions from a MEA-based PCC pilot plant
Figure 5: NDELA peaks for MRM transition 135->104 in DI water (1 µg/L, 5 µg/L, 10 µg/L, 25 µg/L, 50 µg/L and blank respectively)
Figure 6: NMOR peaks for MRM transition 117->87 in DI water. (1 µg/L, 5 µg/L, 10 µg/L, 25 µg/L, 50 µg/L and blank respectively)

Assessing Atmospheric Emissions from Amine based CO2 PCC Process and their Impacts on the Environment – A Case Study
Volume 1: Measurement of emissions from a MEA-based PCC pilot plant | 133
Figure 7: NDELA peaks for MRM transition 135->104 in 1% ethanolamine solutions (10 µg/L, 50 µg/L, 100 µg/L, 200 µg/L, 500 µg/L and blank respectively).
Figure 8: NMOR peaks for MRM transition 117->87 in 1% ethanolamine solutions (10 µg/L, 50 µg/L, 100 µg/L, 200 µg/L, 500 µg/L and blank respectively).

Assessing Atmospheric Emissions from Amine based CO2 PCC Process and their Impacts on the Environment – A Case Study
134 | Volume 1: Measurement of emissions from a MEA-based PCC pilot plant
Figure 9: NDELA peaks for MRM transition 135->104 in 30 % ethanolamine solutions (100 µg/L, 500 µg/L, 1000 µg/L, 2000 µg/L, 5000 µg/L and blank respectively).
Figure 10: NMOR peaks for MRM transition 117->87 in 30% ethanolamine solutions (100 µg/L, 500 µg/L, 1000 µg/L, 2000 µg/L, 5000 µg/L and blank respectively).

Assessing Atmospheric Emissions from Amine based CO2 PCC Process and their Impacts on the Environment – A Case Study
Volume 1: Measurement of emissions from a MEA-based PCC pilot plant | 135
6.4 Analyses of NDELA and NMOR in Tarong sample
Tarong samples were analysed after diluting 50 times with DI water (4.11). The concentrations of these
samples were calculated against the spikes performed (matrix match standards) on a blank 30% ethanolamine
solution (4.12.3). The five spikes performed on 30% ethanolamine solutions were used for 5 point calibration
and a linear regression r2 > 0.99 was achieved. The lowest ethanolamine spike standard used was 0.1 mg/L which would be the limit of detection. The limit of reporting for these compounds in 30% ethanolamine solutions would be 0.5 mg/L.
The Tarong sample analysed in the previous study (A12-2284A) was reported to be containing approximately 3 mg/L of NDELA. The sample was re-analysed in the current study using an internal standard and the mean of three replicates was 2.3 mg/L. A second sample was received during the current study and was analysed in triplicates. In this sample, NDELA was detected at an average concentration of 2.4 mg/L for the three replicates. NMOR was not detected in both the samples. The samples were re-analysed by spiking them with NDELA and NMOR at a concentration of 2 mg/L. Three spikes were performed for each of these samples. The average spike recoveries performed on these samples for NDELA and NMOR were between 80 -125%. The experiments were performed on a different day and the recoveries were consistent.
6.5 Sample Analysis from Loy Yang PCC plant
Ten samples were analysed received from CSIRO that were stored at 4 degrees and the sample description is listed in table 5. The samples included in the list are the samples collected from Loy Yang Pcc plant and spikes performed by CSIRO on some of these samples. The samples were analysed using two sets of
calibration standards and the analysis was performed as described in section 4.12. The overall in house spike
recoveries on DI water, 0% 0.2%, 0.3% and 28% MEA solutions for NDELA and NMOR were between 80% and 120% respectively. All the samples were analysed on a different day with a fresh stock of standards used and the results were concurrent for all the samples, duplicates and spikes. The duplicate results are listed in the table 5 and the % RPD (relative percent difference) are less than 20% except for samples 5030 and 5014 which are approximately 30%.
Table: 5 Results for the sample analysis from Loy Yang
Sample Sample description % MEA
NDELA
µg/L
NMOR
µg/L
sample repeat sample repeat
5022 1st impinger –after water wash 0.2% 5 6 < 5 <5
5024 3rd impinge after water wash 0.2% <5 <5 <5 <5
5027 1st impinger after water wash + spike 0.2% 216
203 1246
(191*)
1460
5030 1st impinger - Before water wash 0.3% 10 7 18 13
5032 3rd impinger - before water wash 0.3% <5 <5 <5 <5
5014 1st impinger - Before water wash 0.3% <5 <5 8 <5
5122 Nitrosamine blank + Spike 0 232
203 1131
(228*)
890
5135 water wash 0.2% 12 7 10 8
5221 MQ water + Spike 0% 421 430 426 390
5191 MEA Solvent 28% 530 490 <500 <500
* Corrected results after 10 fold dilution of the samples.

Assessing Atmospheric Emissions from Amine based CO2 PCC Process and their Impacts on the Environment – A Case Study
136 | Volume 1: Measurement of emissions from a MEA-based PCC pilot plant
After further discussions with CSIRO and comparing the spike date for the blind studies, it was revealed that NMOR spike recoveries in samples 5027 and 5122 were approximately 500-700%. To investigate the effect of pH on these samples, the pH of the sample 5122 was adjusted to 7.8 from 2.8 using ammonia and was re-analysed. The re-analysis revealed similar results for NDELA (213 µg/L) and lower values for NMOR (750 µg/L). However, the spike recovery for NMOR was approximately 350%. The results were quantified on a second MRM (117-> 57) for NMOR to check the matrix effect existed for both the MRM transitions and these results were consistent to the quantification involved with first MRM (117-> 87).
The samples which had higher concentrations of NMOR were diluted 10 times to check if the matrix effect could be eliminated. 100 µL for each of the samples 5027 and 5122 were diluted with 900 µL of DI water and
spiked with 20 µL of internal standard (4.8). The samples were filtered and reanalysed on UPLCMSMS using
fresh set of standards. The concentrations for NDELA on both the samples were 19.7 µg/L. After applying the 10 fold dilution factor the results were 197 µg/L. The concentrations of NMOR in the sample 5027 and 5122 were 191 µg/L and 228 µg/L respectively after applying the dilution factor correction. These values were significantly lower for both the samples compared to the undiluted analysis.
The significant variation in the NMOR concentrations might be due to the signal enhancement for NMOR in presence of sulfamic acid in ethanolamine solutions or a combination of NMOR, sulfamic acid and ammonia in the mobile phase. It would be ideal to run the samples in 10 fold dilution to eliminate the matrix effect. If the samples have to be re-analysed by diluting 10 fold using DI water, the limit of reporting for NMOR would be 50 µg/L. The concentrations represented for impinger solutions in Table 5 were for the undiluted samples and may be having signal enhancement for NMOR response. The reported results for NMOR may therefore be higher than actual. It is difficult to predict to what extent the result will be high. If the matrix effect was eliminated the samples may even be less than LOR.
6.6 Screening of unknown impurity using UPLC QTRAP.
The sample analysis from Tarong power plant indicated the presence of NDELA at an approximate concentration of 2.3 mg/L. In addition to NDELA, there was a closely eluting peak at 1.1 min with same MRM transitions to that of NDELA. This peak was co-eluting with NDELA on normal LCMSMS as reported in
section6.1. This unknown peak at retention time 1.1 min was detected only in the Tarong sample and not in
any other solutions such as 30% ethanolamine solutions, water samples and their spikes. The spike on Tarong sample clearly distinguishes the unknown peak from NDELA (retention time 1.3 min) due to the signal enhancement of NDELA in the spike solution. NDELA was positively identified with the use of standard addition and the spike recovery was greater than 80%.
The identity of the unknown peak at retention time 1.1 min was not established. The main aim of the characterisation was to identify the molecular ion of the unknown impurity. The possibility of this unknown peak being NDELA was ruled out by comparing the enhanced product ion spectra of this compound to that of NDELA. An enhanced product ion spectrum (EPI) for m/z 135 was generated using QTRAP (figure 11 and figure 12). Further analysis was performed to characterise this unknown compound using different aqueous mobile phases such as DI water and 5mM ammonium formate with pH adjusted to 3.5. In addition to use of different mobile phases, the chromatographic conditions are modified in order to achieve better separation of the unknown peak from the NDELA. When the mobile phase was swapped from ammonium formate to DI water, NDELA was not detected in the Tarong sample as the ionisation of NDELA was not efficient in the absence of the buffer as observed in the previous study. Interestingly, the unknown peak was able to be ionised and identified to have molecular ion [M+H]+ of 117, in positive ionisation mode. The EPI obtained initially indicates that molecular ion was 135.1. The presence of ammonium formate in the mobile phase could be contributing to the formation of the ammonium adduct [M+NH4]+. The molecular ion has further confirmed by performing enhanced resolution for m/z 117 (Figure 13) and m/z 135. The enhanced product ion spectra for m/z 117 (Figure 14) was obtained and the fragmentation pattern is consistent with EPI for m/z 135 for the unknown impurity with ammonium adduct.

Assessing Atmospheric Emissions from Amine based CO2 PCC Process and their Impacts on the Environment – A Case Study
Volume 1: Measurement of emissions from a MEA-based PCC pilot plant | 137
Figure 11: Enhanced product ion spectra for unknown compound in Tarong sample using Ammonium formate as aqueous mobile phase.
Figure 12: Enhanced product ion spectra for NDELA at retention time 1.3 min
Figure 13: Enhanced Resolution of m/z 117 for unknown compound in Tarong sample using DI water as aqueous mobile phase.
+EPI (135.05) Charge (+0) CE (10) FT (4.44936): Exp 2, 1.069 min from Sample 7 (Sample ) of 120612_4.wiff (Turbo Spray) Max. 2.9e6 cps.
50 60 70 80 90 100 110 120 130 140 150 160 170 180 190 200 210 220 230 240 250m/z, Da
0.0
2.0e5
4.0e5
6.0e5
8.0e5
1.0e6
1.2e6
1.4e6
1.6e6
1.8e6
2.0e6
2.2e6
2.4e6
2.6e6
2.8e6
2.9e6
Inte
nsity
, cps
89.0
135.1
88.1
71.0
70.1 89.999.0 117.071.9 136.385.1 139.0
+EPI (135.05) Charge (+0) CE (10) FT (62.9673): Exp 2, 1.335 min from Sample 12 (Std 20ppm DI) of 120612_4.wiff (Turbo Spray) Max. 7.9e4 cps.
50 60 70 80 90 100 110 120 130 140 150 160 170 180 190 200 210 220 230 240 250m/z, Da
0.0
5000.0
1.0e4
1.5e4
2.0e4
2.5e4
3.0e4
3.5e4
4.0e4
4.5e4
5.0e4
5.5e4
6.0e4
6.5e4
7.0e4
7.5e4
7.9e4
Inte
nsity
, cps
86.0
73.9
135.0
73.0104.0
85.1
74.8 89.2 99.0 135.686.9
117.1105.276.2
87.758.1 90.1
+ER: 1.284 min from Sample 2 (A12-2284A) of 120914_1.wiff (Turbo Spray) Max. 1.2e5 cps.
104 106 108 110 112 114 116 118 120 122 124 126 128 130 132m/z, Da
0.00
5000.00
1.00e4
1.50e4
2.00e4
2.50e4
3.00e4
3.50e4
4.00e4
4.50e4
5.00e4
5.50e4
6.00e4
6.50e4
7.00e4
7.50e4
8.00e4
8.50e4
9.00e4
9.50e4
1.00e5
1.05e5
1.10e5
1.15e5
1.20e5
Inte
nsity
, cps
117.1
117.8
117.6 120.0119.3114.1

Assessing Atmospheric Emissions from Amine based CO2 PCC Process and their Impacts on the Environment – A Case Study
138 | Volume 1: Measurement of emissions from a MEA-based PCC pilot plant
Figure 14: Enhanced product ion of m/z 117 for unknown compound in Tarong sample using DI water as aqueous mobile phase.
7. CONCLUSION AND FURTHER RECOMMENDATIONS
This study has established that the NDELA and NMOR need to be stored at 4 degrees, protected from light in amber coloured glass vials.
The use of internal standard is critical for the analysis of NMOR and NDELA to compensate signal enhancement and/or suppression on LCMSMS.
The limit of reporting of 0.5 mg/L was achieved for NDELA and NMOR in 30% ethanolamine solutions. In case of DI water the limits of reporting were 5 µg/L.
The use of ultra high performance liquid chromatography combined with high resolution mass spectrometers is recommended to achieve better resolution and sensitivity for NDELA and NMOR in presence of the matrix.
If NMOR is detected in concentrations above the limit of reporting it would be ideal to re-analyse the sample after diluting 10 times with DI water.
If the samples have to be diluted 10 fold using DI water, then the LOR would be 50 µg/L for NMOR.
The mass spec data for the unknown impurity has indicated that the peak closely eluting to NDELA do not have the same molecular ion and fragmentation pattern to that of NDELA.
8. REFERENCES
Characterization of New Nitrosamines in Drinking Water Using Liquid Chromatography Tandem Mass Spectrometry, Y .Y Zhao , J Boyd; S. Hurdey, and X F Li, Environ. Sci. Technol. 2006, 40, 7636-7641
+EPI (117.00) CE (10): 1.247 min from Sample 14 (A12-2284A_117EPI) of 120914_1.wiff (Turbo Spray) Max. 2.2e6 cps.
50 55 60 65 70 75 80 85 90 95 100 105 110 115 120 125 130 135 140m/z, Da
0.0
1.0e5
2.0e5
3.0e5
4.0e5
5.0e5
6.0e5
7.0e5
8.0e5
9.0e5
1.0e6
1.1e6
1.2e6
1.3e6
1.4e6
1.5e6
1.6e6
1.7e6
1.8e6
1.9e6
2.0e6
2.1e6
2.2e6
Inte
nsity
, cps
117.1
99.1
100.1
74.1 86.188.1
100.970.2

Assessing Atmospheric Emissions from Amine based CO2 PCC Process and their Impacts on the Environment – A Case Study
Volume 1: Measurement of emissions from a MEA-based PCC pilot plant | 139
ADVANCED ANALYTICAL AUSTRALIA - ADDENDUM
INCLUSION OF DIETHANOLAMINE (DELA) IN LCMSMS NITROSAMINE METHODOLOGY
The methodology for DELA followed principles described above with inclusion of appropriate MRM (multiple reaction monitoring) transitions for detection and quantification of DELA, as per Table below.
One aspect of the development which required consideration was the finding that DELA can be present as a background contaminant. After testing of various components of the system, the contamination was traced to the quality of the MilliQ water used for preparation of reagents and samples. Organic impurities were present from certain ion exchange cartridges used to purify water and up to 100 µg/L was seen from certain systems. The water used for analysis of the process solutions contained nil detectable DELA.
Calibration was performed against pure DELA compound and its isotopically labelled analogue was added to all standards and samples to correct for matrix effects and associated differences in MS response. Matrix effects were also checked using standard spikes to all samples and the recoveries determined.
MRM (multiple reaction monitoring) transitions used for analysis of NDELA, NMor and DELA in samples from Phase 2 sampling campaign were as follows:
Compound Q1 Q3 msec DP(v) CE(v) CXP(v)
NDELA_104 135 104 100 60 7 10
NDELA_56 135 56 100 60 30 6
NDELA_74 135 74 100 60 17 8
NMOR_87 117 87 100 50 20 8
NMOR_57 117 57 100 50 20 8
NMOR_41 117 41 100 50 33 6
NMORd8_95 125 95 50 96 17 8
NMORd8_49 125 49 50 96 23 6
NDELAd8_80 143 80 50 116 9 10
NDELAd8_46 143 111 116 66 9 10
DELA_106 106 88 50 50 15 16
DELA_105.9 105.9 87.8 50 50 15 16
DELAd8_113.9 113.9 96.1 50 50 15 10
DELAd8_113.9 113.9 77.9 50 50 21 36

Assessing Atmospheric Emissions from Amine based CO2 PCC Process and their Impacts on the Environment – A Case Study
140 | Volume 1: Measurement of emissions from a MEA-based PCC pilot plant
ASUREQUALITY, NEW ZEALAND – TECHNICAL REPORT
METHODOLOGY FOR THE DETERMINATION OF VOLATILE NITROSAMINES BY GCMS
Methodology and optimisation based on information provided by Phil Bridgen, Chief Chemist, AsureQuality.
AsureQuality are NATA accredited for the determination of volatile nitrosamines by GCMS. This method is applies to the determination of nitrosamines in drinking water and uses a solid phase extraction (SPE) technique to isolate the analytes followed by analysis using high resolution gas chromatography and tandem mass spectrometry (GCMSMS). The method is based on US EPA Method 521 methodology and is applicable to the determination of US EPA priority volatile nitrosamines which includes the target species, namely NDMA, NDEA and NMor. Note that NDELA is not applicable to this method of analysis due to its lower volatility and higher polarity. The methodology and its modifications required to address issues associated with high MEA and/or ammonia in process solutions is described as follows.
Samples aliquots of 50 mL volume were fortified with labelled internal standard solution and extracted via SPE using a 2g coconut charcoal cartridge. Solvent samples containing ~30% MEA were diluted 10 fold with deionised water prior to taking the 5mL aliquot for analysis. Samples expected to contain high levels of nitrosamines were diluted appropriately prior to taking the 5mL aliquot for analysis. The analytes are eluted with dichloromethane and the extracts were dried and concentrated before addition of a recovery standard and adjustment of the final volume to 0.5mL. The extracts were analysed by Gas Chromatography - High Resolution Mass Spectrometry (GC-HRMS) using positive electron ionisation (EI) mass spectrometry. Sample concentrations were calculated from their relative response against the slope of a 5-point calibration curve. The internal standards were used for quantification of the target analytes, thus results are recovery corrected. The recovery standard was used for quantification of the internal standards to determine the percent recovery.
The method used is validated and accredited for water samples and typically provides detection limits of ~1 ng/L (1 ppt). The nitrosamine results are reported using sample specific estimated detection limits. These are calculated for each analyte, for each sample, using signal to noise measurements. Method detection limits from analysis of Phase 1 samples were at a level of 10 µg/L for the nitrosamines (1-5 µg/L for volatile nitrosamines and 10-20 µg/L for NMor) and further work was undertaken to improve various aspects of sample preparation and instrumental analysis towards increasing the sensitivity of the method for process samples. This resulted in a significant reduction in detection limits and the nominal detection limit for this method is now 10 ng/L in the as received solution equivalent to a limit of reporting (LOR) of 50 ng/L (diluted samples will have proportionally higher LORs). A minor modification of the method has been applied to the CSIRO process water samples by diluting the sample first. This is to help offset potential matrix interferences that may be in the process water; however this dilution does result in higher detection limits. Further reduction can only be obtained by reducing/removing the initial dilution; however the investigations undertaken so far indicate significant sample matrix interferences at this level
Low recoveries encountered in the iteration of the methodology used in Phase 1 and investigations have been on-going to identify the cause and address this issue. They appeared to be related particularly to the extraction phase and modification of the volume of elution solvent showed promise of improvement; however we needed to confirm that additional elution volume was not going to significantly impact on background levels of analytes. This was undertaken using samples from Phase 2, when sufficient sample volume could be supplied, using various sample types (impinger 1, impinger 3, water wash and solvent). The methodology now delivers 50-80% recovery. As previously mentioned, the recovery of the internal standard is not critical for this method, as the isotope dilution technique corrects for recovery, however it is advantageous to optimise the efficiency of all aspects of the technique.
We believe the GC-HRMS method is an adequate and robust method for water samples. We do have other instrumentation at our disposal, such as an LCMS, however unless specifically required or there are significant advantages otherwise, we will not likely develop a method using other instrumental techniques while the GC-HRMS method remains adequate. Matrix effects have a major influence on the quantitative

Assessing Atmospheric Emissions from Amine based CO2 PCC Process and their Impacts on the Environment – A Case Study
Volume 1: Measurement of emissions from a MEA-based PCC pilot plant | 141
accuracy of the LCMS technique, often despite the use of isotopically labelled internal standards which are required for each and every compound. The method can be found to be quantitatively unreliable for analysis of variable sample matrices containing variable co-constituents, particularly at trace levels. It is also imperative in analytical work that desired detection limits are stated based on the intended use and that the GCCSI reviewers state these clearly so that method performance at this level can be investigated. It is also necessary to consider that that the lowering of detection limits should not be at the expense of recovery or to compromise accuracy.

Assessing Atmospheric Emissions from Amine based CO2 PCC Process and their Impacts on the Environment – A Case Study
142 | Volume 1: Measurement of emissions from a MEA-based PCC pilot plant
CONTACT US
t 1300 363 400 +61 3 9545 2176 e [email protected] w www.csiro.au
YOUR CSIRO
Australia is founding its future on science and innovation. Its national science agency, CSIRO, is a powerhouse of ideas, technologies and skills for building prosperity, growth, health and sustainability. It serves governments, industries, business and communities across the nation.
FOR FURTHER INFORMATION
Energy Technology Merched Azzi t +61 2 9490 5307 e [email protected] w www.csiro.au