assessing and improving inter-rater and referent …
TRANSCRIPT

ASSESSING AND IMPROVING INTER-RATER
AND REFERENT-RATER AGREEMENT
OF PILOT PERFORMANCE EVALUATION
by
Allen Xie
A Dissertation
Submitted to the Faculty of Purdue University
In Partial Fulfillment of the Requirements for the degree of
Doctor of Philosophy
School of Aviation & Transportation Technology
West Lafayette, Indiana
December 2018

2
THE PURDUE UNIVERSITY GRADUATE SCHOOL
STATEMENT OF COMMITTEE APPROVAL
Dr. Thomas Q. Carney, Chair
School of Aviation and Transportation Technology
Dr. Richard O. Fanjoy
School of Aviation and Transportation Technology
Dr. James P. Greenan
Department of Curriculum and Instruction
Dr. Mary E. Johnson
School of Aviation and Transportation Technology
Approved by:
Dr. Kathryne A. Newton
Head of the Graduate Program

3
ACKNOWLEDGMENTS
First of all, I would like to thank my committee chair, Dr. Thomas Carney. Dr. Carney is
an excellent mentor, teacher, leader, training captain and friend. His help, guidance, and
encouragement are vital to the success of my study at Purdue University, and we shared lots and
lots of great memories.
It’s my honor to have Dr. Richard Fanjoy, Dr. James Greenan and Dr. Mary Johnson in
my committee. As a former pilot examiner, Dr. Fanjoy gave me perfect insights as an evaluator
and as a researcher. Dr. Greenan is an excellent educator and provided me exceptional guidance
on instructional curriculum design. Dr. Johnson provided me endless confidence and shared her
remarkable expertise in conducting research. I would like to thank Dr. Fanjoy, Dr. Greenan and
Dr. Johnson for their tremendous support and care, and I am extremely fortunate to have them on
board.
In addition to my committee board, I would like to appreciate the much-needed guidance
from Professor Michael Suckow. This research is also not possible without the help from all the
Embraer Phenom 100 Training Captains at Purdue University.
I wish to acknowledge my family for their unprecedented support during my studies. I
would not have traveled this far without their love and encouragement.
Confucius said, “If I walk along with two other people, there must be one who can teach
me”. I would like to express my appreciation for the support from all my professors, colleagues
and friends, and the lifelong learning experience they gave me. Thank you.

4
TABLE OF CONTENTS
LIST OF TABLES .......................................................................................................................... 8
LIST OF ABBREVIATIONS ......................................................................................................... 9
ABSTRACT .................................................................................................................................. 11
INTRODUCTION .............................................................................................. 12
1.1 Background ....................................................................................................................... 12
1.2 Research Questions ........................................................................................................... 13
1.3 Significance....................................................................................................................... 13
1.4 Assumptions ...................................................................................................................... 14
1.5 Limitations ........................................................................................................................ 14
1.6 Delimitations ..................................................................................................................... 15
1.7 Summary ........................................................................................................................... 15
REVIEW OF LITERATURE ............................................................................. 16
2.1 Importance of Rater Agreement........................................................................................ 16
2.2 The Process of Assessing Students ................................................................................... 17
2.3 Rater Agreement and Rater Reliability ............................................................................. 17
2.4 Reasons for Low IRA/IRR................................................................................................ 18
2.5 Studies on IRA/IRR .......................................................................................................... 20
2.6 Referent-Rater Agreement/Referent-Rater Reliability ..................................................... 22
2.6.1 Determining the Referent Standard ........................................................................... 22
2.7 Types of Rater Training Design ........................................................................................ 23
2.7.1 Typical Process of Rater Training ............................................................................. 26
2.7.2 Video Scenarios for Rater Training ........................................................................... 29
2.8 Design of Scoring Rubric.................................................................................................. 30
2.9 Analyzing IRA/IRR .......................................................................................................... 32
2.9.1 Percentage of Agreement ........................................................................................... 32
2.9.2 Kappa Statistic ........................................................................................................... 32
2.10 Analyzing RRA/RRR ..................................................................................................... 33
2.11 Analyzing Likert Scale Data .......................................................................................... 34
2.12 Determine Training Effectiveness .................................................................................. 34

5
2.13 Results of Rater Training Effectiveness in Different Studies ........................................ 36
2.14 Addressing the Issues Identified in Literature Review ................................................... 40
2.15 Summary ......................................................................................................................... 41
METHODOLOGY.............................................................................................. 42
3.1 Research Design................................................................................................................ 42
3.2 Types of Statistical Error .................................................................................................. 43
3.2.1 Power ......................................................................................................................... 44
3.2.2 Effect Size .................................................................................................................. 44
3.3 Sampling Approach .......................................................................................................... 45
3.4 Unequal Control and Treatment Group Allocations ......................................................... 48
3.5 The 4-Point Grading Scale ................................................................................................ 49
3.6 Scenario Events for Evaluation ......................................................................................... 51
3.7 Developing the Scenarios Based on the Referent Score ................................................... 53
3.8 Procedures ......................................................................................................................... 55
3.8.1 Intake of Participants ................................................................................................. 56
3.8.2 Pre-Test ...................................................................................................................... 57
3.8.3 Control Group ............................................................................................................ 57
3.8.4 Treatment Group ........................................................................................................ 57
3.8.5 Post-Test .................................................................................................................... 58
3.9 Design of the Rater Training Workshop ........................................................................... 58
3.9.1 Introduction ................................................................................................................ 59
3.9.2 Behavioral-Observation Training .............................................................................. 59
3.9.3 Review of Embraer Phenom 100 Operating Procedures ........................................... 59
3.9.4 Performance-Dimension Training ............................................................................. 60
3.9.5 Frame-of-Reference Training .................................................................................... 60
3.10 Variables ......................................................................................................................... 62
3.11 Data Analysis .................................................................................................................. 63
3.12 Threats to Internal and External Validity ....................................................................... 64
3.12.1 History ..................................................................................................................... 65
3.12.2 Maturation ............................................................................................................... 65
3.12.3 Testing ..................................................................................................................... 66

6
3.12.4 Instrumentation ........................................................................................................ 66
3.12.5 Selection Bias .......................................................................................................... 66
3.12.6 Statistical Regression .............................................................................................. 67
3.12.7 Mortality .................................................................................................................. 67
3.12.8 Selection-Maturation Interaction ............................................................................. 67
3.12.9 Reactive or Interaction Effect of Testing ................................................................ 68
3.12.10 Interaction of Selection Bias and Experimental Variable ...................................... 68
3.12.11 Reactive Effects of Experimental Arrangements ................................................... 68
3.12.12 Multiple Treatment Interference ............................................................................ 68
3.12.13 Reducing Participant Crosstalk .............................................................................. 69
3.13 Summary ......................................................................................................................... 70
RESULTS ........................................................................................................... 71
4.1 Demographic Information ................................................................................................. 71
4.2 Emergency Evacuation Scenario ...................................................................................... 74
4.3 Descriptive Statistics of the Scenario Scores .................................................................... 76
4.4 Analysis of Inter-Rater Agreement ................................................................................... 78
4.4.1 For Five Video Scenarios .......................................................................................... 78
4.4.2 For Six Video Scenarios ............................................................................................ 79
4.5 Analysis of Referent-Rater Agreement ............................................................................. 81
4.5.1 For Five Video Scenarios .......................................................................................... 81
4.5.2 For Six Video Scenarios ............................................................................................ 87
4.6 Summary ........................................................................................................................... 91
CONCLUSIONS AND RECOMMENDATIONS ............................................. 92
5.1 Summary of the Study ...................................................................................................... 92
5.2 Results and Conclusions ................................................................................................... 94
5.3 Limitations of the Study.................................................................................................... 98
5.4 Recommendations for Practice ......................................................................................... 99
5.5 Future Research Recommendations ................................................................................ 101
APPENDIX A. INSTITUTIONAL REVIEW BOARD APPROVAL LETTER ....................... 103
APPENDIX B. INVITATION EMAIL ...................................................................................... 104
APPENDIX C. CONSENT FORM ............................................................................................ 105

7
APPENDIX D. SME QUESTIONNAIRE ................................................................................. 109
APPENDIX E. VIDEO SCENARIOS SCRIPT ......................................................................... 111
APPENDIX F. PARTICIPANT DEMOGRAPHICS SURVEY ................................................ 124
APPENDIX G. SUGGESTIONS AND COMMENTS FROM PARTICIPANTS ..................... 126
APPENDIX H. PRE-TEST ANALYSIS FOR FIVE SCENARIOS .......................................... 129
APPENDIX I. POST-TEST ANALYSIS FOR FIVE SCENARIOS ......................................... 135
APPENDIX J. PRE-TEST ANALYSIS FOR SIX SCENARIOS .............................................. 146
APPENDIX K. POST-TEST ANALYSIS FOR SIX SCENARIOS .......................................... 151
REFERENCES ........................................................................................................................... 162

8
LIST OF TABLES
Table 3.1 The 4-Point Grading Scale ............................................................................................ 49
Table 3.2 The Video Scenarios ..................................................................................................... 52
Table 3.3 Training Workshop Outline .......................................................................................... 61
Table 4.1 Participants' Flight Hours ............................................................................................. 72
Table 4.2 Flight Instructor Information ........................................................................................ 73
Table 4.3 Phenom 100 Course Completion .................................................................................. 74
Table 4.4 Descriptive Statistics for Pre-test Control Group ......................................................... 76
Table 4.5 Descriptive Statistics for Pre-test Treatment Group ..................................................... 76
Table 4.6 Descriptive Statistics for Post-test Control Group ........................................................ 77
Table 4.7 Descriptive Statistics for Post-test Treatment Group ................................................... 78
Table 4.8 Percentage of Agreement for Five Scenarios ............................................................... 78
Table 4.9 Fleiss' Kappa Values for Five Scenarios ...................................................................... 79
Table 4.10 Percentage of Agreement for Six Scenarios ............................................................... 80
Table 4.11 Fleiss' Kappa Values for Six Scenarios ...................................................................... 80
Table 4.12 Percentage of Agreement Compared to the Referent Score for Five Scenarios ......... 81
Table 4.13 Mean Absolute Deviation From the Referent Score for Five Scenarios .................... 81
Table 4.14 Statistical Test Results for Five Scenarios .................................................................. 86
Table 4.15 Percentage of Agreement Compared to the Referent Score for Six Scenarios ........... 87
Table 4.16 Mean Absolute Deviation From the Referent Score for Six Scenarios ...................... 87
Table 4.17 Statistical Test Results for Six Scenarios ................................................................... 91

9
LIST OF ABBREVIATIONS
AQP – Advanced Qualification Program
ATC – Air Traffic Control
ATP – Airline Transport Pilot
BOT – Behavioral-Observation Training
CFI – Certified Flight Instructor
CRM – Crew Resource Management
DV – Dependent Variable
FAA – Federal Aviation Administration
FAR – Federal Aviation Regulations
FOR – Frame-of-Reference Training
FTD – Flight Training Device
F/O – First Officer
HRPP – Human Research Protection Program
IATA – International Air Transport Association
ICAO – International Civil Aviation Organization
ICC – Intra-Class Correlation
ID – Identification
IRA – Inter-Rater Agreement
IRB – Institutional Review Board
IRR – Inter-Rater Reliability
IV – Independent Variable

10
I/E – Instructor/Evaluator
MAD – Mean Absolute Deviation
MAPP – Model for Assessing Pilots’ Performance
NOTECHS – Non-Technical Skills of Crew Members
PC – Personal Computer
PDT – Performance-Dimension Training
PIC – Pilot-in-Command
PTS – Practical Test Standards
QRH – Quick Reference Handbook
RET – Rater Error Training
RRA – Referent-Rater Agreement
RRR – Referent-Rater Reliability
SIC – Second-in-Command
SME – Subject Matter Expert
SOP – Standard Operating Procedures
11
ABSTRACT
Author: Xie, Allen. Ph.D.
Institution: Purdue University
Degree Received: December 2018
Title: Assessing and Improving Inter-Rater and Referent-Rater Agreement of Pilot Performance
Evaluation
Committee Chair: Dr. Thomas Q. Carney
The Federal Aviation Administration (FAA) has been promoting Advanced Qualification
Program (AQP) for pilot training and checking at Federal Aviation Regulations (FAR) Part 121
and Part 135 air carriers. Regarding pilot performance evaluation, instructors and evaluators
assign scores to a student based on specific grading standards. To ensure the best possible quality
of training and the highest level of safety, it is vital for different instructors and evaluators to
grade students based on the same standard. Therefore, inter-rater and referent-rater agreement are
paramount in calibrating the performance evaluation among different instructors and evaluators.
This study was designed to test whether a focused workshop could increase the level of inter-
rater and referent-rater agreement. A pre-test post-test control group experiment was conducted
on a total of 29 Certified Flight Instructors (CFIs) at Purdue University. Participants were asked
to watch several pre-scripted video flight scenarios recorded in an Embraer Phenom 100 FTD
and give grades to the student pilots in the videos. After a rater training workshop that consisted
of Behavior-Observation Training, Performance-Dimension Training, and Frame-of-Reference
Training, participants in the treatment group were able to achieve a significantly higher level of
inter-rater and referent-rater agreement.

12
INTRODUCTION
This chapter provides an overview of the study by presenting a background of the
problem area. In addition, the research questions, significance, assumptions, limitations, and
delimitations are discussed in this chapter.
1.1 Background
According to the Boeing Company (2018), over the next twenty years from 2018 to 2037,
there will be a demand of 790,000 pilots around the globe, including 261,000 in Asia, 206,000 in
North America, 146,000 in Europe, 64,000 in the Middle East, 57,000 in Latin America, 29,000
in Africa and 27,000 in Russia/Central Asia. This demand cannot be fulfilled without the support
from pilot training organizations, such as universities, flight schools and airline training
departments. Modern data-driven technology has enabled more advanced methods of pilot
training. For instance, the Advanced Qualification Program (AQP), introduced by the Federal
Aviation Administration (FAA) in the 1990s, allowed Federal Aviation Regulations (FAR) Part
121 and Part 135 Air Carriers to develop aviation training programs utilizing the newest
innovations in training techniques (FAA, 2017). Instead of “satisfactory or unsatisfactory” on a
checkride (FAA, 2017), students are evaluated by instructors based on a grading standard for
each flight event throughout their training. Also, many FAR Part 61 and Part 141 regulated flight
schools and collegiate aviation programs require instructors and evaluators to give grades to
students as part of the students’ performance records.
The accuracy of instructors and evaluators in grading is critical to a student’s success in
training. Without proper standardization and calibration, different instructors and evaluators may
assign conflicting scores to the same flight event conducted by the same crew, resulting in low

13
inter-rater agreement (IRA) and/or referent-rater agreement (RRA). This study was designed to
test whether a rater training workshop can potentially increase the level of inter-rater and
referent-rater agreement.
1.2 Research Questions
This study was designed to answer the following question:
Can utilization of a focused workshop significantly affect rater agreement of pilot
performance evaluation conducted by instructors and evaluators (i.e., raters)?
Based on the research question, the following sub-questions were also addressed in this
study:
After receiving the training, is there a significant increase in the level of agreement
among different raters?
After receiving the training, is there a significant increase in the level of agreement
between the raters and the referent standard?
1.3 Significance
Safety is always the first priority in aviation, and pilots are ultimately responsible for the
safe operations of an aircraft. It is crucial to ensure pilots are well educated in technical and non-
technical aspects of operation. Examples of technical skills include takeoff and landing,
navigation and knowledge such as aircraft systems (Mavin & Dall’Alba, 2010). Examples of
non-technical skills include “co-operation, leadership and management skills, situation
awareness and decision making” (Flin et al., 2003, p. 98). Instructors and evaluators are
responsible for providing high-quality training to pilots. High-quality training could not be
achieved without adequately trained instructors who have specialized technical expertise and are

14
familiar with the grading standard. Having a high level of inter-rater and referent-rater agreement
could not only improve the overall quality of pilot training, but also reduce the training time and
cost for air carriers. Well trained pilots could contribute to a safer aviation industry. Therefore, it
is essential to address inter-rater and referent-rater agreement issues for instructors and
evaluators in aviation.
1.4 Assumptions
The assumptions of this study were as follows:
1. Participants held the appropriate qualifications and requirements to participate.
2. Participants were familiar with the Standard Operating Procedures (SOP) of the Embraer
Phenom 100 aircraft.
3. Participants provided their responses in an honest manner.
4. Participants completed the tests independently, and there was no participant crosstalk
during the experiment.
1.5 Limitations
The limitations of this study were as follows:
1. The sample size was limited to candidates who held a Certified Flight Instructor (CFI)
certificate and were completing or have completed AT395 Turbine Aircraft Simulation
Lab Course at Purdue University.
2. Participants had different backgrounds and experience in flight instruction and evaluation.
3. Participants had different levels of experience in the operations of Embraer Phenom 100
aircraft.

15
1.6 Delimitations
The delimitations of this study were as follows:
1. The Embraer Phenom 100 was the only aircraft type used in this study.
2. The video recording was conducted in a FAA Level 6 Flight Training Device (FTD), not
in the real aircraft.
3. Participants issued a grade on a 4-point scale for each pre-scripted video scenario.
4. No actual student grades were involved in this study.
5. Only the pilot flying in the left seat was graded by the participants.
6. Only a certain number of selected scenario events were evaluated by the participants, and
each event scenario was independent from each other.
1.7 Summary
This chapter provided the background, significance, research questions, assumptions,
limitations, and delimitations for this study.

16
REVIEW OF LITERATURE
This chapter provides a literature review on the problems of pilot performance evaluation,
inter-rater agreement (IRA), referent-rater agreement (RRA), rater training, and the
determination of training effectiveness.
2.1 Importance of Rater Agreement
It is essential to establish a high level of agreement on assessments conducted by
instructors and evaluators in aviation. By assessing IRA, researchers are able to quantify the
degree of agreement among different raters who make independent judgments on the same
subject (Hallgren, 2012). High IRA can lead to transparent and traceable ratings, thus enhancing
the training quality (Gontar & Hoermann, 2015). If instructors and evaluators do not agree with
each other’s assessment and are not grading based on the same standard, performance ratings
become more subjective and instructor-dependent. A low IRA would deliver negative
consequences for pilots as well as air carriers. If assessors are overly strict in their ratings, the
pass rate will become extremely low, which will result in additional training costs for the air
carrier as well as negative effects on an applicant’s pilot and career record. If assessors become
too lenient on their ratings, sub-proficient pilots may be allowed to work on the line, which will
create adverse impacts to aviation safety.
A good evaluator has a sensible understanding of performance standards and can apply
the standards in a fair manner among different crews (Hamman, Beaubien, & Holt, 1999). Good
evaluators could not only improve the training quality for students, but also improve the level of
safety and decrease the cost of training. Therefore, the goal of IRA/RRA training is to let
assessors become “good evaluators”.

17
2.2 The Process of Assessing Students
To understand the reasons behind low IRA/RRA, it is vital to understand the process of
how instructors and evaluators give grades to a student. Baker and Dismukes (2002) developed a
framework for understanding the process of pilot performance assessment. The framework
consists of three critical activities: The first activity is the observation of the crew’s behaviors.
The second action is the evaluation of both technical and non-technical performance concerning
their effectiveness. The third activity is to weigh the results of this evaluation process, assign
respective scores, and record them on the grading sheet (Baker & Dismukes, 2002).
Roth (2015) described the typical process of assigning grades. Most evaluators used the
documentary method to interpret pilot performance. Flight examiners tended to construct
narrative descriptions first, and then made the judgements based on the recorded notes. The
examiners looked for multiple supporting observations as evidence to idealize the underlying
issue that caused the problem (Roth, 2015).
2.3 Rater Agreement and Rater Reliability
In a number of research studies, the terms “agreement” and “reliability” have been used
interchangeably (Kottner, Gajewski & Streiner, 2011; Gisev, Bell & Chen, 2013). The
boundaries between the concepts of “agreement” and “reliability” were not clear, even among
experts (Santos, Bernardes & Ayres-de-Campos, 2011). Kottner and Streiner (2011) claimed that
conceptual differences exist between “agreement” and “reliability”. The term “agreement”
represents the absolute degree of measurement error. The term “reliability” represents the
variability among scores of the different raters. Inter-rater agreement aims to measure if raters
assign the exact same score for each item, while inter-rater reliability (IRR) aims to measure if
raters distinguish different items consistently on the same measurement scale (Gisev, Bell &

18
Chen, 2013). In other words, IRR is focused on the relative consistency between judges, while
IRA is focused on absolute consensus (LeBreton & Senter, 2008). De Vet, Terwee, Knol and
Bouter (2006) argued that agreement parameters were more stable over different population
samples, compared to reliability parameters.
2.4 Reasons for Low IRA/IRR
Weber, Roth, Mavin, and Dekker (2013) conducted qualitative research on six captains
working for the same airline. The captains formed in three pairs and were asked to critique two
videotaped scenarios. Results showed that two pairs of captains decided to fail the videotaped
crew, while one pair decided to pass the videotaped crew. Participants identified different crew
performance issues in the scenarios, as only 17% to 33% of the problems were simultaneously
addressed by all three pairs. Results showed considerable difference among the assessments from
different raters (Weber et al., 2013).
Based on the assessment process, there are several reasons that may lead to low IRA/IRR.
The first issue occurs during the “behavior observation” stage (Roth, 2015). Instructors may miss
one or several key points during the observation of the crew’s performance. For example, in the
study conducted by Weber (2016), the captain ordered an emergency evacuation while the
turboprop engine on one side was still spinning. Only 4 out of 18 assessor pairs identified this
behavior, and all assessor pairs who identified this behavior failed the crew. Raters might be
distracted and miss the mistake while being saturated with other tasks, such as acting as Air
Traffic Control (ATC), setting up the simulator, or writing down notes. In a different case, raters
simply ignored the crew’s behavior because they were not aware of the importance of this
behavior. It is impossible for instructors and evaluators to observe and note every single detail.

19
In short, effective behavioral observation training is essential for raters to identify and record the
key points.
Even if all assessors identify the same behaviors, problems may also occur during the
evaluation stage, that would lead to IRA/IRR issues. Weber et al. (2013) found out there were
several occasions when the assessor pairs recognized the same problem but gave different scores.
Moreover, there were several occasions when the raters identified different issues but arrived at
the same rating. Assessors may be unfamiliar with the grading standard or grading sheet, which
may result in incorrect ratings for the event. For example, Hamman et al. (1999) identified a
common group of assessors called the “Midline Evaluators”. This group of evaluators tended to
give more “3” (Standard Performance) ratings on a 4-point scale. The authors cited that the
rater’s unfamiliarity with the grading criteria could be one of the reasons that they tended to give
“standard” scores (Hamman et al., 1999).
Furthermore, assessors may be comparing the student’s performance with other students
instead of comparing with the standard. Some raters may be comparing the student’s current
performance with the same student’s past performance. To prevent this issue, raters should be
adequately trained to evaluate students based on the same, clearly established performance
standard. Without a grading standard, some instructors may think the behavior is acceptable,
while other instructors may feel the same behavior is unsatisfactory.
The other reason for low IRA/IRR is subjective bias. Flight examiners develop a general
sense of proficiency of a pilot in the early stages of the evaluation (Roth, 2015). If a flight
examiner has a negative feeling of the student at the beginning, the examiner tends to look for
evidence to support a low score throughout the evaluation. In this case, the examiner is no longer
grading students based on the performance standards.

20
The difference in the total amount of evaluation experience may also play an important
role. More experienced instructors may be able to evaluate students more effectively due to their
familiarity with different scenarios, as well as proficiency in identifying and gauging the
importance of errors in operation. Roth (2015) identified that more experienced flight examiners
tended to use the overall assessment documentary sense to determine whether a pilot who is
performing at the borderline would pass or not. In comparison, junior flight examiners devoted a
lot of energy on small errors, rather than providing overall assessments.
Weber et al. (2013) also noted that care should be taken when assessing IRR, as a high
IRR may not indicate that raters had the same observations. To find out if evaluators genuinely
agree with one another, it is necessary to identify the reasons behind raters’ judgments.
2.5 Studies on IRA/IRR
Inter-rater agreement and reliability issues are often studied in disciplines that require
evaluators to assign subjective ratings to the performance of a candidate. For example, the
performance of flight crew, athletes, students, and conditions of patients are often assessed by
evaluators, and IRA/IRR studies are often conducted in these areas.
There are several different goals pursued in the studies of IRA/IRR. Some studies utilized
IRA/IRR to examine if a testing instrument or assessment method would work well (Ergai et al.,
2016; Kelly, 2005; Lindeman, Libkuman, King, & Kruse, 2000; Mulcahey et al., 2011). Other
studies tried to determine if dedicated training could improve IRA/IRR (Jackson, Atkins,
Fletcher, & Stillman, 2005; Lin et al., 2013; Sattler, McKnight, Naney, & Mathis, 2015).
Likewise, some studies attempted to examine both rater training as well as different testing
instruments (Brannick, Prince, & Salas, 2002; Gontar & Hoermann, 2015; Holt, Hansberger, &
Boehm-Davis, 2002).
21
The analytical methods varied widely, from utilizing the “percentage of agreement” to
conducting complex variance calculations. More than 15 different methods to evaluate IRA/IRR
were used across the studies investigated in the review of literature. As part of an ongoing
research, there is not a “best” method to measure IRA/IRR. Most of the studies reported results
of more than one type of analysis.
As an example, in the aviation industry, Smith, Niemczyk, and McCurry (2008)
conducted an IRR analysis on four flight instructors at a flight school. Researchers videotaped
the performance of 10 different students flying the same flight pattern in a simulator, and four
instructors were asked to grade the performance of these students. Results showed that the IRR
was low based on the Cohen’s Kappa Coefficient. However, researchers identified that one of the
instructors caused a significant decrease in IRR. Consequently, removing scores from this
instructor improved the IRR.
Similar to the aviation industry, IRA/IRR has shown to be an equally significant issue in
academic literature. Nicolai, Schmal and Schuster (2015) conducted a meta-analysis of the IRA
issues regarding journal peer review in the field of academia. Results showed that rater
agreement among the reviewers of several management journals was low. The authors further
reviewed several chemistry and physics journals and revealed that five out of six journals had
substantial reviewer variance.
Subjective judgments are also common in sports. Fort-Vanmeerhaeghe, Montalvo, Lloyd,
Read and Myer (2017) conducted research on the scoring system of the Tuck Jump Assessment,
a common test for evaluating sport technique as well as in injury screening. Two raters evaluated
24 volleyball athletes and assigned scores across ten different criteria. Results showed excellent
IRA/IRR with a 92.1% agreement and an Intra-Class Correlation (ICC) coefficient of 0.94.

22
2.6 Referent-Rater Agreement/Referent-Rater Reliability
Referent-rater reliability (RRR) resembles the level of agreement between instructor
ratings and a standard or referent (Transport Canada, 2007). In the aviation industry, the referent
score is called the “Gold Standard” (Baker & Dismukes, 2002).
Goldsmith and Johnson (2002) argued that RRA/RRR could be a better metric than
IRA/IRR because RRA/RRR has more accurate training implications and can be used to measure
an evaluator’s grading ability. RRA/RRR has three crucial training implications (Holt, Johnson,
& Goldsmith, 1997): First, a high RRA/RRR implies a high IRA/IRR. If all raters are assigning
the same scores with the gold standard, the IRA/IRR would be high as well. In contrast, a high
IRA/IRR may not indicate a high RRA/RRR. Second, the referent score provides a basis for
comparing the distribution of actual evaluator scores. Instructors and evaluators could be trained
to match the distribution of referent ratings, such as the mean, skewness and variance of their
grades. Third, the utilization of RRA/RRR could eliminate the problem of the incorrect group
norm. By measuring RRA/RRR, evaluators can be trained toward the referent standard instead of
an incorrect group standard. The main disadvantage of training based on RRA/RRR is the extra
time and resources needed to construct the referent. The referent must have a high level of
precision, as a wrong referent could render the entire training ineffective (Holt, Johnson, &
Goldsmith, 1997).
2.6.1 Determining the Referent Standard
To effectively utilize RRA/RRR training, Goldsmith and Johnson (2002) recommended
the referent grade, or the gold standard, to be established by a board of subject matter experts
(SMEs) or supervisory level evaluators. The SMEs would independently evaluate the scenarios
and then discuss their agreements/disagreements as a group. If significant disagreement occurs

23
among SMEs, and the conflict could not be resolved, it may indicate: “(a) the relevant behavior
is not clearly represented in the video, (b) the performance item is not clearly stated on the grade
sheet, or (c) the link between the item and the appropriate qualification standard is not clearly
defined” (Goldsmith and Johnson, 2002, p. 236).
Beaudin-Seiler and Seiler (2015) used a similar method to determine gold standards, as a
committee consisting of the program manager and flight faculty members formed a board of
SMEs. The SMEs independently graded the video scenarios and then collaborated to discuss any
agreement or disagreement. After the review and discussion, the SMEs established the gold
standard.
Baker and Dismukes (2002) recommended that the gold standards criteria could be set up
for both instructor training and instructor testing. For example, only instructors who provide
grades that closely reflect the gold standards (within a set number of deviations) could be
certified to conduct student performance evaluation. A low RRA/RRR indicates that additional
training is required to ensure that the evaluator can provide scores consistent with the gold
standard.
2.7 Types of Rater Training Design
There are two primary goals for rater training in aviation (Brannick et al., 2002): The first
goal is to correctly evaluate and document the quality of students’ performance; the second goal
is to effectively provide debrief and feedback to the students for future performance
improvement.
The design of rater training is crucial to the achievement of the outcomes above. Several
different training approaches (treatments) were investigated by Holt et al. (2002) and Feldman,
Lazzara, Vanderbilt, & DiazGranados (2012): Rater-Error Training (RET), Frame-of-Reference

24
Training (FOR), and Performance-Dimension Training (PDT). Additionally, Behavioral-
Observation Training (BOT) could be conducted to enhance the observational skills of the
instructors and evaluators, so they can correctly identify all the problems and mistakes made by
students (Weber et al., 2016).
Even though Woehr and Huffcutt (1994) discovered that RET may not be the best
method of training raters, this type of training was still widely used. The goal of RET is to
provide detailed feedback to individual instructors on their grading differences within the whole
group.
FOR training, according to Woehr and Huffcutt (1994), is a better method of rater
training. FOR training aims to train evaluators to a common frame-of-reference. A gold standard
is established for each event and may include the descriptions of behaviors that contributed to the
specific score. The rater’s grading needs to be consistently compared to that of the referent (Holt,
Johnson, & Goldsmith, 1997). Extra training could be devoted to the low-agreement grading
items between individual evaluations and the gold standard. Baker and Dismukes (2002) claimed
that FOR training was the most effective training method to improve the accuracy of ratings.
Reinforcing this conclusion, experiments conducted by Gorman and Rentsch (2009) showed that
FOR-trained participants graded significantly more accurately compared to the control group.
However, Cook, Dupras, Beckman, Thomas, & Pankratz (2009) argued that FOR training may
not be as effective in some scenarios because the referent is often case-specific and cannot be
generalized.
Roch, Woehr, Mishra, and Kieszczynska (2012) conducted a meta-analysis on FOR
training studies. More than 90% of the research studies utilized the following components: a gold
standard based on ratings by SMEs; a presentation of specific behaviors that correspond to their

25
respective performance dimensions; and practice grading based on written and videotaped
behaviors (Roch et al., 2012).
PDT aims to ensure the raters’ familiarity with grading scales (Woehr & Huffcutt, 1994).
Raters must be adequately trained to recognize the appropriate behaviors and be able to associate
them with the dimension targeted (Feldman et al., 2013). For example, if raters are unfamiliar
with the grading dimensions of an “A” or a “B” performance, they may face difficulty in
determining which grade to give to a well-performing student who made several minor errors.
PDT allows instructors and evaluators to recognize the specific skills or competencies for each
performance dimension.
On the other hand, Weber, Roth, Mavin, and Dekker (2014) recommended BOT to
improve the observation skills of an assessor. Raters cannot provide the correct grades unless
they are able to observe and identify all critical behaviors. BOT should consist of two elements
(Woehr & Huffcutt, 1994): First, the techniques on how to observe and record a student’s
behavior, such as note-taking methods. Second, systematic observational errors need to be
recognized and discussed. For example, contamination from previous observations and over-
reliance on a single source of information are common observational errors (Woehr & Huffcutt,
1994). According to Baker and Dismukes (2002), BOT is a very effective training strategy to
improve observational accuracy.
There are several other recommendations for rater training design. The International Air
Transport Association (IATA, 2013) recommended that “IRR training should be presented as a
group process beginning with an overview of IRR, followed by the critical nature of crew
assessment, the IRR measures, the grade sheet, rating scales, and examples of the criteria for
each point on the scale” (p. 24). Goldsmith and Johnson (2002) stated that the rater calibrating
26
session could be carried out for individual evaluators instead of a group of evaluators, thus
ensuring greater flexibility and more specific feedback.
2.7.1 Typical Process of Rater Training
In the study by Holt et al. (2002), the rater training delivery consisted of four steps: “(a)
developing the metrics and visualizations for measuring reliability, (b) preparing materials before
the workshop, (c) delivery of the training program in a workshop setting, and (d) development of
postsession summary feedback” (p. 311).
Regarding the basic elements of a rater training workshop, Mulqueen, Baker and
Dismukes (2002) included the following components: a grading process overview, a review of
the grading sheets, and an exercise on grading tasks. The first two elements were achieved
through in-class lecture, discussion and demonstration. During the grading task exercise,
participants were asked to watch and grade several video scenarios. The results were analyzed by
researchers and fed back to the participants. Discussion of the results was conducted to further
calibrate the raters. Finally, participants graded the performance of additional video scenarios to
determine the level of IRA/IRR after training, and further issues were discussed (Mulqueen et al.,
2002).
Mavin, Roth, and Dekker (2012) utilized a similar method for rater training, with some
slight differences among captains, first officers and flight examiners. All captains and first
officers went through a training course that lasted one day, while the flight examiners went
through a two-day training course. The first part of the course was a PowerPoint presentation
describing the assessment model, including review of the assessment form and the theoretical
concepts of each performance dimension. In the afternoon, participants were asked to grade three
video scenarios independently and discussed the results of their assessments. For the examiners,

27
a discussion of briefing philosophy and a training course on briefing technique was conducted on
the second day (Mavin et al., 2012).
It is essential to provide training on the assessment model. The training conducted by
Weber (2016) included PowerPoint presentations as well as discussion sessions, to familiarize
participants with the assessment model. The grading sheet was explained in detail, including the
assessment categories and descriptions of the performance grading scale. The theoretical
concepts of decision making and situational awareness were also discussed as part of the training.
After the presentation and discussion, participants were asked to grade at least three different
video scenarios using the assessment model (Weber, 2016). Similarly, Flin et al. (2003)
addressed the training requirements for an assessment model. The training needs to be focused
on the understanding of assessment methodology, the specific use of grading scales, and should
include a rater judgment calibration process with debriefings. The authors recommended the
length of training to be two days or longer.
In the training program developed by Holt et al. (2002), both RET and FOR training were
utilized. Also, the training program used the problem-solving process to tackle deficiencies in
IRR. Participants were asked to give grades to sample video scenarios. Scores were analyzed by
the researchers and feedback was provided. This training lasted approximately one day.
Brannick et al. (2002) organized a three-day training course for instructors. In
comparison, PDT and BOT were utilized, with a focus of crew coordination. Most of the three-
day session was spent on watching videotapes, practicing observations, as well as discussion
about the ratings.
Gold standard training was utilized by Beaudin-Seiler and Seiler (2015). Participants
were asked to grade the pilot’s performance in each video. Then, the gold standard was presented,

28
and participants discussed with flight faculty members to align their scores with the gold
standard grades. The authors claimed that the gold standard training increased participants’
understandings of the grading scale.
In the medical discipline, Lin et al. (2013) conducted a 1-month training program for
raters on dentist performance assessment. The training included role-playing sessions, grading
practice using videotapes, group discussion, checklist development and case studies. The goal of
this training was to “improve raters’ abilities to define the key components of competence for
specific clinical skills and develop criteria for satisfactory performance” (Lin et al., 2013, p. 257).
Similarly, Yule et al. (2008) utilized a “Non-Technical Skills for Surgeons” rater training
course which lasted 2.5 hours. The training started with an introduction of non-technical skills,
followed by an explanation of the grading system. Then, participants were trained on how to
effectively assess behavioral skills, with practice grading on three video scenarios.
In the nursing home quality assessment study conducted by Mor et al. (2003), the
research nurses went through a five-day training process. The training covered the methods to
conduct evaluations, and the use of information from multiple sources. Video scenarios were
shown to be used as a practice in coding. Role-playing exercises were conducted to improve
interviewing skills. The training also included case presentations and guided discussion. The
final step was to complete a case assessment with individual debrief to show the candidate’s
competency in assessment (Mor et al., 2003).
Weitz et al. (2014) organized a 90-minute FOR training session for raters on the
assessment of physical examination. First, assessment standards and the rating dimensions were
introduced. Next, four different videos indicating different levels of performance were shown,

29
and raters were asked to grade each of the video. The assessors then discussed their difference in
the assessments as a group.
In the field of education, Sattler, McKnight, Naney and Mathis (2015) utilized an 11-
minute training video to improve IRR in research grant peer review. The video was designed to
help raters review grant proposals and provided a guideline on how to assign a value on the
rating scale based on the quality of grant proposal.
Recurrent training is also imperative to maintain a high level of IRA/IRR, as suggested
by Smith et al. (2008). The recurrent training should be focused on reinforcements of the grading
criteria and differentiation between similar scores such as “3” and “4”. Also, it is recommended
to train new instructors to grade simple maneuvers first, and then progress to complex maneuvers.
2.7.2 Video Scenarios for Rater Training
For rater training and evaluation, it is not practical for multiple raters to observe actual
flying of the same crew at the same time. As a result, a commonly used method is to record crew
performance in videotapes and ask raters to evaluate videotaped scenarios. Baker and Dismukes
(2002) recommended that a minimum of three different practice video scenarios to be developed,
reflecting excellent, average, and unsatisfactory performance.
In aviation training, most video scenarios were filmed in flight simulators. In several
studies (Beaudin-Seiler & Seiler, 2015; O’Connor et al., 2002; Weber et al., 2013; Weber, 2016),
the scenarios were scripted in advance. Pilots in the videos were considered as “actors” and flew
the pre-scripted scenarios in a flight simulator. In the medical field, scenarios utilized by Yule et
al. (2008) were filmed using patient simulators. The advantage of a scripted scenario is that
performance criteria could be pre-identified, and scenarios could be developed based on that
referent performance standard. For example, a scenario could be specifically designed to reflect
30
an unsatisfactory performance. Also, the scenario selection process could be shorter, as the
scenarios are pre-defined. The disadvantages are the extra time needed to construct and record
the scenarios, and the potential lack of realism (Goldsmith & Johnson, 2002).
There are also several studies (Brannick et al., 2002; Gontar & Hoermann, 2015; Holt et
al., 2002; Lin et al., 2013; Smith et al., 2008) that used actual student performance recordings.
First, a large pool of videotapes needs to be available. The scenarios for rater training must be
selected by a group of SMEs. For example, Gontar and Hoermann (2015) selected four video
scenarios from a pool of 30 videotapes to reflect different levels of performance. The use of
actual training footage may require approval from flight school administration or the pilot union.
Students’ identity data may have to be erased in the video. The overall quality of the video may
be lower than the pre-scripted scenarios (Goldsmith & Johnson, 2002).
2.8 Design of Scoring Rubric
A robust scoring rubric must be provided to improve IRA/IRR. Smith et al. (2008) cited a
paragraph from the manual of the flight school in the study: “An Excellent (5) grade will be
issued when a student’s performance far exceeds and is well above the comparison standards”
(Smith et al., 2008, p. 91). However, the terms “far exceeds” and “well above” were somewhat
blurry and difficult to define. The authors recommended to precisely define each grading point
and fine-tune the standards and criteria (Smith et al., 2008).
Brannick et al. (2002) compared three types of grading forms: grading specific behaviors;
grading the overall handling of an event set; grading various Crew Resource Management (CRM)
behaviors. Results showed that the inter-judge agreement was highest for “specific behaviors”

31
followed by “overall grading”, and the agreement on CRM evaluation was the lowest (Brannick
et al., 2002).
Mavin and Dall’Alba (2010) introduced a Model for Assessing Pilots’ Performance
(MAPP). Researchers claimed that technical and non-technical skills should not be graded
separately, as the flight is conducted holistically. The MAPP integrates all skills into a single
model. The highest level in the model is “situational awareness”. “Situational awareness” is
supported by two essential skills: “aircraft flown within tolerances” and “decisions considerate of
risk”. These essential skills are further supported by three enabling skills: “aviation knowledge”,
“management of crew” and “communication amongst crew” (Mavin & Dall’Alba, 2010, p. 2).
Flin et al. (2003) targeted on the non-technical skills only. The article presented a
European non-technical skills assessment system called Non-Technical Skills of Crew Members
(NOTECHS). There are four different categories under NOTECHS: “co-operation, leadership
and managerial skills, situation awareness and decision making” (Flin et al., 2003, p. 98). Each
category is defined by several elements, and each element is further explained by different
behavioral markers.
IATA (2013) recommended the following eight areas of competencies in their Evidence-
Based Training Program Manual: “Application of Procedures; Communication; Aircraft Flight
Path Management, Automation; Aircraft Flight Path Management, Manual Control; Leadership
and Teamwork; Problem Solving and Decision Making; Situation Awareness; Workload
Management” (p. 27). These key areas of competencies provide a reference for the design of
scoring rubric.

32
2.9 Analyzing IRA/IRR
In the classical test theory developed by Lord (1959) and Novick (1965), observed score
(X) equals to the sum of a true score (T) and an error (E) due to measurement.
Var(X) = Var(T) + Var(E)
Reliability =Var(T)
Var(T) + Var(E)
There are several methods to analyze IRA/IRR. Each of them has its own advantages and
disadvantages. The best method has always been under constant debate, as the same method may
be criticized by some researchers, while being recommended by other researchers. Most studies
have used more than one type of measurement methods to analyze IRA/IRR.
2.9.1 Percentage of Agreement
The most direct method that researchers often use to assess IRA/IRR is to calculate the
percentage of agreement among different evaluators. However, this method does not make
corrections for agreements that is expected by chance. It is possible that this statistic may
overestimate the level of agreement (Hallgren, 2012). Despite the limitations of this method, the
percentage of agreement was commonly reported on research studies as the baseline reference.
2.9.2 Kappa Statistic
One frequently used statistic for IRA/IRR is the Kappa statistic. In contrast to the
percentage of agreement, Kappa statistic accounts for the possibility of chance or grading due to
uncertainty.
Cohen’s Kappa is a robust statistic used in testing IRA/IRR between no more than two
raters. Cohen’s Kappa has the following formula (Cohen, 1960):
𝜅 =Pr(a) − Pr(e)
1 − Pr(𝑒)

33
Pr(a) is the actual observed agreement, and Pr(e) is the expected chance agreement
(Cohen, 1960).
One of the limitations of Cohen’s Kappa is that, Cohen’s Kappa can only be used to
measure not more than two raters. To cope with this issue, Fleiss (1971) generalized Scott’s Pi
statistic to allow the measurement of IRR among multiple raters and developed the Fleiss’ Kappa.
Both Cohen’s Kappa and Fleiss’ Kappa could be interpreted as follows: “values ≤ 0
indicates no agreement, 0.01-0.20 indicates none to slight agreement, 0.21-0.40 indicates fair
agreement, 0.41-0.60 indicates moderate agreement, 0.61-0.80 indicates substantial agreement,
and 0.81-1.00 indicates almost perfect agreement” (Landis & Koch, 1977, p. 165). The Kappa
value should be no greater than 1.00 but could be lower than 0.
2.10 Analyzing RRA/RRR
One method to analyze RRA/RRR is to calculate the percentage of agreement of the
scores given by the raters compared to the referent score (Feldman et al., 2012).
O’Connor et al. (2002) and Yule et al. (2008) measured the RRA by comparing the mean
of “absolute deviation” between the raters’ scores and the referent score. For example, if a
participant rated a “3” and the gold standard is “2”, the absolute deviation is “1”. A low mean
absolute deviation (MAD) indicates a high RRA.
Lobo, Huyse, Herzog, Malt and Opmeer (1996) used another method to calculate
RRA/RRR. Each rater’s score was individually compared with the referent score. Researchers
calculated the percentage of agreement for both nominal and ordinal variables. Kappa coefficient
was calculated for nominal variables and some ordinal variables with symmetrical distribution.
Also, the intra-class coefficient (ICC) was calculated for continuous and some ordinal variables

34
with symmetrical distribution. The authors created a term called “reliable raters”, to identify the
raters with high RRA/RRR (Lobo, Huyse, Herzog, Malt, & Opmeer, 1996).
2.11 Analyzing Likert Scale Data
There is an ongoing debate on whether parametric tests, such as t-test and ANOVA,
should be used for Likert scale data. The debate comes from whether Likert scale data is
continuous (the distance between each scale point is equal). Most Likert scale data is considered
as ordinal data. Some researchers claimed that the data needs to be on interval scale or above,
before parametric tests can be used (Jamieson, 2004). However, Norman (2010) used actual and
simulated data to argue that parametric tests can be used for Likert scale data, even if there is a
small sample size, the variance is unequal, or the distribution is non-normal. Sullivan and Artino
(2013) also indicated that parametric tests are robust enough for analyzing Likert scale data.
Norman (2010) further claimed that intra-class correlation is usable for Likert scale data. A
parametric test may be more powerful than a non-parametric test in determining statistical
significance.
2.12 Determine Training Effectiveness
Training workshops are widely used in different industries. There are different methods
to measure and determine the effectiveness of a training program. Kirkpatrick and Kirkpatrick
(2006, p. 21) utilized four levels to assess training effectiveness: “reaction, learning, behavior
and result”. This is one of the most commonly used frameworks to determine training
effectiveness (Arthur, Bunnett, Edens, & Bell, 2003; Santos & Stuart, 2003).
The “reaction” level only measures how the subjects reacted to the training (Kirkpatrick
and Kirkpatrick, 2006). The reaction level is usually self-reported by the subjects. For example,

35
reaction is measured when trainees write a post-training satisfaction survey that asks whether the
training is beneficial or not.
The “learning” aspect of the framework measures the learning outcomes of a training
event, usually in terms of knowledge, skill or attitude (Kirkpatrick and Kirkpatrick, 2006).
Learning results are often measured by written tests or performance tests.
In comparison, the “behavior” facet focuses on the subject’s change in job behavior after
the training (Santos & Stuart, 2003). This could be measured by the subject’s post-training work
performance based on established performance indicators, or supervisor’s evaluations of
performance.
The “results” criterion measures the overall effectiveness of training on the macro scale
(Santos & Stuart, 2003). Depending on the anticipated training outcome and the mission
statement of the organization, the results criteria can be increased efficiency, improved safety,
reduced costs, better product quality and lower turnover. This level of performance is not
typically reported, as it is often difficult to evaluate.
A similar but slightly different measurement framework was developed by Burke and
Day (1986, p. 232): “subjective learning, objective learning, subjective behavior and objective
results”. In Burke and Day’s view, the main difference from Kirkpatrick’s framework is on the
definition of “subjective” and “objective”. The term “subjective” measures the training
effectiveness in terms of opinion, judgment or belief from the trainee or trainer (Burke & Day,
1986), while the term “objective” measures by objective means such as a standardized test.
A meta-analysis conducted by Arthur et al. (2003) aimed to test the training effectiveness
on 397 data points from 162 sources. Results indicated that 59% of the 397 data points reported
learning changes, 31% reported behavioral changes, followed by 7% for result changes and 4%

36
for reaction changes. The weighted effect size for the sample was 0.60 to 0.63 (Arthur et al.,
2003).
However, Arthur et al. (2003) claimed that rater training was qualitatively different from
traditional training programs. As a result, rater training was not presented in their analysis. In
contrast, Burke and Day (1986) considered rater training as one of the content areas in
managerial training programs and included rater training in their meta-analysis. Results showed
small to moderate effect size of training effectiveness for the 70 managerial training studies
conducted. Rater training was shown to have a medium to large effect size (d = 0.64) in the
“objective results” criterion.
Woehr and Huffcutt (1994) executed a meta-analysis on studies that utilized RET, FOR,
PDT and BOT. Results showed that FOR (d = 0.83) and BOT (d = 0.77) were the most effective
methods to improve rating accuracy. In addition, a meta-analysis conducted by Roch, Woehr,
Mishra, and Kieszczynska (2012) focused on the review of FOR rater training. Results showed
the overall effect size of FOR training was 0.5 based on 36 studies, which was considered as a
medium effect size. The effect size for recall and behavioral accuracy was high (d = 0.88).
2.13 Results of Rater Training Effectiveness in Different Studies
Holt, Hansberger, and Boehm-Davis (2002) conducted a case study at a regional airline
on rater calibration issues among instructors and evaluators over a three-year period. The
regional airline implemented rater training to all their instructors and evaluators. During the
three-year period, there was a general improvement in their benchmarks from year 1 to year 2.
However, benchmarks remained mostly the same, with a slight decrease in some items from year
2 to year 3. The authors claimed that there was a large number of turnovers during the 3-year
period, as well as a change in scoring instrument on the third year. In addition to the reasons

37
above, as a case study, the constraints in time, resources and lack of researcher’s control may
contribute to the results. The authors recommended further research to “evaluate the
effectiveness of the IRR training by gathering and analyzing either pre- or post-training
evaluations or by comparing the evaluation results of a trained group of I/Es versus an untrained
group” (Holt, Hansberger & Boehm-Davis, 2002, p. 328).
Weber (2016) compared the IRA/IRR of participants from two different airlines.
Participants from Airline A received training on the assessment model, while participants from
Airline B did not receive any training. The results showed that participants from Airline B gave
significantly lower scores than Airline A. Participants from Airline A had lower standard
deviation and a narrower range of scores compared to Airline B. This indicated that participants
who were trained with the assessment model had higher IRA and lower scoring variation,
compared to participants who were not trained with the assessment model. Also, a pass-fail
analysis was conducted. Participants from Airline B were much stricter regarding pass or fail
judgements, compared to Airline A (Weber, 2016).
The testing of NOTECHS training was conducted by a joint research committee consisted
of several airlines and universities in Europe (Flin et al., 2003). Participants include a total of
105 instructors from 12 different countries in Europe. Results showed that 80% of instructors
graded consistently under NOTECHS. The difference between the instructors’ ratings and the
referent rating was less than 1 on a 5-point scale. The results showed a high level of IRA and a
high level of internal consistency (Flin et al., 2003). However, the researchers found out that the
variation was more significant when raters were grading based on pass/fail, compared to grading
based on a 5-point scale. Also, “situational awareness” and “decision making” categories were
the hardest to grade accurately (O’Connor et al., 2002).

38
The study conducted by Beaudin-Seiler and Seiler (2015) focused on the IRA/RRA
issues of flight instructors in a collegiate aviation program. The rater training sessions had a
positive effect on flight instructors with one year or less of experience. For flight instructors with
13 months to two years of experience, there was an improvement in agreement, but not as
significant compared to less experienced flight instructors. For instructors with more than two
years of experience, the researchers only found a slight improvement in agreement. Even though
there was an improvement after training, the IRA was still not at an acceptable level, and there
was still a gap between instructors’ ratings and the gold standard (Beaudin-Seiler & Seiler, 2015).
Rater training was effective in the study conducted by Sattler et al. (2015) regarding
university grant peer review. Results showed that the training (treatment) group had significantly
higher ICC compared to the untrained group. The authors also compared the raters’ results with
the referent score and showed that the treatment group provided more similar scores to the
referent. A similar study was conducted by Schroter et al. (2004) to test if an in-person training
workshop or a self-study training program could improve the IRA of journal peer review.
Participants were randomly assigned into three groups: a control group, a workshop group, and a
self-taught group. A pre-test was administered in the form of a sample paper for participants to
complete three tasks: assign quality review instrument, identify the number of major errors and
to accept/reject the paper. The first post-test was given two to three months after the treatment,
and a second post-test was given six months after the treatment. Results showed that the self-
study group scored highest in terms of review quality, number of errors identified, and rejection
rate during the first post-test, compared to the control group. The workshop group also scored
significantly higher during the first post-test, but slightly lower than the self-study group.
However, for the second post-test, the author did not detect a significant difference among all

39
groups. The author concluded that short training programs would provide a slight impact on peer
review quality, but the treatment would not be as effective over time (Schroter et al., 2004).
The results of training were also positive in the field of dentistry. Lin et al. (2013) used a
one group pre-test post-test design to analyze IRR among nine raters. After the pre-test, the
participants received a one-month rater assessment training, followed by the post-test. The
results showed that the training program was efficient to significantly improve IRR.
In addition, Jackson et al. (2005) utilized the FOR training method to train management
assessors on evaluation of behaviors and traits. Results showed that IRR improved significantly
after the training, for both behavior measures and trait measures.
However, several research studies showed little or no improvement after training. In the
medical field, Cook et al. (2009) utilized a training workshop on Mini-Clinical Evaluation
Exercise. The training workshop consisted of PDT, RET, BOT and FOR training. Results
showed that the training workshop did not significantly improve IRR/RRR. The authors cited the
sample size, the short workshop, and the problems with FOR training as possible reasons for
non-significant improvements.
Weitz et al. (2014) used a post-test only control group design to test FOR training on the
assessments of physical examination skills. The results indicated that the rater training did not
create a significant impact on rating accuracy. However, the treatment group was significantly
more stringent on the ratings, and the level of stringency was closer to the referent. The author
claimed that the FOR training could not effectively adjust individual rater’s judgments on real-
life assessments (Weitz et al., 2014).
Lundstrom (2007) utilized FOR training to evaluate biodata on applicants’ résumés.
Results showed that there was an improvement in grading accuracy after FOR training, and there

40
was an improvement in IRR. However, the scores of the treatment group did not reach the same
level when comparing with the referent score.
In conclusion, there has been mixed results regarding the effectiveness of rater training.
A pre-test post-test control group design may be ideal to examine training effectiveness in a
controlled experimental condition.
2.14 Addressing the Issues Identified in Literature Review
Through the literature review, no study was found in aviation that utilized a pre-test post-
test control group design to investigate IRA/RRA issues. Also, several studies examined
IRA/RRA of a scoring instrument, instead of determining the effectiveness of rater training.
Conducting experimental studies at air carriers is not an easy task due to constraints in
costs and resources. However, there is a possibility to perform IRA/RRA research studies under
the collegiate environment. The SOP of the Embraer Phenom 100 at Purdue University is
identical to the one used by air carriers, and students are trained to the FAA Airline Transport
Pilot (ATP) standard. Baker and Dismukes (2002) recommended the use of experimental design
to test the effectiveness of rater training programs. A pre-test post-test control group design can
be utilized to test if there is statistical significance between and within groups.
There were several constraints in the case study by Holt et al. (2002). The case study was
conducted on a regional airline over a period of three years, and researchers had little control
over the nuisance factors. There was a large turnover rate of the participants. Novice instructors
who joined in the middle of the study, as well as experienced instructors who left the study may
have created impacts on the results. Also, there was a major revision to the evaluation worksheet
on the third year. A more robust experimental design could be developed, with a random

41
assignment of raters, as well as a reduction in research timespan to minimize turnovers. With this
in mind, a pre-test post-test control group design would be ideal to further investigate this issue.
The study conducted by Weber (2016) compared participants from two different airlines,
in which one airline utilized an assessment model, while the other airline did not. These two
airlines operated different types of aircraft with different SOPs. There was possible confounding
on whether the airlines themselves caused the difference, or the assessment model caused the
difference. The author recommended a more rigorous experiment design with highly identical
conditions among all participants, hopefully operating the same aircraft type, and working for the
same company. It would be ideal to utilize the pre-test post-test control group design, with
participants from the same flight program.
The study of IRR among four flight instructors by Smith et al. (2008) was limited in
sample size (n = 4). There was one outlier that significantly lowered the overall Cohen’s Kappa
Coefficient. Also, there was no demographic information collected on the subjects. As a result,
the backgrounds of these flight instructors were unknown. The authors suggested future research
to include larger sample size, more flight events and collect demographic information (Smith et
al., 2008).
2.15 Summary
This chapter provided a literature review on the problem of pilot training, inter-rater
reliability/agreement, referent-rater reliability/agreement and rater training. The next chapter
presents the methodology to be used in this study.

42
METHODOLOGY
This chapter provides the methodology used in this study. A randomized pre-test post-test
control group design was utilized. The goal of this research is to determine the effectiveness of a
training workshop in improving inter-rater agreement (IRA) and referent-rater agreement (RRA)
of pilot performance evaluations conducted by instructors and evaluators (i.e., raters).
3.1 Research Design
According to Campbell and Stanley (1963), true experimental design is one of the most
recommended research designs to examine cause and effect relationships. There are a few
requirements for the study to be considered a true experimental design (Shuttleworth, 2008): first,
a control group, that does not receive any treatment, must exist; second, the subjects must be
randomly assigned to the different groups, and third, only one variable is changed and tested,
which is the independent variable.
Campbell and Stanley (1963, p. 8) identified the following types of true experimental
designs: “the pre-test post-test control group design, the post-test only control group design and
the Solomon four-group design”. The basic principles of true experimental designs are:
randomized assignment of experimental units to different treatments, repeated treatments on
multiple experimental units, and comparing two or more experimental conditions (Moore,
McCabe, & Craig, 2014).
The pre-test post-test control group design is one of the most widely used design methods
(LoBoindo-Wood, Haber, Cameron, & Singh, 2014). This type of design allows researchers to
conduct the study in a more controlled environment. With the pre-test post-test control group

43
design, the comparison between pre-test and post-test, as well as the comparison between control
group and treatment group, can be conducted.
In the pre-test post-test control group design used in this study, participants were
randomly assigned to a control group and a treatment group. Both groups received the same pre-
test. After administration of the pre-test, participants in the treatment group attended the training
workshop (treatment), while participants in the control group did not receive any treatment.
Finally, a post-test was conducted for both groups.
𝑅 → 𝑂1 → 𝑋𝑐 → 𝑂2
𝑅 → 𝑂1 → 𝑋𝑡 → 𝑂2
𝑅= Random Assignment𝑂1= Pre-test
𝑋𝑐= Control Group (No Treatment)
𝑋𝑡= Treatment 𝑂2= Post-test
3.2 Types of Statistical Error
There are several types of statistical errors that may render the conclusion invalid, even if
the statistical test is significant. A type I error occurs when the null hypothesis is rejected
incorrectly (Banerjee, Chitnis, Jadhav, Bhawalkar, & Chaudhury, 2009): even though the null
hypothesis is true in the entire population, the researcher still rejects the null hypothesis based on
the experiment. Type I error is regarded as 𝛼 (alpha) error. A commonly used 𝛼 value is 0.05,
and a conventional range for 𝛼 is between 0.01 and 0.10 (Banerjee et al., 2009).
A type II error occurs when the null hypothesis is retained incorrectly (Banerjee et al.,
2009): the researcher fails to reject the null hypothesis based on the experiment, even though the
null hypothesis should be rejected in the entire population. Type II error is regarded as 𝛽 (beta)

44
error. A commonly used 𝛽 value is 0.2, and a conventional range for 𝛽 is between 0.05 and 0.20
(Banerjee et al., 2009).
Increasing the sample size would reduce the chance of Type I and Type II errors.
However, the increased sample size requires additional cost and resources, which may be
impractical for some research studies.
3.2.1 Power
Power is the probability that the null hypothesis is rejected when it should be (Banerjee et
al., 2009). The power is equal to 1-𝛽. If 𝛽 = 0.3, then Power = 0.7. The higher the power, the
higher the chance of observing an effect, considering the specific effect size. A commonly-used
power value is 0.80 (Banerjee et al., 2009).
3.2.2 Effect Size
Even if the treatment effect is statistically significant, the results may not be meaningful
or helpful. For example, the treatment showed a 1% increase, which was statistically significant.
However, the 1% increase may not have any practical meaning. Statistical significance only
measures whether two groups are different. It is equally important to test how much of a
difference exists. In this case, the effect size needs to be determined.
One of the most common methods to measure effect size is Cohen’s D (Cohen, 1988).
The formula is as follows (Stangroom, 2018):
𝑑 =𝑀𝑔𝑟𝑜𝑢𝑝1 −𝑀𝑔𝑟𝑜𝑢𝑝2
𝑆𝐷𝑝𝑜𝑜𝑙𝑒𝑑
An effect size of 1 means that the difference between means is one standard deviation.
According to Cohen (1992), 0.2 is considered as a small effect size, 0.5 represents a medium
effect size, and 0.8 is a large effect size.

45
If the effect size is very small, even if the difference is statistically significant, the
difference is trivial, and the practical meaning of that difference is negligible. The larger the
effect size, the larger the difference between groups; the smaller the effect size, the harder to
determine the actual difference between groups.
3.3 Sampling Approach
To participate in this study, candidates were required to fulfill two requirements: to hold
an FAA CFI certificate, and to be currently enrolled or have completed AT395 (Turbine Aircraft
Simulations Lab) at Purdue University. An ideal situation is that all candidates who meet the
requirements will participate in this study. However, as a human subject study, researchers
cannot force people to participate. All participants were recruited under an established and
approved process, and all participants voluntarily agreed to participate.
The researchers utilized multiple methods to advertise this study and recruit participants.
First, all Professional Flight Technology students (junior standing or above) received an email
soliciting participation. The email is included in Appendix B. A sign-up webpage hyperlink was
included as part of the email. If a potential participant was interested in the study, he/she was
able to type in and submit his/her email address on the webpage.
Second, the researchers worked with instructors of the following Purdue University
courses: AT388 (Large Aircraft Systems), AT395 (Turbine Aircraft Simulation Lab), AT396
(Turbine Aircraft Flight Lab), and AT487 (Transport Aircraft Simulation Lab), to recruit
students who were enrolled in these courses. A paper form was provided for potential
participants to write down their email addresses, if they were interested.
Third, additional advertisements were posted at the Purdue University Airport facilities,
including Niswonger Hall of Aviation Technology, Airport Terminal, Hangar 5, Hangar 6, and

46
Holleman-Niswonger Simulator Center. A Quick Response Barcode was included in the poster.
If potential candidates were interested, they could scan the Barcode to enter the sign-up webpage.
To thank participants for their time and effort in the study, participants received a gift card award
if they completed the experiment.
Based on the literature review, instructional experience of the individual participants may
be a nuisance factor for this study. New instructors have less experience in performance
evaluation. To compensate for this issue, the participants were classified in two blocks:
Participants with less than 100 hours of experience as a flight instructor (Block A), and
participants with 100 hours of experience as a flight instructor or more (Block B).
Before the start of the pre-test, each participant was assigned a random identification (ID)
number and were asked to report their total time as a flight instructor (dual-given time). Based on
these reported data, participants became part of either Block A or Block B. Within these two
blocks, a random assignment was conducted. By using this method, the difference in
instructional experience could be minimized between the two groups.
According to Kottner et al. (2011), few studies have investigated the sample size issues
for IRA/IRR research. However, a wide variety of methods could be used to determine the
required sample size. In IRA/IRR studies, the total number of observations (𝑛𝑂𝑏𝑠𝑒𝑟𝑣𝑎𝑡𝑖𝑜𝑛𝑠) is
determined by the total number of raters (k) multiplied by the number of items they grade
(𝑚𝑆𝑝𝑒𝑐𝑖𝑚𝑒𝑛𝑠). The total number of grading items can be controlled by the researchers, by
adjusting the number of video scenarios available. It is desirable to find a balance between the
total number of raters and the total number of grading items while considering the limitations in
time and resources, to determine the optimized sample size.

47
By using an independent t-test to compare the mean absolute deviation (MAD) between
the groups, Cohen (1992) suggested that for two-tailed, medium effect size (d = 0.5), an alpha
value of 0.05 and a beta value of 0.20, a sample size of 64 per group is needed.
In order to use a paired samples t-test to compare the statistical significance within the
same group between the pre-test and post-test, another sample size calculation is needed. For
two-tailed, medium effect size (d = 0.5), an alpha value of 0.05 and a beta value of 0.20, it is
required to have a sample size of 34, according to G*Power Version 3.1.9.2 (Faul, Erdfelder,
Lang, & Buchner, 2007).
Gwet (2013) calculated the number of sample raters needed, based on the percentage of
agreement measurements. The author argued that using the percentage of agreement is the most
practical approach to determine the sample size in IRA/IRR studies, as many variables may be
unknown during the design stage of a study. IRA/IRR research studies usually report two or
more different measurements (such as Cohen’s Kappa, ICC, Fleiss’ Kappa), and selecting the
sample size based on percentage of agreement is beneficial to all IRA/IRR measurements.
According to Gwet (2013), the variances caused by the raters should be no more than 4𝑝𝑎2/𝑟2, in
which 𝑝𝑎 is the percentage of agreement and 𝑟 is the number of raters. As a result, the required
number of raters is determined by the desired variation coefficient.
Calculations showed that in order to ensure the variance caused by the sampling of raters
is less than 5%, a total of 40 raters are required (Gwet, 2013). To ensure the variance caused by
the sampling of raters is less than 10%, the required number of raters needs to be 20 (Gwet,
2013).

48
3.4 Unequal Control and Treatment Group Allocations
One of the most challenging factors for human subject research studies is the limited
number of candidates who are willing to voluntarily participate. As a pre-test post-test control
group design, participants were randomly assigned into two groups. Due to the limited number of
participants available, the researchers decided to employ a smaller control group and a larger
treatment group. Hutchins, Brown, Mayberry and Sollecito (2015) conducted a simulation of
different control group sizes relative to a fixed treatment group size for intervention effects.
Results showed that “the mean intervention effect and effect sizes were equivalent regardless of
control group size and equal to the actual study effect” (Hutchins et al., 2015, p. 1).
There are several reasons for the utilization of an unbalanced group design. The first and
foremost factor is the limitation in cost and resources. Torgerson and Campbell (2000) claimed
that for a fixed sample size, an unbalanced design may result in substantial savings in cost, with
only limited reduction in statistical power.
The treatment for this study is a training workshop, which implies a “learning” element.
Allowing more participants to be assigned to the treatment group may cause a reduction of the
possible impact, due to “learning curve” (Dumville, Hahn, Miles, & Torgerson, 2006).
Peckham et al. (2015) analyzed a total of 86 studies with unequal control group and
treatment group(s). Results showed that 84% of the studies utilized an unbalanced ratio of 1:2,
with 94% of the studies favoring the intervention group. Reasons for the unbalanced design
include learning curves, statistical analysis, adverse events, logistical, ethical, economic, and
improving recruitment (Peckham et al., 2015).
Based on the research cited, this study utilized a participant ratio of 1:2 between the
control group and the treatment group. For the 29 participants in this study, 9 were in the control
group and 20 were in the treatment group.

49
3.5 The 4-Point Grading Scale
Table 3.1 illustrates the four-point grading scale that was used to grade each scenario
event, based on the grading scale utilized by Transport Canada (2017).
Table 3.1 The 4-Point Grading Scale
Goldsmith and Johnson (2002) claimed they have seen grading scales ranging from 2
points, to 5 points. The critical issue was the ability of raters to correctly discriminate the
different levels of performance, based on the grading scale. If the grading scale was too wide,
evaluators were not able to discriminate performance precisely. If the grading scale was too
narrow, potentially useful information was lost (Goldsmith and Johnson, 2002).
Under Advanced Qualification Program (AQP), the FAA (2006) did not establish a
common, standardized grading scale. Instead, the FAA allowed individual air carriers to set the
grading scale, based on the airlines’ own needs.
A 4-point scale was utilized at the air carriers studied by Baker and Dismukes (2002), Holt,
Hansberger, and Boehm-Davis (2002), and Mulqueen et al. (2002). It was also used at the
collegiate flight program studied by Beaudin-Seiler and Seiler (2014). Moreover, the examples in
ICAO (2002) Line Operations Safety Audit used a 4-point grading scale, indicating a 1 as “Poor

50
observed performance that had safety implications”, 2 as “Marginal observed performance that
was barely adequate”, 3 as “Good observed performance that was effective” and 4 as
“Outstanding observed performance that was truly noteworthy” (ICAO, 2002, p. A-2). Delta
Airlines used a 4-point scale for procedures and automation proficiency, and a 5-point scale for
Stick & Rudder and CRM/TEM (Tovani, 2014).
The 4-point scale has been used and validated by Transport Canada (2017), the aviation
authority of Canada. Transport Canada has been utilizing a 4-point grading scale, not only at air
carriers, but also for all flight tests (checkrides), ranging from recreational pilot permit to aircraft
type ratings. Pilot examiners are required to give grades to each maneuver that a student
performed during the flight test, based on a 4-point grading scale. Rather than assigning “pass”
or “fail”, the 4-point scale was designed to more closely reflect the quality of performance.
Transport Canada (2006) stated in their check pilot manual that “the (1) to (4) marking scale is
based on accepted instructional design principles and is an integral part of the Advanced
Qualification Program (AQP), which is being recognized worldwide and adopted by several
major airlines for crew training. The scale is consistent with ICAO proposals for international
adoption of competency-based (skill-based) training and evaluation” (p. 59).
A 5-point scale has also been commonly used in the aviation industry, such as the flight
school studied by Smith et al. (2008), as well as the air carriers studied by Flin et al. (2003),
Mavin, Roth, and Dekker (2013), and Weber (2016). IATA (2013) also demonstrated the use of
a 5-point scale.
A grading scale that is too wide may lead to difficulties when grading the student and
may result in low IRA. Bamford et al. (2004) conducted analysis on a 10-point scale to measure
the severity of rosacea. Results showed that the IRA was low. However, after the scales were

51
collapsed to a 6-point, 5-point or 4-point scale, the IRA improved significantly. The authors did
not find a significant difference in terms of IRA between the 5-point and 4-point scale.
A grading scale that is too narrow may not clearly reflect the candidate’s actual
performance. Halpin, Halpin, and Arbet (1994) compared the internal consistency of two
response formats - a two-choice (true or false) format to a 4-point Likert scale format. Results
showed that the internal consistency was significantly improved for the 4-point Likert-type
format, compared to the true or false format.
To determine the optimal width of the grading scale, Lozano, Garcia-Cueto, and Muniz
(2008) conducted simulated tests on the reliability and validity of grading scales with width from
two to nine. A total of 30 items were tested with sample sizes of 50, 100, 200 and 500. Results
showed that the optimum number of the grading scale was between four and seven.
In conclusion, a 4-point scale was used for this study. A 4-point scale may be less
difficult to train than a 5-point scale, as raters can more easily discriminate students’
performance. The disadvantage of a 4-point scale is that the information may not be as detailed
as taken using a 5-point scale.
3.6 Scenario Events for Evaluation
The participants in this study were asked to view several videos and grade the videotaped
students’ flight performance. A total of six videos were created for pre-test, with another six
videos created for the post-test. Each set of videos covered six different Areas of Operation. The
Areas of Operation were selected from the FAA (2008) Airline Transport Pilot and Aircraft Type
Rating Practical Test Standards (PTS). Table 3.2 shows the Areas of Operation and the
approximate length of each video scenario.

52
Table 3.2 The Video Scenarios
Two different scenario events were recorded for each Area of Operation listed above,
totaling 12 videos. Six of these scenario events were used for pre-test, and six were used for
post-test. Each of the 12 videos was assigned a referent standard score in advance.
For the pre-test, the video scenarios were developed and scripted with the following
referent standard scores:
IV. Task A: 3
IV. Task B: 2
V. Task C: 2
VI. Task B: 3
III. Task F: 4
VIII. Task A: 1
For the post-test, the video scenarios were developed and scripted with the following
referent standard scores:
IV. Task A: 2

53
IV. Task B: 1
V. Task C: 3
VI. Task B: 2
III. Task F: 3
VIII. Task A: 4
Each video scenario was scripted and designed based on these scores. The researchers
operated an Embraer Phenom 100 Flight Training Device (FTD) and flew the scenarios based on
a pre-designed script to reflect different grades of performance for the event sets above. These
event sets were videotaped and edited for participants to evaluate.
3.7 Developing the Scenarios Based on the Referent Score
With the referent scores defined above, the script for each video scenario was designed
based on these referent scores. Current Phenom 100 full-time instructors (training captains)
formed a board of subject-matter experts (SMEs). The SMEs discussed what type of behaviors or
performance would represent the gold standard scores listed above and validated the video
scenario scripts. To effectively gather information from all participating SMEs, the Delphi
Method was used.
The Delphi Method, also called the Delphi Technique, was developed by the RAND
Corporation to predict potential future war attacks (RAND Corporation, 2017). It was developed
to gather a range of responses from different experts and achieve convergence of different
opinions. The Delphi Method could be useful in several situations, such as developing
alternatives, exploring underlying assumptions, seeking information, and correlating informed
judgments (Hsu & Sandford, 2007).

54
A common problem during an in-person meeting is that sometimes the opinions and
views may be dominated by someone with high status (such as a manager), those with forceful
personalities, or from internal and external pressures. Consequently, not everyone's view can be
shared equally, and some important opinions may be ignored. The Delphi Method avoids this
problem by allowing every member to share their opinions individually and anonymously. With
several rounds of discussions, the group may be able to reach a consensus (Thangaratinam &
Redman, 2005).
The typical process of the Delphi Method is as follows: The first round of a questionnaire
is sent to the group of experts, to gather the individual's opinions, thoughts and ideas. The
questionnaire usually consists of open-ended questions. The replies are organized qualitatively
by the researchers. The researchers group different views and prepares a compiled response
information packet, along with the second questionnaire, which is more specific. This packet is
sent back to the experts, and the experts provide one further round of comments. The opinions
are then posted back to researchers and further analyzed. Several rounds of comment gathering,
and feedback are conducted until a consensus can be formed or the results can be published
(Thangaratinam & Redman, 2005).
For this study, a three-round Delphi Method was utilized. The goal of this Delphi Method
discussion is to determine the types of behaviors that represent each grade of performance, to
determine what exact behaviors will be embedded within each video scenario, and to develop
and validate the video scenario scripts.
During the first round of discussion, each SME was asked to brainstorm what behaviors
or tolerances would result in certain scores. For example, each SME would determine what type

55
of behavior would have caused a score of 1 (unsatisfactory) for the steep turn maneuver. The
brainstorming questionnaire was included in Appendix D.
After the first round of questionnaires were completed and returned, the researchers
summarized all the SMEs’ comments and feedback. A scenario script was developed by the
researchers, based on the responses from the SMEs. Then, a second round of discussions was
initiated. During the second round, the SMEs were asked to provide comments and edits to the
scenario script.
After the feedback from the second round was gathered, the researchers made several
updates to the scenario script. Then, the third round of the Delphi Method process was conducted.
The updated scenario script was sent out for final review and validation. Afterwards, the final
version of the scenario script was completed. The video scenario script is included in Appendix
E.
3.8 Procedures
As a human subject research study, an Institutional Review Board (IRB) review by
Purdue University’s Human Research Protection Program (HRPP) is required to ensure the study
is “conducted ethically and in a manner that promotes the protection of the rights and welfare of
human subjects” (Purdue University, 2018). An IRB request was submitted before any
recruitment or experiment process started. The IRB request package consisted of all surveys,
recruitment posters, invitation letters, informed consent forms, as well as the step-by-step details
of the recruitment and experiment procedures. After one revision regarding the wording of the
advertising poster, the IRB permission was granted. The IRB authorization letter is included in
Appendix A.

56
Two independent experiment sessions were planned on two different dates. Each
participant could choose which session they would like to voluntarily participate in, and each
participant could only participate in one of the two sessions. The two sessions were identical in
content.
During each session, two classrooms were used for this study: a computer lab for
participants to complete the pre-test and post-test, and a classroom to conduct the training
workshop for the treatment group. Both classrooms were located at Niswonger Hall of Aviation
Technology at Purdue University, in West Lafayette, Indiana.
3.8.1 Intake of Participants
Participants were welcomed by researchers as they entered the computer lab. As
participants entered the classroom, a randomized ID number was assigned to each participant as
a method of de-identification. Based on this randomized ID number, they were asked to take the
most spread-out seating in the computer lab, to avoid interference with other candidates. Pizza
and refreshments were provided before the actual experiment started.
An information briefing was conducted. Researchers introduced the significance of this
research and explained the steps and timelines for the experiment. Participants were given time
to read through and sign the informed consent form, if they decided to participate. The form also
stated that the participant had the right to withdraw from participation at any time without
penalty. Signing the form indicated that the participant understood his/her rights in the study, and
his/her consent to participate. The informed consent form is included in Appendix C. The
participants also confirmed that they were at least 18 years of age. Any additional questions
raised by the participants were answered by the researchers.
The welcome session lasted approximately 20 minutes.
57
3.8.2 Pre-Test
A short survey was conducted to determine the participants’ demographics background
and instructional experience. The survey is included in Appendix F. Based on the instructional
experience information from the survey, participants were assigned randomly into two groups -
the treatment group and the control group.
During the pre-test, participants from both groups were asked to evaluate six video
scenarios, using the four-point grading scale. The process was done individually on personal
computer (PC) stations. Each participant watched the six videos on their PC stations with their
headphones on, and gave their ratings on the online grading sheet. Also, participants were asked
to list the errors or problems they observed in each of the videos. Copies of the respective pages
of the Embraer Phenom 100 SOP, Checklist, QRH, Jeppesen Approach Charts and multiple
sheets of blank note paper were provided to the participants.
The pre-test took approximately 30 minutes. After the pre-test, participants in the control
group were asked to stay in the computer lab, while participants in the treatment group were
asked to move to another classroom for the workshop.
3.8.3 Control Group
Participants in the control group did not receive any treatment. After the pre-test, there
was a 10-minute break period. When the break period was over, the control group participants
were asked to complete the post-test.
3.8.4 Treatment Group
After the pre-test and a 10-minute break period, participants in the treatment group
attended the rater training workshop, conducted by the researcher in a separate classroom. The
rater training workshop lasted approximately 75 minutes.

58
After the rater training workshop, participants in the treatment group received another 10-
minute break. After the break period, participates were asked to move back to the computer lab
and complete the post-test.
3.8.5 Post-Test
Participants in both the control group and the treatment group were asked to grade the
last six video scenarios, using the four-point grading scale. These videos were different from the
videos used in the pre-test, but covered the same Areas of Operation. The process was done
individually on PC stations. Each participant watched the six videos on their PC stations with
headphones on and indicated their ratings on the online grading sheet. Participants were also
asked to list the errors or problems they observed in each of the videos. Copies of the respective
pages of the Embraer Phenom 100 SOP, Checklist, QRH, Jeppesen Approach Charts and
multiple sheets of blank note paper were provided to the participants.
The post-test took approximately 30 minutes. A survey was conducted afterwards,
focusing on the participants’ feedback and thoughts on performance grading and evaluation.
Participants were thanked and asked to leave the classroom when they were finished. The
participants were given a Gift Card award as they exited the classroom. At this point, the
experiment was considered complete for the participants.
3.9 Design of the Rater Training Workshop
As part of the experiment, participants in the treatment group underwent an interactive
rater training workshop. The rater training workshop was similar to the rater academic training
used in the airline industry. The training workshop was developed by the researchers and
validated by the board of SMEs.

59
The rater training workshop included the following elements:
3.9.1 Introduction
The workshop started with a discussion of the problem, the importance of standardized
grading, the difficulties faced to achieve this goal, as well as the significance of this training
workshop. Also, the typical grading process was introduced and discussed.
3.9.2 Behavioral-Observation Training
As part of the BOT, the researchers trained participants on how to effectively observe a
student’s behavior. Through in-class lectures, videos and discussions, participants were taught on
how to observe a student’s behaviors, what to specifically look for, how to multi-task, what to do
when a mistake was observed, as well as note-taking techniques. Typical observational errors
and their antidotes were also discussed. For each of the six Areas of Operation, participants
discussed what to look for and what to focus on during the observation process.
3.9.3 Review of Embraer Phenom 100 Operating Procedures
A good instructor is required to be competent with the operating procedures of the
specific aircraft type. Due to time constraints, during the workshop, participants only reviewed
the relevant normal and abnormal procedures for the Areas of Operation utilized in this study.
There was also a discussion on which official document to refer to, if the instructor was unsure
of certain issues. Aircraft limitations, such as maximum airspeed and stall airspeed, were also
discussed and reinforced. The goal of this review was to refresh the details of Phenom 100
Operating Procedures, similar to a recurrent training ground school.

60
3.9.4 Performance-Dimension Training
First, the 4-point grading scale was introduced and discussed in detail, including the
concepts behind each point on the grading scale. The training was specifically focused on the
difference between a score of “2” and a score of “3”. Second, the performance standard for each
of the six Areas of Operation was discussed individually. Common errors for each maneuver
were also discussed as part of the PDT. The goal was to let instructors become an expert with the
grading process, based on specific Area of Operation, and effectively utilize the grading scale.
3.9.5 Frame-of-Reference Training
As part of the FOR training, the researchers provided two calibration scenarios for each
Area of Operation, and an interactive grading process was initiated. Participants were given four
sheets of colored index cards, with “1”, “2”, “3” and “4” written on each card. Participants were
asked to raise the index card that represented the scores they gave to the student, based on their
own judgements. Participants’ individual evaluation scores were compared with the referent and
with other participants. Participants then discussed the reasons behind their judgements and
reviewed the discrepancies between the referent and the raters. This interactive process was used
to practice grading, calibrate raters, and provide standardization for all raters. The goal was to
train participants on a common frame-of-reference.
The training was concluded by a discussion on the topic areas reviewed, and a “questions
and answers” session.
The outline of the training is illustrated in Table 3.3.

61
Table 3.3 Training Workshop Outline
➢ Introduction (5 mins)
• Problems with inconsistent instructor grading
• Importance of rater training and standardization
• Typical grading process
o Observe student behaviors and take notes
o Evaluate student behaviors and compare with the grading standard
o Conclude results and assign scores to the student
➢ Behavioral-Observation Training (15 mins)
• The observation processes
• Techniques in behavior observation and what to look at
o Observing aircraft instruments, hand-flying, automation, pilot flying/ pilot
monitoring duties, ATC, intercom/noise and aircraft warnings.
• Emphasizing multi-tasking skills
o Acting as an instructor, grader, ATC, simulator operator at the same time
o Managing distraction
• Note-taking techniques
o Best note-taking format
o Using abbreviations
• Common observational errors
➢ Review of Embraer Phenom 100 Operating Procedures
• Review of Phenom 100 limitations
• Review of Phenom 100 SOPs for the scenarios involved

62
• Official documents and manuals
➢ Performance-Dimensions Training & Frame-of-Reference Training (50 mins)
• Introduction of the 4-point grading scale
o What is a 4-point performance?
o What is a 3-point performance?
o What is a 2-point performance?
o What is a 1-point performance?
o Focus: How to distinguish a score of 2 and a score of 3?
• Discussion of the six Areas of Operation in detail
• Common errors for each maneuver
• Practice grading
o 2 calibration scenarios for each Area of Operation
o Let the participants grade each behavior
o Compare the grades given by each person with the referent standard
o Discussion of results
➢ Q & A (5 mins)
3.10 Variables
For this study, the grades given by the participants were the variables obtained through
the pre-test and post-test. Analyses were conducted on these scores to determine the IRA/IRR
coefficients (percentage of agreement and Fleiss’ Kappa), as well as the mean absolute
deviations (MAD) from the referent score. The grades given by the participants, as well as the
MAD, were the dependent variables (DV) for this study.
63
The independent variable (IV) was the training workshop completed by the participants
in the treatment group.
3.11 Data Analysis
First, descriptive data from the participants were analyzed. The mean and median ratings,
as well as the standard deviation were calculated for pre-test control group, pre-test treatment
group, post-test control group, and post-test treatment group.
The research questions were analyzed as follows:
Research Question 1: After receiving the training, is there a significant increase in the
level of agreement among different raters?
The percentage of agreement for the pre-test control group, pre-test treatment group,
post-test control group, and post-test treatment group were calculated and compared as a baseline
reference.
In order to analyze the chance-corrected indication of inter-rater agreement, the Fleiss’
Kappa values were calculated for each of the four groups. The Fleiss’ Kappa values were then
compared between and within groups and were referred to the matrix developed by Landis &
Koch (1977), to determine the change in the level of agreement among different raters.
The hypothesis was an improvement in the level of agreement among different raters for
the treatment group after the training workshop, as measured by the Fleiss' Kappa Statistic.
Research Question 2: After receiving the training, is there a significant increase in the
level of agreement between the raters and the referent standard?
The percentage of agreement compared to the referent score for the pre-test control group,
pre-test treatment group, post-test control group, and post-test treatment group were calculated as
a baseline reference.

64
For each score given by the participants, the absolute deviation of that score from the
referent score was calculated. The MAD was then analyzed for each participant.
An independent samples t-test was used to determine the statistical significance between
pre-test control group and pre-test treatment group, as well as between post-test control group
and post-test treatment group. In addition to the t-test, the Mann-Whitney U test was used as a
non-parametric test to determine the statistical significance between the two groups.
A paired samples t-test was used to determine the statistical significance between pre-test
control group and post-test control group, as well as between pre-test treatment group and post-
test treatment group. In addition to the t-test, the Wilcoxon Signed-Rank Test and the Sign Test
were conducted to determine the statistical significance within the groups.
The hypothesis was an improvement in the level of agreement between the raters and the
referent standard for the treatment group after the training workshop, as measured by the MAD.
3.12 Threats to Internal and External Validity
There were several issues that must be addressed to reduce threats to internal validity and
external validity. For the pre-test post-test control group design, potential issues must be
identified, and care should be taken throughout the design and implementation phases, to
minimize the threats to internal and external validity.
Internal validity is the ability of researchers to identify whether the independent variable
created an effect on the dependent variable (Groebner, Shannon, & Smith, 2011). According to
Campbell and Stanley (1963), potential threats to internal validity are: “History, Maturation,
Testing, Instrumentation, Selection Bias, Statistical Regression, Mortality and Selection-
Maturation Interaction” (p. 5).

65
External validity is the generalizability of treatment, or the observed relationships to the
population outside of the experiment (Sani & Todman, 2008). There are also several important
factors to be considered to ensure external validity, including “reactive or interaction effect of
testing, interaction of selection bias and experimental variable, reactive effects of experimental
arrangements, and multiple treatment interference” (Campbell and Stanley, 1963, p. 5-6).
3.12.1 History
History occurs when participants experience an external event not as part of the
experiment, and that external event affects the post-test score (Kirk, 1982). For example,
between the pre-test and post-test, the participant received additional rater training from outside
sources. Researchers must ensure participants are not receiving treatments from other sources at
the same time. The experiment should be conducted and finished in a timely manner, to limit the
potential effects of external events. For this study, the pre-test, treatment, and post-test were
completed on the same day, thus minimizing the adverse effect of history on internal validity.
3.12.2 Maturation
Dimitrov and Rumrill (2003) stated that maturation and history are the major threats to
internal validity in pre-test post-test control group designs. Maturation is the physical or
psychological change of participant characteristics over time, and that change can affect the post-
test score (Campbell & Stanley, 1963). In contrast to history, maturation results from the internal
changes that occur within the participants themselves, instead of changes caused by external
events.
This study aimed to minimize maturation by reducing the overall time span of the
experiment. As noted with history, the pre-test, treatment, and post-test were conducted in one
day to reduce the threat from maturation. In addition, the FAA requires holders of the flight

66
instructor certificate to be at least 18 years of age (Eligibility Requirements, 2009). Only adults
were eligible to participate in this study.
3.12.3 Testing
A pre-test may influence the outcome of a post-test (Christensen, Johnson, & Turner,
2015). The participant could memorize the questions used in the pre-test and apply that memory
to the post-test. Careful design of the pre-test and post-test is essential to reduce the threats to
validity from testing. For this study, researchers recorded two different sets of video scenarios.
One set was used for the pre-test, while the other set was used for the post-test. Participants used
the same grading scale to evaluate pilot performance in the videotapes for both pre-test and post-
test. Repetition of the same videotapes was avoided, thus preventing participants from judging
based on memory.
3.12.4 Instrumentation
If there is a change in the measurement instrument, or if there is a change in observers or
grade sheets used during the experiment, there could be threats to internal validity (Campbell &
Stanley, 1963). For this study, participants conducted the pre-test and post-test under the same
set-up conditions, with the same evaluation standards and grading sheets.
3.12.5 Selection Bias
Selection bias occurs when participants in the control group and treatment group are not
equivalent at the beginning of the study (Campbell & Stanley, 1963). Randomization is very
important to reduce the threat from selection bias.
In this study, participants were randomly assigned into either the treatment or the control
group, based on their instructional experience, with a ratio of 2:1.

67
3.12.6 Statistical Regression
There is a tendency for extreme scores to regress towards the mean between pre-test and
post-test (Campbell & Stanley, 1963). For example, participants who scored very low in the pre-
test may show an improved score on a post-test; however, participants who scored very high in
the pre-test may show a decreased score on a post-test. A randomized assignment was necessary
for this matter, to ensure participants were not grouped on the basis of extreme scores.
3.12.7 Mortality
When a participant drops out from a study, the sample size may be reduced, and the
number of participants may be unbalanced between the control group and treatment group
(Christensen et al., 2015). All subjects had the right to drop out from this study at any point of
time, as they were voluntarily participating in the study. On the researcher’s side, there were
several ways to minimize the threat of mortality. First, the experiment was conducted on the
subjects’ best available times, to reduce the potential for participants to drop out, due to other
duties at the same time. Second, the experiment was completed within a reasonable timeframe.
3.12.8 Selection-Maturation Interaction
In some instances, there can be an interaction between maturation and selection
(Campbell & Stanley, 1963). The selection bias may cause specific groups to be different from
another, and participants in these groups may be different in maturation. The interaction between
the two may cause additional problems.
In this study, this interaction was minimized through the pre-test post-test control group
design, the randomized selection, as well as a short overall time span of the experiment.

68
3.12.9 Reactive or Interaction Effect of Testing
A pre-test may influence the subjects’ sensitivity to the dependent variable (Campbell &
Stanley, 1963). The interaction of testing and the treatment may affect the final results of the
treatment group. For example, participants who completed the pre-test may be more sensitive to
the treatment, and may perform better in the post-test as a result. This result may not be
generalizable to the population.
For this research, all participants were asked to complete the same pre-test. The pre-test
was similar to what certified flight instructors accomplish in real life: observe student behaviors,
assess student performance, and provide useful critique. Moreover, all participants completed
both the pre-test and the post-test.
3.12.10 Interaction of Selection Bias and Experimental Variable
Due to the interaction of selection bias and the experimental variable, there is a
possibility that the treatment effect could not be generalized to the larger population (Campbell
& Stanley, 1963). For this study, a randomized assignment was conducted. In addition, all
participants who volunteered in this study were part of a larger population.
3.12.11 Reactive Effects of Experimental Arrangements
For this study, subjects were aware that they were participating in research experiments.
The experimental arrangements may affect the outcome of the pre-test and post-test (Campbell &
Stanley, 1963). Researchers tried to simulate the grading process utilized in real-world situations.
3.12.12 Multiple Treatment Interference
When multiple treatments are being applied to the same subjects, multiple-treatment
interference may occur (Campbell & Stanley, 1963). There was only one treatment in the design

69
of this study. Researchers also ensured that the participants did not accidentally receive
additional treatments.
3.12.13 Reducing Participant Crosstalk
Edlund et al. (2009) conducted three experiments to identify and eliminate participant
crosstalk in research studies. The first experiment showed that there was 2.8% confirmed
crosstalk among the 809 participants (Edlund et al., 2009). The second experiment included a
classroom treatment, as textbooks were modified to ask participants not to talk to other people
about what happened in the laboratory. Also, this was reinforced by instructors throughout the
semester. This treatment reduced the crosstalk to less than 1%; only 6 of the 631 students
showed confirmed crosstalk. The third experiment further added an in-lab treatment. Participants
were asked not to disclose any information regarding the experiment, and a verbal commitment
was obtained from each participant. Only one (0.08%) of the nearly 1,250 participants showed
clear evidence of cross-talk (Edlund et al., 2009). Results showed that a classroom treatment
reminding students of the importance of non-disclosure, as well as an in-lab treatment asking
students not to disclose any information, could eliminate the chance of crosstalk.
Several methods were used to reduce the chances of cross-talk among participants in this
study. First, participants were not allowed to talk with each other during the pre-test and post-test.
Second, participants were asked to sit as far apart as possible while doing the pre-test and post-
test. Third, participants were asked not to discuss the video scenarios to anyone outside of the
experiment.

70
3.13 Summary
This chapter described the methodology for this study. The research design, hypotheses,
sampling approach, statistical error, grading scale, scenario events, experiment procedures,
workshop design, variables, data analysis, and threats to internal and external validity were
discussed.

71
RESULTS
This study was designed to determine the effects of a training workshop on inter-rater
agreement (IRA) and referent-rater agreement (RRA). Demographic information and statistical
analysis will be discussed in the current chapter.
4.1 Demographic Information
After the recruitment process, a total of 31 candidates indicated interest in participation,
and 29 participants showed up for the experiment sessions. To accommodate the participants’
availability, two identical but independent sessions were held on different dates for the
participants to select, and the participants could only enroll in one of the two dates. In the first
experiment session, there were a total of 20 participants. In the second experiment session, there
were a total of 9 participants. All of the 29 participants completed the entire experiment. Within
each session, participants were asked about their total hours of flight instruction and were then
randomly-assigned into the control group or the treatment group based on a ratio of 1:2. Table
4.1 shows the participants’ total flight hours, Table 4.2 lists the participants’ flight instructor
background information, and Table 4.3 illustrates the participants’ Phenom 100 course
completion status.

72
Table 4.1 Participants' Flight Hours
Variables Control Group
Frequencies
Treatment
Group
Frequencies
Total Flight Hours
≤ 200 1 1
200-399 4 5
400-599 2 7
600-799 2 3
800-999 0 3
≥ 1000 0 1
Total Hours as Flight Instructor
≤ 49 3 4
50-99 1 3
100-199 1 2
200-499 4 7
500-999 0 4
Total Hours in a Flight Simulator
≤ 49 1 0
50-99 6 11
100-149 2 8
≥ 150 0 1
Total Hours in the Phenom 100 Aircraft
0 2 1
1-6 3 8
7-15 0 7
>15 4 4
Total (n) 9 20

73
Table 4.2 Flight Instructor Information
Variables Control Group
Frequencies
Treatment
Group
Frequencies
Initial CFI Checkride Year
2015 0 1
2016 1 5
2017 5 11
2018 3 3
Types of CFI Certificates
CFI only 7 14
CFI and CFI-I 2 5
CFI, CFI-I and MEI 1
Experience Teaching in a Flight
Simulator
Yes 6 14
No 3 6
Total (n) 9 20

74
Table 4.3 Phenom 100 Course Completion
Variables Control Group
Frequencies
Treatment
Group
Frequencies
AT395 (Phenom 100 Sim Course) Status
Completed in Summer 2017 or before 4 13
Completed in Fall 2017 2 6
Enrolled in Spring 2018 3 1
AT396 (Phenom 100 Flight Course)
Status
Completed in Summer 2017 or before 2 6
Completed in Fall 2017 2 8
Enrolled in Spring 2018 2 5
Did Not Take 3 1
Total (n) 9 20
4.2 Emergency Evacuation Scenario
There was a large variation of scores on the post-test emergency evacuation scenario for
all participants in the control group and the treatment group. The problem with this specific
scenario event created an impact on the IRA and RRA analysis between and within the two
groups. As a result, a separate analysis was conducted, to exclude the emergency evacuation
scenario (five scenarios), in addition to the set including this scenario (six scenarios).
Several factors may have contributed to the large variation in scoring. First, Purdue
University operates the Embraer Phenom 100 with two pilots (Purdue University, 2016) in spite
of the fact that the jet is designed as a single-pilot aircraft (McClellan, 2009). The Phenom 100
emergency evacuation Quick Reference Handbook (QRH) checklist states that calling Air
Traffic Control (ATC) is the third from last item to do, after the engine shutdown procedures.
However, the QRH is designed by the aircraft manufacturer for single-pilot operations. Purdue

75
University operates the Phenom 100 within a multi-crew environment, and the Standard
Operating Procedures (SOP) clearly states that “Just after the Captain calls for the emergency
evacuation, the First Officer (F/O) may notify ATC. The order is maintained here in case of
single pilot operation” (Purdue University, 2016, p. 80). However, even though the Emergency
Evacuation SOP extract was given to the participants during the experiment, most participants
were unaware of this paragraph in the SOP. During the training workshop, the delegation of
“Calling ATC” task to the F/O was not emphasized.
Secondly, the emergency evacuation was conducted in the hypothetical scenario that both
engines were on fire simultaneously. The pilots in the scenario decided to evacuate immediately.
On the Phenom 100, there is only one fire extinguishing bottle for two engines. The engine fire
extinguishing bottle is only able to discharge into one engine, even if both engines are on fire. In
addition to the standard emergency evacuation QRH items, the crew in the scenario decided to
discharge the fire extinguishing bottle as per the SOP and ordered evacuation to the left side only.
Some participants considered it unacceptable to conduct this action because the emergency
evacuation QRH did not specify this task.
For the reasons stated above, two separate sets of analyses were conducted and reported.
One set of analyses included Steep Turns, Approaches to Stalls and Stall Recovery, Precision
Approaches - Hand Flown, Landing from a Precision Approach, Powerplant Failure during
Takeoff, and Emergency Procedures - Emergency Evacuation, namely the “Six Video Scenarios
Analysis”; the other set of analyses included Steep Turns, Approaches to Stalls and Stall
Recovery, Precision Approaches - Hand Flown, Landing from a Precision Approach, and
Powerplant Failure during Takeoff, namely the “Five Video Scenarios Analysis”.

76
4.3 Descriptive Statistics of the Scenario Scores
Table 4.4 illustrates the mean, median, standard deviation, minimum and maximum
scores given by the participants in the control group during pre-test. The referent standard scores
are also listed for comparison.
Table 4.4 Descriptive Statistics for Pre-test Control Group
Mean Median
Standard
Deviation Minimum Maximum
Referent
Score
Scenario 1 3.11 3 0.33 3 4 3
Scenario 2 2.33 2 0.5 2 3 2
Scenario 3 2 2 0.87 1 3 2
Scenario 4 3.11 3 0.78 2 4 3
Scenario 5 3.22 3 0.67 2 4 4
Scenario 6 1.11 1 0.33 1 2 1
Table 4.5 illustrates the mean, median, standard deviation, minimum and maximum
scores given by the participants in the treatment group during pre-test. The referent standard
scores are also listed for comparison.
Table 4.5 Descriptive Statistics for Pre-test Treatment Group
Mean Median
Standard
Deviation Minimum Maximum
Referent
Score
Scenario 1 3.15 3 0.37 3 4 3
Scenario 2 2.65 3 0.75 1 4 2
Scenario 3 2.1 2 0.64 1 3 2
Scenario 4 3.1 3 0.64 2 4 3
Scenario 5 3.3 3 0.73 2 4 4
Scenario 6 1.25 1 0.44 1 2 1

77
Table 4.6 illustrates the mean, median, standard deviation, minimum and maximum
scores given by the participants in the control group during post-test. The referent standard
scores are also listed for comparison.
Table 4.6 Descriptive Statistics for Post-test Control Group
Mean Median
Standard
Deviation Minimum Maximum
Referent
Score
Scenario 1 1.89 2 0.78 1 3 2
Scenario 2 1.33 1 0.71 1 3 1
Scenario 3 3.33 3 0.71 2 4 3
Scenario 4 2.22 2 0.67 1 3 2
Scenario 5 2.78 3 0.67 2 4 3
Scenario 6 2.56 3 1.13 1 4 4
Table 4.7 illustrates the mean, median, standard deviation, minimum and maximum
scores given by the participants in the treatment group during post-test. The referent standard
scores are also listed for comparison.

78
Table 4.7 Descriptive Statistics for Post-test Treatment Group
Mean Median
Standard
Deviation Minimum Maximum
Referent
Score
Scenario 1 2 2 0 2 2 2
Scenario 2 1.05 1 0.22 1 2 1
Scenario 3 3.4 3 0.60 2 4 3
Scenario 4 2.05 2 0.51 1 3 2
Scenario 5 2.9 3 0.79 1 4 3
Scenario 6 3.1 3.5 1.07 1 4 4
4.4 Analysis of Inter-Rater Agreement
4.4.1 For Five Video Scenarios
For this set of analyses, only the pre-test and post-test data for Steep Turns, Approaches
to Stalls and Stall Recovery, Precision Approaches - Hand Flown, Landing from a Precision
Approach, and Powerplant Failure during Takeoff were included. The percentage of agreement
among the raters is reported in Table 4.8.
Table 4.8 Percentage of Agreement for Five Scenarios
Pre-test Post-test
Control Group 43.33% 38.33%
Treatment Group 45.37% 65.05%
To analyze the chance-corrected coefficient of IRA, the Fleiss’ Kappa was utilized. A
higher Fleiss’ Kappa value indicates a higher level of agreement, with a maximum Kappa value
of 1.0. The Kappa values are reported in Table 4.9.
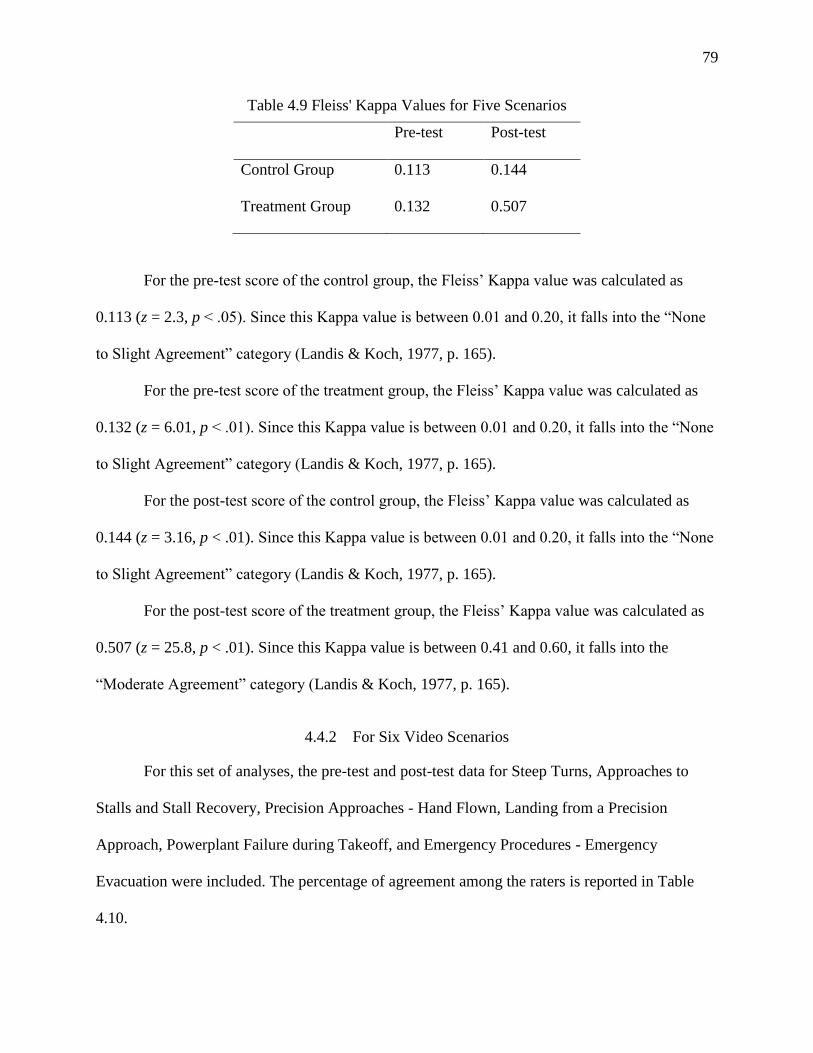
79
Table 4.9 Fleiss' Kappa Values for Five Scenarios
Pre-test Post-test
Control Group 0.113 0.144
Treatment Group 0.132 0.507
For the pre-test score of the control group, the Fleiss’ Kappa value was calculated as
0.113 (z = 2.3, p < .05). Since this Kappa value is between 0.01 and 0.20, it falls into the “None
to Slight Agreement” category (Landis & Koch, 1977, p. 165).
For the pre-test score of the treatment group, the Fleiss’ Kappa value was calculated as
0.132 (z = 6.01, p < .01). Since this Kappa value is between 0.01 and 0.20, it falls into the “None
to Slight Agreement” category (Landis & Koch, 1977, p. 165).
For the post-test score of the control group, the Fleiss’ Kappa value was calculated as
0.144 (z = 3.16, p < .01). Since this Kappa value is between 0.01 and 0.20, it falls into the “None
to Slight Agreement” category (Landis & Koch, 1977, p. 165).
For the post-test score of the treatment group, the Fleiss’ Kappa value was calculated as
0.507 (z = 25.8, p < .01). Since this Kappa value is between 0.41 and 0.60, it falls into the
“Moderate Agreement” category (Landis & Koch, 1977, p. 165).
4.4.2 For Six Video Scenarios
For this set of analyses, the pre-test and post-test data for Steep Turns, Approaches to
Stalls and Stall Recovery, Precision Approaches - Hand Flown, Landing from a Precision
Approach, Powerplant Failure during Takeoff, and Emergency Procedures - Emergency
Evacuation were included. The percentage of agreement among the raters is reported in Table
4.10.

80
Table 4.10 Percentage of Agreement for Six Scenarios
Pre-test Post-test
Control Group 49.07% 34.72%
Treatment Group 47.89% 59.30%
To test inter-rater agreement, the Fleiss’ Kappa was utilized. A higher Fleiss’ Kappa
value indicates a higher level of agreement, with a maximum Kappa value of 1.0. The Kappa
values are reported in Table 4.11.
Table 4.11 Fleiss' Kappa Values for Six Scenarios
Pre-test Post-test
Control Group 0.275 0.101
Treatment Group 0.255 0.441
For the pre-test score of the control group, the Fleiss’ Kappa value was calculated as
0.275 (z = 6.64, p < .01). Since this Kappa value is between 0.21 and 0.40, it falls into the “Fair
Agreement” category (Landis & Koch, 1977, p. 165).
For the pre-test score of the treatment group, the Fleiss’ Kappa value was calculated as
0.255 (z = 14.2, p < .01). Since this Kappa value is between 0.21 and 0.40, it falls into the “Fair
Agreement” category (Landis & Koch, 1977, p. 165).
For the post-test score of the control group, the Fleiss’ Kappa value was calculated as
0.101 (z = 2.48, p < .02). Since this Kappa value is between 0.01 and 0.20, it falls into the “None
to Slight Agreement” category (Landis & Koch, 1977, p. 165).

81
For the post-test score of the treatment group, the Fleiss’ Kappa value was calculated as
0.441 (z = 25.2, p < .01). Since this Kappa value is between 0.41 and 0.60, it falls into the
“Moderate Agreement” category (Landis & Koch, 1977, p. 165).
4.5 Analysis of Referent-Rater Agreement
4.5.1 For Five Video Scenarios
For this set of analyses, only the pre-test and post-test data for Steep Turns, Approaches
to Stalls and Stall Recovery, Precision Approaches - Hand Flown, Landing from a Precision
Approach, and Powerplant Failure during Takeoff were included. The percentage of agreement
compared to the referent score is reported in Table 4.12.
Table 4.12 Percentage of Agreement Compared to the Referent Score for Five Scenarios
Pre-test Post-test
Control Group 53.33% 55.56%
Treatment Group 57% 75%
The mean absolute deviation (MAD) from the referent score is reported in Table 4.13.
Table 4.13 Mean Absolute Deviation From the Referent Score for Five Scenarios
Pre-test Post-test
Control Group 0.49 0.47
Treatment Group 0.48 0.26
For RRA, the MAD was calculated and used for comparison. Each grade given by the
participants was transformed into an absolute deviation value from the gold standard score, and
82
the MAD value was calculated for each participant. These values were then compared for
statistical significance.
Two bar charts are included in Appendix I, to illustrate and compare the differences of
the MAD for each participant from pre-test to post-test. For the control group, two of the nine
participants showed zero change in MAD from pre-test to post-test. Four of the control group
participants showed a decrease in MAD from pre-test to post-test; while three of the participants
showed an increase in MAD from pre-test to post-test. Control group participant #9 had the
greatest decrease in MAD, from 0.80 to 0, while control group participant #4 had the greatest
increase in MAD, from 0 to 0.40.
For the treatment group, three of the twenty participants showed no change in MAD from
pre-test to post-test. Fourteen of the participants showed a decrease in MAD from pre-test to
post-test; while only three of the participants showed an increase in MAD from pre-test to post-
test. Treatment group participant #14 had the greatest decrease in MAD, from 1.00 to 0.20, while
treatment group participant #5 had the greatest increase in MAD, from 0.40 to 0.60.
Before conducting an independent samples t-test, there are several assumptions that must
be met (Laerd Statistics, 2018a). First, the data from each participant (observations) must be
independent from each other. Independent observation is ensured by the design of this study. The
participants completed their grading independently, without interaction with other participants.
Second, the data must be at least interval scale or higher (Laerd Statistics, 2018a). The
MAD value is considered as interval scale, as the distance between the MAD values is consistent.
Therefore, this assumption was met.
Third, an independent samples t-test requires the random sample to come from a normal
distribution (Laerd Statistics, 2018a). Normality can be tested through the Shapiro-Wilk test. If

83
results of the Shapiro-Wilk test are not significant (p > .05), the data are believed to meet the
normality assumption. After completion of the Shapiro-Wilk test, for the control group pre-test,
W(9) = 0.886, p > .05; for the treatment group pre-test, W(20) = 0.935, p > .05; for the control
group post-test, W(9) = 0.883, p > .05; and for the treatment group post-test, W(20) = 0.879,
p < .05. All but the treatment group post-test met this assumption. However, the t-test is
relatively robust to non-normal situations. The t-test results were reported, along with the non-
parametric test results.
Finally, Levene’s test was conducted to determine the Homogeneity of Variance (Laerd
Statistics, 2018a). If the results of Levene’s test are not significant (p > .05), the data are believed
to meet the Homogeneity of Variance Assumption. The results showed that for the pre-test, F(1,
27) = 0.245, p > .05; for the post-test, F(1, 27) = 0.005, p > .05. Both the pre-test and post-test
met the assumption of Homogeneity of Variance.
The independent samples t-test showed that there was no significant difference for the
pre-test MAD between the control group (M = 0.4889) and the treatment group (M = 0.48), t(27)
= 0.078, p = .939. There was a very small effect size (d = 0.0307).
For the post-test MAD between the control group (M = 0.4667) and the treatment group
(M = 0.26), there was a significant difference between the two, t(27) = 2.519, p = .018. There
was a large effect size (d = 0.9836).
To compare the differences between the two groups during the pre-test and during the
post-test, a non-parametric test was also used. The Mann-Whitney U test can be used as a non-
parametric test equivalent to the independent samples t-test (Mendonca, 2017).
There are four assumptions for the Mann-Whitney U test (Laerd Statistics, 2018b). First,
the dependent variable must be on a continuous or ordinal level. Second, the independent
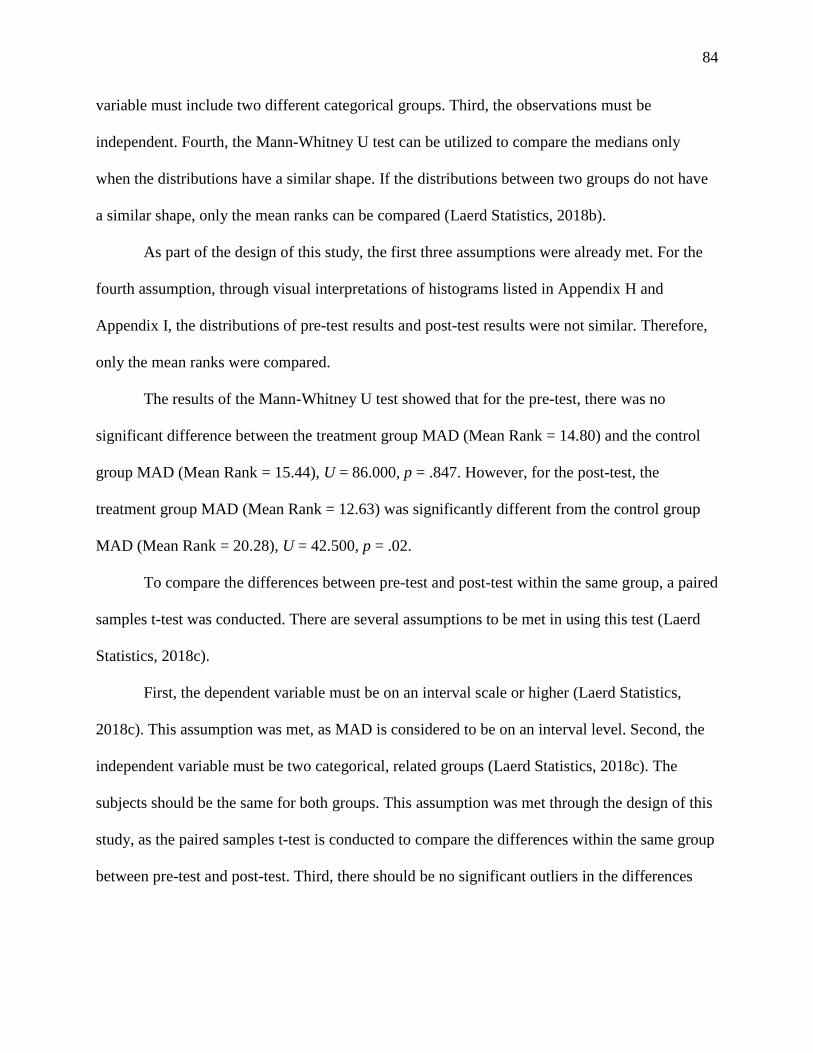
84
variable must include two different categorical groups. Third, the observations must be
independent. Fourth, the Mann-Whitney U test can be utilized to compare the medians only
when the distributions have a similar shape. If the distributions between two groups do not have
a similar shape, only the mean ranks can be compared (Laerd Statistics, 2018b).
As part of the design of this study, the first three assumptions were already met. For the
fourth assumption, through visual interpretations of histograms listed in Appendix H and
Appendix I, the distributions of pre-test results and post-test results were not similar. Therefore,
only the mean ranks were compared.
The results of the Mann-Whitney U test showed that for the pre-test, there was no
significant difference between the treatment group MAD (Mean Rank = 14.80) and the control
group MAD (Mean Rank = 15.44), U = 86.000, p = .847. However, for the post-test, the
treatment group MAD (Mean Rank = 12.63) was significantly different from the control group
MAD (Mean Rank = 20.28), U = 42.500, p = .02.
To compare the differences between pre-test and post-test within the same group, a paired
samples t-test was conducted. There are several assumptions to be met in using this test (Laerd
Statistics, 2018c).
First, the dependent variable must be on an interval scale or higher (Laerd Statistics,
2018c). This assumption was met, as MAD is considered to be on an interval level. Second, the
independent variable must be two categorical, related groups (Laerd Statistics, 2018c). The
subjects should be the same for both groups. This assumption was met through the design of this
study, as the paired samples t-test is conducted to compare the differences within the same group
between pre-test and post-test. Third, there should be no significant outliers in the differences

85
(Laerd Statistics, 2018c). According to a visual inspection of the boxplots in Appendix I, there
were no significant outliers in the data.
Lastly, the differences between the groups must be approximately normally-distributed
(Laerd Statistics, 2018c). For the control group, the differences between pre-test and post-test
MADs were approximately normally-distributed through the Shapiro-Wilk test, W(9) = 0.959,
p > .05; For the treatment group, the differences between pre-test and post-test MADs were also
approximately normally-distributed, W(20) = 0.923, p > .05. As a result, this assumption was
met.
The execution of a paired samples t-test showed that, for the control group, there was no
significant difference between the pre-test MAD (M = 0.4889) and post-test MAD (M = 0.4667),
t(8) = 0.151, p = .884. In comparison, for the treatment group, there was a significant difference
between the pre-test MAD (M = 0.48) and post-test MAD (M = 0.26), t(19) = 3.488, p = .002.
The Wilcoxon Signed Rank Test, along with the Sign Test, is considered to be the non-
parametric version of the paired samples t-test (Mendonca, 2017). There are three assumptions
for the Wilcoxon Signed Rank Test. First, the data should be at least ordinal or higher. Second,
the independent variable should be two categorical and related groups. These two assumptions
have already been met. Third, there should be a symmetrical distribution of the differences
between the two groups (Laerd Statistics, 2018d).
Through a visual inspection of the boxplots in Appendix I, only the treatment group had
approximately symmetrical distribution. Therefore, the Wilcoxon Signed Rank Test was
conducted for the treatment group only. Results showed that there was a significant difference
between the post-test treatment group MAD and pre-test treatment group MAD (z = -2.861, p
= .004).

86
A Sign Test was conducted to compare the differences before and after the workshop
within both control group and treatment group. There are a total of four assumptions that must be
met before conducting the Sign Test (Laerd Statistics, 2018e). First, the dependent variable must
be on an ordinal or higher level. Second, the independent variable should consist of two
categorical and related groups. Third, each observation should be independent. Fourth, the
distribution of difference scores should be continuous (Laerd Statistics, 2018e). All four
assumptions were met for this study.
For the control group, there were no significant differences between the pre-test and post-
test (p = 1.000). For the treatment group, there was a statistically-significant difference between
the pre-test and post-test (p = .013). Results showed that the training workshop did create a
statistically-significant reduction of MAD for the treatment group, both between groups and
within groups.
Table 4.14 illustrates the statistical test results, including t-test, Mann-Whitney U test,
Wilcoxon Signed Rank Test and Sign Test.
Table 4.14 Statistical Test Results for Five Scenarios
t-test Mann-
Whitney
U Test
Wilcoxon
Signed Rank
Test
Sign Test
PreCtrl vs PostCtrl p = .884 - - p = 1.000
PreTreat vs PostTreat p = .002 - p = .004 p = .013
PreCtrl vs PreTreat p = .939 p = .847 - -
PostCtrl vs PostTreat p = .018 p = .020 - -
An alternative-form reliability analysis was conducted on the two different versions of
tests (pre-test and post-test), based on the MAD data from the control group. A Pearson product-

87
moment correlation was run to test the relationship between pre-test MADs and post-test MADs.
Results showed r(7) = -.395, which is considered as medium negative correlation (Cohen, 1988),
p = .293.
4.5.2 For Six Video Scenarios
For this set of analyses, the pre-test and post-test data for Steep Turns, Approaches to
Stalls and Stall Recovery, Precision Approaches - Hand Flown, Landing from a Precision
Approach, Powerplant Failure during Takeoff, and Emergency Procedures - Emergency
Evacuation were included. The percentage of agreement, compared to the referent score, is
reported in Table 4.15.
Table 4.15 Percentage of Agreement Compared to the Referent Score for Six Scenarios
Pre-test Post-test
Control Group 59.26% 50%
Treatment Group 60% 70.83%
The MAD from the referent score is reported in Table 4.16.
Table 4.16 Mean Absolute Deviation From the Referent Score for Six Scenarios
Pre-test Post-test
Control Group 0.43 0.63
Treatment Group 0.44 0.37
Two bar charts are included in Appendix K, to illustrate and compare the differences of
the MAD for each participant from pre-test to post-test. For the control group, two of the nine
participants showed zero change from pre-test to post-test. Two of the participants showed a

88
decrease in MAD from pre-test to post-test; five of the participants showed an increase in MAD
from pre-test to post-test. Control group participant #9 had the greatest decrease in MAD from
0.67 to 0.17, while control group participant #4 had the greatest increase in MAD from 0 to 0.83.
For the treatment group, eleven of the twenty participants showed a decrease in MAD
from pre-test to post-test; nine of the participants showed an increase in MAD from pre-test to
post-test. Treatment group participant #17 had the greatest decrease in MAD, from 0.83 to 0.30,
while treatment group participant #18 had the greatest increase in MAD, from 0 to 0.62.
Before conducting the independent samples t-test, there are several assumptions that must
be met (Laerd Statistics, 2018a). Similar to the 5 video scenarios analysis, the independent
assumption, as well as the interval scale assumption, was met.
In order to test the normality assumption, the Shapiro-Wilk test was conducted (Laerd
Statistics, 2018a). Results showed that for the control group pre-test, W(9) = 0.899, p > .05; for
the treatment group pre-test, W(20) = 0.917, p > .05; for the control group post-test, W(9) =
0.951, p > .05; for the treatment group post-test, W(20) = 0.919, p > .05. The normality
assumption was met.
Lastly, the Levene’s test was conducted to determine the Homogeneity of Variance
assumption (Laerd Statistics, 2018a). The results showed that for the pre-test, F(1, 27) = 0.035,
p > .05; for the post-test, F(1, 27) = 0.121, p > .05. Both the pre-test and post-test data met this
assumption.
The independent samples t-test showed that there was no significant difference for the
pre-test MAD between the control group (M = 0.4259) and the treatment group (M = 0.4417),
t(27) = -0.159, p = .874. There was a very small effect size (d = 0.0649).

89
For the post-test MAD between the control group (M = 0.6296) and the treatment group
(M = 0.3667), there was a significant difference between the two, t(27) = 2.538, p = .017. The
effect size (d = 1.0157) was large.
To compare the differences between the two groups during the pre-test and during the
post-test, the Mann-Whitney U test was conducted. As part of the design of this study, the first
three assumptions (ordinal level or higher, two groups, independent observations) for the Mann-
Whitney U test (Laerd Statistics, 2018b) were met. For the fourth assumption (similar-shaped
distributions), through visual interpretations of histograms in Appendix J and Appendix K, the
distributions of pre-test results and post-test results were judged to be not similar. Therefore,
only the mean ranks were compared, and the median ranks were not compared.
The results of the Mann-Whitney U test showed that for the pre-test, there was no
significant difference between the treatment group MAD (Mean Rank = 15.05) and the control
group MAD (Mean Rank = 14.89), U = 89.000, p = .961. However, for the post-test, the
treatment group MAD (Mean Rank = 12.58) was significantly different from the control group
MAD (Mean Rank = 20.39), U = 41.500, p = .02.
To compare the differences between pre-test and post-test within the same group, a paired
samples t-test was conducted. There are several assumptions to be met before using this test
(Laerd Statistics, 2018c).
First, the dependent variable must be on an interval scale or higher (Laerd Statistics,
2018c). This assumption is met, as MAD is considered to be on an interval level. Second, the
independent variable must be two categorical, related groups (Laerd Statistics, 2018c). The
subjects should be the same for both groups. This assumption was met through the design of this
study, as the paired samples t-test was conducted to compare the differences within the same

90
group between pre-test and post-test. Third, there should be no significant outliers in the
differences (Laerd Statistics, 2018c). According to a visual inspection of the boxplots in
Appendix K, there were no significant outliers in the data.
The results of the paired samples t-test showed that, for the control group, there was no
significant difference between the pre-test MAD (M = 0.4259) and post-test MAD (M = 0.6296),
t(8) = -1.301, p = .230. For the treatment group, there was also no significant difference between
the pre-test MAD (M = 0.4417) and post-test MAD (M = 0.3667), t(19) = 0.975, p = .342.
The Wilcoxon Signed Rank Test and the Sign Test are considered to be the non-
parametric version of the paired samples t-test (Mendonca, 2017). In order to conduct the
Wilcoxon Signed Rank Test, first, the data should be at least ordinal or higher. Second, the
independent variable should be two categorical and related groups. These two assumptions were
met. Third, there should be a symmetrical distribution of the differences between the two groups
(Laerd Statistics, 2018d).
Through a visual inspection of the boxplots in Appendix K, both groups did not have a
symmetrical distribution. A Wilcoxon Signed Rank Test could not be conducted, because the
differences were not approximately symmetrical for either the control group or the treatment
group.
The Sign Test was conducted to compare the differences before and after the workshop
for both control group and treatment group. There are four assumptions for the Sign Test (Laerd
Statistics, 2018e). First, the dependent variable must be on an ordinal or higher level. Second, the
independent variable must include two categorical and related groups. Third, each observation
should be independent. Fourth, the distribution of the difference scores must be continuous
(Laerd Statistics, 2018e). All four assumptions were met for this study.

91
The researcher conducted a Sign Test to compare the differences before and after the
workshop, for both the control group and the treatment group. For the control group, there was
no significant difference between the pre-test and post-test (p = .453). For the treatment group,
there was also no significant difference between the pre-test and post-test (p = .238).
Table 4.17 illustrates the statistical test results, including t-test, Mann-Whitney U test,
Wilcoxon Signed Rank Test and Sign Test.
Table 4.17 Statistical Test Results for Six Scenarios
t-test Mann-
Whitney
U Test
Wilcoxon
Signed Rank
Test
Sign Test
PreCtrl vs PostCtrl p = .230 - - p = .453
PreTreat vs PostTreat p = .342 - - p = .238
PreCtrl vs PreTreat p = .874 p = .961 - -
PostCtrl vs PostTreat p = .017 p = .020 - -
An alternative forms reliability analysis was conducted on the two different versions of
the tests (pre-test and post-test), based on the MAD data from the control group. A Pearson
product-moment correlation was run to test the relationship between pre-test MADs and post-test
MADs. Results showed r(7) = -.780, which is considered as large negative correlation (Cohen,
1988), p = .013.
4.6 Summary
Chapter 4 presented the results of this study. The demographics information and the
analyses for both inter-rater and referent-rater agreement were discussed.

92
CONCLUSIONS AND RECOMMENDATIONS
5.1 Summary of the Study
This study aimed to improve inter-rater and referent-rater agreement of pilot performance
evaluation conducted by instructors and evaluators (i.e., raters). An interactive training workshop
was developed, with focus on Behavioral-Observation Training, Performance-Dimension
Training, and Frame-of-Reference Training.
The pre-test and post-test included the following pre-scripted video scenarios: Steep Turn,
Approach to Landing Stall, Precision Approach, Landing from a Precision Approach, Engine
Failure After Takeoff, and Emergency Evacuation. One set of six video scenarios was created for
pre-test, and a different set of six video scenarios was created for post-test. Each video script was
designed based on a gold standard score (referent score). The video scripts were brainstormed,
developed, and validated by a board of SMEs using the Delphi Method. Researchers completed
the videotaping process on an Embraer Phenom 100 Flight Training Device (FTD), based on the
script.
An Institutional Review Board (IRB) approval was obtained through Purdue University’s
Human Research Protection Program (HRPP), under the expedited category. Participants were
then recruited using several methods, including emails, classroom visits, and campus posters. To
better facilitate the participants’ schedule, two identical experiment sessions were conducted. A
total of 31 participants signed up for the experiment. In the first session, there were 20
participants. In the second session, there were nine participants. As a result, there were 29
participants who completed the entire experiment.
Participants were randomly-assigned into two groups, within their blocks of similar
instructional experience. All participants completed a background survey, followed by the pre-

93
test. Participants watched and graded a total of six video scenarios during the pre-test on their
individual PC stations. After completing the pre-test, all participants were given a 10-minute
break. Participants in the control group then completed the post-test. Participants in the treatment
group went through the interactive training workshop in a separate classroom, followed by
another 10-minute break. During the post-test, all participants watched and graded a different set
of 6 video scenarios on their individual PC stations. After completion of the post-test, the
experiment ended, and all participants were given gift cards for their participation.
The data were de-identified and analyzed. Due to issues with the post-test Emergency
Evacuation video scenario, two independent sets of analyses were conducted. One set of analyses
included Steep Turns, Approaches to Stalls and Stall Recovery, Precision Approaches - Hand
Flown, Landing from a Precision Approach, Powerplant Failure during Takeoff, and Emergency
Procedures - Emergency Evacuation, namely the “Six Video Scenarios Analysis”; the other set
of analyses included Steep Turns, Approaches to Stalls and Stall Recovery, Precision
Approaches - Hand Flown, Landing from a Precision Approach, and Powerplant Failure during
Takeoff, namely the “Five Video Scenarios Analysis”.
First, the descriptive statistic was presented for each scenario and for each group. An
analysis of inter-rater and referent-rater agreement was conducted. For inter-rater agreement
(IRA), the percentage of agreement was presented. The Fleiss’ Kappa statistic was used and
benchmarked with the matrix defined by Landis and Koch (1977). For referent-rater agreement
(RRA), the percentage of agreement between the raters and the referent score was reported. The
mean absolute deviation (MAD) from the standard score was calculated, and the result was
compared for statistical significance between and within groups by parametric and non-
parametric tests. IBM SPSS 24 Statistics 24, R: A Language and Environment for Statistical
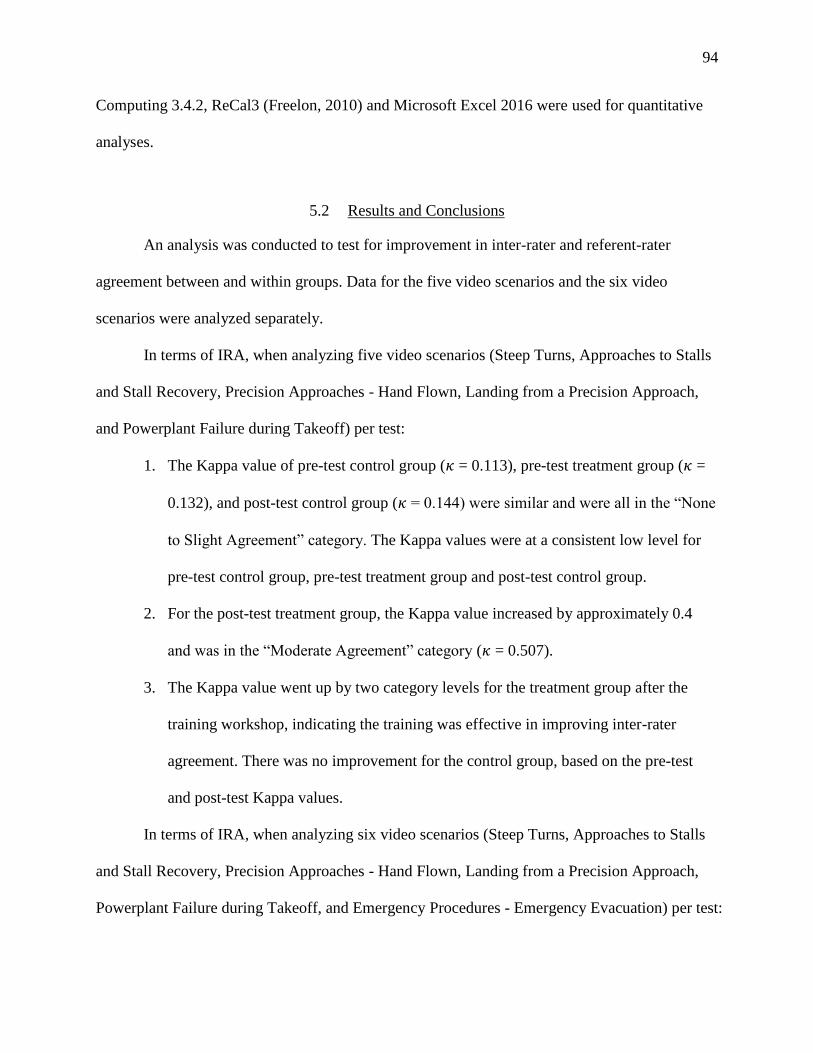
94
Computing 3.4.2, ReCal3 (Freelon, 2010) and Microsoft Excel 2016 were used for quantitative
analyses.
5.2 Results and Conclusions
An analysis was conducted to test for improvement in inter-rater and referent-rater
agreement between and within groups. Data for the five video scenarios and the six video
scenarios were analyzed separately.
In terms of IRA, when analyzing five video scenarios (Steep Turns, Approaches to Stalls
and Stall Recovery, Precision Approaches - Hand Flown, Landing from a Precision Approach,
and Powerplant Failure during Takeoff) per test:
1. The Kappa value of pre-test control group (𝜅 = 0.113), pre-test treatment group (𝜅 =
0.132), and post-test control group (𝜅 = 0.144) were similar and were all in the “None
to Slight Agreement” category. The Kappa values were at a consistent low level for
pre-test control group, pre-test treatment group and post-test control group.
2. For the post-test treatment group, the Kappa value increased by approximately 0.4
and was in the “Moderate Agreement” category (𝜅 = 0.507).
3. The Kappa value went up by two category levels for the treatment group after the
training workshop, indicating the training was effective in improving inter-rater
agreement. There was no improvement for the control group, based on the pre-test
and post-test Kappa values.
In terms of IRA, when analyzing six video scenarios (Steep Turns, Approaches to Stalls
and Stall Recovery, Precision Approaches - Hand Flown, Landing from a Precision Approach,
Powerplant Failure during Takeoff, and Emergency Procedures - Emergency Evacuation) per test:

95
1. Both the pre-test control group (𝜅 = 0.275) and pre-test treatment group (𝜅 = 0.255)
had a similar Kappa value and were in the “Fair Agreement” category. The Kappa
values were consistent across the pre-test control group and pre-test treatment group.
2. Due to the disruption of the sixth video scenario, the post-test control group Kappa
value went down one category level (𝜅 = 0.101) and was in the “None to Slight
Agreement” category.
3. Despite the disruption, the post-test treatment group’s Kappa value still showed an
improvement (𝜅 = 0.441) and was in the “Moderate Agreement” category.
4. When comparing between groups, the Kappa value for post-test treatment group
moved up two category levels, compared to the post-test control group; when
comparing within groups, the Kappa value for post-test treatment group moved up
one category level, compared to the pre-test treatment group.
5. The results indicated that the training was effective in improving inter-rater
agreement when compared between and within groups.
In terms of RRA, for each video scenario, each person’s absolute deviation from the
standard referent score was calculated and the MAD was analyzed. Parametric and non-
parametric tests were conducted to test for statistical significance.
When analyzing five video scenarios (Steep Turns, Approaches to Stalls and Stall
Recovery, Precision Approaches - Hand Flown, Landing from a Precision Approach, and
Powerplant Failure during Takeoff) per test:
1. There was no significant difference (p > .05) for the MAD between pre-test control
group (M = 0.49) and pre-test treatment group (M = 0.48). This result was determined
using the independent samples t-test and Mann-Whitney U Test.

96
2. The difference for the MAD between post-test control group (M = 0.47) and post-test
treatment group (M = 0.26) was statistically significant (p < .05). This result was
determined using the independent samples t-test and Mann-Whitney U Test. There
was a large effect size of 0.98.
3. There was no significant difference (p > .05) for the MAD between pre-test control
group (M = 0.49) and post-test control group (M = 0.47). This result was determined
using the paired samples t-test and Sign Test.
4. The difference for the MAD between pre-test treatment group (M = 0.48) and post-
test treatment group (M = 0.26) was statistically significant (p < .05). This result was
determined using the paired samples t-test, the Wilcoxon Signed Rank Test and Sign
Test.
When analyzing six video scenarios (Steep Turns, Approaches to Stalls and Stall
Recovery, Precision Approaches - Hand Flown, Landing from a Precision Approach, Powerplant
Failure during Takeoff, and Emergency Procedures - Emergency Evacuation) per test:
1. There was no significant difference (p > .05) for the MAD between the pre-test
control group (M = 0.43) and pre-test treatment group (M = 0.44). This result was
determined using the independent samples t-test and Mann-Whitney U Test.
2. The difference for the MAD between the post-test treatment group (M = 0.37) and
post-test control group (M = 0.63) was statistically significant (p < .05). This result
was determined using the independent samples t-test and Mann-Whitney U Test.
There was a large effect size of 1.02.

97
3. There was no significant difference (p > .05) for the MAD between the pre-test
control group (M = 0.43) and the post-test control group (M = 0.63). This result was
determined using both paired samples t-test and Sign Test.
4. There was no significant difference (p > .05) for the MAD between the pre-test
treatment group (M = 0.44) and the post-test treatment group (M = 0.37). This result
was determined using both the paired samples t-test and Sign Test.
In conclusion, in terms of IRA for both five video scenarios and six video scenarios
analyses, the Fleiss’ Kappa values were at a higher category level after the treatment. Therefore,
there was a significant increase in the level of agreement among different raters after the training.
However, the Fleiss’ Kappa coefficient only reached “Moderate Agreement” level after the
treatment and did not reach “Substantial Agreement” or “Almost Perfect Agreement” level.
In terms of RRA, for five video scenarios per test, the MAD was at a significantly lower
level after the treatment workshop between and within groups. For six video scenarios per test,
the MAD was at a significantly lower level when comparing the post-test control group with the
post-test treatment group. Therefore, after receiving the training, there was a significant increase
in the level of agreement between the raters and the referent standard.
Overall, there was an improvement when comparing the inter-rater and referent-rater
agreement between and within groups after the treatment. This suggests that the utilization of a
focused rater training workshop could significantly affect rater agreement of pilot performance
evaluation conducted by instructors and evaluators (i.e., raters). Participants also expressed
generally positive feedback on the training workshop. See Appendix G for the comments from
participants.

98
5.3 Limitations of the Study
There were several limitations in this study. First, the video scenarios were pre-scripted,
and the participants had a relatively controlled environment when watching the videos. However,
in “real life” situations, instructors may be performing other duties at the same time, such as
acting as ATC or simulator operator. The additional tasks were not considered during this
experiment.
There were six Areas of Operation covered in this experiment, compared to a total of 32
Areas of Operation in the FAA ATP PTS (2008) for airplane multi-engine land. In real training
situations, instructors must evaluate all the items required in the FAA ATP PTS. The additional
events/maneuvers may add complexity to the grading process, as each Area of Operation has its
unique challenges. Additional training may be required for each individual Area of Operation,
and the training workshop may take significantly longer.
One of the other limitations is the aircraft itself. The Embraer Phenom 100 is designed as
a single-pilot aircraft (McClellan, 2009). All the manuals and procedures from Embraer were
designed, based on single-pilot operations. However, Purdue University operates the Phenom
100 under a multi-crew environment (Purdue University, 2016). As a result, the Purdue-specific
SOP was developed, based on a multi-crew environment. Pilots are required to refer to
documents developed from the aircraft manufacturer and the air operator at the same time. Some
confusion existed during the experiment, as seen in the emergency evacuation scenario.
Additional research should be done to examine the impact of utilizing multi-person crews on
aircraft designed to be flown by a single pilot. Furthermore, the grades in this study were only
given to the pilot flying in the left seat. No grades were established for the pilot monitoring in the
right seat.

99
During the experiment, the researcher attempted to assign instructors to two groups,
based on instructional experience. However, due to the unequal number of participants during
the two different sessions, the number of more-experienced instructors and less-experienced
instructors was not evenly-distributed between the two groups. The varied instructional
experience among different instructors remained as one of the limitations for this study.
This study tested only the effect of a one-time training workshop. Due to constraints in
time and resources, there was no subsequent recurrent training or testing. In real flight training
situations, recurrent training may be essential for instructors and evaluators.
5.4 Recommendations for Practice
Rather than only grading a candidate as pass or fail, it is recommended to grade a student,
based on a 4-point scale, to more precisely reflect the candidate’s performance. This grading
process is also promoted by the FAA under AQP, as well as the grading scale used by Transport
Canada for all flight tests. Rater training is essential to standardized training and operations.
Based on the results from this study, it is a recommended practice for airlines and flight training
organizations to conduct rater training workshops. Behavior-Observation Training, Performance-
Dimension Training, as well as Frame-of-Reference Training, are recommended to be included
in the workshop. Through this experiment, Frame-of-Reference Training was found to be the
most engaging and positive element of the workshop.
The findings from this study could apply to several situations. First, the findings in this
research could help FAR Part 121 and Part 135 air carriers to develop or improve their rater
training programs, especially when providing initial training to new instructors and evaluators.
Second, the findings from this research could help collegiate aviation programs develop
or improve their instructor training programs. The evolution of AQP at air carriers has changed

100
the training process for airline pilots. However, most FAR Part 61 and Part 141 pilot training
providers are still following the procedures and practices established decades ago. Currently,
only a few flight schools and colleges have a clearly-defined grading rubric. With the large
turnovers of flight instructors and inadequate training, different instructors may provide scores,
based on different standards, leading to deficiencies in training. It is recommended to conduct
training workshops on student grading for all new and experienced instructors. The findings from
this study could help collegiate programs to develop and revise their own training programs and
scoring standards, thus improving the quality of training.
No matter whether the organization is an air carrier or a flight school, the ultimate goal of
rater training is to improve aviation safety. If instructors are well-trained, the students will
become better and safer pilots. It is vital for instructors to effectively assess the student’s
performance, and thereby help to ensure a safe aviation industry.
Even if some participants may not become evaluators in the future, it is beneficial for all
pilots to assess the performance of other pilots (Mavin, Roth & Dekker, 2012). This research
should be beneficial for all participants involved, as learning about the assessment model and
evaluating a peer’s performance could further reinforce the individual’s learning.
The findings from this study can be used not only for pilot training, but also in other
sectors in aviation, such as cabin crew training. Subjective judgments are usually required in the
fields of sports, medicine, and education. The findings herein may also be helpful and provide
insights for IRA/RRA issues in other industries.

101
5.5 Future Research Recommendations
Even though this research showed a positive influence of the rater training workshop on
inter-rater and referent-rater agreement, additional research is needed, and further studies are
required to reveal the unknown.
IRA and RRA were both investigated in this study. RRA requires a referent score to be
established for each case scenario, which may not be practical during real-world operations. IRA,
on the other hand, does not require a common referent score to be established for the specific
case scenario. During this research, both IRA and RRA showed an improvement after the
training workshop. However, additional research can be done to investigate whether IRA or
RRA is a more-preferred method to evaluate instructors.
This study consisted only of quantitative analysis. Even though participants may give the
exact same score, the reasons behind his/her grading may be completely different (Weber et al.,
2013). Further qualitative research should be conducted to discover the reasons behind each
person’s grading.
During this study, only the pilot flying in the left seat was graded by the participants.
Similarly, the FAA ATP PTS (2008) is based on grading one individual at a time. With the
evolution of flight training and the focus on multi-crew operations, CRM is becoming an
increasingly crucial element of safe flight operations. With this in mind, additional research
should be conducted to test whether it is a better practice to grade the entire crew, or to grade
each pilot individually.
Pilots at FAR Part 121 and Part 135 air carriers are required to conduct recurrent training
within a certain time interval. Instructors will need to go through recurrent training, as well.
Additional research can be conducted to determine the effect of memory lapse and the best
interval for instructor recurrent training.

102
Flying is a dynamic environment, and every decision made by pilots may result in
completely different outcomes. The pre-scripted scenarios utilized in this study could not
represent every scenario that would happen during real-world operations. In some cases, the real-
world situations may be more complex than what was exposed during the study. During these
complex scenarios, it may be more difficult for the instructor to grade the student, especially
when they involve multiple issues with non-technical skills. Future research can be conducted to
study and define the standards for non-technical skills.
In conclusion, this research has shown the positive impact of a rater training workshop on
inter-rater and referent-rater agreement. After the training, there was a significant increase in the
level of agreement among different raters. Similarly, there was a significant increase in the level
of agreement between the raters and the referent standard. The researcher hopes this study will
contribute to the on-going study of inter-rater and referent-rater agreement.

103
APPENDIX A. INSTITUTIONAL REVIEW BOARD APPROVAL LETTER

104
APPENDIX B. INVITATION EMAIL

105
APPENDIX C. CONSENT FORM

106

107

108

109
APPENDIX D. SME QUESTIONNAIRE

110
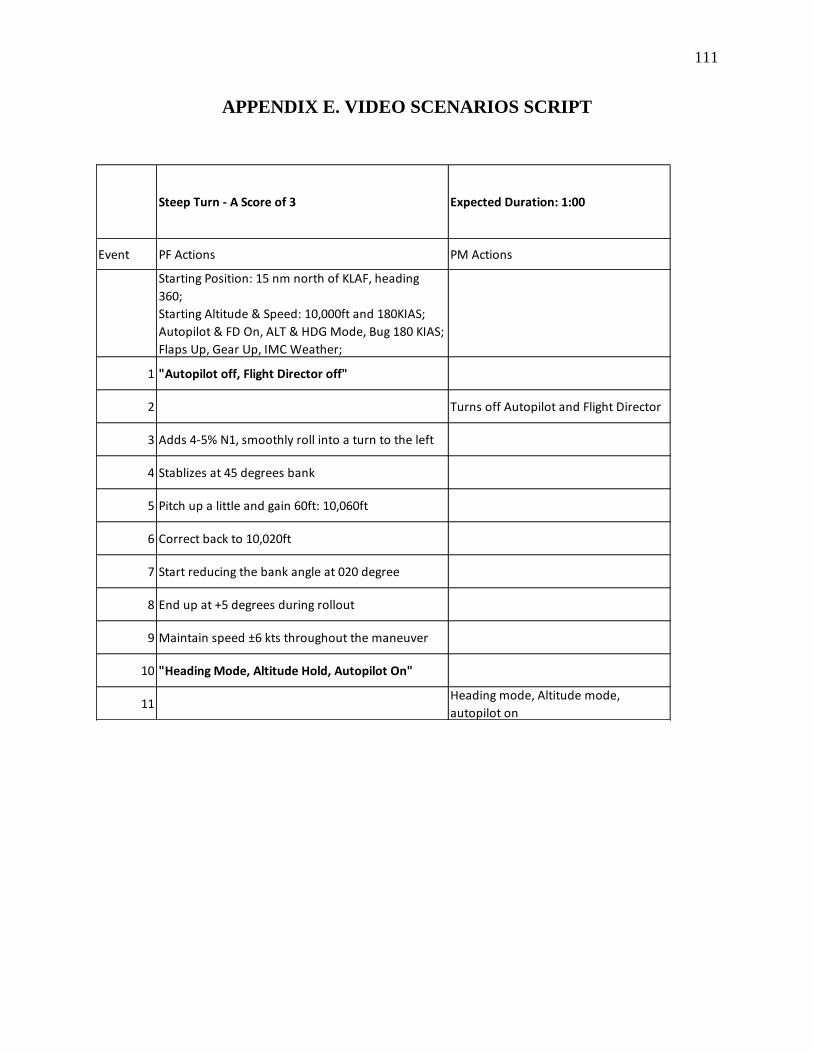
111
APPENDIX E. VIDEO SCENARIOS SCRIPT
Steep Turn - A Score of 3 Expected Duration: 1:00
Event PF Actions PM Actions
Starting Position: 15 nm north of KLAF, heading
360;
Starting Altitude & Speed: 10,000ft and 180KIAS;
Autopilot & FD On, ALT & HDG Mode, Bug 180 KIAS;
Flaps Up, Gear Up, IMC Weather;
1 "Autopilot off, Flight Director off"
2 Turns off Autopilot and Flight Director
3 Adds 4-5% N1, smoothly roll into a turn to the left
4 Stablizes at 45 degrees bank
5 Pitch up a little and gain 60ft: 10,060ft
6 Correct back to 10,020ft
7 Start reducing the bank angle at 020 degree
8 End up at +5 degrees during rollout
9 Maintain speed ±6 kts throughout the maneuver
10 "Heading Mode, Altitude Hold, Autopilot On"
11Heading mode, Altitude mode,
autopilot on

112
Steep Turn - A Score of 2 Expected Duration: 1:00
Event PF Actions PM Actions
Starting Position: 15 nm north of KLAF, heading
360;
Starting Altitude & Speed: 10,000ft and 180KIAS;
Autopilot & FD On, ALT & HDG Mode, Bug 180 KIAS;
Flaps Up, Gear Up, IMC Weather;
1 "Autopilot off, Flight Director off"
2 Turns off Autopilot and Flight Director
3 Adds 4-5% N1, smoothly roll into a turn to the left
4Turns into a 50 degrees bank, then corrected back
to 45 degrees
5 Did not pitch the nose up and lost 140ft: 9,860ft
6 Promptly corrected back to 10,000ft
7 Start reducing the bank angle at 010 degree
8 End up at +8 degrees during rollout
9 Maintain speed ±10 kts throuhout the maneuver
10 "Heading Mode, Altitude Hold, Autopilot On"
11Heading mode, Altitude mode,
Autopilot on

113
Approach to Landing Stall - A score of 2 Expected Duration: 1:30
Event PF Actions PM Actions
Starting Position: 15 nm north of KLAF, heading
360;
Starting Altitude & Speed: 10,000ft and 160KIAS;
Autopilot & FD On, ALT & HDG Mode, Bug 160 KIAS;
Flaps Up, Gear Up, IMC Weather; Power 60%
1 "Flaps 1"
2 "Checks, Flaps 1", Set Flaps 1
3 "Gear Down"
4 Puts gear down
5 "Flaps 3"
6 Set Flaps 3
7 "Flaps Full" Set Flaps Full
8 Set power idle
9 At the "Stall, Stall" aural warning:
10 Pitch the nose down and add power
11 "Flaps 2"
12 (Leaves the flight director on) Sets flaps 2
13Did not pitch down enough, resulting in a new
"Stall, stall" warning, but corrected promptly
14 "Positive Rate"
15 "Gear Up" Selects gear up
16 As the aircraft is accelerating… At 140kts
17 "Would you like Flaps 0?"
18 "Oh yes, Flaps 0"
19 Goes above the original altitude, then correct back
20 "Heading Mode, Alititude Hold, Autopilot On" Turns autopilot on

114
Approach to Landing Stall - A score of 1 Expected Duration: 1:30
Event PF Actions PM Actions
Starting Position: 15 nm north of KLAF, heading
360;
Starting Altitude & Speed: 10,000ft and 160KIAS;
Autopilot & FD On, ALT & HDG Mode, Bug 160 KIAS;
Flaps Up, Gear Up, IMC Weather; Power 60%
1 "Gear Down"
2 Puts gear down
3 "Flaps 1"
4 "Checks, Flaps 1", Set Flaps 1
5 "Flaps Full"
6 Set Flaps Full
7 Set power idle
8 At the "Stall, Stall" aural warning:
9 Add full power but pulled control backwards
10 Enters multiple secondary stalls
11 "Flaps 0"
12 Sets flaps 0
13 Forgets to put gear up
14
15 "Heading Mode, Alititude Hold, Autopilot On" Turns autopilot on

115
ILS - A score of 2 Expected Duration: 2:30
Event PF Actions PM Actions
Start Position: 3 miles from EARLE on ILS10, 2300ft,
Flaps 1, 150KIAS, Hand Flown with Flight Director
"Glideslope Alive"
1 (Does nothing when GS alive)
2 EARLE inbound "EARLE Inbound"
3 "Oh, gear down, flaps 3, bug Vref+5"
4 Did all three items at the same time
5 "Flaps full"
6 Speed fluctuating between Vref and Vref+10
7 Oscillate left and right half a dot back and forth
8 "1000ft above"
9 "Stabilized"
10 "… Landing checklist, set missed approach altitude"Completes checklist, set missed
approach altitude
11 "200 above"
12 "100 above"
13 "Runway insight, landing"

116
ILS - A score of 3 Expected Duration: 2:30
Event PF Actions PM Actions
Start Position: 3 miles from EARLE on ILS10, 2300ft,
Flaps 1, 150KIAS, Hand flown with FD
1 "Glideslope alive, gear down" Sets gear down
2 When gear is down: "Flaps 3, bug Vref+5"
3 When flap is 3: "Flaps full, set missed approach altitude, before landing checklist"
4 Speed fluctuating between Vref and Vref+5
5 Left on course 1/4 dot then corrected, small glideslope deviation 1/2 dot then corrected
6 "1000ft above"
7 "Stabilized"
8 "200 above"
9 "100 above"
10 "Runway insight, landing"

117
Landing from a Precision Approach - Score of 3 Expected Duration: 1:00
Event PF Actions PM Actions
Starting Position: 250' AGL on ILS10@KLAF,
Heading 100, Speed Vref+5;
Autopilot off, FD on, Bug Vref+5;
Flaps Full, Gear Down, VMC Weather
1 "Runway in sight, Landing"
2 Glideslope deviates 1/4 dot
3 PAPI shows 2 white 2 red
4 Maintains Vref+5 above the runway threshold
5Left of centerline, but the centerline remains within
main landing gear width
6 Started flare and touched down at Vref-5
7 Main landing gear touches down first.
8 Land at touch down zone 1000' markers at +200ft
9Applies heavy braking (but evenly) trying to make B
taxiway

118
Landing from a Precision Approach - Score of 2 Expected Duration: 1:00
Event PF Actions PM Actions
Starting Position: 250' AGL on ILS10@KLAF,
Heading 100, Speed Vref+5;
Autopilot off, FD on, Bug Vref+5;
Flaps Full, Gear Down, VMC Weather
1 "Runway in sight, Landing"
2 Stayed high, glideslope deviates 1/2 dot
3 PAPI shows 3 white 1 red, little corrections made for that
4 Maintains Vref above the runway threshold
5The aircraft is left of centerline, and the right gear is
left of the centerline
6 Started flare and touched down at Vref-5
7Main landing gear touches down first at a slightly
harder touch down rate.
8 Land at touch down zone 1000' markers at +500ft
9Used rudder and differential braking to correct
back to centerline
10Oscilatted left and right of centerline due to
inproper brake usage, until below 40kts.

119
Emergency Evacuation - Score of 4 Expected Duration: 1:00
Event PF Actions PM Actions
Starting Position: After touchdown, rolling on
Runway 10@KLAF,
Heading 100, Speed 30kts;
Flaps Full, Gear Down, VMC Weather
1 Fire, Fire, Fire on both engines
2"Silence the warning, and we are going to evacuate
as we stop"
3 "I will call ATC"
4
"Mayday Mayday Mayday, Phenom
100PU, both engines on fire, evacuating
to the left side"
5 Thrust Levers, Idle
6 Emergency/Parking Brake, Set
7 Start Stop Knobs Stop
8 Shutoff 1 & 2 Buttons, Push in
9 Fire Bottle Select
10 Pressurization Mode Switch - Manual
11 Dump - Push in
12 ATC - notified "Notified"
13 Evacuation - Perform
14 "Evacuate via the main doors only!"
15 BATT 1 & 2 switches - off

120
Emergency Evacuation - Score of 4 Expected Duration: 1:00
Event PF Actions PM Actions
Starting Position: After touchdown, rolling on
Runway 10@KLAF,
Heading 100, Speed 30kts;
Flaps Full, Gear Down, VMC Weather
1 Fire, Fire, Fire on both engines
2"Silence the warning, and we are going to evacuate
as we stop"
3 "I will call ATC"
4
"Mayday Mayday Mayday, Phenom
100PU, both engines on fire, evacuating
to the left side"
5 Thrust Levers, Idle
6 Emergency/Parking Brake, Set
7 Start Stop Knobs Stop
8 Shutoff 1 & 2 Buttons, Push in
9 Pressurization Mode Switch - Manual
10 Dump - Push in
11 ATC - notified "Notified"
12 Evacuation - Perform
13 "Evacuate via the main doors only!"
14 BATT 1 & 2 switches - off

121
Emergency Evacuation - Score of 1 Expected Duration: 1:00
Event PF Actions PM Actions
Starting Position: After touchdown, rolling on
Runway 10@KLAF,
Heading 100, Speed 30kts;
Flaps Full, Gear Down, VMC Weather
1 Fire, Fire, Fire on both engines
2 Did not silence the fire warning
3 Stopped the aircraft and did nothing
4Did not announce anything, started the evacuation
checklist by memory
5 Start/Stop Knobs - Stop
6 "Hey can you pull out the QRH?"
7 "I am going to pull out the QRH"
8(Spends the next minute looking for the
pages)
9 Pressurization Mode Switch - Manual
10 Dump - Push in
11 Did not notify ATC
12 "Evacuate!!! Go go go go!"
13 Did not shut of BATT 1 & 2

122
V1 Cut - Score of 4 Expected Duration: 2:30
Event PF Actions PM Actions
Starting Position: Runway 10, Heading mode, TO
mode, aircraft configured for takeoff
1 TOGA: "Thrust Set"
2 When ATR armed… "ATR armed"
3 When airspeed alive… "Airspeed Alive"
4 At 70 knots… "70 knots"
5 "Checked"
6 At V1… "V1, Rotate"
7 (Lose Engine 1) "Engine failure"
8 Maintain directional control using rudder
9 "Positive Rate"
10 "Gear Up"
11 Pulls the gear up
12 "Flight Level Change, Bug V2"
13 Bug V2 speed, FLC switch
14"Mayday Mayday Mayday, Phenom
100PU, Engine failure, departing
15 1000ft: "Autopilot On, Bug Vfs"
16 Turn on autopilot and bug Vfs
17 Aircraft accelerates…
18 Right before Vfs: "Flaps Zero"
19 Sets flaps to 0
20 Set thrust to CON/CLB
21 "I have control and communication"
22 "Engine 1 Failure Checklist"

123
V1 Cut - Score of 3 Expected Duration: 2:30
Event PF Actions PM Actions
Starting Position: Runway 10, heading mode, TO,
aircraft configured for takeoff
1 TOGA: "Thrust Set"
2 When ATR armed… "ATR armed"
3 When airspeed alive… "Airspeed Alive"
4 At 70 knots… "70 knots"
5 "Checked"
6 At V1… "V1, Rotate"
7 (Lose Engine 1) "Engine failure"
8 Lost directional control to the left for 8 degrees
9 "Positive Rate"
10 "Gear Up"
11 Pulls the gear up
12 "Flight Level Change, Bug V2"
13 Slightly uncoordinated Bug V2 speed, FLC switch
14"Mayday Mayday Mayday, Phenom
100PU, Engine failure, departing
15 Maintain V2+8kts for climb…
16 1000ft: "Autopilot On, Bug Vfs"
17 Turn on autopilot and bug Vfs
18 Aircraft accelerates…
19 After reaching Vfs: "Flaps Zero"
20 Sets flaps to 0
21 Set thrust to CON/CLB
22 "I have control and communication"
23 "Engine 1 Failure Checklist"

124
APPENDIX F. PARTICIPANT DEMOGRAPHICS SURVEY

125
Approximately what time did you take your initial CFI
checkride? (e.g. Fall 2015, Summer 2016)
How many students have you taught as a flight instructor?
(Include students you are currently teaching; only include
students you have trained for more than 5 hours; Include all
simulator students)
• 0
• 1-3
• 3-6
• 6-12
• >12
Do you have any experience teaching in a flight simulator?
• Yes
• No
How many hours do you have on the ACTUAL Phenom
100 aircraft?
• 0
• 1-6
• 7-15
• >15
What is your status for the AT395 (Phenom
100 Simulator Course)?
• Enrolled this semester
• Completed during Fall 2017
• Completed during Summer 2017 or before
• Did not take
What is your status for the AT396 (Phenom
100 Flight Course)?
• Enrolled this semester
• Completed during Fall 2017
• Completed during Summer 2017 or before
• Did not take

126
APPENDIX G. SUGGESTIONS AND COMMENTS FROM
PARTICIPANTS
It was good to show a variety of different maneuvers and skill levels. However, most
of us as CFIs instruct in smaller GA planes, not the Phenom or Phenom sim. Maybe it
would be good to do this experiment with maneuvers in the Cirrus or Frasca sims,
representing small GA aircraft that most of us do CFI in?
I think that this was a good experience, however it would help to know the level of
student being evaluated, as expectations would differ for someone who is entering the
course and then towards the end of completing it.
Near the end of the pre-test session, i felt rushed as more and more people left the
computer lab. This changed how detailed i was with my responses and analysis of the
scenarios. Had all of the participants stayed in the room until everyone was complete, i
feel i would have taken more time to analyze the laws two videos.
clearer video quality needed
wider/multiple views of instrumentation (esp. nav dats on MFD during ILS)
There was a lot of paper used and distributed for this project. Some of the material
probably could have been presented electronically (for example, the PTS/SOP packet
could have been opened in another window as a PDF) to keep waste down.
I liked the experiment and the way it was conducted overall.

127
Implementation of the workshop into the Hangar 6 standardization would greatly
improve grading. It is many instructor's first time instructing and they are worried more
about the student not killing them then they are giving them a grade. this is a very
simple and straight forward grading procedure that i think would be beneficial to all
grading flight operations.
I had briefly gone over the 1-4 grading system with my instructor for 396 so had an
idea how the system worked going into the first set of videos. After the workshop I had
a deeper understanding of the grading system and used my knew knowledge to the best
of my abilities to grade the students. I do believe however that my grades from the first
set of videos are likely similar to the second set of videos only because my
understanding of the grading system before hand. I do believe that I may have graded
harder before my understanding after the work shop. All in all in was a great
experience for me to get some more practice and understanding of different teaching
and grading methods.
Incorporating more borderline scenarios to lead to a discussion. It would be necessary
to have one correct standard answer to provide after the discussion.
Have the group who attended the workshop do the second round of grading without the
training packet in front of them as they grade. In the real world it will be unlikely they
will carry this with them as they are grading students. Another suggestion is to only

128
Make airspeed and glideslope more visible on some of the videos - was hard to read
and thus grade as a result (mostly the landing video).
This was great, and I really hope to see something like this implemented in the future.
It takes a LARGE amount of subjectivity out of the grading process and makes it more
streamlined and sets a more recognizable goal for both students and instructors alike to
reach. Hearing that this is used in the industry only furthers my hope that this becomes
standard practice in America.
The presentation diagram was very helpful to help with the grading. Allen did an
excellent job explaining the problems and challenges that instructors face and applying
it to our daily flight. I believe that this SHOULD be mandatory for all instructors. It
would help me be less random with the grading of my students especially at H6.
This was awesome Allen. I think all CFI's should go through the workshop for Purdue
Aviation and University.
Kind of hard to judge the flights because it was hard to tell what the airspeeds and
other indications were. made it slightly difficulty to be picky with airspeeds but overall
was a good study and I feel I will be taking a lot away from it.
none that i can think of
Excellent workshop. I hope we transition to this grading system and use this training
during Stan week

129
APPENDIX H. PRE-TEST ANALYSIS FOR FIVE SCENARIOS
Fleiss’ Kappa for Pre-test Control Group
Fleiss’ Kappa for Pre-test Treatment Group
Fleiss' Kappa for m Raters
Pre-test Control Group
Subjects = 5
Raters = 9
Kappa = 0.113
z = 2.3
p-value = 0.0215
Fleiss' Kappa for m Raters
Pre-test Treatment Group
Subjects = 5
Raters = 20
Kappa = 0.132
z = 6.01
p-value = 1.87e-09

130
Descriptive Statistics for Pre-test Control Group MAD
Normality Tests for Pre-test Control Group MAD
Descriptives
Statistic Std. Error
PreControl Mean .4889 .10062
95% Confidence
Interval for Mean
Lower Bound .2569
Upper Bound .7209
5% Trimmed Mean .4988
Median .6000
Variance .091
Std. Deviation .30185
Minimum .00
Maximum .80
Range .80
Interquartile Range .60
Skewness -.425 .717
Kurtosis -1.360 1.400
Tests of Normality
Kolmogorov-Smirnova Shapiro-Wilk
Statistic df Sig. Statistic df Sig.
PreControl .199 9 .200* .886 9 .180
Note. *. This is a lower bound of the true significance.
a. Lilliefors Significance Correction

131
Descriptive Statistics for Pre-test Treatment Group MAD
Normality Tests for Pre-test Treatment Group MAD
Group Statistics for Pre-test MAD
Descriptives
Statistic Std. Error
PreTreatment Mean .4800 .06224
95% Confidence
Interval for Mean
Lower Bound .3497
Upper Bound .6103
5% Trimmed Mean .4778
Median .4000
Variance .077
Std. Deviation .27834
Minimum .00
Maximum 1.00
Range 1.00
Interquartile Range .40
Skewness .359 .512
Kurtosis -.503 .992
Tests of Normality
Kolmogorov-Smirnova Shapiro-Wilk
Statistic df Sig. Statistic df Sig.
PreTreatment .163 20 .171 .935 20 .191
Note. a. Lilliefors Significance Correction
Group Statistics
Group N Mean
Std.
Deviation
Std. Error
Mean
PreTest 1.00 9 .4889 .30185 .10062
2.00 20 .4800 .27834 .06224

132
Levene’s Test for Pre-Test MAD
Independent samples T-Test for Pre-test MAD
Test of Homogeneity of Variances
PreTest
Levene
Statistic df1 df2 Sig.
.245 1 27 .625
Independent Samples Test
t-test for Equality of Means
t df
Sig.
(2-
tailed)
Mean
Difference
Std. Error
Difference
95% Confidence
Interval of the
Difference
Lower Upper
PreTest Equal
variances
assumed
.078 27 .939 .00889 .11460 -.22625 .24403
Equal
variances not
assumed
.075 14.406 .941 .00889 .11831 -.24419 .26197

133
Mann-Whitney U Test for Pre-test MAD

134
Ranks
Group N Mean Rank
Sum of
Ranks
PreTest 1.00 9 15.44 139.00
2.00 20 14.80 296.00
Total 29
Test Statisticsa
PreTest
Mann-Whitney U 86.000
Wilcoxon W 296.000
Z -.193
Asymp. Sig. (2-tailed) .847
Exact Sig. [2*(1-tailed
Sig.)]
.871b
Note. a. Grouping Variable: Group
b. Not corrected for ties.

135
APPENDIX I. POST-TEST ANALYSIS FOR FIVE SCENARIOS
Fleiss’ Kappa for Post-test Control Group
Fleiss’ Kappa for Post-test Treatment Group
Fleiss' Kappa for m Raters
Post-test Control Group
Subjects = 5
Raters = 9
Kappa = 0.144
z = 3.16
p-value = 0.00156
Fleiss' Kappa for m Raters
Post-test Treatment Group
Subjects = 5
Raters = 20
Kappa = 0.507
z = 25.8 p-value = 0

136
Descriptive Statistics for Post-test Control Group MAD
Normality Tests for Post-test Control Group MAD
Descriptives
Statistic Std. Error
PostControl Mean .4667 .07454
95% Confidence
Interval for Mean
Lower Bound .2948
Upper Bound .6385
5% Trimmed Mean .4741
Median .4000
Variance .050
Std. Deviation .22361
Minimum .00
Maximum .80
Range .80
Interquartile Range .20
Skewness -.843 .717
Kurtosis 1.943 1.400
Tests of Normality
Kolmogorov-Smirnova Shapiro-Wilk
Statistic df Sig. Statistic df Sig.
PostControl .272 9 .054 .883 9 .170
Note. a. Lilliefors Significance Correction

137
Descriptive Statistics for Post-test Treatment Group MAD
Normality Tests for Post-test Treatment Group MAD
Group Statistics for Post-test MAD
Descriptives
Statistic Std. Error
PostTreatment Mean .2600 .04377
95% Confidence
Interval for Mean
Lower Bound .1684
Upper Bound .3516
5% Trimmed Mean .2556
Median .2000
Variance .038
Std. Deviation .19574
Minimum .00
Maximum .60
Range .60
Interquartile Range .35
Skewness .067 .512
Kurtosis -.964 .992
Tests of Normality
Kolmogorov-Smirnova Shapiro-Wilk
Statistic df Sig. Statistic df Sig.
PostTreatment .213 20 .018 .879 20 .017
Note. a. Lilliefors Significance Correction
Group Statistics
Group N Mean
Std.
Deviation
Std. Error
Mean
PostTest 1.00 9 .4667 .22361 .07454
2.00 20 .2600 .19574 .04377

138
Levene’s Test for Post-Test MAD
Independent samples T-Test for Post-test MAD
Paired Samples T-Test for Control Group MAD
Test of Homogeneity of Variances
PostTest
Levene
Statistic df1 df2 Sig.
.005 1 27 .947
Independent Samples Test
t-test for Equality of Means
t df
Sig.
(2-
tailed)
Mean
Difference
Std. Error
Difference
95% Confidence
Interval of the
Difference
Lower Upper
PostTest Equal
variances
assumed
2.519 27 .018 .20667 .08204 .03833 .37500
Equal
variances
not assumed
2.391 13.779 .032 .20667 .08644 .02100 .39233

139
Paired Samples T-Test for Treatment Group MAD
Paired Samples Test
Paired Differences
t df
Sig.
(2-
tailed) Mean
Std.
Deviation
Std. Error
Mean
95% Confidence
Interval of the
Difference
Lower Upper
PreControl -
PostControl
.02222 .44096 .14699 -.31673 .36117 .151 8 .884
Paired Samples Test
Paired Differences
t df
Sig. (2-
tailed) Mean
Std.
Deviation
Std.
Error
Mean
95% Confidence Interval
of the Difference
Lower Upper
PreTreatment -
PostTreatment
.22000 .28210 .06308 .08797 .35203 3.488 19 .002

140
Mann-Whitney U Test for Post-test MAD

141
Wilcoxon Signed Rank Test for Control Group MAD
Ranks
Group N Mean Rank
Sum of
Ranks
PostTest 1.00 9 20.28 182.50
2.00 20 12.63 252.50
Total 29
Test Statisticsa
PostTest
Mann-Whitney U 42.500
Wilcoxon W 252.500
Z -2.330
Asymp. Sig. (2-tailed) .020
Exact Sig. [2*(1-tailed
Sig.)]
.023b
Note. a. Grouping Variable: Group
b. Not corrected for ties.

142
Sign Test for Control Group MAD
Ranks
N Mean Rank
Sum of
Ranks
PostControl -
PreControl
Negative Ranks 4a 3.50 14.00
Positive Ranks 3b 4.67 14.00
Ties 2c
Total 9
Note. a. PostControl < PreControl
b. PostControl > PreControl
c. PostControl = PreControl
Test Statisticsa
PostControl -
PreControl
Z .000b
Asymp. Sig. (2-tailed) 1.000
Note. a. Wilcoxon Signed Ranks Test
b. The sum of negative ranks
equals the sum of positive ranks.
Frequencies
N
PostControl -
PreControl
Negative Differencesa 4
Positive Differencesb 3
Tiesc 2
Total 9
Note. a. PostControl < PreControl
b. PostControl > PreControl
c. PostControl = PreControl

143
Wilcoxon Signed Rank Test for Treatment Group MAD
Test Statisticsa
PostControl -
PreControl
Exact Sig. (2-tailed) 1.000b
Note. a. Sign Test
b. Binomial distribution used.
Ranks
N Mean Rank
Sum of
Ranks
PostTreatment -
PreTreatment
Negative Ranks 14a 9.64 135.00
Positive Ranks 3b 6.00 18.00
Ties 3c
Total 20
Note. a. PostTreatment < PreTreatment
b. PostTreatment > PreTreatment
c. PostTreatment = PreTreatment

144
Sign Test for Treatment Group MAD
Pearson Product-moment Correlation
Test Statisticsa
PostTreatment -
PreTreatment
Z -2.861b
Asymp. Sig. (2-tailed) .004
Note. a. Wilcoxon Signed Ranks Test
b. Based on positive ranks.
Frequencies
N
PostTreatment -
PreTreatment
Negative Differencesa 14
Positive Differencesb 3
Tiesc 3
Total 20
Note. a. PostTreatment < PreTreatment
b. PostTreatment > PreTreatment
c. PostTreatment = PreTreatment
Test Statisticsa
PostTreatment -
PreTreatment
Exact Sig. (2-tailed) .013b
Note. a. Sign Test
b. Binomial distribution used.
Correlations
Pre-test Post-test
Pre-test Pearson Correlation 1 -.395
Sig. (2-tailed) .293
N 9 9
Post-test Pearson Correlation -.395 1
Sig. (2-tailed) .293
N 9 9

145
Pre-test MAD vs. Post-test MAD for Each Participant in Control Group
Pre-test MAD vs. Post-test MAD for Each Participant in Treatment Group

146
APPENDIX J. PRE-TEST ANALYSIS FOR SIX SCENARIOS
Fleiss’ Kappa for Pre-test Control Group
Fleiss’ Kappa for Pre-test Treatment Group
Fleiss' Kappa for m Raters
Pre-test Control Group
Subjects = 6
Raters = 9
Kappa = 0.275
z = 6.64 p-value = 3.12e-11
Fleiss' Kappa for m Raters
Pre-test Treatment Group
Subjects = 6
Raters = 20
Kappa = 0.255
z = 14.2
p-value = 0

147
Descriptive Statistics for Pre-test Control Group MAD
Normality Tests for Pre-test Control Group MAD
Descriptives
Statistic Std. Error
PreControl6 Mean .4259 .07911
95% Confidence
Interval for Mean
Lower Bound .2435
Upper Bound .6084
5% Trimmed Mean .4362
Median .5000
Variance .056
Std. Deviation .23733
Minimum .00
Maximum .67
Range .67
Interquartile Range .42
Skewness -.645 .717
Kurtosis -.543 1.400
Tests of Normality
Kolmogorov-Smirnova Shapiro-Wilk
Statistic df Sig. Statistic df Sig.
PreControl6 .178 9 .200* .899 9 .246
Note. *. This is a lower bound of the true significance.
a. Lilliefors Significance Correction

148
Descriptive Statistics for Pre-test Treatment Group MAD
Normality Tests for Pre-test Treatment Group MAD
Group Statistic for Pre-test MAD
Descriptives
Statistic Std. Error
PreTreatment6 Mean .4417 .05577
95% Confidence
Interval for Mean
Lower Bound .3249
Upper Bound .5584
5% Trimmed Mean .4444
Median .5000
Variance .062
Std. Deviation .24941
Minimum .00
Maximum .83
Range .83
Interquartile Range .46
Skewness .044 .512
Kurtosis -.875 .992
Tests of Normality
Kolmogorov-Smirnova Shapiro-Wilk
Statistic df Sig. Statistic df Sig.
PreTreatment6 .192 20 .051 .917 20 .088
Note. a. Lilliefors Significance Correction
Group Statistics
Group N Mean
Std.
Deviation
Std. Error
Mean
PreTest6 1.00 9 .4259 .23733 .07911
2.00 20 .4417 .24941 .05577
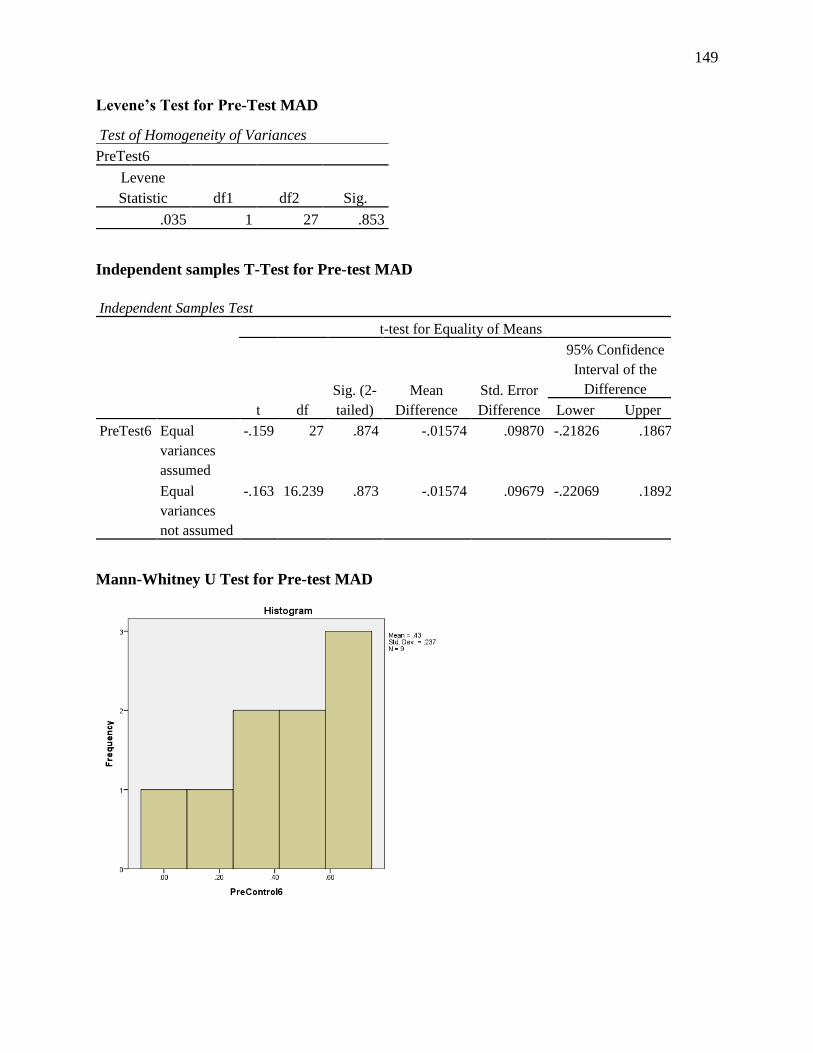
149
Levene’s Test for Pre-Test MAD
Independent samples T-Test for Pre-test MAD
Mann-Whitney U Test for Pre-test MAD
Test of Homogeneity of Variances
PreTest6
Levene
Statistic df1 df2 Sig.
.035 1 27 .853
Independent Samples Test
t-test for Equality of Means
t df
Sig. (2-
tailed)
Mean
Difference
Std. Error
Difference
95% Confidence
Interval of the
Difference
Lower Upper
PreTest6 Equal
variances
assumed
-.159 27 .874 -.01574 .09870 -.21826 .18677
Equal
variances
not assumed
-.163 16.239 .873 -.01574 .09679 -.22069 .18921
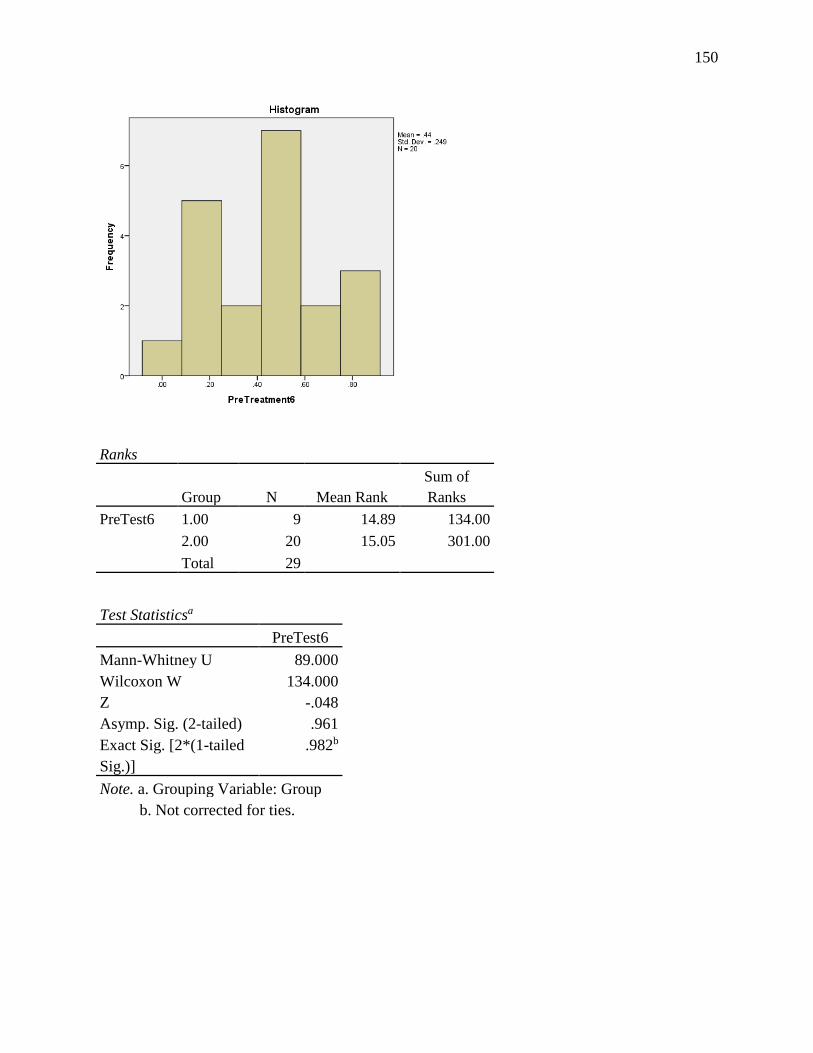
150
Ranks
Group N Mean Rank
Sum of
Ranks
PreTest6 1.00 9 14.89 134.00
2.00 20 15.05 301.00
Total 29
Test Statisticsa
PreTest6
Mann-Whitney U 89.000
Wilcoxon W 134.000
Z -.048
Asymp. Sig. (2-tailed) .961
Exact Sig. [2*(1-tailed
Sig.)]
.982b
Note. a. Grouping Variable: Group
b. Not corrected for ties.

151
APPENDIX K. POST-TEST ANALYSIS FOR SIX SCENARIOS
Fleiss’ Kappa for Post-test Control Group
Fleiss’ Kappa for Post-test Treatment Group
Fleiss' Kappa for m Raters
Post-test Control Group
Subjects = 6
Raters = 9
Kappa = 0.101
z = 2.48
p-value = 0.0132
Fleiss' Kappa for m Raters
Post-test Treatment Group
Subjects = 6
Raters = 20
Kappa = 0.441
z = 25.2
p-value = 0

152
Descriptive Statistics for Post-test Control Group MAD
Normality Tests for Post-test Control Group MAD
Descriptives
Statistic Std. Error
PostControl6 Mean .6296 .08686
95% Confidence
Interval for Mean
Lower Bound .4293
Upper Bound .8299
5% Trimmed Mean .6348
Median .6667
Variance .068
Std. Deviation .26058
Minimum .17
Maximum 1.00
Range .83
Interquartile Range .42
Skewness -.541 .717
Kurtosis -.145 1.400
Tests of Normality
Kolmogorov-Smirnova Shapiro-Wilk
Statistic df Sig. Statistic df Sig.
PostControl6 .223 9 .200* .951 9 .701
Note. *. This is a lower bound of the true significance.
a. Lilliefors Significance Correction

153
Descriptive Statistics for Post-test Treatment Group MAD
Normality Tests for Post-test Treatment Group MAD
Group Statistic for Pre-test MAD
Descriptives
Statistic Std. Error
PostTreatment6 Mean .3667 .05748
95% Confidence
Interval for Mean
Lower Bound .2464
Upper Bound .4870
5% Trimmed Mean .3611
Median .4167
Variance .066
Std. Deviation .25706
Minimum .00
Maximum .83
Range .83
Interquartile Range .33
Skewness -.084 .512
Kurtosis -1.046 .992
Tests of Normality
Kolmogorov-Smirnova Shapiro-Wilk
Statistic df Sig. Statistic df Sig.
PostTreatment6 .198 20 .039 .919 20 .094
Note. a. Lilliefors Significance Correction
Group Statistics
Group N Mean
Std.
Deviation
Std. Error
Mean
PostTest6 1.00 9 .6296 .26058 .08686
2.00 20 .3667 .25706 .05748

154
Levene’s Test for Post-Test MAD
Independent samples T-Test for Post-test MAD
Paired Samples T-Test for Control Group MAD
Test of Homogeneity of Variances
PostTest6
Levene
Statistic df1 df2 Sig.
.121 1 27 .731
Independent Samples Test
t-test for Equality of Means
t df
Sig. (2-
tailed)
Mean
Difference
Std. Error
Difference
95% Confidence
Interval of the
Difference
Lower Upper
PostTest6 Equal
variances
assumed
2.538 27 .017 .26296 .10360 .05039 .47554
Equal
variances not
assumed
2.525 15.305 .023 .26296 .10416 .04134 .48458

155
Paired Samples T-Test for Treatment Group MAD
Paired Samples Test
Paired Differences
t df
Sig. (2-
tailed) Mean
Std.
Deviation
Std.
Error
Mean
95% Confidence
Interval of the
Difference
Lower Upper
PreControl6 -
PostControl6
-.20370 .46976 .15659 -.56480 .15739 -1.301 8 .230
Paired Samples Test
Paired Differences
t df
Sig. (2-
tailed) Mean
Std.
Deviation
Std.
Error
Mean
95% Confidence
Interval of the
Difference
Lower Upper
PreTreatment6 -
PostTreatment6
.07500 .34402 .07692 -.08601 .23601 .975 19 .342

156
Mann-Whitney U Test for Post-test MAD
Ranks
Group N Mean Rank
Sum of
Ranks
PostTest6 1.00 9 20.39 183.50
2.00 20 12.58 251.50
Total 29

157
Wilcoxon Signed Rank Test for Control Group MAD
Test Statisticsa
PostTest6
Mann-Whitney U 41.500
Wilcoxon W 251.500
Z -2.322
Asymp. Sig. (2-tailed) .020
Exact Sig. [2*(1-tailed
Sig.)]
.020b
Note. a. Grouping Variable: Group
b. Not corrected for ties.
Ranks
N Mean Rank
Sum of
Ranks
PostControl6 -
PreControl6
Negative Ranks 2a 3.50 7.00
Positive Ranks 5b 4.20 21.00
Ties 2c
Total 9
Note. a. PostControl6 < PreControl6
b. PostControl6 > PreControl6
c. PostControl6 = PreControl6

158
Sign Test for Control Group MAD
Test Statisticsa
PostControl6
- PreControl6
Z -1.190b
Asymp. Sig. (2-tailed) .234
Note. a. Wilcoxon Signed Ranks Test
b. Based on negative ranks.
Frequencies
N
PostControl6 -
PreControl6
Negative Differencesa 2
Positive Differencesb 5
Tiesc 2
Total 9
Note. a. PostControl6 < PreControl6
b. PostControl6 > PreControl6
c. PostControl6 = PreControl6
Test Statisticsa
PostControl6
- PreControl6
Exact Sig. (2-tailed) .453b
Note. a. Sign Test
b. Binomial distribution used.

159
Wilcoxon Signed Rank Test for Treatment Group MAD
Ranks
N Mean Rank
Sum of
Ranks
PostTreatment6 -
PreTreatment6
Negative Ranks 12a 9.04 108.50
Positive Ranks 6b 10.42 62.50
Ties 2c
Total 20
Note. a. PostTreatment6 < PreTreatment6
b. PostTreatment6 > PreTreatment6
c. PostTreatment6 = PreTreatment6
Test Statisticsa
PostTreatment6 -
PreTreatment6
Z -1.013b
Asymp. Sig. (2-tailed) .311
Note. a. Wilcoxon Signed Ranks Test
b. Based on positive ranks.

160
Sign Test for Treatment Group MAD
Pearson Product-moment Correlation
Frequencies
N
PostTreatment6 -
PreTreatment6
Negative Differencesa 12
Positive Differencesb 6
Tiesc 2
Total 20
Note. a. PostTreatment6 < PreTreatment6
b. PostTreatment6 > PreTreatment6
c. PostTreatment6 = PreTreatment6
Test Statisticsa
PostTreatment6 -
PreTreatment6
Exact Sig. (2-tailed) .238b
Note. a. Sign Test
b. Binomial distribution used.
Correlations
Pre-test Post-test
Pre-test Pearson Correlation 1 -.780*
Sig. (2-tailed) .013
N 9 9
Post-test Pearson Correlation -.780* 1
Sig. (2-tailed) .013
N 9 9
*. Correlation is significant at the 0.05 level (2-tailed).
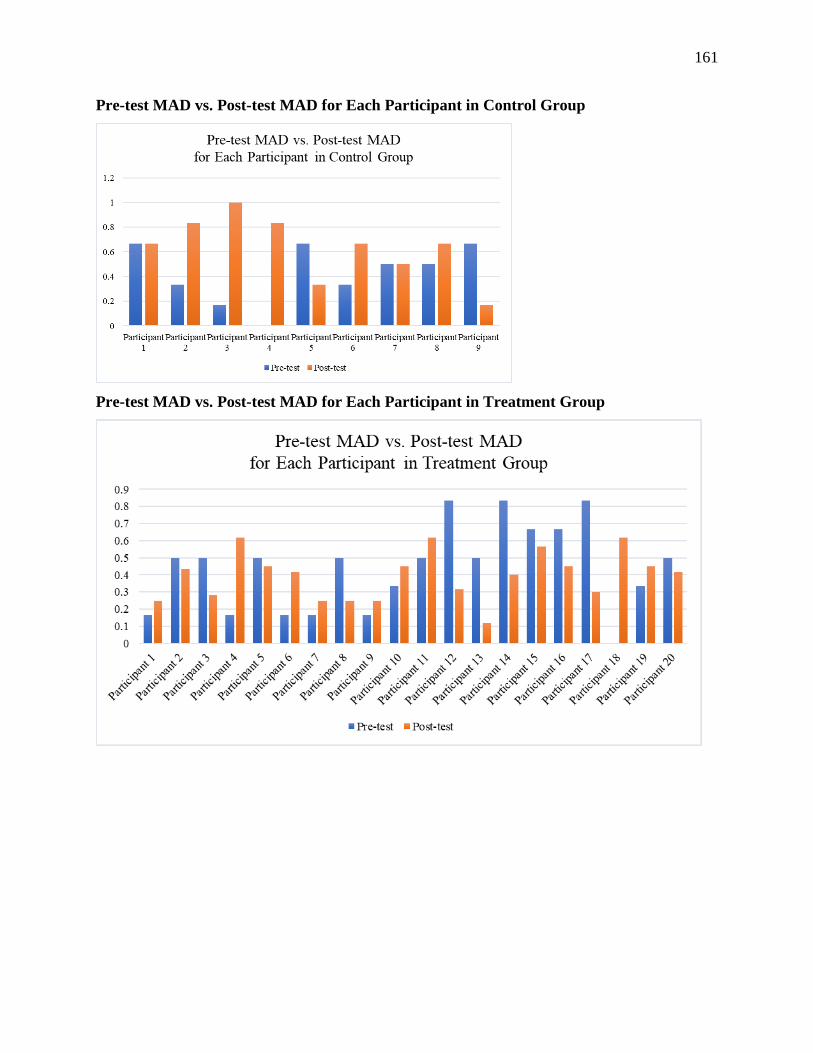
161
Pre-test MAD vs. Post-test MAD for Each Participant in Control Group
Pre-test MAD vs. Post-test MAD for Each Participant in Treatment Group

162
REFERENCES
Arthur, W., Jr., Bennett, W., Jr., Edens, P. S., & Bell, S. T. (2003). Effectiveness of training in
organizations: A meta-analysis of design and evaluation features. Journal of Applied
Psychology, 88(2), 234-245.
Baker, D., & Dismukes, R. (2002). A framework for understanding crew performance
assessment issues. The International Journal of Aviation Psychology, 12(3), 205-222.
Bamford, J. T., Gessert, C. E., & Renier, C. M. (2004). Measurement of the severity of
rosacea. Journal of the American Academy of Dermatology, 51(5), 697-703.
Banerjee, A., Chitnis, U. B., Jadhav, S. L., Bhawalkar, J. S., & Chaudhury, S. (2009). Hypothesis
testing, type I and type II errors. Industrial Psychiatry Journal, 18(2), 127–131.
Beaudin-Seiler, B. M., & Seiler, R. (2015). A study of how flight instructors assess flight
maneuvers and give grades: inter-rater reliability of instructor assessments. Journal of
Aviation/Aerospace Education & Research, 25(1).
Boeing Company. (2018). Boeing: 2018 pilot outlook. Retrieved from
https://www.boeing.com/commercial/market/pilot-technician-outlook/2018-pilot-outlook/
Brannick, M. T., Prince, C., & Salas, E. (2002). The reliability of instructor evaluations of crew
performance: Good news and not so good news. The International Journal of Aviation
Psychology, 12(3), 241-261.
Burke, M. J., & Day, R. R. (1986). A cumulative study of the effectiveness of managerial
training. Journal of applied Psychology, 71(2), 232.
Campbell, D., Stanley, J. (1963). Experimental and quasi-experimental designs for research.
Boston: H. Mifflin.
163
Christensen, L. B., Johnson, B., & Turner, L. A. (2015). Research methods, design, and analysis.
Harlow: Pearson.
Cohen, J. (1960). A coefficient of agreement for nominal scales. Educational and psychological
measurement, 20(1), 37-46.
Cohen, J. (1988). Statistical power analysis for the behavioral sciences. Hillsdale, NJ:
L. Lawrence Earlbaum Associates.
Cohen, J. (1992). A power primer. Psychological bulletin, 112(1), 155.
Cook, D. A., Dupras, D. M., Beckman, T. J., Thomas, K. G., & Pankratz, V. S. (2009). Effect of
rater training on reliability and accuracy of mini-CEX scores: A randomized, controlled
trial. Journal of general internal medicine, 24(1), 74.
De Vet, H. C., Terwee, C. B., Knol, D. L., & Bouter, L. M. (2006). When to use agreement
versus reliability measures. Journal of clinical epidemiology, 59(10), 1033-1039.
Dimitrov, D. M., & Rumrill Jr, P. D. (2003). Pre-test-post-test designs and measurement of
change. Work, 20(2), 159-165.
Dumville, J. C., Hahn, S., Miles, J. N. V., & Torgerson, D. J. (2006). The use of unequal
randomisation ratios in clinical trials: a review. Contemporary clinical trials, 27(1), 1-12.
Edlund, J. E., Sagarin, B. J., Skowronski, J. J., Johnson, S. J., & Kutter, J. (2009). Whatever
happens in the laboratory stays in the laboratory: The prevalence and prevention of
participant crosstalk. Personality and Social Psychology Bulletin, 35(5), 635-642.
Eligibility Requirements. 14 C.F.R. § 61.183 (2009).
Ergai, A., Cohen, T., Sharp, J., Wiegmann, D., Gramopadhye, A., & Shappell, S. (2016).
Assessment of the human factors analysis and classification system (HFACS): intra-rater
and inter-rater reliability. Safety science, 82, 393-398.

164
Faul, F., Erdfelder, E., Lang, A.-G., & Buchner, A. (2007). G*Power 3: A flexible statistical
power analysis program for the social, behavioral, and biomedical sciences. Behavior
Research Methods, 39, 175-191.
Federal Aviation Administration. (2006). Advanced qualification program (AC120-54A).
Washington, D.C.
Federal Aviation Administration. (2008). Airline transport pilot and aircraft type rating
practical test standards for airplane (FAA-S-8081-5F). Washington, D.C.
Federal Aviation Administration. (2017). Advanced qualification program (AC120-54A change
1). Washington, D.C.
Feldman, M., Lazzara, E. H., Vanderbilt, A. A., & DiazGranados, D. (2012). Rater training to
support high‐stakes simulation‐based assessments. Journal of Continuing Education in
the Health Professions, 32(4), 279-286.
Fleiss, J. L. (1971). Measuring nominal scale agreement among many raters. Psychological
bulletin, 76(5), 378.
Flin, R., Martin, L., Goeters, K. M., Hörmann, H. J., Amalberti, R., Valot, C., & Nijhuis, H.
(2003). Development of the NOTECHS (non-technical skills) system for assessing pilots’
CRM skills. Journal of Human Factors and Aerospace Safety, 3(2), 95-117.
Fort-Vanmeerhaeghe, A., Montalvo, A., Lloyd, R., Read, P., & Myer, G. (2017). Intra- and inter-
rater reliability of the modified tuck jump assessment. Journal of Sports Science and
Medicine, 16(1), 117-124.
Freelon, D. (2010). ReCal: Intercoder reliability calculation as a web service. International
Journal of Internet Science, 5(1), 20-33.

165
Gisev, N., Bell, J. S., & Chen, T. F. (2013). Interrater agreement and interrater reliability: key
concepts, approaches, and applications. Research in Social and Administrative
Pharmacy, 9(3), 330-338.
Goldsmith, T., & Johnson, P. (2002). Assessing and improving evaluation of aircrew
performance. The International Journal of Aviation Psychology, 12(3), 223-240.
Gontar, P., & Hoermann, H. J. (2015). Interrater reliability at the top end: Measures of pilots’
nontechnical performance. The International Journal of Aviation Psychology, 25(3-4),
171-190.
Gorman, C. A., & Rentsch, J. R. (2009). Evaluating frame-of-reference rater training
effectiveness using performance schema accuracy. Journal of Applied Psychology, 94(5),
1336.
Groebner, D. F., Shannon, P. W., Fry, P. C., & Smith, K. D. (2011). Business statistics: A
decision making approach. Prentice Hall/Pearson.
Gwet, K. L. (2013). Estimating the number of subjects and number raters when designing an
inter-rater reliability study. Retrieved from
http://agreestat.com/blog_irr/sample_size_calculation.html
Hallgren, K. A. (2012). Computing inter-rater reliability for observational data: an overview and
tutorial. Tutorials in Quantitative Methods for Psychology, 8(1), 23-34.
Halpin, G., Halpin, G., & Arbet, S. (1994). Effects of number and type of response choices on
internal consistency reliability. Perceptual and Motor Skills, 79(2), 928-930.
Hamman, W. R., Beaubien, M. J., & Holt, R. W. (1999). Evaluating instructor/evaluator inter-
rater reliability from performance database information. In Proceedings of the 10th
International Symposium on Aviation Psychology (pp. 1214-1219).

166
Holt, R. W., Johnson, P. J., & Goldsmith, T. E. (1997). Application of psychometrics to the
calibration of air carrier evaluators. In Proceedings of the Human Factors and
Ergonomics Society Annual Meeting (Vol. 41, No. 2, pp. 916-920). Los Angeles, CA:
SAGE Publications.
Holt, R. W., Hansberger, J., & Boehm-Davis, D. (2002). Improving rater calibration in aviation:
a case study. The International Journal of Aviation Psychology, 12(3), 305-330.
Hsu, C. C., & Sandford, B. A. (2007). The Delphi technique: making sense of
consensus. Practical assessment, research & evaluation, 12(10), 1-8.
Hutchins, S. S., Brown, C., Mayberry, R., & Sollecito, W. (2015). Value of a small control group
for estimating intervention effectiveness: results from simulations of immunization
effectiveness studies. Journal of Comparative Effectiveness Research, 1–12.
International Air Transport Association. (2013). Evidence-based training implementation
guide. Montreal, Canada.
International Civil Aviation Organization. (2002). Line operations safety audit (LOSA): DOC
9803 (AN/761). Montreal, Canada.
Jackson, D. J., Atkins, S. G., Fletcher, R. B., & Stillman, J. A. (2005). Frame of reference
training for assessment centers: Effects on interrater reliability when rating behaviors and
ability traits. Personnel Administration, 34(1), 17-30.
Jamieson, S. (2004). Likert scales: how to (ab) use them. Medical education, 38(12),
1217-1218.
Kelly, J. (2005). Inter-rater reliability and Waterlow's pressure ulcer risk assessment tool.
Nursing Standard, 19(32), 86-7, 90-2.
Kirk, R. E. (1982). Experimental design. John Wiley & Sons, Inc.

167
Kirkpatrick, D. L., & Kirkpatrick, J. D. (2006). Evaluating training programs: the four
levels (3rd ed.). San Francisco, CA: Berrett-Koehler.
Kottner, J., Gajewski, B. J., & Streiner, D. L. (2011). Guidelines for reporting reliability and
agreement studies (GRRAS). International journal of nursing studies, 48(6), 659-660.
Kottner, J., & Streiner, D. L. (2011). The difference between reliability and agreement. Journal
of clinical epidemiology, 64(6), 701-702.
Laerd Statistics (2018a). Independent t-test in SPSS statistics - procedure, output and
interpretation of the output using a relevant example. Retrieved from
https://statistics.laerd.com/spss-tutorials/independent-t-test-using-spss-statistics.php
Laerd Statistics (2018b). Mann-Whitney U test in SPSS statistics | Setup, Procedure &
Interpretation. Retrieved from
https://statistics.laerd.com/spss-tutorials/mann-whitney-u-test-using-spss-statistics.php
Laerd Statistics (2018c). Dependent t-test in SPSS statistics - the procedure for running the test,
generating the output and understanding the output using a relevant example. Retrieved
from
https://statistics.laerd.com/spss-tutorials/dependent-t-test-using-spss-statistics.php
Laerd Statistics (2018d). Wilcoxon signed rank test in SPSS statistics - procedure, output and
interpretation of output using a relevant example. Retrieved from
https://statistics.laerd.com/spss-tutorials/wilcoxon-signed-rank-test-using-spss-
statistics.php
Laerd Statistics (2018e). Sign test in SPSS Statistics - procedure, output and interpretation of
output using a relevant example. Retrieved from
https://statistics.laerd.com/spss-tutorials/sign-test-using-spss-statistics.php

168
Landis, J. R., & Koch, G. G. (1977). The measurement of observer agreement. Biometrics, 33(1),
159-174.
LeBreton, J. M., & Senter, J. L. (2008). Answers to 20 questions about interrater reliability and
interrater agreement. Organizational research methods, 11(4), 815-852.
Lin, C., Chang, J. Z, Hsu, T., Liu, Y., Yu, S., Tsai, S. S., Lai, E., Lin, C. (2013). Correlation of
rater training and reliability in performance assessment: Experience in a school of
dentistry. Journal of dental sciences, 8(3), 256-260.
Lindeman, B., Libkuman, T., King, D., & Kruse, B. (2000). Development of an instrument to
assess jump-shooting form in basketball. Journal of Sport Behavior, 23(4), 335.
LoBiondo-Wood, G., Haber, J., Cameron, C., & Singh, M. (2014). Nursing Research in Canada-
E-Book: Methods, Critical Appraisal, and Utilization. Elsevier Health Sciences.
Lobo, A., Huyse, F. J., Herzog, T., Malt, U. F., & Opmeer, B. C. (1996). The ECLW
collaborative study II: patient registration form (PRF) instrument, training and
reliability. Journal of psychosomatic research, 40(2), 143-156.
Lord, F. M. (1959). Statistical inferences about true scores. Psychometrika, 24(1), 1-17.
Lozano, L. M., García-Cueto, E., & Muñiz, J. (2008). Effect of the number of response
categories on the reliability and validity of rating scales. Methodology: European Journal
Of Research Methods For The Behavioral And Social Sciences, 4(2), 73-79.
Lundstrom, J. T. (2007). A new use of frame-of-reference training: Improving reviewers’
inferences from biodata information (Doctoral dissertation, Kansas State University).
Mavin, T. J., & Dall'Alba, G. (2010). A model for integrating technical skills and NTS in
assessing pilots’ performance. In 9th International Symposium of the Australian Aviation
Psychology Association, Sydney, Australia.

169
Mavin, T. J., Roth, W. M., & Dekker, S. (2012). Should we turn all airline pilots into examiners?
The potential that evaluating other pilots' performance has for improving practice. In 30th
EAAP Conference, Villasimius, Sardinia, Italy.
Mavin, T. J., Roth, W. M., & Dekker, S. (2013). Understanding variance in pilot performance
ratings. Aviation Psychology and Applied Human Factors.
McClellan, D. (2009). Embraer Phenom 100: It takes an airline maker to produce an easy to
operate and very durable entry-level business jet. The Flying Magazine. Retrieved from
https://www.flyingmag.com/pilot-reports/jets/embraer-phenom-100
Mendonca, F. A. (2017). Exploiting science: enhancing the safety training of pilots to reduce the
risk of bird strikes (Doctoral dissertation, Purdue University).
Moore, D. S., McCabe, G. P., & Craig, B. A. (2014). Introduction to the practice of statistics.
New York: W. H. Freeman.
Mor, V., Angelelli, J., Jones, R., Roy, J., Moore, T., & Morris, J. (2003). Inter-rater reliability of
nursing home quality indicators in the US. BMC Health Services Research, 3(1), 20.
Mulcahey, M. J., Gaughan, J. P., Chafetz, R. S., Vogel, L. C., Samdani, A. F., & Betz, R. R.
(2011). Interrater reliability of the international standards for neurological classification
of spinal cord injury in youths with chronic spinal cord injury. Archives of physical
medicine and rehabilitation, 92(8), 1264-1269.
Mulqueen, C., Baker, D. P., & Dismukes, R. K. (2002). Pilot instructor rater training: the utility
of the multifacet item response theory model. The International Journal of Aviation
Psychology, 12(3), 287-303.

170
Nicolai, A. T., Schmal, S. L., & Schuster, C. (2015). Interrater reliability of the peer review
process in management journals. In Incentives and Performance: Governance of
Research Organizations (pp. 107-119). Springer International Publishing.
Norman, G. (2010). Likert scales, levels of measurement and the “laws” of statistics. Advances
in health sciences education, 15(5), 625-632.
Novick, M. R. (1965). The axioms and principal results of classical test theory. ETS Research
Report Series, 1965(1).
O'Connor, P., Hörmann, H. J., Flin, R., Lodge, M., Goeters, K. M., & the JARTEL Group.
(2002). Developing a method for evaluating crew resource management skills: A
European perspective. The International Journal of Aviation Psychology, 12(3), 263-285.
Peckham, E., Brabyn, S., Cook, L., Devlin, T., Dumville, J., & Torgerson, D. J. (2015). The use
of unequal randomisation in clinical trials—an update. Contemporary clinical trials, 45,
113-122.
Purdue University. (2016). Phenom 100 Standard Operating Procedures Manual. West
Lafayette, IN: Purdue University.
Purdue University. (2018). Human Research Protection Program. Retrieved from
https://www.irb.purdue.edu
RAND Corporation. (2017). Delphi method. Retrieved from https://www.rand.org/topics/delphi-
method.html
Roch, S. G., Woehr, D. J., Mishra, V., & Kieszczynska, U. (2012). Rater training revisited: An
updated meta-analytic review of frame-of-reference training. Journal of Occupational
and Organizational Psychology, 85(2), 370-395.

171
Roth, W. (2015). Flight examiners’ methods of ascertaining pilot proficiency. The International
Journal of Aviation Psychology, 25(3-4), 209-226.
Sani, F., & Todman, J. (2008). Experimental design and statistics for psychology a first course.
Hoboken: Wiley.
Santos, A., & Stuart, M. (2003). Employee perceptions and their influence on training
effectiveness. Human resource management journal, 13(1), 27-45.
Santos, C. C., Bernardes, J., & Ayres-de-Campos, D. (2011). Observer reliability and agreement:
differences, difficulties, and controversies. Journal of clinical epidemiology, 64(6), 702.
Sattler, D. N., McKnight, P. E., Naney, L., & Mathis, R. (2015). Grant peer review: improving
inter-rater reliability with training. PloS one, 10(6).
Schroter, S., Black, N., Evans, S., Carpenter, J., Godlee, F., & Smith, R. (2004). Effects of
training on quality of peer review: Randomised controlled trial. BMJ, 328(7441), 673.
Shuttleworth, M. (2008). True Experimental Design. Retrieved from https://explorable.com/true-
experimental-design
Smith, M. V., Niemczyk, M. C., & McCurry, W. K. (2008). Improving scoring consistency of
flight performance through inter-rater reliability analyses. Collegiate Aviation
Review, 26(1), 85.
Stangroom, J. (2018). Effect Size Calculator (Cohen's D) for T-Test. Retrieved from
http://www.socscistatistics.com/effectsize/Default3.aspx
Sullivan, G. M., & Artino Jr, A. R. (2013). Analyzing and interpreting data from Likert-type
scales. Journal of graduate medical education, 5(4), 541-542.
Thangaratinam, S., & Redman, C. W. (2005). The delphi technique. The obstetrician &
gynaecologist, 7(2), 120-125.

172
Torgerson, D., & Campbell, M. (2000). Use of unequal randomisation to aid the
economic efficiency of clinical trials. BMJ, 321(7263), 759.
Tovani, J. (2014). Delta’s experience with EBT. [PowerPoint slides]. Retrieved from
https://www.icao.int/SAM/Documents/2014-
AQP/Jon%20Tovani_Delta's%20Experience%20with%20EBT.pdf
Transport Canada. (2006). Approved check pilot manual: TP 6533E. Ottawa, Canada.
Transport Canada. (2007). Advanced qualifications program evaluator manual: TP 14672E.
Ottawa, Canada.
Transport Canada. (2017). Pilot proficiency check and aircraft type rating flight test guide
(aeroplane): TP 14727. Ottawa, Canada.
Weber, D. E., Roth, W. M., Mavin, T. J., & Dekker, S. W. (2013). Should we pursue inter-rater
reliability or diversity? An empirical study of pilot performance assessment. Aviation in
Focus–Journal of Aeronautical Sciences, 4(2), 34-58.
Weber, D. E. (2016). Judging airline pilots' performance with and without an assessment model:
a comparison study of the scoring of raters from two different airlines. Journal of
Aviation/Aerospace Education & Research, 25(2), 39.
Weitz, G., Vinzentius, C., Twesten, C., Lehnert, H., Bonnemeier, H., & König, I. R. (2014).
Effects of a rater training on rating accuracy in a physical examination skills
assessment. GMS Zeitschrift für Medizinische Ausbildung, 31(4).
Woehr, D. J., & Huffcutt, A. I. (1994). Rater training for performance appraisal: A quantitative
review. Journal of occupational and organizational psychology, 67(3), 189-205.

173
Yule, S., Flin, R., Maran, N., Rowley, D., Youngson, G., & Paterson-Brown, S. (2008).
Surgeons’ non-technical skills in the operating room: reliability testing of the NOTSS
behavior rating system. World journal of surgery, 32(4), 548-556.