assays for determination of protein unit 3.4 concentrationampleunit
DESCRIPTION
Accurate measurement of protein concentration is critical since the results are used inother calculations, such as determination of enzyme activity. Errors in protein concentrationdetermination tend to amplify overall errors in these calculations. Furthermore,protein assays are often purchased as kits from commercial suppliers, which result in apoor understanding of the underlying chemistry. This unit presents a survey of the commonprotein assay methods and highlights their usefulness and limitations. Additionally,the chemistry underlying each assay is explained to aid in troubleshooting and assayselection.TRANSCRIPT

7/21/2019 Assays for Determination of Protein UNIT 3.4 ConcentrationampleUnit
http://slidepdf.com/reader/full/assays-for-determination-of-protein-unit-34-concentrationampleunit 1/29
UNIT 3.4Assays for Determination of ProteinConcentration
Accurate measurement of protein concentration is critical since the results are used in
other calculations, such as determination of enzyme activity. Errors in protein concen-
tration determination tend to amplify overall errors in these calculations. Furthermore,
protein assays are often purchased as kits from commercial suppliers, which result in a
poor understanding of the underlying chemistry. This unit presents a survey of the com-mon protein assay methods and highlights their usefulness and limitations. Additionally,
the chemistry underlying each assay is explained to aid in troubleshooting and assay
selection.
There is no single protein assay method that yields absolutely accurate results. Each
method has different advantages and limitations. The primary intention of this unit is
to inform users how to select the most appropriate protein assay for a specific applica-
tion. The Kjeldahl method (Ballentine, 1957) and the acid digestion–ninhydrin method
(Lovrien and Matulis, 1995) are no longer in general use and are not included here.
This unit discusses the following protein assay methods that are commonly used in
biochemical laboratories: the Lowry assay (see Basic Protocol 1), the Bradford assay
(see Basic Protocol 2 and Alternate Protocol 1), the BCA assay (see Basic Protocol 3
and Alternate Protocol 2), and UV spectroscopy to determine protein concentration (see
Basic Protocol 4). Support Protocol 1 discusses standard curves and data processing in
detail and is a good place for a novice to start before beginning any experimentation.
Also included are two precipitation strategies for dealing with buffer incompatibility.
Finally, many applications of SDS-PAGE require equal loading of samples based on total
protein. Typically, this requires laborious extraction in a buffer compatible with a protein
assay, before adding SDS-PAGE loading buffer. Alternate Protocol 3 details a method
for alkylation of excess reducing agent in SDS-PAGE loading buffer for direct analysis
in the BCA assay.
The protocols in this unit should produce valid results for most applications. There are
also kits available for protein determination from Sigma, BioRad, and Pierce. Prior to
employing an assay kit or protocol, the user is advised to consult the Strategic Planning
section because it describes how to select the most appropriate assay for a particu-
lar task. The assays have different strengths and weaknesses, particularly regarding
buffer compatibility. Since some investigators may have limited experience with bio-
chemical techniques, the Commentary presents a discussion of the critical parameters
for protein assays, focusing on the standard curve and a brief review of spectropho-
tometry. Finally, a Support Protocol provides suggestions for processing data using a
spreadsheet.
STRATEGIC PLANNING
Assay choice
Two common applications of the protein assay are enzyme activity assays and equal
protein loading of SDS-PAGE gels. The strategies and considerations for these applica-
tions are considerably different. In enzyme activity calculations, the primary concern is
the accuracy of the results, whereas for equal loading of SDS-PAGE gels, precision is
more important. There are many other applications for protein assays, e.g., in nutrition
and pharmacology, and it is strongly recommend that the literature of the particular field
Contributed by Bradley J.S.C. Olson and John MarkwellCurrent Protocols in Protein Science (2007) 3.4.1-3.4.29
Copyright C 2007 by John Wiley & Sons, Inc.
Detection andAssay Methods
3.4.1
Supplement 48
7/21/2019 Assays for Determination of Protein UNIT 3.4 ConcentrationampleUnit
http://slidepdf.com/reader/full/assays-for-determination-of-protein-unit-34-concentrationampleunit 2/29
Assays forDetermination of
ProteinConcentration
3.4.2
Supplement 48 Current Protocols in Protein Science
be consulted before employing one of the assays presented in this unit to ensure that
these assays are applicable in the field. It is particularly important to realize that these
assays are estimation procedures unless the individual assay has been standardized to
total amino acid analysis (UNIT 3.2).
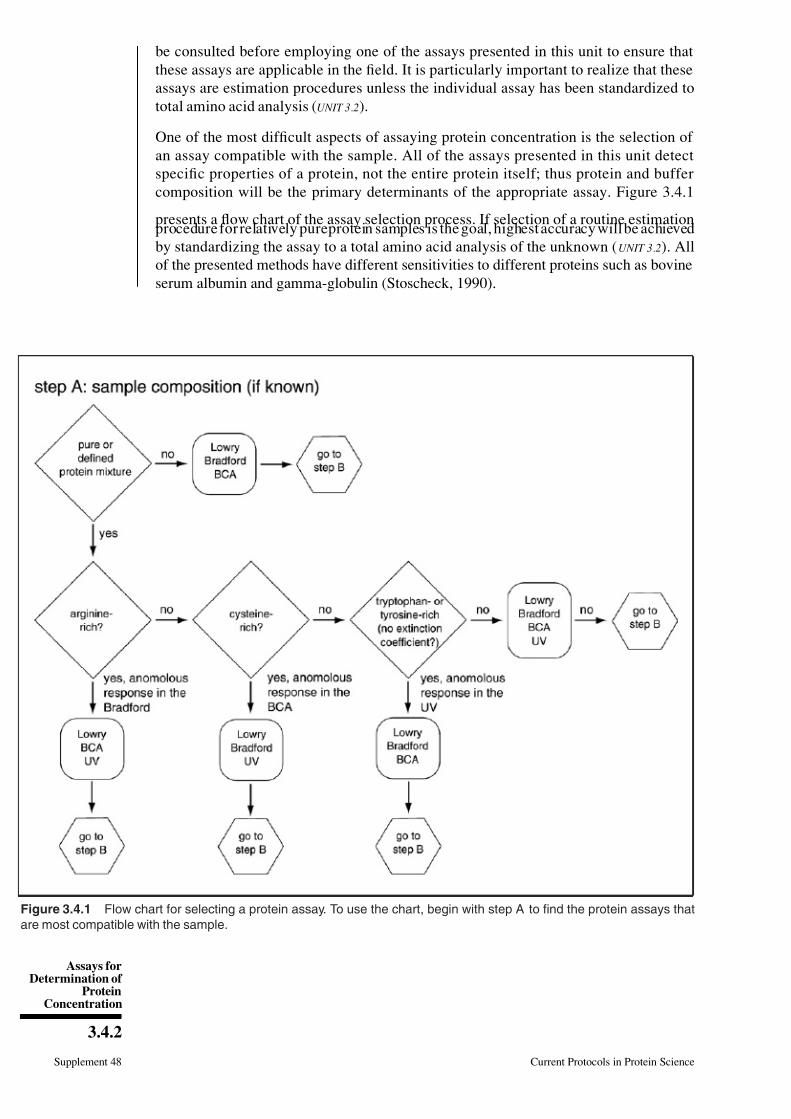
One of the most difficult aspects of assaying protein concentration is the selection of
an assay compatible with the sample. All of the assays presented in this unit detect
specific properties of a protein, not the entire protein itself; thus protein and buffer
composition will be the primary determinants of the appropriate assay. Figure 3.4.1
presents a flow chart of the assay selection process. If selection of a routine estimationprocedure for relatively pureprotein samples is the goal, highest accuracy will be achieved
by standardizing the assay to a total amino acid analysis of the unknown ( UNIT 3.2). All
of the presented methods have different sensitivities to different proteins such as bovine
serum albumin and gamma-globulin (Stoscheck, 1990).
Figure 3.4.1 Flow chart for selecting a protein assay. To use the chart, begin with step A to find the protein assays that
are most compatible with the sample.

7/21/2019 Assays for Determination of Protein UNIT 3.4 ConcentrationampleUnit
http://slidepdf.com/reader/full/assays-for-determination-of-protein-unit-34-concentrationampleunit 3/29
Detection andAssay Methods
3.4.3
Current Protocols in Protein Science Supplement 48
Figure 3.4.1 (continued) Then proceed to step B to obtain the list of assays compatible with the buffer system.
Compare the results from each step to find the most compatible assay for the sample. Refer to the text for the
assay and Table 3.4.1 to confirm assay compatibility before using a protein assay strategy. Abbreviations: 2-ME,
2-mercaptoethanol; DTT, dithiothreitol; SDS, sodium dodecyl sulfate.

7/21/2019 Assays for Determination of Protein UNIT 3.4 ConcentrationampleUnit
http://slidepdf.com/reader/full/assays-for-determination-of-protein-unit-34-concentrationampleunit 4/29
Assays forDetermination of
ProteinConcentration
3.4.4
Supplement 48 Current Protocols in Protein Science
Sample composition
Sample composition is critical when choosing a protein assay. For example, a protein
rich in arginine residues will produce an artificially high result using a Bradford assay,
whereas the same protein will most likely produce a more accurate result using either the
Lowry or BCA assay. Conversely, a protein high in cysteine would produce an artificially
high result using the BCA assay, but would likely produce better results with the Lowry
or Bradford assay. In general, the BCA and Lowry assays perform better with complex
protein mixtures.
Buffer composition
Buffer composition is an important consideration when selecting a protein assay. The
Lowry assay is very sensitive for determining protein concentration; however, common
buffer components such as ethylenediaminetetraacetic acid (EDTA) interfere with chro-
mophore production. The BCA assay is compatible with a wide range of detergents,
including sodium dodecylsulfate (SDS), but does not tolerate reducing agents such as
dithiothreitol (DTT). The Bradford assay will not tolerate high concentrations of deter-
gents but will work in the presence of reducing agents, such as DTT or 2-ME. See Table
3.4.1 for a comprehensive table listing interfering compounds and the limiting concen-
tration of each for the different assay methods. If it is not possible to find an assay that
is compatible with the buffer system, then the best strategy is to employ a precipitation
step (see Support Protocols 2 and 3). After precipitation, the sample is resuspended in abuffer compatible with one of the protein assays.
High-throughput adaptations
The Bradford and BCA assays are easily adapted for high-throughput analysis using a
microtiter plate format, as presented in Alternate Protocols 1 and 2, respectively. These
protocols are carried out in flat-bottom 96-well microtiter plates and are the methods of
choice when processing a large number of unknowns. If microtiter plate–based assays are
performed often, it is recommended to use a multichannel repeating pipettor to increase
accuracy and decrease user fatigue as samples are dispensed. A convenient approach is to
set up a master plate with pre-diluted standards and unknowns that can then be dispensed
onto multiple replicate plates. Another significant advantage of this format is that a larger
number of standard curve points can be processed, thus increasing the overall accuracy
of the results.
Selection of microtiter plate and plate reader
To adapt protein assays to high-throughput analyses, it is important to select a microtiter
plate reader that will accommodate the rigors of analysis. An instrument that has two
features: a tungsten and mercury or deuterium lamp as a light source, permitting assays
at both UV and visible wavelengths is recommended. The instrument should also utilize
interchangeable filter wheels or a diffraction grating to permit tuning of the light source.
If a filter wheel is used, it is important to purchase a filter wheel with a fairly narrow
bandpass (typically, a bandpass range of 10 to 20 nm; a wider bandpass may result in
overlap with unbound Coomassie brilliant blue G-250 dye (CBBG) in the Bradford assayor the copper reagent in the BCA assay). Interference filters are more expensive than
simple glass filters, but have a narrower bandpass. For the BCA assay, it is desirable
to have a short time between each sample reading. Ideally, all 96 wells in the plate
should be read in ≤2 min. Any polystyrene untreated flat-bottomed microplate should
be acceptable. Suppliers include BD Falcon, Corning Costar, and Whatman.

7/21/2019 Assays for Determination of Protein UNIT 3.4 ConcentrationampleUnit
http://slidepdf.com/reader/full/assays-for-determination-of-protein-unit-34-concentrationampleunit 5/29
Detection andAssay Methods
3.4.5
Current Protocols in Protein Science Supplement 48
Table 3.4.1 Concentration Limits of Chemicals in Protein Assaysa
Substanceb Concentration limits
Enhanced
copper c BCAd Dyee UV f
280 nm 205 nm
Acids and bases
HCl 0.1 M 0.1 M >1 M 0.5 M
NaOH 0.1 M 0.1 M >1 M 25 mM
PCA <1.25% <1% 10% 1 M
TCA <1.25% <1% 10% <1%
Buffers
Acetate 0.2 M 0.6 M 0.1 M 10 mM
Ammonium sulfate >28 mM 20% 1 M >50% 9%
Borate 10 mM >100 mM
Citrate 2.5 mM <1 mM 50 mM 5% <10 mM
Glycine 2.5 mM 1 M 0.1 M 1 M 5 mM
HEPES 2.5 µ M 100 µ M 100 mM <20 mM
Phosphate 250 mM 250 mM 2 M 1 M 50 mM
Tris 250 mM 0.1 M 2 M 0.5 M 40 mM
Detergents
Brij 35 1% 1% 1%
CHAPS 1% 10% <0.1%
Deoxycholate 625 µ g/ml 0.25% 0.30% 0.1%
Digitonin 10%
Lubrol PX 1% 10%
Octylglucoside 1% 10%
SDS 1.25% 1% 0.10% 0.10% 0.10%
Triton X-100 0.25% 1% 0.10% 0.02% <0.01%
Triton X-100(R) >10% 2%
Tween 20 0.10% 1% 0.30% 0.1%
Reductants
Dithiothreitol 50 µ M <1 mM 1 M 3 mM 0.1 mM
2-Mercaptoethanol 1.8 µ M <1% 1 M 10 mM <10 mM
Miscellaneous
DNA/RNA 0.2 mg 0.1 mg 0.25 mg 1 µ g
DMSO >6.2% 5% 20% <10%EDTA 125 µ M 10 mM 0.1 M 30 mM 0.2 mM
Glycerol 25% 10% 100% 40% 5%
KCl 30 mM <10 mM 1 M 100 mM 50 mM
continued

7/21/2019 Assays for Determination of Protein UNIT 3.4 ConcentrationampleUnit
http://slidepdf.com/reader/full/assays-for-determination-of-protein-unit-34-concentrationampleunit 6/29
Assays forDetermination of
ProteinConcentration
3.4.6
Supplement 48 Current Protocols in Protein Science
Table 3.4.1 Concentration Limits of Chemicals in Protein Assaysa, continued
Substanceb Concentration limits
Enhanced
copper c BCAd Dyee UV f
280 nm 205 nm
NaCl 1.75 M 1 M 5 M >1 M 0.6 M
Sucrose 50 mM 40% 1 M 2 M 0.5 M
Urea >200 mM 3 M 6 M >1 M <0.1 M
aThis table is a general guide.Figuresprecededby (<) o r (>) symbols indicate that thetolerable limitfor the chemical is unknown
but is, respectively, less than or greater than the amount shown. Blank spaces indicate that data were unavailable. Reproduced
with permission from Stoscheck (1990).bAbbreviations: PCA, perchloric acid; TCA, trichloroacetic acid; CHAPS, 3-[(3-cholamidopropyl)dimethylammonio]-1-
propanesulfonate; EDTA, ethylenediamine tetraacetic acid; HEPES, 4-(2-hydroxyethyl)-1-piperazineethanesulfonic acid; SDS,
sodium dodecyl sulfate R, reduced; DMSO, dimethyl sulfoxide.cFigures indicate the final concentration of the chemical in the assay.d Figures indicate the concentration of the chemical in a 50-µl sample.eFigures indicate the concentration of the chemical in a 25-µl sample.
f Figures indicate the concentration of the chemical that does not produce an absorbance of 0.5 over water.
BASIC PROTOCOL 1
THE LOWRY ASSAY
The Lowry method (Lowry et al., 1951) relies on two different reactions. The first reaction
is the formation of a copper ion complex with amide bonds, forming reduced copper in
alkaline solutions. This is called a Biuret chromophore and is commonly stabilized by
the addition of tartrate (Gornall et al., 1949). The second reaction is reduction of the
Folin-Ciocalteu reagent (phosphomolybdate and phosphotungstate), primarily by the
reduced copper-amide bond complex as well as by tyrosine and tryptophan residues. The
reduced Folin-Ciocalteu reagent is blue and thus detectable with a spectrophotometer
in the range of 500 to 750 nm. The Biuret reaction itself is not very sensitive. Using
the Folin-Ciocalteu reagent to detect reduced copper makes the Lowry assay nearly 100
times more sensitive than the Biuret reaction alone. Several useful modifications of the
original Lowry assay have been developed to increase the dynamic range of the assay
over a wider protein concentration (Hartree, 1972), to make the assay less sensitive to
interference by detergents (Dulley and Grieve, 1975), and to first precipitate the proteins
to remove interfering contaminants (Bensadoun and Weinstein, 1976).
The Lowry assay is relatively sensitive, but requires more time than other assays and is
susceptible to many interfering compounds (Table 3.4.1). The following substances are
known to interfere with the Lowry assay: detergents, carbohydrates, glycerol, Tricine,
EDTA, Tris, potassium compounds, sulfhydryl compounds, disulfide compounds, most
phenols, uric acid, guanine, xanthine, magnesium, and calcium. Many of these interfering
substances are commonly used in buffers for preparing proteins or in cell extracts. This is
one of the major limitations of the assay. The Lowry assay is also sensitive to variations
in the content of tyrosine and tryptophan residues, a trait shared with the ultraviolet assay
at 280 nm (see Basic Protool 4). The assay is linear over the range of 1 to 100 µ g protein
(Fig. 3.4.2). The absorbance can be read in the region of 500 to 750 nm, with 660 nm
being the most commonly employed. Other wavelengths can also be used, however, and
may reduce the effects of contamination (e.g., chlorophyll in plant samples interferes at
660 nm, but not at 750 nm). Also, if the A660 values are low, sensitivity can be increased
by rereading the samples at 750 nm. A typical Lowry assay standard curve is depicted in
Figure 3.4.2 and a typical assay spreadsheet is listed in Table 3.4.2.

7/21/2019 Assays for Determination of Protein UNIT 3.4 ConcentrationampleUnit
http://slidepdf.com/reader/full/assays-for-determination-of-protein-unit-34-concentrationampleunit 7/29
Detection andAssay Methods
3.4.7
Current Protocols in Protein Science Supplement 48
Figure 3.4.2 A sample Lowry protein assay standard curve produced using BSA at triplicatepoints of 0, 10, 20, 30, 40, and 50 µ g. The data are fit with a linear regression by the line y =
153.06x + 0.179 with an R2 value of 0.992. The data table used to generate the figure and
depiction of a typical Lowry assay is shown in Table 3.4.2.
Materials
1 mg/ml protein standard (e.g., BSA, albumin, or γ-globulin; see SupportProtocol 1)
Sample
Lowry assay mix (see recipe)
Freshly prepared diluted Folin-Ciocalteu reagent (see recipe)
Test tubes (e.g., 16 × 125–mm)Spectrophotometer warmed up and set to 660 nm (or other appropriate wavelength)
and cuvette
1. Prepare standards containing a range of 1 to 100 µ g protein (e.g., albumin or γ-
globulin) to a volume of 1 ml (see Support Protocol 1 for information on standard
curve preparation).
2. Add sample to water in a 16 × 125–mm test tube to yield a final volume of 1 ml.
Also include two separate tubes containing water for water blanks. Additionally, use
buffer blanks if necessary (see Spectrophotometry for more detail).
3. To each tube, add 5 ml of freshly prepared Lowry assay mix and thoroughly
vortex.4. Incubate tubes 10 min at room temperature.
5. Add 0.5 ml of diluted Folin-Ciocalteu reagent to each tube and vortex
immediately.
6. Incubate 30 min at room temperature.

7/21/2019 Assays for Determination of Protein UNIT 3.4 ConcentrationampleUnit
http://slidepdf.com/reader/full/assays-for-determination-of-protein-unit-34-concentrationampleunit 8/29
Assays forDetermination of
ProteinConcentration
3.4.8
Supplement 48 Current Protocols in Protein Science
Table 3.4.2 Typical Layout of a Lowry Assay and Dataa
Standard
1 mg/ml
standard (µ l) H2O (µ l)
Assay mix
(ml)
Diluted
Folin-Ciocalteu
reagent (ml)
BSA (µ g) A660
0 1000 5 0.5 0 0
0 1000 5 0.5 0 0.009
0 1000 5 0.5 0 −0.003
10 990 5 0.5 10 0.062
10 990 5 0.5 10 0.064
10 990 5 0.5 10 0.077
20 980 5 0.5 20 0.125
20 980 5 0.5 20 0.127
20 980 5 0.5 20 0.136
30 970 5 0.5 30 0.172
30 970 5 0.5 30 0.193
30 970 5 0.5 30 0.20140 960 5 0.5 40 0.25
40 960 5 0.5 40 0.265
40 960 5 0.5 40 0.242
50 950 5 0.5 50 0.344
50 950 5 0.5 50 0.321
50 950 5 0.5 50 0.334
Equation 1: [µ g protein] = (153.06 × A660) + 0.179
Unknowns
Unknown (µ l) H2O (µ l) Assay mix
(ml)
Diluted
Folin-Ciocalteureagent (ml)
A660
Protein (µ g)
from Eqn. 1
1 999 5 0.5
1 999 5 0.5
5 995 5 0.5
5 995 5 0.5
20 980 5 0.5
20 980 5 0.5
aTypical layout of a Lowry assay and data used to create the sample standard curve shown in Figures 3.4.2 and 3.4.6.
The volumes of unknown used are typical amounts required to be within the dynamic range of the assay.
7. Vortex the tubes, zero the spectrophotometer with the blank, and measure absorbance
at 660 nm (or other appropriate wavelength).
The absorbance will not change significantly if all the samples are read at the sametime. The Lowry assay is not an endpoint assay, so samples will change in absorbance if too much time elapses between sample readings. The typical time that elapses during the
reading of samples (<10 min) does not usuallyresult in significant changes in absorbance.
8. Refer to Support Protocol 1 for data analysis.

7/21/2019 Assays for Determination of Protein UNIT 3.4 ConcentrationampleUnit
http://slidepdf.com/reader/full/assays-for-determination-of-protein-unit-34-concentrationampleunit 9/29
Detection andAssay Methods
3.4.9
Current Protocols in Protein Science Supplement 48
BASIC
PROTOCOL 2
THE BRADFORD ASSAY
The Bradford assay (Bradford et al., 1976) is a popular protein assay because it is simple,
rapid, inexpensive, and sensitive. The Bradford assay is based on the direct binding of
Coomassie brilliant blue G-250 dye (CBBG) to proteins at arginine, tryptophan, tyrosine,
histidine, and phenylalanine residues. The assay primarily responds to arginine residues
(eight times as much as the other listed residues), therefore, if the sample is rich in
arginines (e.g., histone), it may be necessary to use an arginine-rich standard as well.
Anionic CBBG binds to these residues producing an absorbance maximum at 595 nm,
whereas the free dye in solution has an absorbance maximum at 470 nm (Fig. 3.4.3).
The assay is monitored at 595 nm in a spectrophotometer, and thus measures the CBBG
complex with the protein, which results in an absorption peak shift.
The absorption spectra of the bound and free dye overlap and cause the Bradford assay to
respond nonlinearly to protein concentration, conflicting with a common misconception
that the response is linear with respect to protein concentration. However, when a standard
curve is performed, a second-order curve will fit the data more accurately than a linear
fit (Fig. 3.4.4). Since the data will be analyzed with software that is capable of fitting
second-order curves, there is no reason not to use an appropriate curve fit to the standards.
One crucial aspect of this assay is the buffer blank (see Spectrophotometry). Since the
assay responds nonlinearly to protein concentration, it is important to be certain about the
zero point. Because this point is so important to the curve fit, it is highly recommendedthat at least two buffer blanks be included. If it is determined that interference is not
occurring, as is the usual case, proceed to use the water blank. The water and buffer
blanks will have a relatively high absorbance, therefore, zeroing the spectrophotometer
with air is recommended. This will produce an A595 of ∼0.5 for the blank. However, to
zero the spectrophotometer with the blank would force the spectrophotometer to subtract
Figure 3.4.3 Absorbance spectra of the Bradford reagent and the Bradford reagent bound to
20 µ g of BSA standard. The free reagent (solid line) has an absorbance peak of 470 nm whereas
the Bradford reagent complexed with protein (dashed line) has an absorbance peak near 600 nm.
Note that the unbound dye partially overlaps with the bound form of the reagent and thus leads to
the nonlinear response of the Bradford assay.

7/21/2019 Assays for Determination of Protein UNIT 3.4 ConcentrationampleUnit
http://slidepdf.com/reader/full/assays-for-determination-of-protein-unit-34-concentrationampleunit 10/29
Assays forDetermination of
ProteinConcentration
3.4.10
Supplement 48 Current Protocols in Protein Science
Figure 3.4.4 A sample micro-Bradford assay standard curve. BSA standard was added in tripli-cate at 0, 0.25, 1.25, 2.5, 5, 7.5, and 10 µ g. Note that the assay does not respond linearly to the
concentration of standard. The data is fit with the equation y = 4.5898x 2 + 14.424x − 10.694 and
has an R2 value of 0.9979. The data table used to generate the figure and depiction of a typical
micro-Bradford assay is shown in Table 3.4.3.
a very large amount from every sample read. An absorbance of 0.5 is equivalent to only
31% of the light being transmitted by the reagent blank. This will tend to produce error
and imprecision into the sample readings especially at high protein concentration. By
zeroing against air, less noise occurs in the readings and A595 values stay below 2.0, a
common upper limit for absorbance values (see Spectrophotometry).
The choice of standard protein for this assay is important to the success of the assay. Manyinvestigators have noted abnormalities of using various standards with the Bradford assay.
Bovine serum albumin (BSA) was the original standard of choice, and is the standard that
most likely comes with the assay if purchased as a kit. However, it has been noted that
BSA has a significantly higher than “normal” response in the assay (e.g., Stoscheck, 1990)
and may not always be suitable. Several researchers, therefore, use immunoglobulin G
(IgG) or lysozyme as the preferred standard for the assay, but other standards may be
appropriate depending on the particular sample protein.
The CBBG dye used in the assay strongly binds to quartz cuvettes. Therefore, glass or
plastic cuvettes should be utilized. It is convenient to use disposable plastic cuvettes,
making cleanup much easier. Using a single cuvette for all the samples is recommended,
as plastic cuvettes are not constructed with the same precision as quartz or glass cuvettes.By using a single microcuvette and maintaining its orientation in the sample holder, this
eliminates one potential source error from the system. For the 1-ml micro-Bradford assay,
after taking an A595 reading, the contents are aspirated and 0.1 ml of the next sample is
used to wash the cuvette. The cuvette is again aspirated and the remaining 0.9 ml of the
next sample is added to the cuvette for A595 determination.
There are two major formats of this assay, each with a different detection range. The
micro-assay format is designed for protein concentrations between 1 and 20 µ g. The
macro-assay format is designed for protein concentrations in the range of 20 to 100 µ g.
7/21/2019 Assays for Determination of Protein UNIT 3.4 ConcentrationampleUnit
http://slidepdf.com/reader/full/assays-for-determination-of-protein-unit-34-concentrationampleunit 11/29
Detection andAssay Methods
3.4.11
Current Protocols in Protein Science Supplement 48
It is generally more convenient to use the micro-assay format because it uses less of
the sample. The micro-assay format also results in less chemical waste and allows the
concentrate to be used for more assays. The assay can also be carried out in a microwell
plate, which is a very convenient way to process a large number of samples rapidly (see
High-Throughput Adaptations).
Some proteins, especially hydrophobic, membrane or “sticky” proteins tend to precipitate
in the presence of CBBG and will appear as dark-blue clumps after the Bradford reagent
has been added. Precipitation of the sample causes light scattering and incorrect reporting
of absorbance. If there is formation of precipitate when the dye reagent is added to thesample, add a small amount of sodium hydroxide to help solubilize the protein (see steps
3a and 3b below).
It is commonly stated that detergent or surfactant-containing samples are not compatible
with the Bradford assay. It is common to lyse bacterial cultures in a proprietary surfactant
solution such as BugBuster (Novagen). The authors have found that the amount of
surfactant in extracts prepared with 100 µ l BugBuster for pelleted cells from a 5-ml
culture is sufficiently small that it does not interfere with the Bradford assay. Extracts
containing 0.5 to 4 mg/ml protein require <10 µ l of sample in a 1-ml total assay volume.
A typical standard curve for the micro-Bradford assay is depicted in Figure 3.4.4 and a
typical micro-Bradford assay spreadsheet is shown in Table 3.4.3.
Materials
1 mg/ml protein standard (e.g., BSA, albumin, or γ-globulin; see SupportProtocol 1)
Protein sample
1 M NaOH (optional)
Bradford reagent (see recipe)
Spectrophotometer warmed up at least 15 min before use and set to 595 nm, andcuvette
Test tubes (e.g., 10 × 75–mm for the micro assay or 17 × 100–mm for the macroassay)
Micro-Bradford assay
1a. Prepare standards containing a range of 1 to 20 µ g protein (e.g., albumin or γ-
globulin) to a volume of 800 µ l (to a volume of 700 µ l if adding 1 M NaOH). See
Support Protocol 1 for information on standard curve preparation.
Table 3.4.3 contains detailed information for preparing a typical Bradford assay with thestand curve results depicted in Figure 3.4.4.
2a. Add sample to water in a final volume of 800 µ l (700 µ l if adding 1 M NaOH).
3a. Optional: Add 100 µ l of 1 M NaOH to each sample and vortex.
NaOH is added to ensure that the sample does not precipitate upon addition of Bradford
reagent in step 4a. If a sample (not containing NaOH) precipitates upon addition of
Bradford reagent then a new sample must be prepared since addition of NaOH after precipitation will not cause it to dissolve. NaOH should thus be added to the new sample
prior to addition of Bradford reagent.
4a. Add 200 µ l Bradford reagent, vortex, and incubate 5 min at room temperature.
The Bradford assay is an endpoint assay, therefore, absorbance readings will not change
significantly over time.
5a. Record blank, vortex samples again, and measure the absorbance at 595 nm.
6a. Refer to Support Protocol 1 for information on data processing.

7/21/2019 Assays for Determination of Protein UNIT 3.4 ConcentrationampleUnit
http://slidepdf.com/reader/full/assays-for-determination-of-protein-unit-34-concentrationampleunit 12/29
Assays forDetermination of
ProteinConcentration
3.4.12
Supplement 48 Current Protocols in Protein Science
Table 3.4.3 Typical Layout for a Micro-Bradford Assay and Dataa
Standard
1 mg/ml
standard (µ l) H2O (µ l) 1 M NaOH (µ l)
Bradford
reagent (µ l) BSA (µ g) A595
0 700 100 200 0 0.603
0 700 100 200 0 0.603
0 700 100 200 0 0.613
1 699 100 200 1 0.675
1 699 100 200 1 0.664
1 699 100 200 1 0.662
5 695 100 200 5 0.9
5 695 100 200 5 0.878
5 695 100 200 5 0.883
10 690 100 200 10 1.069
10 690 100 200 10 1.062
10 690 100 200 10 1.062
15 685 100 200 15 1.254
15 685 100 200 15 1.257
15 685 100 200 15 1.279
20 680 100 200 20 1.443
20 680 100 200 20 1.444
20 680 100 200 20 1.43
25 675 100 200 25 1.651
25 675 100 200 25 1.631
25 675 100 200 25 1.638
Equation 2: [µ g protein] = (4.5898 × A5952) + (14.424 × A595) − 10.694
Unknowns
Unknown (µ l) H2O (µ l) 1 M NaOH (µ l) Bradford
reagent (µ l) A595
Protein (µ g)
from Eqn. 2
1 699 100 200
1 699 100 200
5 695 100 200
5 695 100 200
20 680 100 200
20 680 100 200
aTypical layout for a micro-Bradford assay and the data used to create the sample standard curve in Figure 3.4.4. Thevolumes of unknown used are typical amounts required to be within the dynamic range of the assay.
Macro-Bradford assay
1b. Prepare standards containing a range of 20 to 200 µ g protein (e.g., albumin or γ-
globulin) in a standard volume (generally ≤1 ml). Refer to Support Protocol 1 for
information on standard curves.
2b. Dilute unknowns to an estimated concentration of 20 to 200 µ g protein per tube in a
same volume as the standards.
7/21/2019 Assays for Determination of Protein UNIT 3.4 ConcentrationampleUnit
http://slidepdf.com/reader/full/assays-for-determination-of-protein-unit-34-concentrationampleunit 13/29
Detection andAssay Methods
3.4.13
Current Protocols in Protein Science Supplement 48
3b. Optional: Add 0.25 ml of 1 M NaOH to each sample and vortex.
NaOH is added to ensure that the sample does not precipitate upon addition of Bradford reagent in step 4a. If a sample (not containing NaOH) precipitates upon addition of
Bradford reagent then a new sample must be prepared since addition of NaOH after precipitation will not cause it to dissolve. NaOH should thus be added to the new sample
prior to addition of Bradford reagent.
4b. Add 5 ml Bradford reagent, vortex, and incubate 5 min at room temperature.
5b. Record blank, vortex samples again, and measure the absorbance at 595 nm.
6b. Refer to Support Protocol 1 for information on data processing.
ALTERNATE
PROTOCOL 1
MICROTITER PLATE BRADFORD
For microtiter plate–based Bradford assays, it is recommended that a commercial reagent
be considered. The authors find that, due to the small volume, any precipitates that may
be in a laboratory prepared reagent will interfere with the determination. A laboratory
prepared reagent must be filtered before use. The reagent should be pipetted from the
top of the solution to avoid interference from precipitates that may be found at the
bottom. The microtiter plate assay version is more prone to protein precipitation due to
the higher concentration of dye. Even if the protein sample does not precipitate in the
regular Bradford assay, it should again be verifed that the protein is not precipitating in
this assay format. If protein sample precipitation is observed, add a small volume of 1 MNaOH (see step 2) to solubilize the protein.
Materials
Sample
1 mg/ml protein standard (e.g., BSA; see Support Protocol 1)
Bradford reagent (see recipe)
1 M NaOH
Microtiter plate (see Strategic Planning)
Multichannel pipettor or repeating pipettor, optional
Microtiter plate reader (see Strategic Planning)
1. Prepare unknowns and standards in a final volume of 160 µ l.
If protein solubility is an issue in the presence of the Bradford reagent reduce samplevolume to 140 µl to accommodate addition of NaOH in step 2.
2. Optional: Add 20 µ l of 1 M NaOH.
NaOH is added to ensure that the sample does not precipitate upon addition of Bradford
reagent in step 4a. If a sample (not containing NaOH) precipitates upon addition of Bradford reagent then a new sample must be prepared since addition of NaOH after
precipitation will not cause it to dissolve. NaOH should thus be added to the new sample prior to addition of Bradford reagent.
3. Add 40 µ l of Bradford reagent to each well of a microtiter plate and carefully mix.
Using a multichannel pipettor facilitates mixing. If one is not available, carefully tap theside of the microtiter plate to avoid cross-contaminating wells or use a minishaker.
4. Incubate 5 min at room temperature.
If this is the first time using the microtiter plate format, carefully inspect the microtiter plate
wells on a lightbox for signs of precipitate formation. If protein precipitation is observed,add 20 µl of 1 M NaOH and reduce the final sample volume as indicated above.
5. Read samples at an appropriate wavelength (commonly 595 nm).
6. See Support Protocol 1 for information on data processing.

7/21/2019 Assays for Determination of Protein UNIT 3.4 ConcentrationampleUnit
http://slidepdf.com/reader/full/assays-for-determination-of-protein-unit-34-concentrationampleunit 14/29
Assays forDetermination of
ProteinConcentration
3.4.14
Supplement 48 Current Protocols in Protein Science
BASIC
PROTOCOL 3
BCA ASSAY
The BCA assay (Smith et al., 1985) measures the formation of Cu+ from Cu2+ by
the Biuret complex in alkaline solutions of protein using bicinchoninic acid (BCA).
Originally, the mechanism of the BCA assay was thought to be similar to the Lowry
assay, but it is now known that there are two distinct reactions that take place with copper
ions unique to the BCA assay (Wiechelman et al., 1988). The first reaction occurs at
lower temperatures and is the result of the interaction of copper and BCA with cysteine,
cystine, tryptophan, and tyrosine residues in the protein. At elevated temperatures, the
peptide bond also is responsible for color development. Hence, performing the assay at
37◦C or 60◦C versus room temperature increases the sensitivity and reduces the variation
in the response of the assay as a function of protein composition. When possible, the
assay should be incubated at 60◦C since, after the reaction is complete, the absorbance
does not increase appreciably, whereas after cooling samples incubated at 37◦C to room
temperature, the blank continues to increase in absorbance at ∼2.3% every 10 min.
The BCA reagent replaces the Folin-Ciocalteu reagent in the Lowry assay. The BCA
reagent forms a complex with Cu+, which has a strong absorbance at 562 nm. BCA is
advantageous in that it does not interact with as many contaminants and buffer compo-
nents as the Folin-Ciocalteu reagent, especially detergents. Components that interfere
with the BCA assay either lead to reduction of Cu2+ (e.g., DTT) or copper chelators
(e.g., EGTA). Generally, these are not critical components of buffers and can be easily
removed or omitted prior to the assay.
Note that there are two variations of the assay. The micro-based assay requires three
reagents, whereas the test tube protocol requires only two reagents. The micro-based
assay reagents are at a significantly higher concentration than the macro-based assay
reagents. To prevent precipitation of BCA, it is prepared as a separate reagent in the
micro-based format. It is important to use the correct reagent mixtures and ratios for the
Figure 3.4.5 A sample micro-BCA assay standard curve with triplicate BSA standard points of
0, 0.625, 3.125, 6.25, 12.5, and 18.75 µ g. Note that the curve is linear across a wide range and
is fit with the equation y = 10.571x − 2.0254 and has a R2 value of 0.9893. The data table used
to generate the figure and depiction of a typical micro-BCA assay is shown in Table 3.4.4.

7/21/2019 Assays for Determination of Protein UNIT 3.4 ConcentrationampleUnit
http://slidepdf.com/reader/full/assays-for-determination-of-protein-unit-34-concentrationampleunit 15/29
Detection andAssay Methods
3.4.15
Current Protocols in Protein Science Supplement 48
chosen format. In Strategic Planning, a microtiter plate adaptation of the micro-based
assay is described. A typical standard curve for the micro-BCA assay is depicted in
Figure 3.4.5 and assay setup is listed in Table 3.4.4.
Table 3.4.4 Typical Layout of a Micro-BCA Assay and Dataa
Standard
1 mg/ml
standard (µ l) H2O (µ l)
Micro-BCA
solution (µ l) BSA total (µ g) A562
0 500 500 0 0.149
0 500 500 0 0.153
0 500 500 0 0.151
0.5 499.5 500 0.5 0.179
0.5 499.5 500 0.5 0.187
0.5 499.5 500 0.5 0.179
2.5 497.5 500 2.5 0.433
2.5 497.5 500 2.5 0.4512.5 497.5 500 2.5 0.445
5 495 500 5 0.744
5 495 500 5 0.700
5 495 500 5 0.738
10 490 500 10 1.228
10 490 500 10 1.209
10 490 500 10 1.226
15 485 500 15 1.689
15 485 500 15 1.642
15 485 500 15 1.651
20 480 500 20 1.988
20 480 500 20 1.913
20 480 500 20 2.009
Equation 3: [µ g protein] = (10.571 × A562) − 2.0254
Unknowns
Unknown (µ l) H2O (µ l) Assay mix (ml) A562Protein (µ g)
from Eqn. 3
1 499 500
1 499 5005 495 500
5 495 500
20 480 500
20 480 500
aTypical layout of a micro-BCA assay and the data used to create the sample standard curve in Figure 3.4.5.
The volumes of unknown used are typical amounts required to be within the dynamic range of the assay.

7/21/2019 Assays for Determination of Protein UNIT 3.4 ConcentrationampleUnit
http://slidepdf.com/reader/full/assays-for-determination-of-protein-unit-34-concentrationampleunit 16/29
Assays forDetermination of
ProteinConcentration
3.4.16
Supplement 48 Current Protocols in Protein Science
Materials
Macro-BCA or micro-BCA assay solution (see recipes)
Samples
1 mg/ml standard proteins (e.g., BSA, albumin, or γ-globulin; see SupportProtocol 1)
Test tubes (e.g., 10 × 75–mm for micro-BCA assay or 13 × 100–mm for macro-BCA assay)
Spectrophotometer warmed up and set to 562 nm, and cuvette
60◦
C (or 37◦
C) heating block or water bath
Micro-BCA assay (1-ml)
1a. Prepare fresh micro-BCA assay solution. Set up test tubes (e.g., 10 × 75–mm)
containing samples and known amounts of standard protein in the range of 0.5 to
20 µ g with each final sample volume of 500 µ l. Refer to Support Protocol 1 for
information on preparation of a standard curve.
2a. Add 500 µ l of micro-BCA assay solution to each tube, vortex, and incubate the
sample 15 min at 60◦C.
Alternatively, incubate 1 hr at 37 ◦C, although, in practice, a 60◦C incubation will yield more consistent results.
3a. Cool samples to room temperature.
Note that this is extremely important. The simplest method is to put the test-tube rack intoa pan containing room temperature water.
4a. Vortex samples and read absorbance at 562 nm.
5a. Refer to Support Protocol 1 for information on data processing.
Macro-BCA assay (2.1-ml)
1b. Prepare fresh macro-BCA assay solution.
2b. Set up 13× 100–mm test tubes containing samples and known amounts of standard
protein in the range of 0 to 100 µ g in a total tube volume of 0.1 ml.
3b. Add 2.0 ml macro-BCA assay solution to each tube and vortex.
4b. Incubate tubes 15 min at 60◦C.
Alternatively, incubate tubes 30 min at 37 ◦C.
5b. Cool the tubes to room temperature.
6b. Vortex samples and read the absorbance at 562 nm.
7b. Refer to Support Protocol 1 for information on data processing.
ALTERNATE
PROTOCOL 2
MICROTITER PLATE BCA ASSAY
The microtiter plate BCA assay is based on the micro-BCA assay (see Basic Protocol 3)
and utilizes the same reagents. This protocol results in a final volume of 250 µ l and in the
authors’ experience, works with most commercially available microtiter plates, but oc-
casionally, some plates cannot accommodate 250 µ l without well-to-well contamination.
In this case, reducing the volume of reagents may help, but may result in a narrowing of
the detection range. For the microtiter plate–based assay, incubating for 15 min at 60◦C
and cooling the plate to room temperature prior to reading the plate is recommended.
Some microtiter plate readers can do this entire operation automatically.

7/21/2019 Assays for Determination of Protein UNIT 3.4 ConcentrationampleUnit
http://slidepdf.com/reader/full/assays-for-determination-of-protein-unit-34-concentrationampleunit 17/29
Detection andAssay Methods
3.4.17
Current Protocols in Protein Science Supplement 48
Materials
Micro-BCA working solution (see recipe)
1 mg/ml protein standard (e.g., BSA; see Support Protocol 1)
Microtiter plate(s) (BD Falcon 353915; Costar 3370; Whatman 7701-1350)
Microtiter plate reader, warmed up and ready to read at 562 nm
60◦C (or 37◦C) oven or water bath
1. Prepare sufficient micro-BCA working solution for all assays—prepare ∼15% to
20% extra to account for waste and to avoid running out.
2. Prepare standards and unknowns each in a 125-µ l final volume in individual wells
of the microtiter plate.
3. Add 125 µ l of micro-BCA working solution to each well and gently mix by tapping
the side of the microtiter plate or using a minishaker
4. Incubate 15 min at 60◦C.
Alternatively, incubate 30 min at 37 ◦C, but the absorbance will continue to increase at
2.3% per 10 min)
5. Cool plate to room temperature.
6. Gently mix by tapping the side of the plate or by using a minishaker and read
absorbance at 562 nm.
BASIC
PROTOCOL 4
UV ABSORBANCE TO MEASURE PROTEIN CONCENTRATION
The use of ultraviolet absorbance to measure protein concentration is perhaps the most
simple and quick method, but also the most likely to produce inaccurate results. Deter-
mination of protein concentration by ultraviolet absorption, usually at 280 nm, depends
on the presence of aromatic amino acids in proteins. Tyrosine and tryptophan absorb at
∼280 nm, whereas phenylalanine has a peak of absorbance at ∼260 nm. Higher orders
of protein structure may also modify the molar absorptivities of tyrosine and tryptophan
and thus the UV detection is sensitive to pH and ionic strength.
Unless the protein sample is pure and its extinction coefficient is known, UV determi-nation of protein concentration will invariably be significantly in error. This protocol is
included here because it is extremely useful for making quick and rough estimates of
protein concentration before proceeding to a more accurate assay such as those listed
above. A useful equation (Layne, 1957) for approximate concentration determination
using UV absorbance is as follows:
[protein] (mg/ml) = (1.55 × A280) – (0.76 × A260)
This equation is not sufficiently accurate for routine biochemical calculations.
Many other cellular components, particularly nucleic acids, also absorb UV light. Al-
though different proteins will have different amino acid compositions and thus different
molar absorptivities, this method can be very accurate when comparing different solutionsof the same protein.
Glass and polystyrene cuvettes absorb UV light, therefore, quartz cuvettes should be
used. Methacrylate plastic cuvettes are also available, which transmit ∼60% of 280-nm
light and it is possible to zero spectrophotometers with them and acquire absorbance
readings. Methacrylate cuvettes are significantly less expensive than quartz cuvettes and
may be a good alternative in environments where cuvette breakage is a concern (e.g.,
teaching laboratories).

7/21/2019 Assays for Determination of Protein UNIT 3.4 ConcentrationampleUnit
http://slidepdf.com/reader/full/assays-for-determination-of-protein-unit-34-concentrationampleunit 18/29
Assays forDetermination of
ProteinConcentration
3.4.18
Supplement 48 Current Protocols in Protein Science
This method is the least sensitive of the methods presented in this unit. For increased
sensitivity, the wavelength can be altered to a range of 210 to 225 nm (Stoscheck, 1990).
This measures the amide bonds in proteins and is often the wavelength range used for
measuring absorbance of HPLC column fractions. However, it is much more subject
to interference from many more biological components and compounds used to make
buffer solutions.
If using a pure protein with a known extinction coefficient (ε), it is possible to directly
determine the concentration from the measured A280. The extinction coefficients for many
proteins have been published (Fasman, 1989). Because of the different mole fractionsof tyrosine and tryptophan residues in different proteins, their extinction coefficients
can be very different. An example of the difference in extinction coefficient at 280 nm
between proteins having different amino acid compositions is as follows: consider the
following ε1% values (Fasman, 1989) for horse liver alcohol dehydrogenase, 4.2 to 4.5;
bovine serum albumin, 6.3 to 6.8; rabbit IgG, 13.5 to 14.6; and egg white lysozyme, 24.7
to 27.2. Most protein extinction coefficients are not expressed as εmolar (M−1 cm−1) as
is usual for most biomolecules, but rather as ε1% (%−1 cm−1). The ε1% is defined as
the A280 value of a 1% solution (1 g/100 ml) of the protein. It is necessary to be aware
of this difference when calculating the amount of protein from A280 values. Using the
molar absorptivity, A280 / εmolar produces a concentration in molar terms. Using the per-
cent absorptivity, A280 / ε1% produces a concentration in percent. When using the percent
absorptivity, it is common to use the equation ( A280 / ε1%) × 10 to yield the concen-tration in units of mg/ml. If the amino acid sequence of the sample protein is known,
it is possible to calculate the theoretical extinction coefficient (Gill and von Hippel,
1989).
A procedure for determining the concentration of an unknown using UV absorbance and
a standard curve is presented here. In general, the results from this approach will also
not be accurate enough to use in downstream calculations.
Materials
Sample
Protein standard prepared in the same buffer as unknown
Sample buffer Spectrophotometer and quartz or UV-transparent cuvettes
1. To perform an ultraviolet reading at 280 nm, warm up the spectrophotometer and set
it to 280 nm.
2. Zero the spectrophotometer with a water blank.
3. Construct a standard curve (0 to 3 mg/ml) using a protein standard of choice in the
expected concentration range at 280 nm in a quartz or UV-transparent cuvette.
4. Measure the A280 of the buffer used to prepare the sample.
5. Measure the A280 of the sample. If the A280 is >2, dilute an aliquot of the sample in
the sample buffer and remeasure.
6. Calculate the protein concentration from the standard curve.
7. Refer to Support Protocol 1 for information on data processing.

7/21/2019 Assays for Determination of Protein UNIT 3.4 ConcentrationampleUnit
http://slidepdf.com/reader/full/assays-for-determination-of-protein-unit-34-concentrationampleunit 19/29
Detection andAssay Methods
3.4.19
Current Protocols in Protein Science Supplement 48
SUPPORT
PROTOCOL 1
STANDARD CURVES AND DATA PROCESSING
Standard Curves and Standard Selection
Two details must be understood about standard curves. First, they are called standard
“curves” because the response of absorbance to the amount of added protein is not
necessarily linear. Second, the range of protein concentrations chosen for the standard
curve (e.g., 0 to 25 µ g or 0 to 100 µ g) will depend on the assay employed. The A280
method (see Basic Protocol 4) is the least sensitive and requires the highest amounts
of protein in the standard curve, whereas the Bradford method (see Basic Protocol 2)
is sensitive, but not linear over a very wide range, necessitating the use of a relativelynarrow range of standard protein.
Another factor to keep in mind is that the standard curve is based on one protein (usually
BSA). The mixture of proteins in the sample may not yield identical results as the
standard, in terms of a signal as a function of protein concentration directly corresponding
to the standard chosen. While BSA, in general, is a suitable choice as a standard, it does
have limitations as a standard (see Standard Selection) and this should be kept in mind
when assaying protein samples.
One of the most often overlooked assay parameters is the generation of a standard curve
with each assay, which is known as an internal standard curve. Internal standard curves
are essential for obtaining accurate results, especially for the Lowry (see Basic Protocol
1) and BCA (see Basic Protocol 3 and Alternate Protocol 2) assays, which are non-
endpoint reactions. In the case of the Bradford assay, many procedures state that it is not
necessary to run internal standard curves with each assay. However, analysis of years of
compiled data for various Bradford assays has shown that standard curves can exhibit
significant amounts of drift, concluding that neglecting to perform an internal standard
curve may yield inaccurate results. Typically, standard curves should be run at least in
duplicate.
Sample dilution series
In addition to having unknown samples fall within the linear response range of the
standard curve, it is good practice to perform a dilution series of the unknown(s). Expect
to observe a change in the response of the unknown that follows the slope of the standardcurve. For example, if 5 and 10 µ l of the sample produce responses equivalent to 7.5 and
15 µ g of protein, respectively, confidence may be placed in the results. If the unknowns
do not change when diluted, or the response curve does not follow that of the standard
curve, assay selection and buffer compatibility may need to re-evaluated.
Standard selection
Standard selection for protein assays is critical. If the selected standard does not respond
to the assay in a manner similar to the unknowns, the magnitude of error in the assay
may be significant. The most common standards are BSA or purified-IgG proteins. A
review by Stoscheck (1990) describes how differently these two proteins respond in all
of the assays presented in this unit. While these have become the de facto standards of
choice, there are experiments where these may not be the most appropriate standards.Unfortunately, the only way to ensure total accuracy is by standardizing any assay
procedure to quantitative amino acid analysis (UNIT 3.2).
Bovine serum albumin (BSA) is the most commonly used standard for protein assays.
BSA in no way is the perfect standard, but it has become the arbitrary standard of choice.
Serum albumins are “sticky” proteins to the extent that drug adsorption to them is a
critical factor in pharmacokinetic calculations (Mandula et al., 2006). This means that
BSA tends to bind to other proteins and molecules and, thus, it is very difficult to purchase

7/21/2019 Assays for Determination of Protein UNIT 3.4 ConcentrationampleUnit
http://slidepdf.com/reader/full/assays-for-determination-of-protein-unit-34-concentrationampleunit 20/29
Assays forDetermination of
ProteinConcentration
3.4.20
Supplement 48 Current Protocols in Protein Science
Figure 3.4.6 Data for a sample Lowry protein assay standard curve produced using BSA stan-
dard at triplicate points of 0, 10, 20, 30, 40, and 50 µ g. The data are identical to those in Figure3.4.2 except that BSA (µ g) is plotted on the x axis and A660 is plotted on the y axis. The data are
fit with a linear regression by the line y = 0.0065x + 0.0001 with an R2 value of 0.992. Note that
to use the equation to return protein concentration, the equation must be rearranged.
in a 100% pure form. These contaminants can lead to problems with any of the listed
assays due to side reactions or blocking interaction sites.
Protein standards can be purchased from most chemical suppliers in liquid form or they
may be prepared in the laboratory. Usually, a 1 to 5 mg/ml stock solution is prepared in
bulk (50 to 100 ml) to avoid variation in the concentration of standards from day to day.
When the solution is prepared, do not shake it because this will lead to denaturation of
the protein (observed as bubbles on the top of the solution), but rather gently swirl to
dissolve the BSA in water. This solution is then dispensed into smaller aliquots (1- to
5-ml) and stored at –20◦C. As with any solution, it must be mixed upon thawing because
melting solutions form an internal concentration gradient.
The best strategy for preparing a standard curve dilution series is to prepare the standard
as a 1 to 5 mg/ml stock in water and prior to the assay, dilute the stock in the same buffer
as the unknowns—including a buffer blank. This strategy will provide the most accurate
result, because the effects of the buffer are accounted for in the standard curve. It is
also possible to prepare a standard curve dilution series in water and use a buffer blank,
however, the buffer used in the unknowns should be fully compatible with the assay.
Placing absorbance on the x axis during data processingPresented here is a hypothetical example that illustrates why it is more convenient to use
the y axis for protein concentration. Consider the data used to generate Figure 3.4.2 and
listed in Table 3.4.2. If this data is plotted with the protein (µ g) data on the x axis, the
standard curve has a curve fit line with the equation y = 0.0065 x + 0.0001 (Fig. 3.4.6).
The x values are micrograms of protein and the y values are A590. Thus, the equation can
be rewritten as follows to be more intuitive:
[ A590] = 0.0065 x [µ g protein] + 0.0001

7/21/2019 Assays for Determination of Protein UNIT 3.4 ConcentrationampleUnit
http://slidepdf.com/reader/full/assays-for-determination-of-protein-unit-34-concentrationampleunit 21/29
Detection andAssay Methods
3.4.21
Current Protocols in Protein Science Supplement 48
The measurement taken is the absorbance of the sample, therefore, to calculate the
micrograms of protein in the unknown sample, the equation is rearranged as follows:
[µ g protein] = ([ A590] – 0.0001)/0.0065
While not a difficult rearrangement, it could introduce errors into the calculation of the
amount of protein by an inexperienced laboratory worker.
Now consider the same data, rearranged so that the protein (µ g) data is on the y axis as
in Figure 3.4.2. A linear fit of this data produces the equation y = 153.06 x + 0.179. The
x values this time are A590, whereas the y values are micrograms of protein. Thus, theequation becomes
[µ g protein] = (153.06 × [ A590]) + 0.179
Now the equation need not be rearranged before use. The advantage of plotting standard
curves with the protein amounts on the y axis is especially apparent when using a
nonlinear fit as with the Bradford assay (Fig. 3.4.4). In the case where a spreadsheet is
being used to calculate standard curve and experimental data, the line-fit equation can be
directly copied from the graph and pasted into the spreadsheet formula, thus simplifying
the entire process of analyzing data.
Considerations for Processing Data with Spreadsheet SoftwareThere are numerous spreadsheet software packages that can be used for processing data
from a standard curve. Some general considerations are presented here for preparing the
data using these software packages.
Standard curve generation
Standard curves should be produced using a scatter plot. When possible, plot each data
point individually (see examples in Figs. 3.4.2, 3.4.4, and 3.4.5). This will allow the curve-
fitting algorithm to fit each data point and for the curve fit to reflect the real variation in the
data points. As mentioned above, the y axis should be concentration values and the x axis
should be absorbance values, as this will allow the curve fit to directly return a function
without having to rearrange the equation. Note that many spreadsheet programs allow
calculation of a curve fit with a function in the spreadsheet from the set of standard data.For experienced users, this is a convenient shortcut and allows the production of template
spreadsheets for data analysis. For inexperienced protein assay users, it is recommended
to produce a graphical plot with a curve fit to avoid errors in data analysis and to have a
visual check that there has not been an error in entering the data.
If performing the Bradford assay, be sure to use a polynomial curve fit as the Bradford
assay is a nonlinear assay (see Fig. 3.4.4). The BCA and Lowry assays both perform
linearly, therefore, a linear curve fit is acceptable (Figs. 3.4.2 and 3.4.5).
Unknowns within standard curve range
A common error made by novices is the utilization of sample data points that do not fit
within their standard curves to extrapolate results. To make valid use of a standard curve,data points must be within the linear range of the spectrophotometer (see Spectropho-
tometry). When unknowns are compared to a standard curve in this way, it is termed
interpolation. Avoid extrapolating results in cases where no standard curve data points
are in the range of the unknown to support the value that has been determined.
Furthermore, the response range of the assay (which is listed with each assay) is consid-
erably narrower than the range of the spectrophotometer. It is generally best to have at
least two standard curve data points on either side of the results for the unknowns. This

7/21/2019 Assays for Determination of Protein UNIT 3.4 ConcentrationampleUnit
http://slidepdf.com/reader/full/assays-for-determination-of-protein-unit-34-concentrationampleunit 22/29
Assays forDetermination of
ProteinConcentration
3.4.22
Supplement 48 Current Protocols in Protein Science
may require pilot assays to ensure the addition of the proper amounts or to properly dilute
the sample into the correct range. To find the proper range, Basic Protocol 4 describes a
crude, but rapid, estimation of the protein concentration by UV spectrophotometry.
SUPPORT
PROTOCOL 2
ACETONE PRECIPITATION OF PROTEIN
Often, the easiest way to remove interfering non-proteinacious substances from protein
preparations is to precipitate the protein prior to the assay. In this case, two standard
curves should be performed. The first standard curve is prepared from a dilution series of
standards that are precipitated under similar conditions as the unknowns, and a secondstandard curve is prepared without precipitation to allow estimation of the amount of
sample lost during the precipitation. It is best to precipitate identical points on the
standard curve dilution, however, this is time consuming. Alternatively, a few select
points covering the entire range of the standard curve can be precipitated and then
compared to the results of the nonprecipitated standard points. For example, in the
Lowry assay described in Table 3.4.2 points at 10, 30, and 50 µ g of BSA would be
precipitated and compared to nonprecipitated standards in a compatible buffer. Acetone
precipitation is the easiest method and is the most compatible with downstream assays.
Materials
100% acetone, −20◦C
Protein sampleProtein assay–compatible buffer
−20◦C freezer
1.5-ml microcentrifuge tubes (acetone-compatible, not polycarbonate)
Microcentrifuge
1. Add cold 100% acetone to the protein sample to a final concentration of 80% (v/v)
(e.g., 0.2 ml diluted protein and 0.8 ml acetone) in acetone-compatible microcen-
trifuge tubes.
2. Vortex the sample vigorously.
3. Incubate 1 hr at −20◦C in an explosion-proof freezer.
4. Pellet the protein by centrifuging 20 min at 15,000 × g, 4◦C.
CAUTION: Acetone is flammable. Do not scale this precipitation up to volumes >1.5 ml.
5. Carefully decant the supernatant and dispose as organic waste, being careful not to
dislodge the pellet.
6. Dry the pellet 20 to 30 min at room temperature by inverting the tube onto a clean
paper towel or lint-free wipe. Care should be taken not to dislodge the pellet. Do not
over-dry the pellet as this may make is difficult to resuspend.
7. Resuspend the pellet in a protein assay–compatible buffer by vortexing.
SUPPORT PROTOCOL 3
TCA PRECIPITATION OF PROTEIN
Acetone precipitation (see Support Protocol 2) is the easiest method and is most compati-
ble with downstream assays, however, a large protein sample may requirean impractically
large volume to bring the concentration of acetone up to 80%. In these cases, a second
protocol utilizing trichloroacetic acid (TCA) precipitation of protein is provided. In TCA
precipitation, it is critical that excess TCA be removed before assaying the protein.
CAUTION: TCA is caustic and will burn the skin, therefore, proper precautions must be
taken when handling this reagent.

7/21/2019 Assays for Determination of Protein UNIT 3.4 ConcentrationampleUnit
http://slidepdf.com/reader/full/assays-for-determination-of-protein-unit-34-concentrationampleunit 23/29
Detection andAssay Methods
3.4.23
Current Protocols in Protein Science Supplement 48
Materials
80% (w/v) TCA
Protein sample
80% acetone, −20◦C
Protein assay–compatible buffer
−20◦C freezer
1.5-ml centrifuge tubes (acetone-compatible, not polycarbonate)
Microcentrifuge
1. Wearing gloves, add TCA to the protein sample to a final concentration of 4%.
2. Incubate 30 min on ice.
3. Centrifuge 10 min at 15,000× g, 4◦C.
4. Decant the supernatant and dispose as organic waste, being careful not to dislodge
the pellet.
5. Add an equal volume of 80% cold acetone to the pellet to wash away residual TCA.
Vortex vigorously to release the pellet from the bottom of the centrifuge tube.
6. Centrifuge 10 min at 15,000 × g, 4◦C and repeat 80% acetone wash four additional
times.
7. Dry the pellet inverted on a paper towel or lint-free wipe for 30 min being careful
not to dislodge or over-dry the pellet.
8. Resuspend the pellet in a protein assay–compatible buffer by vigorous vortexing.
ALTERNATE
PROTOCOL 3
ALKYLATION OF REDUCTANT AND BCA ASSAY OF PROTEIN SAMPLESIN SDS-PAGE LOADING BUFFER
One of the most common problems encountered when performing polyacrylamide gel
electrophoresis (PAGE; Chapter 10) and immunoblot analysis (UNITS 10.7 & 10.8) of protein
extracts is how to load equal amounts of samples for semi-quantitative comparison. All
too often researchers loadSDS-PAGE gels based on tissue weight before homogenization,
but this can lead to significant sample-to-sample variation. Also, some researchers will
stain a duplicate gel and compare one or two bands between the gels and state that they
are equally loaded. When investigating changes in protein composition between two
samples, it is preferable to load based on total protein concentration.
Many vendors now offer detergent- and reductant-compatible protein assays to quantitate
samples prior to loading of gels for electrophoretic fractionation. These assays are usually
more expensive than normal assay kits and either rely on a method similar to what
follows, or on protein precipitation prior to an assay such as the Lowry assay (e.g.,
BioRad RC/DC). One critical factor to this assay is that bromophenol blue should not
be added to the SDS-PAGE sample buffer as it may interfere. It is preferable to prepare
SDS-PAGE loading buffer as a 6× stock without bromophenol blue and then, if desired,
add bromophenol blue from a 10 mg/ml stock to the sample prior to gel loading. Once theamount of sample that is required from each unknown for equal loading is determined, it
is critical that all of the samples are diluted to the same volume. If this is not done, band
broadening (for high volume samples) and band narrowing (for small volume samples)
during the stacking phase of electrophoretic fractionation may be observed.
This assay (Hill and Straka, 1988) is a two-step procedure and takes advantage of the
fact that the BCA assay is compatible with SDS up to concentrations of 5%. The 6×
SDS-PAGE loading buffer described in UNIT10.1 results in a 1% final concentration of SDS

7/21/2019 Assays for Determination of Protein UNIT 3.4 ConcentrationampleUnit
http://slidepdf.com/reader/full/assays-for-determination-of-protein-unit-34-concentrationampleunit 24/29
Assays forDetermination of
ProteinConcentration
3.4.24
Supplement 48 Current Protocols in Protein Science
in the sample. However, it also contains DTT or 2-mercaptoethanol (2-ME) at greater
than millimolar concentrations, which is not compatible with the assay. Thus, prior to
the assay, the thiol groups of DTT (or 2-ME) must be alkylated with iodoacetamide to
form an S-carboxymethyl derivative of DTT or 2-ME. Iodoacetamide does not interfere
with the BCA assay, nor does alkylated DTT or 2-ME, therefore, after the iodoacetamide
treatment, samples may be assayed directly in the BCA assay (see Basic Protocol 3 or
Alternate Protocol 2).
Finally, two standard curves should be performed, especially when starting out with this
procedure. Samples for one standard curve will be suspended in SDS-PAGE samplebuffer while the others will be in water and will not be treated with iodoacetamide.
This will ensure that the addition of the SDS-PAGE loading buffer has not interfered
with the BCA assay, and it will also confirm a negligible difference in BCA assay
response in the presence of SDS-PAGE loading buffer. In the authors’ experience, little
detectable difference has been found between samples prepared in SDS-PAGE sample
buffer compared to those in water. It is appropriate to include both water blanks and
buffer blanks in this assay. The spectrophotometer should be allowed to warm up and
then zeroed with the water blank before recording the A562 of the buffer blank so it can
be subtracted from the standard curve containing SDS-PAGE loading buffer.
Materials
Stock protein standards6× SDS-PAGE loading dye without bromophenol blue (UNIT 10.1; see recipe)
Unknowns
20 mM iodoacetamide solution (see recipe)
Additional reagents and equipment for BCA assay (see Basic Protocol 3)
1. Dilute stock protein standard to 100µ l final volume of water and 100 µ l final volume
of 1× SDS-PAGE loading buffer (without bromophenol blue)
2. Prepare unknowns in a final volume of 100 µ l with 1× SDS-PAGE loading buffer
without bromophenol blue.
Make sure samples have been homogenized, heated, and centrifuged prior to assaying
for total protein.
3. Add 100 µ l of 20 mM iodoacetamide solution to the sample.
4. Incubate 20 min at 37◦C.
5. Proceed to Basic Protocol 3 by adding working reagent directly to the sample.
6. See Support Protocol 1 for data analysis.
REAGENTS AND SOLUTIONS
Use Milli-Q-purified water or equivalent in all recipes and protocol steps. For common stock solutions, see APPENDIX 2E; for suppliers, see SUPPLIERS APPENDIX .
Bradford reagent To 50 ml of 95% ethanol, add 100 mg Coomassie Brilliant Blue G-250 (CBBG).
When the CBBG is partially dissolved, add 100 ml 85% (w/v) phosphoric acid and
stir until CBBG is completely dissolved. Let the solution stir overnight to assure
maximal dissolution. Dilute to 1 liter with water. Store up to 1 month at room
temperature or 3 months at 4◦C.
continued

7/21/2019 Assays for Determination of Protein UNIT 3.4 ConcentrationampleUnit
http://slidepdf.com/reader/full/assays-for-determination-of-protein-unit-34-concentrationampleunit 25/29
Detection andAssay Methods
3.4.25
Current Protocols in Protein Science Supplement 48
Prior to use, filter enough reagent for the day’s work through Whatman no. 1 filter
paper.
While it is possible to make the reagent in the laboratory, due to the use of phosphoric
acid, it more cost effective to purchase a commercial reagent. Commercial reagents also donot need to be filtered prior to use. Note that different brands of commercial reagent (e.g.,
BioRad or Sigma) have different concentrations and thus different volumes are required.
Bromophenol blue stock solution
10 mg/ml bromophenol blue in water
Bromophenol blue is not very soluble in water, therefore, allow the solution to settle prior to use. Store up to 1 year at room temperature.
Folin-Ciocalteu reagent
Dilute purchased reagent (e.g., Sigma F9252) with an equal volume of water toprepare the desired volume. Prepare diluted reagent fresh daily.
Iodoacetamide solution
20 mM iodoacetamide (2-iodoacetamide) in 100 mM Tris·Cl, pH 8.0
Prepare fresh daily
Any buffer compatible with the BCA assay may be used in lieu of Tris·Cl, pH 8.0, as longas the pH is near physiological pH.
Lowry alkaline reagent
2 g NaOH (0.1 M)
10 g Na2CO3
2.5 g sodium tartrate (use of potassium salt will cause SDS to be insoluble)
12.5 g sodium dodecylsulfate
Bring to a final volume of 500 ml with water
Store in a plastic bottle up to 3 months at room temperature and check that it is
optically clear before using. If the solution is cloudy or particulates are visible,
prepare a new batch.
Lowry assay mix
50 ml Lowry alkaline reagent (see recipe) and 0.5 ml Lowry copper reagent (seerecipe)
Prepare fresh daily
Lowry copper reagent
1 g CuSO4·5H2O
Bring to a final volume of 100 ml with water
Store up to 1 year at room temperature
Macro-BCA assay reagent A
1 g sodium bicinchoninate (BCA)
2 g sodium carbonate
0.16 g sodium tartrate
0.4 g NaOH
0.95 g sodium bicarbonate
Adjust the pH to 11.25 with 10 M NaOH.
Bring to 100 ml with distilled water
Store up to 1 year at room temperature

7/21/2019 Assays for Determination of Protein UNIT 3.4 ConcentrationampleUnit
http://slidepdf.com/reader/full/assays-for-determination-of-protein-unit-34-concentrationampleunit 26/29
Assays forDetermination of
ProteinConcentration
3.4.26
Supplement 48 Current Protocols in Protein Science
Macro-BCA assay reagent B
0.4 g CuSO4·5H2O
Bring to 10 ml with distilled water
Store for 1 year at room temperature
Macro-BCA assay solution
50:1 (v/v) macro-BCA assay reagent A/macro-BCA assay reagent B (see recipes)
Make fresh daily
Micro-BCA assay reagent A
8 g sodium carbonate monohydrate
1.6 g sodium tartrate
Adjust the pH to 11.25 with 10 M NaOH
Bring to 100 ml with distilled water
Store up to 1 year at room temperature
Micro-BCA assay reagent B
4 g BCA in 100 ml distilled water
Store up to 1 year at room temperature
Micro-BCA assay reagent C
0.4 g CuSO4·5 H2O in 10 ml water.
Store up to 1 year at room temperature
Micro-BCA assay solution
25:25:1 (v/v/v) micro-assay reagent A/micro-assay reagent B/micro-assay reagentC (see recipes)
Prepare fresh daily
SDS-PAGE loading buffer without bromophenol blue, 6×
7 ml 0.5 M Tris·Cl, 0.4% SDS, pH 6.8
3.0 ml glycerol
1 g SDS0.93 g DTT
Add water to 10 ml
Store in small aliquots at −70◦C, do not re-freeze
Do not add bromophenol blue until after the BCA assay has been performed.
COMMENTARY
Critical Parameters andTroubleshooting
In addition to sample composition (see
Strategic Planning) and proper standard curve
production (see Support Protocol 1) there are
several other elements for a successful protein
assay. Be sure to use clean glassware since it
is difficult to get accurate results using dirty
glassware. For the methods described in this
unit, it is recommended to use new glass tubes
and discard them after use. High-quality de-
tergents and distilled water should be used to
clean glassware. In some cases, such as the
Bradford assay, it may be more convenient
to use disposable plastic cuvettes, rather than
those made from Pyrex or quartz, because the
assay reagents may leave a residue. If a cuvette
does not look clean, it should be first washed
with soap and water. If the residue remains, a
pipe cleaner works well for cleaning cuvettes.
Bend the pipe cleaner in the middle and use the
bent end to scrub the inside of the cuvette, be-
ing careful not to use the other end of the pipe
cleaner as the wires will scratch the optical
surfaces of the cuvette. If this is not sufficient
to remove residues from cuvettes, try soak-
ing in 50% nitric acid overnight. Also, a wash
with ethanol or methanol often works well

7/21/2019 Assays for Determination of Protein UNIT 3.4 ConcentrationampleUnit
http://slidepdf.com/reader/full/assays-for-determination-of-protein-unit-34-concentrationampleunit 27/29
Detection andAssay Methods
3.4.27
Current Protocols in Protein Science Supplement 48
to remove contaminating materials. Cuvettes
should be thoroughly washed with distilled
water between determinations. While carrying
out absorbance determinations, hold the filled
cuvette up and look though it to determine that
the solution is optically clear and without pre-
cipitates or floaters.
SpectrophotometrySpectrophotometry used in the protein as-
says presented in this unit either relies on the
presence of a metal (e.g., Cu2+ in the BCA
and Lowry assays) or involves a system of
conjugated double bonds (e.g., CBBG in the
Bradford assay) to absorb photons produced
by the spectrophotometer. Spectrophotometry
is advantageous in that it is a nondestructive
method. Because different molecules have dif-
ferent absorption characteristics, a particular
compound in a mixture can often be singled
out for observation. Most importantly, highly
accurate measurements can be made in a short
period of time.
Lambert-Beer (or Beer-Lambert) equationThe Beer-Lambert law of absorption states
that the fraction of light absorbed is (1) pro-
portional to the thickness of the absorbing so-
lution, (2) proportional to the concentration
of absorbing species, and (3) independent of
the light intensity. Mathematically presented
as follows:
The Beer-Lambert equation:
A = –log( I / I 0) = εcl
where ε is the molar extinction coefficient or
molar absorptivity and usually has units of
M−1 cm−1, except as noted above (see Ba-
sic Protocol 4 introduction) for proteins based
on a mass percent. If I 0 = intensity of the light
entering a colored solution; I = intensity of
light leaving the solution; c = concentration; l
= length of the light path (pathlength) through
the solution; then –log( I / I 0) is proportional to
both the pathlength and the concentration. The
term –log( I / I 0) is called the absorbance ( A) of
the solution.
Extinction coefficientsThe extinction coefficient is a proportion-
ality constant that relates absorbance to the
concentration and pathlength.
ε = A /(cl)
Absorbanceis a dimensionless quantity (es-
sentially a ratio). Pathlength is usually 1 cm.
Notice that ε is a value true for only the
wavelength at which it is defined. The same
molecule at different wavelengths has differ-
ent molar absorptivities.
Percent transmittanceMany spectrophotometers are capable of
measuring both absorbance, A, and percent
transmittance, %T .
Transmittance is defined as I / I 0 and is not
directly proportional to the absorbance. Ab-
sorbance is the –log of the transmittance. Val-
ues of transmittance normally vary from 0 to1.0.
Percent transmittance is defined as:
%T = ( I / I 0) × 100.
Percent transmittance is helpful for zero-
ing the spectrophotometer prior to use. With a
buffer blank, the %T should read 100%, and
with thelight beam blocked, it should read 0%.
There is a practical limit on the absorbance
that can be measured in a spectrophotometer.
An absorbance of 1 means that the transmit-
tance is 0.10 and that only 10% of the light
is reaching the light-measuring photodiode.
An absorbance of 2 means that the transmit-
tance is 0.01 and only 1% of the light is pass-
ing through the sample. An absorbance of 3
means a transmittance of 0.001 and 0.1% of
the light is passing through the sample. Good
spectrophotometers can measure absorbance
values up to 3. Less sophisticated spectropho-
tometers that are more commonly found in
laboratories can generally only measure ab-
sorbance to 2 or 2.5 before there is so little
light being measured that the signal-to-noise
ratio deteriorates. For the purposes of protein
assays, keeping the absorbance range between
0.05 and 2.0 is recommended.
Zeroing and blanksThe use of the jargon “zero” and “blank”
is often confusing and sometimes used inter-
changeably. Here, “zero” is used as a verb to
mean the act of setting the absorbance of a
spectrophotometer readout to a value of 0.0.
Obviously, one could zero the spectropho-
tometer without a cuvette in the sample holder;
this is not normally done and would be re-
ferred to as zeroing with air. It is much morecommon to zero the spectrophotometer with
a cuvette in the sample holder. The cuvette
used to zero the spectrophotometer is called
a blank. If a cuvette containing only water is
used, it is called a water blank. If a cuvette
containing water instead of sample, plus the
assay reagents, is used to zero the spectropho-
tometer, it is referred to as a reagent blank.

7/21/2019 Assays for Determination of Protein UNIT 3.4 ConcentrationampleUnit
http://slidepdf.com/reader/full/assays-for-determination-of-protein-unit-34-concentrationampleunit 28/29
Assays forDetermination of
ProteinConcentration
3.4.28
Supplement 48 Current Protocols in Protein Science
If a cuvette containing the buffer components
found in the sample to be measured plus the
assay reagents is used, this is called a buffer
blank. It is important to keep these differences
in mind, since they are not equivalent and can
lead to misinterpretation and different results.
Quantitative amino acid analysisThe assays described in this unit have dif-
ferent sensitivities for proteins with different
amino acid compositions. This is often not asignificant issue for complex protein extracts,
but becomes significant for purified proteins.
Typically, amino acid analysis is performed
by a service facility. An increasing number
of companies will perform this service at a
reasonable cost. Most service companies will
be able to provide the precise protein concen-
tration, and these results can be compared to
results from one or all of the assays presented
in this unit.
Anticipated ResultsTables 3.4.2 to 3.4.4 demonstrate typical
results for the Lowry, Bradford, and BCA as-
says, respectively. These tables can also be
used as assay and spreadsheet templates and
are of particular value to new assay users.
Time ConsiderationsBasic Protocols 1 and 3 (the Lowry and
BCA assays) can easily be completed and data
collectedin 1 to 1.5hr. TheBradfordassay(see
Basic Protocol 2) typically can be completed
in <1 hr. UV absorbance (see Basic Protocol
1) is one of the quickest methods and data canbe acquired in<30 min. Users unfamiliar with
data analysis of protein assay data can antic-
ipate requiring ∼30 min to 1 hr to analyze
data. Once familiar with the data analysis pro-
cess, it is typically completed in 10 to 20 min,
especially if using the spreadsheet templates
in Tables 3.4.2 to 3.4.4. If sample preparation
such as precipitation is required prior to assay,
this will typically add 1 hr to analysis time.
The high-throughput adaptations can be
completed in a similar amount of time as
the regular assays for approximately five mi-
crotiter plates. Additional microtiter platesonly add a few minutes to analysis time. These
times can be significantly shortened and the
number of samples scaled up by the utiliza-
tion of multichannel and repeating pipettors.
For large-scale operations, these assays will
scale nicely with robotics. Many microtiter
plate readers also come with software that can
easily automate both data acquisition andanal-
ysis. Typically, the high-throughput methods
are the best strategies to use if the assay is
compatible with the sample, as they are quick,
reliable, and allow acquisition of more data
points per sample.
Literature CitedBallentine,R. 1957. Determination of total nitrogen
and ammonia. Methods Enzymol. 3:984-995.
Bensadoun, A. and Weinstein, D. 1976. Assay of proteins in the presence of interfering materials. Anal. Biochem. 70:241-250.
Bradford, M.M. 1976. A rapid and sensitive methodfor the quantitation of microgram quantities of protein utilizing the principle of protein-dyebinding. Anal. Biochem. 72:248-254.
Dulley, J.R. and Grieve, P.A. 1975. A simple tech-nique for eliminating interference by detergentsin the Lowry method of protein determination. Anal. Biochem. 64:136-141.
Fasman, G.D. 1989. Practical Handbook of Bio-chemistry and Molecular Biology. CRC Press,Boca Raton, Florida.
Gill, S.C. and von Hippel,P.H. 1989. Calculation of protein extinction coefficients from amino acidsequence data. Anal. Biochem. 182:319-326.
Gornall, A.G., Bardawill, C.S., and David, M.M.1949. Determination of serum proteins by meansof the biuret method. J. Biol. Chem. 177:751-766.
Hartree, E.E. 1972. Determination of protein: Amodification of the Lowry method that givesa linear photometric response. Anal. Biochem.48:422-427.
Hill, H.D. and Straka, J.G. 1988. Protein determi-nation using bicinchoninic acid in the presence
of sulfhydryl reagents. Anal. Biochem. 170:203-208.
Layne, E. 1957. Spectrophotometric and turbidi-metric methodsfor measuring proteins. Methods Enzymol. 3:447-455.
Lovrien, R. and Matulis, D. 1995. Assays for totalprotein. Curr. Protoc. Protein Sci. 3.4.4-3.4.24.
Lowry, O.H., Rosebrough, N.J., Farr, A.L., andRandall, R.J. 1951. Protein measurement withthe Folin phenol reagent. J. Biol. Chem.193:265-275.
Mandula, H., Parepally, J.M., Feng, R., and Smith,O.R. 2006. Role of site-specific binding toplasma albumin in drug availability to brain. J.
Pharmacol. Exp. Ther. 317:667-675.Smith, P.K., Krohn, R.I., Hermanson, G.T., Mallia,
A.K., Gartner, F.H., Provenzano, M.D., Fu- jimoto, E.K., Goeke, N.M., Olson, B.J., andKlenk, D.C. 1985. Measurement of protein us-ing bicinchoninic acid. Anal. Biochem. 150:76-85.
Stoscheck, C.M. 1990. Quantitation of protein. Methods Enzymol. 182:50-68.

7/21/2019 Assays for Determination of Protein UNIT 3.4 ConcentrationampleUnit
http://slidepdf.com/reader/full/assays-for-determination-of-protein-unit-34-concentrationampleunit 29/29
Detection andAssay Methods
Wiechelman, K.J., Braun, R.D., and Fitzpatrick,J.D. 1988. Investigation of the bicinchoninicacid protein assay: Identification of the groupsresponsible for color formation. Anal. Biochem.175:231-237.
Contributed by Bradley J.S.C. Olson
Michigan State University
East Lansing, Michigan
John MarkwellUniversity of Nebraska
Lincoln, Nebraska