asphalt binder testing using 4 mm parallel plate geometry
TRANSCRIPT

Asphalt Binder Testing using
4 mm parallel plate geometry
of Dynamic Shear Rheometer
Interlaboratory Study
including test results of 20 participating laboratories
from Belgium, Czech Republic, Denmark, Finland,
France, Germany, Italy, Lithuania, and Poland
Final Report by
Johannes Büchner, Michael P. Wistuba and Ina Klüter
March 2020
Braunschweig Pavement Engineering Centre, Technische Universität Braunschweig
Beethovenstraße 51 b, D 38102 Braunschweig
Contact: [email protected]

Final Report – ILS 4mm - 2019 Seite 2 von 54
Participants:
Johannes Büchner, TU Braunschweig, Germany
Radek Černý, Unipetrol, Czech Republic
Davide Crisà, Alma Petroli, Italy
Gustavo Canon Falla, TU Dresden, Germany
Ondrej Dasek, Brno University of Technology, Czech Republic
Judita Gražulytė, Vilnius Gediminas Technical University, Lithuania
Carole Gueit, COLAS, France
Trine Jacobsen, NCC Industry, Denmark
Tomas Koudelka, Vialab, Czech Republic
Andreas Lutz, Anton Paar, Germany
Michalina Makowska, Aalto University, Finland
Aurélia Nicolaï, Spie Batignolles Malet, France
Torsten Remmler, Malvern Panalytical, Germany
Philipp Rückert, Asphalta, Germany
Dawid Rys, Gdansk University of Technology, Poland
Soenke Schroeder, Total Bitumen, Germany
Hilde Soenen, Nynas Antwerpen, Belgium
Matthias Staschkiewicz, Ruhr-Universität Bochum, Germany
Chiara Tozzi, Politecnico di Torino, Italy
Adam Zofka, Road and Bridge Research Institute, Poland

Final Report – ILS 4mm - 2019 Seite 3 von 54
Table of Contents
1 Motivation ................................................................................................................. 4
2 Materials .................................................................................................................... 4
3 Instructions ............................................................................................................... 4
4 Registration and submission .................................................................................... 5
5 Analysis ...................................................................................................................... 5
6 Test protocols and test results ................................................................................. 7
6.1 Dynamic Shear Rheometer used in this study ............................................................ 7
6.2 Sample preparation ..................................................................................................... 9
6.3 Sample conditioning and test parameters ................................................................. 14
6.4 Rheological parameters ............................................................................................ 18
6.5 Statistical analysis of rheological parameters @1.59Hz .......................................... 19
6.5.1 Complex Shear Modulus G* ................................................................................. 19
6.5.2 Phase angle δ ......................................................................................................... 27
6.6 Graphical analysis of rheological parameters @0.1Hz ............................................ 35
6.6.1 Complex Shear Modulus G* ................................................................................. 35
6.6.2 Phase Angle δ ....................................................................................................... 38
6.7 Graphical analysis of rheological parameters @1.0Hz ............................................ 41
6.7.1 Complex Shear Modulus G* ................................................................................. 41
6.7.2 Phase Angle δ ....................................................................................................... 44
6.8 Graphical analysis of rheological parameters @10.0Hz .......................................... 47
6.8.1 Complex Shear Modulus G* ................................................................................. 47
6.8.2 Phase angle δ ......................................................................................................... 50
7 Summary and conclusions ..................................................................................... 53
Final Report – ILS 4mm - 2019 Seite 4 von 54
1 Motivation
Today, there is no test standard in Europe for low temperature testing of asphalt binders with
the Dynamic Shear Rheometer (DSR), even though the 4 mm parallel plate geometry is noted
in the draft standard prEN 14770. Currently, there are few laboratories using this geometry
and only limited information is available on sample geometry, sample preparation, sample
conditioning, test procedure and test repeatability.
However, DSR testing by use of the 4 mm parallel plate geometry is gaining more and more
interest in the asphalt community for assessing low temperature properties of asphalt binders.
Therefore, this interlaboratory study was initiated and sponsored by the Braunschweig
Pavement Engineering Centre (ISBS) at Technische Universität Braunschweig in 2019, in
order to compare different test protocols currently in use, specifically in view of repeatability
and reproducibility. In this report, information on different test methods is provided, and the
respective test results are statistically analyzed and compared.
ISBS thanks all laboratories for participating in this interlaboratory study.
2 Materials
In this interlaboratory study, penetration graded asphalt binders were used, i. e. plain asphalt
binder of the type 50/70 and polymer modified asphalt binder of the type 25/55-55 A
(according to EN 12591, 2009 and EN 14023, 2010, respectively) (see Table 1).
Table 1: Asphalt binders of the penetration graded types 50/70 and 25/55-55 A
Test Method 50/70 25/55-55 A
Softening Point Ring-and-Ball (EN 1426, 2015) [°C] 51.3 58.0
Needle Penetration (EN 1427,2015) [1/10mm] 64 46
The batches for both asphalt binders consisted of 40 buckets of about 10kg, provided by the
manufacturer in November 2017.
For sample production, 10kg of each binder was heated in oven and homogenized in
accordance with EN 12594 (2012), and then separated into 25 containers of 350ml per
binder. Sampling took place on August 27th, 2019. On August 28th one container of binder
50/70 (approx. 350ml) and one container of binder 25/55-55 A (approx. 350ml), together
with safety data sheets was sent to each participant of the interlaboratory study. No sample
was reported damaged or missing.
3 Instructions
All participants received instructions for testing per email from August 29th.
A temperature-frequency sweep (T-f-sweep) test was performed on both binders, with two
test repetitions. Test temperatures were -30 (if possible), -20, -10 and 0°C. Test frequencies
were 0.1; 1.0; 1.59 and 10Hz.

Final Report – ILS 4mm - 2019 Seite 5 von 54
The participants applied their usual procedure when using 4 mm geometry. No detailed
instructions on sample preparation and material testing were provided. Sample preparation,
sample conditioning, oscillation amplitude was individually chosen by each participant.
An Excel file was provided to collect information on the device used, on sample geometry,
sample preparation, specimen conditioning, test conditioning and test results (phase angle δ
and complex shear modulus G*). In addition, participants had the possibility to comment
their specific methods.
4 Registration and submission
20 laboratories participated in this interlaboratory study, covering Belgium, Czech Republic,
Denmark, Finland, France, Germany, Italy, Lithuania, and Poland. One participant provided
three separate results with different testing procedures. One participant was not able to
submit results for technical reasons. A total number of 22 test protocols was received, from
September 24th, 2019 to January 13th, 2020.
5 Analysis
Anonymous laboratory numbers are assigned to all test results. Any participant knew his
specific number only.
General information on test equipment and test procedure is summarized in Section 6.
Based on the resulting values for complex shear modulus and phase angle of all data sets,
the following parameters were calculated (cp. Section 6):
• mean value of the two individual test results,
• deviation of individual values from the mean value in percent,
• general mean of all test results from all participants, except those with z score ≥ 3.0,
• lab deviation of mean value from each participant from general mean of all test results
in percent,
• z score; the z score was chosen as the statistical criterion. The z score for a result of a
proficiency test is calculated from: 𝑧𝑖 = (𝑥𝑖 − 𝑥𝑝𝑡)/𝜎𝑝𝑡 according to Section 9.4 of
Standard ISO 13528, where xi is the assigned value, xpt is the robust average of the
laboratory results before statistical exclusion, but after analytical exclusions, and σpt is
the standard deviation for the proficiency assessment. The conventional interpretation
of z scores is as follows (see ISO/IEC 17043,2010):
o result that gives |z| ≤ 2,0 is considered satisfactory,
o result that gives 2,0 < |z| < 3,0 is considered to be a warning signal,
o result giving |z| ≥ 3,0 is considered unsatisfactory (or intervention signal).
Detailed statistical analysis is provided for a test frequency of 1.59Hz only, results for
frequencies of 0.1; 1.0 and 10Hz are presented graphically in Section 6.

Final Report – ILS 4mm - 2019 Seite 6 von 54
The deviation is used to evaluate the repeatability of test results for each participant. The lab
deviation is used to evaluate the overall reproducibility of the test method. It should be noted
that the test results are not obtained under reproducibility conditions, as different methods
in terms of sample preparation, sample geometry and sample conditioning were used.

Final Report – ILS 4mm - 2019 Seite 7 von 54
6 Test protocols and test results
6.1 Dynamic Shear Rheometer used in this study
Laboratory Brand of DSR Model of DSR Year of purchase DSR control software
1 Discovery Series HR-3 2015 Trios
2 Anton Paar EC Twist 502 2016 RheoCompass 1.23
3 Anton Paar MCR 102 2013 RheoPlus
4 Anton Paar SmartPave102 2016 RheoCompass 1.24
5 Malvern Panalytical DSR 2018 rSpace 1.75
6 Malvern Panalytical Kinexus Pro 2012 rSpace 1.72
7 Anton Paar MCR-101 2008 RheoPlus 2.81
8 Anton Paar MCR 502 2014 RrheoCompass 1.20
9 Malvern Panalytical Kinexus Pro Plus 2014 rSpace 1.72
10 Anton Paar MCR 302 2016 RheoCompass 1.24
11 Anton Paar MCR 302 2019 RheoCompass 1.24
12 Anton Paar MCR 302 2016 RheoCompass
13 Malvern Panalytical Ultra+ - rSpace 1.75
14 Anton Paar MCR 302 2012 RheoPlus 3.61
15 Anton Paar MCR 502 2016 RheoCompass 1.23
16 Anton Paar MCR 302 2014 RheoCompass
17 Malvern Panalytical Kinexus DSR+ 2015 rSpace 1.75
18 Anton Paar SmartPave 102 2019 RheoCompass 1.24
19 Malvern Panalytical Kinexus Pro+; DSR+ 2017 rSpace 1.75
20 Malvern Panalytical Kinexus Pro+; DSR+ 2017 rSpace 1.75
21 Malvern Panalytical Kinexus Pro+; DSR+ 2017 rSpace 1.75
22 Anton Paar MCR Smart Pave 102 2018 RheoCompass 1.24
Laboratory Temperature control system Model of temperature control system
1 Liquid Nitrogen ETC Oven
2 Peltier H-PTD 200
3 Peltier H-PTD-200
4 Peltier P-PTD200/56/I+H-PTD200
5 Peltier -
6 Peltier KNX2007
7 Peltier TU1=TEK150PA-CF (this is under Peltier) +H-PTD200- (this is the upper Peltier-
was acquired 2018)
8 Peltier H-PTD 200+P-PTD 200
9 Peltier -
10 Peltier H-PTD 200, P-PTD 200/56/I
11 Peltier H-PTD 200
12 - H-PTD200 + P-PTD200
13 Peltier Active Peltier
14 Peltier C-PTD200+H-PTD200
15 Convection CTD 180
16 Peltier H-PTD200
17 Peltier -
18 Peltier P-PTD200 + H-PTD200
19 Peltier KNX2007
20 Peltier KNX2007
21 Peltier KNX2007
22 Peltier P-PTD200+H-PTD120

Final Report – ILS 4mm - 2019 Seite 8 von 54
laboratory
Is an external
heat
exchanger used
for
counter cooling?
If YES, brand
and model
If YES, liquid used
for counter cooling
If YES, is the
external heat
exchanger
controlled by
the DSR?
If YES, is the
external heat
exchanger
controlled
manually?
If YES,
counter
cooling
temperature
1 NO - - - - -
2 YES Julabo FP50 Thermal G YES NO -
3 YES Julabo FE32 HL Antifreeze YES No but Yes we
can -
4 YES Julabo FP50 Glycol NO YES 8
5 YES Julabo CF41 Fridex G48 YES NO -
6 YES Julabo CF41 Fridex YES NO -
7 YES Minichiller
Petroplus Water-Glycerol 50/50 NO YES -10
8 YES Viscotherm VT2 Antifreeze YES NO -
9 YES Julabo CF41 - YES NO -
10 YES Viscotherm VT2 Antifreeze YES YES -10
11 YES Viscotherm VT2 50% Water- 50%
Glycerol YES YES -10
12 YES Viscotherm VT2 Water + 15% Glycol YES NO -
13 YES Julabo CF41 Thermal G YES NO -
14 YES ViscoTherm VT2 Ethylene Glycol NO YES 5
15 YES Julabo FP50 Ethanol 96% YES NO -
16 YES Julabo FP50 Water + Glycol YES - -
17 YES Julabo CF41 Antifreeze G12+ YES NO -
18 YES Julabo CF41 Water NO YES 5
19 YES Julabo CF41 Thermal G YES NO -
20 YES Julabo CF41 Thermal G YES NO -
21 YES Julabo CF41 Thermal G YES NO -
22 NO - - - - -
laboratory
Is the 4mm-geometry
serrated?
Is compliance correction
applied to the test results?
If YES, compliance of
4mm-geometry used
Do you have any previous
experiences with the 4mm-
geometry?
(YES/NO) (YES/NO) [rad/Nm] (YES/NO)
1 NO NO - YES
2 NO NO - YES
3 NO YES 0.0017 YES
4 NO YES 0.0017 YES
5 YES NO - NO
6 NO NO - NO
7 NO YES 0.0203 YES
8 NO YES 0.016 YES
9 YES - - NO
10 NO YES 0.0224 YES
11 NO NO - NO
12 NO - - NO
13 YES YES 0.01262 YES
14 NO YES 0.028 YES
15 NO NO - NO
16 NO YES (sample 2 field) 0.023 YES
17 NO NO - YES
18 YES YES 0.016 NO
19 YES YES - -
20 YES YES - YES
21 YES YES 0.0014 YES
22 NO NO - YES

Final Report – ILS 4mm - 2019 Seite 9 von 54
Comments
lab. 1 (cooling by liquid nitrogen, heating by peltier). There is no heat exchanger but a bottle with liquide nitrogen with a control
system lab. 3 Das Gerät wird einmal jährlich durch den Gerätehersteller gewartet und justiert. Quartalsweise erfolgt eine Messung der
Trägheit/Luftdurchströmung/Abweichung des Drehmomentes/Messung eines Standardviskosen Material bei 70°C und
Aufzeichnung in einer Kontrollkarte. lab. 7 Compliance correction has been determined in a previous step, sample temperature has been measured and corrected for
lab. 10 Compliance specified in 2.9.1 is for lower measuring system geometry (it is put in the DSR cell of "torsional compliance". The entire compliance is 0.024 (0.0016 is for rheometer motor).
We have already published a paper on 4-mm DSR "Analysis of 4-mm DSR tests: calibration, sample preparation, and
evaluation of repeatability and reproducibility" and Judita Gražulytė have done tests with 4-mm DSR in her doctoral thesis "Bitumen stress relaxation modulus as an indicator of asphalt pavements resistance to low temperature cracking".
At the end is a summary in english:
http://dspace.vgtu.lt/bitstream/1/3824/1/J.%20Gra%c5%beulyt%c4%97s%20disertacija.pdf lab. 13 The used 4mm-plate-plate-geometry is sand-blasted.
lab. 16 But not so much experiences (4mm-geometry), about under 20 measurements. We did not insert the compliance correction into the software. The calculation is done manually. Sample 1 field has raw result and field of sample 2 is having
compliance corrected value. So far the sample 2 was not run. I will get back to you about the countercooling. We have
problems with going below the 0 deg C of the coolant. The room is small and with no great heat exchange of its own, I suppose Julabo is not as effective in cooling it down. So the lowest stable temperature we can go down to with our system
is-28
6.2 Sample preparation
laboratory
At which
temperature has the
gap set zero?
Has a sub-sample of
the distributed container
been taken for sample
preparation?
[°C] (YES/NO)
1 25 YES
2 0 NO
3 -15 YES
4 -15 YES
5 25 YES
6 30 NO
7 -10 NO
8 0 NO
9 25 NO
10 0 YES
11 -15 YES
12 -15 -
13 25 NO
14 -15 NO
15 20 NO
16 5 NO
17 30 NO
18 - YES
19 25 YES
20 25 NO
21 25 YES
22 0 NO
If NO, describe sample preparation procedure
lab. 2 Sample preparation according to AL DSR / ASHTOO - Samples were heated up to 180 °C and poured into silicone
moulds, cooled down at room temperature for 2h. Then the first sample 50/70 was tested and aftwards the second one, which was stored at room temperature. The two samples of 25/55-55A, which were prepared at the same time, were stored
in a fridge over night at 5-8°C and tested at the next day.
lab. 6 Pouring hot bitumen into moulds from two-component silicone rubber (Lukopren N 1522)
lab. 7 Can was heated and a drop was placed in a mold- see further
lab. 8 Poured on silicon moulds
lab. 9 Bitumen container is warmed up at a low temperature and sample is placed directly on the geometry.
lab. 13 Heat Up Sample to 90°C
lab. 15 No mould used. A small amount of bitumen taken from the container
lab. 16 50/70 container heated 135 C at 1 h and 25/55-55 container heated 140 C at 1 h-> stirr and molds
lab. 17 Sample was heated up to 170°C for 1 hour and poured into silicone moulds.
lab. 22 1. Sample was taken by tweezers from container. (in 25 oC) 2. The portion of sample was weighted and formed into cylinder shape of 4mm diameter. This act was made by fingers (fresh super nitrile gloves was used separately for each
sample as a protection from "fat"). Tools used: ruler, steel spatula, calliper.

Final Report – ILS 4mm - 2019 Seite 10 von 54
laboratory
If YES, approximate
weight of the sub-sample
If YES, heating
temperature of the sub-
sample
If YES, heating time of the
sub-sample
Have the sub samples
been used for direct
application in the
rheometer?
[g] [°C] [min] (YES/NO)
1 50 160 5 YES
2 - - - NO
3 10 145 60 NO
4 50 165 15 NO
5 70 150 90 YES
6 - - - NO
7 - - - -
8 - - - NO
9 - - - -
10 17 150 for 50/70; 170 for
25/55-55 20 NO
11 50 150 45 NO
12 - - - NO
13 - - - NO
14 - - - -
15 - - - NO
16 - - - -
17 - - - -
18 125 140 60 YES
19 30 150 1 NO
20 - - - -
21 15 135 1 NO
22 - - - NO
laboratory
Were moulds or sheet
materials used for
specimen preparation?
If YES, specify material of
mould or sheet
If YES, specify shape of the
specimen
If YES, storage time
before demoulding and
testing
(YES/NO) [min]
1 YES Silicone Rectangle 5
2 YES Silicon like ASHTOO 315 with 4mm
diameter see 3.2.1
3 YES Silicone mold as in AL DSR
(T-Sweep / BTSV)
diameter 8 mm and 2 mm
height 720
4 YES Silicon 4mm diameter, height 2.5
mm 30-240
5 YES Malvern, silicone mould Cylindrical 0
6 YES two-component silicone
rubber (Lukopren N 1522) Cylindrical 15
7 YES Silicon molds 2.5 mm height, 4.2 mm diameter
first repeat 5 min, second repeat about 4 hours
8 YES Silicon cylinder 60
9 NO - - -
10 YES Silicone cylindrical 15
11 YES Silicone Circular, with a diameter of
4mm 720
12 YES Non sticky silicon sheet material
- -
13 YES Silicone Rubber Cylindrical Shape
14 NO - - -
15 NO - - -
16 YES Silicone moulds Cylinder for 8 mm plate 50/70: 2h 41 min and
25/55-55: 19h 10 min
17 - - - -
18 YES Silicone moulds cylinder 12H
19 YES Silicone 25mm 20
20 - - - -
21 YES Silicon AAHSTO mold 8mm 12 h
22 NO - - -

Final Report – ILS 4mm - 2019 Seite 11 von 54
laboratory
If YES,
specimen placed
in a refrigerator
prior to
demoulding?
If YES,
duration of
conditioning in
refrigerator
Sample
loading
temperature
50/70
Sample
loading
temperature
25/55-55
How were the sample loading temperatures
chosen? (e.g. based on experience, based on
softening point)
(YES/NO) [min] [°C] [°C]
1 YES 2 60 60 Based on experience
2 NO - 60 70 We used the same bitumen in FE 07.0293
3 NO - 50 50 Experience
4 YES 10 80 70 based on softening point
5 NO - 10 10 Sample was poured directly into the mould at 90°C. Then cooled down to 10°C. Temeperature
is based on literature survey.
6 NO - 30 30 Based on experience
7 NO - 50 50 experience, and visually after the test when
taking out the sample
8 NO - 48 72 based on softeninf point
9 - - 25 30 based on experience
10 NO - 70 70 based on experience
11 YES < 5 60 then 40 60 then 40 Thanks the ball-ring softening point of bitumen
(60°C) and for final snatching (40°C)
12 YES - 45 50 Based on softing point
13 NO - 90 90 based on experience
14 - - 45 55 Softening Point
15 - - 40 40 Based on experience
16 No - 45 50 experience
17 - - 30 30 Based on the cited article
18 YES 15 45 50 softening point
19 NO - 80 90 experience
20 - - 62 67 softening point
21 NO - 50 60 softening point
22 - - 60 70 both- experience + softening point
laboratory
Equilibrium time of
loading temperature
before sample loading
Sample loading gap (desired gap
+ closure gap for the bulge)
Equilibrium time of
loading temperature
after sample loading
[min] [mm] [min]
1 1 3.5 1
2 - 2 ca. 5
3 5 1.8 10
4 10 1.525 10
5 5 0 10
6 5 2.1 10
7 5 1.80 mm after trimming 1.75mm 5
8 5 4.5 0
9 10 1.1 10
10 5 1.870 2
11 15 1.825 < 5
12 5 2.025 5
13 1 3 2
14 10 1.87 5
15 5 10 5
16 10 1.775 5
17 - 2.05 10
18 5 1.775 30
19 1 - 1
20 1 1.87 5
21 0 2.1 1
22 1 2.050 mm stick gap 0.5

Final Report – ILS 4mm - 2019 Seite 12 von 54
laboratory
Has the specimen
been trimmed after
loading in the DSR?
If YES, approximate
temperature of trimming tool
If YES, specify material
of trimming tool (e.g.
plastic, aluminum,
stainless steel)
If YES, specify shape of
trimming tool
(YES/NO) [°C]
1 YES 10 stainless steel Chisel
2 YES 100 stainless steel spatula
3 YES 90 stainless steel Spatel mit Radius
4 YES <90 stainless steel 90° bended spetula
5 NO - - -
6 YES 100 Stainless steel Bent spatula
7 YES (at 15°C)
the spatula is hold against a hot
stage at 180°C, so my guess is at 160°C
stainless steel standard spatula (not curved!)
area is 2cm on 0.5 cm
8 YES 160 stainless steel creased chemical spatula
9 YES 90 stainless steel Scalpel
10 YES 95 aluminum spatula
11 YES 40 stainless steel With curved
and linear axis
12 YES - stainless steel L shape
13 YES 90 stainless steel rectangular
14 YES 100 stainless steel spatula
15 YES Unknwon Stainless steel L
16 YES ??75 stainless steel dogbone with flat end
17 YES 25 stainless steel spatula
18 YES 150 stainless steel spatula
19 YES 140 stainless steel section of a ruler
20 NO - - -
21 YES 120 stainless steel bended spatula
22 NO - - -
laboratory
Has the specimen
the exact weight,
so trimming is not
necessary?
If YES, weigth of the
specimen
Final gap after
sample
preparation
(YES/NO) [mg] [mm]
1 NO - 3
2 NO - 1.75
3 NO - 1.75
4 NO - 1.5
5 YES - 3
6 NO - 2
7 NO - 1.75
8 NO - 2.2
9 NO - 1
10 NO - 1.75
11 NO - 1.75
12 NO - 2
13 NO - ca. 2.7
14 NO - 1.75
15 NO - 3
16 NO - 1.75
17 NO - 2
18 NO - 1.75
19 NO - 3.1 ± 1.0
20 YES 0.025 1.75
21 NO - 2
22 YES 0.0265 1.9

Final Report – ILS 4mm - 2019 Seite 13 von 54
If available: references for sample preparations method
lab. 2 FE 07.0293 lab. 4 AASHTO T315
lab. 5 Schrader et al. 2019: On low temperature binder testing using 4 mm geometry, EATA 2019 lab. 7 J. Gražulytė, H. Soenen, J. Blom, A. Vaitkus, J. Židanavičiūtė & A. Margaritis (2019): Analysis of 4-mm DSR tests:
calibration, sample preparation, and evaluation of repeatability and reproducibility, Road Materials and Pavement Design,
DOI: 10.1080/14680629.2019.1634636 lab. 8 AASHTO project: determining the low temperature rheological properties of asphalt binder using a dynamic shear
rheometer
lab. 10 Samples preparation method is published in "Analysis of 4-mm DSR tests: calibration, sample preparation, and evaluation of repeatability and reproducibility":
https://www.tandfonline.com/doi/pdf/10.1080/14680629.2019.1634636?needAccess=true
lab. 14 Western Research Institute sample preparation protocol lab. 16 We follow what was in AASHTO draft in 2015. Trimming with hot spatula.
lab. 17 ČSN EN 14 770, LU, Xiaohu; UHLBACK, Petri; SOENEN, Hilde. Investigation of bitumen low temperature properties using a dynamic shear rheometer with 4 mm parallel plates. International Journal of Pavement Research and Technology,
2017, 10.1: 15-22.
lab. 19 Wang, D., Cannone Falchetto, A., Alisov, A., Schrader, J., Riccardi, C. & Wistuba, M. P. 2019. An Alternative Experimental Method for Measuring the Low Temperature Rheological Properties
of Asphalt Binder Using 4 mm Parallel Plates on Dynamic Shear Rheometer. Transportation Research Record: Journal of
the Transportation Research Board, Vol. 2673, Issue 3, 427–438. DOI: 10.1177/0361198119834912.
Schrader, J., Wistuba, M. P., Remmler, T. & Wang, D. 2019. On Low Temperature Binder Testing using DSR 4mm
Geometry, under review. Materials and Structures, Springer.
lab. 20 Farrar, M., Sui, C., Salmans, S., & Qin, Q. (2015). Determining the low-temperature rheological properties of asphalt binder using a dynamic shear rheometer (DSR).
Fundamental Properties of Asphalts and Modified Asphalts III Product: FP, 8.
Comments
lab. 5 The subsample was heated several times in order to evaluate LVE. The subsample was also used for the evaluation of the
needed conditioning time. The subsample could aged a little bit over time. For the subsequent measurements a new
subsample was used. lab. 7 temp interval from +10°C to-30°C
lab. 8 loading at R&B +2°C and just after loading, cooling at 15°C. equilibrium time at 15°C: 5min.
First trimming at 4.5mm. 2nd triming at 2.4mm.
lab. 13 Final Gap achieved under normal force control
lab. 14 The material was transferred to the lower fixed plate by means of a hot spatula- the upper plate was lowered to 1.87 mm-
the sample was trimmed- the temperature was lowered to 30°C and the gap was closed to 1.75 mm
lab. 15 The samples were trimmed at 0°C (10 min of equilibrium time). It was very difficult to get a proper specimen geometry.
We tried different methods but we are still not satisfied with the results. Further tests are needed.
lab. 16 we used 8mm moulds and samples were done smaller after moulding with hot spatula.
lab. 18 * Use ever the same temperature of the analisys
lab. 19 Sample height is trimmed instead of sample radius at 10°C
lab. 22 Better results are obtained by using 1.9mm gap rather than 2.0 mm
Better results are obtained by using sample volume or weight rather than its triming

Final Report – ILS 4mm - 2019 Seite 14 von 54
6.3 Sample conditioning and test parameters
laboratory
Was an increasing trend
used for subsequent test
temperatures?
Was the normal force
kept zero during
temperature conditioning
for each of the test
temperatures?
Was the gap kept
constant during testing
for each of the
temperatures?
(YES/NO) (YES/NO) (YES/NO)
1 YES YES YES
2 NO YES NO
3 NO YES YES
4 NO NO NO
5 NO YES NO
6 NO NO YES
7 NO YES YES
8 NO YES NO
9 NO NO YES
10 NO YES NO
11 NO YES YES
12 NO YES YES
13 YES YES YES
14 NO YES YES
15 NO YES NO
16 NO YES NO
17 YES NO YES
18 NO NO YES
19 YES YES YES
20 NO YES YES
21 YES YES YES
22 NO NO YES
laboratory
Duration of equilibrium
time at test temperature-
30°C before measure
Duration of equilibrium
time at test temperature-
20°C before measure
Duration of equilibrium
time at test temperature-
10°C before measure
Duration of equilibrium
time at test temperature
0°C before measure
[min] [min] [min] [min]
1 1 1 1 1
2 - 30 30 30
3 10 10 10 10
4 10 10 10 10
5 60 60 60 60
6 20 20 20 20
7 20 20 20 20
8 2 2 2 2
9 10 10 10 10
10 20 20 20 20
11 15 15 15 15
12 5 5 5 5
13 45 30 20 10
14 5 5 5 10
15 - See comment 10 10
16 15 15 15 15
17 20 10 10 10
18 30 30 30 30
19 45 30 20 10
20 40 40 40 40
21 45 30 20 10
22 10 10 10 10

Final Report – ILS 4mm - 2019 Seite 15 von 54
laboratory
Have the equilibrium times been
selected based on Annex B of
EN 14770?
Has the thermal
expansion of the
geometry been
checked during
the last 8 weeks
Has gas/air been
used to prevent ice
formation at the
interface between
the geometry and
the temperature
hood?
If YES, specify the type of gas/air
and the volume flow
(YES/NO) (YES/NO) (YES/NO)
1 - YES YES LIQUID NITROGEN
2 NO YES NO -
3 NO YES Yes, Peltier standard-Peltier
4 NO YES YES dried O2 220Ln/h
5 NO NO NO -
6 NO NO NO -
7 No (determined with
thermocouples) NO YES dry air/ 200l/h
8 NO NO YES comprimed air at 200l/h
9 NO YES NO -
10 YES NO YES air, 200 lN/h
11 YES NO YES Compressed air- 2 bar
12 - - - -
13 NO YES YES Dried Air
14 NO YES NO -
15 NO NO NO -
16 No or I don’t know NO - -
17 NO NO NO -
18 YES YES YES air 200 Ln/h
19 YES YES YES nitrogen 99.999%, 2 L/min
20 YES YES YES nitrogen 99.999%, 2 L/min
21 YES YES NO -
22 NO YES NO -

Final Report – ILS 4mm - 2019 Seite 16 von 54
laboratory
Has the linear
viscoelatic (LVE)
range been
determined for
the materials?
If YES, specify tested temperatures, tested
frequencies and tested stress/strain amplitude
If NO, has the
strain/stress been
selected based on
previous
experience with
the materials?
Is strain or
stress controlled
mode used for
the T-f-Sweep?
(YES/NO) (YES/NO)
1 YES - - Stress
2 NO - YES Strain
3 YES strain at-30°C and 10 Hz YES Strain
4 YES 0°C,-30°C, 1.59Hz, 0.01-10% - Strain
5 YES
Temperatures: 0°C and 30°C, tested frequencies: 0.1Hz
and 10 Hz, LVER Stress mode 1 kPa to 1000 kPa - Stress
6 YES 0°C and 30°C, 0.1Hz and 10 Hz, 0.1 kPa to 1000 kPa - Stress
7 NO - YES Strain
8 NO - YES Strain
9 YES 0,-10,-20,-30°C; 0.1, 1.0, 1.59, 10 Hz; 0.01- 0.5 % strain - Strain
10 YES at 0°C with 0.1Hz; at –30°C with 10 Hz;
in both cases strain from 0.0001 to 0.1 - Strain
11 YES 0°C,-10°C,-30°C ; 1.59Hz ; from 1E-5 % to 1 % - -
12 NO - NO -
13 NO - YES Stress
14 NO - YES Strain
15 NO - YES Strain
16 No - YES -
17 YES 0°C, 0.1- 10 Hz, strain 10-6- 10-4 %, stress 0- 10 Pa NO Stress
18 YES - - -
19 NO - YES Stress
20 YES -30C with 10Hz and 0C with 0.1Hz - Stress
21 NO - YES Stress
22 NO - YES Strain
laboratory
Strain or stress applied
-30°C
(50/70)
-20°C
(50/70)
-10°C
(50/70) 0°C (50/70)
-30°C
(25/55-55)
-20°C
(25/55-55)
-10°C
(25/55-55)
0°C (25/55-
55)
% / kPa % / kPa % / kPa % / kPa % / kPa % / kPa % / kPa % / kPa
1 10 10 10 10 10 10 10 10
2 -
0.2 (1.0 Hz) 0.1 (1Hz)
0.1 (1.59Hz)
0.05 (10Hz)
0.2 (1.0 Hz) 0.2 (1Hz)
0.1 (1.59Hz)
0.05 (10Hz)
0.2 (1.0 Hz) 0.2 (1Hz)
0.1 (1.59Hz)
0.05 (10Hz)
-
0.2 (1.0 Hz) 0.1 (1Hz)
0.1 (1.59Hz)
0.05 (10Hz)
0.2 (1.0 Hz) 0.2 (1Hz)
0.1 (1.59Hz)
0.05 (10Hz)
0.2 (1.0 Hz) 0.2 (1Hz)
0.1 (1.59Hz)
0.05 (10Hz)
3 0.005 0.005 0.005 0.0083 0.005 0.005 0.005 0.0084
4 0.1 0.1 0.1 0.1 0.05 0.05 0.05 0.05
5 10 and 100 10 and 100 10 and 100 10 and 100 10 and 100 10 and 100 10 and 100 10 and 100
6 50 50 50 50 50 50 50 50
7 0.02 0.02 0.02 0.02 0.02 0.02 0.02 0.02
8 0.01 0.01 0.01 0.01 0.01 0.01 0.01 0.01
9 0.1 0.1 0.1 0.1 0.1 0.1 0.1 0.1
10 0.1 0.1 0.1 0.1 0.1 0.1 0.1 0.1
11 0.1 0.1 0.1 0.1 0.1 0.1 0.1 0.1
12 0.1 0.1 0.1 0.1 0.1 0.1 0.1 0.1
13 300 100 10 5 300 100 10 5
14 0.05 0.05 0.05 0.05 0.05 0.05 0.05 0.05
15 - - 0.30 0.40 - - 0.20 0.30
16 0.1 0.1 0.1 0.1 0.1 0.1 0.1 0.1
17 1 1 1 1 1 1 1 1
18 - 0.001 0.01 0.5 - 0.001 0.1 0.1
19 100 50 25 10 100 50 25 10
20 10 10 10 10 10 10 10 10
21 100 50 25 10 100 50 25 10
22 0.01026 0.01026 0.01026 0.01026 0.01026 0.01026 0.01026 0.01026

Final Report – ILS 4mm - 2019 Seite 17 von 54
laboratory
Measurement duration for each data point
Date of testing the
50/70
Date of testing the
25/55-55
Number of
individual
measurement
values for each
temperature-
frequency
combination
0.10 Hz 1.00 Hz 1.59Hz 10.00Hz
[-] [s] [s] [s] [s]
1 5 100 10 6.3 1 07.10.2019 10.10.2019
2
0.1Hz
5Measurements;
Rest 10
45 15 15 10 30.09.2019 01.10.2019
3 n+10+1 auto 08.10.2019 09.10.2019
4 1 ca.74 ca.13 ca.10 ca.8 10.09.2019 12.09.2019
5 4 117 47 27 11 11. and 12.11.2019 13. to 15.11 2019
6 10 10 10 10 10 13. to 15.11.2019 18. to 20.11.2019
7 automatic-
software decides 77 26 20 18 12.11.2009 13.11.2019
8 1 10 10 10 10 07.11.2019 12.11.2019
9 5 240 240 240 240 KW45 KW46
10 5 108 16 14 6 08.11.2019 11.11.2019
11 15 10 1 0.6 0.1 13. and 14.11.2019 13. and 15.11.2019
12 - - - - - 15.11.2019 18.11.2019
13 1 300 30 20 20 - -
14 1 - - - - 09.10.2019 11.10.2019
15 By the equipment (Automatic) 22.11.2019 22.11.2019
16 1 set by device 13.11.2019 15.11.2019
17 20 5 5 5 5 14.11.2019 18.11.2019
18 26 * * * * 7 to 11.10.2019 22 to 29.10.2019
19 1 180 30 20 20 05.- 06.09.2019 05.- 06.09.2019
20 1 120 10 9 3 2019.10.20 2019.10.20
21 1 180 30 20 20 14.11.2019 14.11.2019
22 6 15.32 5.7 5.7 6.1 9.- 10.01.2020 10.01.2020
Comments
lab. 1 Duration of the whole temperature-frequency combination equals 16 minutes.
lab. 3 Die Deformation wurde Automatisch am Gerät über eine einprogrammierte Abhängigkeit zwischen LVE-Grenze und der
gemessenen Spannung eingestellt. Die Abhängigkeit wurde im FE NaHiTas des BMBV abgeleitet und ist dort beschrieben. lab. 5 Based on LVE measurements two stress levels were applied during the measurements. A sequence was prepared so to
measure 10 kPa firstly then 100 kPa and once again 10 kPa and 100 kPa in order to check whether the sample was not
damaged during testing. If the values are close enough we know that the sample is still intact. In this way we were able to track damaged samples. LVE was measured only on 50/70.
lab. 7 measuring duration is the sum of adjusting and averaring time (this was set on automatic)
lab. 10 Test temperatures were from highest (0°C) to lowest (-30°C).
lab. 11 First tests with the 4 mm plate geometry by our laboratory. The geometry wasn't used before these tests
lab. 13 I did not find the time for amplitude sweeps, just checked harmonic distortion values to be within acceptable limits.
lab. 15 We are presenting only the results at 0°C and-10°C. At lower temperatures (-20°C) the specimen debonded. We also tried
to perform some tests are lower strain levels but we were not happy with the results. lab. 16 we used-28 C not-30 C, and also 10 C was measured 10->-28. Peltier is connected to pressurised air and it is kept at around
180 L/h. We have done the LVE ranges for other bitumens with and without modification previously to choose the strain. lab. 17 In a first approach, there was an effort to measure completely according to the article LU, Xiaohu; UHLBACK, Petri;
SOENEN, Hilde. Investigation of bitumen low temperature properties using a dynamic shear rheometer with 4 mm parallel
plates. International Journal of Pavement Research and Technology, 2017, 10.1: 15-22.1). However, some parameters were necessary to be omitted/modified: 1) Normal force control (0 N during temperature equlibrion) was not able to be used,
however there were only normal forces up to 0,05 N. 2) Temperature equilibrium was necessary to be prolonged to 20
minutes in case of measurements at-30°C. 3) The stress level was 1 MPa for the sample 50/70 but it had to be lowered to 1
kPa for the sample 25/55-55 (instrument limits were exceeded). 4) Freezing of the samples before the measurement was not
carried out. 5) Linear viscoelastic range was determined, however according to the cited article, fixed stress level was used
(1 MPa) and consequently it was lowered for the sample 25/55-55 (1 kPa). lab. 18 * We use the function "set by device" so We have a variable number of representative point.

Final Report – ILS 4mm - 2019 Seite 18 von 54
6.4 Rheological parameters
laboratory
Have additional
test results
beyond the below
stated been
discarded?
If YES, why?
Have the results
been compared
to 8mm-
geometry
measurements?
If YES, what
was the
maximum
percentual
difference of
shear modulus
(YES/NO) (YES/NO)
1 NO - NO
2 YES Because our T-Sweep is from 30°C to-20°C NO
3 NO - NO
4 YES Different operators, thus different values NO
5 YES
Samples were damaged during testing. We had severe
problems with freezing. Therefore, the results below
contain only the results which we think are reliable (to a certain point).
NO
6 YES Large differences between measurements, inappropriate
shear stress NO
7 YES data at 10°C-not asked for NO
8 NO - NO
9 NO - NO
10 NO - NO
11 YES Testing different gap for fixed the final gap for these tests. NO
12 NO - NO
13 NO - NO
14 NO - NO
15 YES
We are gaining experience with this testing method. There
are still a lot of uncertainties associated with the specimen geometry. We performed several tests (different specimen
preparation techniques, different strain levels) The phase
angle (who is independent of the geometry) was very similar between the tests. However, there was a lot of
variation in the dynamic shear modulus
NO
16 NO - Not yet
17 YES
Because the first measurement of the sample 25-55-55 at
the stress level 1 Mpa lead to error in measurement causing
the occurrence of non-representative results. Therefore, only results at the stress level 1 kPa are involved.
NO
18 YES no repeatibility NO
19 YES Ice formation at-20°C YES 17%
20 - - NO
21 NO - NO
22 YES
Test was prepared for 6 individual measurements (slightly scatter of results was observed- module value) + extra tests
which allowed create repetitive procedure for used device
for both spindles (4 and 8 mm)
YES 5 %
Comments
Lab. 1 We have a technical posibilities to perform test in-30 but bitumen specimens lost bond with steal plates when they coold down to-30. Results were unrealistic thus we did not includ them. We suppose that less strain should be applied, however
to confirm it we would need more time.
Lab. 5 Measurements will be reapeted as soon as the right equipement is placed into a working condition. There will be either nitrogen or dry air.
Lab. 10 samples were tested from the highest frequency to the lowest one.
Lab. 11 During the second sample for 25/55-55, we had a problem with our viscotherm VT 2, that stop current test. Because of the condensation on the pipe, the bath lost liquid, so we must to add a bit of mixing liquid (50 glycol/50 water) and
restart the test with the same sample.
The rheometer was stop current test when peltier plan was dropped in temperature. In the beginning of the test, it was dropping from 60°C to 0°C, and after the incident we restart from 21°C to 0°C, because 21°C was the temperature of the
peltier plan when the test was stopped.
Lab. 13 Rather than cooling with maximum cooling rate from loading temperature to first test temperature, I think we should define a specific cooling rate . I did not find the time to make a comparison of reproducability between rapid, undefined
cooling and defined cooling with small cooling rate. It looks like there is a structural impact present.
Lab. 15 We have some concerns about the magnitude of the shear modulus determined with the PP4. It seems too high. Lab. 16 we used-28 C not-30 C, and also 10 C was measured 10->-28

Final Report – ILS 4mm - 2019 Seite 19 von 54
6.5 Statistical analysis of rheological parameters @1.59Hz
6.5.1 Complex Shear Modulus G*
Characteristic: complex shear modulus G*
Material: 50/70
Frequency: 1.59Hz
Temperature: -30°C
laboratory value 1 value 2 mean value deviation lab deviation
z score [kPa] [kPa] [kPa] [%] [%]
11 335 268 312 420 323 844 3.53 -53.30 -2.27
17 342 707 475 787 409 247 16.26 -40.99 -1.75
4 552 430 543 180 547 805 0.84 -21.01 -0.90
12 568 480 543 100 555 790 2.28 -19.86 -0.85
3 596 744 562 533 579 639 2.95 -16.42 -0.70
6 580 400 616 310 598 355 3.00 -13.72 -0.58
13 627 448 713 064 670 256 6.39 -3.35 -0.14
9 665 844 712 635 689 240 3.39 -0.61 -0.03
16 758 167 713 094 735 630 3.06 6.08 0.26
7 757 300 798 200 777 750 2.63 12.15 0.52
14 814 120 806 720 810 420 0.46 16.86 0.72
20 840 371 799 973 820 172 2.46 18.27 0.78
19 849 014 795 945 822 480 3.23 18.60 0.79
10 852 320 846 760 849 540 0.33 22.50 0.96
21 890 794 810 000 850 397 4.75 22.62 0.96
22 934 338 791 248 862 793 8.29 24.41 1.04
8 852 710 919 400 886 055 3.76 27.77 1.18
5 2 115 219 - 2 115 219 0.00 205.01 8.74
general mean: 693 495
Figure 1 Complex shear modulus G* of plain binder 50/70 at 1.59Hz and -30°C
Lab 1, 2, 15 and 18 were not able to test at test temperature-30°C.
Lab 5 only provided one test result.
100 000
200 000
300 000
400 000
500 000
600 000
700 000
800 000
900 000
1 000 000
11 17 4 12 3 6 13 9 16 7 14 20 19 10 21 22 8 5com
ple
x s
hea
r m
od
ulu
s G
* [
kP
a]
laboratory

Final Report – ILS 4mm - 2019 Seite 20 von 54
Characteristic: complex shear modulus G*
Material: 50/70
Frequency: 1.59Hz
Temperature: -20°C
laboratory value 1 value 2 mean value deviation lab deviation
z score [kPa] [kPa] [kPa] [%] [%]
11 245 382 233 374 239 378 2.51 -51.51 -2.25
17 204 661 362 914 283 788 27.88 -42.51 -1.86
6 387 110 411 060 399 085 3.00 -19.15 -0.84
1 399 678 399 497 399 588 0.02 -19.05 -0.83
12 427 150 406 500 416 825 2.48 -15.56 -0.68
2 435 467 408 196 421 832 3.23 -14.55 -0.64
3 457 588 426 869 442 229 3.47 -10.42 -0.45
9 440 153 447 137 443 645 0.79 -10.13 -0.44
4 453 080 450 230 451 655 0.32 -8.51 -0.37
18 467 430 502 412 484 921 3.61 -1.77 -0.08
13 470 725 504 629 487 677 3.48 -1.21 -0.05
7 525 700 554 500 540 100 2.67 9.41 0.41
16 578 037 541 611 559 824 3.25 13.41 0.59
22 641 683 550 418 596 050 7.66 20.75 0.91
14 599 250 596 720 597 985 0.21 21.14 0.92
21 638 832 570 000 604 416 5.69 22.44 0.98
10 610 260 600 700 605 480 0.79 22.66 0.99
20 632 430 613 705 623 068 1.50 26.22 1.14
8 605 480 657 430 631 455 4.11 27.92 1.22
19 669 080 618 604 643 842 3.92 30.43 1.33
5 1 325 483 - 1 325 483 0.00 168.51 7.36 general mean: 493 642
Figure 2: complex shear modulus G* of plain binder 50/70 at 1.59Hz and -20°C
Lab 15 was not able to test at test temperature-20°C.
Lab 5 only provided one test result.
100 000
200 000
300 000
400 000
500 000
600 000
700 000
800 000
11 17 6 1 12 2 3 9 4 18 13 7 16 22 14 21 10 20 8 19 5com
ple
x s
hea
r m
od
ulu
s G
* [
kP
a]
laboratory

Final Report – ILS 4mm - 2019 Seite 21 von 54
Characteristic: complex shear modulus G*
Material: 50/70
Frequency: 1.59Hz
Temperature: -10°C
laboratory value 1 value 2 mean value deviation lab deviation z score
[kPa] [kPa] [kPa] [%] [%]
11 116 105 118 654 117 380 1.09 -52.11 -2.18
17 144 687 146 057 145 372 0.47 -40.69 -1.70
1 156 641 160 536 158 589 1.23 -35.29 -1.48
6 198 490 210 760 204 625 3.00 -16.51 -0.69
2 209 785 202 064 205 925 1.87 -15.98 -0.67
12 211 410 202 220 206 815 2.22 -15.62 -0.65
13 210 162 215 979 213 071 1.37 -13.06 -0.55
5 228 935 - 228 935 0.00 -6.59 -0.28
3 250 132 232 521 241 327 3.65 -1.54 -0.06
9 242 947 246 060 244 504 0.64 -0.24 -0.01
7 239 400 253 900 246 650 2.94 0.64 0.03
18 273 968 234 634 254 301 7.73 3.76 0.16
4 263 390 266 670 265 030 0.62 8.14 0.34
22 279 428 251 213 265 320 5.32 8.25 0.34
10 272 620 269 930 271 275 0.50 10.68 0.45
21 287 220 258 000 272 610 5.36 11.23 0.47
16 287 771 269 320 278 546 3.31 13.65 0.57
8 271 790 296 600 284 195 4.36 15.96 0.67
14 290 220 285 970 288 095 0.74 17.55 0.73
20 300 445 278 936 289 691 3.71 18.20 0.76
19 353 795 277 749 315 772 12.04 28.84 1.21
15 418 420 369 500 393 960 6.21 60.74 2.54 general mean: 245 090
Figure 3: complex shear modulus G* of plain binder 50/70 at 1.59Hz and-10°C
Lab 5 only provided one test result.
50 000
100 000
150 000
200 000
250 000
300 000
350 000
400 000
450 000
11 17 1 6 2 12 13 5 3 9 7 18 4 22 10 21 16 8 14 20 19 15com
ple
x s
hea
r m
od
ulu
s G
* [
kP
a]
laboratory

Final Report – ILS 4mm - 2019 Seite 22 von 54
Characteristic: complex shear modulus G*
Material: 50/70
Frequency: 1.59Hz
Temperature: 0°C
laboratory value 1 value 2 mean value deviation lab deviation
z score [kPa] [kPa] [kPa] [%] [%]
11 38 654 43 166 40 910 5.51 -44.57 -1.67
1 43 346 43 537 43 441 0.22 -41.14 -1.54
13 48 851 48 893 48 872 0.04 -33.78 -1.27
6 48 340 51 320 49 830 2.99 -32.48 -1.22
17 52 994 52 525 52 759 0.44 -28.51 -1.07
5 65 385 51 802 58 594 11.59 -20.60 -0.77
18 67 128 64 840 65 984 1.73 -10.59 -0.40
2 67 118 66 134 66 626 0.74 -9.72 -0.36
12 67 970 65 770 66 870 1.64 -9.39 -0.35
21 72 677 67 600 70 138 3.62 -4.96 -0.19
9 70 052 78 916 74 484 5.95 0.93 0.03
7 75 260 80 280 77 770 3.23 5.38 0.20
3 81 829 77 608 79 718 2.65 8.02 0.30
22 84 562 79 280 81 921 3.22 11.01 0.41
10 83 210 83 755 83 483 0.33 13.12 0.49
20 87 485 81 211 84 348 3.72 14.29 0.54
8 83 022 90 702 86 862 4.42 17.70 0.66
16 93 283 83 231 88 257 5.70 19.59 0.74
19 93 561 83 307 88 434 5.80 19.83 0.74
14 95 233 92 398 93 816 1.51 27.12 1.02
4 93 811 95 343 94 577 0.81 28.15 1.06
15 134 550 117 220 125 885 6.88 70.58 2.65 general mean: 73 799
Figure 4: complex shear modulus G* of plain binder 50/70 at 1.59Hz and 0°C
20 000
40 000
60 000
80 000
100 000
120 000
140 000
160 000
11 1 13 6 17 5 18 2 12 21 9 7 3 22 10 20 8 16 19 14 4 15com
ple
x s
hea
r m
od
ulu
s G
* [
kP
a]
laboratory

Final Report – ILS 4mm - 2019 Seite 23 von 54
Characteristic: complex shear modulus G*
Material: 25/55-55
Frequency: 1.59Hz
Temperature: -30°C
laboratory value 1 value 2 mean value deviation lab deviation
z score [kPa] [kPa] [kPa] [%] [%]
17 453 815 410 774 432 294 4.98 -37.76 -1.85
4 449 160 431 300 440 230 2.03 -36.61 -1.79
3 461 736 588 585 525 161 12.08 -24.39 -1.19
12 542 500 564 230 553 365 1.96 -20.32 -0.99
18 604 335 589 563 596 949 1.24 -14.05 -0.69
6 608 360 647 320 627 840 3.10 -9.60 -0.47
9 632 790 647 486 640 138 1.15 -7.83 -0.38
14 632 110 653 090 642 600 1.63 -7.48 -0.37
21 697 000 669 000 683 000 2.05 -1.66 -0.08
16 714 937 698 211 706 574 1.18 1.74 0.08
20 731 480 704 502 717 991 1.88 3.38 0.17
13 687 473 774 600 731 037 5.96 5.26 0.26
7 750 300 766 800 758 550 1.09 9.22 0.45
19 776 197 799 807 788 002 1.50 13.46 0.66
10 825 470 819 460 822 465 0.37 18.42 0.90
8 835 220 820 360 827 790 0.90 19.19 0.94
11 849 192 845 355 847 274 0.23 21.99 1.08
5 926 379 - 926 379 0.00 33.38 1.63
22 862 658 993 885 928 271 7.07 33.66 1.65 general mean: 694 522
Figure 5: complex shear modulus G* of polymer modified binder 25/55-55 at 1.59Hz and-30°C
Lab 1, 2 and 15 were not able to test at test temperature-30°C.
Lab 5 only provided one test result and is not included in general mean.
200 000
400 000
600 000
800 000
1 000 000
1 200 000
17 4 3 12 18 6 9 14 21 16 20 13 7 19 10 8 11 5com
ple
x s
hea
r m
od
ulu
s G
* [
kP
a]
laboratory

Final Report – ILS 4mm - 2019 Seite 24 von 54
Characteristic: complex shear modulus G*
Material: 25/55-55
Frequency: 1.59Hz
Temperature: -20°C
laboratory value 1 value 2 mean value deviation lab deviation
z score [kPa] [kPa] [kPa] [%] [%]
17 341 230 293 632 317 431 7.50 -36.06 -1.91
4 361 360 344 110 352 735 2.45 -28.94 -1.54
2 375 464 393 457 384 461 2.34 -22.55 -1.20
1 374 193 449 654 411 924 9.16 -17.02 -0.90
3 366 991 465 955 416 473 11.88 -16.11 -0.85
12 412 200 429 800 421 000 2.09 -15.19 -0.81
6 415 350 441 960 428 655 3.10 -13.65 -0.72
9 419 042 459 212 439 127 4.57 -11.54 -0.61
18 465 403 458 722 462 063 0.72 -6.92 -0.37
14 479 560 486 330 482 945 0.70 -2.71 -0.14
21 506 000 485 000 495 500 2.12 -0.19 -0.01
13 523 354 511 500 517 427 1.15 4.23 0.22
7 537 800 550 700 544 250 1.19 9.63 0.51
20 575 313 525 561 550 437 4.52 10.88 0.58
16 562 829 547 878 555 354 1.35 11.87 0.63
5 560 558 - 560 558 0.00 12.92 0.69
19 575 747 575 320 575 534 0.04 15.94 0.85
10 604 980 602 880 603 930 0.17 21.66 1.15
8 609 890 604 440 607 165 0.45 22.31 1.18
11 637 874 639 499 638 687 0.13 28.66 1.52
22 613 368 705 043 659 205 6.95 32.79 1.74 general mean: 496 422
Figure 6: complex shear modulus G* of polymer modified binder 25/55-55 at 1.59Hz and-20°C
Lab 15 was not able to test at test temperature-20°C.
Lab 5 only provided one test result and was included in general mean.
100 000
200 000
300 000
400 000
500 000
600 000
700 000
800 000
17 4 2 1 3 12 6 9 18 14 21 13 7 20 16 5 19 10 8 11 22com
ple
x s
hea
r m
od
ulu
s G
* [
kP
a]
laboratory
Final Report – ILS 4mm - 2019 Seite 25 von 54
Characteristic: complex shear modulus G*
Material: 25/55-55
Frequency: 1.59Hz
Temperature: -10°C
laboratory value 1 value 2 mean value deviation lab deviation
z score [kPa] [kPa] [kPa] [%] [%]
17 161 522 142 800 152 161 6.15 -39.44 -1.71
2 201 144 207 753 204 449 1.62 -18.63 -0.81
1 185 076 228 814 206 945 10.57 -17.64 -0.76
4 225 980 215 780 220 880 2.31 -12.09 -0.52
12 217 540 226 130 221 835 1.94 -11.71 -0.51
6 229 210 243 970 236 590 3.12 -5.84 -0.25
13 246 682 227 400 237 041 4.07 -5.66 -0.25
3 213 649 268 537 241 093 11.38 -4.05 -0.18
18 243 679 241 564 242 622 0.44 -3.44 -0.15
5 251 955 243 247 247 601 1.76 -1.46 -0.06
21 253 000 243 000 248 000 2.02 -1.30 -0.06
20 249 610 246 412 248 011 0.64 -1.29 -0.06
14 248 540 247 590 248 065 0.19 -1.27 -0.06
9 255 057 250 901 252 979 0.82 0.68 0.03
19 268 301 249 769 259 035 3.58 3.09 0.13
7 266 300 272 300 269 300 1.11 7.18 0.31
10 296 370 294 590 295 480 0.30 17.60 0.76
8 299 100 299 660 299 380 0.09 19.15 0.83
16 306 225 295 478 300 851 1.79 19.74 0.85
22 292 603 337 623 315 113 7.14 25.41 1.10
11 326 897 331 272 329 085 0.66 30.97 1.34
15 461 160 443 160 452 160 1.99 79.96 3.46 general mean: 251 263
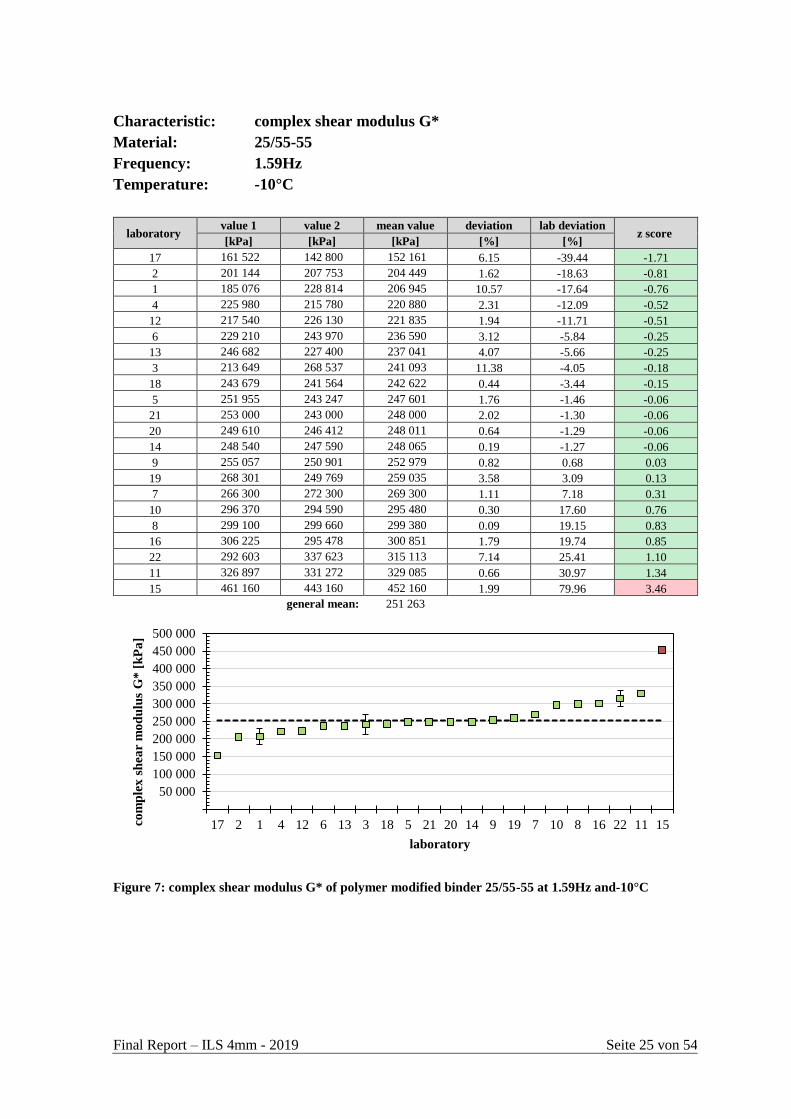
Figure 7: complex shear modulus G* of polymer modified binder 25/55-55 at 1.59Hz and-10°C
50 000
100 000
150 000
200 000
250 000
300 000
350 000
400 000
450 000
500 000
17 2 1 4 12 6 13 3 18 5 21 20 14 9 19 7 10 8 16 22 11 15com
ple
x s
hea
r m
od
ulu
s G
* [
kP
a]
laboratory

Final Report – ILS 4mm - 2019 Seite 26 von 54
Characteristic: complex shear modulus G*
Material: 25/55-55
Frequency: 1.59Hz
Temperature: 0°C
laboratory
value 1 value 2 mean value deviation lab deviation z score
[kPa] [kPa] [kPa] [%] [%]
17 63 851 60 026 61 938 3,09 -28,90 -1,24
13 61 263 68 540 64 901 5,61 -25,50 -1,09
1 67 608 70 008 68 808 1,74 -21,01 -0,90
2 70 383 73 462 71 922 2,14 -17,44 -0,75
6 76 290 81 150 78 720 3,09 -9,63 -0,41
12 76 941 80 732 78 837 2,40 -9,50 -0,41
19 89 680 73 022 81 351 10,24 -6,61 -0,28
20 82 160 80 835 81 498 0,81 -6,44 -0,28
5 87 396 82 521 84 959 2,87 -2,47 -0,11
14 86 368 84 556 85 462 1,06 -1,89 -0,08
9 83 678 87 871 85 775 2,44 -1,53 -0,07
4 90 105 86 018 88 062 2,32 1,09 0,05
3 83 337 95 259 89 298 6,68 2,51 0,11
21 92 800 86 500 89 650 3,51 2,91 0,13
18 91 181 88 279 89 730 1,62 3,01 0,13
7 91 160 92 910 92 035 0,95 5,65 0,24
10 101 030 100 310 100 670 0,36 15,57 0,67
8 102 230 102 510 102 370 0,14 17,52 0,75
16 108 275 100 928 104 601 3,51 20,08 0,86
22 98 625 114 288 106 456 7,36 22,21 0,95
11 120 630 123 951 122 291 1,36 40,38 1,73
15 159 570 153 020 156 295 2,10 79,42 3,41 general mean: 87 111
Figure 8: complex shear modulus G* of polymer modified binder 25/55-55 at 1.59Hz and 0°C
20 000
40 000
60 000
80 000
100 000
120 000
140 000
160 000
180 000
17 13 1 2 6 12 19 20 5 14 9 4 3 21 18 7 10 8 16 22 11 15com
ple
x s
hea
r m
od
ulu
s G
* [
kP
a]
laboratory

Final Report – ILS 4mm - 2019 Seite 27 von 54
6.5.2 Phase angle δ
Characteristic: phase angle δ
Material: 50/70
Frequency: 1.59Hz
Temperature: -30°C
laboratory value 1 value 2 mean value deviation lab deviation
z score [°] [°] [°] [%] [%]
7 4.83 4.74 4.79 1.02 -30.44 -1.79
10 5.07 5.12 5.10 0.49 -25.94 -1.53
11 5.63 5.58 5.61 0.45 -18.50 -1.09
8 5.87 5.59 5.73 2.44 -16.71 -0.98
16 6.16 6.42 6.29 2.13 -8.56 -0.50
19 6.52 6.52 6.52 0.00 -5.18 -0.31
4 5.55 8.04 6.80 18.32 -1.23 -0.07
22 6.96 6.83 6.89 0.94 0.19 0.01
3 7.00 6.80 6.90 1.45 0.30 0.02
13 8.48 5.57 7.03 20.73 2.14 0.13
21 7.09 7.23 7.16 0.97 4.06 0.24
9 7.30 7.20 7.25 0.69 5.39 0.32
12 7.31 7.45 7.38 0.95 7.28 0.43
14 7.58 7.48 7.53 0.66 9.46 0.56
20 7.52 7.66 7.59 0.96 10.35 0.61
17 9.27 8.82 9.04 2.46 31.48 1.85
6 9.50 9.20 9.35 1.60 35.91 2.11 general mean: 6.88
Figure 9: Phase angle δ of plain binder 50/70 at 1.59Hz and-30°C
Lab 1, 2, 5, 15 and 18 were not able to test at test temperature -30°C.
4
5
6
7
8
9
10
7 10 11 8 16 19 4 22 3 13 21 9 12 14 20 17 6
ph
ase
an
gle
δ [
°]
laboratory

Final Report – ILS 4mm - 2019 Seite 28 von 54
Characteristic: phase angle δ
Material: 50/70
Frequency: 1.59Hz
Temperature: -20°C
laboratory value 1 value 2 mean value deviation lab deviation
z score [°] [°] [°] [%] [%]
4 8.69 9.66 9.18 5.29 -17.72 -1.41
16 9.36 9.76 9.56 2.06 -14.26 -1.13
11 10.15 9.34 9.74 4.17 -12.63 -1.00
10 9.82 9.90 9.86 0.41 -11.58 -0.92
1 9.40 10.52 9.96 5.62 -10.69 -0.85
7 10.03 10.04 10.04 0.05 -10.01 -0.79
18 10.86 9.44 10.15 7.00 -8.98 -0.71
19 10.38 10.34 10.36 0.19 -7.09 -0.56
3 11.00 10.70 10.85 1.38 -2.70 -0.21
8 11.07 10.63 10.85 2.03 -2.70 -0.21
2 10.91 11.21 11.06 1.37 -0.85 -0.07
20 11.30 11.11 11.20 0.83 0.47 0.04
12 11.39 11.51 11.45 0.52 2.68 0.21
14 11.60 11.49 11.55 0.48 3.53 0.28
13 12.47 10.81 11.64 7.14 4.39 0.35
22 12.21 12.14 12.18 0.29 9.20 0.73
21 12.30 12.17 12.24 0.53 9.73 0.77
9 12.90 12.80 12.85 0.39 15.23 1.21
17 14.21 12.53 13.37 6.29 19.91 1.58
6 15.20 14.70 14.95 1.67 34.06 2.70 general mean: 11.15
Figure 10: Phase angle δ of plain binder 50/70 at 1.59Hz and-20°C
Lab 5 and 15 were not able to test at test temperature -20°C.
8
9
10
11
12
13
14
15
16
4 16 11 10 1 7 18 19 3 8 2 20 12 14 13 22 21 9 17 6
ph
ase
an
gle
δ [
°]
laboratory

Final Report – ILS 4mm - 2019 Seite 29 von 54
Characteristic: phase angle δ
Material: 50/70
Frequency: 1.59Hz
Temperature: -10°C
laboratory value 1 value 2 mean value deviation lab deviation
z score [°] [°] [°] [%] [%]
4 17.18 17.17 17.18 0.03 -16.83 -2.02
16 18.18 18.71 18.45 1.43 -10.66 -1.28
18 17.94 19.54 18.74 4.27 -9.25 -1.11
11 19.95 17.77 18.86 5.79 -8.67 -1.04
3 19.40 19.20 19.30 0.52 -6.53 -0.79
10 19.94 20.05 20.00 0.28 -3.17 -0.38
19 19.00 21.12 20.06 5.27 -2.85 -0.34
20 20.17 20.09 20.13 0.20 -2.52 -0.30
7 20.23 20.16 20.20 0.17 -2.20 -0.26
14 20.14 20.32 20.23 0.44 -2.03 -0.24
2 20.34 20.23 20.29 0.27 -1.75 -0.21
12 20.60 20.55 20.58 0.12 -0.36 -0.04
9 20.90 20.80 20.85 0.24 0.97 0.12
15 21.19 20.60 20.90 1.41 1.19 0.14
8 21.59 21.26 21.43 0.77 3.76 0.45
13 22.00 21.85 21.92 0.34 6.17 0.74
21 21.93 21.97 21.95 0.10 6.30 0.76
22 22.37 21.84 22.10 1.19 7.04 0.85
1 22.07 22.62 22.34 1.23 8.19 0.98
6 23.30 22.70 23.00 1.30 11.38 1.37
17 25.18 25.13 25.16 0.09 21.83 2.62 general mean: 20.65
Figure 11: Phase angle δ of plain binder 50/70 at 1.59Hz and-10°C
Lab 5 was not able to test at test temperature -10°C.
16
17
18
19
20
21
22
23
24
25
26
4 16 18 11 3 10 19 20 7 14 2 12 9 15 8 13 21 22 1 6 17
ph
ase
an
gle
δ [
°]
laboratory

Final Report – ILS 4mm - 2019 Seite 30 von 54
Characteristic: phase angle δ
Material: 50/70
Frequency: 1.59Hz
Temperature: 0°C
laboratory value 1 value 2 mean value deviation lab deviation
z score [°] [°] [°] [%] [%]
11 31.62 28.72 30.17 4.80 -9.83 -1.70
4 30.37 30.36 30.37 0.02 -9.26 -1.60
14 31.24 31.72 31.48 0.76 -5.93 -1.02
16 31.34 32.49 31.91 1.80 -4.63 -0.80
3 32.30 32.00 32.15 0.47 -3.93 -0.68
20 32.17 32.13 32.15 0.05 -3.92 -0.68
2 32.42 32.05 32.23 0.58 -3.68 -0.64
7 32.63 32.47 32.55 0.25 -2.73 -0.47
10 32.63 32.71 32.67 0.12 -2.37 -0.41
9 33.20 32.50 32.85 1.07 -1.84 -0.32
12 33.03 32.80 32.92 0.35 -1.64 -0.28
19 33.05 33.24 33.14 0.29 -0.96 -0.17
15 33.29 33.10 33.20 0.29 -0.80 -0.14
18 34.23 33.22 33.73 1.50 0.78 0.13
22 34.49 33.63 34.06 1.26 1.78 0.31
5 34.43 34.16 34.29 0.39 2.48 0.43
8 34.50 34.29 34.40 0.31 2.78 0.48
6 35.90 35.10 35.50 1.13 6.08 1.05
21 35.40 35.67 35.54 0.37 6.19 1.07
1 35.99 36.63 36.31 0.89 8.50 1.47
13 36.91 36.59 36.75 0.44 9.82 1.70
17 37.80 37.91 37.85 0.15 13.12 2.26 general mean: 33.46
Figure 12: Phase angle δ of plain binder 50/70 at 1.59Hz and 0°C
28
30
32
34
36
38
40
11 4 14 16 3 20 2 7 10 9 12 19 15 18 22 5 8 6 21 1 13 17
ph
ase
an
gle
δ [
°]
laboratory

Final Report – ILS 4mm - 2019 Seite 31 von 54
Characteristic: phase angle δ
Material: 25/55-55
Frequency: 1.59Hz
Temperature: -30°C
laboratory value 1 value 2 mean value deviation lab deviation
z score [°] [°] [°] [%] [%]
7 4.69 4.59 4.64 1.12 -30.66 -1.75
5 5.04 - 5.04 0.00 -24.72 -1.41
10 5.32 5.24 5.28 0.76 -21.09 -1.20
11 5.43 5.42 5.43 0.10 -18.87 -1.07
8 5.70 5.38 5.54 2.89 -17.21 -0.98
16 5.71 5.86 5.78 1.30 -13.56 -0.77
3 6.07 6.32 6.19 2.01 -7.44 -0.42
19 6.64 6.41 6.52 1.72 -2.49 -0.14
13 7.56 5.74 6.65 13.67 -0.64 -0.04
9 6.90 6.90 6.90 0.00 3.12 0.18
22 6.86 6.95 6.90 0.60 3.17 0.18
12 6.99 6.93 6.96 0.43 4.01 0.23
21 7.00 7.07 7.03 0.53 5.14 0.29
14 7.40 7.39 7.40 0.07 10.52 0.60
20 7.49 7.32 7.40 1.15 10.64 0.61
4 7.55 7.67 7.61 0.79 13.73 0.78
6 8.50 8.40 8.45 0.59 26.28 1.50
17 8.35 8.97 8.66 3.59 29.37 1.67
18 10.11 7.38 8.75 15.61 30.69 1.75 general mean: 6.69
Figure 13: Phase angle δ polymer modified binder 25/55-55 at 1.59Hz and-30°C
Lab 1. 2 and 15 were not able to test at test temperature -30°C.
Lab 5 only provided one test result.
4
5
6
7
8
9
10
11
7 5 10 11 8 16 3 19 13 9 22 12 21 14 20 4 6 17 18
ph
ase
an
gle
δ [
°]
laboratory

Final Report – ILS 4mm - 2019 Seite 32 von 54
Characteristic: phase angle δ
Material: 25/55-55
Frequency: 1.59Hz
Temperature: -20°C
laboratory value 1 value 2 mean value deviation lab deviation
z score [°] [°] [°] [%] [%]
16 8.26 8.49 8.38 1.38 -18.59 -1.68
7 8.81 8.88 8.84 0.36 -14.04 -1.27
11 9.08 8.95 9.02 0.70 -12.34 -1.11
5 9.04 - 9.04 0.00 -12.11 -1.09
10 9.15 9.08 9.12 0.38 -11.40 -1.03
3 9.21 9.49 9.35 1.54 -9.13 -0.82
8 9.85 9.44 9.65 2.13 -6.25 -0.56
2 10.29 9.52 9.91 3.93 -3.73 -0.34
1 10.08 9.97 10.03 0.51 -2.55 -0.23
18 10.13 10.17 10.15 0.20 -1.34 -0.12
19 10.32 10.37 10.35 0.22 0.57 0.05
12 10.46 10.37 10.42 0.43 1.23 0.11
4 10.52 10.47 10.50 0.24 2.01 0.18
14 10.69 10.94 10.82 1.16 5.12 0.46
20 10.71 10.98 10.85 1.26 5.42 0.49
21 10.85 10.89 10.87 0.19 5.66 0.51
13 11.43 10.53 10.98 4.10 6.72 0.61
22 11.06 11.15 11.10 0.38 7.91 0.71
9 11.20 11.40 11.30 0.88 9.83 0.89
17 11.95 12.28 12.11 1.35 17.74 1.60
6 13.50 13.10 13.30 1.50 29.27 2.64 general mean: 10.29
Figure 14: Phase angle δ polymer modified binder 25/55-55 at 1.59Hz and-20°C
Lab 15 was not able to test at test temperature -20°C.
Lab 5 only provided one test result.
8
9
10
11
12
13
14
16 7 11 5 10 3 8 2 1 18 19 12 4 14 20 21 13 22 9 17 6
ph
ase
an
gle
δ [
°]
laboratory

Final Report – ILS 4mm - 2019 Seite 33 von 54
Characteristic: phase angle δ
Material: 25/55-55
Frequency: 1.59Hz
Temperature: -10°C
laboratory value 1 value 2 mean value deviation lab deviation
z score [°] [°] [°] [%] [%]
16 15.46 15.92 15.69 1.47 -15.12 -2.25
3 16.48 16.92 16.70 1.32 -9.69 -1.44
4 16.97 17.08 17.03 0.32 -7.92 -1.18
11 17.46 17.19 17.32 0.79 -6.30 -0.94
7 17.70 17.61 17.66 0.25 -4.52 -0.67
2 18.02 17.49 17.75 1.49 -3.99 -0.59
10 17.75 17.82 17.79 0.20 -3.81 -0.57
18 18.17 18.14 18.16 0.08 -1.81 -0.27
5 18.07 18.40 18.23 0.93 -1.39 -0.21
12 18.41 18.36 18.39 0.14 -0.57 -0.08
14 18.27 18.72 18.50 1.22 0.03 0.00
9 18.60 18.50 18.55 0.27 0.33 0.05
15 18.56 18.59 18.58 0.08 0.46 0.07
8 18.84 18.32 18.58 1.40 0.49 0.07
1 18.80 18.43 18.62 0.98 0.68 0.10
21 18.94 18.83 18.88 0.28 2.12 0.32
20 19.58 18.92 19.25 1.70 4.11 0.61
22 19.63 19.50 19.56 0.33 5.79 0.86
19 19.36 20.60 19.98 3.10 8.06 1.20
6 20.30 19.90 20.10 1.00 8.71 1.30
13 20.37 19.94 20.15 1.07 9.00 1.34
17 21.36 21.29 21.33 0.17 15.34 2.28 general mean: 18.49
Figure 15: Phase angle δ polymer modified binder 25/55-55 at 1.59Hz and-10°C
15
16
17
18
19
20
21
22
16 3 4 11 7 2 10 18 5 12 14 9 15 8 1 21 20 22 19 6 13 17
ph
ase
an
gle
δ [
°]
laboratory

Final Report – ILS 4mm - 2019 Seite 34 von 54
Characteristic: phase angle δ
Material: 25/55-55
Frequency: 1.59Hz
Temperature: 0°C
laboratory value 1 value 2 mean value deviation lab deviation
z score [°] [°] [°] [%] [%]
16 27.43 28.39 27.91 1.72 -6.35 -1.49
11 28.28 27.76 28.02 0.93 -6.00 -1.40
4 28.11 28.15 28.13 0.07 -5.62 -1.32
3 28.34 28.76 28.55 0.73 -4.21 -0.99
2 29.16 28.61 28.88 0.94 -3.09 -0.72
7 29.30 29.27 29.29 0.05 -1.74 -0.41
9 29.10 29.50 29.30 0.68 -1.69 -0.40
10 29.27 29.43 29.35 0.27 -1.52 -0.36
14 29.08 29.62 29.35 0.92 -1.52 -0.36
21 29.33 29.41 29.37 0.14 -1.46 -0.34
18 29.31 29.46 29.39 0.26 -1.41 -0.33
5 29.29 29.82 29.55 0.88 -0.84 -0.20
20 29.87 29.48 29.67 0.66 -0.44 -0.10
12 29.76 29.62 29.69 0.24 -0.38 -0.09
15 30.14 30.14 30.14 0.00 1.13 0.26
8 30.56 30.11 30.34 0.74 1.78 0.42
22 30.58 30.35 30.46 0.38 2.21 0.52
1 29.78 31.44 30.61 2.71 2.70 0.63
17 31.06 31.11 31.09 0.08 4.31 1.01
6 31.70 31.30 31.50 0.63 5.69 1.33
19 30.57 33.08 31.83 3.95 6.78 1.59
13 33.51 33.07 33.29 0.66 11.69 2.74 general mean: 29.80
Figure 16: Phase angle δ polymer modified binder 25/55-55 at 1.59Hz and 0°C
27
28
29
30
31
32
33
34
16 11 4 3 2 7 9 10 14 21 18 5 20 12 15 8 22 1 17 6 19 13
ph
ase
an
gle
δ [
°]
laboratory

Final Report – ILS 4mm - 2019 Seite 35 von 54
6.6 Graphical analysis of rheological parameters @0.1Hz
6.6.1 Complex Shear Modulus G*
Figure 17: complex shear modulus G* of plain binder 50/70 at 0.1Hz and -30°C
Figure 18: complex shear modulus G* of plain binder 50/70 at 0.1Hz and -20°C
200 000
400 000
600 000
800 000
1000 000
1200 000
1400 000
1600 000
1800 000
11 17 6 12 4 3 9 13 16 20 14 21 19 7 22 10 8 5com
ple
x s
hea
r m
od
ulu
s G
* [
kP
a]
laboratory
200 000
400 000
600 000
800 000
1 000 000
1 200 000
11 17 6 9 12 1 2 3 18 13 4 16 22 7 21 14 20 8 10 19 5com
ple
x s
hea
r m
od
ulu
s G
* [
kP
a]
laboratory

Final Report – ILS 4mm - 2019 Seite 36 von 54
Figure 19: complex shear modulus G* of plain binder 50/70 at 0.1Hz and -10°C
Figure 20: complex shear modulus G* of plain binder 50/70 at 0.1Hz and 0°C
Figure 21: complex shear modulus G* of polymer modified binder 25/55-55 at 0.1Hz and -30°C
50 000
100 000
150 000
200 000
250 000
17 11 1 6 12 13 2 9 5 18 22 3 7 21 8 16 10 4 20 14 19 15com
ple
x s
hea
r m
od
ulu
s G
* [
kP
a]
laboratory
5 000
10 000
15 000
20 000
25 000
30 000
35 000
40 000
45 000
50 000
17 13 1 11 6 5 12 21 9 2 18 22 7 3 8 10 19 20 16 14 4 15com
ple
x s
hea
r m
od
ulu
s G
* [
kP
a]
laboratory
100 000
200 000
300 000
400 000
500 000
600 000
700 000
800 000
900 000
17 4 18 3 12 6 9 14 16 21 20 13 19 7 8 10 11 22 5com
ple
x s
hea
r m
od
ulu
s G
* [
kP
a]
laboratory

Final Report – ILS 4mm - 2019 Seite 37 von 54
Figure 22: complex shear modulus G* of polymer modified binder 25/55-55 at 0.1Hz and -20°C
Figure 23: complex shear modulus G* of polymer modified binder 25/55-55 at 0.1Hz and -10°C
Figure 24: complex shear modulus G* of polymer modified binder 25/55-55 at 0.1Hz and 0°C
50 000
100 000
150 000
200 000
250 000
300 000
350 000
400 000
450 000
500 000
17 4 6 9 2 1 12 3 14 21 18 13 20 16 7 19 5 8 22 10 11com
ple
x s
hea
r m
od
ulu
s G
* [
kP
a]
laboratory
50 000
100 000
150 000
200 000
250 000
17 1 2 6 12 13 4 18 9 21 20 5 14 3 19 7 8 22 10 16 11 15com
ple
x s
hea
r m
od
ulu
s G
* [
kP
a]
laboratory
10 000
20 000
30 000
40 000
50 000
60 000
13 17 1 6 2 19 12 9 20 5 14 18 21 3 4 7 8 22 10 16 11 15com
ple
x s
hea
r m
od
ulu
s G
* [
kP
a]
laboratory

Final Report – ILS 4mm - 2019 Seite 38 von 54
6.6.2 Phase Angle δ
Figure 25: Phase angle δ of plain binder 50/70 at 0.1Hz and -30°C
Figure 26: Phase angle δ of plain binder 50/70 at 0.1Hz and -20°C
Figure 27: Phase angle δ of plain binder 50/70 at 0.1Hz and -10°C
4
6
8
10
12
14
16
18
7 10 11 8 16 19 3 13 22 14 21 20 12 4 9 6 17
ph
ase
an
gle
δ[°
]
laboratory
12
14
16
18
20
22
24
11 4 10 7 16 19 1 2 20 14 3 8 13 12 18 21 22 17 9 6
ph
ase
an
gle
δ [
°]
laboratory
22
24
26
28
30
32
34
36
38
11 4 18 20 14 16 10 3 7 2 19 15 12 21 13 8 22 1 9 6 17
ph
ase
an
gle
δ [
°]
laboratory

Final Report – ILS 4mm - 2019 Seite 39 von 54
Figure 28: Phase angle δ of plain binder 50/70 at 0.1Hz and 0°C
Figure 29: Phase angle δ of polymer modified binder 25/55-55 at 0.1Hz and -30°C
Figure 30: Phase angle δ of polymer modified binder 25/55-55 at 0.1Hz and -20°C
34
36
38
40
42
44
46
48
50
52
54
11 14 20 4 2 16 15 7 3 10 19 12 18 9 22 5 8 21 1 6 13 17
ph
ase
an
gle
δ [
°]
laboratory
4
6
8
10
12
14
16
18
7 10 5 11 8 16 3 13 19 22 12 21 14 9 18 20 4 6 17
ph
ase
an
gle
δ[°
]
laboratory
12
14
16
18
20
22
24
16 7 11 10 5 3 8 2 19 14 1 20 12 21 13 22 4 17 9 18 6
ph
ase
an
gle
δ [
°]
laboratory

Final Report – ILS 4mm - 2019 Seite 40 von 54
Figure 31: Phase angle δ of polymer modified binder 25/55-55 at 0.1Hz and -10°C
Figure 32: Phase angle δ of polymer modified binder 25/55-55 at 0.1Hz and 0°C
22
23
24
25
26
27
28
29
30
31
32
16 11 3 2 7 10 4 14 5 15 20 1 21 12 18 8 22 19 9 13 6 17
ph
ase
an
gle
δ [
°]
laboratory
34
35
36
37
38
39
40
41
42
43
44
11 16 2 20 14 4 3 5 21 7 10 15 9 18 12 1 22 8 17 6 19 13
ph
ase
an
gle
δ [
°]
laboratory

Final Report – ILS 4mm - 2019 Seite 41 von 54
6.7 Graphical analysis of rheological parameters @1.0Hz
6.7.1 Complex Shear Modulus G*
Figure 33: complex shear modulus G* of plain binder 50/70 at 1.0Hz and -30°C
Figure 34: complex shear modulus G* of plain binder 50/70 at 1.0Hz and -20°C
500 000
1 000 000
1 500 000
2 000 000
2 500 000
11 17 4 12 3 6 13 9 16 7 14 20 19 21 10 22 8 5com
ple
x s
hea
r m
od
ulu
s G
* [
kP
a]
laboratory
200 000
400 000
600 000
800 000
1 000 000
1 200 000
1 400 000
11 17 6 1 12 9 2 3 4 18 13 7 16 22 14 21 10 20 8 19 5com
ple
x s
hea
r m
od
ulu
s G
* [
kP
a]
laboratory

Final Report – ILS 4mm - 2019 Seite 42 von 54
Figure 35: complex shear modulus G* of plain binder 50/70 at 1.0Hz and -10°C
Figure 36: complex shear modulus G* of plain binder 50/70 at 1.0Hz and 0°C
Figure 37: complex shear modulus G* of polymer modified binder 25/55-55 at 1.0Hz and -30°C
50 000
100 000
150 000
200 000
250 000
300 000
350 000
400 000
11 17 1 6 2 12 13 5 9 3 7 18 22 4 21 10 16 8 14 20 19 15com
ple
x s
hea
r m
od
ulu
s G
* [
kP
a]
laboratory
20 000
40 000
60 000
80 000
100 000
120 000
11 1 13 17 6 5 2 12 18 21 9 7 3 22 10 20 8 19 16 14 4 15com
ple
x s
hea
r m
od
ulu
s G
* [
kP
a]
laboratory
200 000
400 000
600 000
800 000
1 000 000
1 200 000
17 4 3 18 12 6 9 14 21 16 20 13 7 19 10 8 11 22 5com
ple
x s
hea
r m
od
ulu
s G
* [
kP
a]
laboratory

Final Report – ILS 4mm - 2019 Seite 43 von 54
Figure 38: complex shear modulus G* of polymer modified binder 25/55-55 at 1.0Hz and -20°C
Figure 39: complex shear modulus G* of polymer modified binder 25/55-55 at 1.0Hz and -10°C
Figure 40: complex shear modulus G* of polymer modified binder 25/55-55 at 1.0Hz and 0°C
100 000
200 000
300 000
400 000
500 000
600 000
700 000
17 4 2 1 3 6 12 9 18 14 21 13 7 20 16 5 19 10 8 11 22com
ple
x s
hea
r m
od
ulu
s G
* [
kP
a]
laboratory
50 000
100 000
150 000
200 000
250 000
300 000
350 000
400 000
450 000
17 2 1 12 4 6 13 18 3 20 5 21 14 9 19 7 10 8 16 22 11 15com
ple
x s
hea
r m
od
ulu
s G
* [
kP
a]
laboratory
20 000
40 000
60 000
80 000
100 000
120 000
140 000
160 000
17 13 1 2 6 12 19 20 9 5 14 4 3 21 18 7 10 8 22 16 11 15com
ple
x s
hea
r m
od
ulu
s G
* [
kP
a]
laboratory

Final Report – ILS 4mm - 2019 Seite 44 von 54
6.7.2 Phase Angle δ
Figure 41: Phase angle δ of plain binder 50/70 at 1.0Hz and -30°C
Figure 42: Phase angle δ of plain binder 50/70 at 1.0Hz and -20°C
Figure 43: Phase angle δ of plain binder 50/70 at 1.0Hz and -10°C
4
5
6
7
8
9
10
11
7 10 11 8 16 19 3 22 13 4 21 9 12 20 14 6 17
ph
ase
an
gle
δ [
°]
laboratory
9
10
11
12
13
14
15
16
17
4 16 11 10 7 1 19 2 3 8 18 20 14 12 13 22 21 9 17 6
ph
ase
an
gle
δ [
°]
laboratory
17
19
21
23
25
27
29
4 16 18 11 3 10 20 19 14 7 2 12 15 9 8 21 13 22 1 6 17
ph
ase
an
gle
δ [
°]
laboratory

Final Report – ILS 4mm - 2019 Seite 45 von 54
Figure 44: Phase angle δ of plain binder 50/70 at 1.0Hz and 0°C
Figure 45: Phase angle δ of polymer modified binder 25/55-55 at 1.0Hz and -30°C
Figure 46: Phase angle δ of polymer modified binder 25/55-55 at 1.0Hz and -20°C
30
32
34
36
38
40
42
11 4 14 20 16 2 3 7 10 12 15 19 9 18 22 5 8 21 6 1 13 17
ph
ase
an
gle
δ [
°]
laboratory
4
5
6
7
8
9
10
11
7 5 10 11 8 16 3 19 13 22 9 9 21 14 20 4 18 6 17
ph
ase
an
gle
δ [
°]
laboratory
8
9
10
11
12
13
14
15
16 7 11 5 10 3 8 2 18 19 12 1 4 14 21 20 13 22 9 17 6
ph
ase
an
gle
δ [
°]
laboratory

Final Report – ILS 4mm - 2019 Seite 46 von 54
Figure 47: Phase angle δ of polymer modified binder 25/55-55 at 1.0Hz and -10°C
Figure 48: Phase angle δ of polymer modified binder 25/55-55 at 1.0Hz and 0°C
16
17
18
19
20
21
22
23
24
16 3 4 11 7 10 2 5 12 14 15 18 8 9 1 21 20 22 19 13 6 17
ph
ase
an
gle
δ [
°]
laboratory
28
29
30
31
32
33
34
35
36
11 16 4 3 2 14 10 21 18 9 7 20 5 12 15 8 22 1 17 6 19 13
ph
ase
an
gle
δ [
°]
laboratory

Final Report – ILS 4mm - 2019 Seite 47 von 54
6.8 Graphical analysis of rheological parameters @10.0Hz
6.8.1 Complex Shear Modulus G*
Figure 49: complex shear modulus G* of plain binder 50/70 at 10.0Hz and -30°C
Figure 50: complex shear modulus G* of plain binder 50/70 at 10.0Hz and -20°C
500 000
1 000 000
1 500 000
2 000 000
2 500 000
11 17 4 12 3 6 13 9 7 16 19 14 10 20 21 22 8 5com
ple
x s
hea
r m
od
ulu
s G
* [
kP
a]
laboratory
200 000
400 000
600 000
800 000
1 000 000
1 200 000
1 400 000
1 600 000
11 17 1 12 2 6 4 3 9 18 13 7 16 10 14 22 21 20 8 19 5com
ple
x s
hea
r m
od
ulu
s G
* [
kP
a]
laboratory

Final Report – ILS 4mm - 2019 Seite 48 von 54
Figure 51: complex shear modulus G* of plain binder 50/70 at 10.0Hz and -10°C
Figure 52: complex shear modulus G* of plain binder 50/70 at 10.0Hz and 0°C
Figure 53: complex shear modulus G* of polymer modified binder 25/55-55 at 10.0Hz and -30°C
50 000
100 000
150 000
200 000
250 000
300 000
350 000
400 000
450 000
500 000
11 17 1 2 12 6 13 5 3 7 18 4 9 10 22 21 16 14 20 8 19com
ple
x s
hea
r m
od
ulu
s G
* [
kP
a]
laboratory
50 000
100 000
150 000
200 000
250 000
300 000
11 1 13 17 5 6 12 2 21 9 18 7 3 10 20 22 19 16 4 8 14 15com
ple
x s
hea
r m
od
ulu
s G
* [
kP
a]
laboratory
200 000
400 000
600 000
800 000
1 000 000
1 200 000
17 3 18 12 4 9 6 14 21 20 16 13 7 19 10 8 11 5 22com
ple
x s
hea
r m
od
ulu
s G
* [
kP
a]
laboratory

Final Report – ILS 4mm - 2019 Seite 49 von 54
Figure 54: complex shear modulus G* of polymer modified binder 25/55-55 at 10.0Hz and -20°C
Figure 55: complex shear modulus G* of polymer modified binder 25/55-55 at 10.0Hz and - 10°C
Figure 56: complex shear modulus G* of polymer modified binder 25/55-55 at 10.0Hz and 0°C
100 000
200 000
300 000
400 000
500 000
600 000
700 000
800 000
900 000
1 000 000
17 4 2 3 1 12 9 6 18 14 21 13 7 5 20 16 19 10 8 11 22com
ple
x s
hea
r m
od
ulu
s G
* [
kP
a]
laboratory
100 000
200 000
300 000
400 000
500 000
600 000
700 000
17 2 1 4 12 3 18 13 6 5 14 21 20 9 7 19 10 8 16 11 22com
ple
x s
hea
r m
od
ulu
s G
* [
kP
a]
laboratory
50 000
100 000
150 000
200 000
250 000
300 000
17 1 13 2 12 6 20 19 5 4 14 9 3 21 18 7 10 16 8 22 11 15com
ple
x s
hea
r m
od
ulu
s G
* [
kP
a]
laboratory

Final Report – ILS 4mm - 2019 Seite 50 von 54
6.8.2 Phase angle δ
Figure 57: Phase angle δ of plain binder 50/70 at 10.0Hz and -30°C
Figure 58: Phase angle δ of plain binder 50/70 at 10.0Hz and -20°C
Figure 59: Phase angle δ of plain binder 50/70 at 10.0Hz and -10°C
1
2
3
4
5
6
7
10 7 11 8 16 19 4 3 22 12 13 21 9 20 14 17 6
ph
ase
an
gle
δ [
°]
laboratory
4
5
6
7
8
9
10
11
12
4 16 10 19 11 1 18 7 8 3 2 12 13 14 22 21 20 9 17 6
ph
ase
an
gle
δ [
°]
laboratory
10
12
14
16
18
20
22
4 16 18 3 11 10 7 2 12 20 14 19 9 8 21 13 22 1 6 17
ph
ase
an
gle
δ [
°]
laboratory

Final Report – ILS 4mm - 2019 Seite 51 von 54
Figure 60: Phase angle δ of plain binder 50/70 at 10.0Hz and 0°C
Figure 61: Phase angle δ of polymer modified binder 25/55-55 at 10.0Hz and -30°C
Figure 62: Phase angle δ of polymer modified binder 25/55-55 at 10.0Hz and -20°C
22
23
24
25
26
27
28
29
30
31
32
4 11 16 14 3 18 2 10 9 7 12 19 20 5 15 8 22 21 6 1 17 13
ph
ase
an
gle
δ [
°]
laboratory
1
2
3
4
5
6
7
7 10 11 5 8 16 3 19 12 13 22 21 20 9 9 4 14 17 6
ph
ase
an
gle
δ [
°]
laboratory
4
5
6
7
8
9
10
16 5 11 7 10 3 8 18 2 1 12 4 21 19 14 22 13 9 20 17 6
ph
ase
an
gle
δ [
°]
laboratory

Final Report – ILS 4mm - 2019 Seite 52 von 54
Figure 63: Phase angle δ of polymer modified binder 25/55-55 at 10.0Hz and -10°C
Figure 64: Phase angle δ of polymer modified binder 25/55-55 at 10.0Hz and 0°C
11
12
13
14
15
16
17
16 4 3 11 2 10 7 18 5 12 9 21 8 1 15 14 20 6 22 19 13 17
ph
ase
an
gle
δ [
°]
laboratory
21
22
23
24
25
26
27
28
29
16 4 11 3 18 2 21 10 7 9 14 5 12 8 20 15 1 22 17 6 19 13
ph
ase
an
gle
δ [
°]
laboratory
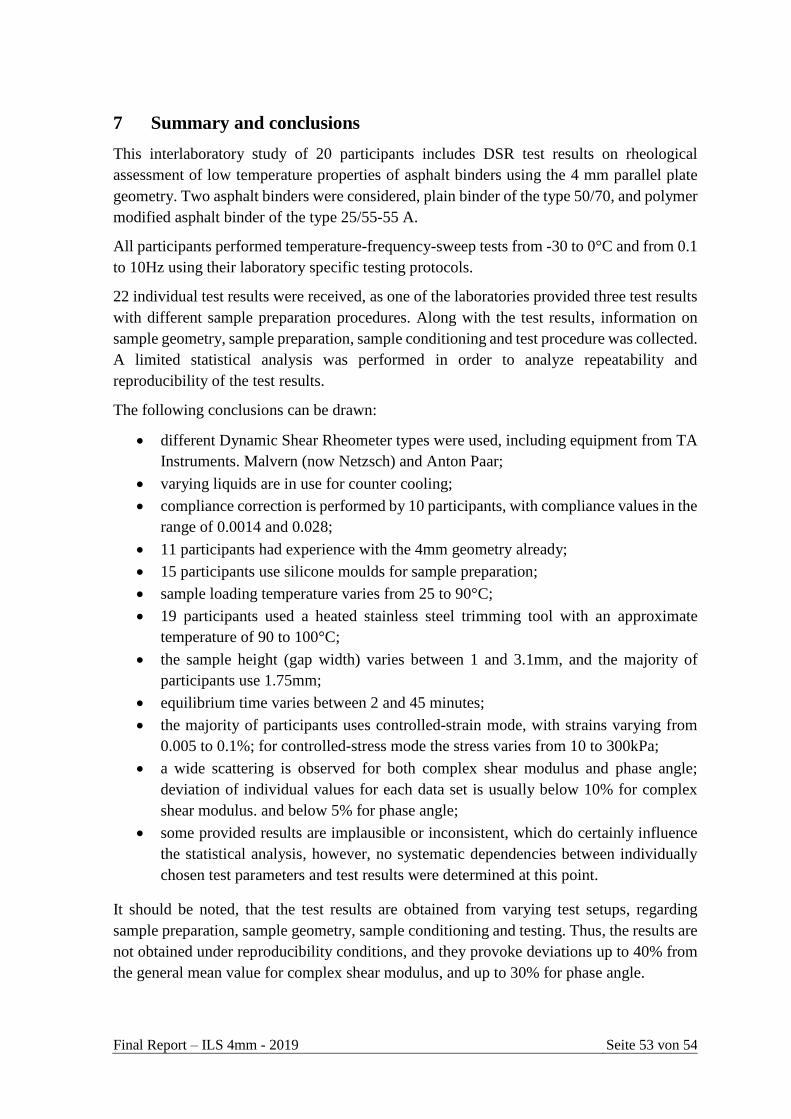
Final Report – ILS 4mm - 2019 Seite 53 von 54
7 Summary and conclusions
This interlaboratory study of 20 participants includes DSR test results on rheological
assessment of low temperature properties of asphalt binders using the 4 mm parallel plate
geometry. Two asphalt binders were considered, plain binder of the type 50/70, and polymer
modified asphalt binder of the type 25/55-55 A.
All participants performed temperature-frequency-sweep tests from -30 to 0°C and from 0.1
to 10Hz using their laboratory specific testing protocols.
22 individual test results were received, as one of the laboratories provided three test results
with different sample preparation procedures. Along with the test results, information on
sample geometry, sample preparation, sample conditioning and test procedure was collected.
A limited statistical analysis was performed in order to analyze repeatability and
reproducibility of the test results.
The following conclusions can be drawn:
• different Dynamic Shear Rheometer types were used, including equipment from TA
Instruments. Malvern (now Netzsch) and Anton Paar;
• varying liquids are in use for counter cooling;
• compliance correction is performed by 10 participants, with compliance values in the
range of 0.0014 and 0.028;
• 11 participants had experience with the 4mm geometry already;
• 15 participants use silicone moulds for sample preparation;
• sample loading temperature varies from 25 to 90°C;
• 19 participants used a heated stainless steel trimming tool with an approximate
temperature of 90 to 100°C;
• the sample height (gap width) varies between 1 and 3.1mm, and the majority of
participants use 1.75mm;
• equilibrium time varies between 2 and 45 minutes;
• the majority of participants uses controlled-strain mode, with strains varying from
0.005 to 0.1%; for controlled-stress mode the stress varies from 10 to 300kPa;
• a wide scattering is observed for both complex shear modulus and phase angle;
deviation of individual values for each data set is usually below 10% for complex
shear modulus. and below 5% for phase angle;
• some provided results are implausible or inconsistent, which do certainly influence
the statistical analysis, however, no systematic dependencies between individually
chosen test parameters and test results were determined at this point.
It should be noted, that the test results are obtained from varying test setups, regarding
sample preparation, sample geometry, sample conditioning and testing. Thus, the results are
not obtained under reproducibility conditions, and they provoke deviations up to 40% from
the general mean value for complex shear modulus, and up to 30% for phase angle.

Final Report – ILS 4mm - 2019 Seite 54 von 54
From this first interlaboratory testing campaign it is concluded that the 4 mm parallel plate
geometry in the DSR is generally applicable for testing asphalt binder at low temperature
conditions, resulting in acceptable repeatability. However, the test procedures need to be
unified and standardized. Therefore, a follow-up interlaboratory study is carried out in 2020
with more detailed instructions regarding sample preparation, sample geometry, sample
conditioning and test procedure.