aspect human exposure to emerging and legacy flame ...etheses.bham.ac.uk/6925/1/tao16phd.pdfrange of...
TRANSCRIPT

Aspect human exposure to emerging and
legacy flame retardants in the UK and
Vietnam
by
Fang Tao (M.Sc, B.Sc)
A thesis submitted to the University of Birmingham for the degree
of
DOCTOR OF PHILOSOPHY
Division of Environmental Health and Risk Management
School of Geography, Earth, and Environmental Sciences
College of Life & Environmental Sciences
The University of Birmingham
August 2016

University of Birmingham Research Archive
e-theses repository This unpublished thesis/dissertation is copyright of the author and/or third parties. The intellectual property rights of the author or third parties in respect of this work are as defined by The Copyright Designs and Patents Act 1988 or as modified by any successor legislation. Any use made of information contained in this thesis/dissertation must be in accordance with that legislation and must be properly acknowledged. Further distribution or reproduction in any format is prohibited without the permission of the copyright holder.

ii

iii
ACKNOWLEDGEMENTS
First of all, I would like to thank my supervisor Prof. Stuart Harrad for all the support,
encouragement and valuable scientific advice throughout the whole project. I’d also thank
him for his active cooperation with key scientists and making it possible for me to obtain
the research experiences staying abroad from which I benefited greatly.
I would also like to thank my other supervisor Dr. Mohamed Abdallah for his unending
help, kind support and valuable suggestions throughout the highs and lows of this project.
I would like to thank Prof. Adrian Covaci for allowing me to benefit from his great
experience. I learnt many things from Adrian during the secondment in Canada and I also
had some great times with him, Nele and Stuart’s families in Winnipeg.
A special thank goes to Hidenori Matsukami for the support and easy-going collaboration
during my research stay at NIES in Japan and I really enjoyed Japanese cherry blossom,
food and picturesque views that will remain as good memories forever.
On the same note I’d like to thank Dr. Go Suzuki, Dr. Natsuyo Noda, Dr. Tomoko Oguri,
Chieko Michinaka, Akinori Hashimoto and Dr. Nguyen Minh Tue for their help and
companionship during my research stay in Tsukuba, Japan and Hanoi, Vietnam.
I would like to acknowledge Dr. Gregg Tomy and Dr. Nele Van Den Eede for their
collaboration and help during my stay in Winnipeg, Canada.
I would also like to acknowledge gratefully the award of a Li Siguang Scholarship by the
China Scholarship Council and the University of Birmingham to fund my Ph.D. study, as
well as the European Union Seventh Framework Programme FP7/2007-2013 under the
Interflame project # 295138 to fund my research secondments in Vietnam, Japan and
Canada.
A special “thank you” must also go to my special friends in University of Birmingham
(Eric Wang, Congqiao Yang, Jiang meng Kuang, Layla, Ana, Gopal, Cassie, Sandra, Leon,
Salim, Yessica, Hoang, Andrew, Jennifer and Ganci) for all the support, intellectual
conversations, impassioned discussions and happy moments.
Finally, I am immensely grateful to my beloved parents and younger brother for all their
continued love, strong mental support and indomitable encouragement throughout my
whole life. 爸爸妈妈和万生,谢谢你们一如既往的爱和支持,永远爱你们。

iv
Abstract
Analytical methods based on gas chromatography in combination with electron capture
negative ion/electron ionisation mass spectrometry were developed and validated for the
separation and determination of legacy and emerging flame retardants (EFRs) in a wide
range of samples including indoor air, dust, diet and human milk. A broad suite of EFRs
and legacy flame retardants (FRs) including polybrominated diphenyl ethers (PBDEs) and
hexabromocyclododecane (HBCDDs) were determined in indoor air and dust taken from
offices and homes in Birmingham, UK. Comparison with previous data, suggests that
temporal trends in contamination with EFRs and legacy FRs reflect changes in production
and use of such compounds as a result of bans and restrictions on the use of legacy FRs.
Specifically, concentrations of some EFRs are increasing, while those of PBDEs and
HBCDDs are decreasing in both indoor air and dust. In contrast, there are indications that
concentrations of ∑PBDEs are increasing in UK diet samples, indicating a gradual shift
over time of PBDEs from the indoor to the outdoor environment and thus our food supply.
Using inter alia a simple, single compartment, steady state pharmacokinetic model, human
exposure to FRs via air inhalation, dust ingestion and diet was estimated for different age
groups (adults, toddlers and nursing infants) and the relative importance of each exposure
route to overall exposure assessed under different exposure scenarios. Dust ingestion was
the main exposure pathway for toddlers to all target FRs except DBE-DBCH (for which
dietary exposure was the major exposure pathway), EH-TBB and BTBPE (for which dust

v
and diet are broadly equally important). By comparison, for adults, dust ingestion appears
to constitute the major exposure pathway to BDE-209, BTBPE, BEH-TEBP, and DBDPE,
with dietary exposure the predominant pathway to HBCDDs, tri-hexa BDEs, DBE-DBCH
and EH-TBB. Concentrations of target EFRs were detected for the first time in UK human
milk samples (n=35). No significant differences were found between the levels of
individual EFRs in human milk group 1 (collected in 2010) and group 2 (collected from
2014-2015) (p > 0.05). No obvious time trends were found between the two human milk
groups for ΣPBDEs and HBCDDs. The most abundant EFR was found to be β-DBE-
DBCH with a mean concentration of 2.5 ng/g lw which is comparable to the levels of the
most abundant legacy FRs i.e. BDE 47, 153 and α-HBCDD (2.8, 1.7 and 2.1 ng/g lw,
respectively). Human exposure to EFRs and HBCDDs via diet was estimated for a
population impacted by a rudimentary e-waste processing area in Vietnam. Concentrations
of all target FRs in e-waste-impacted samples exceed significantly (p < 0.05) those
detected in the controls, suggesting e-waste processing activities exert a substantial impact
on local environmental contamination and human dietary exposure. The estimated dietary
intakes of EFRs in this study were 170 and 420 ng/kg bw/day, for adults and children,
respectively; while daily ingestion of HBCDDs were an estimated 480 and 1500 ng/kg
bw/day for adults and children, respectively.

vi
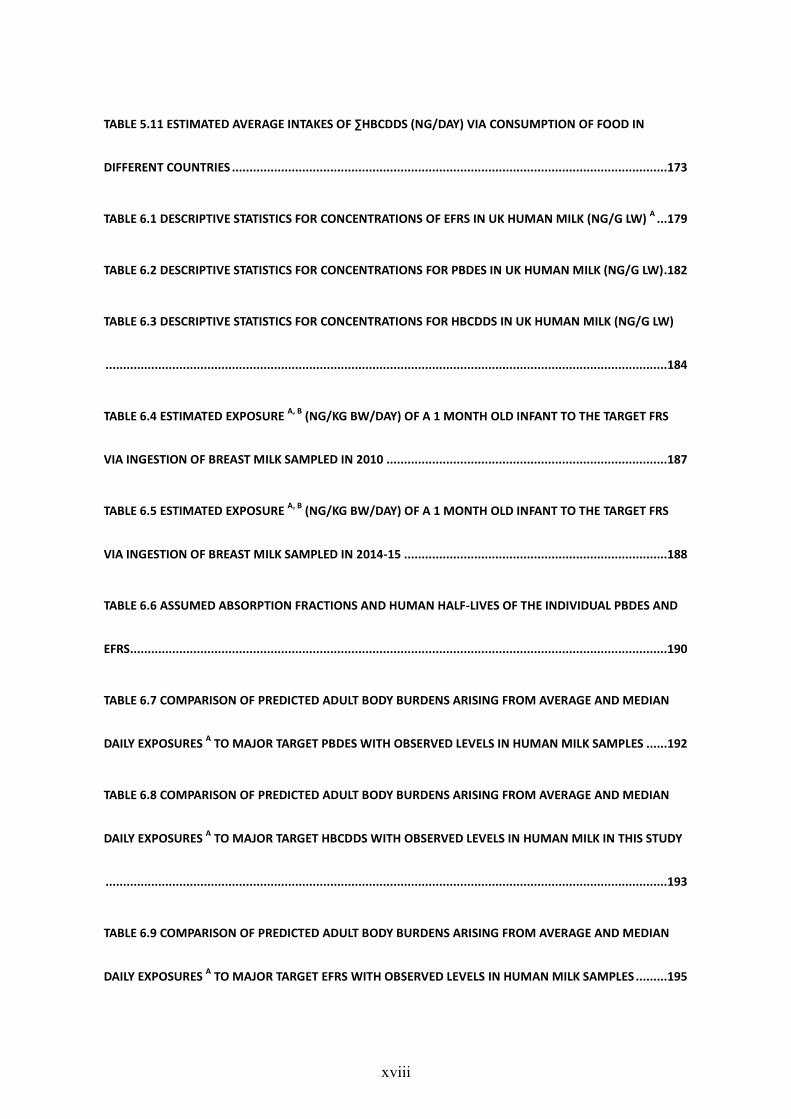
TABLE OF CONTENTS
ACKNOWLEDGEMENTS .............................................................................................................................. III
ABSTRACT .................................................................................................................................................. IV
TABLE OF CONTENTS .................................................................................................................................. VI
LIST OF TABLES......................................................................................................................................... XIV
LIST OF FIGURES ...................................................................................................................................... XIX
ABBREVIATIONS ...................................................................................................................................... XXI
CHAPTER 1 INTRODUCTION ........................................................................................................................ 1
1.1 ENVIRONMENTAL DEGRADATION, METABOLISM, AND PHYSICOCHEMICAL PROPERTIES .............................................. 3
1.1.1 DBDPE ......................................................................................................................................... 3
1.1.2 BTBPE .......................................................................................................................................... 4
1.1.3 EH-TBB and BEH-TEBP ................................................................................................................ 5
1.1.4 TBBPA-BDBPE ............................................................................................................................. 6
1.1.5 DBE-DBCH ................................................................................................................................... 6
1.1.6 DDC-CO ....................................................................................................................................... 7
1.1.7 Other EFRs .................................................................................................................................. 8
1.1.8 Relationships between physicochemical properties and human exposure ............................... 15
1.1.8.1 Influence of production volume and types of EFR on human exposure ............................................. 15
1.1.8.2 Influence of physicochemical properties on human exposure pathways ........................................... 16

vii
1.1.8.3 Vapour pressure.................................................................................................................................. 16
1.1.8.4 KOW ...................................................................................................................................................... 16
1.1.8.5 Water solubility .................................................................................................................................. 18
1.2 APPLICATIONS AND USE ............................................................................................................................ 18
1.3 TOXICOLOGY AND HEALTH EFFECTS .............................................................................................................. 19
1.3.1 DBDPE ....................................................................................................................................... 19
1.3.2 BTBPE ........................................................................................................................................ 20
1.3.3 EH-TBB and BEH-TEBP .............................................................................................................. 21
1.3.4 TBBPA-BDBPE ........................................................................................................................... 21
1.3.5 DBE-DBCH ................................................................................................................................. 22
1.3.6 DDC-CO ..................................................................................................................................... 23
1.3.7 Other EFRs ................................................................................................................................ 23
1.4 CONCENTRATIONS OF EFRS IN AIR AND DUST ................................................................................................ 27
1.5 CONCENTRATIONS OF EFRS IN BIOTA AND HUMANS ....................................................................................... 32
1.6 RELATIVE IMPORTANCE OF DIFFERENT EXPOSURE PATHWAYS FOR EFRS ............................................................... 37
1.6.1 Dietary exposure ....................................................................................................................... 38
1.6.2 Exposure via dust ingestion ...................................................................................................... 42
1.6.3 Exposure via dermal absorption of BFRs in dust ....................................................................... 44
1.6.4 Exposure via inhalation ............................................................................................................ 46
1.6.5 Occupational exposure ............................................................................................................. 47
1.7 OBJECTIVES OF THIS STUDY ........................................................................................................................ 49

viii
CHAPTER 2 SAMPLING AND ANALYTICAL METHODOLOGY ........................................................................ 51
2.1 SYNOPSIS .............................................................................................................................................. 52
2.2 CHEMICALS AND REAGENTS ....................................................................................................................... 53
2.3 SAMPLING ............................................................................................................................................. 54
2.3.1 Air sampling .............................................................................................................................. 54
2.3.1.1 Air sampling method .......................................................................................................................... 54
2.3.1.2 Passive air sampling rates ................................................................................................................... 55
2.3.2 Dust sampling ........................................................................................................................... 60
2.3.3 Diet sampling ............................................................................................................................ 60
2.3.3.1 Market basket diet sampling in Birmingham, UK ................................................................................ 60
2.3.3.2 Diet sampling in Vietnam.................................................................................................................... 61
2.3.4 Soil sampling in Vietnam .......................................................................................................... 63
2.3.5 Human milk sampling ............................................................................................................... 63
2.3.6 Lipid determination .................................................................................................................. 64
2.4 EXTRACTION .......................................................................................................................................... 64
2.4.1 Comparison of extraction methods: ASE vs. Vor-Usoni ............................................................ 64
2.4.1.1 ASE ...................................................................................................................................................... 64
2.4.1.2 Vor-Usoni ............................................................................................................................................ 65
2.4.1.3 Extraction efficiency comparison results: ASE vs. Vor-Usoni .............................................................. 65
2.4.2 Air and dust sample extraction ................................................................................................. 67
2.4.3 Diet and human milk sample extraction ................................................................................... 67

ix
2.4.4 Extraction of diet and soil samples collected in Vietnam ......................................................... 67
2.5 CLEAN UP .............................................................................................................................................. 68
2.5.1 Air and dust sample clean up procedures ................................................................................. 72
2.5.2 Diet and human milk samples clean up procedures ................................................................. 73
2.6 INSTRUMENTAL ANALYSIS ......................................................................................................................... 73
2.6.1 GC-NCI-MS analysis for determination of PBDEs and EFRs ...................................................... 73
2.6.1.1 Evaluation of the PTV vs the Split/Splitless injector............................................................................ 74
2.6.1.2 Influence of GC-MS transfer line temperatures .................................................................................. 75
2.6.1.3 Evaluation of the three different GC injection port liners ................................................................... 75
2.6.2 LC-ESI-MS/MS analysis for determination of HBCDDs .............................................................. 76
2.7 QA/QC AND VALIDATION OF METHODS ....................................................................................................... 78
2.7.1 Analyte identification and quantification criteria ..................................................................... 78
2.7.2 Recovery determination (syringe) standard (RDS) .................................................................... 80
2.7.3 Analysis of Blanks and calculation of LODs and LOQs .............................................................. 81
2.7.4 Accuracy and precision ............................................................................................................. 83
2.8 STATISTICAL ANALYSIS .............................................................................................................................. 85
CHAPTER 3 EFRS AND HBCDDS IN FOOD SAMPLES FROM AN E-WASTE PROCESSING AREA IN VIETNAM .. 87
3.1 SYNOPSIS .............................................................................................................................................. 88
3.2 DETECTION OF HFRS IN FOOD AND SOIL SAMPLES .......................................................................................... 89
3.2.1 Concentrations in food ............................................................................................................. 89

x
3.2.2 Concentrations in soil ............................................................................................................... 96
3.3 CONCENTRATIONS AND DIASTEREOMER PATTERNS OF HBCDDS IN FOOD SAMPLES AND CO-LOCATED SOIL SAMPLES .... 97
3.3.1 HBCDDs in food ......................................................................................................................... 97
3.3.2 Concentrations in soil ............................................................................................................... 99
3.4 RELATIONSHIPS BETWEEN CONCENTRATIONS OF HFRS IN CHICKEN AND CO-LOCATED SOIL SAMPLES ....................... 103
3.5 ESTIMATED DAILY INTAKE OF EFRS AND HBCDDS VIA CONSUMPTION OF FOODSTUFFS INCLUDED IN THIS STUDY ...... 104
CHAPTER 4 EFRS, PBDES AND HBCDDS IN UK INDOOR AIR AND INDOOR DUST .......................................111
4.1 SYNOPSIS ............................................................................................................................................ 112
4.2 SAMPLING STRATEGY.............................................................................................................................. 112
4.3 CONCENTRATION OF EFRS, PBDES AND HBCDDS IN INDOOR AIR .................................................................. 113
4.3.1 EFRs ........................................................................................................................................ 113
4.3.2 PBDEs ...................................................................................................................................... 114
4.3.3 HBCDDs ................................................................................................................................... 117
4.3.4 Relative abundance of different classes of FRs ....................................................................... 118
4.4 CONCENTRATION OF EFRS, PBDES AND HBCDDS IN INDOOR DUST ............................................................... 119
4.4.1 EFRs ........................................................................................................................................ 119
4.4.2 PBDEs ...................................................................................................................................... 121
4.4.3 HBCDDs ................................................................................................................................... 123
4.4.4 Composition profiles of FRs (including EFRs, PBDEs and HBCDDs) ......................................... 124
4.5 COMPARISONS BETWEEN INDOOR MICROENVIRONMENTS.............................................................................. 125

xi
4.5.1 Comparisons between indoor microenvironments in indoor air ............................................. 125
4.5.2 Comparisons between indoor microenvironments in indoor dust .......................................... 125
4.6 COMPARISONS WITH OUTDOOR AIR SAMPLES .............................................................................................. 127
4.7 COMPARISONS WITH PREVIOUS STUDIES IN THE UK ...................................................................................... 127
4.7.1 EFRs ........................................................................................................................................ 127
4.7.2 PBDEs ...................................................................................................................................... 128
4.7.3 HBCDDs ................................................................................................................................... 129
4.8 CORRELATIONS BETWEEN FRS IN INDOOR MICROENVIRONMENTS ................................................................... 129
4.9 CORRELATIONS BETWEEN FR CONCENTRATIONS IN AIR AND DUST ................................................................... 130
4.10 EXPOSURE TO FRS VIA INHALATION AND DUST INGESTION ......................................................................... 136
CHAPTER 5 EFRS, PBDES AND HBCDDS IN UK FOOD SAMPLES .................................................................151
5.1 SYNOPSIS ............................................................................................................................................ 152
5.2 CONCENTRATIONS AND PATTERNS OF HFRS IN FOOD .................................................................................... 153
5.2.1 EFRs ........................................................................................................................................ 153
5.2.2 PBDEs ...................................................................................................................................... 158
5.2.3 HBCDDs ................................................................................................................................... 163
5.2.4 Relative abundance of different classes of FRs ....................................................................... 165
5.3 ESTIMATION OF DAILY DIETARY INTAKES ...................................................................................................... 165
5.3.1 EFRs ........................................................................................................................................ 167
5.3.2 PBDEs ...................................................................................................................................... 169

xii
5.3.3 HBCDDs ................................................................................................................................... 171
5.4 CONCLUSIONS ...................................................................................................................................... 173
CHAPTER 6 EFRS, PBDES AND HBCDDS IN UK HUMAN MILK: IMPLICATIONS FOR INFANT EXPOSURE AND
RELATIONSHIP TO EXTERNAL EXPOSURE .................................................................................................174
6.1 INTRODUCTION ..................................................................................................................................... 175
6.2 CONCENTRATIONS AND PATTERNS OF FRS IN HUMAN MILK ............................................................................ 176
6.2.1 EFRs ........................................................................................................................................ 176
6.2.2 PBDEs ...................................................................................................................................... 180
6.2.3 HBCDDs ................................................................................................................................... 183
6.2.4 Relative abundance of different classes of FRs ....................................................................... 184
6.3 NURSING INFANTS' DIETARY INTAKE OF HFRS VIA BREAST MILK ....................................................................... 185
6.4 RELATIONSHIP BETWEEN FR INTAKE AND HUMAN BODY BURDENS ................................................................... 189
6.5 CONCLUSION ........................................................................................................................................ 196
CHAPTER 7 SUMMARY AND CONCLUSIONS .............................................................................................197
7.1 THE OPTIMISATION AND VALIDATION OF ANALYTICAL METHODOLOGY ............................................................... 197
7.2 FOOD, AN E-WASTE PROCESSING AREA IN VIETNAM ..................................................................................... 197
7.3 DUST AND AIR, UK ................................................................................................................................ 198
7.4 FOOD, UK ........................................................................................................................................... 199
7.5 HUMAN MILK, UK ................................................................................................................................. 199
7.6 HUMAN EXPOSURE, UK ......................................................................................................................... 200

xiii
7.7 COMPARISON OF FRS INTAKE TO HUMAN BODY BURDENS .............................................................................. 201
7.8 RESEARCH GAPS AND FUTURE PERSPECTIVES ............................................................................................... 202
REFERENCES ............................................................................................................................................204
APPENDIX: LIST OF PUBLICATIONS ...........................................................................................................246

xiv
List of tables
TABLE 1.1 PHYSICOCHEMICAL PROPERTIES OF SOME IMPORTANT EFRS, PBDES AND HBCDDS ................. 10
TABLE 1.2 APPLICATION, USES AND PRODUCTION VOLUMES OF SOME IMPORTANT EFRS ........................ 25
TABLE 1.3A SUMMARY OF MEDIAN CONCENTRATIONS OF EFRS IN AIR AND DUST (RANGE VALUES IN
PARENTHESES) .......................................................................................................................................... 30
TABLE 1.3B SUMMARY OF MEDIAN CONCENTRATIONS OF EFRS IN AIR AND DUST (RANGE VALUES IN
PARENTHESES) (CONTINUED) ................................................................................................................... 31
TABLE 1.4 SUMMARY OF CONCENTRATIONS OF EFRS IN BIOTA (NG/G LW) (RANGE OF VALUES IN
PARENTHESES) .......................................................................................................................................... 33
TABLE 1.5 SUMMARY OF DIETARY INTAKES OF BFRS IN DIFFERENT COUNTRIES AND THEIR
CONTRIBUTIONS TO OVERALL HUMAN EXPOSURE TO SOME BFRS ........................................................... 40
TABLE 1.6 SUMMARY OF ESTIMATES OF HUMAN EXPOSURE TO SELECTED BFRS VIA DUST INGESTION IN
DIFFERENT COUNTRIES AND THEIR CONTRIBUTIONS TO OVERALL HUMAN EXPOSURE ............................ 42
TABLE 1.7 SUMMARY OF EXPOSURE VIA DERMAL ABSORPTION OF BFRS IN DIFFERENT COUNTRIES AND
ITS CONTRIBUTION TO OVERALL HUMAN EXPOSURE ............................................................................... 45
TABLE 1.8 SUMMARY OF EXPOSURE TO BFRS VIA INHALATION IN DIFFERENT COUNTRIES AND ITS
CONTRIBUTION TO OVERALL HUMAN EXPOSURE ..................................................................................... 48
TABLE 2.1 OVERVIEW OF SAMPLING METHODS AND LOCATIONS FOR DIFFERENT SAMPLE TYPES ..... 52
TABLE 2.2 PASSIVE SAMPLING RATES (M3/DAY) OF PBDES AND HBCDDS IN INDOOR AIR
A ....................... 56

xv
TABLE 2.3 PASSIVE SAMPLING RATES (M3/DAY) OF THE INDIVIDUAL STUDIED EFRS IN INDOOR AIR ......... 56
TABLE 2.4 PASSIVE SAMPLING RATES (M3/DAY) OF THE INDIVIDUAL STUDIED EFRS IN INDOOR AIR ......... 58
TABLE 2.5 FOOD GROUPS INCLUDED IN THE MARKET BASKET STUDY ....................................................... 61
TABLE 2.6 RELATIVE RECOVERIES (SD) OF FRS ON DIFFERENT CLEAN-UP METHODS .................................. 70
TABLE 2.7 PEAK AREA RATIOS OF PBDES AND EFRS INJECTED ON INJECTION MODE (PTV AND SPLITLESS) 76
TABLE 2.8 LODS AND LOQS OF PBDES, HBCDDS AND EFRS ................................................................... 82
TABLE 2.9 MEAN VALUES AND STANDARD DEVIATIONS (NG/G DUST) OF FLAME RETARDANTS MEASURED
IN SRM 2585 (STANDARD DEVIATIONS IN PARENTHESES) ......................................................................... 84
TABLE 3.1 AVERAGE, MEDIAN AND RANGE OF CONCENTRATIONS OF EFRS AND HBCDDS (NG/G LW) IN
FOOD AND CO-LOCATED SOIL AND SEDIMENT SAMPLES (NG/G DW) FROM AN E-WASTE PROCESSING (BUI
DAU, VIETNAM) AND CONTROL SITES. ...................................................................................................... 90
TABLE 3.2 ESTIMATED DIETARY EXPOSURE (NG/KG BW/DAY) TO EFRS AND HBCDD FOR ADULTS AND
CHILDREN LIVING IN E-WASTE IMPACTED AREAS OF BUI DAU, VIETNAM. NE = NOT ESTIMATED .............108
TABLE 4.1 DESCRIPTIVE STATISTICS FOR CONCENTRATIONS OF EFRS IN UK INDOOR AIR (PG/M3) ............115
TABLE 4.2 DESCRIPTIVE STATISTICS FOR CONCENTRATIONS OF PBDES AND HBCDDS IN UK INDOOR AIR
(PG/M3) ...................................................................................................................................................116
TABLE 4.3 DESCRIPTIVE STATISTICS FOR CONCENTRATIONS FOR EFRS IN UK INDOOR DUST (NG/G) ........122
TABLE 4.4 DESCRIPTIVE STATISTICS FOR CONCENTRATIONS OF PBDES AND HBCDDS IN UK INDOOR DUST
(NG/G) .....................................................................................................................................................126

xvi
TABLE 4.5 PEARSON CORRELATIONS FOR THE CONCENTRATIONS OF FRS IN AIR ......................................132
TABLE 4.6 PEARSON CORRELATIONS FOR THE CONCENTRATIONS OF FRS IN DUST...................................133
TABLE 4.7 PEARSON CORRELATIONS FOR THE CONCENTRATIONS OF FRS IN MATCHED AIR (RED) AND DUST
(BLUE) (N=30) ..........................................................................................................................................134
TABLE 4.8 SUMMARY OF ESTIMATES OF EXPOSURE (NG/DAY) OF UK ADULTS AND TODDLERS TO EFRS VIA
AIR...........................................................................................................................................................139
TABLE 4.9 SUMMARY OF ESTIMATES OF EXPOSURE (NG/DAY) OF UK ADULTS AND TODDLERS TO PBDES
VIA AIR ....................................................................................................................................................140
TABLE 4.10 SUMMARY OF ESTIMATES OF EXPOSURE (NG/DAY) OF UK ADULTS AND TODDLERS TO HBCDDS
VIA AIR ....................................................................................................................................................141
TABLE 4.11 SUMMARY OF ESTIMATES OF EXPOSURE (NG/DAY) OF UK ADULTS AND TODDLERS TO EFRS VIA
DUST .......................................................................................................................................................144
TABLE 4.12 SUMMARY OF ESTIMATES OF EXPOSURE (NG/DAY) OF UK ADULTS AND TODDLERS TO PBDES
VIA DUST .................................................................................................................................................145
TABLE 4.13 SUMMARY OF ESTIMATES OF EXPOSURE (NG/DAY) OF UK ADULTS AND TODDLERS TO HBCDDS
VIA DUST .................................................................................................................................................147
TABLE 4.14 ESTIMATES OF EXPOSURE (NG/DAY) OF UK ADULTS AND TODDLERS TO FRS VIA AIR AND DUST,
AND RELATIVE SIGNIFICANCE (%) OF EACH PATHWAY UNDER TYPICAL EXPOSURE SCENARIO A ...............150
TABLE 5.1 AVERAGE CONCENTRATIONS OF EFRS IN COMPOSITE FOOD SAMPLES FROM BIRMINGHAM, UK

xvii
(NG/G LW) ...............................................................................................................................................155
TABLE 5.2 AVERAGE CONCENTRATIONS OF EFRS (NG/G LW) IN BIOTA SAMPLES FROM DIFFERENT
COUNTRIES. .............................................................................................................................................156
TABLE 5.3 AVERAGE CONCENTRATIONS (PG/G WW IN PARENTHESES) OF PBDES IN COMPOSITE FOOD
SAMPLES FROM BIRMINGHAM, UK (NG/G LW) .......................................................................................160
TABLE 5.4 AVERAGE CONCENTRATIONS OF ∑PBDES (PG/G WW) IN FOOD SAMPLES FROM DIFFERENT
COUNTRIES (MEDIAN CONCENTRATIONS IN PARENTHESES). ...................................................................161
TABLE 5.5 AVERAGE CONCENTRATIONS (PG/G WW IN PARENTHESES) OF HBCDDS IN COMPOSITE FOOD
SAMPLES FROM BIRMINGHAM, UK (NG/G LW) .......................................................................................164
TABLE 5.6 AVERAGE (STANDARD DEVIATION IN PARENTHESES) QUANTITIES OF FOOD CONSUMED BY UK
TODDLERS AND ADULTS (G/DAY) (FOOD STANDARDS AGENCY, 2014) ......................................................166
TABLE 5.7 ESTIMATED AVERAGE AND HIGH-END A INTAKES OF ∑EFRS (NG/DAY) VIA CONSUMPTION OF
FOOD FOR UK ADULTS AND TODDLERS ....................................................................................................168
TABLE 5.8 ESTIMATED AVERAGE AND HIGH-END A INTAKES OF ∑PBDES (NG/DAY) VIA CONSUMPTION OF
FOOD FOR UK ADULTS AND TODDLERS ....................................................................................................170
TABLE 5.9 ESTIMATED AVERAGE ADULT INTAKES OF ∑PBDES (NG/DAY) VIA CONSUMPTION OF FOOD IN
DIFFERENT COUNTRIES ............................................................................................................................171
TABLE 5.10 ESTIMATED AVERAGE AND HIGH-END A INTAKES OF ∑HBCDDS (NG/DAY) VIA CONSUMPTION
OF UK FOOD FOR ADULTS AND TODDLERS ...............................................................................................172
xviii
TABLE 5.11 ESTIMATED AVERAGE INTAKES OF ∑HBCDDS (NG/DAY) VIA CONSUMPTION OF FOOD IN
DIFFERENT COUNTRIES ............................................................................................................................173
TABLE 6.1 DESCRIPTIVE STATISTICS FOR CONCENTRATIONS OF EFRS IN UK HUMAN MILK (NG/G LW) A ...179
TABLE 6.2 DESCRIPTIVE STATISTICS FOR CONCENTRATIONS FOR PBDES IN UK HUMAN MILK (NG/G LW) .182
TABLE 6.3 DESCRIPTIVE STATISTICS FOR CONCENTRATIONS FOR HBCDDS IN UK HUMAN MILK (NG/G LW)
................................................................................................................................................................184
TABLE 6.4 ESTIMATED EXPOSURE A, B
(NG/KG BW/DAY) OF A 1 MONTH OLD INFANT TO THE TARGET FRS
VIA INGESTION OF BREAST MILK SAMPLED IN 2010 ................................................................................187
TABLE 6.5 ESTIMATED EXPOSURE A, B
(NG/KG BW/DAY) OF A 1 MONTH OLD INFANT TO THE TARGET FRS
VIA INGESTION OF BREAST MILK SAMPLED IN 2014-15 ...........................................................................188
TABLE 6.6 ASSUMED ABSORPTION FRACTIONS AND HUMAN HALF-LIVES OF THE INDIVIDUAL PBDES AND
EFRS.........................................................................................................................................................190
TABLE 6.7 COMPARISON OF PREDICTED ADULT BODY BURDENS ARISING FROM AVERAGE AND MEDIAN
DAILY EXPOSURES A TO MAJOR TARGET PBDES WITH OBSERVED LEVELS IN HUMAN MILK SAMPLES ......192
TABLE 6.8 COMPARISON OF PREDICTED ADULT BODY BURDENS ARISING FROM AVERAGE AND MEDIAN
DAILY EXPOSURES A TO MAJOR TARGET HBCDDS WITH OBSERVED LEVELS IN HUMAN MILK IN THIS STUDY
................................................................................................................................................................193
TABLE 6.9 COMPARISON OF PREDICTED ADULT BODY BURDENS ARISING FROM AVERAGE AND MEDIAN
DAILY EXPOSURES A TO MAJOR TARGET EFRS WITH OBSERVED LEVELS IN HUMAN MILK SAMPLES .........195

xix
List of figures
FIGURE 1.1 POTENTIAL FOR BIOACCUMULATION (EFSA 2012) .................................................................. 18
FIGURE 2.1 DIAGRAM OF PASSIVE AIR SAMPLER CONFIGURATION ........................................................... 54
FIGURE 2.2 SAMPLING SITES IN AN E-WASTE PROCESSING REGION, BUI DAU, CAM XA, HUNG YEN
PROVINCE, VIETNAM ................................................................................................................................ 63
FIGURE 2.3 SPIKING EXPERIMENT RESULTS ON SORBENT MATERIAL. EACH LEVEL WAS COMPOSED OF
THREE REPLICATE MEASUREMENTS ON THREE DIFFERENT DAYS (VERTICAL LINES REPRESENT STANDARD
DEVIATIONS) ............................................................................................................................................. 66
FIGURE 3.1 DIASTEREOMER PROFILES IN FOOD AND CO-LOCATED SURFACE SOIL SAMPLES FROM E-WASTE
PROCESSING AREAS IN VIETNAM IN THIS STUDY AND COMMERCIAL HBCDD MIXTURES (COVACI ET AL.,
2006) .......................................................................................................................................................100
FIGURE 3.2 ENANTIOMER FRACTIONS (EF) OF -HBCDD, -HBCDD AND -HBCDD IN CHICKEN AND CO-
LOCATED SOIL SAMPLES (LINE AT EF=0.50 INDICATES RACEMIC VALUE) ...................................................101
FIGURE 3.3 CONTRIBUTIONS OF DIFFERENT FOOD GROUPS TO TOTAL DIETARY EXPOSURES TO EFRS AND
HBCDDS OF CHILDREN IN BUI DAU, VIETNAM .........................................................................................107
FIGURE 3.4 CONTRIBUTIONS OF DIFFERENT FOOD GROUPS TO TOTAL DIETARY EXPOSURES TO EFRS AND
HBCDDS OF ADULTS IN BUI DAU, VIETNAM .............................................................................................107
FIGURE 4.1 RELATIVE CONTRIBUTIONS OF EFRS, PBDES AND HBCDDS TO FRS IN UK INDOOR AIR .........118
FIGURE 4.2 RELATIVE CONTRIBUTIONS OF EFRS, PBDES AND HBCDDS TO FRS IN UK INDOOR DUST ...124

xx
FIGURE 4.3 CORRELATION OF KDA VERSUS KOA FOR EFRS AND PBDES IN HOMES (ABOVE) AND OFFICES
(BELOW) ..................................................................................................................................................135
FIGURE 4.4 CONTRIBUTIONS TO ESTIMATED EXPOSURE OF UK ADULTS VIA AIR INHALATION OF DIFFERENT
FRS ..........................................................................................................................................................142
FIGURE 4.5 CONTRIBUTIONS TO ESTIMATED EXPOSURE OF UK TODDLERS VIA AIR INHALATION OF
DIFFERENT FRS ........................................................................................................................................143
FIGURE 4.6 CONTRIBUTIONS TO HUMAN EXPOSURE OF UK ADULTS VIA DUST INGESTION FROM
DIFFERENT FRS ........................................................................................................................................148
FIGURE 4.7 CONTRIBUTIONS TO HUMAN EXPOSURE OF UK TODDLERS VIA DUST INGESTION FROM
DIFFERENT FRS ........................................................................................................................................149
FIGURE 5.1 RELATIVE CONTRIBUTIONS OF TRI-HEXA-BDES AND BDE 209 TO ∑PBDES IN UK FOOD SAMPLES
IN THIS STUDY AND TWO PREVIOUS STUDIES ..........................................................................................163
FIGURE 5.2 RELATIVE CONTRIBUTIONS OF EFRS, PBDES AND HBCDDS TO FRS IN UK FOOD SAMPLES ...165
FIGURE 5.3 ESTIMATED AVERAGE DIETARY EXPOSURES TO EFRS, PBDES, AND HBCDDS ..........................167
FIGURE 5.4 CONTRIBUTIONS TO AVERAGE TOTAL DIETARY EXPOSURES FOR EFRS FROM DIFFERENT
GROUPS OF UK FOOD ..............................................................................................................................169
FIGURE 6.1 AVERAGE RELATIVE CONTRIBUTIONS OF EFRS, PBDES AND HBCDDS TO FRS IN UK HUMAN
MILK ........................................................................................................................................................185

xxi
ABBREVIATIONS
APPI Atmospheric pressure photoionisation
BAF Bioaccumulation factor
BEH-TEBP Bis(2-ethylhexyl) tetrabromophthalate
BFR Brominated flame retardant
BTBPE 1,2-bis (2,4,6-tribromophenoxy) ethane
Bw Body weight
DBDPE Decabromo diphenyl ethane
DBE-DBCH Tetrabromoethylcyclohexane
DDC-CO Dechlorane plus
Dw Dry weight
ECNI Electron capture negative ionisation
EH-TBB 2-ethylhexyl-2,3,4,5-tetrabromobenzoate
EF Enantomeric fraction
EFR Emerging flame retardant
EI Electron impact
GC Gas chromatography
HBB Hexabromobenzene
HBCDD Hexabromocyclododecane
HCDBCO Hexachlorocyclopentadienyldibromocyclooctane
HPLC High pressure liquid chromatography
IS Internal standard
Kow n-octanol/water partition coefficient
LOD Limit of detection.
LOQ Limit of quantification.
Lw Lipid weight
m/z Mass to charge ratio.
MS Mass spectrometry
PBBz pentabromobenzene
PBDE Polybrominated diphenyl ether
PBEB Pentabromoethylbenzene
PBT Pentabromotoluene
PK Pharmacokinetic.

xxii
POP Persistent organic pollutant
PUF Polyurethane foam
QA/QC Quality assurance/quality control
RDS Recovery determination standard
RSD Relative standard deviation
SD Standard deviation
S/N Signal to noise ratio
TBCT Tetrabromo-o-chlorotoluene
TBBPA-BDBPE Tetrabromobisphenol A-bis(2,3-dibromopropyl ether)
TBP-DBPE 2,3-dibromopropyl 2,4,6-tribromophenyl ether
TBX 1,2,4,5-Tetrabromo-3,6-dimethylbenzene
UNEP United Nations Environment Programme
USEPA United States Environmental Protection Agency
WHO World Health Organization
Ww Wet weight

1
CHAPTER 1 Introduction

2
Halogenated flame retardants (HFRs) have found utility as flame retardants (FRs)
incorporated within a wide range of consumer goods and materials. This is because halogens
are very effective in capturing free radicals, and thus in preventing flame propagation (Alaee
et al., 2003). Even though all four halogens are effective in eliminating free radicals,
fluorinated compounds are very stable and decompose at much higher temperatures than most
organic matter burns, and iodinated compounds are not stable and decompose at slightly
elevated temperatures (Alaee et al., 2003). Therefore, organochlorine and organobromine
compounds are favoured as flame retardants because of their stability during the lifetime of
the product and their appropriate decomposing temperature (Alaee et al., 2003). Brominated
flame retardants (BFRs) are one of the most-widely used groups of organic flame retardants
because of their relatively low cost and high performance efficiency (Abdallah, 2009). As a
result, there are more than 75 different organobromine compounds used as flame retardants to
make sure that a variety of manufactured goods such as plastics, textiles, building materials,
vehicles and electronic equipments meet fire safety regulations (Alaee et al., 2003; Ali et al.,
2011a; Reistad et al., 2005). The most commonly used and studied “legacy” BFRs are
PBDEs, HBCDDs and tetrabromobisphenol-A (TBBP-A). The Penta-BDE and Octa-BDE
commercial mixtures were added to the Persistent Organic Pollutants list of the Stockholm
Convention (2009) for global bans and the production and use of both commercial mixtures
were phased out in Europe and North America in 2004 (La Guardia et al., 2006). The use of
Deca-BDE in the EU has been banned in electrical and electronic applications since 1 July
2008 (European Court of Justice, 2008). HBCDDs were listed in the Stockholm Convention
recently (UNEP, 2014). Following these bans and restrictions imposed on PBDEs and
HBCDDs globally, there is potential for emerging flame retardants (EFRs) to replace these
formulations. The estimated total production volume for EFRs is around 180,000 tons/year on
the assumption that the production volumes have not changed much over the past few years

3
(Harju, et al., 2009). However, very limited information currently exists about the production
volumes, physicochemical properties, analytical methods, environmental fate and behaviour,
and toxicity of EFRs. In the absence of detailed evidence, concern exists that given their
similar structures to “legacy” BFRs, they may show persistent, bioaccumulative, and toxic
(PBT) characteristics and pose health risks to human and wildlife, especially for those
produced in high volumes. Likewise, the similar use patterns and structures, means that the
typical pathways of human exposure to EFRs are likely similar to those of the legacy BFRs,
via a combination of diet, ingestion of dust, dermal uptake and inhalation (Harrad et al.,
2010).
1.1 Environmental degradation, metabolism, and physicochemical
properties
The physicochemical properties of some important EFRs, PBDEs and HBCDDs are shown in
Table 1.1. Currently, although very limited information is available for physicochemical
properties of EFRs, their structural similarity to “legacy” BFRs, suggests such properties will
also be similar.
1.1.1 DBDPE
Because of its similar structure, the physicochemical properties of DBDPE are assumed to be
similar to those of BDE 209, including: low vapour pressure, low water solubility, and high
KOW (Hardy et al., 2002). Similar to BDE 209, DBDPE undergoes degradation to lower
brominated congeners during sample preparation/analysis, although it appears to be less
sensitive to thermal degradation than BDE 209 (Kierkegaard et al., 2009). Likewise, the
inclusion of the ethane bridge between the aromatic rings makes it slightly more hydrophobic
than BDE 209 (Covaci et al., 2011). DBDPE has been reported to have a high
bioaccumulation factor (BAF), with log BAF values between 6.1 and 7.1 in fish that are one

4
order of magnitude higher than those of BDE 209 (He et al., 2012). In contrast, DBDPE was
found to bioaccumulate in rats at concentrations 3-5 orders of magnitude lower than BDE 209
after oral exposure to 100 mg/kg body weight(bw)/day of DBDPE or BDE 209 for 90 days
(Wang et al., 2010). Preferential accumulation of BDE 209 in the liver rather than other
tissues (kidney, adipose) has also been observed, however, adipose displayed the greatest
accumulation of DBDPE (Wang et al., 2010). Biomagnification factor (BMF) values of 0.2-
9.2 were found for DBDPE between trophic levels of the Lake Winnipeg (Canada) food web
(Law et al., 2006b). At least seven unknown compounds were observed in DBDPE-exposed
rats, indicating that DBDPE biotransformation occurred in rats (Wang et al., 2010). Two
degradation products (nona-brominated congeners) were found to be present in the technical
product (Saytex®8010) (Kierkegaard et al., 2004). When DBDPE dissolved in n-hexane was
exposed to a daylight fluorescent lamp, DBDPE was degraded to the two nona-brominated
congeners as well as a number of peaks tentatively identified as octa-brominated products
(Kierkegaard et al., 2009). On the other hand, when high impact polystrene (HIPS) powder
was spiked with BFRs and exposed to sunlight for 112 days, no degradation of DBDPE was
found, while the photolytic half-life of BDE 209 was estimated at 31 days (Kajiwara et al.,
2007).
1.1.2 BTBPE
For BTBPE, the derived BAF in juvenile rainbow trout was 2.3 ± 0.9 with a calculated half-
life of 54.1 ± 8.5 days, suggesting that this chemical has a high potential for biomagnification
in aquatic food webs (Tomy et al., 2007a). No metabolites were detected and results indicated
that BTBPE is not a potent thyroid axis disruptor (Tomy et al., 2007a). Biomagnification
between trophic levels of the Lake Winnipeg (Canada) food web resulted in a BMF of 0.1-2.5
for BTBPE (Law et al., 2006). However, BTBPE displayed poor gastrointestinal absorption
in two oral ingestion studies of BTBPE in rats (Nomeir et al., 1993; Verreault et al., 2007).

5
Metabolites were excreted in the urine, bile and faeces, but at a very low level. Fecal
metabolites were characterised as monohydroxylated, monohydroxylated with
debromination, dihydroxylated/debrominated on a single aromatic ring, monohydroxylated
on each aromatic ring with accompanying debromination, and cleavage on either side of the
ether linkage to yield tribromophenol and tribromophenoxyethanol in rats (Verreault et al.,
2007). In Hakk et al.'s study (2004), male Sprague-Dawley rats were orally exposed to a
single oral dose of BTBPE (2.0 mg/kg bw) in conventional and bile-duct cannulated
experiments and the great majority of BTBPE (>94%) was excreted in the faeces of both
groups of rats at 72 h while a limited quantity of stable metabolites was excreted.
1.1.3 EH-TBB and BEH-TEBP
In laboratory photodegradation experiments, photodegradation of EH-TBB and BEH-TEBP
via debromination reactions was reported to occur more slowly than photodegradation of
decaBDE or nonaBDEs (Davis and Stapleton, 2009). In one in vitro study, EH-TBB was
consistently metabolised to 2,3,4,5-tetrabromobenzoic acid (TBBA) via cleavage of the 2-
ethylhexyl chain without requiring any added cofactors in experiments with liver and
intestinal subcellular fractions and in purified porcine carboxylesterase, while BEH-TEBP
was only metabolised to mono(2-ethylhexyl) tetrabromophthalate (TBMEHP) in purified
porcine carboxylesterase (Roberts et al., 2012). Bearr et al. (2012) studied in vitro
biotransformation of EH-TBB and BEH-TEBP in hepatic subcellular fractions (i.e. S9,
microsomes and cytosol) of the fat-head minnow, common carp, mouse and snapping turtle.
Metabolic loss of BEH-TEBP was measured for all species, with EH-TBB loss observed for
all species except snapping turtle. The same study reported that EH-TBB was consistently
metabolised to a greater extent than BEH-TEBP across all species tested (Bearr et al., 2012).

6
1.1.4 TBBPA-BDBPE
TBBPA-BDBPE exhibits the same overall persistence (POV) and long-range transport
potential (LRTP) values as the POP-PBDEs - i.e. those listed as persistent organic pollutants
in the Stockholm Convention in May 2009 (Kuramochi et al., 2014). Studies of the
metabolism of this substance in rats (Fischer 344) showed TBBPA-BDBPE is poorly
absorbed from the gastrointestinal tract and not metabolically transformed. On the other hand,
elimination from the body took a relatively long time (13.9 h) and most of the retained
compound accumulated in the liver (Knudsen et al., 2007). TBBPA-BDBPE is susceptible to
hydrolysis at the same level as DDT with an experimental half-life of < 0.02 h at 273 K
(MeOH/DMF, 5/95 ratio) with sodium methoxide as a strong nucleophile. The elimination
product TBBPA bis-(bromopropenyl ether) might be more prevalent in sediment in a similar
manner as DDE is for DDT (Rahm et al., 2005). If present in the atmosphere, TBBPA-
BDBPE will likely be bound to particles because of its low volatility. Consequently, its
atmospheric transport behaviour will be determined by particle transport (Harju et al., 2009).
1.1.5 DBE-DBCH
In Muir and Howard’s (2006) review of screening and categorisation studies of chemicals in
commerce, with high predicted bioconcentration potential, low biodegradation rates and long
range atmospheric transport potential, DBE-DBCH was one of the 30 chemicals included on
their list. With a logKOW value of 5.25 (i.e. within the “ideal” >3−6 range), and a reported
bioconcentration factor (BCF) of 2,153, the DBE-DBCH isomers have been identified as
having high persistence and environmental bioaccumulation potential (Howard and Muir,
2010). DBE-DBCH was found to be bioavailable to Eisenia fetida and accumulated in
earthworms (Nyholm et al., 2010a). Following its application to soil, degradation of DBE-
DBCH was evident over 360 days; moreover, the soil-air partition coefficient of DBE-DBCH

7
increased over time before levelling off, suggesting that the volatility of DBE-DBCH
decreases with time as it becomes more strongly bound to soil (Wong et al., 2012). The α-
and β-DBE-DBCH isomers undergo thermal rearrangement to γ- and δ-DBE-DBCH at
temperatures above 120-125 °C, which could be expected to occur at the high temperatures
used in manufacturing processes (Riddell et al., 2009). In in vitro enzyme-mediated
biotransformation assays based on rat liver microsomes, concentrations of both α- and β-
DBE-DBCH isomers were equally depleted by about 40% and metabolism via hydroxylation
(but not debromination) occurred in vitro for α- and β-DBE-DBCH (Chu et al., 2012).
1.1.6 DDC-CO
DDC-CO is an odourless, white, free-flowing powder that is thermally stable up to 285 °C;
its vapour pressure is moderate (0.8 Pa at 200 °C) and KOW is very high (Log KOW = 9.3),
with the latter making it extremely lipophilic (Xian et al., 2011). DDC-CO has been identified
by the European Commission as a possible replacement for DBDPE (Chen et al., 2014). The
DDC-CO technical product consists of the syn- and anti- isomers in a ratio of about 1:3
(Sverko et al., 2011). Given its physicochemical properties (high lipophilicity, chemical
stability (exemplified by its long photodegradation> 24 years)), bioaccumulation in fish and
lack of biodegradation, DDC-CO has characteristics typical of persistent organic pollutants
(de la Torre et al., 2011). DDC-CO has potential to be bioaccumulated and biomagnified in
fish regardless of its high molecular weight and very high log KOW value and to be
susceptible to long-range atmospheric transport (Feo et al., 2012). DDC-CO was reported to
be bioavailable to the oligochaete, L. variegatus, from sediment (syn-DDC-CO (biota-
sediment accumulation factors (BSAFs) = 0.34-0.48 g OC/g lipid) > anti-DDC-CO (BSAFs=
0.21-0.39 g OC/g lipid)) (Li et al., 2014), and to bioaccumulate in a marine food web (with
BMFs of 0.14 and 0.11 for syn-DDC-CO and anti-DDC-CO, respectively in black-headed
gulls) (Peng et al., 2014). In Li et al.'s study (2013), accumulation of both syn-DDC-CO and

8
anti-DDC-CO was reported in Sprague-Dawley rats. Specifically, DDC-CO was
preferentially accumulated in the liver rather than in muscle, no significant stereoselectivity
of anti-DDC-CO or syn-DDC-CO in tissues was observed in the low DDC-CO exposure
groups, while the ratio of syn-DDC-CO to anti-DDC-CO increased significantly in all tissues
in the high DP exposure groups. Furthermore, Tomy et al. (2008a) also found the BMF value
(determined in whole fish minus liver) of the syn-isomer (5.2) in juvenile rainbow trout
exceeded that of the anti-isomer (1.9), suggesting that the syn- isomer is more bioavailable.
However, a different pattern of bioaccumulation was found in the Lake Winnipeg food web;
with anti-DDC-CO dominant in higher trophic level (TL) organisms like walleye and
goldeye, while syn-DDC-CO dominated the lower TL organisms like zooplankton and
mussels (Tomy et al., 2007b).
1.1.7 Other EFRs
TBX, TBCT, PBT, and HBB were identified as POP-like chemicals on the basis of their POV
and LRTP values (Kuramochi et al., 2014). In another modelling study, PBT, HBB, and TBX
were highlighted as capable of travelling extremely long distances (>8000 km) and were
thereby classified as POP candidates based on POV, LRTP, and bioaccumulation criteria
(Liagkouridis et al., 2015). Another study identified PBEB as potentially environmentally
persistent (Gouteux et al., 2008). Log BAF values ranged from 2.04–4.77, 2.72–4.09 and
3.31–5.54 for PBT, PBEB, and HBB, respectively in various aquatic species, demonstrating
their highly bioaccumulative properties (Wu et al., 2011). In Wu et al.’s study (2010), HBB
was reported to be biomagnified in the food web, whereas PBT was found to be diluted. HBB
was also found to be bioavailable to and accumulate in Eisenia fetida (Nyholm et al., 2010a).
However, BMF values of HBB for the earthworm Eisenia andrei were <0.17 which
suggested minimal biomagnification from soil (Belfroid et al., 1995). A study of the
transformation of HBB in soil, showed it degraded more rapidly (with a half-life < 40 days)

9
in aerobic soil than under anoxic conditions (in which a half-life >100 days was observed)
(Nyholm et al., 2010b). As reported above for DBE-DBCH, following its application to soil,
degradation of TBP-DBPE was evident over 360 days; moreover, the soil-air partition
coefficient of TBP-DBPE increased over time before levelling off, suggesting that the
volatility of TBP-DBPE decreases with time as it becomes more strongly bound to soil
(Wong et al., 2012). PBEB is included in the OSPAR list of chemicals, being ranked as
persistent, liable to bioaccumulate and toxic (OSPAR, 2001) and classified as a low
production volume (LPV) chemical in the EU (ESIS, 2010).

10
Table 1.1 Physicochemical properties of some important EFRs, PBDEs and HBCDDs
Compound Acronym Chemical structure Molecular
formula
Molecular
weight
Melting
point(°C)
Boiling
point(°C)
Vapour
pressure
(Pa)
(25 °C)
Water
solubility
(g/L)
(25 °C)
Log
KOW
Log
KOA
Half-
life in
air
(hours)
Half-
life in
water
(hours)
Half-
life in
soil
(hours)
Production
volume
Type of
BFR
2,2’,4,4’,5-
Pentabromodiphenyl ether BDE 99
C12H5Br5O 564.69 90.5-94.5 434.2 1.32E-07 h
9E-06 h
7.32 h
11.31 r 456
n 19992
n 19992
n HPV
j Additive
2,2’,4,4’,5,6’-
Hexabromodiphenyl ether BDE 154
C12H4Br6O 643.58 N/A 453.2 2.85E-08 h 1E-06
h 7.82
h 11.92
r N/A N/A N/A HPV
j Additive
2,2’,3,4,4’,5’,6-
Heptabromodiphenyl ether BDE 183
C12H3Br7O 722.48 N/A 490.7 3.51E-09 h 2E-06
h 8.27
h 11.96
r 1536
m N/A N/A HPV
k Additive

11
Decabromodiphenyl ether
BDE 209
C12Br10O 959.17 h
300-310 h
decompos
es at >320
4.63E-
06(21°C) h
<1E-07 h 8.70
i
18.42 t ,
14.98 s
7632 m
N/A N/A HPV Additive
Hexabromocyclodecane
HBCDD
C12H6Br6 641.7 c N/A
decompos
es at >190
c
1.04E-07 c N/A 7.92
c 11.8
o 40.8
m
1.05E-
15
(pH=7)
m
N/A HPV Additive c
Decabromodiphenyl ethane
DBDPE
C14H4Br10
971.2a
334-337b,
344-349d,
348-353e,
351-355e
676±50a
6.0E-15 a
1.0E-06 e
2.10E-07
a
7.2E-04 e
11.1 a
18.8 l
19.34 o
53.6 l 4320
l 8640
l N/A Additive
g
1,2-Bis(2,4,6-
tribromophenoxy)ethane BTBPE
C14H8Br6O2 687.6
a N/A
566.4±50.
0a
3.88E-10a
1.90E-05
a
7.88±0.
86 a
15.0 l 8.6
l 4320
l 8640
l LPV
g Additive
g

12
2-Ethylhexyl-2,3,4,5-
tetrabromobenzoate EH-TBB
(TBB)
C15H18Br4O2 549.9c
N/A N/A 3.71E-07 e 1.14E-05
f
7.73 c
8.75 f
12.34 q N/A N/A N/A N/A Additive
g
Bis(2-ethylhexyl)
tetrabromophthalate
BEH-
TEBP
(TBPH)
C24H34Br4O4 706.1 a N/A
584.8±45.
0a
1.55E-11 a 1.60E-06
a
10.08±
0.94 a
17.7 l
16.86 o
5.9 l 1440
l 2880
l LPV
g Additive
g
Tetrabromobisphenol A-
bis(2,3-dibromopropyl
ether)
TBBPA-
BDBPE
(TBBPA-
DBPE)
C21H20Br8O2 943.6 a
90-105 b,
90-100 c
676.5±55.
0a
1.60E-07 a 1.60E-07
a
10.42±
0.7 a
21.1 l 12.2
l 4320
l 8640
l LPV
g Additive
g
Pentabromoethylbenzene
PBEB
C8H5Br5 500.7 a 138
b
413.3±40.
0a
3.2E-04 a
4.67E-05e
3.50E-04 a
6.40±0.
62 a
9.9 l 111.6
l 4320
l 8640
l LPV
g Additive
g
2,3-Dibromopropyl 2,4,6-
tribromophenyl ether
TBP-
DBPE
(DPTE)
C9H7Br5O 530.6
c N/A N/A 1.86E-05
c N/A 5.82
c N/A N/A N/A N/A N/A Additive
c

13
Tetrabromoethylcyclohexane
DBE-
DBCH
(TBECH)
C8H12Br4 427.8 c N/A N/A
2.97E-03 c
1.05E-04e
6.92E-05e
4.82 c,
5.24 e,
5.25 p
8.01 p 52.8
m
756864
(pH=7)
m
N/A N/A Additive g
Benzene, 1,2,4,5-
tetrabromo- 3,6-dimethyl TBX
(p-TBX)
C8H6Br4 421.75 c N/A N/A 5.80E-03
c N/A 6.2
c 8.81
t N/A N/A N/A N/A Additive
c
Pentabromotoluene
PBT
C7H3Br5 486.6
g
280-282 g,
288-289 g
394.4±37
g
1.22E-03 g
7.80-E04
g
5.87±0.
62 g,
5.43 g,
6.99 t,
6.26 c
9.66 u
N/A N/A N/A LPV g Additive
c
Hexabromobenzene
HBB
C6Br6 551.5 g
327 g,
326 g
417.5±40g
1.14E-04 g
3.17E-04 g
7.70E-
04g,
1.10E-07g
5.85±0.
67 g,
6.07 g
10.26 u 1992
n 7584
n 7584
n N/A Additive
c

14
a) Data from SciFinder originating from calculated properties (ACD/labs Software V9.04); b) Data from SciFinder data base originating from experimentally
determined properties; c) Data from Bergman et al., (2012); d) Experimental data from Li et al. (2004); e) Experimental data from the Environment Agency
Dungey, S and Akintoye (2007); e) Data from Syracuse Research Corporation. f) Data from US. EPA (2008a); (g) Information from Covaci et al., (2011); (h)
Data from US. EPA (2008b); i) Data from Sifleet (2009); j) Data from Penta-BDE( Alaee et al. (2003)); k) Data from from octa-BDE (Alaee et al. (2003)); l)
Data from NPCA (2008); m): Data from Nyholm (2009); n) Data from Wegmann et al. (2009); o) Data from Ruan et al. (2009); p) Data from Howard and
Muir (2010); q): Data from Stapleton et al. (2008); r) Data from Harner and Shoeib (2002); s) Data from Cetin and Odabasi (2008); t) Data from
HENRYWIN v3.20 (EPIWIN 4) u) Stenzel et al. (2013); v) Data from Xian et al. (2011); w) Data from Feo et al. (2012); HPV: high production volume
(above 1000 tons/year); LPV: low production volume (below 1000 tons/year); N/A: not available.
Pentabromobenzene
PBBz
C6HBr5 472.59 N/A N/A N/A N/A 6.44 t 9.10
t N/A N/A N/A N/A N/A
Tetrabromo-o-chlorotoluene
TBCT
(TBoCT)
C7H3Br4Cl 442.17 c N/A N/A 1.72E-03
c N/A 6.29
c 8.82
t N/A N/A N/A N/A Additive
c
Dechlorane plus
DDC-CO
(DP)
C18H12Cl12 653.7
v
206 w,
350 °C
with
decompos
-ition v
N/A
1.37E-11 c,
4.71E-08 w
4.0E-11 w
9.3 v,
10.12 c,
11.27 p
13.1 t
N/A N/A N/A N/A Additive c

15
1.1.8 Relationships between physicochemical properties and human exposure
The presence of EFRs in dust, air and biota is governed by several factors such as: type of
flame retardant (reactive or additive), production volume, and physicochemical properties
such as vapour pressure, KOW, water solubility etc.
1.1.8.1 Influence of production volume and types of EFR on human exposure
After the phase out of “legacy” BFRs, there is increasing demand for EFRs. However, there
is very limited information about their production volumes. Dodson et al., (2012) found
concentrations of Firemaster 550 (FM550) components (EH-TBB and BEH-TEBP) and
DBDPE in 16 house dust samples from the USA were higher in 2011 than 2006, consistent
with increased production and use of these EFRs. In a similar vein, Tian et al. (2011) reported
DBDPE to exhibit the highest atmospheric concentrations other than PBDEs out of a group
of EFRs monitored at e-waste and rural sites in China. The authors attributed this to the large
production volume of DBDPE in China. These results indicate that the production volume
affects environmental concentrations of EFRs.
BFRs are mainly divided into two subgroups depending on their mode of incorporation into
polymers: reactive and additive. Reactive flame retardants, such as TBBP-A, are chemically
bound to the plastics. Conversely, additive flame retardants, which include HBCDDs,
PBDEs, DBDPE and BTBPE are simply blended with the polymers and are thus more easily
released from the treated products. This is illustrated by the markedly higher concentrations
of HBCDDs in indoor air, outdoor air and indoor dust compared to TBBP-A in spite of the
higher production volume of TBBP-A compared to HBCDD (Abdallah et al., 2008). All the
EFRs listed in Table 1.1 (except for PBBz which is unknown) are additive flame retardants;
therefore, this makes them more prone to leach out of products leading to a potential for high
levels in environmental and biotic samples.

16
1.1.8.2 Influence of physicochemical properties on human exposure pathways
1.1.8.3 Vapour pressure
Chemicals like PBEB, TBP-DBPE, TBX, PBT, HBB, TBCT and DBE-DBCH have relatively
high vapour pressures which equates to likely existence in the gas phase in air samples in
preference to the particulate phase. PBEB was found in a large number of air samples in
many countries such as Denmark, Norway, Sweden (Nordic Council of Ministers, 2011), the
US (Salamova and Hites 2011), and China (Tian et al. 2011). DBE-DBCH was the most
frequently detected compound in indoor air in Sweden, with DBE-DBCH and PBT more
frequently detected in indoor air than dust (Newton et al., 2015). Additionally, PBT and
DDC-CO were detected in all, and TBP-DBPE, HBB, EH-TBB detected in >75% of air
samples in Canada’s Western Sub-Arctic (Yu et al., 2015). Inhalation – particularly of indoor
air - will thus likely be an important route of human exposure to such chemicals.
1.1.8.4 KOW
BMF was found strongly, linearly related to log KOW for PBDEs and DDC-CO, with BMF
increasing up to log KOW values of ~8 (r2 = 0.92, p < 0.00001), and then markedly decreasing
as KOW increased further (She et al., 2013). Burreau et al. (2004) also found that tri- to hepta-
BDEs biomagnify with maximum biomagnification for penta-BDEs (log KOW = 6.46-6.97),
whereas bioaccumulation of PBDEs with six or more bromine atoms appeared negatively
correlated with the degree of bromination; octa-, nona- and deca-BDEs were bioavailable and
detected in fish muscle but were not biomagnified (Burreau et al., 2004). Likewise, in
Voorspoels et al. ’s study (2007) of a rodent-buzzard food chain, biomagnification only
increased with KOW for BDEs 47 to 154, with BDE 183 less biomagnified in buzzard than
expected based on its KOW. These observations are consistent with a bioaccumulation model
that predicted that accumulation of organic chemicals in biota increases with increasing log

17
KOW up to log KOW = 7 but decreases at higher log KOW values (Thomann, 1989). This would
also account for the observation that DBDPE bioaccumulated in rats to concentrations 3-5
orders of magnitude lower than BDE 209 after oral exposure to 100 mg/kg bw/day of
DBDPE or BDE 209 for 90 days (log KOW of BDE 209 = 8.70 (Sifleet, 2009); log KOW of
DBDPE = 11.10 (data from Scifinder)) (Wang et al., 2010). However, in stark contrast, He et
al. (2012) found that DBDPE bioaccumulated in fish at concentrations one order of
magnitude higher than those of BDE 209, even though DBDPE concentrations were lower
than BDE 209 in both water and sediment samples to which the fish were exposed. This
could be partly attributed to piscine metabolic debromination of BDE 209 and lack of
metabolism for DBDPE. Moreover, the marked differences between the studies of Wang et al.
(2010) and He et al. (2012) may reflect different bioavailability and biotransformation
behaviour for DBDPE and BDE 209 in fish compared to rats. In summary, without
considering biotransformation of the chemicals, compounds possessing log KOW values
between around 7 to 8 may have the greatest potential for bioaccumulation. Based on this
simple criterion, BTBPE, EH-TBB, PBEB, PBT and PBBz are potentially the most likely of
the EFRs in Table 1.1 to display high bioaccumulative potential, and thus human exposure to
these contaminants via the diet is likely to be substantial.
Perhaps more reliable are the evaluation criteria of EFSA (2012), who state that chemicals
with log KOW between 3 and 11 and a metabolic rate constant (km) >1 day-1
are likely to
display high potential for bioaccumulation. Therefore, EFRs having a high potential for
bioaccumulation according to these two heuristic rules are indicated in the box in Figure 1.1,
namely: BTBPE, EH-TBB, DBE-DBCH, PBEB, PBT, HBB, TBX and TBCO. These EFRs exhibit
potential to distribute in the sediment and biotic samples and dietary intake may be their main
exposure pathway for humans.

18
Figure 1.1 Potential for bioaccumulation (EFSA 2012)
1.1.8.5 Water solubility
While all of the EFRs in Table 1.1 have very low water solubility, BTBPE and EH-TBB show
higher water solubility and lower vapour pressure compared to other EFRs and may thus be
found in water to a limited extent. Coupled with their bioaccumulative potential, this means
that BTBPE and EH-TBB are likely to be prevalent in aquatic foodstuffs consumed by
humans.
1.2 Applications and use
Application, uses and production volumes of some important EFRs are shown in Table 1.2.
As replacements for “legacy” FRs, these EFRs were produced and used widely worldwide in
electrical and electronic appliances, building insulation foam, textiles, construction materials,
adhesives, polyurethane foam and so on. Despite the wide variety of potential applications,
information about EFR production volumes is scarce. Compared to the estimated total

19
consumption of Penta-BDEs (7,500 tons), Octa-BDEs (3,790 tons), Deca-BDEs (56,100 tons)
in 2001 (BSEF, 2006) and annual worldwide production of HBCDDs (~28,000 tons) (Yang,
2014), reported global production volumes of DBDPE and BTBPE were comparable to those
of Deca-BDEs and HBCDDs while worldwide production of BEH-TEBP, PBT, DDC-CO,
and TBBPA-BDBPE was comparable to those of Penta-BDEs and Octa-BDEs. Production
volume information for other EFRs is either not available, or reveals production to be low.
More detailed, up-to-date information on production of EFRs is needed to test the hypothesis
that their production has increased following restriction of “legacy” FRs.
1.3 Toxicology and health effects
1.3.1 DBDPE
DBDPE does not display acute toxicity in laboratory animals, with single-dose and long-term
(90 days) oral administration of DBDPE in rats yielding a lethal dose (LD50) > 5000 mg/kg
bw and an acute dermal LD50 > 2000 mg/kg bw for rabbits (Harju et al., 2009). However, the
DBDPE concentrations in dust were positively associated with triiodothyronine (T3) levels in
the exposed men, indicating exposure to DBDPE in indoor dust may be leading to endocrine
disruption (adverse health effects which human and wildlife have suffered from exposed to
chemicals that interact with the endocrine system (Kavlock et al., 1996)) in males (Johnson et
al., 2013). This epidemiological finding was consistent with the laboratory study of Wang et
al. (2010), which found a significant increase in the T3 level in male rats following DBDPE
treatment, suggesting that DBDPE can alter thyroid hormone homeostasis. DBDPE-induced
hepatotoxicity in rats was also indicated by serum clinical chemistry data for AST, ALP, Cr,
and TBA (Wang et al., 2010). In aquatic organisms, DBDPE was reported to be acutely toxic
to Daphnia magna, reduced the hatching rates of exposed zebra-fish eggs and raised
significantly the mortality of hatched larvae (Nakari and Huhtala, 2009). Moreover, in

20
rainbow trout and brown trout hepatocytes, DBDPE increased vitellogenin synthesis
(indicating DBDPE to be estrogenic), inhibited CYP1-dependent monooxygenase activity,
and increased the activity of UGT (Nakari and Huhtala, 2009). Additionally, DBDPE (at
doses of 0.1 and 0.2 μM) induced AhR-regulated CYP1A4 and CYP1A5 mRNA in primary
culture of chicken embryonic hepatocytes (Egloff et al., 2011).
1.3.2 BTBPE
Studies using Salmonella typhimurium strains TA98, TA100, TA 1535, TA1537 and TA1538
and Saccharomyces cerevisiae strain D4, both in the presence and absence of metabolic
activation, revealed BTBPE to display a lack of mutagenicity (Harju et al., 2009). Harju et al.
(2009) also reported the lethal concentration to be > 36.7 g/m3 in rats following BTBPE
inhalation for period of 4 hours, with the only relevant effects observed being behavioural
modification, gastrointestinal lesions, and dermatitis. Dermal application to rabbits
established the lethal dose to be > 10 g/kg (Harju et al., 2009). Acute toxicity studies showed
the oral LD50 of BTBPE to be >10 g/kg b.w. for rats and dogs (Matthews, 1984, as cited by
Nomeir et al., 1993). No obvious effect was seen for rats exposed to BTBPE in the diet at a
concentration of 500 mg/kg, corresponding to 35 mg/kg b.w. for 14 days (Nomeir et al.,
1993). Egloff et al. (2011) investigated the toxicity of BTBPE in chicken embryos. The
embryonic pipping success was not affected at any of the injected doses (from 0.1 to 10 μg/g
egg). The changes in the relative messenger RNA (mRNA) abundance of 11 genes involved
in xenobiotic biotransformation, lipid metabolism and thyroid hormone homeostasis were
investigated in the liver of pipped embryos, and in primary cultured chicken embryo
hepatocytes exposed to various BTBPE concentrations. BTBPE significantly upregulated the
expression of cytochrome P-450 (CYP) 1A4 and 1A5 mRNA levels in vitro (at ≥ 0.03 μM)
and in vivo (at 3 μg/g egg). A dose-dependent decrease in type III iodothyronine 5‟-
deiodinase mRNA was observed in embryonic livers, whereas type I iodothyronine

21
deiodinase was upregulated in chicken embryo hepatocytes (Egloff et al., 2011). Moreover, it
has been reported that BTBPE may cause antiestrogenic effects (Ezechiáš et al., 2012).
1.3.3 EH-TBB and BEH-TEBP
The Firemaster 550 formulation which contains both EH-TBB and BEH-TEBP, was shown
to be an endocrine disruptor and an obesogen at environmentally relevant levels in rats
(Patisaul et al., 2013) and caused DNA damage to fathead minnows (Bearr et al., 2010). EH-
TBB and BEH-TEBP were reported to show the endocrine disrupting potentials using the
yeast YES/YAS reporter assay and the mammalian H295R steroidogenesis assay (Saunders et
al., 2013). In one study investigating the effects of EH-TBB and BEH-TEBP on
steroidogenesis in a porcine primary testicular cell model, it was shown that EH-TBB
exposure appeared to favour synthesis of cortisol and aldosterone, while BEH-TEBP
exposures selectively produced more sex hormones (Mankidy et al., 2014). Concentrations of
BEH-TEBP in indoor dust were positively associated with total T3 in exposed men,
suggesting that exposure to contaminants in indoor dust may be leading to endocrine
disruption in men (Johnson et al., 2013). Noyes et al. (2015) studied a new morphological
and behavioural testing platform with embryonic zebrafish to characterise the developmental
toxicity of some flame retardants. Their results indicated zebrafish neurodevelopment was
sensitive to EH-TBB and BEH-TEBP.
1.3.4 TBBPA-BDBPE
The LD50 of TBBPA-BDBPE was found to be > 20 g/kg for oral and dermal administration in
mice and no abnormal gross symptoms or death were observed, suggesting that TBBPA-
BDBPE is not acutely toxic (WHO, 1995). In mutagenicity tests performed with Salmonella
typhimurium strains TA100 and TA1535, TBBPA-BDBPE caused positive responses both in
the presence and absence of metabolic activation. However, its mutagenicity in the absence

22
of metabolic activation was found to be higher than in its presence, suggesting any
metabolites to be less mutagenic (Haneke, 2002). No endocrine effect of TBBPA-BDBPE
was found in tests based on aromatase enzymes (CYP19 and CYP17) in H295R adrenal
cortical cells (Cantón et al., 2005). In addition, no effects of TBBPA-BDBPE on the aryl
hydrocarbon receptor, the androgen receptor, progesterone receptor and estrogen receptor
were found, although TBBPA-BDBPE has a high potency of estradiol sulfotransferase
inhibition and can compete with thyroxine for binding to the plasma transport protein
transthyretin (Hamers, 2006).
1.3.5 DBE-DBCH
Liver and gonad somatic indices were not affected in juvenile brown trout following dietary
exposure to three concentrations of β-DBE-DBCH (2.02 (low), 14.7 (medium) and 118.4
(high) pmoles/g fat at a feed ration of 1 % of their b.w.) (Gemmill et al., 2011). There were
also no significant differences in circulating plasma levels of 17 β-estradiol, testosterone and
11-ketotestosterone between the treatment groups and no evidence of isomerisation of the β-
isomer to other isoforms in vivo (Gemmill et al., 2011). In a follow-up study using the same
dose levels, a significant reduction in total plasma thyroxine in the high dose group and a
significant increase in mean thyroid epithelial cell height in the three different dose groups
were found, while these differences disappeared at the end of the depuration phase, with the
growth of the fish unaffected (Park et al., 2011). Larsson et al. (2006) found that DBE-DBCH
bound to and activated the human androgen receptor (AR), and can compete with
dihydrotestosterone (DHT) in a receptor-binding assay. Furthermore, Khalaf et al. (2009)
reported that the γ- and δ-DBE-DBCH activated the human androgen receptor (AR) at
concentrations that are comparable to those of DHT. While the γ- and δ-isomers were found
to be more potent activators of AR than α- and β-DBE-DBCH, all diastereomers activated the
AR in the human prostate cell line LNCaP, indicating DBE-DBCH to be a potential endocrine

23
disrupter, and comparably increased expression of prostate specific antigen (PSA). Moreover,
DBE-DBCH was reported to be mutagenic in the absence of metabolic activation in a
L1578Y tk+/tk-mouse lymphoma-cell forward-mutation assay (McGregor et al., 1991).
Furthermore, DBE-DBCH diastereomers bound to the zebrafish androgen receptor in vitro
and in vivo, indicating that DBE-DBCH has androgenic properties (Pradhan et al., 2013). In
the same study, DBE-DBCH displayed a negative effect on zebrafish hatching and induced
morphological abnormalities and juvenile mortality (Pradhan et al., 2013).
1.3.6 DDC-CO
The developmental and reproductive toxicity of DDC-CO in rats was investigated, with no
effects observed on in-life parameters or clinical or anatomic pathology, resulting in a no-
observable-effect level (NOEL) in both repeat dose toxicity and developmental or
reproductive toxicity phases of the study of 5000 mg/kg (Brock et al., 2010). DDC-CO has
been shown to have very low toxicity to fish (no acute toxicity with regard to bluegill
sunfish—Lepomis macrochirus—was seen at the highest test concentration of 100 mg/L) (US
EPA, 2009). No adverse effects of DDC-CO on embryonic viability or pathways associated
with the genes assessed are predicted at current environmental exposure levels (Crump et al.,
2011). However, a significant dose-related decrease of liver and ovary weights was observed
in rabbits compared to control animals following exposure to DDC-CO through the skin (US
EPA, 2009). Furthermore, DDC-CO is reported to induce hepatic oxidative damage and
perturbations of metabolism and signal transduction in rats and cause significant alteration of
gene expression involved in carbohydrate, lipid, nucleotide, and energy metabolism, as well
as signal transduction processes (Wu et al., 2012).
1.3.7 Other EFRs
PBT and HBB are both reported as able to bind and activate the Ah receptor (Brown et al.,

24
2004). There were no evident signs of PBT toxicity when rats were exposed orally to PBT at
doses ranging from 0.05 to 500 mg/kg for 91 days, except some histological changes in the
thyroid gland, liver and kidneys (Harju et al., 2009). There was also no observed mutagenic
activity as assessed by S. typhimurium assays, either in the presence or in the absence of
metabolic activation (Harju et al., 2009). HBB shows very low toxicity to rats, quail and
chickens. The lowest toxic dose reported following oral exposure to HBB in rats, quail and
chickens was 150 mg/kg, 1.5 g/kg/ 15 days and 52.5 g/kg/ 12 weeks, respectively, and dietary
exposure to HBB gave rise to effects on the liver, enzyme inhibition and induction of, or
changes in, blood or tissue levels of rats, quail and chickens (Harju et al., 2009). Larsson et
al. (2006) reported that HBB is not an agonist or antagonist of the androgen receptor as
shown by tests in human liver carcinoma cells. Conversely, an increase in the porphyrin level
in rats following HBB exposure suggested porphyrogenic activity (Szymańska and
Piotrowski, 2000).
PBEB has been tested for acute toxicity in rabbits with LD50 values > 8 g/kg reported (Harju
et al., 2009). No mutagenic activity was observed for this compound according to S.
typhimurium assays (Harju et al., 2009). TBP-DBPE was demonstrated to be a potent AR
antagonist in humans, zebrafish, and chickens, with observed alterations in LAT gene
transcription suggesting that this compound should be considered as a potential neurotoxic
and endocrine disrupting compound (Asnake et al., 2015; Pradhan et al., 2015).
No recent relevant toxicity data appear to be available for TBX, PBBz and TBCT.

25
Table 1.2 Application, uses and production volumes of some important EFRs
Compounds Application and uses Product (Company) Production/import volume
DBDPE ABS, polycarbonate/ABS, HIPS/polyphenylene oxide and textiles a
Saytex® 8010 (Albemarle Corp.) a
Firemaster® 2100 (Chemtura Corp.) a
~1000 and 5000 tons (European imports,
primarily to Germany) in 2001 a
12,000 tons (production in China) in 2006 a
BTBPE ABS, HIPS, thermoplastics, thermoset resins, polycarbonate and
coatings a
FF-680 (Chemtura Corp.) a
450-4500 tons/year in the USA after 1998 a
~16,710 tons (worldwide) in 2001 a
EH-TBB(TBB) PUF applications a
Firemaster 550 (Chemtura Corp.) a
Fire retardant BZ-54 (Chemtura Corp.) a
N/A
BEH-TEBP(TBPH)
PUF applications, PVC and neoprene, wire and cable insulation, film
and sheeting, carpet backing, coated fabrics, wall coverings and
adhesives a
Firemaster 550 (Chemtura Corp.) a
Fire retardant BZ-54(Chemtura Corp.) a
DP-45(Chemtura Corp.) a
450 to 4500 tons/year from 1990 to 2006 a
TBBPA-BDBPE
(TBBPA-DBPE)
plastic products, such as pipes, water barriers, kitchen hoods and
electronics a
now ICL Industrial Products, Israel, Albemarle
Corp., the Great Lakes Chemical
Corporation/Chemtura, a
JiangSu HaoHua Fine Chemical Co., Ltd and
Weidong International Group, Ltd. in China a
4000 tons in China in 2006 a
< 4500 tons in the USA in 2006 a
3000 tons/year (JiangSu HaoHua Fine
Chemical Co., Ltd) in China a
PBEB
thermoset polyester resins (circuit boards, textiles, adhesives, wire and
cable coatings, polyurethane foam) a, unsaturated polyesters, styrene
butadiene copolymers, textiles b
Albemarle Corp. a
FR-105 (now ICL Industrial Products) a
N/A
TBP-DBPE(DPTE) N/A Bromkal 73-5PE (Chemische Fabrik Kalk in
Germany) c
N/A

26
a) Covaci, A., Harrad, S., Abdallah, M.A.E., Ali, N., Law, R.J., Herzke, D., de Wit, C.A., 2011. Novel brominated flame retardants: A review of their analysis, environmental
fate and behaviour. Environ. Int. 37, 532–556.; b) Wu, J.-P., Guan, Y.-T., Zhang, Y., Luo, X.-J., Zhi, H., Chen, S.-J., Mai, B.-X., 2011. Several current-use, non-PBDE
brominated flame retardants are highly bioaccumulative: Evidence from field determined bioaccumulation factors. Environ. Int. 37, 210–215.; c) De Wit, C., Kierkegaard, A.,
Ricklund, N., Sellström, U., 2011. Emerging Brominated Flame Retardants in the Environment Brominated Flame Retardants, in: Eljarrat, E., Barceló, D. (Eds.), . Springer
Berlin / Heidelberg, pp. 241–286.; d) Brominated Flame Retardants (BFRs) in Food. EFSA Journal 2012;10(10):2908. [125 pp.]. Available online:
www.efsa.europa.eu/efsajournal; e) Xian, Q., Siddique, S., Li, T., Feng, Y., Takser, L., Zhu, J., 2011. Sources and environmental behavior of dechlorane plus — A review.
Environ. Int. 37, 1273–1284.; f) Sverko, E., Tomy, G.T., Reiner, E.J., Li, Y.F., McCarry, B.E., Arnot, J.A., Law, R.J., Hites, R.A., 2011. Dechlorane plus and related
compounds in the environment: a review. Environ. Sci. Technol. 45, 5088–98.; g) Feo, M.L., Barón, E., Eljarrat, E., Barceló, D., 2012. Dechlorane Plus and related
compounds in aquatic and terrestrial biota: a review. Anal. Bioanal. Chem. 404, 2625–2637.
DBE-
DBCH(TBECH)
expandable PS beads for house insulation, extrudedpolystyrene, for
adhesives in fabric, electrical cable coatings, high impact plastic in
appliances and some construction materials a
Saytex BCL-462 Albemarle Corp. (contains
equal amounts of the two diastereomers, α-and
β-TBECH) a
4.5 to 230 tons/year in the US from1986 to
2002 a
TBX(p-TBX) N/A N/A N/A
PBT
unsaturated polyesters, polyethylene, polypropylene, polystyrene,
SBR-latex, textile, rubbers, ABS (acrylonitrile butadiene styrene
terpolymer) a
Flammex 5-BT (Berk Ltd., U.K.) a
FR-105 (ICL Industrial Products, Israel and
Chemtura, US) a
~1000 and 5000 tons/ year a
600 tons/year at Shou Guang Longfa
Chemical Co. Ltd in China a
HBB paper, woods, textiles, electronic and plastic goods a
FR-B (Japanese Nippoh Chemicals Corp) a
Dayang Chemicals in China a
AFR 1001, HBB (flame retardant), HBB-S,
NSC 113975 d
350 tons in 2001 in Japan a
600 tons/year (Shou Guang Longfa
Chemical Co. Ltd.) in China a
PBBz N/A N/A N/A
TBCT(TBoCT) N/A N/A N/A
DDC-CO(DP)
nylons, polybutylene terephthalate (PBT), polypropylene (PP), ABS,
epoxy resins, electric wire and cable, and synthetic elastomers e
plastic connectors in televisions and computer monitors, and furniture f
plastic roofing materials and other polymeric systems for fire
prevention g
DP,DP-25,DP-35, and DP-515 (Hooker
Chemical Corporation, now called Occidental
Chemical Corporation (Oxychem), in Buffalo,
USA) e
Anpon Electrochemical Co., Ltd in Jiangsu
province in China e
5000 tons/ year (worldwide) e
300-1,000 tons/ year in China g
27
1.4 Concentrations of EFRs in air and dust
Multiple studies have reported the concentrations, fate and behaviour of EFRs in both indoor
and outdoor environments, as shown in Table 1.3. EH-TBB, BEH-TEBP, DBDPE, BTBPE,
HBB, TBX, PBBz, PBEB, PBT, TBP-DBPE, as well as syn- and anti-DDC-CO were
detectable in European Arctic air (Möller et al., 2011a, 2011b; Salamova et al., 2014) or
Canada’s Western Sub-Arctic (Yu et al., 2015) suggesting that these compounds can undergo
long-range atmospheric transport. This is supported by the detection of PBT, PBEB, HBB,
EH-TBB, BEH-TEBP, BTBPE, TBP-DBPE, and DDC-COs in various animals from remote
areas such as the Norwegian Arctic and Greenland (Mckinney et al., 2011a; Verreault et al.,
2007; Vorkamp et al., 2015). The concentrations of some EFRs, especially HBB, TBP-
DBPE, PBT, EH-TBB, BEH-TEBP, DBDPE and DDC-COs were similar to or higher than
those of PBDEs in the Arctic, indicating a trend away from PBDEs towards EFRs (Möller et
al., 2011a, 2011b; Salamova et al., 2014).
Very little is known about the levels of EFRs in indoor air. DBDPE has been determined in
indoor air in a recycling facility at a concentration of 0.6 ng/m3 in Sweden (Kierkegaard et
al., 2004) which exceeds concentrations reported for one Swedish household (22.9 pg/m3)
(Karlsson et al., 2007) and those detected more recently in Swedish offices, apartments,
stores, and schools (<90-250 pg/m3) (Newton et al., 2015). BTBPE was also measured at
high concentrations (<0.6–67 ng/m3) in indoor air from various electronic dismantling sites in
Sweden (Pettersson-Julander et al., 2004; Sjödin et al., 2001), but was not detected in air
from Swedish offices, apartments, stores, and schools (Newton et al., 2015) nor in
households and primary schools in Norway (Cequier et al., 2014).
The more volatile compounds such as DBE-DBCH, PBT, and PBEB, similar to BDE 28, 47,
99, and 100, were more frequently detected in indoor air samples (Cequier et al., 2014;

28
Newton et al., 2015), and DBE-DBCH was the most abundant EFR found in indoor air in
Sweden (Newton et al., 2015) and Norway (Cequier et al., 2014).
Less volatile EFRs such as BEH-TEBP, DDC-CO, and DBDPE were found much more
frequently than more volatile EFRs like DBE-DBCH, PBT, and PBEB in indoor dust than air
(Cequier et al., 2014; Newton et al., 2015; Qi et al., 2014; Shoeib et al., 2012) (Table 1.3 and
1.4). Levels of DBDPE, BTBPE and PBDEs determined in floor and furniture dust from the
living room and bedroom of five households in Sweden were 47 ng/g (<0.455-121), 4.8 ng/g
(2.5-8.2) and 692.6 ng/g (174.4-1722.5), respectively (Karlsson et al. 2007). The same study
reported PBDEs in the blood plasma of householders at a mean concentration of 33.7 ng/g
lw; with EFRs not found above detection limits in the same individuals (<1.31 ng/g lw for
BTBPE and <1.03 ng/g lw for DBDPE) (Karlsson et al. 2007). In North America, Stapleton et
al. (2008) reported DBDPE, BTBPE, BEH-TEBP, and EH-TBB in domestic dust collected
from 19 homes from Boston, USA. In living area, bedroom, and vacuum bag dust, geometric
mean concentrations (ranges) of these were: DBDPE: 138 ng/g (<10-11,070), 153 ng/g (<10-
3240), and 39.4 ng/g (<10-262); BTBPE 48 ng/g (4.7-654), 48 ng/g (1.6-789), and 18 ng/g
(2.5-219); BEH-TEBP 234 ng/g (3.0-10,630), 105 ng/g (1.5-763), and 66 ng/g (24.3-111);
and EH-TBB 322 ng/g (<6.6-15,030), 90 ng/g (<11-378), and 92 ng/g (35.7-669),
respectively. In a study monitoring a wide range of EFRs in indoor dust in Norwegian
households and schools, the most abundant compounds were DBDPE and BEH-TEBP in
both living rooms and classrooms (Cequier et al., 2014). Especially in house dust samples,
DBDPE and BEH-TEBP were found to be the main congeners in various countries such as
the USA (Dodson et al., 2012), China (Qi et al., 2014), Sweden (Sahlström et al., 2015),
Germany (Fromme et al., 2014), Belgium and the UK (Ali et al. 2011a).
Dust-air partitioning coefficients (KDA) (expressed as the quotient of matched dust and indoor

29
air samples (m3/g)) for compounds were found to be strongly correlated with KOA values for
three EFRs: DBE-DBCH, PBT, HBB, and BDE 47 (R2 = 0.9965, P < 0.005) (Newton, 2015).
Cequier et al. (2014) reported similar highly significant linear correlations for 20 FRs in the
living rooms sampled including DBE-DBCH, PBT, and HBB. This correlation suggests that
thermodynamic equilibrium between dust and air is reached for these compounds.

30
Table 1.3a Summary of median concentrations of EFRs in air and dust (range values in parentheses)
Matrix
DBDPE BTBPE EH-TBB BEH-TEBP TBBPA-BDBPE DBE-DBCH Region References
Ambient air
(pg/m3)
1842 (402-3578)
23 a
0.27 (0.04-2.2)
1.0-22
0.15(<0.12-0.33)
2.95(<5.90-216)
nd-2240
3.97-1370
6.7 (2.8-70)
25.7(3.83-67.4)
0.4-1.8 a
nd-0.06 b
0.73 a
0.044 (0.024-0.222)
0.03 (0.01-0.09)
0.5-1.2
<0.077(<0.077-0.26)
1.26(<0.06-90.5)
4.49-398
nd-28.4
0.143(0.024-1.21)
2.2(0.17-58)
0.13(<0.029-0.47)
0.03(<0.06-1.19)
0.5-8 a
0.353(0.028-5.55)
1.8(0.27-14)
0.35(<0.69-64.2)
371(131-1240)
0.46(0.18-2.4)
USA
China
USA
Greenland
China
Canada, Western sub-arctic
Longyearbyen, Svalbard
USA, near Great Lakes
Sweden
East Africa
China, e-waste
China, rural area
(Hoh et al., 2005)
(Shi et al., 2009)
(Ma et al., 2013)
(Möller et al., 2011b)
(Qiu et al., 2010)
(Yu et al., 2015)
(Salamova et al., 2014)
(Venier and Hites, 2008)
(Newton et al., 2015)
(Arinaitwe et al., 2014)
(Tian et al., 2011b)
(Tian et al., 2011b)
Indoor air
(pg/m3)
<90(<90-250)
0.6 ng/m3
8.30(na-20.6)
0.01–1.2 ng/m3
20 a(5.6-67) ng/m3
<0.6–39 ng/m3
<35(<35-150)
nd(na-6.32)
55(7.0-130)
46.6(na-399)
Sweden
Sweden, e-waste
Sweden, e-waste
Norway, classroom
Sweden, e-waste
(Newton et al., 2015)
(Sjödin et al., 2000)
(Kierkegaard et al., 2004)
(Cequier et al., 2014)
(Pettersson-Julander et al., 2004)
House air
(pg/m3)
nd(na-963)
nd(nd-22.9)
nd(na-24.2) 77.9(na-4120) Norway, living room
Sweden
(Cequier et al., 2014)
(Karlsson et al., 2007)
Indoor dust
(ng/g)
12(<0.41-2200)
280(nd-16000)
156(na-360)
17(<0.76-150)
2.5(0.21-220)
6.55(na-53.0)
9.1(<2.5-65)
0.83(nd-6300)
3.32(na-5.72)
140(<33-1500)
29(nd-1600)
103(na-151)
1.2(<0.073-3.8)
2.10(na-10.0)
Sweden
China
Norway, classroom
(Newton et al., 2015)
(Qi et al., 2014)
(Cequier et al., 2014)
Office dust
(ng/g)
750-16200
721(170-1846)
99(nd-860)
6.5-11700
19(2-384)
nd(nd-40)
4.0-66.4
7(<2-31)
42.7-928
64(16-265)
306(<20-2211)
China
Belgium
UK
(Cao et al., 2014)
(Ali et al., 2011a)
(Harrad et al., 2008a)
House dust
(ng/g)
14(5-850)
153(55-2126)
23(<2-1430)
201(<10-11070)
2733(100-47000)
24(nd-3400)
140(18-2800)
146(47-1570)
150(43-1500)
147(na-4460)
3.15(<0.2-397)
2(<0.5-1019)
2(<2-175)
30(1.6-789)
6.47(nd-211)
5.3(nd-1900)
12(3-130)
<10(<10-34)
6.3(1.1-36)
30(1.8-610)
3.76(na-41.9)
0.03(<0.2-4.5)
1(<2-436)
2(<2-2285)
133(<6.6-15030)
100(45-5900)
<3.0(<3.0-13.6)
2.6(<0.29-280)
120(<0.30-18000)
2.54(na-245)
3.5(<0.2-141)
13(<2-5004)
12(<2-640)
142(1.5-10630)
260(<2-3800)
343(25-2274)
61(<10-340)
99(10-6400)
78.5(na-809)
78(<20-1286)
7(<10-560)
<2(<2-25) α-DBE-DBCH;
<2(<2-26) β-DBE-DBCH
3.3(<0.6-19) α-DBE-DBCH;
3.4(0.77-16) β-DBE-DBCH
1.72(na-172)
Pakistan
Belgium
New Zealand
USA
China
UK
USA
Germany
Sweden
Canada
Norway
( Ali et al., 2012b)
(Ali et al., 2011a)
(Ali et al., 2012a)
(Stapleton et al., 2008)
(Wang et al., 2010)
(Harrad et al., 2008a)
(Dodson et al., 2012)
(Fromme et al., 2014)
(Sahlström et al., 2015)
(Shoeib et al., 2012)
(Cequier et al., 2014)
a) Average concentration; b) Gaseous phase; c) Total DDC-CO concentration; d) Passive air sampling; e) Active air sampling; na: not available; nd: not detectable.

31
Table 1.3b Summary of median concentrations of EFRs in air and dust (range values in parentheses) (Continued)
Matrix PBEB TBP-DBPE TBX PBT HBB PBBz TBCT Syn-DDC-CO Anti-DDC-CO Region References
Ambient air
(pg/m3)
nd-0.01
0.011(0.002-0.078)
0.03(0.01-0.24)
0.03(<0.06-1.83)
0.29-867
0.10-4.80
0.034(0.006-0.201)
0.07(0.01-0.16)
nd-158
nd-3.43
0.001-0.02 b
nd-0.02
0.055 (0.007-0.47)
0.17(0.066-0.50)
0.03(<0.06-22.2)
0.19-125
0.21-3.57
0.04-0.66 b
1.7 a (0.3-6.5)
0.02-0.09
0.015(0.003-0.104)
0.12(0.01-1.7)
<0.053(<0.053-0.26)
0.05(<0.09-1.47)
4.47-559
0.42-13.9
0.04(0.01-1.1)
3.5 a
0.050(0.003-0.722)
0.22(0.05-0.91)
0.8-20 c
<1-9.0
0.03(<0.05-4.39)
6.9 d
/0.4 e a
0.046(0.005-1.04)
0.55(0.15-4.2)
<1-33.1
0.03(<0.05-1.37)
Greenland
China
Canada
Canada, Western sub-arctic
Longyearbyen, Svalbard
USA, near Great Lakes
Greenland
Sweden
East Africa
China, e-waste
China, rural area
China, urban area
(Möller et al., 2011b)
(Qiu et al., 2010)
(Gouteux et al., 2008)
(Yu et al., 2015)
(Salamova et al., 2014)
(Venier and Hites, 2008)
(Vorkamp et al., 2015)
(Newton et al., 2015)
(Arinaitwe et al., 2014)
(Tian et al., 2011b)
(Tian et al., 2011b)
(Ma et al., 2011)
Indoor air
(pg/m3)
nd(na-nd)
0.841(na-10.6)
nd(na-2.92)
11(2.6-29)
2.57(na-4.14)
3.6(<5.1-64)
4.03(na-6.52)
<36(<36-48) c
nd(na-nd)
nd(na-nd)
Sweden
Norway, classroom
(Newton et al., 2015)
(Cequier et al., 2014)
House air
(pg/m3)
0.531(na-30.6) 0.789(na-132) nd(na-2830) 7.64(na-213) 4.11(na-297) nd(na-7.39) nd(na-7.61) Norway, living room (Cequier et al., 2014)
Indoor dust
(ng/g)
nd(nd-4.8)
nd(na-0.103)
nd(nd-26)
0.178(na-0.707)
nd(na-nd)
1.1(<0.066-5.5)
0.60(nd-34)
0.232(na-1.06)
3.1(<0.26-69)
0.57(nd-260)
0.901(na-5.27)
0.14(nd-3.6)
4.8(<0.19-4800) c
0.921(na-3.13)
2.63(na-9.25)
Sweden
China
Norway, classroom
(Newton et al., 2015)
(Qi et al., 2014)
(Cequier et al., 2014)
Office dust
(ng/g)
0.15(nd-2.05) 1.52(0.22-12.0) 21.0(3.22-658) China (Wang et al., 2010)
House dust
(ng/g)
<0.07-4.1
nd(na-8.00)
1.50(<0.30-1200)
0.505(na-21.4)
nd(na-88.8)
2.8(<0.20-100)
0.30(<0.02-12)
0.633(na-16.1)
<2(<2-13)
8.9(<0.32-170)
3.7(<0.02-130)
0.671(na-8.94)
0.99(<0.29-11)
<0.02-7.1
2.8(<0.70-170)
14(2.3-5683) c
212(nd-8810)
2.98(nd-21.6)
0.971(nd-7.97)
1.45(na-311)
4.0(<0.70-170)
325(nd-12200)
12.4(1.83-62.1)
2.49(nd-20.7)
4.16(na-590)
USA
Sweden
Canada
Canada
South China, e-waste
South China, Guangzhou
South China, rural area
Norway
(Dodson et al., 2012)
(Sahlström et al., 2015)
(Shoeib et al., 2012)
(Zhu et al., 2007)
(Wang et al., 2011)
(Wang et al., 2011)
(Wang et al., 2011)
(Cequier et al., 2014)
a) Average concentration; b) Gaseous phase; c) Total DDC-CO concentration; d) Passive air sampling; e) Active air sampling; na: not available; nd: not detectable.

32
1.5 Concentrations of EFRs in biota and humans 1
There is very little information on the occurrence of EFRs in biota and only a few EFRs such as 2
BTBPE and DBDPE have been reported in biotic samples. Current information about 3
concentrations of EFRs in biota are summarised in Table 1.4. BTBPE and DBDPE were detected 4
in a variety of biota samples including meat, fish, shellfish, offal, eggs and birds (Fernandes et 5
al., 2010; Gauthier et al., 2008; Guerra et al., 2012; Labunska et al., 2015; Law et al., 2006a; Li 6
et al., 2015; Munschy et al., 2011; Shi et al., 2009). A selection of UK and Irish food samples 7
were analysed for HBB, DBDPE and BTBPE. HBB and DBDPE were not detected in any foods, 8
whilst BTBPE occurred in some UK food samples such as meat (0.05 - 1.76 ng/g lw), fish (0.26 - 9
3.33 ng/g lw), eggs (0.29 ng/g lw) and offal (0.75 - 0.81 ng/g lw) (Fernandes et al., 2010). The 10
highest BTBPE concentrations were found in chicken eggs (37.2-264 ng/g lw) from an e-waste 11
area in South China (Zheng et al., 2012), with DBDPE also found at high levels in chicken eggs, 12
birds’ offal, muscle and eggs from an e-waste area and the Pearl River Delta, South China (Shi et 13
al., 2009; Sun et al., 2012, 2014; Zheng et al., 2012). Meanwhile, in food samples collected from 14
e-waste impacted locations in Eastern China, EH-TBB was the dominant compound (Labunska 15
et al., 2015). Interestingly, the levels of EH-TBB and BEH-TEBP in avian livers exceeded those 16
in corresponding muscle samples in the same study (Labunska et al., 2015). However, in 17
Sweden, EFRs were only detected in fish samples in a market basket study, with DBE-DBCH 18
the predominant compound in these fish samples (Sahlström et al., 2015).19

33
Table 1.4 Summary of concentrations of EFRs in biota (ng/g lw) (range of values in parentheses) 1
Samples BTBPE DBDPE EH-TBB BEH-TEBP DBE-DBCH HBB PBEB Location References
Meat
Beef 0.56 nd nd
UK (Fernandes et al., 2010) Pork 0.55 nd nd
Lamb 0.05 nd nd
Turkey 1.76 nd nd
Chicken nd nd 2.66 1.78 nd nd
Shanghai and Nanjing City, China a
(Labunska et al., 2015) Duck 1.87 nd 2.74 nd nd 1.16
Pork 2.69 nd 2.14 1.37 nd nd
Chicken 1.46 nd 24.7 8.97 0.41 nd
E-waste area, South China a (Labunska et al., 2015) Duck 4.57 nd 24.2 7.23 0.56 0.87
Pork 5.4 nd 38.2 12.4 0.41 nd
Meat c 100 0.8 0.1 Shandong Province, North China a (Li et al., 2015)
Fish and shellfish
Salmon 0.26 nd nd
UK (Fernandes et al., 2010)
Mackerel 0.3 nd nd
Herring 0.25 nd nd
Haddock 0.83 nd nd
Lemon Sole 3.33 nd nd
Whitebait 0.77 nd nd
Fish 2.1 nd 4 1.9 nd nd Shanghai and Nanjing City, China
a (Labunska et al., 2015)
Shrimp nd 9.19 11.7 9.32 0.97 nd
Fish 1.46 nd 24.7 8.97 0.41 nd E-waste area, South China a (Labunska et al., 2015)
Shrimp 5.4 nd 38.2 12.4 0.41 nd
Fish nd-3.72 nd-3.30
Lake Winnipeg a (Law et al., 2006a) Mussel 1.29 (0.83-2.28) nd
Zooplankton 0.37 (nd-0.69) nd

34
Fish c 1.1-3.6b Nd nd 114 23 8.7 Sweden (Sahlström et al., 2015)
Juvenile common sole 0.08-0.31 0.28-1.13 0.5-1.4 Nursery zones situated along the
French coast a (Munschy et al., 2011)
Fish nd-0.15 nd E-waste area, South China (Shi et al., 2009)
Fish nd-230 Dongjiang River,
South China (He et al., 2012)
Fish and seafood 121 3.2 nd Shandong Province, North China a (Li et al., 2015)
Eggs
Free range organic eggs 0.29 nd nd UK (Fernandes et al., 2010)
Chicken eggs 37.2-264 5.97-37.9 7.32-25.7 0.63-0.77 E-waste area,
South China (Zheng et al., 2012)
Chicken eggs nd nd 1.73 nd nd nd Shanghai and Nanjing City, China
a (Labunska et al.. 2015)
Chicken eggs 2.93 nd 4.80 1.16 nd nd E-waste area, South China a (Labunska et al.. 2015)
Duck eggs nd nd 1.21 nd nd nd Shanghai and Nanjing City, China
a (Labunska et al.. 2015)
Duck eggs 2.11 nd 4.03 1.11 nd nd E-waste area, South China a (Labunska et al.. 2015)
Offal
Pork liver 0.81 nd nd UK (Fernandes et al., 2010)
Chicken liver 0.75 nd nd
Chicken liver 3.38 nd 5 2.61 nd 2.66 Shanghai and Nanjing City, China a
(Labunska et al.. 2015) Duck liver 3.27 nd 8.2 1.69 nd nd
Chicken liver 15 nd 35 10.6 nd 2.3 E-waste area, South China a (Labunska et al.. 2015)
Duck liver 11.7 nd 38.4 13.7 nd 3.37
Juvenile common sole liver 0.17-4.1 nd-1.33 0.1-5.3 Nursery zones situated along the
French coast a (Munschy et al., 2011)
Beluga blubber 1.1-9.3 Canadian Arctic (Tomy et al., 2008b)

35
Fish liver nd-0.041 nd
E-waste area, South China (Shi et al., 2009) Bird liver 0.27-2.41 13.7-54.6
Bird kidney 0.12-0.89 24.5-124
Bird muscle 0.07-0.39 9.6-16.3
Birds and birds' eggs
Peregrine eggs 3.3-13 nd-8.2 nd-4.5 Canada (Great Lakes Basin, New
Brunswick) and Central Spain (Guerra et al, 2012)
terrestrial birds eggs nd-1.7 6.1-609 Pearl River Delta, South China (Sun et al.,2014)
terrestrial birds nd-130 Pearl River Delta, South China (Sun et al.,2012)
Herring gull eggs c 60-1820 1300-288000 40-3440 Colonies in the five Laurentian
Great Lakes (Gauthier et al., 2009)
a) average concentrations; b) mLOD – mLOQ; c) the units are pg/g ww.1

36
Very few studies have been conducted to investigate EFRs in human matrices. In Sahlström et
al.’s study (2015) of two Swedish pooled human milk samples, only BTBPE, -DBE-DBCH and
-DBE-DBCH were found with mean concentrations at 1.0-3.4, 4.0 and 0.50-1.7 pg/g ww,
respectively. EFRs were also detected in 20 matched serum samples from Swedish first-time
mothers and their toddlers. Specifically, -DBE-DBCH and -DBE-DBCH were found in serum
from one toddler (1.8 and 1.3 ng/g lw, respectively), α-DBE-DBCH in one maternal serum
sample (0.7 ng/g lw), with syn-DDC-CO and anti-DDC-CO present in serum from one toddler
(85 and 63 ng/g lw, respectively) and one mother (49 and 39 ng/g lw, respectively) (Sahlström et
al., 2014). In Canada, Zhou et al. (2014) examined several EFRs including EH-TBB, BEH-
TEBP, BTBPE, and DBDPE in paired human maternal serum (n = 102) and breast milk (n = 105)
samples collected in 2008-2009 in the Sherbrooke region. EH-TBB had detection frequencies
greater than 55% in both serum and milk samples and the median concentrations in serum and
milk were 1.6 and 0.41 ng/g lw, while BEH-TEBP, BTBPE, and DBDPE were less frequently
detected in both human matrices (the detection frequencies in serum and milk were 16.7% and
32.4% for BEH-TEBP, 3.9% and 0.0% for BTBPE and 5.9% and 8.6% for DBDPE) (Zhou et al.,
2014). Human hair samples from urban, e-waste, and rural areas in south China were collected
and analysed for EFRs, with the levels of BTBPE, HBB and PBBz found to be in the order:
occupationally exposed workers > residents in e-waste recycling area > residents in urban and
rural areas (Zheng et al., 2011). For DBDPE, similar concentrations were observed in residents
from urban (median of 17.7 ng/g) and e-waste-impacted (median of 17.8 ng/g) areas, as well as
workers involved in e-waste handling (median of 24.2 ng/g). The lowest DBDPE levels in
human hair were found in residents from a rural area (Zheng et al., 2011).

37
1.6 Relative importance of different exposure pathways for EFRs
Because of the resemblance between the chemical structures and physicochemical properties of
some EFRs and “legacy” PBDEs such as BDE 209 and DBDPE, it can be hypothesised that the
human exposure pathways to these compounds and their relative significance will be broadly
similar. Owing to the current paucity of data relating to human exposure to EFRs, this section
cross-refers to exposure to legacy BFRs where necessary.
Human exposure to BFRs can be divided into non-occupational and occupational exposure. It
has been reported that the main pathways of non-occupational human exposure to BFRs are
likely to be a combination of diet, ingestion of indoor dust and inhalation of indoor air (Abdallah
et al., 2008; Roosens et al., 2009a, 2009b). The relative significance of these different exposure
pathways for BFRs will vary between individuals, chemicals, and countries etc. For toddlers (1–
5 yr), children (6–11 yr), teenagers (12–19 yr), and adults (≥20 yr), exposure to PBDEs via dust
ingestion is considered the main pathway of human exposure in the US, followed by dietary
exposure; nevertheless, diet (in the form of human milk) is the major source of PBDE exposure
for breast-fed infants (<1 yr) (Johnson-Restrepo and Kannan, 2009). International variations in
exposure patterns are illustrated by the fact that in Germany (Fromme et al., 2009), and Belgium
(Roosens et al., 2009b) the intake of ΣPBDEs in adults is influenced mainly by diet; whereas in
the US (Johnson-Restrepo and Kannan, 2009; Lorber, 2008) and Canada (Jones-Otazo et al.,
2005) ingestion of house dust is the major pathway of human exposure to ΣPBDEs in adults;
moreover, in the UK, both diet and dust make substantial contributions to human exposure to
PBDEs (Harrad et al., 2006). For UK individuals, dust ingestion makes an important - sometimes
an overwhelming - contribution to exposure to BDE 209 as a result of the high levels of BDE
209 in UK dust that are substantially higher than in Canada and the US (Harrad et al., 2008b). In

38
contrast, persistent and bioaccumulative BFRs, such as BDE 47, make their way to human
populations mainly via food intake; while human exposure to non-persistent BFRs, such as
TBBP-A, and other phenolic BFRs, occurs primarily via inhalation (Sjödin et al., 2003).
However, Abdallah et al. (2008) reported that dietary intake and dust ingestion both constitute
important pathways of exposure to TBBP-A and inhalation appears a minor exposure pathway to
TBBP-A. For occupationally-exposed workers, ingestion and inhalation of dust particles and
vapour are thought to constitute major exposure pathways (Covaci et al., 2011).
1.6.1 Dietary exposure
Table 1.5 summarises the dietary intake of BFRs and its relative contribution to overall exposure
in different countries. Of note, is the fact that in some countries, dietary intake is deemed an
important exposure pathway to PBDEs, TBBP-A and HBCDDs for adults (Abdallah et al., 2008;
Fromme et al., 2009; Harrad et al., 2004; Jones-Otazo et al., 2005; Roosens et al., 2009b;
Sahlström et al., 2015).
Harrad et al. (2006) reported the median value of dietary exposure to PBDEs (sum of BDE 28,
47, 49, 66, 85, 99, 100, 153 and 154) to be 90.5 ng/person/d in UK, contributing 96.8% of
overall exposure, which is in line with estimates for Germany (Fromme et al., 2009), Spain
(Domingo et al., 2008), the US (Johnson-Restrepo and Kannan, 2009) and Canada (Jones-Otazo
et al., 2005), but rather higher than that reported for Belgium (Roosens et al., 2009b). In
Germany, dietary intakes of PBDEs (sum of BDE 47, 99, 100, 153, 154, 183) were 107.9
ng/person/d (1.42 ng/kg bw/d, assuming a body weight of 76 kg) and 58.1 ng/person/d (0.88
ng/kg bw/d, assuming a body weight of 66 kg) for male and female population, separately,
responsible for 97% (average intake) of the total intake for an adult population (Fromme et al.,

39
2009). The dietary intake of PBDEs for Spanish male adults was reported to be 75.4 ng/person/d
(1.1 ng/kg bw/d, assuming a body weight of 70 kg) (Domingo et al. 2008). Dietary intakes for
adults of tri-hepta BDEs (sum of BDE 28, 47, 99, 100, 153, 154, and 183) in Belgium were 5.9-
22.0 ng/person/d (median 10.3), accounting for 96% of total exposure (Roosens et al. 2009b).
The median daily dietary intakes of PBDEs for mothers and toddlers in Sweden were 20.88 and
9.96 ng/person/d, respectively, contributing 65.6% and 34.9% of overall exposure, respectively
(Sahlström et al., 2015). The dietary intake of PBDEs by US and Canadian adults has been
reported to be 1.1 ng/kg bw/d and 49.7 ng/person/d, respectively (Johnson-Restrepo and Kannan
2009; Jones-Otazo et al, 2005). Even though this intake in the US is consistent with the intakes
found in other countries and the dietary intake in Canada is half of that in the UK; dietary intake
was not the major source of PBDEs exposure for the American population and the contribution
of dietary exposure in Canada is only one third of that in the UK (Johnson-Restrepo and Kannan
2009; Jones-Otazo et al, 2005; Harrad et al. 2004, 2006). This is because of the significantly
higher PBDE levels found in US and Canadian indoor dust compared to elsewhere (Lorber,
2008; Jones-Otazo et al, 2005). PBDEs enter infants primarily via human milk intake; Johnson-
Restrepo and Kannan (2009) reported the average estimated daily intake of PBDEs was highest
for breastfed infants (86.4 ng kg/bw/d), and originated primarily (91%) from the consumption of
breast milk. Jones-Otazo et al. (2005) also found the main exposure pathway for infants was via
human milk (1800 ng/person/d), accounting for 91.7% of exposure. Average dietary intakes of
HBCDDs and TBBP-A for UK adults were 413.0 and 2.8 ng/person/d, contributing 5.2% and
59.6% of the overall human exposure, respectively (Abdallah et al. 2008).
The median daily dietary intakes of EFRs for mothers and toddlers determined in one Swedish
market basket study were 6.83 and 3.86 ng/person/d, respectively, which are lower than for

40
Table 1.5 Summary of dietary intakes of BFRs in different countries and their
contributions to overall human exposure to some BFRs
Country, Population
group and BFR Method
Dietary intake
(ng/person/d) Contribution to overall exposure (%) References
UK
PBDEs, adults a Duplicate
diet study
90.5 96.8 (Harrad et al.
2006) PBDEs, toddlers a 51.6 80.8
HBCDD, adults Single food
product
samples
413.0 75.2
(UK Food
Standards
Agency, 2006)
TBBP-A, adults 2.8 59.6 (de Winter-
Sorkina,2003)
Germany
PBDEs, female b Duplicate
diet study
107.9 97.0 (Fromme et al.,
2009) PBDEs, male b 58.1 97.0
Belgium
PBDEs, adults c
Duplicate
diet study 10.3 96.0
(Roosens et al.,
2009b)
Spanish
PBDEs, adults d
Market
basket study 75.4 -
(Domingo et al.,
2008).
US
PBDEs, adults e
Market
basket study
71.5 56.0
(Johnson-
Restrepo and
Kannan, 2009)
PBDEs, teenagers e 67.6 38.0
PBDEs, children e 55.7 36.9
PBDEs, toddlers e 44.2 20.8
PBDEs, infants e 432.0 91.0
PBDEs, adults - 91 16.9 (Lorber, 2008)
Canada
PBDEs, average
adults f
Market
basket study
Meat,
dairy,eggs 24.7 15.9
32.1
(Jones-Otazo et al.
2005)
Fish and
shellfish 5.6 3.6
Plant
products 15.8 10.2
Fats, nuts,
oils 2.9 1.9
Sugars and
sweets 0.7 0.5
PBDEs, elevated
indoor sources f
Meat,
dairy,eggs 24.7 1.1
1.7 Fish and
shellfish 5.6 0.3

41
Plant
products 15.8 0.2
Fats, nuts,
oils 2.9 0.1
Sugars and
sweets 0.7 ~0
PBDEs, fish eater f
Meat,
dairy,eggs 24.7 10.9
53.4
Fish and
shellfish 76.9 33.9
Plant
products 15.8 7.0
Fats, nuts,
oils 2.9 1.3
Sugars and
sweets 0.7 0.3
PBDEs,
occupational f
Meat,
dairy,eggs 24.7 8.8
17.6
Fish and
shellfish 5.6 2.0
Plant
products 15.8 5.6
Fats, nuts,
oils 2.9 1.0
Sugars and
sweets 0.7 0.2
PBDEs, infants f 1800 91.7
Sweden
HBCDDs, Mothers
Market
basket study
11.0 76.4 h
(Sahlström et al.,
2015)
HBCDDs, Toddlers
5.0 42.0 h
PBDEs, Mothers g 20.88 65.6
h
PBDEs, Toddlers g
9.96 30.9 h
EFRs, Mothers g 6.83 47.7
h
EFRs, Toddlers g
3.26 17.7 h
a) ΣPBDE: sum of PBDE 28, 47, 49, 66, 85, 99, 100, 153 and 154; b) ΣPBDE: sum of PBDE 47, 99, 100, 153, 154,
and 183; c) ΣPBDE: sum of PBDE 28, 47, 99, 100, 153, 154, and 183; d) ΣPBDE: sum of PBDE 47, 99, 100, 153,
154, and 183; e) ΣPBDE: sum of PBDE 17, 28, 47, 66, 77, 85, 99, 100, 138, 153, 154, 183, and 209; f) Fatty foods:
sum of PBDE15, 17, 28, 47, 66, 71, 75, 77, 85, 99, 100, 119, 126, 138, 153, 154, 183, and 190; non-fatty foods
(fruit, vegetables, and grain): arithmetic mean concentrations of BDE 47, 99, 100, 153, and 154 and BDE 15, 17, 28,
47, 66, 71, 75, 77, 85, 99, 100, 119, 126, 138, 153, 154, 183 and 190; whole milk: sum of PBDE 28, 47, 99, 100,
153, 154, and 183; g) Dietary intake calculated based on fish consumption only; PBDEs: sum of PBDE28, 47, 99,
100, 153, 196, 197, 203, 206, 207, 208 and 209; EFRs: sum of -DBE-DBCH and -DBE-DBCH, TBX, BATE,
PBBz, TBCT, PBT, PBEB, TBP-DBPE, DBDPE, BTBPE, EH-TBB and BEH-TEBP; h) overall exposure only
includes dust ingestion and dietary intake.

42
PBDEs and HBCDDs (Sahlström et al., 2015). The DBDPE intake for infants consuming
formula, cereal, and puree was quantified in one study in 2013 (Liu et al., 2014). Between the
age of 1 and 12 months the daily median intake varied from 3.1 to 5.3 ng/day in the US and 2.2
to 3.4 ng/day in China. No other data on dietary exposure to EFRs have been reported so far.
1.6.2 Exposure via dust ingestion
Dust ingestion plays a key role in toddler (1–5 yr) exposure to PBDEs and has been hypothesised
to account for higher exposure of toddlers than adults as a result of markedly greater dust
ingestion by toddlers arising from frequent hand-to-mouth contact behaviour and crawling
(Lorber, 2008). For EFRs, as for PBDEs, toddlers were estimated to be more exposed than adults
(Ali et al., 2011a; Ali et al., 2012a, 2012b; Cequier et al., 2014; Qi et al., 2014; Sahlström et al.,
2015).
Table 1.6 summarises estimates of human exposure to BFRs via dust ingestion in different
countries and its relative contribution to overall human exposure.
Table 1.6 Summary of estimates of human exposure to selected BFRs via dust ingestion in
different countries and their contributions to overall human exposure
Population and
compounds High dust ingestion
a
(ng/person/d) Mean dust ingestion
b
(ng/person/d)
Contribution to overall
exposure (%) (mean
dust ingestion) References
UK
PBDEs, adults c 21.5 0.9 1.0
(Harrad et al., 2006) PBDEs, toddlers
c 43.1 11.8 18.6
Germany
PBDEs, adults d 7.7 2.0 2.7 (Fromme et al., 2009)
Belgium
PBDEs, adults e 0.31 0.76 4.0 (Roosens et al., 2009b)
US
PBDEs, adults f N/A 84.5 45.0
(Johnson-Restrepo and
Kannan, 2009)
PBDEs, teenagers f N/A 83.2 46.8
PBDEs, children f N/A 75.4 49.9
PBDEs, toddlers f N/A 152 71.7
PBDEs, infants f N/A 33.5 7.7

43
PBDEs, adults 357.3 N/A 66.1g (Lorber, 2008)
Canada
PBDEs, average adults h N/A 95.8 61.7
(Jones-Otazo et al.,
2005)
PBDEs, elevated indoor
sources h
N/A 1983 90.5
PBDEs, fish eater h N/A 95.8 42.3
PBDEs, occupational h N/A 215.7 76.5
PBDEs, infants h N/A 162.6 8.3
Belgium, adults
BTBPE 0.7 0.28 NA
(Ali et al., 2011a)
DBDPE 14 5.6 NA TBB (EH-TBB) 0.7 0.28 NA
TBPH (BEH-TEBH) 1.4 0.56 NA TBBPA-DBPE (TBBPA-
BDBPE) 5.6 2.24 NA
ΣEFRs 22.4 8.96 NA
Belgium, toddlersn
BTBPE 0.65 0.16 NA
(Ali et al., 2011a)
DBDPE 24.7 6.18 NA EH-TBB 1.04 0.26 NA
BEH-TEBP 5.2 1.3 NA TBBPA-BDBPE 14.56 3.64 NA
ΣEFRs 46.15 11.51 NA
New Zealand, adults
BTBPE <0.7 <0.7 NA
(Ali et al. 2012a)
DBDPE <0.7 0.7 NA EH-TBB <0.7 <0.7 NA
BEH-TEBP <0.7 0.7 NA ΣEFRs NA 0.14 NA
New Zealand, toddlers
BTBPE <0.7 0.7 NA
(Ali et al. 2012a)
DBDPE 0.48 1.92 NA TBB (EH-TBB) 0.12 0.48 NA
TBPH (BEH-TEBH) 0.60 1.28 NA ΣEFRs 1.2 4.38 NA
Pakistan, adults
ΣEFRs k 0.7 1.4 NA (Ali et al., 2012b)
Pakistan, toddlers
ΣEFRs k 1.32 5.4 NA (Ali et al., 2012b)
Norway, Woman (ng/kg bw/day)
ΣEFRs l,o
0.45 (Cequier et al., 2014)
Norway, Children (ng/kg bw/day)
ΣEFRs l,o
1.71 (Cequier et al., 2014)
Sweden, Adults p
ΣEFRs m
7.48
(Sahlström et al., 2015) PBDEs 10.9
HBCDDs 3.4
Sweden, Toddlers p
ΣEFRs m
15.16
(Sahlström et al., 2015) PBDEs 22.3
HBCDDs 6.9
China, infants j
(Qi et al., 2014) ΣEFRs
i 12.5

44
DBDPE i 4.9
China, Toddlers j
ΣEFRs i 115.2
DBDPE i 44.8
China, Children j
ΣNBFRs i 28.71
DBDPE i 11.02
China, Teenagers j
ΣEFRs i 31.72
DBDPE i 12.48
China, Adults j
ΣEFRs i 31.85
DBDPE i 12.35
a) Mean dust ingestion rate for adults = 20 mg/d; for toddlers = 50 mg/d; b) High dust ingestion rate for adults =
50 mg/d; for toddlers = 200 mg/d; c) ΣPBDE: sum of PBDE 28, 47, 49, 66, 85, 99, 100, 153 and 154; b)
ΣPBDE: sum of PBDE 47, 99, 100, 153, 154, and 183; d) Average intake scenario based on median
concentrations and high intake scenario based on 90th percentiles as not otherwise stated; ΣPBDE: Sum of BDE
47, 99, 100, 153, 154, and 183; e) Total exposure calculated based on dust ingestion and food intake; ΣPBDE:
Sum of BDE 28, 47, 99, 100, 153, 154, and 183; f) ΣPBDE: sum of PBDE 17, 28, 47, 66, 77, 85, 99, 100, 138,
153, 154, 183, and 209. g) Calculated from high dust ingestion; h) ΣPBDE: sum of PBDE 17, 28, 47, 66, 71, 85,
99, 100, 153 in the residential scenarios, and 154 and BDE 17, 28, 47, 66, 77, 85, 99, 100, 126, 153, 154, and
183 in the occupational scenarios; i) ΣEFRs: sum of PBBz, PBT, PBEB, DPTE, HBB, EH-TBB, BTBPE, BEH-
TEBP, and DBDPE; j) Dust ingestion rates were 0.02, 0.1, 0.05, 0.05, 0.05 g/day for infants, toddlers, children,
teenagers and adults, respectively; k) ΣEFRs: sum of EH-TBB, BTBPE, BEH-TEBP, and DBDPE; l) ΣEFRs:
sum of DBE-DBCH, TBP-AE, PBB, PBT, TBP-DBPE,PBEB, HBB, EH-TBB, BTBPE, BEH-TEBP, and
DBDPE, syn-DDC-CO, anti-DDC-CO; m) Calculated based on dust ingestion rate of 30 mg/day and 60 mg/day
for adults and toddlers, respectively; ΣEFRs: sum of DBE-DBCH, TBCT, PBBz, BATE, TBX, PBT, TBP-
DBPE, PBEB, HBB, EH-TBB, BTBPE, BEH-TEBP, and DBDPE; n) the samples of home and office dust they
used were from Belgium, but the samples of classroom dust were from the UK; o) Calculated based on dust
ingestion rate of 50 mg/day and 100 mg/day for adults and toddlers, respectively; p) Calculated based on dust
ingestion rate of 30 mg/day and 60 mg/day for adults and toddlers, respectively.
1.6.3 Exposure via dermal absorption of BFRs in dust
There are few results reporting human exposure to BFRs, especially for EFRs via dermal
absorption from dust. One study suggests that only a small fraction (3%) of the dust is absorbed
through the skin (Lorber, 2008). But taking into account the high concentration detected in dust,
exposure via dermal absorption from dust may be an important pathway of human exposure – in
addition to dermal uptake via direct contact with materials containing BFRs. Abdallah et al.
(2015a) investigated human dermal absorption of eight mono- to deca-brominated diphenyl
ethers (PBDEs) using EPISKIN human skin equivalent tissue and found the proportion of the
applied PBDE dose that accumulated in the skin increased with increasing bromine substitution

45
from BDE 1 (∼18%) to BDE 153 (∼37%), this proportion dropped steeply from BDE 183
Table 1.7 Summary of exposure via dermal absorption of BFRs in different countries and
its contribution to overall human exposure
Population and
compounds Dermal absorption
(ng/person/d) Contribution to overall exposure (%)
(mean dust ingestion e)
References
USA
PBDEs, adults
(≥20 yr) a
22.1 11.8
(Johnson-Restrepo and
Kannan, 2009)
PBDEs, teenagers
(12–19 yr) a
17.7 9.9
PBDEs, children
(6–11 yr) a
13.3 8.8
PBDEs, toddlers
(1–5 yr) a
11.2 5.3
PBDEs, infants
(<1 yr) a
3.85 0.9
PBDEs, adults b 85.9 16 (Lorber, 2008)
China
PBDEs, infants
(3-12months) c
0.35 N/A
(Chen et al., 2009)
PBDEs, toddlers
(1-3 yr) c
0.46 N/A
PBDEs, children
(3-5 yr) c
0.74 N/A
PBDEs, children
(5-9 yr) c
0.81 N/A
PBDEs, teenagers
(9-14 yr) c
1.35 N/A
Norway, children(ng/kg bw/day)
ΣEFRs d
0.25 (Cequier et al., 2014)
PBDEs 0.14
Norway, women (ng/kg bw/day)
ΣEFRs d 0.109
(Cequier et al., 2014) PBDEs 0.091
a) ΣPBDE: sum of PBDE 17, 28, 47, 66, 77, 85, 99, 100, 138, 153, 154, 183, and 209; b) ΣPBDE: sum of PBDE 28,
47, 99, 100, 138, 153, 154, 183, and 209; c) ΣPBDE: sum of PBDE 28, 47, 66, 99, 100, 138, 153, 154, 183, 196,
197, 203, 206, 207, 208 and 209. d) EFRs: sum of PBBz, PBT, PBEB, DPTE, HBB, EH-TBB, BTBPE, BEH-TEBP,
and DBDPE; e) In this scenario, the human exposure via dust was calculated by mean dust ingestion rates which are
20 mg/d for adults and 50 mg/d for toddlers, respectively.
(∼13%) to BDE 209 (8%). Additionally, the percutaneous penetration of HBCDD and TBBP-A
through two commercially available 3D-human skin equivalents (3D-HSE) models was studied
by Abdallah et al. (2015b), and the absorbed dose was found to be low (less than 7%) and was

46
significantly correlated with log KOW of the tested BFR. Table 1.7 summarises estimates of
dermal absorption exposures to BFRs from different countries and its relevant contribution to
overall human exposure. For the USA, Johnson-Restrepo and Kannan (2009) calculated the daily
exposure doses for PBDEs from dermal absorption for infants (<1 yr), toddlers (1–5 yr), children
(6–11 yr), teenagers (12–19 yr), and adults (≥20 yr) to be 0.77, 0.7, 0.46, 0.34 and 0.34 ng/kg
bw/d, respectively. These estimates are lower than those from diet or dust ingestion but
comparable to those from air inhalation. The estimated dermal absorption dose of PBDEs for
adults in Johnson-Restrepo and Kannan’s (2009) study was approximately 4-fold lower than the
estimate of Lorber (2008); this was mainly due to the differences in dust PBDE concentrations
(1910 ng/g dw in study versus 8154 ng/g dw in Lorber, 2008) (Johnson-Restrepo and Kannan
2009; Lorber 2008). In China, Chen et al. (2009) estimated that daily exposures to PBDEs for
children from 3 months to 14 years via dermal contact with toys varied from 30.5 to 43.3 pg/kg
bw/d. This is approximately one order of magnitude lower than the exposure from dermal
absorption of dust or air inhalation and three orders of magnitude lower than the exposure from
human milk (78.6 ng/kg bw/d) for infants in the USA (Johnson-Restrepo and Kannan 2009).
However, it should be noted that the BFR concentrations in toys are much lower than in flame-
retarded materials. Qi et al. (2014) estimated dermal exposure to EFRs via this pathway to be
0.25 and 0.109 ng/kg bw/d for women and children in China, respectively, a figure comparable
to that obtained for PBDEs .
1.6.4 Exposure via inhalation
The presence of BFRs in indoor air is a non-negligible exposure pathway for humans. Harrad et
al. (2004, 2006) estimated that the median human intake of ∑PBDE via inhalation was 2.1
ng/person (contributing 2.3% of overall exposure) using the median concentrations of ∑PBDE

47
detected in air from outdoor, workplace, and domestic environments and found a significant
positive correlation (p < 0.001) between PBDE concentrations and both the number of electrical
appliances and polyurethane foam-containing chairs (Harrad et al. 2004). HBCDDs and TBBP-A
were also found in indoor air from UK homes (n = 33; median concentrations ΣHBCDDs =180
pg/m3; TBBP-A = 15 pg/m
3), offices (n = 25; 170; 11), public microenvironments (n = 4; 900;
27) and outdoor air (n= 5; 37; 1) (Abdallah et al. 2008). Table 1.7 summarises exposure via air
inhalation of BFRs in different countries and its relative contribution to overall human exposure.
Compared to dietary intake and dust ingestion, inhalation is a minor exposure pathway for
PBDEs, HBCDDs and TBBP-A in the UK, the USA, Germany, and Canada (Harrad et al. 2006;
Abdallah et al. 2008; Fromme et al. 2009; Johnson-Restrepo and Kannan 2009; Abdallah et al.
2008). Similar to “legacy” FRs, Cequier et al. (2014) reported human exposure to EFRs via air
inhalation which is 1-2 orders of magnitude lower than the human exposure to EFRs via dust
ingestion (Cequier et al., 2014), while for the more volatile compounds (e.g., DBE-DBCH), the
main source of exposure was air (∼80%) (Cequier et al., 2014).
1.6.5 Occupational exposure
High levels of some EFRs were found in air and dust samples near EFR manufacturing sites or e-
waste processing areas and the workers may be subject to high occupational exposures through
air inhalation, dust ingestion and dermal absorption. In one study, the concentrations of BTBPE
and DBDPE were 14.6-232 ng/g dw (mean: 107 ng/g dw) and <2.50-139 ng/g dw (mean: 107
ng/g dw) respectively in dust collected from an e-waste area in China; while TBBPA-BDBPE
was not detectable (Shi et al. 2009). High BTBPE levels of 70 and 19 pg/m3 were found in two
outdoor air samples collected near a BTBPE producing facility in the US (150 km east and 480
km southeast of the facility) (Hoh et al. 2005). BTBPE was also found in indoor air at electronics

48
Table 1.8 Summary of exposure to BFRs via inhalation in different countries and its
contribution to overall human exposure
Population and compounds Air
inhalation
(ng/person/d)
Contribution to overall
exposure (%) References
UK
PBDEs, adults a 2.1 2.3
Harrad et al. (2006) PBDEs, toddlers
(0.5-2 yr) a
0.7 0.6
HBCDDs, adults 5.0 0.9
Abdallah et al. (2008)
HBCDDs, toddlers
(0.5-2 yr) 1.0 0.2
TBBP-A, adults 0.3 6.4
TBBP-A, toddlers
(0.5-2 yr) 0.1 2.0
Germany
PBDEs, adults b 0.17 0.24 Fromme et al. (2009)
USA
PBDEs, adults
(≥20 yr) c
9.1 4.8
Johnson-Restrepo and Kannan
(2009)
PBDEs, teenagers
(12–19 yr) c
9.36 5.3
PBDEs, children
(6–11 yr) c
6.67 4.4
PBDEs, toddlers
(1–5 yr) c
4.64 2.2
PBDEs, infants
(<1 yr) c
3.0 0.7
Canada
PBDEs, average adults d
9.7 6.2
PBDEs, elevated indoor
sources d
158.7 7.2
PBDEs, fish eater d 9.7 4.3
PBDEs, occupational d 16.3 5.8
PBDEs, infants d 0.8 ~0
Norway, children(pg/kg bw/day)
ΣEFRs e
27 (Cequier et al., 2014)
PBDEs 55
Norway, women (pg/kg bw/day)
ΣEFRs e 12
(Cequier et al., 2014) PBDEs 19
a) ΣPBDE: sum of PBDE 28, 47, 49, 66, 85, 99, 100, 153 and 154; b) ΣPBDE: Sum of BDE 47, 99, 100,
153, 154, and 183; c) ΣPBDE: sum of PBDE 17, 28, 47, 66, 77, 85, 99, 100, 138, 153, 154, 183, and 209;
d) ΣPBDE: sum of PBDE 17, 28, 47, 66, 71, 85, 99, 100, 153 in the residential scenarios, and 154 and
BDE 17, 28, 47, 66, 77, 85, 99, 100, 126, 153, 154, and 183 in the occupational scenarios; e) ΣEFRs: sum
of PBBz, PBT, PBEB, DPTE, HBB, EH-TBB, BTBPE, BEH-TEBP, and DBDPE.
recycling plants, with the mean BTBPE levels being 20,000 and 23 000-32 000 pg/m3 in the air
of dismantling hall and shredder, separately. Such high concentrations of EFRs in air and dust

49
samples illustrate the potential for high occupational exposure to these chemicals for workers in
such facilities (Sjödin et al., 2001). By comparison, indoor air in an office containing computers
only, contained BTBPE at 5.8 pg/m3, ca. 4000 times lower than in recycling plants. The much
higher levels observed in such recycling plants are hypothesised to occur because bromine
containing additives to plastic materials are emitted to the indoor work environment from
particulate matter generated via the dismantling and shredding of BFR-containing plastics
(Sjödin et al., 2001).
1.7 Objectives of this study
EFRs are of environmental and human health concern due to their potential toxicity, both in
humans and animals. Current understanding of the potential environmental impacts of EFRs
reveals several research gaps with respect to our knowledge of their environmental presence,
human exposure and body burdens. The overriding hypothesis of the work reported in this thesis
is that human exposure to EFRs is substantial, and is increasing following restrictions on the use
of “legacy” FRs. To test this hypothesis and address some of the research gaps, the aims of the
current study are to:
1- Develop and validate analytical methodology for determination of EFRs in a range of matrices
relevant to human exposure.
2- Determine concentrations of EFRs in foodstuffs from a location impacted by rudimentary e-
waste processing in Bui Dau, Vietnam and estimate human exposure to EFRs via dietary intake
in this area.
3- Characterise concentrations of EFRs and “legacy” FRs in indoor air and dust in the UK.
4- Elucidate the time trends in concentrations of EFRs and “legacy” FRs in indoor air and dust

50
samples which may reflect changes in production and use of such compounds.
5- Estimate human exposure to EFRs and “legacy” FRs via air inhalation, dust ingestion and
dietary intake in the UK, assess the relative importance of each exposure route to the overall
exposure of adults and toddlers using different exposure scenarios.
6- Determine concentrations of EFRs and “legacy” FRs in human milk from a small number of
UK mothers and study the relationship between external and internal exposure to the studied FRs
using a simple, one-compartment pharmacokinetic model.

51
CHAPTER 2 Sampling and Analytical
Methodology

52
2.1 Synopsis
In order to test the hypotheses outlined at the end of the previous chapter, different types of
samples were collected, including indoor air, indoor dust, diet, soil and human milk. A
description of sampling methods and locations employed for each of these sample matrices is
given in Table 2.1. Analytical methodology for determination of emerging and legacy FRs
consisting of extraction, cleaning up and instrumental analysis has been developed and optimised
in diverse biotic and abiotic samples. The reliability of the developed and applied analytical
methods has been tested in different matrices, along with quality assurance (QA)/quality control
(QC) employed to validate the data in this thesis.
Table 2.1 Overview of sampling methods and locations for different sample types
Sample Types Collection Method Location
Indoor dust Nylon sock Birmingham, UK
Air Passive PUF disk Birmingham, UK
Market basket diet a Market basket
method from different
markets
Birmingham, UK
Human milk
Obtained
from adult healthy
volunteers via
Birmingham
Women's Hospital
Milk Bank (Abdallah
and Harrad, 2014)
Birmingham, UK
Human milk
Supplied by Imperial
College, London.
Obtained
from two hospitals in
Southampton and
London, respectively
Southampton and
London, UK

53
Soil samples
Surface soil collected
at the same time from
the backyards where
the poultry were
raised
Bui Dau (Cam Xa,
Hung Yen
province), Vietnam
Diet samples
Poultry and fish
purchased from local
residents and market
Bui Dau (Cam Xa,
Hung Yen
province), Vietnam
a) market basket diet: this method is to collect a number of the most commonly bought food
based on the actual average consumption of different categories of food (Frederiksen et al.,
2009).
2.2 Chemicals and reagents
Solvents used were all of HPLC analytical grade and purchased from Fisher Scientific
(Loughborough, UK). Standards of BDE 28, 47, 99, 100, 153, 154, 183 and 209, α-, β- DBE-
DBCH, TBX, PBBz, PBT, TBP-DBPE, PBEB, HBB, BTBPE, DBDPE, EH-TBB, BEH-TEBP,
and labelled internal standards (IS) 13
C-BDE 209, 13
C-BTBPE, 13
C-BEH-TEBP and 13
C-HBCDD
were purchased from Wellington Laboratories (Guelph, ON, Canada). DDC-CO was purchased
from Cambridge Isotope Laboratories Inc. (Tewksbury, MA, USA). TBCT was obtained from
Accustandard (New Haven, CT, USA). TBBPA-BDBPE was purchased from Dr. Ehrenstorfer
(Essex, UK). HBCDDs were obtained from Sigma-Aldrich Company Ltd. (Dorset, UK). BDE 77
and 128 (IS) were obtained from AccuStandard Inc. (New Haven, CT, USA). Indoor dust SRM
2585 was purchased from the US National Institute of Standards and Technology (NIST,
Gaithersburg, MD, USA).

54
2.3 Sampling
2.3.1 Air sampling
2.3.1.1 Air sampling method
Air samples were collected in offices (n=20) and houses (n=15) using passive air sampling
techniques in Birmingham, UK from February to May 2015. Each passive sampler was deployed
for around 45 days around a height of the human breathing zone. The passive air sampler
configuration used followed the method reported by Abdallah and Harrad (2010) and comprised
polyurethane foam disks (140 mm diameter, 12 mm thickness, 360.6 cm2 surface area, 0.07 g
cm-3
density, PACS, Leicester, UK) and a glass fibre filter (GFF, 12.5 cm diameter, 1 μm pore
size, Whatman, UK) fully sheltered by two different size stainless steel housings (Figure 2.1).
PUF disks were pre-cleaned with DCM, acetone, and hexane in turn using ASE extraction and
GFFs were preconditioned by heating at 450°C for 5 h. “Field blanks” comprising PUF disks and
GFFs analysed as air samples were examined to check that the levels of target compounds in the
Figure 2.1 Diagram of passive air sampler configuration
disks and GFFs were acceptably low. Shelters were cleaned carefully and wrapped with hexane
55
rinsed aluminium foil and sealed in a polyethylene zip bag before and after deployment.
Harvested disks were stored at -20°C until analysis.
2.3.1.2 Passive air sampling rates
The sampling rate for BDE 28 (1.74 m3/day) was derived from the study of Hazrati and Harrad
(2007). Sampling rates (m3/day) for HBCDDs and PBDEs except for BDE 28 in this study were
derived from the values of sampling rates for PUF using the same passive air sampler
configuration (Abdallah and Harrad, 2010). We analysed PUF disks and GFFs together, while in
Abdallah’s study (2010) the sampling rates were calculated separately for gas and particle
phases. Therefore, in this study we calculated the sampling rates for the combination of gas and
particle phases using the equation below:
S = 𝑆𝐺𝑎𝑠 ∗ 𝑃𝐺𝑎𝑠 + 𝑆𝑃𝑎𝑟𝑡𝑖𝑐𝑙𝑒 ∗ 𝑃𝑃𝑎𝑟𝑡𝑖𝑐𝑙𝑒…………….(2.1)
where SGas : sampling rates for gas phase from Abdallah’s study (2010); SParticle : sampling rates
for particle phase from Abdallah’s study (2010); PGas : the percentage of target compounds in
gas phase of gas and particle phases from Abdallah’s study (2010); PParticle : the percentage of
target compounds in particle phase of gas and particle phases from Abdallah’s study (2010).
Sampling rates (m3/day) for HBCDDs and PBDEs except for BDE 28 in this study derived from
equation 2.1 are shown in Table 2.2.
To our knowledge, no EFR-specific PAS sampling rates exist – i.e. sampling rates derived via a
bespoke calibration exercise. As a result of this, in this study, sampling rates for EFRs were
derived via two different methods. The first method assumed a uniform sampling rate for all
EFRs targeted in this study that was the average value obtained for PBDEs in two previous

56
Table 2.2 Passive sampling rates (m3/day) of PBDEs and HBCDDs in indoor air
a
Sampling
rates
(gas)
Sampling
rates
(particle)
Gas
(pg/day)
Particle
(pg/day)
Gas
(%)
Particle
(%)
Sampling
rates
(m3/day)
(this study)
BDE 47 1.509 0.448 63.8 2.3 97% 3% 1.472
BDE 99 1.075 0.491 27.2 4.5 86% 14% 0.992
BDE 100 1.136 0.494 4.7 1.1 81% 19% 1.014
BDE 153 0.844 0.542 2.8 3.1 47% 53% 0.685
BDE 154 0.807 0.537 0.4 0.3 57% 43% 0.691
α-HBCDD 0.852 0.561 23 4.1 85% 15% 0.807
β-HBCDD 0.848 0.567 6 2.1 74% 26% 0.775
γ-HBCDD 0.837 0.579 49.4 20.5 71% 29% 0.761
a) The sampling rates values of PBDEs and HBCDDs cited in this table and used for calculation of sampling rates in
this study were from Abdallah and Harrad's study (2010).
Table 2.3 Passive sampling rates (m3/day) of the individual studied EFRs in indoor air
PBDEs
sampling rate of PBDEs in
the literaturea
sampling rate of PBDEs in
the literatureb
overall average
sampling rate
BDE 28 - -
BDE 47 1.472 -
BDE 100 0.992 -
BDE 99 1.014 -
BDE 154 0.685 -
BDE 153 0.691 -
BDE 183 0.550 -
BDE 209 0.567 -
Average
sampling rate 0.853 2.5 1.677
a) Abdallah, M.A.-E. & Harrad, S., 2010. Modification and calibration of a passive air sampler for monitoring vapor and particulate phase brominated flame retardants in indoor air: application to car interiors. Environmental science & technology, 44(8), pp.3059–65; b) Wilford, B.H.,
Harner, T., Zhu, J., Shoeib, M., Jones, K.C., 2004. Passive Sampling Survey of Polybrominated Diphenyl Ether Flame Retardants in Indoor and
Outdoor Air in Ottawa, Canada: Implications for Sources and Exposure. Environ. Sci. Technol. 38, 5312–5318.

57
studies (Table 2.3). The second approach is outlined in Table 2.4, whereby the sampling rates for
individual EFRs were assumed equivalent to literature reported sampling rates for PBDEs of
similar KOA and KOW values. To illustrate, the sampling rate for BTBPE (log KOA = 15.67) was
assumed equivalent to that for BDE 183 (log KOA = 14.55 and 11.96). These approaches are
broadly consistent with that used by Drage et al. (2016) to derive PAS sampling rates for EFRs
for an outdoor air sampling campaign. In that earlier study, for most EFRs (those expected to be
mostly in the vapour phase) the authors assumed the same rate as BDE 47 and 99 (3.92 m3/day),
while for DBDPE they applied the same rate as BDE 209 (2.26 m3/day). The 5
th percentile, 95
th
percentile, mean, median, minimum, maximum and geometric mean values of human exposure
to EFRs via inhalation using the two different sampling rates in Table 2.3 and 2.4 were compared
by independent t-test. No big differences were found between the data using these two different
sampling rates for both toddlers and adults (p > 0.05). This suggests the effect from of the
sampling rates for EFRs was minor, therefore in this study we used the sampling rates calculated
from the first approach (1.677 m3/day) for all EFRs.

58
Table 2.4 Passive sampling rates (m3/day) of the individual studied EFRs in indoor air
EFRs number
of Br Log KOA Log KOW PBDEs
number
of Br log KOA Log KOW
sampling rate of PBDEs
in the literaturej
(m3/day)
sampling
rate
(m3/day)
(this
study) PUF filter
PUF
and
filter
DBE-DBCH
(TBECH)
4
8.01h 4.82
c, 5.24
h, 4.41
a, 5.24
b
BDE 28 3 9.40b , 9.5
g 5.94
d, 6.47
a, 5.88
b 1.74
k
TBX 8.81b 6.2
c,6.06
a, 6.65
b
TBCT(TBoCT) 8.82b 6.74,6.29
c
TBP-DBPE(DPTE)
5
8.01b 5.25
b
PBBz 9.10b 6.44
b
PBT 9.66i
5.87f,5.43
f,6.25
c,
6.42a,6.99
b
PBEB 5 9.97b 6.76
c, 6.78
a,7.48
b
BDE 47 4 10.69b , 10.53
g 6.81
d, 7.16
a, 6.77
b 1.509 0.448 1.472 1.472
HBB 6 10.26i 5.85
f,6.07
i,
EH-TBB
(TBB) 4 12.34
b 7.73
c, 8.28
a,8.75
b
BDE 153 6 11.82g 7.90
d, 8.73
a 0.844 0.542 0.691 0.691
BDE 154 6 13.27b , 11.92
g 7.82
d, 8.75
a, 8.55
b 0.807 0.537 0.685 0.685
BTBPE 6 15.67b 7.88
f, 8.31
c, 9.39
a, 9.15
b BDE 183 7 14.55
b , 11.96
g 8.27
d, 9.55
a, 9.44
b 0.558 0.546 0.550 0.550
DBDPE
10
19.22b 11.1
c,12.27
a, 13.64
b
BDE 209 10 18.42b , 14.98
e 12.04
a, 12.11
b 0.567 0.567 0.567
BEH-TEBP
(TBPH) 16.86
b 9.34
c, 10.92
a, 11.95
b
TBBPA-BDBPE 20.30b 12.99
c,11.52, 12.22
DDC-CO(DP) -- 13.1b 10.12
c, 11.27
h

59
a)Sparc On-Line Calculator 4.6
b)HENRYWIN v3.20 (EPIWIN 4.) c)Bergman, Å., Rydén, A., Law, R.J., de Boer, J., Covaci, A., Alaee, M., Birnbaum, L., Petreas, M., Rose, M., Sakai, S., Van den Eede, N., van der Veen, I., 2012. A novel abbreviation standard for organobromine, organochlorine
and organophosphorus flame retardants and some characteristics of the chemicals. Environ. Int. 49, 57–82.
d)Braekevelt, E., Tittlemier, S. a., Tomy, G.T., 2003. Direct measurement of octanol-water partition coefficients of some environmentally relevant brominated diphenyl ether congeners. Chemosphere 51, 563–567. e)Cetin, B., Odabasi, M., 2008. Atmospheric concentrations and phase partitioning of polybrominated diphenyl ethers (PBDEs) in Izmir, Turkey. Chemosphere 71, 1067–1078.
f)Covaci, A., Harrad, S., Abdallah, M.A.E., Ali, N., Law, R.J., Herzke, D., de Wit, C.A., 2011. Novel brominated flame retardants: A review of their analysis, environmental fate and behaviour. Environ. Int. 37, 532–556.
g)Harner, T., Shoeib, M., 2002. Measurements of octanol-air partition coefficients (KOA) for polybrominated diphenyl ethers (PBDEs): Predicting partitioning in the environment. J. Chem. Eng. Data 47, 228–232. h)Howard, P.H., Muir, D.C.G., 2010. Identifying new persistent and bioaccumulative organics among chemicals in commerce. Environ. Sci. Technol. 44, 2277–85.
i)Stenzel, A., Goss, K.-U., Endo, S., 2013. Determination of polyparameter linear free energy relationship (pp-LFER) substance descriptors for established and alternative flame retardants. Environ. Sci. Technol. 47, 1399–406.
j)Abdallah, M.A.-E. & Harrad, S., 2010. Modification and calibration of a passive air sampler for monitoring vapor and particulate phase brominated flame retardants in indoor air: application to car interiors. Environ. Sci. Technol. 44(8), pp.3059–65.
k)Hazrati, S., Harrad, S., 2007. Calibration of polyurethane foam (PUF) disk passive air samplers for quantitative measurement of polychlorinated biphenyls (PCBs) and polybrominated diphenyl ethers (PBDEs): Factors
influencing sampling rates. Chemosphere 67, 448–455.

60
2.3.2 Dust sampling
Dust samples were collected in offices (n=42) and houses (n=30) using a Black and Decker
780 W mini vacuum cleaner and nylon sample socks (25 µm pore size) from June 2013 to
May 2015. Both living room and bedroom dust samples were collected in 15 houses. Samples
were collected under normal office and house use conditions to reflect actual human
exposure. In each location, one m2 of carpet was vacuumed for 2 min and 4 m
2 of bare floors
were vacuumed for 4 min to take the dust samples. After sampling, samples were sealed in a
plastic bag and stored at -20 °C. All dust samples were sieved through a pre-cleaned 500 μm
mesh sieve, homogenised thoroughly, transferred to clean glass vials and then stored at -
20 °C prior to analysis.
2.3.3 Diet sampling
In this study we only focus on meat-related food samples because FRs such as PBDEs are
lipophilic and persistent organic compounds which accumulate in lipid-rich tissues
(Frederiksen et al., 2009).
2.3.3.1 Market basket diet sampling in Birmingham, UK
Food samples were purchased from two supermarkets representing national chains and one
local indoor market in Birmingham, UK from May to June 2015. The collected foods were
composited into 14 of the food groups (90 samples total) that make up our preliminary
market basket study (Table 2.5). Equal weights of each of the 3 samples of each food group
from each market were homogenized and combined into 30 composite samples. All food
samples were homogenised, freeze dried and stored at -20 °C prior to analysis. The water
content of each sample was determined gravimetrically to permit calculation of
concentrations on a wet weight (ww) basis. Concentrations of FRs (ng/g ww) in each sample

61
were multiplied by the consumption rates for various food groups to calculate an estimate of
dietary intake.
Table 2.5 Food groups included in the market basket study
Food types Food groups Food name
Number of
samples
analysed
Meat Group 1 beef 3
Group 2 chicken 3
Group 3 pork 3
Group 4 lamb 3
Fish Group 5 salmon 3
Group 6 tuna 2
Group 7 trout 2
Group 8 mackerel 2
Egg and dairy product Group 9 cheese 2
Group 10 chicken egg 1
Offal Group 11 chicken liver 1
Group 12 pork liver 1
Group 13 beef liver 2
Group 14 lamb liver 2
2.3.3.2 Diet sampling in Vietnam
Samples of selected human foodstuffs were collected in northern Vietnam from an e-waste
processing area in Bui Dau (Cam Xa, Hung Yen province). This area is a rural location with
approximately 200 households. The main supplies of livestock products and fish for the local
people in Bui Dau are from neighbouring communities (Tue et al., 2010), and the livestock
and fish raised in farm yards in Bui Dau are intended mainly for consumption by the families

62
themselves with any small surpluses sold commercially. E-waste treatment activities such as:
dismantling of electrical wires and metals, shredding of plastics into pellets, manual recycling
of TVs, printers, printed circuit boards and other computer components started in this village
at the beginning of the current decade. Most businesses are family-based and e-waste is
recycled in the backyard of the house where livestock are also raised. Locations of the
sampling sites are presented in Figure 2.2. Questionnaires were given to the inhabitants of the
sites sampled to collect information about the location, types of the facilities, sampling site
description, dietary habits and sales of the food. Fresh hens’ eggs (n=18) were collected from
chicken farm owners in six sampling sites (site 1- site 6) shown in Figure 2.2, with five
chickens purchased from five farm owners in five locations (site 1- site 5) to obtain samples
of chicken muscle (n=5), chicken liver (n=5), and chicken skin (n=5) in January 2014. One
control egg sample and one control chicken muscle sample were purchased from Thanh Hoa
province, which is situated approximately 175 km distant from the e-waste recycling sites.
Furthermore, chicken egg, chicken muscle, chicken liver, and chicken skin were purchased as
control samples in Tsukuba, Japan. River fish samples (tilapia, n=5) and pond fish samples
(rohu, n=3 and tilapia, n=2) were collected from the river (site 7) and the fish pond (site 8)
located close to Bui Dau, with 2 pork samples purchased from the small market in Bui Dau
village. Control samples of pork and fish were purchased in Hanoi City.
Heat treatment of eggs was conducted in a large pan by boiling gently for 8 minutes at 100
˚C. This was conducted to facilitate easy transportation of samples for analysis. Eggs were
removed from the heat and cooled down to room temperature before egg yolks were
separated from the egg white and wrapped in pre-cleaned aluminium foil. All samples were
stored at -20 ˚C until shipping to the analytical laboratory on ice.

63
Figure 2.2 Sampling sites in an e-waste processing region, Bui Dau, Cam Xa, Hung Yen
province, Vietnam
2.3.4 Soil sampling in Vietnam
Five soil samples were collected from the same backyards from which the chicken samples
were collected (site 1- site 5 - Figure 2.2). Three subsamples of soil were collected from each
location, homogenised, and stored at -20 ºC until shipping on ice to the analytical laboratory.
2.3.5 Human milk sampling
Archived human milk samples (n=25, each comprising ~50 mL) were obtained from the milk
bank of Birmingham Women’s Hospital in 2010 after the research proposal and experimental
design were approved by a local research ethics committee (REC reference number:
9/H1211/57) according to the NHS guidelines (Abdallah and Harrad, 2014). Detailed
sampling collection procedures are provided elsewhere (Abdallah and Harrad, 2014), but in
summary, milk samples were transferred on ice from the milk bank in 100 mL clean
polypropylene containers and freeze-dried prior to storage at -20 ºC until analysis.
Another batch of human milk samples were collected from two hospitals in Southampton and
London, respectively, between August 2014 and May 2015 by researchers at Imperial College

64
London. After collection, samples were kept in clean screw-capped plastic containers and
transferred from Imperial College London to Birmingham in special ice boxes then stored at -
20 °C until the time of analysis.
2.3.6 Lipid determination
The lipid content in diet and human milk samples was determined gravimetrically on separate
aliquots of the freeze-dried samples (typically 1g) following a standard procedure (The
European Standard EN 1528-2, 1996).
2.4 Extraction
2.4.1 Comparison of extraction methods: ASE vs. Vor-Usoni
A mixture of n-hexane (Hex)/acetone (Ac) (3:1, v/v) was proven to be a reliable solvent for
both EFRs and PBDEs in a previous study (Van den Eede et al., 2012) and was thus
employed as the extraction solvent in this study. Two extraction methods (accelerated solvent
extraction (ASE) and vortex and ultrasonication extraction (Vor-Usoni)) were assessed by
performing spiking experiments on sorbent material (Na2SO4) using three concentration
levels, Qlow (50 ng of each, 75 ng DBDPE), Qmedium (100 ng of each, 150 ng DBDPE) and
Qhigh (200 ng of each, 300 ng DBDPE). Each of these spiked samples were extracted in
triplicate on three separate days (n=9).
2.4.1.1 ASE
An aliquot of each sample of spiked sorbent material (~100 mg) was accurately weighed. The
extraction cells were filled from bottom to top with: pre-cleaned hydromatrix, spiked sample,
and hydromatrix. Spiked samples were further treated with internal standards (ISs - 13
C-BDE
209, 13
C-BTBPE, 13
C-BEH-TEBP, BDE 77, BDE 128). Extraction was performed using an
ASE 350 (temperature 100 °C, pressure 1500 psi, heating time 5 min, static time 4 min, purge

65
time 90 s, flush volume 60%, 3 static cycles, solvent Hex-Ac (3:1, v/v)).
2.4.1.2 Vor-Usoni
An aliquot of each spiked sample (~100 mg) was accurately weighed into glass tubes and
spiked with the same IS described in the previous section. Hex-Ac (2 mL, 3:1, v/v) was
added and the tube vortexed for 2 mins, prior to ultrasonication for 5 mins. The supernatant
was removed, fresh solvent introduced and the extraction process repeated three times. After
extraction, spiked sample extracts were combined, centrifuged, transferred into clean glass
tubes and then evaporated to dryness and redissolved in 1 mL hexane.
2.4.1.3 Extraction efficiency comparison results: ASE vs. Vor-Usoni
Figure 2.3 compares the recoveries obtained for the two different extraction methods. It is
evident that recoveries were generally higher for ASE extraction than Vor-Usoni. The
recoveries of all target analytes for ASE extraction exceeded 90% except for DBDPE for
which the recovery was ~70%. Moreover, no significant differences in recoveries were
observed for the three spike levels. Relatively low variability was seen for the low-level
spiked samples for both ASE and Vor-Usoni (RSD < 15%). Recoveries for ASE were less
consistent for PBT, HBB, HCDBCO, BEH-TEBP (15% < RSD <17%) in the medium-level
spiking experiments with 2 compounds (TBP-DBPE and DBDPE) displaying moderate
variability (15% < RSD <18%) for the high-level spiked samples. By comparison, Vor-Usoni
displayed moderate variability (15% < RSD < 22%) in high-level spike experiments, for all
target compounds except EH-TBB and DBE-DBCH.
Overall, this comparison of the two different methods indicates that the ASE method is more
robust for extracting EFRs, and this method was thus chosen as our extraction method for air,
dust, diet, and human milk samples.

66
Figure 2.3 Spiking experiment results on sorbent material. Each level was composed of three replicate measurements on three different
days (vertical lines represent standard deviations)

67
2.4.2 Air and dust sample extraction
Aliquots of dust samples (typically between 50 and 200 mg) were accurately weighed,
and then extracted using ASE 350; air samples (combined PUF disks and GFF) were
also extracted by ASE. The extraction conditions were the same as for the spiked
samples described in 2.4.1.
2.4.3 Diet and human milk sample extraction
Aliquots of human milk or diet samples (~500 mg) were accurately weighed and
extracted using ASE 350. Extraction cells were filled from the bottom to top with:
pre-cleaned hydromatrix, 2 g florisil, 3 g alumina, samples, and then topped with
hydromatrix. The other extraction conditions were the same as for the spiked samples
as described in 2.4.1.
2.4.4 Extraction of diet and soil samples collected in Vietnam
Aliquots of samples (5 g) were extracted in National Institute for Environmental
Studies (NIES), Japan using a rapid solvent extractor (SE100, Mitsubishi Chemical
Analytech) at 35 ˚C for 40 min with 50% acetone in n-hexane at a flow rate of 2
mL/min, followed by secondary extraction at 80 °C for 40 min with toluene at a flow
rate of 2 mL/min. The extracts were evaporated to incipient dryness and then diluted
in 10 mL toluene.

68
2.5 Clean up
The effectiveness of three clean-up methods involving different combinations of
chromatographic fractionation and acid cleaning, was evaluated. The three methods
assessed were as follows.
Method 1 Following evaporation to 1 mL, sample extracts were fractionated on a
column packed with 2 g florisil. Before the sample extract was applied, the column
was washed and conditioned sequentially with 6 mL dichloromethane (DCM) and 6
mL hexane (Hex). The extracts were quantitatively transferred and fractionation
achieved by eluting with 20 mL of Hex (Fraction 1-F1) and 35 mL of DCM (Fraction
2 -F2). F1 was evaporated to 1 mL and the solvent applied to 44% acidified silica
cartridges (2 g acidified silica, prewashed with 6 mL Hex-DCM (1:1, v/v)) for a
second clean-up. The extracts were eluted with 20 mL of Hex-DCM (1:1, v/v). The
eluate was then combined with fraction 2 prior to evaporation to dryness under a
gentle nitrogen flow and reconstitution in 200 μL of iso-octane containing PCB-129
(250 pg/uL) as a recovery determination standard. After analysis via gas
chromatography coupled with electron capture negative ionization mass spectrometry
(GC-NCI-MS), samples were evaporated carefully to dryness and resolubilized in 200
uL of methanol containing d18-γ-HBCDD (25 pg/µL) as recovery determination
standard for LC determination of HBCDDs.
Method 2 Following concentration of crude extracts to 1 mL, they were subjected to
fractionation on a column packed with 2 g florisil washed and conditioned prior to use

69
sequentially with 6 mL DCM and 6 mL Hex. Crude extracts were quantitatively
transferred and fractionation achieved by eluting sequentially with 20 mL of Hex and
then 15 mL Hex-DCM (1:1, v/v) (Fraction 1-F1) and 35 mL of DCM (Fraction 2 -F2).
F1 was evaporated to 1 mL prior to application of the concentrate to 44% or 22%
acidified silica cartridges (2 g acidified silica, prewashed with 6 mL Hex-DCM (1:1,
v/v)) for further clean-up. Extracts were eluted through these acidified silica columns
with 20 mL of Hex-DCM (1:1, v/v). The eluate was then combined with F2 and
afterwards evaporated to near dryness under a gentle nitrogen flow and reconstituted
in 200 μL of iso-octane containing PCB129 (250 pg/uL) as a recovery determination
standard. After analysis via GC-NCI-MS, the samples were evaporated to dryness and
resolubilized in 200 uL of methanol containing d18-γ-HBCDD (25 pg/µL) as recovery
determination standard for LC determination of HBCDDs.
Method 3 Crude extracts were evaporated to 0.5 mL using a Zymark Turbovap® II
(Hopkinton, MA, USA) and then transferred to 10 mL glass tubes, followed by clean
up with 3-6 mL concentrated sulfuric acid with vortexing (speed 4, 20 s) or gentle
shaking 20 times. After vortexing/shaking, glass tubes were centrifuged at 2000 g for
5 mins, the supernatants collected and rinsed with 3 x 2 mL hexane. The pooled
supernatants were transferred into clean glass tubes, the glass tubes were evaporated
until dryness under a gentle stream of N2, then reconstituted in 200 μL of iso-octane
containing 250 pg/uL PCB129 used as a recovery determination standard. After
analysis via GC-NCI-MS, the samples were evaporated until dryness and
resolubilized in 200 uL of methanol containing d18-γ-HBCDD (25 pg/µL) as recovery

70
determination standard for LC determination of HBCDDs.
To evaluate the performance of these three methods, one procedural blank and spiked
matrix (Na2SO4) with three concentration levels: Qlow (50 ng of each, 75 ng DBDPE),
Qmedium (100 ng of each, 150 ng DBDPE) and Qhigh (200 ng of each, 300 ng DBDPE),
were used to assess recoveries for each method. Each of these spiked samples were
extracted in triplicate on three separate days (n=9). The recoveries for our target
compounds obtained using different clean-up methods are shown in Table 2.6. Using
method 1 and method 3 as clean-up procedures, relatively high and reproducible
recoveries were achieved for all target compounds. By comparison, recoveries of EH-
TBB were low (15 % and 40 %, respectively) in method 2 when using either 44% or
22% acidified silica for clean up. This contrasts with a previous report that
satisfactory recoveries were obtained for EH-TBB when using an acid silica column
(Ali et al. 2011b). This difference probably arises because of differences in the
Table 2.6 Relative recoveries (SD) of FRs on different clean-up methods
Method 1
(%)
Method 2
(%)
Method 3
(%)
F1 F2 F1 F2 Vortexing Shaking
α-DBE-DBCH 60(2) 58(4) 75(1) 78(1)
β-DBE-DBCH 61(3) 59(2) 80(3) 81(1)
TBX 78(5) 75(6) 83(5) 82(3)
PBBz 83(4) 82(4) 85(8) 85(2)
TBCT 85(2) 90(5) 85(9) 90(6)
BDE 28 81(3) 81(6) 88(2) 91(2)

71
PBT 82(7) 87(7) 96(2) 93(9)
PBEB 95(9) 96(8) 98(4) 95(2)
TBP-DBPE 92(8) 92(9) 103(2) 99(2)
HBB 93(4) 87(10) 104(9) 105(10)
BDE 47 96(3) 98(2) 98(6) 99(8)
BDE 77 92(6) 99(11) 90(2) 95(3)
BDE 100 93(8) 92(2) 91(1) 96(4)
BDE 99 93(10) 93(5) 92(8) 97(5)
EH-TBB 98(8) 15(2)a/40(2)b 98(9) 94(3)
BDE 154 104(11) 103(3) 105(8) 101(11)
BDE 153 107(12) 101(4) 108(7) 110(10)
BDE 128 100(11) 105(2) 103(6) 103(9)
BDE 183 101(13) 104(10) 100(10) 105(10)
BTBPE 103(14) 105(11) 101(10) 108(7)
13C-BTBPE 102(15) 103(9) 108(2) 107(8)
13C-BEH-TEBP 97(3) 98(2) 99(6) 95(9)
BEH-TEBP 97(3) 98(3) 99(7) 96(10)
syn-DDC-CO 101(2) 105(9) 105(8) 101(11)
anti-DDC-CO 87(2) 90(3) 88(2) 98(6)
TBBPA-BDBPE 60(4) 57(2) 65(2) 63(1)
BDE 209 99(5) 79(7) 98(7) 99(8)
13C-BDE 209 98(6) 88(6) 95(9) 90(3)
DBDPE 88(4) 90(8 91(3) 93(2)
HBCDD 89(3) 90(9) 92(2) 94(4)
a) clean-up procedure using 44% acidified silica cartridges; b) clean-up procedure using 22%
acidified silica cartridges.

72
precise procedures followed. In this study, 2 g acid silica was used (rather than 1 g in
Ali et al. (2011b)) and silica was activated before adding acid. Such differences are
important as EH-TBB and the structually-related BEH-TEBP may be destroyed as a
consequence of long contact times with acid on acidified silica column. Interestingly,
the recoveries of BEH-TEBP were high and reproducible when using method 3
incorporating a direct acid wash by gentle vortexing or shaking. This contrasts with
previous studies that have shown BEH-TEBP to degrade on acidified silica (Ali et al.,
2011b; Sahlström et al., 2012; Stapleton et al., 2008; Van den Eede et al., 2012). Our
findings point to a crucial role of silica as a support to the acid in effecting
degradation and are consistent with a recent report of <10% recovery of BEH-TEBP
when acidified silica was used, but 114% recovery when washed with concentrated
acid alone (Guo et al., 2014). The authors of this study suggested that the poor
recoveries when using acidified silica may be attributed to longer contact times with
acid and surface dependent reactions when using this reagent as opposed to neat acid.
Overall, based on the data shown in Table 2.6, methods 1 and 3 both appear reliable
clean up methods. However, method 3 used less solvent and was less time-consuming
and was therefore selected as the clean-up method to be used in this study.
2.5.1 Air and dust sample clean up procedures
The crude extracts were evaporated to 0.5 mL using a Zymark Turbovap® II
(Hopkinton, MA, USA) and then transferred to 10 mL glass tubes, followed by clean
up by vortexing (20s) with 3-4 mL concentrated sulfuric acid. After vortexing, the

73
glass tubes were centrifuged at 2000 g for 5 mins and the supernatants were collected
and rinsed with 3 x 2 mL hexane. The pooled supernatants were transferred into clean
glass tubes, the glass tubes were evaporated to incipient dryness under a gentle stream
of N2, before reconstitution in 200 µL (dust) and 50 μL (air) iso-octane containing 250
pg/uL PCB129 as recovery determination standard.
2.5.2 Diet and human milk samples clean up procedures
Crude extracts of diet and human milk samples were evaporated to 0.5 mL using a
Zymark Turbovap® II (Hopkinton, MA, USA) and then transferred to 10 mL glass
tubes, followed by clean up by shaking with 5-6 mL concentrated sulfuric acid (20
times). After shaking, the glass tubes were centrifuged at 2000 g for 3 mins, before the
supernatants were collected and rinsed with 3 x 2 mL hexane. The pooled
supernatants were transferred into clean glass tubes, evaporated to near dryness under
a gentle stream of N2, and reconstituted in 100 μL of iso-octane containing 250 pg/uL
PCB129 as recovery determination standard.
2.6 Instrumental Analysis
2.6.1 GC-NCI-MS analysis for determination of PBDEs and EFRs
For analysis of EFRs and PBDEs, samples were injected into Thermo Trace 1310 GC
coupled to a Thermo mass spectrometer (ISQ™ LT Single Quadrupole) operated in
ECNI mode with a programmable-temperature vaporizer (PTV) injector. 2 μL of
cleaned extract were injected on a TG-SQC column (15 m×0.25 mm×0.25 μm) using

74
solvent vent injection. Injection was performed under a pressure of 0.19 bar for 1 min
and purge flow to split vent of 50 mL/min. The GC temperature program was 50 °C,
hold 0.50 min, ramp 20 °C/min to 240 °C, hold 5 min, ramp 5 °C /min to 270 °C,
ramp 20 °C/min to 305 °C, hold 17 min. Helium was used as a carrier gas with a
starting flow rate of 1.5 mL/min, hold 22 min, ramp 1 mL/min to 2.5 mL/min, hold 13
min. The electron multiplier voltage was 1460 V. Methane was used as moderating
gas.
2.6.1.1 Evaluation of the PTV vs the Split/Splitless injector
The split/splitless injector is one of the most common injection techniques for PBDE
analysis. However, low transfer efficiency of analytes with high boiling points to the
column and thermal degradation and discrimination of higher molecular weight
PBDEs are encountered using the split/splitless injector (Kierkegaard et al., 2009;
Stapleton, 2006). In the PTV injector, the transfer of compounds with high boiling
points is enhanced via gradual heating of the injector during sample injection. By
introducing the sample in the liquid state into a low temperature liner and
subsequently raising the temperature of the liner to the normal temperature of a
conventional hot injector, the risk of thermal degradation and discrimination is
minimised (Kierkegaard et al., 2009). Therefore, in this study, peak areas of the two
techniques were compared using the same concentration standards for PBDEs and
EFRs (1 ng/uL of each). The PTV injection temperature was set at 92 °C, hold 0.04
min, ramp 11.7 °C /sec to 295 °C, hold 20 mins. The splitless mode temperature was

75
set at 280 °C. Table 2.7 shows that the peak areas obtained when using the PTV were
1.2 to 2.8 times larger than those obtained using conventional split/splitless injection
for most PBDEs and EFRs, with the peak area for DBDPE obtained using PTV being
6.3 times higher than that achieved in splitless mode (SL). This enhanced
performance increased substantially with increasing number of bromines.
2.6.1.2 Influence of GC-MS transfer line temperatures
In NCI mode, we examined the impact of GC-MS transfer line temperatures on peak
area for our target compounds. We evaluated two sets of temperatures: NCI-1 = 230
and 280 °C, and NCI-2 = 300 and 320 °C. As shown in Table 2.7, while NCI-2
conditions gave slightly worse performance for lower molecular weight compounds,
they yielded proportionally better performance for higher molecular weight
compounds. Thus the NCI-2 temperatures were incorporated into our method.
2.6.1.3 Evaluation of the three different GC injection port liners
GC injection port liners play an important role in the volatilisation and transfer of
analytes onto the GC column and ultimately on detection limits. In this study, three
different liners were investigated: PTV siltek metal thick liner (2 mm x 2.75 mm x
120 mm), PTV siltek metal thin liner (1 mm x 2.75 mm x 120 mm), and a baffled
liner (2 mm x 2.75 mm x 120 mm). Table 2.7 shows that while the thin siltek liner
performed well for all compounds except DDC-CO and TBBPA-BDBPE, the baffled
liner showed excellent results for all target compounds especially for high boiling
analytes such as BDE 209 and DBDPE. Consequently, the baffled liner was used in

76
the GC method because of its superior performance.
2.6.2 LC-ESI-MS/MS analysis for determination of HBCDDs
With respect to the instrumental analysis of HBCDDs in this study, a method reported
previously (Harrad et al., 2009a) was used with minor modifications. Briefly, analysis
of three HBCDD diastereomers (, and -HBCDDs) was achieved using a dual
Table 2.7 Peak area ratios of PBDEs and EFRs injected on injection mode (PTV
and Splitless)
NCI-2a/NCI-1b PTV/SL
Thin liner/Thick
liner
Baffled
liner/Thin liner
-DBE-DBCH 0.88 1.0 2.2 1.7
-DBE-DBCH 0.89 1.0 2.3 1.7
TBX 0.87 1.1 1.0 1.4
PBBz 0.89 1.1 1.1 1.0
TBCT 0.90 1.1 1.0 1.2
BDE 28 0.92 1.2 1.0 1.2
PBT 0.82 1.3 1.0 1.2
PBEB 0.96 1.5 1.0 1.3
PCB129 0.42 1.9 1.0 1.0
TBP-DBPE 0.92 1.8 1.3 1.3
HBB 0.93 1.9 1.2 1.1
BDE 47 0.88 1.7 1.2 1.1
BDE 77 0.89 1.5 1.4 1.1
BDE 100 0.86 1.5 1.3 1.0
BDE 99 0.83 2.4 1.3 1.0

77
EH-TBB 0.76 2.1 1.5 1.1
BDE 154 0.83 2.2 1.3 1.1
BDE 153 0.86 2.2 1.3 1.1
BDE 128 0.89 1.5 1.7 1.4
BDE 183 0.91 1.9 1.3 1.2
BTBPE 1.3 2.7 2.1 1.4
13C-BTBPE 1.2 2.5 2.1 1.3
13C-BEH-TEBP 1.2 2.7 1.4 3.3
BEH-TEBP 1.2 2.8 1.5 5.2
syn-DDC-CO 1.3 2.6 0.8 1.0
anti-DDC-CO 1.3 2.6 0.9 1.1
TBBPA-BDBPE 1.4 2.8 0.2 0.6
BDE 209 1.2 2.6 15.3 2.6
13C-BDE 209 1.2 2.5 16.2 2.8
DBDPE 1.1 6.3 3.2 7.1
a) Transfer line: 300 ℃ Ion source: 320 ℃; b) Transfer line: 230 ℃ Ion source: 280 ℃.
pump Shimadzu LC-20AB Prominence high pressure liquid chromatograph
(Shimadzu, Kyoto, Japan) equipped with a Varian Pursuit XRS3 (Varian, Inc., Palo
Alto, CA, USA) C18 reversed phase analytical column (150 mm × 2 mm i.d., 3 μm
particle size). An SIL-20A autosampler and a DGU-20A3 vacuum degasser were
used. The following mobile phase program was used: (a) 1:1 methanol/water and (b)
methanol at a flow rate of 180 μL/min was applied; the mobile phase b starts at 50%
before increasing linearly to 100% over 4 min, held for 5 min followed by a linear
decrease to 88% over 1 min, and a rapid drop to 50%, held for 1 min. The post-elution
78
was conducted by increasing the mobile phase b gradually to 100% over 1 min, held 6
min, and then finished to 50% for 4 min. Using this method, α-, β-, and γ-HBCDDs
were separated at the retention times of 9.0, 10.6, and 11.2, respectively.
Mass spectrometric analysis was performed using a Sciex API 2000 triple quadrupole
mass spectrometer (Applied Biosystems, Foster City, CA, USA) operated in
electrospray negative ionisation mode (ESI-). MS/MS detection operated in the
multiple reaction monitoring (MRM) mode was applied for quantitative determination
of the target compounds based on m/z 640.6/79, m/z 652.4/79 and m/z 657.7/79 for the
native, 13
C-HBCDDs and d18-γ-HBCDD, respectively.
2.7 QA/QC and validation of methods
2.7.1 Analyte identification and quantification criteria
The specific retention time was confirmed for each studied compound by injecting
pure individual standards of each analyte (1 ng on column) on GC-NCI-MS in our
method. To evaluate the linearity of the MS response, full five-point calibrations were
conducted for most of target compounds over a concentration range from 25 to 500
pg/uL, for BDE 209 over a concentration range from 50 to 1000 pg/uL, and for
TBBPA-BDBPE over a concentration range spanning 1000 to 10000 pg/uL. Excellent
linearity (R2
> 0.99) was observed over the studied ranges for all of the studied
compounds. Known amounts of 13
C-labelled isomers were spiked into the samples
prior to extraction as internal standards (ISs) for BTBPE, BEH-TEBP, BDE 209 and

79
HBCDDs, respectively. This is because the detected ions for native and 13
C-labelled
isomers are different for these compounds and thus there are no interferences between
the fragmentation of native and 13
C-labelled isomers. In contrast, BDE 77 and BDE
128 were used for quantification of our other target compounds as the level of BDEs
77 and 128 in the environment are extremely low and will not affect their response
when used as internal standards.
ISs were also added to the five-point calibration plot solutions to calculate relative
response factors (RRFs) for each target compound. The RRF is defined as the
instrument response for a unit amount of target analyte relative to the instrument
response obtained for the same amount of the internal standard (IS) and is calculated
as in equation 2.2.
RRF =𝐴𝑁𝐴𝑇
𝐴𝐼𝑆×
𝐶𝐼𝑆
𝐶𝑁𝐴𝑇… … … … … (2.2)
Where ANAT is the peak area of the native compound (i.e. the 12
C of the target
compound); AIS is the peak area of the internal standard used for each analyte; CNAT is
the level of the native compound; and CIS is the concentration of the internal standard.
The relative standard deviation (RSD) of the RRFs calculated for studied compounds
from the calibration curves did not exceed 5%.
A calibration standard was injected before and after each sample batch (around 10
samples). The average RRF for each target compound from these two injections was
calculated. These must not exceed 25% of the average RRFs calculated for those

80
standards in the initial five-point calibration curves and used for calculating the level
of each target compound in different types of samples of this batch using equation 2.3.
Concentration =𝐴𝑁𝐴𝑇
𝐴𝐼𝑆×
1
𝑅𝑅𝐹×
𝑀𝐼𝑆
𝑆𝑆… … … … … (2.3)
Where AIS is the peak area of internal standard in each sample; ANAT is the peak area
of target compound in each sample; RRF is the relative response factor for the target
pollutant; MIS is mass of internal standard added to sample (pg or ng) and SS is the
sample size (m3 or g).
For a peak in the chromatogram for each sample to be quantified as a target pollutant
in a sample, the following criteria needed to be met:
1. The signal to noise ratio (S/N) must exceed 10:1.
2. The isotope ratios must not exceed ± 20% of the average value for the 2 calibration
standards injected before and after that sample batch.
3. The relative retention time (RRT) of the peak in the sample must not exceed ± 0.2%
of the average value calculated for the same compound in the 2 calibration standards
injected before and after that sample batch.
2.7.2 Recovery determination (syringe) standard (RDS)
The recoveries of IS in the sample preparation were calculated using the RDS added
to the samples before GC-MS analysis. In this study, d18-γ- HBCDD was used as RDS
for α-, β-, and γ- HBCDDs, while PCB129 was used as RDS for IS for PBDEs and

81
EFRs. The recoveries of the IS in each sample were calculated as in equation 2.4.
%IS Recovery = [(𝐴𝐼𝑆
𝐴𝑅𝐷𝑆)
𝑆× (
𝐴𝑅𝐷𝑆
𝐴𝐼𝑆)
𝑆𝑇𝐷× (
𝐶𝐼𝑆
𝐶𝑅𝐷𝑆)
𝑆𝑇𝐷× (
𝐶𝑅𝐷𝑆
𝐶𝐼𝑆)
𝑆]
× 100 … … … … … (2.4)
where (AIS/ARDS)S is the ratio of internal standard peak area to recovery determination
standard peak area in the sample; (ARDS/AIS)STD is the ratio of recovery determination
standard peak area to internal standard peak area in the calibration standard (the
average of values calculated using 2 calibration standards injected before and after
this batch of samples); (CIS/CRDS)STD is the ratio of concentration of internal standard
to concentration of recovery determination standard in the calibration standard; and
(CRDS/CIS)S is the ratio of concentration of recovery determination standard to
concentration of internal standard in the sample.
2.7.3 Analysis of Blanks and calculation of LODs and LOQs
Instrumental limits of detection (LOD) and method limits of quantification (LOQ)
were calculated for each target compound based on a 3:1 and 10:1 signal to noise ratio
column respectively which are shown in Table 2.8.
For air samples, none of the target compounds were detected in method blanks (n=4)
consisting of a pre-cleaned PUF disk and a GFF. One method blank was prepared
using the same analytical method for each batch of five samples. None of the target
compounds were detected in method blanks for air, dust, soil, human milk and diet
samples. While very low concentrations of HBCDDs and BDE 209 which didn’t

82
exceed 5 % of the lowest concentration in the samples were observed in field blanks.
Table 2.8 LODs and LOQs of PBDEs, HBCDDs and EFRs
Air Dust Diet and Human milk
LOD
pg/uL
LOQ
(pg/m3)
LOQ
(ng/g)
LOQ
(ng/g dry weight)
-DBE-DBCH 0.070 1.6 0.2 0.04
-DBE-DBCH 0.070 1.6 0.2 0.04
TBX 0.004 0.1 0.01 0.003
PBBz 0.004 0.1 0.01 0.003
TBCT 0.004 0.1 0.01 0.003
PBT 0.004 0.1 0.01 0.003
PBEB 0.004 0.1 0.01 0.003
TBP-DBPE 0.018 0.4 0.05 0.01
HBB 0.011 0.2 0.03 0.01
EH-TBB 0.004 0.1 0.01 0.003
BTBPE 0.046 1.0 0.13 0.03
BEH-TEBP 0.004 0.1 0.01 0.003
syn-DDC-CO 0.088 2.0 0.25 0.05
anti-DDC-CO 0.053 1.2 0.15 0.03
TBBPA-
BDBPE 0.44 10 1.25 0.25
DBDPE 0.44 10 1.25 0.25
BDE 28 0.011 0.2 0.03 0.01

83
BDE 47 0.014 0.3 0.04 0.01
BDE 100 0.004 0.1 0.01 0.003
BDE 99 0.004 0.1 0.01 0.003
BDE 154 0.021 0.5 0.06 0.01
BDE 153 0.018 0.4 0.05 0.01
BDE 183 0.046 1.0 0.13 0.03
BDE 209 0.12 2.8 0.35 0.07
α-HBCDD 0.056 1.3 0.16 0.03
β-HBCDD 0.049 1.1 0.14 0.03
γ-HBCDD 0.039 0.9 0.11 0.02
2.7.4 Accuracy and precision
As an initial evaluation of method accuracy and precision, 6 aliquots of SRM 2585
were analysed to validate the extraction and clean-up method developed for PBDEs,
HBCDDs and EFRs in combination with GC-NCI-MS and LC-MS/MS. The values
obtained are compared with certified/indicative/previously reported levels as
appropriate in Table 2.9. Levels of PBDEs using NCI mode measured with the
analytical method were comparable to the certified values.
With respect to EFRs, the concentrations of EH-TBB, BTBPE and BEH-TEBP
obtained in this study were similar to those reported previously (Ali et al. 2011a; Van
den Eede et al. 2012; Sahlström et al. 2012; and Cristale & Lacorte 2013). In contrast,
Sahlström et al. (2012) reported BEH-TEBP levels much higher than those found in

84
Table 2.9 Mean values and standard deviations (ng/g dust) of flame retardants
measured in SRM 2585 (standard deviations in parentheses)
SD: standard deviation; a) co-elution with BB-153, b) Keller, J. M.; Stapleton, H. M.;
This study
N=6
(NCI
source)
NIST
certified/
indicativ
e values
Ali
et al.
(201
1b)
N=2
(NC
I
sour
ce)
Sahlstrom
et al.
(2012)
N=5
(NCI
source)
Stapleto
n et al.
(2008)
N=3
(NCI
source)
Cristale
et al.
(2013)
N=4
(GC-EI-
MS/MS)
Van den
Eede et al.
(2012)
N=6
(NCI
source)
BDE 28 48.7(14) 46.9
BDE 47 458(114) 497
BDE 99 752(178) 892
BDE 100 103(50) 145
BDE 153 129(32) 119
BDE 154 108.4(55)a 83.5
BDE 183 52(14) 43
BDE 209 2329(175) 2510
EH-TBB 49(12) -- 40 36(2.4) <30 35(6) 26(2)
BTBPE 63(7) -- 32 39(4.9) <0.8 76(4) 39(14)
BEH-TEBP 863(175) -- 652 1300(94) 145(16.7) 857(73) 574(49)
α-HBCDD 21(2.0) 19(3.7)b -- 25(5.6) -- -- 19(9)
β-HBCDD 4.2(0.3) 4.3(1.1)b -- 5.7(0.2) -- -- 4.2(1.4)
γ-HBCDD 115(18) 121(22)b -- 80(13) -- -- 119(42)
∑HBCDD 140(21) -- -- 100(17) 137(7.8) -- 141(45)

85
Heltsley, R.; Peck, A.; Kucklick, J. R.; Schantz, M.; Wise, S. A. SRMs Available from NIST
for the Analysis of Brominated Flame Retardants; Poster presented at BFR07, Amsterdam,
24–27 April, 2007.
our study. However, our value is consistent with most other studies. Finally, PBEB
was detected in our study while it was not detected in any of the previous studies.
2.8 Statistical Analysis
Statistical analysis of the data in this study was conducted using both Excel
(Microsoft Office 2010) and IBM SPSS Statistics 21.0 (Chicago, IL, U.S.A.). SPSS
Statistics 21.0 was used to perform the statistical analyses for compounds with
detection frequencies ≥40%. In the instances where analyte peaks were below LOQ
and the detection frequencies (DF) are higher than 50%, the concentrations of target
compounds are reported as LOQ/2, and if the detection frequencies are lower than
50%, the concentration for each compound is reported as LOQ*DF – e.g. where the
detection frequency is 45%, the concentration of compounds below LOQ are assumed
to be LOQ x 0.45. Statistical analysis (ANOVA and independent t-test) was performed
on logtransformed concentrations on IBM SPSS Statistics 21.0 after concentrations in
all data sets were revealed to be log-normally distributed using both the Kolmogorov-
Smirnov test and visual inspection of the quantile-by-quantile graphic plot in SPSS
and a p value <0.05 was regarded as indicating statistical significance.

86
This chapter contains some sections (2.7.1, 2.7.2 and 2.7.3) of verbatim text adapted
from our lab’s protocol for analysis of semi-volatile persistent organic pollutants
(prepared by: Prof. Stuart Harrad, Persistent Organic Pollutants Research Group,
Public Health Building, School of Geography, Earth & Environmental Sciences,
University of Birmingham).

87
CHAPTER 3 EFRs and HBCDDs
in food Samples from an e-waste
processing area in Vietnam

88
3.1 Synopsis
More and more attention is being paid to environmental contamination arising from
emissions occurring during end-of-life treatment of treated goods. Particular concern
exists about situations where electrical and electronic waste (e-waste) is dismantled
under rudimentary conditions. Numerous studies have shown elevated contamination
of air, dust, soil, and sediments with PBDEs in such locations (Chen et al., 2009;
Labunska et al., 2013; Liu et al., 2008) with a smaller number of recent studies
reporting elevated human dietary exposure to local populations. In contrast, relatively
few data exist about environmental contamination with EFRs in areas where such
informal e-waste processing is conducted. In addition to PBDEs, HBCDDs have also
been frequently detected in the environment and human milk sampled in the vicinity
of rudimentary e-waste processing sites (Gao et al., 2011; Tue et al., 2013, 2010).
However, studies of human exposure via consumption of food sourced from locations
where rudimentary processing of e-waste is conducted are scarce.
The available data for PBDEs and HBCDDs suggest that fish, pigs, and free-range
chickens reared in e-waste impacted locations accumulate these compounds – likely
through uptake from their environment (e.g. soil and sediment) and food. Therefore,
concentrations of EFRs and HBCDDs were investigated in such foodstuffs collected
from a location impacted by rudimentary e-waste processing in Bui Dau, Vietnam.
These data are compared with concentrations detected in samples of the same
matrices sourced from non-e-waste impacted control locations in Vietnam and Japan,

89
and are combined with information on their consumption by local inhabitants to
estimate human exposure to these contaminants. Concentrations of EFRs and
HBCDDs are also measured in soil samples from the same e-waste impacted locations,
to investigate the impact of soil contamination on chicken tissues and eggs.
3.2 Detection of HFRs in food and soil samples
3.2.1 Concentrations in food
Table 3.1 shows concentrations of HFRs in food, co-located soil and co-located
sediment samples (Someya et al., 2015). Of our target EFRs: PBBz, HBB, BEH-
TEBP, BTBPE, DBDPE, syn-DDC-CO, anti-DDC-CO were detectable in chicken
samples, with the same EFRs (except PBBz) found in soil samples. In contrast, only
BTBPE was detected in river fish, only DBDPE was detectable in pork and no EFRs
were detected in pond fish.
Most strikingly, concentrations of all target EFRs in e-waste-impacted samples in this
study exceed substantially those detected in the corresponding controls. This suggests
substantial impact of the e-waste processing activities on the environment in Bui Dau.
These findings are consistent with previous studies of PBDEs and some EFRs in
Taizhou, eastern China (Labunska et al., 2015, 2014). DDC-COs were the most
frequently detected EFR (100% detection) in chicken samples (muscle, liver, egg,
skin), followed by BTBPE and HBB with a detection frequency of 70% and 50%,
respectively. PBBz was less frequently detected in chicken samples while BEH-TEBP

90
Table 3.1 Average, median and range of concentrations of EFRs and HBCDDs (ng/g lw) in food and co-located soil and sediment
samples (ng/g dw) from an e-waste processing (Bui Dau, Vietnam) and control sites.
Chicken
muscle
(n=5)
Chicken
liver
(n=5)
Chicken
skin
(n=5)
Chicken
egg
(n=15)
Soil
(n=5)
River
fish
(n=5)
Pork
(n=2)
Sedimentc
(n=8)
Control
chicken
muscle-
1
(n=1)a
Control
chicken
egg-1
(n=3) a
Control
chicken
muscle-
2
(n=1) b
Control
chicken
egg-2
(n=1) b
Control
chicken
liver
(n=1) b
Control
chicken
skin
(n=1) b
Control
fish
(n=1) a
Control
pork
(n=1) a
Lipid% 6.0 15 43 42 -- 4.0 18 -- 21 42 2.0 44 12 46 17 30
PBBz
average <1.5 2.0 1.3 0.92 <0.15 <0.36 <0.36 -- <1.5 <0.31 <1.5 <0.31 <0.36 <0.31 <0.36 <0.36
median <1.5 <0.36 0.42 0.96 <0.15 <0.36 <0.36 -- <1.5 <0.31 <1.5 <0.31 <0.36 <0.31 <0.36 <0.36
range --
<0.50-
3.7
<0.50-
2.0
0.19-1.9 -- -- -- -- -- -- -- -- -- -- -- --
HBB
average 6.4 6.8 3.0 1.5 6.9 <0.36 <0.36 0.033 <1.5 <0.30 <1.5 <0.30 <0.36 <0.30 <0.36 <0.36
median <1.5 <0.36 0.49 1.4 1.3 <0.36 <0.36 -- <1.5 <0.30 <1.5 <0.30 <0.36 <0.30 <0.36 <0.36
range <1.5-10
<0.36-
11
<0.30-
5.8
<1.3-2.0 0.15-21 -- -- NDd-0.23 -- -- -- -- -- -- -- --

91
BEH-
TEBP
average <6.5 <1.5 <1.3 2.0 0.13 <1.5 <1.5 <0.20 <6.5 <1.3 <6.5 <1.3 <1.5 <1.3 <1.5 <1.5
median <6.5 <1.5 <1.3 <1.3 <0.050 <1.5 <1.5 -- <6.5 <1.3 <6.5 <1.3 <1.5 <1.3 <1.5 <1.5
range -- -- -- <1.3-3.0
<0.050-
0.40
-- -- ND-1.6 -- -- -- -- -- -- -- --
BTBPE
average 60 54 70 67 10 40 <0.70 0.89 <3.1 <0.62 <3.1 <0.62 <0.70 <0.62 <0.70 <0.70
median 46 12 25 18 5.2 55 <0.70 -- <3.1 <0.62 <3.1 <0.62 <0.70 <0.62 <0.70 <0.70
range <3.1-100
<0.70-
130
<0.62-
100
<2.8-
160
0.19-34
<1.0-
57
-- ND-5.7 -- -- -- -- -- -- -- --
DBDPE
average 6.9 <3.0 <2.8 280 21 <3.0 2.5 3.1 <7.5 <2.5 <7.5 <2.5 <3.0 <2.5 <3.0 <3.0
median <7.5 <3.0 <2.8 <2.5 12 <3.0 -- -- <7.5 <2.5 <7.5 <2.5 <3.0 <2.5 <3.0 <3.0
range <7.5-9.9 -- --
<2.5-
620
0.42-64 -- -- ND-20 -- -- -- -- -- -- -- --
syn-
DDC-CO
average 310 1600 170 140 3.8 <0.36 <0.36 0.17 <1.6 <0.32 <1.6 <0.32 <0.36 <0.32 <0.36 <0.36
median 76 170 90 5.0 0.60 <0.36 <0.36 -- <1.6 <0.32 <1.6 <0.32 <0.36 <0.32 <0.36 <0.36
range
<1.6-
1400
<0.36-
8000
0.13-
790
3.4-560 0.20-13 -- -- ND-1.8 -- -- -- -- -- -- -- --
anti-
DDC-CO
average 1200 3500 350 450 10 <0.36 <0.36 0.45 <1.6 <0.32 <1.6 <0.32 <0.36 <0.32 <0.36 <0.36
median 260 210 160 8.0 2.3 <0.36 <0.36 -- -- -- -- -- -- -- -- --
range <1.6- 7.5- 0.32- 5.1- 0.83-31 -- -- ND-4.8 -- -- -- -- -- -- -- --

92
1600 17000 3000 1800
DDC-
CO
average 1500 5100 520 590 14 <0.36 <0.36 0.59 <1.6 <0.32 <1.6 <0.32 <0.36 <0.32 <0.36 <0.36
median 340 380 250 13 2.9 <0.36 <0.36 -- -- -- -- -- -- -- -- --
range
<1.6-
3000
7.5-
25000
0.44-
3800
4.0-
2300
1.3-44 -- -- ND-6.7 -- -- -- -- -- -- -- --
-
HBCDD
average 34 1700 600 2800 6.7 2.5 0.90 -- 0.10 0.10 17 1.6 <0.020 1.0 <0.020 <0.020
median 20 1000 640 2500 5.0 2.3 -- -- -- -- -- -- -- -- -- --
range 1.2-55
180-
2500
20-850
330-
3500
1.0-8.9
0.10-
3.3
-- -- -- -- -- -- -- -- -- --
-
HBCDD
average 0.15 28 0.06 79 4.8 0.41 <0.020 -- <0.010 <0.010 <0.010 <0.010 <0.010 <0.010 <0.010 <0.010
median 0.25 20 0.10 70 3.8 0.51 -- -- -- -- -- -- -- -- -- --
range 0.10-2.0 2.5-35
0.02-
0.15
15-80
0.50-
8.0
0.040-
0.65
-- -- -- -- -- -- -- -- -- --
-
HBCDD
average 5.3 1500 330 700 110 0.50 0.20 -- <0.020 <0.020 0.57 0.95 <0.020 <0.020 <0.020 <0.020
median 8.9 890 450 910 100 0.60 -- -- -- -- -- -- -- -- -- --
range 0.10-15
160-
3000
3.8-580
200-
2300
56-710
0.050-
0.12
-- -- -- -- -- -- -- -- -- --
HBCDD
average 39 3200 930 3600 120 3.4 1.1 -- 0.10 0.10 18 2.6 <0.050 1.0 <0.050 <0.050
median 29 1900 1000 3500 110 3.4 -- -- -- -- -- -- -- -- -- --

93
range 2.0-80
330-
5500
25-1400
540-
5800
0.030-
580
0.20-
4.1
-- -- -- -- -- -- -- -- -- --
a) Control samples collected in Vietnam; b) Control samples collected in Japan; c) from Someya et al., 2015; d) ND= not detected.

94
was only detected in chicken egg samples. In contrast, the most frequently detected
compounds in foods from e-waste processing sites in Taizhou, eastern China were
EH-TBB and BEH-TEBP (Labunska et al., 2015). This likely reflects different waste
compositions at the two locations. Interestingly, in this study, despite the theoretical
predictions that organic contaminants for which Log KOW>7 become increasingly less
prone to uptake by biota (Thomann, 1989), we detected DBDPE (for which Log KOW
is a reported to be 11.1 (Covaci et al., 2011)) in chicken muscle, egg and pork samples
in this study. The most abundant EFR detected in chicken was DDC-CO, with average
concentrations of DDC-CO in chicken ranged between 520 and 5,100 ng/g lw,
comprising around 90% of the sum of EFRs measured in this study. This is consistent
with previous findings for chicken egg samples from e-waste recycling sites in South
China (Zheng et al., 2012). DDC-CO was not measured in samples taken from
Taizhou in the study of Labunska et al. (2015) so comparison is not possible in this
instance. The predominance of DDC-CO is likely attributable to its classification as a
high production volume (HPV) compound (Xian et al., 2011), a term used to describe
a chemical produced in the United States in quantities exceeding 450 t per year, and
the significant biomagnification potentials of both syn- and anti-DDC-CO in food
samples (Tomy et al., 2008a; Wu et al., 2010b). Furthermore, DDC-CO is used in
electrical cable coatings (Sverko et al., 2011) and dismantling of electrical wires was
one of the main e-waste processing activities in Bui Dau. Consequently, DDC-CO
may be discharged to the environment during the handling of electrical cables. With
respect to our other targeted EFRs, average concentrations in chicken samples of

95
PBBz, HBB, BEH-TEBP, BTBPE, and DBDPE were <1.5-2.0, 1.5-6.8, <1.3-2.0, 54-
70, and <2.8-280 ng/g lw, respectively. The highest concentration of DDC-CO
(25,000 ng/g lw) was found in chicken liver, at the high end of values (nd-9630 ng/g
lw) previously reported for DDC-CO in food samples (Kang et al., 2010; Sun et al.,
2015; Wu et al., 2010b; Zheng et al., 2012). Only limited studies of the presence of
EFRs in food samples from e-waste processing sites, especially in different chicken
tissues, are available. One previous study reported concentrations of DDC-CO,
DBDPE, BTBPE and HBB in chicken eggs from e-waste recycling sites in South
China, to fall within the ranges 665-3,290, 5.97-37.9, 37.2-264 and 7.32-25.7 ng/g lw,
respectively (Zheng et al., 2012). These concentrations exceed those found for
DDC-CO (4.0-2,300 ng/g lw) and HBB (<1.3-2.0 ng/g lw) in this study, but are
similar to those we report here for DBDPE (<2.8-620 ng/g lw) and BTBPE (<2.8-160
ng/g lw) in eggs. Average concentrations of HBB and BTBPE in chicken livers
(<0.15 and 15.0 ng/g lw, respectively), chicken muscle samples (0.41 and 1.46 ng/g
lw) and chicken eggs (<0.15 and 2.93 ng/g lw) from e-waste processing areas in
Taizhou (Labunska et al., 2015) are much lower than those in this study (results
shown in Table 3.1). Moreover, the concentrations of DDC-CO in chicken samples
in this study were comparable to those in chicken liver (4.4 ng/g ww) and muscle
samples (0.92 ng/g ww) from e-waste processing sites in China (Zheng et al., 2014).
Our analyses of DDC-CO concentrations in liver, muscle and skin tissues taken from
individual chickens, revealed DDC-CO concentrations were highest in chicken liver,
followed by chicken muscle, similar to data reported recently for chicken in China

96
(Zheng et al., 2014). Additionally, concentrations of BTBPE in avian (watercock) and
fish samples taken from an e-waste processing area in southern China ranged between
0.07-2.41 and <0.012-0.15 ng/g lw, respectively (Shi et al., 2009). These values are
exceeded substantially in our chicken and fish samples. In contrast, concentrations of
DBDPE in avian muscle and fish samples in our study are similar to those reported
previously (Shi et al., 2009).
In samples originating from areas not impacted by e-waste processing activities,
concentrations of HBB, BTBPE, and DBDPE were determined in a selection of UK
and Irish food samples (Fernandes et al., 2010). Only BTBPE was detectable in this
earlier study, at concentrations of 0.96, 0.75, 0.29, and 0.55 ng/g lw in fish, chicken
liver, and chicken eggs, respectively (Fernandes et al., 2010), which are substantially
lower than those detected in our study. Compared to the presence of BTBPE in UK
food samples, BTBPE was not detected in control samples collected in Vietnam and
Japan.
3.2.2 Concentrations in soil
In co-located soil samples, concentrations of HBB, BEH-TEBP, BTBPE, DBDPE,
syn-DDC-CO, and anti-DDC-CO were in the range 0.15-21, <0.050-0.4, 0.19-34,
0.42-64, 0.20-13, and 0.83-31 ng/g dw, respectively. The detection frequency was 100%
except for BEH-TEBP which was detected in only 20% of samples. PBBz was not
detected in any soil samples in this study. DBDPE was the most dominant compound
in soil, accounting for around 50% of the total EFRs in our study.

97
Concentrations of EFRs in soil in our study exceed (DBDPE and BTBPE) or are
comparable with (DDC-CO) those detected in soils taken from locations in China
surrounding but not directly impacted (e.g. close to workshops) by e-waste processing
(Shi et al., 2009; Yu et al., 2010). Moreover, concentrations of DDC-CO in soil in
this study exceeded by 3 orders of magnitude those found in soils from residential,
business and industrial areas in northern China (Ma et al., 2011). In contrast, the
concentration of DDC-CO in a single surface soil directly impacted (i.e. close to a
workshop) by e-waste recycling in South China was 3,327 ng/g dw (Yu et al., 2010)-
2 orders of magnitude higher than the average concentration detected in our study.
Similarly elevated concentrations of DDC-CO (5,900-10,000 ng/g dw) have also been
reported in soil samples directly impacted by e-waste activities in Qingyuan county
(Zheng et al., 2014).
3.3 Concentrations and diastereomer patterns of HBCDDs in food
samples and co-located soil samples
3.3.1 HBCDDs in food
Concentrations of HBCDDs in food samples in this study are shown in Table 3.1.
HBCDDs were detected in all chicken tissues, river fish, pork, and soil samples. In
chicken and fish samples, the levels of HBCDDs tend to be higher than those of EFRs
except DDC-CO while in pork samples the levels of HBCDDs were comparable to
those of EFRs in line with reports by Labunska et al. (2015) and Zheng et al.(2012).
While HBCDDs are known to be mainly used in polystyrene foam and fabrics, they

98
were used to a minor extent in electrical equipment housing (Alaee et al., 2003). This
latter minor application, could explain the elevated levels of HBCDDs in this study, as
TVs, DVDs, computers and printer housings were processed on a large scale in Bui
Dau. Coupled with their environmental stability, persistence and past high production
volume (Covaci et al., 2006), these factors may account for the levels of HBCDDs in
this study exceeding those for most of the EFRs monitored. In contrast, HBCDDs
were not detected in pond fish. This study’s finding that HBCDD concentrations in e-
waste-impacted samples exceed those in corresponding controls differs to that of
Labunska et al. (2015) who reported that HBCDD concentrations in some control
samples exceeded those in samples derived from e-waste-impacted locations. To our
knowledge, very few data exist about concentrations of HBCDDs in foods reared in
locations where unregulated e-waste processing is conducted. Average concentrations
of HBCDDs in chicken liver (3,200 ng/g lw) and egg (3,600 ng/g lw) in our study
exceeded substantially those found in chicken liver (42.5 ng/g lw) and eggs
(42.6 ng/g lw) from an e-waste processing area in Taizhou City (Labunska et al., 2015)
as well as in chicken eggs (44.2-350 ng/g lw) from another e-waste processing site in
South China (Qingyuan City) (Zheng et al., 2012). Moreover, HBCDDs
concentrations (0.59-670 ng/g ww) in food samples in this study exceed markedly
those detected in similar foodstuffs around the world including China (<LOD to 9.2
ng/g lw)(Shi et al., 2009), the USA (12-616 ng/g lw) (Schecter et al., 2008), Romania
(0.04-0.25 ng/g ww) (Dirtu and Covaci, 2010), Sweden (0.005-0.63 ng/g ww)
(Törnkvist et al., 2011), Belgium (<0.01-0.35 ng/g ww) (Roosens et al., 2009a), and

99
the UK (0.02-0.30 ng/g ww) (Driffield et al., 2008). As shown in Table 3.1, HBCDD
concentrations in animal-related food sampled from the e-waste processing site in
Vietnam varied substantially between species and different chicken tissues. The
highest concentrations were found in chicken eggs, followed by chicken liver, chicken
skin and chicken muscle; with concentrations in fish and pork samples much lower
than those from chickens. Such interspecies differences indicate that the uptake and
metabolism of HBCDDs is organism-dependent.
3.3.2 Concentrations in soil
The mean HBCDD concentration in soil in this study was 120 ng/g dw, varying
from 0.030 to 580 ng/g dw, comparable to HBCDD concentrations in surface soils
from e-waste processing areas in South China, ranging from 0.38-284 ng/g dw (Gao et
al., 2011). In contrast, concentrations of HBCDDs in soil from the vicinity of
HBCDD production facilities in Sweden, Belgium, Germany and China (111-23,200
ng/g dw) exceed significantly those in this study; while those in soils from urban
Guangzhou (1.7-5.6 ng/g dw) and from open waste dumping sites in India, Vietnam,
Malaysia, Indonesia, and Cambodia (< nd to 2.4 ng/g dw) were at the low end of the
range detected in our study (Gao et al., 2011; Li et al., 2012).
The HBCDD diastereomer profiles detected in foodstuffs and co-located soils in this
study are shown in Figure 3.1 along with the profile reported for the HBCDD
commercial formulation (Law et al., 2006b). -HBCDD was the dominant isomer in
soil samples in this study, similar to profiles observed in commercial technical

100
products and related abiotic environmental matrices such as sediment, soil and sewage
sludge (Covaci et al., 2006). However, in all food samples (whether sourced from e-
waste impacted or control locations), -HBCDD predominated, in line with previous
data for biota (Covaci et al., 2006; Reistad et al., 2006). Furthermore, -HBCDD was
relatively more abundant in chicken egg, muscle, and skin than in liver, indicating
tissue-specific variation in the relative abundance of different diastereomers, whereby
-HBCDD is more prevalent in liver samples than the other tissues studied. As
Figure 3.1 Diastereomer profiles in food and co-located surface soil samples from
e-waste processing areas in Vietnam in this study and commercial HBCDD
mixtures (Covaci et al., 2006)
HBCDD
HBCDD
HBCDD
HBCDD
HBCDD
HBCDD
Commercial HBCDD
mixtures

101
Figure 3.2 Enantiomer fractions (EF) of -HBCDD, -HBCDD and -HBCDD in
chicken and co-located soil samples (line at EF=0.50 indicates racemic value)
highlighted previously (Labunska et al., 2015), we believe the diastereomer pattern in
avian liver samples reflects more closely the pattern present in its diet and soil, as
liver is the first organ exposed following the gastrointestinal tract. In contrast, other
avian tissues display a pattern more influenced by metabolism post-exposure.
The --and γ-HBCD diastereoisomers are chiral and thus may exist in the
environment and biota as enantiomeric pairs (Janak et al., 2005). The enantiomeric
composition was expressed as enantiomer fractions (EFs) calculated by the following
formula (de Geus et al., 2000):
𝐸𝐹 =(+)A
(+)A + (−)A
where (+)A and (-)A are the peak areas of the corresponding (+) and (-) enantiomers,
respectively.
Figure 3.2 shows the EF values for -- and -HBCDD in chicken and co-located
HBCDD HBCDD HBCDD

102
soil samples. Average EF values in our soil samples were 0.46, 0.53, and 0.54 for -
- and -HBCDD, respectively, compared with those in commercial HBCDD
(0.514, 0.510, and 0.503) (Gao et al., 2011). This slight deviation from racemic
suggests some edaphic enantioselective degradation of HBCDDs, consistent with an
earlier study that reported enantioselective biodegradation of --HBCDD in soils
(He et al., 2010). In contrast, in soil samples from e-waste recycling areas and
industrial areas in South China, negligible enantioselective degradation was implied
by mean EF values ranging from 0.503 to 0.507, 0.494 to 0.506, and 0.502 to 0.511
for -, -, and -HBCDD, respectively (Gao et al., 2011).
With respect to biotic matrices, in this study, (+)--HBCDD was clearly enriched in
chicken skin and egg while (-)--HBCDD dominated in chicken liver. As proposed
above to explain the different diastereomer profile detected in chicken liver, the
different enantiomer profile observed in the liver may reflect the profile to which the
bird is exposed, while that in skin and egg may reflect in vivo enantioselective
processing post-exposure. To the best of our knowledge, no studies have been
reported to investigate the enantioselectivity of -HBCDD enantiomers in all three of
these chicken tissue types examined here. However, in an earlier study by our group
of chicken liver, eggs and muscle tissue from e-waste impacted locations in Taizhou,
China (Labunska et al., 2015), while (-)--HBCDD was enriched in all three tissue
types, the enrichment was markedly greater in liver than in egg or muscle tissue – an
observation not inconsistent with the present study.

103
Other studies have reported EFs of HBCDDs in birds. He et al. (2010) reported that
spotted dove and Chinese francolin displayed EF values enriched in the ---
enantiomer, while Chinese pond heron and its main prey (fish) displayed relatively
more (+)--HBCDD in an e-waste region in South China. Similarly, Janak et al.
found peregrine falcon eggs and common tern eggs were enriched in (-)--HBCDD,
while white-tailed sea eagle eggs were depleted in the same enantiomer. Chicken
muscle, egg, and liver in our study displayed relative enrichment of (+)--HBCDD,
consistent with previous reports for chicken eggs and muscle from e-waste recycling
sites in eastern China (Labunska et al., 2015), bird samples from an e-waste area in
South China (He et al., 2010) and predatory birds’ eggs from Sweden and the
Netherlands (Janák et al., 2008). In summary, our findings confirm the complex
species and tissue-specific variations that exist in the enantioselective behaviour of
HBCDDs in birds.
3.4 Relationships between concentrations of HFRs in chicken and
co-located soil samples
Significant linear positive correlations were found between concentrations of syn-
DDC-CO in soils and those in co-located chicken muscle, liver, and eggs (p<0.05, r2=
0.921, 0.925, 0.928, respectively for muscle, liver, and egg). Similar correlations were
found for anti-DDC-CO (p<0.05, r2= 0.876, 0.879, 0.885, respectively for muscle,
liver, and egg). Combined, these observations suggest that at our sampling sites, soil
is an important source of DDC-COs in chickens, consistent with the findings of Zheng

104
et al. (2014). This is further substantiated by comparison of values of the fraction of
anti-DDC-CO (fanti – the fractional contribution of anti-DDC-CO to DDC-CO (sum
of anti- and syn-DDC-CO)) in soil and co-located chicken tissue samples. Observed
fanti values ranged from 0.67-0.81 in soil, compared to 0.67-0.82 in chicken tissues
and 0.65-0.80 in technical DDC-CO products (Qiu et al., 2007; Zheng et al., 2012). A
slight caveat to this conclusion is the fact that significant correlation was not observed
between concentrations of either DDC-CO isomer in chicken skin samples and co-
located soil samples. With respect to other HFRs, the potential importance of soil as a
source of BTBPE contamination in chickens at our sites is indicated by the
observation of significant correlations between its concentrations in soil and in co-
located samples of chicken liver (r2=0.985, p<0.01) and muscle (r
2=0.909, p<0.05).
Conversely, no such correlations were detected between BTBPE concentrations in soil
and those in chicken skin and eggs. Similarly, no significant correlations were found
between concentrations of any HBCDD isomer in any chicken tissue and soil, which
suggests substantial metabolism and/or that food and air could be more important
influences on the HBCDD concentrations in chickens.
3.5 Estimated daily intake of EFRs and HBCDDs via consumption
of foodstuffs included in this study
Very few studies have estimated human dietary exposure to EFRs. Estimated dietary
exposure of the sum of our target EFRs for adults and children in this study were 170
and 420 ng/kg bw/day, respectively. The health effects of this exposure cannot be

105
assessed due to the current lack of health based limit values for EFRs exposure. We
have, however, compared our estimates with those reported previously. DDC-COs
account for >90% of estimated exposure for both adults and children (130 and 350
ng/kg bw/day, respectively) followed by BTBPE (31 and 61 ng/kg bw/day,
respectively), while EH-TBB predominated in one study of dietary exposure of the
population living in the vicinity of e-waste impacted sites in eastern China, in which
DDC-COs were not investigated (Labunska et al., 2015). Another study calculated
average estimated daily intakes of EFRs via eggs from one South China recycling area
to range from 970 to 4,530 ng/day (Zheng et al., 2012), which is higher than our
estimate of exposure via egg ingestion of 350 ng/day. Furthermore, the same study
concurred with our finding that DDC-CO was the dominant contributor to EFRs
exposure via egg ingestion.
Daily dietary exposure to HBCDDs of individuals living in an e-waste impacted area
in this study was estimated at 480 and 1500 ng/kg bw/day for adults and children,
respectively. This exceeds estimated dietary exposure to HBCDDs in e-waste
impacted locations in China (10.4 and 36.1 ng/kg bw/day for adults and children)
(Labunska et al., 2015) and is substantially in excess of estimated fish-related dietary
exposure in the Netherlands and Sweden (0.12 and 0.14 ng/kg bw/day, respectively)
(Törnkvist et al., 2011; van Leeuwen and de Boer, 2008) as well as estimated dietary
exposure of non-e-waste impacted populations in Spain, Belgium and China (2.58,
0.99, and 0.432 ng/kg bw/day, respectively) (Eljarrat et al., 2014; Goscinny et al.,
2011; Shi et al., 2009). However, as stated above, the main food supplies for the

106
community in Bui Dau are from neighbouring communities. As a consequence, our
assumption that Bui Dau inhabitants source all their fish, chicken meat, liver, and
eggs from e-waste impacted sites and thus our estimates of the daily intake of EFRs
and HBCDDs via consumption of such foodstuffs represents a worst case – albeit not
wholly unrealistic – scenario (Table 3.2).
For most of our target EFRs and HBCDDs, the main contributors to dietary exposure
of both adults and children in our study were chicken liver and chicken eggs while
fish was the predominant contributor to dietary exposure to BTBPE in our study
(Figure 3.3 and 3.4). In previous studies it has been reported that fish, seafood, meat
and meat products are the principal contributors to HBCDD dietary exposure (Eljarrat
et al., 2014; Goscinny et al., 2011; Shi et al., 2009; Törnkvist et al., 2011). We are
aware of only one previous study of dietary exposure to EFRs in e-waste impacted
areas (Labunska et al., 2015). In that study, consumption of pork was the principal
contributor to dietary exposure of both adults and children to EH-TBB, BEH-TEBP,
and BTBPE (Labunska et al., 2015).

107
Figure 3.3 Contributions of different food groups to total dietary exposures to
EFRs and HBCDDs of children in Bui Dau, Vietnam
Figure 3.4 Contributions of different food groups to total dietary exposures to
EFRs and HBCDDs of adults in Bui Dau, Vietnam

108
Table 3.2 Estimated dietary exposure (ng/kg bw/day) to EFRs and HBCDD for adults and children living in e-waste impacted areas of
Bui Dau, Vietnam. ne = not estimated
Foodstuff Exposed group/HFR PBBz HBB BTBPE BEH-TEBP DBDPE
syn-
DDC-CO
anti-
DDC-CO
-
HBCDD
-
HBCDD
-
HBCDD
HBCDD
Chicken
Muscle
Adult ne 0.17 1.2 ne 0.16 11 32 14 0.06 2.2 16
Children ne 0.28 2.1 ne 0.26 19 54 23 0.10 3.6 27
Chicken Egg
Adult 0.010 0.010 0.28 0.010 0.20 1.7 5.0 73 2.1 18 93
Children 0.020 0.030 0.97 0.040 0.71 5.8 16 250 7.1 63 320
Chicken
Liver
Adult 0.030 0.10 0.75 ne ne 29 50 180 3.0 160 350
Children 0.090 0.31 2.4 ne ne 93 157 580 9.6 510 1100

109
Chicken Skin
Adult 0.010 0.010 0.35 ne ne 0.76 2.9 11 ne 6.2 17
Children 0.010 0.020 0.58 ne ne 1.3 4.8 18 ne 10 29
Fish
Adult ne ne 28 ne ne ne ne 1.8 0.29 0.35 2.4
Children ne ne 55 ne ne ne ne 3.4 0.56 0.68 4.7
Pork
Adult ne ne ne ne 4.6 ne ne 1.7 ne 0.37 2.0
Children ne ne ne ne 1.7 ne ne 0.61 ne 0.14 0.75
Total
Adult 0.040 0.29 31 0.010 5.0 43 90 290 5.0 190 480
Children 0.12 0.64 61 0.040 2.7 120 230 880 17 590 1500

110
This chapter contains some sections of verbatim text adapted from Tao et al. (2016)
published as part of this PhD. The author’s contribution: writing, contribution of ideas
and numerical calculation.

111
CHAPTER 4 EFRs, PBDEs and
HBCDDs in UK indoor air and indoor
dust

112
4.1 Synopsis
Concentrations of EFRs, PBDEs and HBCDDs were determined in indoor air and dust
samples taken from offices and homes in Birmingham, UK. The manufacture and new use of
PBDEs and HBCDDs has been banned or restricted in recent years (Newton et al., 2015). We
thus hypothesise that this may result in increased production, use and thus elevated levels of
EFRs and decreased levels of “legacy” FRs in the environment. Given the similarity in
physicochemical properties between EFRs and “legacy” FRs, it has been suggested that their
environmental behaviour may also be similar and that human exposure pathways to EFRs
will mimic those of their legacy counterparts, with indoor exposures playing an important
role. In this study, 16 EFRs were measured in samples of air and settled floor dust from a
variety of indoor environments in the UK. In the same samples, concentrations were also
measured of 8 PBDEs and 3 HBCDD diastereomers. Data for these legacy FRs were
compared with those reported in previous UK studies to test the hypothesis that the
aforementioned restrictions have been effective in reducing indoor contamination.
Concentrations in this study are also compared with those for other countries, and with recent
data for outdoor air in the West Midlands.
4.2 Sampling strategy
Air samples were collected in offices (n=20) and houses (n=15) using passive air sampling
techniques in Birmingham, UK from February to May 2015. Each passive sampler was
deployed for around 45 days around a height of the human breathing zone (see section 2.3.1
for details of sampling methodology).
Dust samples were collected in offices (n=42) from June 2013 to May 2015. With respect to
houses, both living room and bedroom dust samples were collected in 15 houses, making 30
dust samples overall. Samples were collected under normal office and house use conditions to
113
reflect actual human exposure (see section 2.3.2 for details of sampling methodology).
4.3 Concentration of EFRs, PBDEs and HBCDDs in indoor air
Table 4.1 and Table 4.2 summarise the concentrations of EFRs, PBDEs and HBCDDs in
indoor air samples from homes and offices. All 16 EFRs, 8 PBDEs, and 3 HBCDD
diastereomers were detected in indoor air.
4.3.1 EFRs
In both homes and offices, the more volatile EFRs included in this study (DBE-DBCH, TBX,
PBBz, TBCT, PBT, PBEB, TBP-DBPE and HBB) were detected frequently in indoor air with
detection frequencies (DF) exceeding 60%.This is likely attributable to a combination of
greater indoor use of these chemicals coupled with their relatively higher vapour pressures
and lower KOA values. The most abundant compounds in air were -DBE-DBCH and -
DBE-DBCH, which when summed as DBE-DBCH account for 63% and 80% of EFRs in
homes and offices, respectively. The median concentrations of DBE-DBCH in homes and
offices were 110 and 290 pg/m3, respectively, which is higher than those in Norwegian
households (77.9 pg/m3) and classrooms (46.6 pg/m
3) (Cequier et al., 2014) and in Swedish
offices, apartments, stores and schools (55 pg/m3) (Newton et al., 2015). To the best of our
knowledge, only one commercial product of DBE-DBCH (Saytex BCL-462) has been
reported, which contains equal amounts of the two diastereomers, α- and β-DBE-DBCH
(Arsenault et al., 2008). The isomeric ratio of - to -DBE-DBCH (expressed as fβ-DBE-DBCH)
in this study ranged from 0.53 to 1.0, with a median value of 0.73 which is lower than in the
commercial product (fβ-DBE-DBCH = 1). To the best of our knowledge, this is the first report of
the ratio of - to -DBE-DBCH in indoor air. Possible explanations for the different
diastereomer pattern in air compared to the commercial product include: differences in

114
physicochemical properties (e.g. vapour pressure) between the two diastereomers, and
possible isomerisation post-emission. The latter explanation appears unlikely, as thermal
conversion of the DBE-DBCH isomers occurs at or above 125 ˚C (Arsenault et al., 2008). In
contrast, such high temperatures occur during the incorporation of flame retardant additives
like DBE-DBCH into polymeric products. Consequently, the fβ-DBE-DBCH values observed in
indoor air in this study may actually reflect the pattern present in DBE-DBCH-treated
products rather than that present in the commercial Saytex product.
Other frequently detected EFRs were BTBPE, EH-TBB and BEH-TEBP with DFs above 70%
in both microenvironment categories in this study. In contrast, DFs for these three
compounds in Norwegian and Swedish indoor air were less than 33% (Cequier et al., 2014;
Newton et al., 2015). Moreover, BTBPE was not detected in either of these previous studies
(Cequier et al., 2014; Newton et al., 2015). No production information is available for the UK
or for the EU overall. Both EH-TBB and BEH-TEBP have been reported to be replacements
for Penta-BDE, and BTBPE a replacement for Octa-BDE (Covaci et al., 2011). It is therefore
possible that after the phase out of “legacy” FRs, these EFRs were more widely used in the
UK than Norway and Sweden as a result of the more stringent fire safety regulations in the
UK (Harrad and Abdallah, 2011).
4.3.2 PBDEs
Of all PBDEs analysed, BDEs 28, 47, 100, 99, and 209 were more frequently detected
(DFs >85%) than other PBDEs. Concentrations of ∑PBDEs (gas + particle phases) ranged
from 36 to 6400 pg/m3 with a median value of 280 pg/m
3 in homes which is comparable to
studies conducted in USA (210-3980 pg/m3) and Sweden (72-1400 pg/m
3) but higher than
Germany (8.24-47 pg/m3), Australia (0.5-179 pg/m
3) and Japan (17-55 pg/m
3) (Fromme et
al., 2009; Johnson-Restrepo and Kannan, 2009; Takigami et al., 2009; Thuresson et al., 2012;

115
Table 4.1 Descriptive Statistics for Concentrations of EFRs in UK indoor air (pg/m3)
Statistical
Parameter -DBE-
DBCH
-DBE-
DBCH TBX PBBz TBCT PBT PBEB TBP-DBPE HBB EH-TBB BTBPE BEH-TEBP syn-DDC-CO anti-DDC-CO TBBPA-BDBPE DBDPE
Birmingham, UK, this study,
Homes, n=15
DF 100% 100% 100% 93% 60% 100% 100% 93% 73% 100% 73% 93% 7% 20% 20% 40%
5th percentile 20 15 4.0 0.70 <0.10 3.0 0.47 0.46 <0.20 0.14 <1.0 0.36 <2.0 <1.2 <10 <10
95th percentile 260 210 120 14 83 48 3.7 10 38 17 41 40 2.1 8.3 57 86
Mean 99 74 31 6.6 22 17 1.6 3.5 11 4.8 11 10 <2.0 2.2 13 26
Median 64 45 9.7 5.3 9.9 11 1.3 2.0 4.2 2 5 2.1 <2.0 <1.2 <10 <10
Minimum 17 13 1.6 <0.10 <0.10 2.3 0.41 <0.40 <0.20 0.05 <1.0 <0.10 <2.0 <1.2 <10 <10
Maximum 350 250 190 22 240 63 5.4 14 91 44 50 130 4.6 20 87 97
Geometric Mean 68 50 14 4.1 1.6 11 1.3 2.0 2.3 1.7 4.1 1.9 <2.0 0.92 7.4 13
Birmingham, UK, this study,
Offices, n=20
DF 100% 100% 100% 100% 65% 65% 100% 85% 85% 100% 100% 90% 5% 5% 5% 5%
5th percentile 79 58 3.6 4.6 <0.10 <0.10 0.41 <0.40 <0.20 0.82 0.70 <0.10 <2.0 <1.2 <10 <10
95th percentile 410 240 36 42 9.8 30 17 56 61 80 100 7.8 1.3 1.8 7.3 7.5
Mean 180 140 16 16 1.6 15 4.2 18 19 22 32 2.2 1.3 1.8 7.3 7.5
Median 160 120 14 11 <0.10 4.7 1.7 1.9 9.4 5.3 11 1.4 <2.0 <1.2 <10 <10
Minimum 74 41 2.6 3.1 <0.10 <0.10 0.31 <0.40 <0.20 0.67 0.70 <0.10 <2.0 <1.2 <10 <10
Maximum 440 300 38 47 11 200 35 280 170 240 220 11 7.7 24 50 54
Geometric Mean 160 120 12 12 0.16 1.4 1.8 2.2 5.1 6.5 8.5 0.89 1.1 0.72 5.6 5.6

116
Table 4.2 Descriptive Statistics for Concentrations of PBDEs and HBCDDs in UK indoor air (pg/m3)
Statistical Parameter BDE
28
BDE
47
BDE
100
BDE
99
BDE
154
BDE
153
BDE
183
BDE
209 HBCDD HBCDD HBCDD ∑HBCDDs
Birmingham, UK, this study,
Homes, n=15
DF 100% 100% 87% 100% 53% 67% 27% 100% 40% 47% 100% --
5th percentile 0.35 0.15 <0.10 0.5 <0.50 <0.4 <1.0 41 <2.6 <2.2 32 34
95th percentile 95 560 200 570 59 160 11 2300 200 66 810 1200
Mean 22 120 44 130 14 24 2.8 660 43 17 270 320
Median 1.2 13 1.5 12 1.2 1.8 <1.0 170 <2.6 <2.2 110 110
Minimum 0.21 0.15 <0.10 0.05 <0.50 <0.4 <1.0 23 <2.6 <2.2 16 19
Maximum 310 1700 600 1700 180 180 12 3800 400 160 1400 1500
Geometric Mean 1.3 1.4 1.7 12 1.2 2 1 250 5.8 3.6 140 170
Birmingham, UK, this study,
Offices, n=20
DF 100% 100% 85% 100% 40% 55% 10% 100% 59% 53% 100% --
5th percentile 0.82 1.1 <0.10 1.7 <0.50 <0.4 <1.0 7.7 <2.6 <2.2 7.3 9.7
95th percentile 13 270 12 15 2.7 1.8 1.6 260 22 15 200 240
Mean 4.3 44 3.0 9.2 0.78 0.6 <1.0 74 8.8 5.2 55 69
Median 2.7 6 1.5 7.9 <0.50 <0.4 <1.0 26 5.4 <2.2 34 41
Minimum 0.81 0.15 <0.10 1.2 <0.50 <0.4 <1.0 2.3 <2.6 <2.2 3.1 5.5
Maximum 13 380 17 42 6 3.6 3.8 350 31 15 320 360
Geometric Mean 3.1 8.3 1.0 6.7 0.43 0.37 0.58 35 4.6 2.9 32 39

117
Toms et al., 2009). The concentrations of ∑PBDEs (gas + particle phases) were in the range
of 22-600 pg/m3 with a median value of 54 pg/m
3 in offices which is comparable to Australia
(15-487 pg/m3) but much lower than USA (21-17200 pg/m
3) and Sweden (140-7300 pg/m
3)
(Batterman et al., 2010; Takigami et al., 2009; Thuresson et al., 2012; Toms et al., 2009).
BDE 209 was the dominating congener in homes and offices, contributing 73% and 50% of
the total atmospheric PBDEs, respectively. This congener pattern matches broadly that
reported in Sweden (Thuresson et al., 2012), Germany (Fromme et al., 2009), Australia
(Toms et al., 2009), and Japan (Takigami et al., 2009), in all of which BDE 209 was the
dominant congener in homes and offices. In contrast, in the USA, BDE 47 and BDE 99 were
the most abundant compounds in homes (Johnson-Restrepo and Kannan, 2009), while BDE
17, BDE 47 and BDE 99 accounted for 72% of PBDEs in offices (Batterman et al., 2010).
This different pattern in the USA can be explained by the far more extensive use of Penta-
BDE in USA (97.5% of global Penta-BDE demand) than other countries (Hale et al., 2003).
4.3.3 HBCDDs
Of the 3 HBCDD isomers monitored, -HBCDD was more frequently detected than -
HBCDD and -HBCDD in indoor air. In homes in this study, concentrations of ∑HBCDDs
(gas + particle phases) ranged from 19 to 1500 pg/m3 with a median value of 110 pg/m
3
which is comparable with the range and median reported in the only previous UK study
(range: 67-1300 pg/m3; median: 180 pg/m
3 ) (Abdallah et al., 2008). By comparison, in
offices, concentrations in this study of ∑HBCDDs (gas + particle phases) ranged from 5.5 to
360 pg/m3 with a median value of 41 pg/m
3. These levels are
lower than in offices in the
previous UK study (range: 70-460 pg/m3; median: 170 pg/m
3) (Abdallah et al., 2008).
Outside the UK, concentrations of ∑HBCDDs in offices, apartments, stores and two schools
in Sweden (range <1.3-19 pg/m3; median: <1.3 pg/m
3) (Newton et al., 2015) were

118
substantially lower than those reported here. -HBCDD was the dominant contributor to
ΣHBCDD in both homes and offices in this study. On average, the composition is 87% -
HBCDD, 8% -HBCDD, and 5% -HBCDD in homes, while for offices, it is 71% -
HBCDD, 18% -HBCDD, and 11% -HBCD. This diastereomer pattern is similar to the
previous UK study (in which the composition in indoor air was 65% γ-HBCDD, 22% -
HBCDD and 13% -HBCDD) (Abdallah et al., 2008).
4.3.4 Relative abundance of different classes of FRs
As shown in Figure 4.1, PBDEs were the predominant FR class monitored in homes,
contributing 44 % of FRs. In contrast, EFRs were the principal contributor to FRs in
offices, accounting for 83% of ∑FRs. ∑HBCDDs contributed 18% and 8% to FRs in homes
Figure 4.1 Relative contributions of EFRs, PBDEs and HBCDDs to FRs in UK indoor
air
and offices, respectively. The comparatively high abundance of EFRs in both offices and

119
homes, suggests widespread use of these chemicals in the UK. Particularly noteworthy is the
far greater abundance of EFRs in offices. This could be attributable to different putative
sources in homes and offices, or reflect a more rapid turnover of such source items in offices.
Greater replacement in office environments of old source items containing “legacy” FRs with
replacements containing EFRs, is a plausible explanation for the predominance of the latter
chemical class in offices.
4.4 Concentration of EFRs, PBDEs and HBCDDs in indoor dust
Table 4.3 and Table 4.4 summarise the concentrations of EFRs, PBDEs and HBCDDs in
indoor dust samples taken from homes and offices.
4.4.1 EFRs
In contrast to indoor air in this study, the less volatile compounds were more frequently
detected in office and house dust. These include: DDC-CO, TBBPA-BDBPE and DBDPE
(for which DFs all exceeded 60%). Of particular interest is the very high concentration of
4700,000 ng/g BTBPE detected in one UK office dust sample, which to the author’s
knowledge is the highest BTBPE level reported to date in indoor dust globally. We are
currently unable to give an explanation for the high concentration based on a survey of
potential FR-treated items in the sampled office. TBBPA-BDBPE was the most abundant
compound, comprising 87% and 71% of ∑EFRs in homes and offices based on median
concentrations, respectively, followed by BEH-TEBP, BTBPE, and DBDPE. TBBPA-BDBPE
was also the predominant EFR detected previously in UK classroom dust accounting for on
average 48% of EFRs (Ali et al., 2011a) indicating extensive use of this compound in the
UK. The levels of TBBPA-BDBPE in this study exceeded those in both Belgian homes and
offices (Ali et al., 2011a) and USA homes (Dodson et al., 2012). In office dust, levels of
BTBPE, BEH-TEBP, and DBDPE in this study were comparable to those reported for offices

120
in Beijing, China (Cao et al., 2014) but exceeded those reported for Belgian offices (Ali et al.,
2011a). With respect to house dust, concentrations reported here were comparable to those
measured in Belgium, New Zealand, Germany, Sweden, and Norway (Ali et al., 2012a,
2011a; Cequier et al., 2014; Dodson et al., 2012; Fromme et al., 2014; Sahlström et al., 2015)
but were lower than those found in USA and Canada (Shoeib et al., 2012; Stapleton et al.,
2008). In studies that did not target TBBPA-BDBPE, DBDPE and BEH-TEBP were the most
abundant EFRs in house dust from Norway, USA, China, Sweden and Germany (Cequier et
al., 2014; Dodson et al., 2012; Fromme et al., 2014; Qi et al., 2014; Sahlström et al., 2015),
with similar abundances of DBDPE and BEH-TEBP as was seen in this study. Our data also
represent the first report of the presence of DDC-CO in UK indoor dust at median levels of
5.7 and 73 ng/g in home and office dust, respectively. The fraction of DDC-CO contributed
by the anti DDC-CO isomer (expressed as fanti) in the technical mixture has been reported to
fall in the range 0.65−0.75 (Cequier et al., 2014). By comparison, fanti values in indoor dust in
this study range from 0.27-0.99. This wider range is similar to previous studies of indoor dust
from Canada, China and Sweden (Newton et al., 2015; Shoeib et al., 2012; Wang et al.,
2011). As discussed above for DBE-DBCH in air, plausible explanations include: isomer-
specific degradation, isomer-specific environmental behaviour arising from different
physicochemical properties, as well as thermal isomerisation occurring during incorporation
of the commercial DDC-CO product into source items.
DBE-DBCH was also detected in all indoor dust samples underlining the extensive use of this
compound in the UK. We report here fβ-DBE-DBCH for the first time in indoor dust with values
falling in the range 0.32-2.88 (median value: 0.85) which is lower than the commercial
product (1.0). Possible reasons for the generally lower ratios in dust compared to the
commercial Saytex formulation are as described for indoor air in section 4.3.1. In brief, the
possible explanations are differences in physicochemical properties between -DBE-DBCH

121
and - DBE-DBCH and/or possible isomerisation post-emission. We conducted a paired t-
test comparison of fβ-DBE-DBCH values obtained for air and dust samples taken in the same
rooms. This revealed that fβ-DBE-DBCH values of indoor dust are significantly higher than those
of indoor air (0.53-1.0) (p<0.01). There are very few studies that address differences in the
physicochemical properties and environmental behaviour between DBE-DBCH isomers.
Wong et al. (2012) reported the fate of DBE-DBCH in urban soil and found that β-DBE-
DBCH had a slightly higher soil-air partition coefficient (KSA) than -DBE-DBCH, thereby
indicating β-DBE-DBCH to be less volatile than -DBE-DBCH. This may explain the
significantly higher fβ-DBE-DBCH in indoor dust than indoor air. Moreover, the slightly faster
degradation rate of -DBE-DBCH compared to β-DBE-DBCH reported by Wong et al.
(2012), may also contribute to the observed DBE-DBCH profiles in dust. The fate of DBE-
DBCH isomers in environment and elucidating the reason of the difference between
diastereomer profiles in air and dust is therefore a research priority.
4.4.2 PBDEs
Each of the target individual PBDEs were detected in >90% of indoor dust samples except
for BDE 28 and BDE 47. In house dust, concentrations of ∑PBDEs ranged from 180 to
370000 ng/g with a median value of 4600 ng/g. This is higher than concentrations reported
from other countries in European and North America such as Germany (36.6-1580 ng/g),
Denmark (65-61524), Sweden (53-4000 ng/g), USA (920-17000 ng/g), and Belgium (4-6509
ng/g) as well as Asian countries like China (131.6 to 3886.7 ng/g) but is comparable to those
reported in Canada (170-170000 ng/g) (D’Hollander et al., 2010; Fromme et al., 2009;
Harrad et al., 2008b; Thuresson et al., 2012; Vorkamp et al., 2011; Wilford et al., 2005; Yu et
al., 2012). In office dust, concentrations of ∑PBDEs were 270-110000 ng/g with a median
value of 3000 ng/g. This is comparable to USA, Sweden and China but higher than Belgium

122
Table 4.3 Descriptive Statistics for Concentrations for EFRs in UK indoor dust (ng/g)
Location
(reference) -DBE-
DBCH
-DBE-
DBCH TBX PBBz
TBC
T PBT PBEB
TBP-
DBPE HBB
EH-
TBB BTBPE
BEH-
TEBP
syn -DDC-
CO
anti -DDC-
CO
TBBPA-
BDBPE DBDPE
Birmingham,
UK,
this study,
Homes, n=30
DF 100% 100% 80% 87% 40% 67% 87% 84% 75% 94% 100% 100% 63% 84% 100% 60%
5th percentile 2.0 2.0 <0.010 <0.010 <0.0
10
<0.0
10 <0.010 <0.050
<0.0
30 <0.010 2.4 17 <0.26 <0.15 220 <1.2
95th percentile 25 40 32 8.8 60 24 10 34 7.3 74 57 600 12 120 27000 1200
Mean 9.4 12 18 3.3 21 7.1 2.3 6.6 1.8 21 14 240 3.6 21 5800 240
Median 5.9 6.2 1.4 2.2 <0.0
10 1.8 0.78 1.8
<0.0
30 10 5.6 65 0.77 4.9 1000 41
Minimum 1.4 1.5 <0.010 <0.010 <0.0
10
<0.0
10 <0.010 <0.050
<0.0
30 <0.010 0.01 16 <0.26 <0.15 71 <1.2
Maximum 52 77 410 12 300 90 21 47 12 85 110 3500 28 170 49000 2300
Geometric Mean 6.5 7.2 0.87 1.2 0.16 0.53 0.59 1.5 0.11 5.2 6.1 83 0.87 4.2 1500 28
Birmingham,
UK,
this study,
Offices, n=47
DF 100% 100% 98% 91% 67% 87% 100% 98% 91% 91% 100% 100% 98% 98% 100% 96%
5th percentile 4.1 5.2 0.53 <0.010 <0.0
10
<0.0
10 0.49 1.4
<0.0
30 0.0065 5.9 58 1.0 3.3 480 70
95th percentile 52 44 11 11 44 30 6.7 130 42 490 20000 3600 430 1000 9500 8600
Mean 23 18 3.2 4.5 11 6.0 2.0 24 14 120 100000 1000 60 210 3400 1600
Median 15 13 2.1 3.3 3.4 2.5 1.4 4.7 9.9 31 160 160 11 62 2300 440
Minimum 2.5 2.7 <0.010 <0.010 <0.0
10
<0.0
10 0.36 <0.050
<0.0
30 <0.010 0.019 54 <0.26 <0.15 310 <1.2
Maximum 130 120 19 23 68 59 10 370 84 2000 4700000 25000 640 2100 14000 17000
Geometric Mean 16 14 1.7 2.0 0.54 1.3 1.4 6.1 5.6 18 200 250 11 43 2200 420

123
(Batterman et al., 2010; D’Hollander et al., 2010; Kang et al., 2011; Thuresson et al., 2012).
Similar to indoor air in this study, BDE 209 was the predominant PBDE congener detected,
contributing 99% and 94% of PBDEs in homes and offices, respectively. This predominance
of BDE 209 is in line with other countries in Europe and in Asia, but is more marked than in
North America, where the greater use of Penta-BDE leads to a greater contribution from
BDEs 47 and 99 (Batterman et al., 2010; D’Hollander et al., 2010; Fromme et al., 2009;
Harrad et al., 2008a; Kang et al., 2011; Thuresson et al., 2012; Vorkamp et al., 2011; Wilford
et al., 2005).
4.4.3 HBCDDs
All three targeted HBCDDs were detected in every indoor dust sample.Concentrations of
∑HBCDDs ranged from 50 to 110000 ng/g with a median value of 610 ng/g in homes which
compares to the concentrations detected in house dust in a previous study in the West
Midlands (range: 140-140000 ng/g; median: 1300 ng/g) (Abdallah et al., 2008). In office
dust, concentrations of ∑HBCDDs were in the range 150-6400 ng/g with a median value of
1700 ng/g in offices. This again compares closely with previous UK data (range: 90-6600
ng/g; median: 760 ng/g) (Abdallah et al., 2008). The levels of ∑HBCDDs in office and house
dust in this study exceeded those reported in dust from offices, apartments, stores and two
schools in Sweden (range: 17-2900 ng/g; median: 150 ng/g) (Newton et al., 2015). In our
study, -HBCDD was the dominant contributor to ΣHBCDD in both house and office dust.
The average composition is 53 % -HBCDD, 29 % -HBCDD, and 18 % -HBCDD in
homes, while for offices; it is 56 % -HBCDD, 27 % -HBCDD, and 17 % -HBCDD. This
diastereomer pattern differs from that observed in indoor air. To investigate whether the
diasteromer pattern in air is statistically significant from that in dust in the same rooms, the
fractional contributions of both -HBCDD and -HBCDD to ΣHBCDDs detected in matched

124
pairs (n = 32) of indoor air and dust samples, i.e., collected from the same room at the same
time (dust was collected at the end of the air sampling period) were compared. Similar to a
previous UK study (Abdallah et al., 2008), the results of an paired t-test revealed significantly
greater relative abundance of -HBCDD in dust compared to matched air samples, with the
opposite trend observed for -HBCDD (p < 0.001). This was attributed to a postdepositional
shift from -HBCDD to -HBCDD, and/or preferential degradation of -HBCDD in indoor
dust (Abdallah et al., 2008).
4.4.4 Composition profiles of FRs (including EFRs, PBDEs and HBCDDs)
As shown in Figure 4.2, PBDEs are the predominant FR class monitored in house dust,
contributing 66% FRs, while EFRs dominated in office dust, accounting for 51% of
FRs. HBCDDs contributed 9% and 17% to FRs in house and office dust, respectively.
This is similar to the composition profiles in indoor air and confirms the widespread use of
EFRs in the UK, especially in offices.
Figure 4.2 Relative contributions of EFRs, PBDEs and HBCDDs to FRs in UK
indoor dust

125
4.5 Comparisons between indoor microenvironments
4.5.1 Comparisons between indoor microenvironments in indoor air
We compared concentrations in home and office air using an independent t-test. For EFRs,
DBE-DBCH, PBBz and EH-TBB were significantly higher in offices than homes (p < 0.001
for DBE-DBCH, p < 0.05 for PBBz and EH-TBB), with no significant differences between
homes and offices detected for other EFRs. Concentrations of BDE 209 were significantly
higher in homes than offices (p < 0.005); no differences were found for other congeners. In
contrast, previous studies on West Midlands indoor air focusing on tri- to hexa-BDEs (BDE
209 not measured) found concentrations in offices to exceed those in homes (p < 0.05 Mann-
Whitney U-test) (Harrad et al., 2006, 2004). Finally with respect to HBCDDs, concentrations
of all 3 isomers were significantly higher in homes than offices (p < 0.005 for -HBCDD, p <
0.05 for HBCDD, p < 0.001 for -HBCDD). No such excess of HBCDDs in homes c.f.
offices was observed in the previous UK study (Abdallah et al., 2008).
4.5.2 Comparisons between indoor microenvironments in indoor dust
As with indoor air, we conducted an independent t-test to check for significant differences in
concentrations of our target FRs in home compared to office dust. For EFRs, DBE-DBCH,
EH-TBB, BEH-TEBP, BTBPE, DDC-CO and DBDPE were found to be significantly higher
in offices than homes (p < 0.005 for DBE-DBCH, EH-TBB and DDC-CO, p < 0.001 for
BTBPE, BEH-TEBP and DBDPE). No other significant differences between offices and
homes were found for other EFRs.
In house dust, levels of BDE 209 in homes and offices were comparable (p > 0.05), while for
BDE 47 and BDE 99, concentrations in offices exceeded significantly (p < 0.001) those in
homes. This result is in agreement with previous studies of PBDEs in Belgian and UK house
and office dust (D’Hollander et al., 2010; Harrad et al., 2008a).

126
Table 4.4 Descriptive Statistics for Concentrations of PBDEs and HBCDDs in UK indoor dust (ng/g)
Location (reference) BDE
28
BDE
47
BDE
100
BDE
99
BDE
154
BDE
153
BDE
183
BDE
209 HBCDD HBCDD HBCDD ∑HBCDDs
Birmingham, UK, this study, Homes, n=30
DF 57% 77% 100% 100% 94% 100% 90% 100% 100% 100% 100% --
5th percentile <0.03 <0.04 0.99 6.5 0.35 0.025 <0.13 180 42 11 24 77
95th percentile 11 31 10 76 7.4 14 33 150000 10000 6000 22000 38000
Mean 1.9 14 4.2 31 2.0 4.8 7.4 34000 2300 1100 4900 8300
Median 0.16 13 3.0 22 1.2 3.0 3.5 4500 320 85 93 610
Minimum <0.03 <0.04 0.75 5.0 <0.06 0.025 <0.13 160 21 6.1 23 50
Maximum 15 50 16 92 9.3 24 51 370000 28000 12000 71000 110000
Geometric Mean 0.19 4.5 3.2 24 1.2 1.6 2.9 4700 340 110 160 670
Birmingham, UK, this study, Offices, n=47
DF 82% 100% 100% 100% 100% 100% 100% 100% 100% 100% 100% --
5th percentile <0.03 11 2.7 19 1.2 0.025 0.66 750 190 54 64 310
95th percentile 17 280 61 290 24 92 160 32000 2400 510 2100 4300
Mean 3.9 83 18 100 7.7 28 29 9100 1100 300 630 2000
Median 2.6 37 12 77 3.9 9.2 9.8 2700 980 330 350 1700
Minimum <0.03 7.1 1.9 15 0.80 0.025 0.065 200 100 22 31 150
Maximum 22 660 120 480 68 190 220 110000 2800 590 3700 6400
Geometric Mean 1.1 43 11 72 4.5 7.8 9.3 3300 810 240 360 1500
127
For HBCDDs, no significant differences were detected between concentrations of ΣHBCDDs
in dust from homes and offices (p > 0.05); a finding consistent with the previous study of UK
indoor dust (Abdallah et al., 2008).
4.6 Comparisons with outdoor air samples
In one study by Drage et al. (2016), DBE-DBCH, DDC-CO, PBDEs and HBCDDs were
detected in passive outdoor air samples collected from June 2012 to January 2013 on a rural-
urban transect in UK West Midlands. Compared with our study, the levels of DBE-DBCH,
BDE 28, 47, 100, 99, 209 and ∑HBCDDs in indoor air exceed significantly those in outdoor
air (t-test on log transformed concentrations, p < 0.05), suggesting indoor air to be a source of
contamination to the outdoor environment for those compounds. The levels of DDC-CO and
BDE 154, 153 and 183 in the two studies were not compared as the DFs were low for these
FRs in both.
4.7 Comparisons with previous studies in the UK
4.7.1 EFRs
To our knowledge, these are the first data about concentrations of EFRs in UK indoor air.
Consequently, comparison with previous studies is not possible. With respect to indoor dust,
however, concentrations of BTBPE and DBDPE in dust taken from houses (n=30) and offices
(n=18) in the West Midlands collected between July 2006 and June 2007 have been reported
(Harrad et al., 2008a). Following log-transformation of concentrations, we conducted a t-test
to compare concentrations in these two studies. For house dust, concentrations of BTBPE in
our study were statistically indistinguishable to those in the previous study (p > 0.05); in
contrast, concentrations of DBDPE exceeded significantly (p < 0.05) those in the earlier
study. Moreover, t-test comparison revealed concentrations of BTBPE and DBDPE in our

128
office dust samples were both significantly higher than those reported previously (p < 0.05)
(Harrad et al., 2008a). While based on a relatively limited number of samples, these findings
support the hypothesis that restrictions on legacy FRs have led to a concomitant increase in
concentrations in UK indoor environments of DBDPE and – to a lesser extent – BTBPE.
4.7.2 PBDEs
Two previous studies have reported concentrations of PBDEs in UK indoor air. The first
reported concentrations of BDE 47, 99, 100, 153, and 154 in air from a range of office and
domestic indoor microenvironments using high-volume active air samplers from 2001-2002
(Harrad et al., 2004); while the second - conducted between September 2003 and November
2005 - measured BDE 28, 47, 49, 66, 85, 99, 100, 153, and 154 using fully sheltered passive
air samplers (Harrad et al., 2006). For house air, no significant differences between our study
and two previous studies (Harrad et al., 2006, 2004) were found. While for office air, the
levels of BDE 47, 99, and BDE 154 were significantly lower than these two previous studies
(ANOVA test on log transformed concentrations, p < 0.05) (Harrad et al., 2006, 2004). We
are aware of the potential difficulties of comparing concentrations derived using different air
sampler configurations. Two studies that examined such difficulties are: (a) Melymuk et al.
(2012), who measured PBDEs in outdoor air in Toronto, Canada and found no major
differences between concentrations derived using passive air samplers and high volume
active samples; and (b) Abdallah and Harrad (2010), who found no significant difference
between indoor air concentrations of FRs including PBDEs measured using both passive and
low volume active samplers. On the basis of these previous studies therefore, we conclude
that the influence of the different sampling methods used in the three studies compared here,
should not overly obscure the temporal trend.
Concentrations of BDE 209 in UK office dust were significantly lower (p < 0.05) than those

129
reported in a previous study of UK offices (Harrad et al., 2008a); while for UK house dust,
BDE 209 concentrations were comparable to those in the previous study (p > 0.05) (Harrad et
al., 2008a), perhaps indicating more rapid removal of “legacy” PBDEs in offices than homes.
No significant temporal differences were found for other PBDEs in both house and office
dust. The absence of a marked decline for congeners present in the Penta- and Octa-BDE
formulations may be attributable to the limited past use of these formulations in the UK.
4.7.3 HBCDDs
We compared our data for HBCDDs in indoor air with those in the previous UK study by
independent t-test (Abdallah et al., 2008). In domestic air, no significant differences were
detected; in contrast concentrations of all 3 diastereomers were significantly lower in office
air in our study (p < 0.001). This may possibly indicate possible replacement of HBCDDs by
EFRs such as DBE-DBCH which is used for housing insulation in expandable polystyrene
beads (Newton et al., 2015). Turning to indoor dust, concentrations of -HBCDD in house
dust were significantly lower in our study (p < 0.001) than in the previous study of Abdallah
et al. (2008) but not for other diastereomers and HBCDDs. No significant differences were
observed for office dust.
4.8 Correlations between FRs in indoor microenvironments
Pearson correlation analysis was applied to assess the relationships between the target
compounds in this study in indoor air and dust, respectively, (shown in Table 4.5 and Table
4.6) to investigate whether some chemicals shared similar emission sources. Unsurprisingly,
α-DBE-DBCH concentrations significantly correlated with those of β-DBE-DBCH in both
indoor air and dust samples (p < 0.001) and a similar finding was found for HBCDDs
diastereomers in indoor air and dust implying the similar source of these diastereomers (p <
0.05). Significant correlations between concentrations of individual PBDEs (BDE 47 to BDE

130
153) in indoor air were also found in this study (p < 0.05) indicating common sources of
these congeners. Similarly significant correlations between the same congeners were also
observed for both indoor office and house dust (p < 0.001) and BDE 183 was also correlated
with BDE 47 (p < 0.005), BDE 100 (p < 0.05), BDE 153 (p < 0.01) and BDE 154 (p <
0.001). This probably reflects sources of these compounds are from banned commercial
PentaBDE and OctaBDE. Additionally, correlation (p < 0.01) was obtained for BDE 209
with BDE 154 for indoor dust. PBBz was correlated significantly with PBEB, TBP-DPTE
and HBB in indoor air (p < 0.001), and similar relationships were also found in indoor dust (p
< 0.05). HBB also correlated with PBEB and TBP-DPTE in indoor air (p < 0.001). HBB and
PBBz were also correlated with some PBDEs such as BDE 28, 47 and 99 in air and dust (p <
0.05). While some of these observed correlations are hard to rationalise and may be due to
chance, those between PBEB, HBB and PBBz may result from a common source resulting
from pyrolysis of polymeric BFRs. Conditions that may favour such formation may be
encountered during the process of incorporating BFRs into goods. (Buser, 1986; Gouteux et
al., 2008; Thoma and Hutzinger, 1987)
4.9 Correlations between FR concentrations in air and dust
If semi-volatile organic compounds (SVOCs) partitioning between the gaseous and
particulate phases have reached equilibrium under ideal conditions, there should be a strong
correlation between their concentrations in air and dust, depending on vapour pressure (Bergh
et al., 2011). To investigate this hypothesis, Pearson correlation analysis was conducted to
investigate the correlations between FR concentrations in matched air and dust (n=30)
(shown in Table 4.7). Significant correlations between concentrations of EFRs in air and dust
were found in this study (p < 0.005), especially for the more volatile EFRs, e.g., DBE-
DBCH, PBT, and TBCT. Moreover, concentrations of BDE 28 and 47 in air and dust were
also significantly correlated (p < 0.05). The partition coefficient of FRs between dust and air

131
is expressed as Kda (Kda= Cdust/Cair) (Cdust and Cair are the concentrations of FRs in dust and
air, respectively.). From Figure 4.3, median values of Log Kda are linearly correlated with
their Koa for EFRs, PBDEs and HBCDDs in homes and offices suggesting that
thermodynamic equilibrium conditions have been reached between air and dust for most of
the EFRs, PBDEs and HBCDDs. Similar relationships were also found by Cequier et al.
(2014) for PFRs and PBDEs in Norway homes and classrooms and Newton et al. (2015) for
four BFRs (DBE-DBCH, PBT, HBB and BDE47). Such a relationship between KOA and KDA
means that knowledge of concentrations of FRs in either air or dust facilitates accurate
prediction of concentrations in the other phase given the Koa of the compound in question.
Interestingly, no correlation between LogKda and LogKoa of HBCDD diastereomers were
found in this study. This is consistent with the previously observed post-depositional
transformation in dust of HBCDDs including postdepositional shift from -HBCDD to -
HBCDD, and/or preferential degradation of -HBCDD in indoor dust (Abdallah et al., 2008;
Harrad et al., 2009b).

132
Table 4.5 Pearson correlations for the concentrations of FRs in air
**. Correlation is significant at the 0.01 level (2-tailed; light purple); *. Correlation is significant at the 0.05 level (2-tailed; light green).
-DBE-DBCH -DBE-DBCH TBX PBBz TBCT PBT PBEB TBP-DBPE HBB EH-TBB BTBPE BEH-TEBP BDE28 BDE47 BDE100 BDE99 BDE154 BDE153 BDE209 -HBCDD HBCDD -HBCDD
-DBE-DBCH 1
-DBE-DBCH .971** 1
TBX .015 -.010 1
PBBz .273 .246 .211 1
TBCT .138 .190 .315 .524 1
PBT .253 .329 .060 .284 .754** 1
PBEB .177 .229 .281 .622**
.571* .099 1
TBP-DBPE .049 .116 .129 .662** .320 .516
**.538
** 1
HBB .049 .036 .033 .744**
.775** .078 .656
**.571
** 1
EH-TBB .355* .307 -.405
* .103 -.685** .123 -.143 .230 .021 1
BTBPE -.045 -.144 .333 .006 -.486 .074 -.054 -.018 -.302 -.174 1
BEH-TEBP .092 .095 .110 .105 .390 .536** .337 .427
* .107 .177 .173 1
BDE28 .452**
.370* -.099 .456
* -.325 .006 .198 .150 .293 .509** .199 .120 1
BDE47 -.115 -.177 .179 .182 .524 -.091 .241 .081 .117 -.201 .238 .418* .228 1
BDE100 .318 .297 .007 .317 .625* .300 .307 .294 .440
* -.045 -.073 .286 .171 .551** 1
BDE99 .105 .129 -.022 .302 .681** .373 .250 .293 .450
* -.166 -.048 .243 .075 .483**
.816** 1
BDE154 .057 .051 .190 .145 .572 -.006 .083 -.115 .167 -.212 .059 -.038 .053 .258 .563**
.571** 1
BDE153 -.078 -.002 -.153 -.159 .568 .216 .067 .141 .212 -.047 -.214 .144 -.029 .076 .462*
.379* .352 1
BDE209 -.048 -.083 .149 -.164 .527 .076 .180 -.067 .227 -.181 .032 .387* -.168 .218 .564
** .205 .106 .179 1
-HBCDD -.030 .004 .484 .233 .795 .067 .815** -.058 .744 -.686
* .089 -.324 -.510 -.394 .947** .263 .791
*.779
*.830
** 1
HBCDD -.151 -.063 .184 .778* .813 .647 .804
* .510 .808 -.671 .032 -.044 -.603 -.728 .808* .310 .800 .703 .670 .965
** 1
-HBCDD .122 .016 .159 -.112 .407 -.182 -.115 -.329 .073 -.190 -.012 -.110 -.225 -.132 .471* .020 .246 -.007 .797
**.773
* .613 1

133
Table 4.6 Pearson correlations for the concentrations of FRs in dust
**. Correlation is significant at the 0.01 level (2-tailed; light purple); *. Correlation is significant at the 0.05 level (2-tailed; light green).
-DBE-DBCH -DBE-DBCH TBX PBBz TBCT PBT PBEB TBP-DBPE HBB EH-TBB BTBPE BEH-TEBP syn-DDC-CO anti-DDC-CO TBBPA-BDBPE DBDPE BDE28 BDE47 BDE100 BDE99 BDE154 BDE153 BDE183 BDE209 HBCDD HBCDD HBCDD
-DBE-DBCH 1
-DBE-DBCH .893** 1
TBX -.019 -.080 1
PBBz .352**
.386**
.389** 1
TBCT .038 .256 .359*
.494** 1
PBT .070 .117 .337*
.309*
.568** 1
PBEB .225 .229*
.507**
.334*
.531**
.280* 1
TBP-DBPE .293*
.352** .178 .603
**.410
** .259 .358** 1
HBB .228 .079 .013 .338* .027 -.208 .239 .246 1
EH-TBB .218 .147 .153 .056 -.093 .069 .116 .166 .144 1
BTBPE .419**
.329** -.173 .098 -.140 -.162 .101 -.057 .211 .226 1
BEH-TEBP .262* .159 -.071 .111 -.232 -.081 .081 .104 .219 .581
**.369
** 1
syn-DDC-CO .401**
.248* -.142 .142 -.439
** -.195 .114 .213 .335* .095 .288
*.350
** 1
anti-DDC-CO .357**
.278* -.044 .101 -.314
* -.210 .152 .154 .332* .081 .356
**.360
**.944
** 1
TBBPA-BDBPE .153 .147 .042 .333* .299 .458
**.288
*.406
** .119 .257* .017 .296
* -.070 -.027 1
DBDPE .352**
.256* -.075 .192 -.420
**-.339
** .071 .024 .387** .068 .375
**.477
**.568
**.624
** -.197 1
BDE28 .030 -.023 .232 .017 .044 .204 .160 .244 .197 .272 .134 -.041 -.208 -.058 .168 -.269 1
BDE47 .208 .184 .082 .114 -.044 .020 .192 .199 .360** .231 .288
* .212 .084 .218 .116 .217 .533** 1
BDE100 .250* .194 -.202 .104 -.122 .057 .085 .159 .258 .184 .399
**.250
* .227 .289* .116 .266
*.491
**.893
** 1
BDE99 .170 .109 -.235 .075 -.192 .096 .037 .113 .155 .202 .406**
.237* .125 .184 .181 .241
*.524
**.790
**.907
** 1
BDE154 .238* .207 -.276
* .151 -.178 -.068 .030 .202 .269 .168 .362**
.312**
.457**
.409** .046 .364
** .214 .736**
.839**
.795** 1
BDE153 .108 .002 -.231 -.073 -.468**
-.315* -.024 -.008 .324
* .145 .503**
.479**
.496**
.470** -.039 .524
** -.002 .541**
.572**
.562**
.672** 1
BDE183 .167 .131 .006 .060 -.077 -.279* .034 .153 .203 .208 .384
**.292
*.286
*.336
** .033 .293* .111 .353
**.273
* .221 .502**
.546** 1
BDE209 -.091 -.042 -.192 .088 .109 .052 -.153 .042 .209 .051 .063 .012 .075 .081 .132 -.075 .131 .182 .178 .200 .295* .183 .205 1
HBCDD -.006 .166 .048 .176 .758*
.494* .093 .556
* .402 -.392 -.198 -.135 -.101 .175 .417* -.124 .116 .049 .030 .006 -.064 .265 -.035 .273 1
HBCDD -.045 .108 .077 .087 .606 .355 .068 .534* .447 -.380 -.240 -.142 -.078 .190 .358 -.054 .163 -.063 .026 .024 -.069 .272 -.107 .203 .965
** 1
HBCDD .091 .229 .098 .364 .817**
.581* .128 .636
** .194 -.467* -.153 -.207 .066 .119 .399
* -.048 -.020 .048 .031 .011 -.029 .116 -.084 .096 .895**
.870** 1

134
Table 4.7 Pearson correlations for the concentrations of FRs in matched air (red) and dust (blue) (n=30)
**. Correlation is significant at the 0.01 level (2-tailed; light purple); *. Correlation is significant at the 0.05 level (2-tailed; light green).
-DBE-DBCH -DBE-DBCH TBX PBBz TBCT PBT PBEB TBP-DBPE HBB EH-TBB BTBPE BEH-TEBP BDE28 BDE47 BDE100 BDE99 BDE154 BDE153 BDE209 HBCDD HBCDD HBCDD
-DBE-DBCH .753**
.686** .212 .178 .092 .044 -.021 -.038 -.186 .200 .128 .008 .389
* .024 .224 -.045 .113 -.130 -.029 .249 -.003 .279
-DBE-DBCH .609**
.581** .081 .164 .396 .163 -.031 -.011 -.140 .068 .056 .031 .348
* .047 .370* .149 .273 .048 .055 .568 .447 .346
TBX .009 -.062 .774** .174 .211 .019 .209 .088 .173 -.298 .374
* .209 .008 .262 .285 -.020 .239 -.035 .315 .488 .161 .233
PBBz -.036 -.050 .226 .648** .361 .388 .130 .290 .399
* -.151 .149 .066 .190 .123 .166 .236 .227 -.057 -.147 .446 .764* -.139
TBCT .032 .016 .214 .527*
.883** .300 .403
* .248 .540**
-.440* .065 .212 -.018 .417
*.584
**.544
**.458
* .440 .271 .802 .880* .347
PBT .003 .051 .319 -.068 .611*
.584** .029 .220 -.094 -.382
* .147 .332 -.198 .238 .398* .299 .235 .307 .216 .633 .594 .085
PBEB .214 .232 .408*
.493* .224 .092 .543
** .309 .299 -.239 .216 .070 .213 .325 .455* .227 .403
* .162 .047 .685 .580 -.063
TBP-DBPE .130 .154 .193 .631** .220 .292 .299 .642
** .365 -.066 .067 .065 .247 .192 .446*
.349* .224 .176 -.127 .387 .790
* -.129
HBB .304 .230 -.107 .523* -.294 -.350 .152 .156 .598
** .211 -.092 -.059 .388* .046 -.005 .059 -.061 -.090 -.389
* -.398 -.311 -.262
EH-TBB -.013 -.117 -.013 -.229 -.665* -.307 -.420
* -.260 -.364 .282 .211 -.034 .360* .255 -.280 -.283 -.125 -.532
** -.256 -.746*
-.785* -.153
BTBPE .338* .256 -.011 .354 -.347 -.326 -.108 -.065 -.061 .228 .311 -.196 .420
* .027 -.185 -.170 .097 -.213 -.421* -.418 -.536 -.130
BEH-TEBP .149 .089 -.037 .056 -.119 -.288 -.096 .011 .156 .299 -.110 -.127 .410* .110 -.144 -.218 -.093 -.153 -.237 -.358 -.660 -.040
BDE28 -.003 -.095 -.155 .106 -.432 -.301 .133 .073 .145 .285 .122 .154 .441*
.567** .100 -.152 -.122 .010 -.058 -.509 -.419 -.183
BDE47 .287 .228 -.112 .221 -.322 -.065 .101 -.037 .095 .355* .118 .039 .568
**.490
** .140 -.011 .135 -.074 -.279 -.562 -.471 -.401*
BDE100 .165 .129 -.156 .223 -.322 -.080 .128 -.018 .068 .260 .067 -.039 .469**
.470** .096 .010 .128 -.078 -.309 -.600 -.432 -.461
*
BDE99 .136 .108 -.203 .211 -.371 -.125 .128 -.046 .052 .252 .022 -.078 .406*
.416* .056 -.013 .141 -.039 -.353
*-.675
* -.421 -.470*
BDE154 .157 .152 -.105 .201 -.288 .048 .025 .041 -.077 .232 -.022 -.026 .349*
.383* .049 -.002 .240 .001 -.369
*-.795
* -.619 -.503*
BDE153 .402* .344 -.138 .181 -.403 -.045 .036 .011 -.125 .332 .281 -.160 .566
** .132 -.238 -.192 -.111 -.065 -.448*
-.797*
-.845*
-.471*
BDE209 -.035 -.016 .108 .038 .010 .032 .120 .169 -.044 -.016 .139 .184 -.023 .055 -.003 -.084 -.081 -.126 -.018 .333 .396 -.031
HBCDD .164 .243 .080 .240 .642* .130 .346 .343 .385 -.297 -.229 .226 .089 .081 .479
*.434
* .296 .432 .086 .451 .499 -.088
HBCDD .075 .128 .088 .272 .564 .056 .362 .382 .453* -.269 -.183 .209 .177 .132 .458
*.427
* .253 .425 .153 .474 .538 -.044
HBCDD .286 .354 .160 .356 .792** .234 .400
* .364 .431 -.330 -.264 .126 .159 .242 .639**
.622**
.508*
.454* .145 .387 .369 -.017

135
Figure 4.3 Correlation of Kda versus Koa for EFRs and PBDEs in homes (above) and
offices (below)

136
4.10 Exposure to FRs via inhalation and dust ingestion
Human exposure to FRs via air inhalation and dust ingestion was estimated based on
concentrations reported in this study. Dust ingestion and air inhalation were assumed to occur
pro-rata to typical activity patterns (for adults 78.9% home, 21.1% office; for toddlers 100%
home) (Harrad et al., 2008a). We also assumed 100% absorption of intake of FRs (Jones-
Otazo et al. 2005). Average dust ingestion rates of 20 and 50 mg/day were used for adult and
toddler, respectively, and high dust ingestion rates were 50 mg/d and 200 mg/d for adults and
toddlers, respectively (Jones-Otazo et al. 2005). Air inhalation rate figures for adults and
toddlers were assumed to be on average 20 (Currado and Harrad, 1998) and 3.8 m3/day
(Wilford et al., 2004), respectively. We then estimated various plausible exposure scenarios,
using minimum, 5th
percentile, median, average, 95th
percentile and maximum concentrations
in our air and dust samples. Tables 4.8, 4.9 and 4.10 show the resulting estimates of the
exposure of UK adults and toddlers to different classes of FRs via air inhalation. The median
estimated human exposure estimates for toddlers via air inhalation to ∑EFRs, ∑PBDEs and
∑HBCDDs were 0.66, 0.43 and 0.14 ng/day, respectively. For adults, the estimated human
exposure via air inhalation to ∑EFRs, ∑PBDEs and ∑HBCDDs were 4.3, 2.0 and 2.1 ng/day,
respectively. Estimated exposure via air inhalation to ∑tri-hexa BDEs was previously found
to be 0.16 and 0.82 ng/day for toddlers and adults, respectively (Harrad et al., 2006), which is
comparable to the estimates of this study (0.12 and 0.60 ng/day for toddlers and adults,
respectively). There are no previous estimates of human exposure to BDE 209 via air
inhalation in the UK. For HBCDDs, Abdallah et al. (2008) reported that daily intakes of
toddlers and adults under a “typical” exposure scenario (i.e. air contaminated at the median
concentration) were at 0.8 and 3.9 ng/day, respectively, slightly higher than our study. To our
knowledge, this is first estimate of human exposure to EFRs via air inhalation. The main
contributors to estimated exposures of FRs for adults through air inhalation were -DBE-

137
DBCH, -DBE-DBCH, BDE 209 and γ-HBCDD (contributing to 21%, 14%, 17% and 24%
of the total exposure, respectively, based on median concentrations) (Figure 4.4). Similar
findings were observed for toddlers, for whom -DBE-DBCH, -DBE-DBCH, BDE 209 and
γ-HBCDD contributed to 20%, 14%, 26% and 11% of the total inhalation exposure,
respectively, based on median concentrations (Figure 4.5).
Tables 4.11, 4.12 and 4.13 show our estimates of exposure of UK adults and toddlers to
different classes of FRs via dust ingestion. Estimates of “typical” human exposure for
toddlers (i.e. dust contaminated at the median concentration ingested at the mean dust
ingestion rate) to ∑EFRs, ∑PBDEs and ∑HBCDDs were 38, 280 and 25 ng/day, respectively.
For adults, estimates of human exposure under a “typical” exposure scenario to ∑EFRs,
∑PBDEs and ∑HBCDDs were 27, 100 and 15 ng/day, respectively. Harrad et al. (2008a)
reported ”typical” exposure of toddlers and adults to ∑PBDEs to be 234.3 and 612.6 ng/day
respectively, which in both instances exceeds our exposure estimates. A previous report of
estimated exposure to ∑HBCDDs via dust ingestion under a “typical” exposure scenario put
such exposure at 86.9 and 32.5 ng/day for toddlers and adults respectively. This exceeds
slightly the estimates reported in this study. For EFRs, our estimates of “typical” exposure via
dust ingestion exceed substantially those reported in a previous study (Ali et al., 2011a)
(Table 4.12).
Under an exposure scenario assuming mean dust ingestion rates and median concentrations of
both air and dust, dust ingestion is a more significant contributor to human exposure to
∑EFRs, ∑PBDEs and ∑HBCDDs (shown in Table 4.14) when compared with air inhalation,
which is similar to the findings reported by the previous studies for PBDEs and HBCDDs
(Abdallah et al., 2008; Harrad et al., 2006). For individual FRs, air inhalation contributes
more to UK adults’ estimated exposure than dust ingestion for target compounds with

138
relatively higher vapour pressures such as DBE-DBCH, PBBz, TBX, PBEB, and BDE 28 in
both mean and high dust ingestion scenarios. For toddlers’ intake of FRs, dust ingestion was
the main route for all target compounds. BDE 209 showed the highest estimated exposures of
FRs for adults through dust ingestion (contributing to 70% of the total exposure based on
media concentration of FRs) followed by PA-BDBPE (contributing to 10% of the total
exposure based on media concentration of FRs) (Figure 4.6). Similar observations were found
for toddlers, BDE 209 and PA-BDBPE contributed to 81% and 7% of the total exposure,
respectively (Figure 4.7).

139
Table 4.8 Summary of estimates of exposure (ng/day) of UK Adults and Toddlers to EFRs via air
-DBE
-DBCH
-DBE-
DBCH TBX PBBz TBCT PBT PBEB TBP-DBPE HBB EH-TBB BTBPE BEH-TEBP
syn-
DDC-CO
anti-
DDC-CO TBBPA-BDBPE DBDPE ∑ EFRs
Toddlers
5th percentile 0.075 0.057 0.015 0.0027 0.00019 0.011 0.0018 0.0018 0.00038 0.00053 0.0019 0.0014 0.0038 0.0023 0.019 0.019 0.21
95th percentile 0.97 0.80 0.45 0.054 0.32 0.18 0.014 0.040 0.14 0.064 0.16 0.15 0.0079 0.031 0.22 0.33 3.9
Mean 0.38 0.28 0.12 0.025 0.084 0.066 0.0062 0.013 0.040 0.018 0.042 0.038 0.0047 0.0083 0.051 0.099 1.3
Median 0.24 0.17 0.037 0.02 0.038 0.042 0.0050 0.0075 0.016 0.0075 0.019 0.0080 0.0038 0.0023 0.019 0.019 0.66
Minimum 0.066 0.05 0.0059 0.00019 0.00019 0.0086 0.0015 0.00076 0.00038 0.00019 0.0019 0.00019 0.0038 0.0023 0.019 0.019 0.18
Maximum 1.3 0.94 0.74 0.083 0.93 0.24 0.021 0.055 0.35 0.17 0.19 0.48 0.017 0.076 0.33 0.37 6.3
Geometric mean 0.26 0.19 0.052 0.016 0.0059 0.044 0.005 0.0077 0.0088 0.0065 0.016 0.0071 0.0042 0.0035 0.028 0.048 0.70
Adults
5th percentile 0.65 0.48 0.078 0.03 0.001 0.047 0.0091 0.0082 0.002 0.0056 0.011 0.0059 0.02 0.012 0.1 0.1 1.6
95th percentile 5.8 4.4 2 0.4 1.4 0.89 0.13 0.4 0.85 0.6 1.1 0.66 0.038 0.14 0.93 1.4 21
Mean 2.3 1.7 0.56 0.17 0.36 0.34 0.043 0.13 0.25 0.17 0.31 0.17 0.025 0.042 0.24 0.44 7.3
Median 1.7 1.2 0.21 0.13 0.16 0.2 0.028 0.039 0.11 0.053 0.13 0.039 0.02 0.012 0.1 0.1 4.3
Minimum 0.58 0.38 0.036 0.014 0.001 0.036 0.0077 0.004 0.002 0.0036 0.011 0.001 0.02 0.012 0.1 0.1 1.3
Maximum 7.4 5.2 3.2 0.55 3.9 1.8 0.23 1.4 2.2 1.7 1.7 2 0.1 0.42 1.6 1.8 35
Geometric mean 1.8 1.3 0.27 0.11 0.025 0.19 0.029 0.041 0.058 0.054 0.1 0.033 0.022 0.018 0.14 0.22 4.4

140
Table 4.9 Summary of estimates of exposure (ng/day) of UK Adults and Toddlers to PBDEs via air
BDE 28 BDE 47 BDE 100 BDE 99 BDE 154 BDE 153 BDE 183 BDE 209 ∑PBDEs
Toddlers
5th percentile 0.0022 0.027 0.00019 0.0059 0.00095 0.00076 0.0019 0.09 0.13
95th percentile 0.39 2.1 0.54 1.5 0.089 0.26 0.015 3.2 8.0
Mean 0.091 0.48 0.12 0.34 0.021 0.039 0.0046 0.94 2.0
Median 0.0055 0.058 0.0052 0.039 0.0018 0.0041 0.0019 0.32 0.43
Minimum 0.0019 0.021 0.00019 0.00048 0.00095 0.00076 0.0019 0.066 0.094
Maximum 1.3 6.2 1.6 4.3 0.27 0.28 0.016 5.1 19
Geometric mean 0.0066 0.076 0.0054 0.043 0.0027 0.0048 0.003 0.41 0.55
Adults
5th percentile 0.013 0.12 0.001 0.032 0.005 0.0039 0.01 0.41 0.6
95th percentile 1.7 9.8 2.3 6.2 0.38 1.1 0.068 14 35
Mean 0.4 2.2 0.51 1.5 0.089 0.16 0.021 4.2 9.0
Median 0.035 0.31 0.027 0.19 0.0086 0.018 0.01 1.4 2.0
Minimum 0.012 0.098 0.001 0.0076 0.005 0.0039 0.01 0.31 0.45
Maximum 5.4 28 6.9 18 1.1 1.2 0.073 23 83
Geometric mean 0.042 0.38 0.026 0.21 0.013 0.022 0.015 1.8 2.5
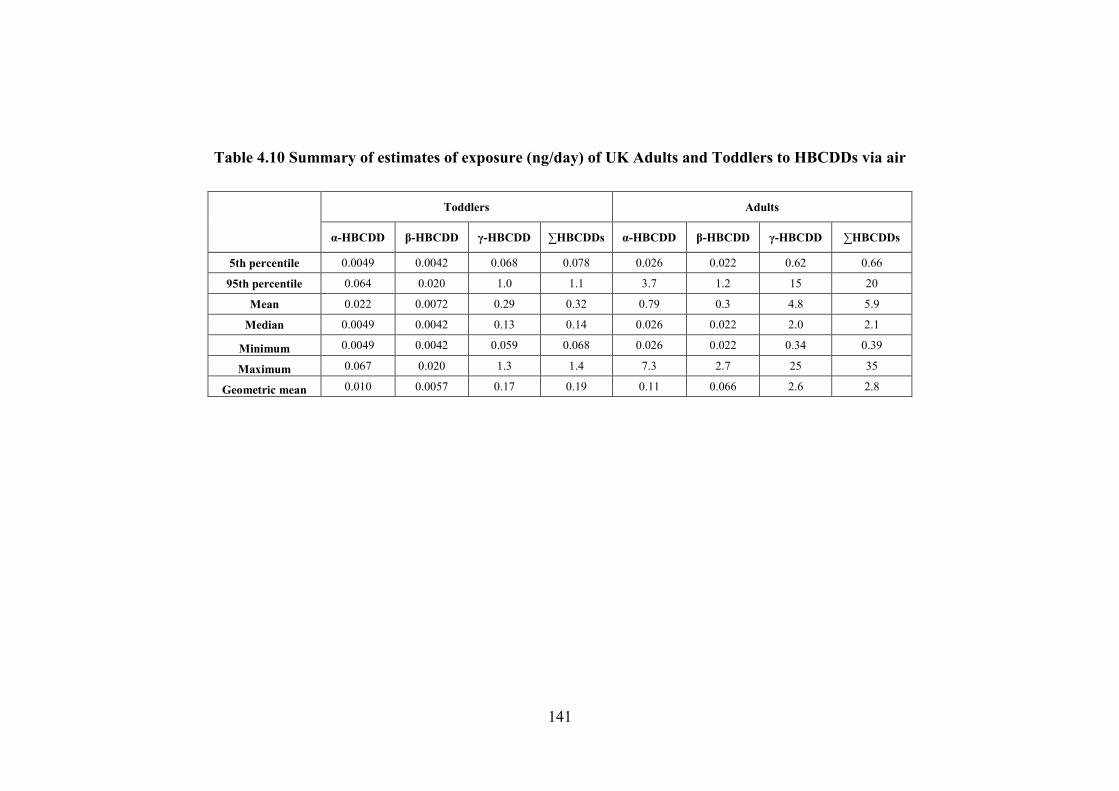
141
Table 4.10 Summary of estimates of exposure (ng/day) of UK Adults and Toddlers to HBCDDs via air
Toddlers Adults
α-HBCDD β-HBCDD γ-HBCDD ∑HBCDDs α-HBCDD β-HBCDD γ-HBCDD ∑HBCDDs
5th percentile 0.0049 0.0042 0.068 0.078 0.026 0.022 0.62 0.66
95th percentile 0.064 0.020 1.0 1.1 3.7 1.2 15 20
Mean 0.022 0.0072 0.29 0.32 0.79 0.3 4.8 5.9
Median 0.0049 0.0042 0.13 0.14 0.026 0.022 2.0 2.1
Minimum 0.0049 0.0042 0.059 0.068 0.026 0.022 0.34 0.39
Maximum 0.067 0.020 1.3 1.4 7.3 2.7 25 35
Geometric mean 0.010 0.0057 0.17 0.19 0.11 0.066 2.6 2.8

142
Figure 4.4 Contributions to estimated exposure of UK adults via air inhalation of different FRs
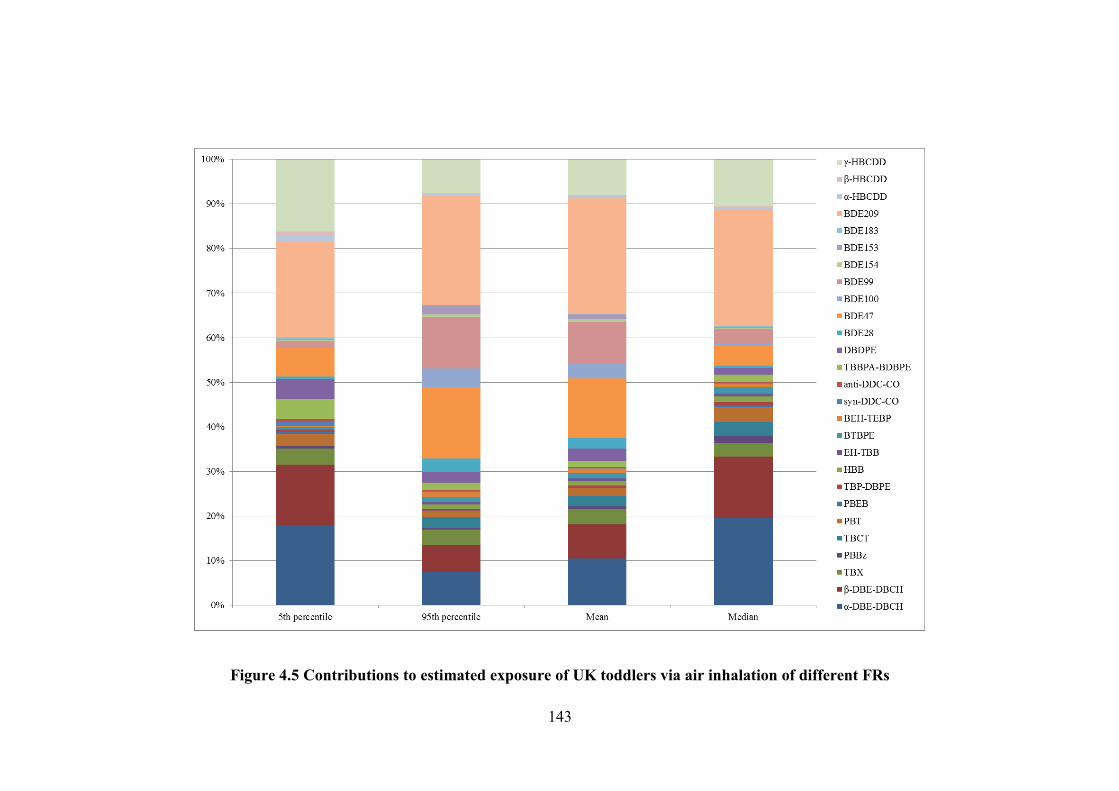
143
Figure 4.5 Contributions to estimated exposure of UK toddlers via air inhalation of different FRs

144
Table 4.11 Summary of estimates of exposure (ng/day) of UK Adults and Toddlers to EFRs via dust
-DBE
-DBCH
-DBE-
DBCH TBX PBBz TBCT PBT PBEB TBP-DBPE HBB EH-TBB BTBPE BEH-TEBP
syn-
DDC-CO
anti-
DDC-CO TBBPA-BDBPE DBDPE ∑ EFRs
Toddlers
Mean dust ingestion
5th percentile 0.11 0.12 0.0015 0.0005 0.20 0.056 0.0055 0.0015 0.001 0.001 0.16 1.4 0.005 0.004 9.8 0.60 12
95th percentile 1.7 2.6 1.2 0.44 11 0.7 0.18 1.5 0.48 3.7 4.3 75 0.85 7.5 440 83 640
Mean 0.57 0.77 0.26 0.17 2.8 0.23 0.05 0.32 0.14 0.94 1.0 19 0.28 1.8 94 22 140
Median 0.31 0.44 0.065 0.11 0.42 0.15 0.017 0.058 0.083 0.35 0.31 4.7 0.014 0.46 23 7.8 38
Minimum 0.072 0.077 0.0015 0.0005 0.2 0.034 0.00050 0.0015 0.0010 0.0010 0.16 0.92 0.005 0.004 3.5 0.6 5.6
Maximum 2.6 3.8 1.9 0.61 15 0.88 0.23 1.9 0.61 3.7 5.4 170 1.4 8.4 600 110 940
Geometric mean 0.35 0.39 0.06 0.068 0.63 0.15 0.021 0.068 0.018 0.19 0.51 6.0 0.043 0.33 34 6.5 49
High dust ingestion
5th percentile 0.45 0.47 0.006 0.002 0.81 0.22 0.022 0.006 0.004 0.004 0.66 5.5 0.02 0.016 39 2.4 50
95th percentile 6.8 10 5.0 1.8 45 2.8 0.73 6.2 1.9 15 17 300 3.4 30 1800 330 2500
Mean 2.3 3.1 1.0 0.66 11 0.91 0.2 1.3 0.55 3.8 4.1 76 1.1 7.2 380 86 580
Median 1.3 1.8 0.26 0.45 1.7 0.58 0.067 0.23 0.33 1.4 1.2 19 0.056 1.8 90 31 150
Minimum 0.29 0.31 0.006 0.002 0.79 0.14 0.002 0.006 0.004 0.004 0.63 3.7 0.02 0.016 14 2.4 22
Maximum 10 15 7.5 2.4 59 3.5 0.94 7.5 2.4 15 22 690 5.5 34 2400 460 3800
Geometric mean 1.4 1.6 0.24 0.27 2.5 0.6 0.086 0.27 0.07 0.77 2.1 24 0.17 1.3 140 26 200
Adults
Mean dust ingestion
5th percentile 0.061 0.058 0.0028 0.0083 0.073 0.023 0.0037 0.0061 0.014 0.041 0.13 0.85 0.02 0.062 5.2 1.5 8
95th percentile 0.69 0.94 0.41 0.17 3.6 0.25 0.07 0.56 0.3 3.8 99 50 0.76 5.0 170 95 440

145
Mean 0.26 0.30 0.091 0.067 0.91 0.092 0.022 0.12 0.11 0.97 21 14 0.24 1.5 42 20 100
Median 0.16 0.18 0.027 0.047 0.16 0.054 0.009 0.031 0.07 0.19 1.5 2.6 0.058 0.52 15 6.5 27
Minimum 0.038 0.036 0.0026 0.0073 0.070 0.015 0.0017 0.0052 0.00040 0.0004 0.097 0.65 0.019 0.034 2.4 1.4 4.8
Maximum 1.0 1.4 0.62 0.23 4.8 0.53 0.11 0.75 0.49 9.4 130 160 1.4 7.7 230 110 660
Geometric mean 0.17 0.17 0.025 0.035 0.22 0.057 0.011 0.037 0.042 0.17 2.3 3.4 0.087 0.50 19 7.6 34
High dust ingestion
5th percentile 0.15 0.15 0.007 0.021 0.18 0.057 0.0093 0.015 0.035 0.10 0.33 2.1 0.051 0.16 13 3.7 20
95th percentile 1.7 2.4 1.0 0.42 9.1 0.63 0.17 1.4 0.76 9.6 250 120 1.9 13 440 240 1100
Mean 0.64 0.75 0.23 0.17 2.3 0.23 0.054 0.31 0.26 2.4 54 35 0.60 3.8 100 50 250
Median 0.39 0.46 0.068 0.12 0.39 0.14 0.022 0.078 0.18 0.48 3.8 6.4 0.15 1.3 37 16 67
Minimum 0.094 0.09 0.0066 0.018 0.17 0.037 0.0042 0.013 0.001 0.001 0.24 1.6 0.047 0.084 6.0 3.5 12
Maximum 2.6 3.5 1.6 0.56 12 1.3 0.27 1.9 1.2 24 330 400 3.5 19 580 270 1600
Geometric mean 0.43 0.43 0.064 0.087 0.56 0.14 0.028 0.093 0.10 0.43 5.7 8.6 0.22 1.3 47 19 84
Table 4.12 Summary of estimates of exposure (ng/day) of UK Adults and Toddlers to PBDEs via dust
BDE 28 BDE 47 BDE 100 BDE 99 BDE 154 BDE 153 BDE 183 BDE 209 ∑PBDEs
Toddlers
Mean dust ingestion
5th percentile 0.00050 0.29 0.074 0.58 0.022 0.054 0.065 9.1 10
95th percentile 2.8 38 37 60 24 22 5.8 4700 4900
Mean 0.63 9.0 8.4 14 5.3 5.3 1.3 1200 1200
Median 0.023 0.84 0.19 1.4 0.08 0.67 0.17 270 280
Minimum 0.00050 0.26 0.062 0.41 0.022 0.037 0.062 8.2 9.1
Maximum 8.9 120 120 190 78 54 13 8200 8800
Geometric mean 0.019 0.99 0.29 2.0 0.14 0.8 0.28 230 230

146
High dust ingestion
5th percentile 0.002 1.1 0.29 2.3 0.089 0.22 0.26 36 41
95th percentile 11 150 150 240 94 89 23 19000 20000
Mean 2.5 36 34 57 21 21 5.2 4600 4800
Median 0.091 3.4 0.74 5.7 0.32 2.7 0.70 1100 1100
Minimum 0.002 1.0 0.25 1.6 0.088 0.15 0.25 33 36
Maximum 36 490 490 760 310 220 52 33000 35000
Geometric mean 0.076 4.0 1.1 7.9 0.57 3.2 1.1 920 940
Adults
Mean dust ingestion
5th percentile 0.0002 0.15 0.035 0.29 0.013 0.05 0.039 8.0 8.5
95th percentile 0.95 14 12 20 7.6 13 2.6 1600 1700
Mean 0.21 3.4 2.8 5.0 1.7 3.4 0.62 410 430
Median 0.012 0.5 0.11 0.82 0.054 0.49 0.11 100 100
Minimum 0.00020 0.14 0.031 0.23 0.010 0.031 0.030 6.5 6.9
Maximum 2.9 41 39 62 25 40 5.1 3000 3200
Geometric mean 0.010 0.58 0.15 0.96 0.070 0.59 0.17 91 93
High dust ingestion
5th percentile 0.00050 0.36 0.087 0.72 0.032 0.13 0.099 20 21
95th percentile 2.4 35 30 51 19 33 6.5 4000 4100
Mean 0.53 8.4 6.9 12 4.3 8.4 1.5 1000 1100
Median 0.03 1.3 0.28 2.1 0.13 1.2 0.27 250 260
Minimum 0.0005 0.34 0.077 0.58 0.026 0.077 0.076 16 17
Maximum 7.2 100 98 150 62 100 13 7600 8100
Geometric mean 0.026 1.4 0.36 2.4 0.18 1.5 0.43 230 230

147
Table 4.13 Summary of estimates of exposure (ng/day) of UK Adults and Toddlers to HBCDDs via dust
Toddlers Adults
Mean dust ingestion
α-HBCDD β-HBCDD γ-HBCDD ∑HBCDDs α-HBCDD β-HBCDD γ-HBCDD ∑HBCDDs
5th percentile 2.1 0.53 1.2 3.8 1.5 0.4 0.64 2.5
95th percentile 500 300 1100 1900 170 96 350 610
Mean 110 55 240 410 41 19 80 140
Median 16 4.3 4.6 25 9.2 2.7 3 15
Minimum 1.1 0.31 1.1 2.5 0.76 0.19 0.49 1.4
Maximum 1400 590 3500 5500 460 190 1100 1800
Geometric mean 17 5.4 8.2 31 8.8 2.7 4.1 16
High dust ingestion
α-HBCDD β-HBCDD γ-HBCDD ∑HBCDDs α-HBCDD β-HBCDD γ-HBCDD ∑HBCDDs
5th percentile 8.4 2.1 4.7 15 3.7 0.99 1.6 6.3
95th percentile 2000 1200 4300 7500 420 240 870 1500
Mean 460 220 980 1700 100 46 200 350
Median 65 17 19 100 23 6.8 7.4 37
Minimum 4.2 1.2 4.6 10 1.9 0.48 1.2 3.6
Maximum 5700 2400 14000 22000 1100 470 2800 4400
Geometric mean 69 22 33 120 22 6.8 10 39

148
Figure 4.6 Contributions to human exposure of UK adults via dust ingestion from different FRs

149
Figure 4.7 Contributions to human exposure of UK toddlers via dust ingestion from different FRs

150
Table 4.14 Estimates of exposure (ng/day) of UK Adults and Toddlers to FRs via air and dust, and relative significance (%) of each
pathway under typical exposure scenario a
Compounds
Intake (ng/day) Percent contribution of exposure pathway
to total exposure (%)
Toddlers Adults Toddlers Adults
Air Dust Air Dust Air Dust Air Dust
∑tri-hepta BDEs 0.11 10 0.6 2.1 1.1% 99% 22% 78%
BDE 209 0.32 270 1.4 100 0.1% 100% 1.4% 99%
∑HBCDDs 0.14 25 2.1 15 0.6% 99% 12% 88%
∑ EFRs 0.66 38 4.3 27 1.7% 98% 14% 86%
α-DBE-DBCH 0.24 0.31 1.7 0.16 44% 56% 91% 9%
β-DBE-DBCH 0.17 0.44 1.2 0.18 28% 72% 87% 13%
TBX 0.037 0.065 0.21 0.027 36% 64% 89% 11%
PBBz 0.02 0.11 0.13 0.047 15% 85% 73% 27%
TBCT 0.038 0.42 0.16 0.16 8.3% 92% 50% 50%
PBT 0.042 0.15 0.2 0.054 22% 78% 79% 21%
PBEB 0.005 0.017 0.028 0.009 23% 77% 76% 24%
TBP-DBPE 0.0075 0.058 0.039 0.031 11% 89% 56% 44%
HBB 0.016 0.083 0.11 0.07 16% 84% 61% 39%
EH-TBB 0.0075 0.35 0.053 0.19 2.1% 98% 22% 78%
BTBPE 0.019 0.31 0.13 1.5 5.8% 94% 8.0% 92%
BEH-TEBP 0.008 4.7 0.039 2.6 0.2% 100% 1.5% 99%
syn-DDC-CO 0.0038 0.014 0.02 0.058 21% 79% 26% 74%
anti-DDC-CO 0.0023 0.46 0.012 0.52 0.5% 100% 2.3% 98%
TBBPA-BDBPE 0.019 23 0.1 15 0.1% 100% 0.7% 99%
DBDPE 0.019 7.8 0.1 6.5 0.2% 100% 1.5% 98%
a) typical exposure scenario means assuming mean dust ingestion rates and median concentrations of both air and dust.

151
CHAPTER 5 EFRs, PBDEs and
HBCDDs in UK food samples

152
5.1 Synopsis
Food is considered as one of the main routes of human exposure to BFRs, including PBDEs
(Fromme et al., 2009; Harrad et al., 2006; Roosens et al., 2009b), HBCDD (Abdallah and
Harrad, 2011; Roosens et al., 2009a) and EFRs (Labunska et al., 2015). Because of recent
bans and restrictions on the use of “legacy” BFRs (Stockholm Convention, 2009; European
Court of Justice, 2008; UNEP, 2014), use of EFRs may increase as a result of the replacement
of “legacy” compounds. The occurrence of relatively high concentrations of EFRs in the
environment may also reflect rising use of EFRs (Ali et al., 2012a; Cequier et al., 2014;
Dodson et al., 2012; Hoh et al., 2005; Newton et al., 2015; Shoeib et al., 2012; Stapleton et
al., 2008). Furthermore, a few reports suggest that some EFRs are bioaccumulative. This
information includes: high log BAF values of DBDPE (6.1 - 7.1) in fish that are one order of
magnitude higher than those of BDE 209 (He et al., 2012), the long half-life and
biomagnification potential of BTBPE in juvenile rainbow trout (Tomy et al., 2007a), and a
reported high BCF value (2,153) for DBE-DBCH isomers, which have been identified as
having high persistence and environmental bioaccumulation potential in this study (Howard
and Muir, 2010). Therefore, the levels of EFRs in food may increase in the future. However,
very limited information on human dietary exposure to EFRs has been reported so far. Hence,
in this study, EFRs were measured in 14 groups of composite food samples covering meat,
liver, oily fish, eggs and cheese to provide a preliminary estimate of UK dietary exposure.
Additionally, concentrations of 8 PBDEs and 3 HBCDD diastereomers were measured in the
same samples to compare with those reported in previous UK studies. By so doing, it is
possible to evaluate the efficacy of regulations and restrictions designed to reduce human
dietary exposure.

153
5.2 Concentrations and patterns of HFRs in food
5.2.1 EFRs
Food samples were collected from three markets in Birmingham, UK from May to June 2015
(see section 2.3.3.1 for sampling details). Table 5.1 summarises the concentrations detected in
this study of EFRs in composite food samples collected in the UK. β-DBE-DBCH was
detected in all food samples, with α-DBE-DBCH and EH-TBB detected in 97% and 77% of
samples, respectively, while DBDPE was only detected in 33% of food samples. β-DBE-
DBCH was the predominant compound in food samples, accounting for 35%-94% of EFRs.
To the best of our knowledge, only one previous study has reported concentrations of DBE-
DBCH in food samples (fish, meat, vegetable oils, dairy products, and eggs) as part of a
Swedish market basket study (Sahlström et al., 2015). In that study, DBE-DBCH was only
found in four fish samples at levels (average 114 pg/g ww) lower than those in our study
(fish: 240-1820 pg/g ww). Moreover, α-DBE-DBCH was the dominant EFR (Sahlström et al.,
2015) in contrast to our study. The highest concentrations of EFRs in the current study were
detected in liver samples ranging from 42 to 93 ng/g lw, which exceeded those in meat (4.5-
14 ng/g lw). Labunska et al. (2015) reported similarly elevated levels in liver and meat
samples from chickens and ducks collected in an e-waste processing area in Eastern China for
most EFRs, including: EH-TBB, BEH-TEBP, and BTBPE (Table 5.2). Very limited studies
are available concerning the levels of EFRs in UK food samples. However, we are aware of
one previous study of a selection of UK and Irish food samples for analysis of HBB, DBDPE,
and BTBPE (Fernandes et al., 2010). HBB and DBDPE were not detected in any foods,
whilst BTBPE occurred in some UK food samples such as meat (0.05 - 1.76 ng/g lw), offal
(0.75 - 0.81 ng/g lw), fish (0.26 - 3.33 ng/g lw), and eggs (0.29 ng/g lw) (Fernandes et al.,
2010) which is comparable to the levels of BTBPE in our study (Table 5.2). Meanwhile,
Labunska et al. (2015) detected BTBPE, EH-TBB, BEH-TEBP and DBDPE in meat, fish,

154
liver and egg samples from an e-waste processing area (Taizhou City) and control sites
(Shanghai and Nanjing City) in South China at levels that exceed those in our study, with the
exception of DBDPE which was not detected (Table 5.2). Another study reported levels of
BTBPE and DBDPE in chicken eggs from an e-waste processing area, South China to also
exceed those in our study (Table 5.2) (Zheng et al., 2012). With respect to fish, BTBPE and
DBDPE were also detected in Canada (Law et al., 2006a), France (Munschy et al., 2011) and
China (He et al., 2012; Li et al., 2015; Shi et al., 2009) at levels comparable to those in fish
samples in our study (Table 5.2).
As mentioned earlier, β-DBE-DBCH was the dominant isomer detected in our study, with fβ-
DBE-DBCH in our food samples ranging from 1.20 to 220, with a median value of 7.3. Gauthier
et al. (2008) also found -DBE-DBCH to be the predominant isomer in herring gull egg
pools. Furthermore, the isomer profile of DBE-DBCH in the blubber of Canadian arctic
beluga whale was also largely dominated by β-DBE-DBCH (Tomy et al., 2008b).
Interestingly, the fβ-DBE-DBCH values in our food samples exceed significantly those detected in
UK indoor dust (0.32-2.88) (t-test on log-transformed concentrations, p < 0.01), indoor air
(0.53 to 1.0) (t-test on log-transformed concentrations, p < 0.01) and the commercial product
(1.0), suggesting diastereomer-specific environmental degradation/metabolism and/or
isomerisation in the food chain. Interestingly, the median value of fβ-DBE-DBCH in liver (80) in
this study was substantially higher than those found in meat (5.9), fish (6.1, tuna not
included), eggs (7.1), and cheese (2.1). Moreover, the levels of DBE-DBCH were higher in
liver than in other food samples studied except tuna, with the fβ-DBE-DBCH value in tuna
(median value: 83) exceeding those in other fish samples. These findings indicate that the
uptake and metabolism of DBE-DBCH isomers is species- and organism-dependent.

155
Table 5.1 Average concentrations of EFRs in composite food samples from Birmingham, UK (ng/g lw)
Number of
composite
samples
Lipid weight
(%)
Water content
(%) α-DBE-DBCH β-DBE-DBCH EH-TBB BTBPE BEH-TEBP DBDPE ∑EFRs
DF -- -- 97% 100% 77% 60% 63% 33% --
Meat
Beef 3 8.0 67 0.89 1.9 0.20 <0.04 0.44 <1.1 4.5
Lamb 3 8.0 68 0.62 6.2 0.19 <0.05 0.28 3.5 11
Pork 3 8.0 66 0.95 4.1 1.4 2.4 0.20 4.6 14
Chicken 3 5.0 73 0.58 7.6 0.36 1.3 0.57 <1.5 11
Liver
Beef liver 2 4.0 64 1.6 49 1.6 <0.06 0.69 4.5 57
Lamb liver 2 5.0 65 <0.26 55 0.19 0.35 0.94 7.6 65
Pork liver 1 5.0 69 1.1 85 0.63 0.24 5.0 1.5 93
Chicken liver 1 4.0 73 0.72 34 0.66 0.14 5.8 <1.6 42
Fish
Salmon 3 9.0 65 1.3 4.4 0.32 <0.04 <0.1 6.6 13
Mackerel 2 20 49 1.1 4.9 0.22 0.17 <0.2 <0.63 7.0
Tuna 2 2.0 75 0.48 39 0.38 0.78 0.42 21 62
Trout 2 10 67 0.60 4.6 0.43 0.16 1.1 <0.88 7.4
Egg and dairy products
Cheese 2 18 46 0.44 0.99 0.11 0.20 0.22 <0.74 2.3
Egg 1 11 51 0.42 3.0 0.10 0.18 1.8 <1.2 6.1
156
Table 5.2 Average concentrations of EFRs (ng/g lw) in biota samples from different countries.
Samples α-DBE-
DBCH
β-DBE-
DBCH EH-TBB BTBPE BEH-TEBP DBDPE Location References
Meat
Meat 0.58-0.95 1.9-7.6 0.19-1.4 <0.04-2.4 0.20-0.57 <1.1-4.6 UK This study
Beef 0.56 <0.06c
UK (Fernandes et al., 2010) Pork 0.55 <0.06
c
Lamb 0.05 <0.06 c
Turkey 1.76 <0.06 c
Chicken 2.66 <0.35 1.78 <0.45 Shanghai and Nanjing City,
China
(Labunska et al., 2015)
Duck 2.74 1.87 <0.25 <0.45
Pork 2.14 2.69 1.37 <0.45
Chicken 24.7 1.46 8.97 <0.45
E-waste area, South China Duck 24.2 4.57 7.23 <0.45
Pork 38.2 5.4 12.4 <0.45
Meat a 100 Shandong Province, North China (Li et al., 2015)
Liver
Liver <0.26-1.6 34-85 0.19-1.6 <0.06-0.35 0.69-5.8 <1.6-7.6 UK This study
Pork liver 0.81 <0.06 c
UK (Fernandes et al., 2010) Chicken liver 0.75 <0.06
c
Chicken liver 5 3.38 2.61 <0.45 Shanghai and Nanjing City, China
(Labunska et al., 2015) Duck liver 8.2 3.27 1.69 <0.45
Chicken liver 35 15 10.6 <0.45 E-waste area, South China
Duck liver 38.4 11.7 13.7 <0.45
Fish
Fish 0.48-1.3 4.4-39 0.22-0.43 <0.04-0.78 <0.1-1.1 <0.63-21 UK This study
Fish 4 2.1 1.9 <0.45 Shanghai and Nanjing City, China (Labunska et al., 2015)
Fish 24.7 1.46 8.97 <0.45 E-waste area, South China

157
Salmon 0.26 <0.06 c
UK (Fernandes et al., 2010)
Mackerel 0.3 <0.06 c
Herring 0.25 <0.06 c
Haddock 0.83 <0.06 c
Lemon Sole 3.33 <0.06 c
Whitebait 0.77 <0.06 c
Fish a 97 17 <14 1.1-3.6
b < 26 Sweden (Sahlström et al., 2015)
Fish <0.05-3.72 <0.1-
3.30 Lake Winnipeg (Law et al., 2006a)
Juvenile common
sole 0.08-0.31 0.28-1.13
Nursery zones situated along the
French coast (Munschy et al., 2011)
Fish <0.012-0.15 <3.8 E-waste area, South China (Shi et al., 2009)
Fish <4.9-230 Dongjiang River, South China (He et al., 2012)
Fish and seafood 121 Shandong Province, North China (Li et al., 2015)
Eggs
Egg 0.42 3.0 0.10 0.18 1.8 <1.2 UK This study
Chicken eggs 1.73 <0.35 <0.25 <0.45 Shanghai and Nanjing City, China
(Labunska et al.. 2015)
Chicken eggs 4.8 2.93 1.16 <0.45 E-waste area, South China
Duck eggs 1.21 <0.35 <0.25 <0.45 Shanghai and Nanjing City, China
Duck eggs 4.03 2.11 1.11 <0.45 E-waste area, South China
Free range organic
eggs 0.29 <0.06
c UK (Fernandes et al., 2010)
Chicken eggs 37.2-264 5.97-37.9 E-waste area, South China (Zheng et al., 2012)
a) the units are pg/g ww; b) mLOD – mLOQ; c) the units are ng/g ww.

158
5.2.2 PBDEs
Table 5.3 shows the average concentrations of PBDEs detected in composite food samples in
our study. Each of our target congeners was frequently detected with the DF exceeding 73%.
BDE 47 and BDE 99 were the major contributing congeners to ∑PBDEs in most of our
samples, which is similar to previous studies of food samples in Spain (Domingo et al.,
2008), the UK (Harrad et al., 2004) and the USA (Schecter et al., 2009). Of all the food
samples analysed in this study, fish showed the highest average concentrations of ∑PBDEs
either on a lipid weight basis (14 to 40 ng/g lw) or on a wet weight basis (400-2800 pg/g
ww). These values are in line with previous studies in the UK (UK Food Standards Agency,
2006; UK Food and Environment Research Agency, 2009), as well as in Belgium (Stefan
Voorspoels et al., 2007), Spain (Domingo et al., 2008), the Netherlands (Bakker et al., 2008),
and Sweden (Törnkvist et al., 2011; Sahlström et al., 2015) (Table 5.4). Average levels of
∑PBDEs in all food categories in the UK in this study exceeded those in the USA (Schecter
et al., 2009), Belgium (Stefan Voorspoels et al., 2007), Spain (Domingo et al., 2008), the
Netherlands (Bakker et al., 2008), Sweden (Törnkvist et al., 2011; Sahlström et al., 2015),
China (Su et al., 2012), and Romania (Dirtu and Covaci, 2010). The only exception was that
the levels of ∑PBDEs in our fish samples were comparable to those in the Netherlands
(Bakker et al., 2008) (Table 5.4). Interestingly, as shown in Table 5.4, the levels of ∑PBDEs
in this study are higher than those recorded in previous studies in the UK conducted in 2003-
2004 and 2006 (UK Food Standards Agency, 2006; UK Food and Environment Research
Agency, 2009). Moreover, the levels of PBDEs in fish from UK fresh water systems were
found to be extremely high (mean level: 20 ng/g ww; maximum level: 130 ng/g ww) recently
by Rose et al. (2015). However, in chapter 4, we showed evidence of a temporal decline in
concentrations of BDE 209 in office dust and of BDE 47, 99 and 154 in office air (data on
levels of BDE 209 in indoor air in previous UK studies are not available). This apparent

159
contradiction may be attributable to a gradual shift over time of PBDEs from the indoor to the
outdoor environment and thus our food supply (Harrad and Diamond, 2006). Furthermore, as
BDE 209 has been reported to debrominate to lower brominated PBDEs in both terrestrial
and aquatic biota (Gandhi et al., 2011; La Guardia et al., 2007; Letcher et al., 2014; Stapleton
et al., 2006; Tian et al., 2012; Van den Steen et al., 2007), it is plausible that the continuous
transfer from the indoor environment to outdoors and subsequent debromination of BDE 209
in biota, could drive temporal increases in levels of lower congener PBDEs in food samples.
This hypothesis was supported by the relatively high ratios of tri-hexa-BDEs/BDE 209 in
foodstuffs in this study compared to those in two previous studies (Figure. 5.1.) (UK Food
Standards Agency, 2006; UK Food and Environment Research Agency, 2009) even though
levels of BDE 209 in this study were comparable to those reported in two UK previous
studies (Table 5.4) (UK Food Standards Agency, 2006; UK Food and Environment Research
Agency, 2009).

160
Table 5.3 Average concentrations (pg/g ww in parentheses) of PBDEs in composite food samples from Birmingham, UK (ng/g lw)
Average
Lipid
weight
(%)
Average
Water
content
(%)
BDE 28 BDE 47 BDE 100 BDE 99 BDE 154 BDE 153 BDE 209 ∑tri-hexa BDEs ∑PBDEs
DF -- -- 73% 93% 90% 100% 83% 100% 97% -- --
Meat
Beef 7.6 67 0.32 (23) 5.5 (360) 1.2 (73) 7.2 (470) 0.42 (27) 0.6 (38) 0.46 (32) 15 (990) 16 (1000)
Lamb 8.0 68 0.082 (7.5) 0.5 (45) 0.48 (36) 0.76 (65) 0.10 (8.3) 0.17 (15) 0.28 (21) 2.1 (177) 2.4 (200)
Pork 8.0 66 0.35 (15) 7.4 (290) 2.0 (82) 9.6 (370) 0.66 (25) 0.88 (33) 0.42 (24) 21 (810) 21 (830)
Chicken 4.6 73 <0.06 (<5.0) 3.5 (160) 1.0 (44) 5.6 (250) 0.43 (19) 0.54 (24) 0.63 (28) 11 (500) 12 (520)
Liver
Beef liver 4.0 64 0.62 (24) 6.5 (250) 2.0 (76) 20 (760) 1.1 (41) 1.4 (53) 3.3 (120) 32 (1200) 35 (1300)
Lamb liver 5.3 65 <0.18 (<7.8) 0.034 (1.8) 3.9 (160) 0.70 (30) 0.33 (17) 0.41 (21) 0.43 (23) 5.5 (240) 5.9 (260)
Pork liver 4.7 69 0.33 (19) 2.0 (82) 0.17 (5.5) 1.7 (63) 0.14 (6.8) 0.34 (20) 0.51 (23) 4.7 (200) 5.3 (220)
Chicken liver 4.6 73 0.12 (5.5) 1.3 (59) 0.069 (3.0) 1.4 (61) 0.16 (7.2) 0.19 (8.7) 0.47 (21) 3.2 (150) 3.7(170)
Fish
Salmon 9.1 65 0.8 (61) 17 (1100) 3.9 (230) 15 (720) 1.5 (94) 1.4 (73) 0.69 (41) 40 (2300) 40 (2300)
Mackerel 24 49 0.63 (130) 5.9 (1200) 1.2 (250) 3.8 (770) 1.0 (210) 0.39 (80) 0.74 (150) 13 (2600) 14 (2800)
Tuna 2.0 75 0.43 (8.9) 6.0 (130) 2.6 (54) 3.7 (80) 2.6 (59) 1.2 (26) 1.7 (39) 16 (360) 18 (400)
Trout 9.2 67 0.76 (71) 12 (950) 2.5 (190) 8.6 (550) 2.0 (150) 1.6 (120) 0.34 (32) 27 (2000) 28 (2100)
Egg and dairy product
Cheese 18 46 0.068 (12) 1.9 (340) 0.59 (100) 2.2 (390) 0.12 (21) 0.14 (26) 0.21 (37) 5.1 (900) 5.3 (940)
Egg 11 51 <0.04 (<4.9) 0.19 (20) 0.13 (14) 0.3 (32) 1.2 (130) <0.04 (<4.9) 0.53 (56) 1.9 (200) 2.4 (250)
161
Table 5.4 Average concentrations of ∑PBDEs (pg/g ww) in food samples from different countries (median concentrations in parentheses).
Food category Sampling
Year Country References
Meat Liver Fish Cheese Egg
∑PBDEs BDE
209 ∑PBDEs
BDE
209 ∑PBDEs
BDE
209 ∑PBDEs
BDE
209 ∑PBDEs
BDE
209
640
(13) a
26
(0.45) a
410
(10) a
40
(0.94) a
1900
(27) a
63
(0.86) a
940
(5.3) a
37
(0.21) a
250
(2.4) a
56
(0.53) a
2015 UK This study
322 260 102 40 608 90 NA NA 143 80 2003-2004 UK (UK Food Standards Agency,
2006)
1.0 a 0.66
a 1.4
a 1.0
a 17
a 0.34
a 0.77
a 0.30
a 2.4
a 0.57
a 2006 UK
(UK Food and Environment
Research Agency, 2009)
NA NA NA NA 20000 NA NA NA NA NA 2014 UK (Rose et al., 2015)
80.2 -- -- -- 32.7 -- 117.15 -- 89.3 -- 2009 USA (Schecter et al., 2009)
70 -- -- -- 460 -- 120 -- 100 -- 2005 Belgium (Stefan Voorspoels et al.,
2007)
49.9 -- -- -- 563.9 -- 121.5 -- 94.8 -- 2006 Spain b
(Domingo et al., 2008)
50 -- -- -- 1460 -- 166 -- 71 -- 2003-2004 Netherlands
b (Bakker et al., 2008)
41 -- -- -- 422 -- -- -- 26 -- 2005 Sweden b
(Törnkvist et al., 2011)
17 4.6 -- -- 332 <3.6 10 5.3 17 13 2010 Sweden d (Sahlström et al., 2015)
-- -- -- 180 -- -- -- 181 -- 2006 China (Su et al., 2012)

162
120 -- -- -- -- -- 130 -- 30 -- 2007 Romania c
(Dirtu and Covaci, 2010)
a) lipid basis; b): BDE 209 was not measured; c) median concentrations of ∑PBDEs; d): dairy products; NA: not available.

163
Figure 5.1 Relative contributions of tri-hexa-BDEs and BDE 209 to ∑PBDEs in UK food
samples in this study and two previous studies
5.2.3 HBCDDs
Concentrations of HBCDDs in the food samples analysed in this study are shown in Table
5.5. The highest average concentrations of ∑HBCDD were found in fish (3.6-16 ng/g lw),
followed by liver (<0.48-20 ng/g lw), meat (0.32-4.6 ng/g lw), and egg and dairy products
(<0.24-1.3 ng/g lw). These levels were comparable to those found in the literature, with fish
showing higher concentrations of ∑HBCDDs than other food categories (Eljarrat et al., 2014;
Goscinny et al., 2011; Schecter et al., 2009; Shi et al., 2009; Törnkvist et al., 2011; Sahlström
et al., 2015). Moreover, concentrations of HBCDD (<0.48-20 ng/g lw; <22-830 pg/g ww) in
food samples in this study were comparable to those detected in similar foodstuffs in two UK
previous studies (<LOD-300 pg/g ww (Driffield et al., 2008); 65-680 pg/g ww (UK Food
Standards Agency, 2006)) as well as those in other countries including: Romania (40-250

164
pg/g ww) (Dirtu and Covaci, 2010), Sweden (5.0-630 pg/g ww (Törnkvist et al., 2011) and
2.9-208 pg/g ww (Sahlström et al., 2015)), Belgium (<10-350 pg/g ww) (Roosens et al.,
2009a), and the USA (nd-593 pg/g ww) (Schecter et al., 2009) but higher than those in China
(<LOD-9.2 ng/g lw) (Shi et al., 2009). Generally, α-HBCDD was the dominant diastereomer
contributing on average 57±22% ∑HBCDDs in all food samples, in line with previous studies
in biota (Covaci et al., 2006; Labunska et al., 2015). The -HBCDD diastereomer is more
prevalent in liver samples than the other food categories, accounting for 34%-53% of
∑HBCDDs in line with previous studies (Labunska et al., 2015; Tao et al., 2016) of avian
samples, which suggested that this pattern arises as the liver is the first organ exposed
following the gastrointestinal tract and thus reflects more closely the pattern of contamination
sources such as dust, soil and air.
Table 5.5 Average concentrations (pg/g ww in parentheses) of HBCDDs in composite
food samples from Birmingham, UK (ng/g lw)
-HBCDD -HBCDD -HBCDD ∑HBCDDs
DF 83% 70% 73%
Meat
Beef 1.6 (100) 0.44 (28) 0.62 (40) 2.7 (170)
Lamb 0.22 (15) <0.12 (<16) <0.08 (<5.5) 0.32 (26)
Pork 2.6 (120) 0.84 (34) 1.2 (53) 4.6 (200)
Chicken 2.3 (100) 0.91 (40) 1.3 (56) 4.5 (200)
Liver
Beef liver 7.0 (260) 2.2 (83) 11 (400) 20 (740)
Lamb liver 0.48 (32) 0.26 (17) 0.6 (41) 1.3 (90)
Pork liver 3.3 (110) 0.89 (30) 3.7 (120) 7.9 (270)
Chicken liver <0.18 (<8.0) <0.18 (<8.0) <0.12 (<5.4) <0.48 (<22)
Fish
Salmon 7.3 (490) 2.9 (220) 1.7 (120) 12 (830)
Mackerel 2.4 (490) 0.2 (40) 1.0 (210) 3.6 (740)
Tuna 12 (110) 2.2 (50) 1.8 (18) 16 (180)
Trout 6.0 (350) 1.2 (72) 1.6 (90) 8.8 (510)
Egg and dairy products
Cheese <0.089 (<7.8) <0.089 (<8.0) <0.059 (<5.4) <0.24 (<43)
Egg 0.78 (190) 0.28 (68) 0.19 (45) 1.3 (300)

165
5.2.4 Relative abundance of different classes of FRs
As shown in Figure 5.2, PBDEs were the predominant FR class found in meat, fish, and egg
and dairy products, contributing 44%, 46% and 52% of FRs, respectively. In contrast, EFRs
were more prevalent in liver samples, accounting for 81% of ∑FRs. This suggests the
mechanisms of uptake, metabolism and excretion of different chemicals varies between food
groups, and requires more detailed study. Furthermore, the relatively high levels of EFRs
found in our food samples requires attention given their propensity for bioaccumulation,
long-range transport and toxicity (Bearr et al., 2010; Howard and Muir, 2010; Larsson et al.,
2006; Mankidy et al., 2014; Pradhan et al., 2013; Wang et al., 2010; Harju et al., 2009).
Figure 5.2 Relative contributions of EFRs, PBDEs and HBCDDs to FRs in UK food
samples
5.3 Estimation of daily dietary intakes
Estimated dietary intakes of FRs were calculated for toddlers and adults based on nutrient
0%
10%
20%
30%
40%
50%
60%
70%
80%
90%
100%
Meat Liver Fish Egg and dairy
products
∑HBCDDs
∑PBDEs
∑EFRs

166
Table 5.6 Average (standard deviation in parentheses) quantities of food consumed by
UK toddlers and adults (g/day) (Food Standards Agency, 2014)
Toddlers a Adults
b
Beef 17 (28) 48 (71)
Lamb 4 .1 (15) 12 (39)
Pork 3.1 (13) 11 (32)
Chicken 14 (21) 61 (77)
Beef liver 0.04 (0.44) 0.34 (2.3)
Lamb liver 0.04 (0.44) 0.34 (2.3)
Pork liver 0.04 (0.44) 0.34 (2.3)
Chicken liver 0.04 (0.44) 0.34 (2.3)
Salmon 0.58 (3.8) 2.7 (7.7)
Mackerel 0.58 (3.8) 2.7 (7.7)
Tuna 0.58 (3.8) 2.7 (7.7)
Trout 0.58 (3.8) 2.7 (7.7)
Cheese 8.6 (9.4) 15 (19)
Egg 8.5 (14) 20 (38)
a) derived from data of food consumption for age group (1.5-3 years old); b) . derived from data
of food consumption for age group (19-64 years old).
intake data from the latest national diet and nutrition survey report published by Public
Health England and the Food Standards Agency (2014) for different ages (Table 5.6).
Consumption rates for each liver (four groups) and each oily fish (four groups) category were
derived from the total liver and oily fish consumptions in the survey report divided by 4
(Food Standards Agency, 2014). The weight of each egg used for calculating daily intakes of
FRs via egg consumption was corrected for the corresponding eggshell weight and
concentrations on a whole egg basis as reported in one previous study (Labunska et al.,

167
2013). Dietary intakes were calculated by multiplying food consumption rates for both
average (“typical”) and high-end consumers (the latter assumed to be those consuming the
average consumption rate + 2 standard deviations) by average concentrations. It is notable
that raw food samples were analysed in our study as preparation and cooking may affect the
concentrations of chemicals (Perelló et al., 2009). Total dietary exposures to EFRs, PBDEs,
and HBCDDs are compared in Figure 5.3.
Figure 5.3 Estimated average dietary exposures to EFRs, PBDEs, and HBCDDs
5.3.1 EFRs
The estimated mean dietary intakes of ∑EFRs in the UK were 26 and 89 ng/day for toddlers
and adults, respectively (Table 5.7). Estimated high-end daily ∑EFRs intakes via diet were
one order of magnitude higher than the mean dietary intakes for toddlers and adults (Table
5.7). The main contributor to human dietary exposure to ∑EFRs was meat, followed by fish
for both toddlers and adults (Figure 5.4). This is the first report of dietary exposure to EFRs
in the UK. Furthermore, very limited information on human dietary exposure to EFRs has
been reported anywhere to date. Labunska et al. (2015) investigated human dietary exposure
to EFRs arising through consumption of foodstuffs from an e-waste recycling area in
0
20
40
60
80
100
120
∑EFRs ∑PBDEs ∑HBCDDs
Exp
osu
re,
ng
/da
y
Toddlers
Adults

168
Table 5.7 Estimated average and high-end a intakes of ∑EFRs (ng/day) via consumption
of food for UK adults and toddlers
Toddlers Adults
Average consumer High-end consumer Average consumer High-end consumer
Meat 18 100 64 294
Liver 0.42 10 3.8 56
Fish 2.4 34 11 76
Cheese 3.6 11 6.3 22
Egg 1.7 7.3 4.0 19
Total 26 162 89 467
a) estimates of high end intakes were derived from food consumption figures in Table 5.6 by
assuming that a high-end consumer of each food group consume the average quantities of
food consumed + 2 × standard deviations (SD). This is because statistically the 95th
percentile value equals average plus 2 × SD.
Taizhou, eastern China. Estimated dietary exposures to EFRs for both adults and children
were 756 and 1827 ng/day, respectively, which is much higher than those in our study
(Labunska et al., 2015). Tao et al. (2016) reported that estimated dietary exposure of
EFRs for adults and children from an e-waste processing area in Vietnam were 8670 and
6153 ng/day, respectively, which is also extremly higher than our study. β-DBE-DBCH
showed the highest estimated intakes of ∑EFRs in this study for both adults and children
(14 and 50 ng/day respectively) followed by DBDPE (4.9 and 16 ng/day respectively). As
DBE-DBCH were not investigated in Labunska et al.'s study (2015), it is impossible to
compare these two studies directly. We are aware of another study on dietary exposure to
EFRs for Swedish mothers and toddlers in which EFRs were only detected in fish
(Sahlström et al., 2015). The estimated median daily intakes of EFRs were 6.8 and 3.3
ng/day in Sahlström et al.’s study (2015) which is one order of magnitude lower than our
total EFRs dietary exposure estimates but similar to our estimated daily intakes of EFRs
through fish consumption (10 and 2.2 ng/day, respectively).

169
Figure 5.4 Contributions to average total dietary exposures for EFRs from different
groups of UK food
5.3.2 PBDEs
Tables 5.8 and 5.9 show the estimated intakes of ∑PBDEs via consumption of food in the UK
and other different countries. Total average daily intakes of ∑PBDEs were estimated in this
study to be 42 and 124 ng/day for toddlers and adults, respectively, which is comparable to
the adults’ dietary intake of PBDEs in Spain (Domingo et al., 2008) but higher than those in
the USA (Schecter et al., 2009), Belgium (Stefan Voorspoels et al., 2007), Netherlands
(Bakker et al., 2008), Sweden (Törnkvist et al., 2011; Sahlström et al., 2015), China (Su et
al., 2012) and Romania (Dirtu and Covaci, 2010). Notably, estimated high-end dietary intakes
of ∑PBDEs were 5 times higher than the mean dietary intakes for both toddlers and adults
(227 ng/day and 568 ng/day, respectively). In spite of the elevated levels of PBDEs in food
samples in this study compared with previous UK studies (UK Food Standards Agency, 2006;
UK Food and Environment Research Agency, 2009), the average daily intake of PBDEs was

170
Table 5.8 Estimated average and high-end a intakes of ∑PBDEs (ng/day) via
consumption of food for UK adults and toddlers
Toddlers Adults
Average consumer High-end consumer Average consumer High-end consumer
Meat 28 135 89 372
Liver 0.08 1.8 0.61 8.9
Fish 4.4 61 20 133
Cheese 8.1 26 14 48
Egg 0.67 2.9 1.2 5.8
Total 42 227 124 568
a) estimates of high end intakes were derived from food consumption figures in Table 5.6 by
assuming that a high-end consumer of each food group consume the average quantities of food
consumed + 2 × standard deviations (SD). This is because statistically the 95th percentile value equals
average plus 2 × SD.
found to be comparable to one previous study (Harrad et al., 2004) but lower than another
one (UK Food Standards Agency, 2006). This may be attributable to the fact that Harrad et
al’s study (2004) was a duplicate diet study, while the study of the Food Standards Agency
(2006) included more types of food samples (n=19) compared with the more limited range of
animal-based sample types collected in our study. Meat was the main source of PBDEs for
both toddlers and adults in our study, contributing > 58% of estimated daily intake, which is
similar to previous studies conducted in China (Su et al., 2012) and Romania (Dirtu and
Covaci, 2010). By comparison in the previous UK study (UK Food Standards Agency, 2006)
meat products were the principal contributor which may also account for the relatively higher
daily intake of PBDEs in this previous study compared to our study. However, fish was the
predominant contributor to human exposure of PBDEs in several other countries such as
Sweden (Törnkvist et al., 2011), Belgium (Stefan Voorspoels et al., 2007), and Spain
(Domingo et al., 2008).

171
Table 5.9 Estimated average adult intakes of ∑PBDEs (ng/day) via consumption of food
in different countries
Country Total PBDEs intake (ng/day) Year References
UK 124 2015 This study
UK 413 2003-2004 (UK Food Standards Agency, 2006)
UK 107 (90.5 a) 2006 (Harrad et al., 2004)
USA 50 2009 (Schecter et al., 2009)
Belgium 23-48 2005 (Stefan Voorspoels et al., 2007)
Spain 75.4 2006 (Domingo et al., 2008)
Netherlands 55.3 2003-2004 (Bakker et al., 2008)
Sweden
49 2005 (Törnkvist et al., 2011)
22 2010 (Sahlström et al., 2015)
China 9.9 2006 (Su et al., 2012)
Romania a 40 2007 (Dirtu and Covaci, 2010)
a) Based on median values of PBDEs and consumption of omnivorous diets only .
5.3.3 HBCDDs
Estimated daily intakes of ∑HBCDDs through food for adults and toddlers in the UK are
shown in Table 5.10. The average dietary exposure to ∑HBCDDs is 8.8 and 31 ng/day for
toddlers and adults, respectively. Estimated high-end daily ∑HBCDDs intakes (54 ng/day
and 149 ng/day for toddlers and adults, respectively) via food consumption were significantly
higher than the mean dietary intakes. Similar to PBDEs, the adults’ daily intake estimation of
∑HBCDDs in this study was lower than that in a previous study (UK Food Standards
Agency, 2006) even though the levels of ∑HBCDDs in this study were comparable to this
previous study. This difference is likely due to the wider range of food groups analysed in the
earlier study. Compared with other countries, our estimate of UK adult dietary intake of
HBCDDs is comparable to those in the USA (Schecter et al., 2009), Sweden (Törnkvist et al.,

172
Table 5.10 Estimated average and high-end a intakes of ∑HBCDDs (ng/day) via
consumption of UK food for adults and toddlers
Toddlers Adults
Average consumers High-end consumers Average consumers High-end consumers
Mean Mean Mean Mean
Meat 6.4 30 23 93
Liver 0.04 1.0 0.37 5.5
Fish 1.3 18 6.1 41
Cheese 0.18 0.6 0.32 1.1
Egg 0.79 3.4 1.9 8.8
Total 8.8 54 31 149
a) estimates of high end intakes were derived from food consumption figures in Table 5.6 by
assuming that a high-end consumer of each food group consumes the average quantities of food
consumed + 2 × standard deviations (SD). This is because statistically the 95th percentile value equals
average plus 2 × SD.
2011) and China (Shi et al., 2009); but lower than those in Belgium (Goscinny et al., 2011),
Spain (Eljarrat et al., 2014), the Netherlands (de Winter-Sorkina R et al., 2003) and Romania
(Dirtu and Covaci, 2010) (Table 5.11). The calculated contributions of the different food
groups to the total estimated daily intake of HBCDDs showed that meat was a predominant
contributor for both toddlers and adults, accounting for 73% and 74% of the total exposure to
HBCDDs, respectively, which is similar to the findings in the USA (Schecter et al., 2009),
Belgium (Goscinny et al., 2011), Netherland (de Winter-Sorkina et al., 2003), China (Shi et
al., 2009) and Romania (Dirtu and Covaci, 2010), followed by fish (13% and 20% for
toddlers and adults, respectively). In contrast, milk and fruit were the main contributors to
dietary exposure to HBCDDs in a previous UK study (Food Standards Agency, 2006), while
in Spain (Eljarrat et al., 2014) and Sweden (Törnkvist et al., 2011), fish was the main source
of dietary intake of HBCDDs.

173
Table 5.11 Estimated average intakes of ∑HBCDDs (ng/day) via consumption of food in
different countries
Country Total HBCDDs intake (ng/day) Year References
UK 31 2015 This study
UK 413 a
2003-2004 (UK Food Standards Agency, 2006)
USA 16 2009 (Schecter et al., 2009)
Belgium a, b 69 2006-2007 (Goscinny et al., 2011)
Spain 177 2009 (Eljarrat et al., 2014)
Netherlands 99-191 2002 (de Winter-Sorkina et al., 2003)
Sweden
10.2 2005 (Törnkvist et al., 2011)
11 2010 (Sahlström et al., 2015)
China 27 2007 (Shi et al., 2009)
Romania a 77 2007 (Dirtu and Covaci, 2010)
a) assuming the body weight was 70 kg for daily intake estimation calculation.
5.4 Conclusions
This study reveals the presence of EFRs in various UK food samples. Meat was the main
source of dietary intakes of PBDEs, EFRs and HBCDDs for both toddlers and adults under an
average consumer scenario. Estimated dietary exposures to EFRs were comparable to dietary
intakes of PBDEs but higher than those of HBCDDs for both toddlers and adults (Figure 5.4).
This may be a health concern as some EFRs show similar persistence, bioaccumulation
potential and toxicity (PBT) properties to legacy FRs (Johnson et al., 2013; Muir and
Howard, 2006; Stieger et al., 2014; Tomy et al., 2007a), exacerbated by likely future
increases in use of EFRs due to the banned and restricted use of legacy FRs (Stockholm
Convention, 2009; European Court of Justice, 2008; UNEP, 2014).
174
CHAPTER 6 EFRs, PBDEs and
HBCDDs in UK human milk:
implications for infant exposure and
relationship to external exposure

175
6.1 Introduction
EFRs have been widely detected in environmental matrices including indoor air, indoor dust,
outdoor air, and sediment as well as biological matrices. (Cequier et al., 2014; Fernandes et
al., 2010; Gauthier et al., 2008; Guerra et al., 2012; Karlsson et al., 2007; Labunska et al.,
2015; Law et al., 2006; Li et al., 2015; Möller et al., 2011a, 2011b; Munschy et al., 2011;
Newton et al., 2015; Salamova et al., 2014; Shi et al., 2009; Yang et al., 2012). In contrast,
very little information is available to estimate the production volume of EFRs. Figures
available put worldwide production/usage of BTBPE at an estimated 16,710 tons in 2001
(Covaci et al., 2011) which exceeds the estimated total consumption of Penta-BDEs (7,500
tons) and Octa-BDEs (3,790 tons), and is one third of the estimated total consumption of
Deca-BDEs (56,100 tons) in 2001 (BSEF, 2006) and around half that of HBCDD (~28,000
tons) (Yang, 2014). With respect to other EFRs, around 1,000 to 5,000 tons of DBDPE were
imported to the EU, primarily to Germany in 2001 (Covaci et al., 2011), with BEH-TEBP and
EH-TBB also extensively used in additive FR products such as Firemaster 550, BZ54 and
DP-45 (Covaci et al., 2011). Of concern is the fact that some EFRs (e.g. DBE-DBCH and
BTBPE) display persistence and bioaccumulative potential giving rise to increasing concern
over their adverse human health effects (Muir and Howard, 2006; Tomy et al., 2007a). In one
study, concentrations of BEH-TEBP and DBDPE in indoor dust were both positively
associated with total T3 in exposed men, suggesting that exposure to these contaminants in
indoor dust may be leading to endocrine disruption in males (Johnson et al., 2013).
Moreover, animal and in vitro studies have shown some EFRs to pose potential health risks
including: endocrine disruption (DBDPE, BTBPE, EH-TBB, BEH-TEBP and DBE-DBCH),
neurodevelopmental and behavioural outcomes (EH-TBB, BEH-TEBP), hepatotoxicity
(DBDPE), impaired reproductive physiology (DBDPE and DBE-DBCH), gene expression
(BTBPE), morphological abnormalities and mortality (DBE-DBCH), DNA damage (EH-

176
TBB, BEH-TEBP and DBE-DBCH) and possible cancer (DBE-DBCH) (Bearr et al., 2010;
Egloff et al., 2011; Ezechiáš et al., 2012; Johnson et al., 2013; Khalaf et al., 2009; Larsson et
al., 2006; Mankidy et al., 2014; McGregor et al., 1991; Nakari and Huhtala, 2009; Noyes et
al., 2015; Park et al., 2011; Pradhan et al., 2013; Saunders et al., 2013; Wang et al., 2010).
The relationships between levels of legacy BFRs including PBDEs and HBCDDs in human
matrices and external exposure have been reported in several previous studies (Abdallah and
Harrad, 2014, 2011; Roosens et al., 2009a). However, very few data exist about the presence
of EFRs in human matrices and the extent to which the known contamination of indoor
environments with EFRs influences human body burdens. Therefore, this study measures the
concentrations of EFRs in UK human milk for the first time and uses a simple one-
compartment pharmacokinetic model to predict the body burdens of the studied EFRs in UK
adults and compare these predicted burdens to the concentrations detected in human milk.
6.2 Concentrations and patterns of FRs in human milk
6.2.1 EFRs
Table 6.1 shows a statistical summary of concentrations of our target EFRs in archived
human milk samples (collected in 2010) (human milk group 1) and human milk samples
collected from 2014-2015 (human milk group 2). No significant differences were found
between the levels of individual EFRs in human milk group 1 and group 2 (p > 0.05).
Moreover, the DFs of all EFRs in human milk group 1 were lower than those in human milk
group 2 even though the sample size of the latter is smaller than the former, indicating the
more widespread usage of these EFRs currently than hitherto. The DFs of DBDPE and
BTBPE were low (<50%) in both human milk groups which is similar to the study of Zhou et
al. (2014) even though these two chemicals were frequently detected in UK indoor dust
samples at high concentrations (seen in Chapter 4, Table 4.1). Given its similar structure to

177
BDE 209, the physicochemical properties and behaviour in the environment and biota of
DBDPE were assumed to be in line with that of BDE 209 which has very low bioavailability
and a high biotransformation rate (Abdallah and Harrad, 2014; Wan et al., 2013). However, to
the best of our knowledge, no studies have been conducted to investigate the bioavailability
and biotransformation of DBDPE and BTBPE in human tissues. Both DBDPE and BTBPE
have been reported to have a high bioaccumulation potential in fish (He et al., 2012; Tomy et
al., 2007a). In contrast, DBDPE was found to be less bioaccumulative in rats (Wang et al.,
2010) and chickens (Zheng et al., 2015) compared to BDE 209, while several oral ingestion
studies of BTBPE in rats also reported poor gastrointestinal absorption, high transformation
and substantial faecal excretion (>94%) (Nomeir et al., 1993; Verreault et al., 2007; Hakk et
al., 2004). Furthermore, biotransformation of DBDPE and BTBPE was found to occur in rats
(Wang et al., 2010; Verreault et al., 2007), with greater depletion of DBDPE (44-74% of 90
pmol) observed in various arctic marine-feeding mammals and in laboratory rats relative to
BDE 209 (14-25% of 30 pmol) in such species (Mckinney et al., 2011b). Such findings for
DBDPE and BTBPE in the mammalian model species may suggest these two chemicals have
low bioaccessibility and relatively high biotransformation potential. Combined, these factors
may explain the low DFs of these chemicals in human milk. Interestingly, very high levels of
BTBPE (56 and 54 ng/g lw) were found in two archived human milk samples which may
reflect recent human exposure to BTBPE. Moreover, a very high concentration of 4,700,000
ng/g BTBPE was found in one UK dust sample (Chapter 4, Table 4.1), so another explanation
for the high levels of BTBPE in these two human milk samples may be relatively high dust
exposure. The DFs of EH-TBB were higher than BEH-TEBP which is in line with Zhou et
al.'s study (2014) and may be attributable to the higher bioaccessibility of EH-TBB compared
to BEH-TEBP (Fang and Stapleton, 2014), or possibly explained by preferential partitioning
of EH-TBB from blood to milk in humans relative to BEH-TEBP (Zhou et al., 2014). Similar

178
observations were made by Liu et al. (2016), i.e. that EH-TBB was detected more frequently
than BEH-TEBP in human hair, fingernails, toenails and serum especially in human serum.
Specifically, EH-TBB was detected in 92% of the serum samples, while BEH-TEBP was
detected in only 16%, with BTBPE present in <15% of samples. In our study, of all targeted
compounds, β-DBE-DBCH showed the highest DFs and concentrations in both human milk
groups which is similar to the findings in UK diet samples (Chapter 5, Table 5.1) indicating
the high bioaccumulative potential in human milk. To our knowledge, this is the first report of
β-DBE-DBCH in human milk samples. The values of fβ-DBE-DBCH ranged from 0.88 to 608,
with a median of 9.6 which is significantly higher than those in UK indoor air (0.53-1.0) (p <
0.001) and dust (0.32-2.88) (p < 0.001) indicating diastereomer-specific environmental
degradation/metabolism and/or isomerisation in humans. Of note, fβ-DBE-DBCH values in human
milk were statistically indistinguishable to those in diet samples (p > 0.05) indicating the
relatively higher abundance of β-DBE-DBCH compared with α-DBE-DBCH may also result
from dietary exposure to DBE-DBCH.
Despite the ubiquity of EFRs in the environment, very few studies have reported the presence
of EFRs in humans. In this study, the only compound detected in >50% of samples in our
two human milk groups was β-DBE-DBCH, with concentrations statistically
indistinguishable between the two groups. In Sahlström et al.’s study (2015), only -DBE-
DBCH were found above the detection limit in the two pooled breast milk samples in Sweden
with mean concentrations at 4.0 pg/g ww which is lower than in our study (mean: 41 and 24
pg/g ww in human milk group 1 and group 2, respectively). In North America, Zhou et al.
(2014) measured several EFRs including EH-TBB, BEH-TEBP, BTBPE, and DBDPE in
human milk (n=105) collected in 2008-2009 in Canada. The concentrations reported of EH-
TBB ranged between nd-24 ng/g lw which is higher than in our study (Table 6.1), while

179
Table 6.1 Descriptive statistics for concentrations of EFRs in UK human milk (ng/g lw) a
Lipid
weight
(%)
α-DBE-
DBCH
β-DBE-
DBCH EH-TBB BTBPE BEH-TEBP DBDPE ∑EFRs
Archived human milk samples collected in 2010 (n=25)
DF 20% 76% 44% 28% 36% 4%
5th
percentile 2.1 <0.13 0.063 <0.1 <0.1 <0.1 <0.78 0.76
95th
percentile 4.3 1.1 34 2.0 -- 1.9 -- --
Mean 3.2 -- 6.8 -- -- -- -- --
Median 3.5 <0.13 3.1 <0.01 <0.1 <0.1 <0.78 7.9
Minimum 1.9 <0.13 <0.13 <0.01 <0.1 <0.1 <0.78 0.57
Maximum 4.4 1.7 38 2.1 56 4.6 250 260
Human milk collected in 2014-2015 (n=10)
DF 100% 100% 90% 40% 50% 10%
5th
percentile 2.2 0.34 0.47 0.041 <0.1 <0.1 <0.78 2.0
95th
percentile 5.2 1.0 8.3 0.40 0.50 0.65 -- --
Mean 3.9 0.67 2.5 0.21 -- 0.25 -- --
Median 4.1 0.60 1.2 0.16 <0.1 <0.1 <0.78 3.1
Minimum 1.5 0.30 0.43 <0.01 <0.1 <0.1 <0.78 1.9
Maximum 5.3 1.1 10 0.48 0.71 0.73 58 59
a) the mean concentrations were calculated when the DF>50%.
concentrations of BEH-TEBP and DBDPE were nd-6.6 and nd-25 ng/g lw, respectively,
comparable to those in our study (Table 6.1). With respect to BTBPE, while detected in the
minority of samples in our study, it was not detected in human milk in the Canadian study
(Zhou et al., 2014). Our concentrations of EH-TBB and BEH-TEBP in human milk were
much lower than those detected in human hair, fingernails and toenails (EH-TBB: 7.6-4540
ng/g; BEH-TEBP: 13-2600 ng/g) and also serum (TBB: 1.3-54 ng/g lw; BEH-TEBP: 19-69
ng/g) in the USA population (Liu et al., 2016). Moreover, while BTBPE was undetectable in
serum in the USA study, concentrations in our study were exceeded by those in human hair,

180
fingernails and toenails (BTBPE: 0.75-8.7 ng/g) in the USA study (Liu et al., 2016).
6.2.2 PBDEs
The concentrations of PBDEs from human milk group 2 are shown in Table 6.2. The levels of
PBDEs in human milk group 1 (n=35) were reported by our group in a previous study
(Abdallah and Harrad, 2014). The mean concentrations of Σtri-hexa BDEs in this study (6.5
ng/g) are comparable to those reported in UK human milk samples collected in 2010 (n=54,
average: 5.9 ng/g lw) from human milk group 1 (Abdallah and Harrad, 2014) and in
Australian human milk samples (7.6 ng/g lw) collected in 2007 (Toms et al., 2009). However,
concentrations in our study are still slightly higher than those in most Asian and European
countries such as: China (0.8 ng/g lw), India (1.1 ng/g lw), Korea (2.7 ng/g lw), France (2.5
ng/g lw), Spain (2.1 ng/g lw), Italy (1.3 ng/g lw), Norway (2.7 ng/g lw), Sweden(2.2 ng/g lw)
and Belgium (3.0 ng/g lw) (Alivernini et al., 2011; Antignac et al., 2009; Devanathan et al.,
2012; Gómara et al., 2011; Kim et al., 2011; Roosens et al., 2010; Shi et al., 2013; Thomsen
et al., 2010; Sahlström et al., 2015). However, concentrations reported here, are significantly
lower than those in the USA (34 ng/g lw) (Schecter et al., 2003) and Canada (50.4 ng/g lw)
(She et al., 2007). Concentrations of BDE 209 (< 0.22 ng/g lw) in this study were lower than
in other European countries including Belgium (5.9 ng/g lw), France (1.6 ng/g lw) and Spain
(2.5 ng/g lw) (Antignac et al., 2009; Gómara et al., 2011; Roosens et al., 2010) but similar to
Sweden (0.33 ng/g lw) (Sahlström et al., 2015). Similar to the previous UK study (Abdallah
and Harrad, 2014), BDE 47, 99, and 153 were the most abundant compounds in this study, in
the order: BDE 47 > BDE 153 > BDE 99. The relatively higher levels of BDE 153 than BDE
99 in this study were in agreement with several previous studies (Abdallah and Harrad, 2014;
Dunn et al., 2010; Frederiksen et al., 2009; Hassine et al., 2012). By comparison, in UK
indoor air, dust (Chapter 4, Table 4.2 and 4.4) and diet samples (Chapter 5, Table 5.3)
concentrations of BDE 153 are much lower than those of BDE 99, indicating that the external

181
exposures through indoor air, dust and diet were not the reason for the elevated abundance of
BDE 153 in human milk. Therefore, the relatively higher levels of BDE 153 compared with
BDE 209 in human milk are likely due to the higher bioaccumulation potential of BDE 153 in
humans and/or the possible stepwise debromination from BDE 209 to BDE 153 (Abdallah
and Harrad, 2014), consistent with the significant correlations between the levels of BDE 153
and BDE 209 in this study (p < 0.05).
The concentrations of BDE 47, 100, 99, 154, and 153 in human milk group 2 were
comparable to the previous study for human milk group 1 (Table 6.2) (Abdallah and Harrad,
2014). Moreover, Schuhmacher et al. (2009) and Shy et al. (2012) also reported no time trend
for ΣPBDEs (except BDE 209) in human milk samples in Spain and Taiwan, respectively
(2002-2007 and 2000/2001-2007/2009 for Spain and Taiwan, respectively). Similarly,
concentrations of PBDEs in Canadian human milk appear to have stabilized between 2002
and 2005 (Ryan and Rawn, 2014). As diet and dust are the main pathways of external human
exposure to PBDEs (Harrad et al., 2004, 2008; Lorber, 2008), it is of interest that while levels
of Σtri-hexa BDEs in our UK food samples are higher than those reported in two previous
UK food surveys (Chapter 5, Table 5.4), no significant temporal differences for Σtri-hexa
BDEs were found in dust (Chapter 4, section 4.7.2). The contrasting trends in diet and dust
levels of tri-hexa BDEs are consistent with the hypothesis put forward in Harrad’s study
(2006) suggesting that both dust- and diet-related exposure exert strong influences on UK
human body burdens for this period. Therefore, it is possible that the steady human body
burden levels observed here are attributable to a combination of: (a) increased dietary
exposure, offset by (b) decreased dust-related exposure to BDE 209 (Chapter 4, section 4.6.2)
followed by in vivo metabolism to tri-hexa-BDEs (Stapleton et al., 2004; Van den Steen et al.,
2007; Wang et al., 2010). The levels of BDE 209 in human milk group 2 are comparable to
those in group 1 (Abdallah and Harrad, 2014) (Table 6.2).

182
Table 6.2 Descriptive statistics for concentrations for PBDEs in UK human milk (ng/g
lw)
BDE 28 BDE 47 BDE 100 BDE 99 BDE 154 BDE 153 Σtri-hexa
BDEs BDE 209
Archived human milk samples collected in 2010 (n=35) (Abdallah and Harrad, 2014)
DFs -- 100% 89% 94% 77% 97% -- 69%
5th
percentile -- 0.27 0.03 0.05 0.03 0.09 0.58 0.03
95th
percentile -- 8.23 0.98 1.7 0.68 3.16 12.52 0.82
Mean -- 3.3 0.45 0.71 0.30 1.10 5.9 0.31
Median -- 2.8 0.38 0.69 0.21 0.91 5.00 0.25
Min -- 0.17 <0.05 <0.06 <0.06 <0.06 0.20 <0.06
Max -- 14.65 1.86 3.43 11.10 4.57 26.10 0.92
Human milk collected from 2014-2015 (n=10)
DFs 90% 100% 100% 100% 90% 100% -- 40%
5th
percentile 0.03 0.63 0.08 0.45 0.06 0.62 2.4 0.08
95th
percentile 0.41 7.0 2.1 1.7 0.21 2.4 13 0.47
Mean 0.19 2.8 0.73 1.0 0.13 1.7 6.5 <0.22
Median 0.14 2.2 0.53 0.77 0.12 1.8 5.8 <0.22
Min <0.03 0.52 0.07 0.42 <0.03 0.49 1.7 <0.22
Max 0.41 7.7 2.2 2.0 0.24 2.7 14 0.67
Fängström et al. (2008) and Shy et al. (2012) also reported no time trend for BDE 209 in
human milk samples in Sweden and Taiwan respectively (1980-2004 and 2000/2001-
2007/2009 for Sweden and Taiwan, respectively). Consistent with this, no substantial
differences were found between concentrations of BDE 209 in this study and in two UK
previous dietary studies (Chapter 5, Table 5.4) (UK Food Standards Agency, 2006; UK Food
and Environment Research Agency, 2009). In contrast, concentrations of BDE 209 in UK
office dust decreased significantly compared with those in a previous UK study (Harrad et al.,

183
2008a) (Chapter 4, section 4.6.2). Consequently, the steady temporal trend in BDE 209 levels
in human milk suggests that concentrations of this congener in dust exert a relatively minor
influence on body burdens. This may be attributable to the very low bioaccessibility from
dust (~14%) of BDE 209, combined with its very short human half-life of and preferential
partitioning to serum rather than milk fat (Abdallah and Harrad, 2014).
6.2.3 HBCDDs
Concentrations of ∑HBCDDs in human milk group 2 samples ranged between 0.69-7.1 ng/g
lw (Table 6.3) i.e. slightly lower than those in UK human milk group 1 from a previous study
(Abdallah and Harrad, 2011). α-HBCDD was the predominant HBCDD diastereomer
contributing on average 62±11% ∑HBCDDs in all human milk samples, with γ-HBCDDs
comprising 32±17% of ΣHBCDDs, in agreement with human milk group 2 (Abdallah and
Harrad, 2011), which was suggested to be a result of preferential metabolism of β- and γ-
HBCDDs (Zegers et al., 2005) and greater bioavailability of α-HBCDD compared to the
other isomers (Abdallah et al., 2009). As mentioned in Chapter 4 (section 4.6.3) and Chapter
5 (section 5.2.3), concentrations of HBCDD in food samples in this thesis were comparable
to those detected in similar foodstuffs in two UK previous studies (Driffield et al., 2008; UK
Food Standards Agency, 2006). By comparison, the levels of HBCDDs in indoor air and
dust measured in this thesis show a decreasing trend which may account for the slight
downward trend observed in UK human milk. Concentrations of HBCDDs in group 2
samples (mean: 3.20 ng/g lw) were at the lower end of those reported for other European
countries including Norway (<LOQ-31 ng/g lw) (Thomsen et al., 2010), France (2.5-5 ng/g
lw) (Antignac et al., 2008), Spain (3-188 ng/g lw) (Eljarrat et al., 2009) and Sweden (<0.04-
1.3 ng/g lw) (Lignell et al., 2012) but lower than those reported for Australia (<3.8-19 ng/g
lw) (Toms et al., 2012) and Canada (0.1-28.2 ng/g lw) (Ryan and Rawn, 2014). In contrast,
concentrations of HBCDDs in UK human milk exceeded those in USA (0.2-0.9 ng/g lw)

184
(Ryan et al., 2006) and in Asian countries like the Philippines (<0.01-0.91 ng/g lw)
(Malarvannan et al., 2013), India (mean: 0.38 ng/g lw) and China (<LOQ-2.8 ng/g lw) (Shi et
al., 2009).
Table 6.3 Descriptive statistics for concentrations for HBCDDs in UK human milk (ng/g
lw)
α-HBCDD β-HBCDD γ-HBCDD
∑HBCDDs
Archived human milk samples collected in 2010 (n=34) (Abdallah and Harrad, 2011)
5th
percentile 1.10 0.09 0.15 1.68
95th
percentile 15.27 0.67 2.11 18.00
Mean 4.91 0.32 0.73 5.95
Median 3.71 0.30 0.56 3.83
Min 0.75 0.08 0.13 1.04
Max 19.71 0.75 2.29 22.37
Human milk collected from 2014-2015 (n=10)
DFs 100% 60% 100% --
5th
percentile 0.65 <0.10 0.29 1.1
95th
percentile 3.7 0.46 1.9 5.7
Mean 2.1 0.25 0.90 3.2
Median 1.9 0.23 0.73 2.9
Min 0.40 <0.10 0.16 0.69
Max 4.4 0.61 2.2 7.1
6.2.4 Relative abundance of different classes of FRs
As shown in Figure 6.1, PBDEs are the predominant FR class in human milk, contributing

185
50% FRs, followed by EFRs, accounting for 38% of FRs while HBCDDs contributed
12% to FRs in human milk. Despite the bans and restrictions on the use of PBDE
commercial products, PBDEs remain the most abundant class out of our target FRs in human
milk which may reflect the continuous release of these “legacy” BFRs from old furniture and
appliances and bioaccumulation of these compounds in humans. In future, because of the
more widespread usage of EFRs and the biomagnification of these chemicals in the food
chain, concentrations of EFRs in humans could increase with consequent potential adverse
human health effects.
Figure 6.1 Average relative contributions of EFRs, PBDEs and HBCDDs to FRs in UK
human milk
6.3 Nursing infants' dietary intake of HFRs via breast milk
Breast milk is a recognized medium for direct transfer of POPs to nursing infants. We
estimated a nursing infants' dietary intake of the studied FRs via breast milk using equation
(6.1):
Di =𝐶𝐹𝑅𝑠∗𝐹𝑙𝑖𝑝𝑖𝑑
𝐵𝑊……………………………….. (6.1)
where Di is the estimated dietary intake (ng/kg bw/day); CFRs is the concentration of target
∑PBDEs
∑EFRs
∑HBCDDs

186
FRs in milk (ng/g lw); Flipid is the daily lipid intake via breast milk (g/day) and Bw is the
body weight (4.14 kg) (U.S. EPA, 2002.). The infant's daily lipid intake via breast milk (Flipid)
was calculated using U.S. EPA guidelines (U.S. EPA, 2002) which suggest an average intake
of 702 mL milk per day for a 1 month old infant weighing 4.14 kg. The median lipid content
of the analysed milk samples was 3.47 g lipid per 100 mL of breast milk resulting in a daily
lipid intake of 24.4 g lipid/day.
Table 6.4 and Table 6.5 show the estimated dietary intake of target FRs via breast milk under
different exposure scenarios. The daily intake estimation of EFRs through breast-feeding
from human milk group 1 was compared with the data from human milk group 2. Notably,
the median dietary exposure estimate of an infant to ΣEFRs via breast milk was 18 ng/kg
bw/day which exceeds estimated dietary intakes of both UK adults (1.1 ng/kg bw/day for 70
kg adults) and toddlers (2 ng/kg bw/day for 10 kg toddlers) (Chapter 5, Table 5.7). Similarly,
the estimated dietary exposure of an infant to ΣHBCDDs and Σtri-hexa BDEs via breast milk
exceeded the estimated upper-bound dietary intakes of both UK adults and toddlers (Abdallah
and Harrad, 2014, 2011).

187
Table 6.4 Estimated exposure a, b
(ng/kg bw/day) of a 1 month old infant to the target
FRs via ingestion of breast milk sampled in 2010
5th
percentile Mean Median 95th
percentile
α-DBE-DBCH 0.38 -- 0.38 6
β-DBE-DBCH 0.37 40 18 200
EH-TBB 0.29 -- 0.29 12
BTBPE 0.29 -- 0.29 --
BEH-TEBP 0.03 -- 0.03 11
DBDPE 2.3 -- 2.3 --
∑EFRs 4.5 -- 47 --
BDE 47 c 1.6 19.3 16.3 48.4
BDE 100 c 0.16 2.7 2.2 5.8
BDE 99 c 0.30 4.2 4.0 10.0
BDE 154 c 0.17 1.7 1.3 4.0
BDE 153 c 0.52 6.5 5.3 18.7
Σtri-hexa BDEs c 3.4 34.9 29.4 73.8
BDE 209 c 0.18 1.8 1.2 4.8
α-HBCDD d 6.4 29 18 89
β-HBCDD d 0.5 1.8 1.8 3.9
γ-HBCDD d 0.9 4.2 3.3 12
∑HBCDDs d 9.8 35 22 110
a) Values below LOQ were assumed to be 1/2 LOQ; b) Based on an average body weight of 4.14 kg
and a daily lipid intake of 24.4 g lipid/day (U.S. EPA, 2002); c) Data from Abdallah and Harrad
(2014); d) Data from Abdallah and Harrad (2011).

188
Table 6.5 Estimated exposure a, b
(ng/kg bw/day) of a 1 month old infant to the target
FRs via ingestion of breast milk sampled in 2014-15
5th
percentile Mean Median 95th
percentile
α-DBE-DBCH 2.0 3.9 3.5 5.9
β-DBE-DBCH 2.8 15 7.1 49
EH-TBB 0.24 1.2 0.94 2.4
BTBPE 0.29 0.88 0.29 2.9
BEH-TEBP 0.03 1.5 0.03 3.8
DBDPE 2.3 -- 2.3 --
∑EFRs 12 -- 18 --
BDE 28 0.18 1.1 0.83 2.4
BDE 47 3.7 17 13 41
BDE 100 0.47 4.3 3.1 12
BDE 99 2.7 5.9 4.5 10
BDE 154 0.35 0.77 0.71 1.2
BDE 153 3.7 10 11 14
Σtri-hexa BDEs 14 38 34 77
BDE 209 0.47 0.65 0.65 2.8
α-HBCDD 3.8 12 11 22
β-HBCDD 0.29 1.5 1.4 2.7
γ-HBCDD 1.7 5.3 4.3 11
∑HBCDDs 6.5 19 17 34
a) based on levels in analysed human milk collected from 2014-2015 (n=10); values below LOQ
were assumed to be 1/2 LOQ; b) Based on an average body weight of 4.14 kg and a daily lipid intake
of 24.4 g lipid/day (U.S. EPA, 2002)

189
6.4 Relationship between FR intake and human body burdens
To examine the relationship between our estimated intakes via various pathways and the body
burdens indicated via levels in human milk, a simple one-compartment, first order
pharmacokinetic (PK) model was used (Lorber, 2008; Abdallah and Harrad, 2011). The
studied FRs were hypothesized to accumulate in lipids (the single compartment in the model).
Therefore, the change in HFR concentrations in lipids over time can be calculated by
equation (6.2):
𝛿𝐶FR
𝛿𝑡=
𝐼𝐹𝑅(t)*𝐴𝐹𝐹𝑅
𝐵𝐿(𝑡)− 𝐾𝐹𝑅 ∗ 𝐶𝐹𝑅(𝑡)……………………….. (6.2)
where CFR is the compound specific concentration in lipids (ng/g lw); IFR is the daily intake
of the target FR (ng/day); AFFR is the absorption fraction; BL is body lipid mass (g) and KFR
is the compound specific first order dissipation rate (day−1
).
If KFR is assumed constant over time, then equation (6.2) can be changed into:
C𝐹𝑅(t) = C𝐹𝑅(0) ∗ 𝑒(−𝐾𝐹𝑅∗𝑡) + [𝐼𝐹𝑅(t)*𝐴𝐹𝐹𝑅
𝐵𝐿(𝑡)] ∗ [
(1−𝑒(−𝐾𝐹𝑅∗𝑡))
𝐾𝐹𝑅]………………………. (6.3)
where CFR(0) is the studied FR body lipid concentration at time 0 (initial concentration before
intake). Assuming a constant dose over time at constant body lipid mass (i.e., when t
approaches infinity), the steady state BFR lipid concentration can be calculated from equation
(6.4):
C𝐹𝑅 =𝐼𝐹𝑅*𝐴𝐹𝐹𝑅
𝐵𝐿∗𝐾𝐹𝑅……………………….. (6.4)
While equation (6.4) is used to predict the body burdens of the target FRs, it is stressed that
the assumption of steady state conditions is an inherent uncertainty with this approach.

190
Table 6.6 Assumed absorption fractions and human half-lives of the individual PBDEs and EFRs
EFR molecular
weight number of
bromines BFR
molecular
weight
number of
bromines
human half-lives of
PBDEs (days)
absorption
fractions of
PBDEs
DBE-DBCH 427.80 4 BDE 47 485.79 4 1096 a
0.58 c
EH-TBB 549.90 4 BDE 47 485.79 4 1096 a 0.58
c
BTBPE 687.60 6 BDE 183 722.48 7 94 b 0.90
d
BEH-TEBP 706.10 4 BDE 183 722.48 7 94 b 0.90
d
DBDPE 971.20 10 BDE 209 959.17 10 15 b 0.14
c
a) Geyer, H. J., Schramm, K.-W., Darnerud, P. O., Aune, M., Feicht, A., Fried, K. W., Mcdonald, T. a. (2004). Terminal elimination half-lives of the brominated flame
retardants TBBPA , HBCD , and lower brominated PBDEs in humans. Organohalogen Compounds, 66, 3820–3825.; b) Thuresson, K., Höglund, P., Hagmar, L., Sjödin, A.,
Bergman, Å. ̊, & Jakobsson, K. (2006). Apparent half-lives of hepta- to decabrominated diphenyl ethers in human serum as determined in occupationally exposed workers.
Environmental Health Perspectives, 114(2), 176–181.; c) Abdallah, M. A.-E., Tilston, E., Harrad, S., & Collins, C. (2012). In vitro assessment of the bioaccessibility of
brominated flame retardants in indoor dust using a colon extended model of the human gastrointestinal tract. Journal of Environmental Monitoring, 14, 3276–3283.; d)
Lorber, M. (2008). Exposure of Americans to polybrominated diphenyl ethers. Journal of Exposure Science and Environmental Epidemiology, 18(1), 2–19.

191
To convert daily adult intakes of FRs via different exposure pathways to expected body burdens,
the dust and diet absorption fractions and human half-lives for PBDEs and HBCDDs (Abdallah
and Harrad, 2011; Abdallah et al., 2012; Geyer et al., 2004; Lorber, 2008; Thuresson et al., 2006)
were used in equation (6.4) (Table 6.6) while the inhalable fraction was assumed to be 100%
bioavailable. The body lipid mass was estimated based on a 25% body fat for an average adult
weighing 70 kg (U.S. EPA, 1997). Finally, KFR was calculated as 0.693/t0.5; where t0.5 is the half-
life of the studied FRs in the body lipid compartment (Table 6.6).
To the best of our knowledge, no information is available for the absorption fractions and half-
lives of EFRs in humans. Based on the number of bromines and molecular weight, the absorption
fractions and human half-lives for individual EFRs were assumed equivalent to literature
reported absorption fractions and human half-lives for PBDEs (Table 6.6). To illustrate, the
absorption fractions and human half-lives for DBE-DBCH (number of bromine: 4; molecular
weight: 427.8) were assumed equivalent to that for BDE 47 (number of bromine: 4; molecular
weight: 485.79).
Generally, predicted body burdens appear reasonably close to measurements for PBDEs in this
study. In one previous study, good agreement was also observed between the predicted body
burdens through diet, air and dust and the observed levels of main target PBDEs in UK human
milk (Abdallah and Harrad, 2014). Even though the levels of PBDEs in human milk in this study
(Table 6.2) were comparable to those in the previous study of Abdallah and Harrad (2014), the
values of PBDEs in air, dust and diet used as input data in this study differed from those used in
the previous study. For example, concentrations of BDE 209 in dust were lower than in the
previous study (Abdallah and Harrad, 2014) while the dietary intake of PBDEs was lower than
the UK Food Standards Agency (2006) data used in Abdallah and Harrad's study (2014).

192
However, the similar good agreement between the predicted and the observed body burdens of
target PBDEs were observed. This is consistent with the hypothesis that the main exposure route
of PBDEs is gradually shifting from indoor air and dust to our diet following declining use of
PBDEs (Harrad and Diamond, 2006). In this study, dietary intakes were the major exposure
pathway contributing to PBDE body burdens (56%-85% for tri-hexa BDEs) in the UK
population except for BDE 209 - for which dust ingestion accounted for ~90% of overall body
burden.
Table 6.7 Comparison of predicted adult body burdens arising from average and median
daily exposures a to major target PBDEs with observed levels in human milk samples
BDE
28
BDE
47
BDE
100
BDE
99
BDE
154
BDE
153
BDE
209
Average intake (ng/day) b
Dust 0.21 3.40 2.80 5.00 1.70 3.40 410
Diet 2.50 45.54 11.40 54.98 7.07 5.11 6.20
Air 0.40 2.20 0.51 1.50 0.09 0.16 4.20
Median intake (ng/day) b
Dust 0.01 0.50 0.11 0.82 0.05 0.49 100
Diet 2.52 35.99 8.27 37.68 6.34 3.94 6.28
Air 0.04 0.31 0.03 0.19 0.01 0.02 1.40
Average predicted body burdens (ng/g lw)
Dust 0.03 0.18 0.13 0.18 0.09 0.58 0.07
Diet 0.41 2.39 0.53 1.93 0.39 0.87 0.001
Air 0.07 0.20 0.04 0.13 0.02 0.06 0.01
Sum 0.51 2.76 0.71 2.24 0.50 1.50 0.08
Median predicted body burdens (ng/g lw)
Dust 0.002 0.03 0.01 0.03 0.003 0.08 0.02
Diet 0.41 1.89 0.39 1.32 0.35 0.67 0.001
Air 0.01 0.03 0.002 0.02 0.001 0.01 0.002
Sum 0.42 1.94 0.39 1.37 0.36 0.76 0.02
Observed body burdens (ng/g lw)
Average 0.19 2.8 0.73 1.0 0.13 1.7 <0.22
Median 0.14 2.2 0.53 0.77 0.12 1.8 <0.22
a) Values below LOQ were assumed to be 1/2 LOQ; b) Based on average adult dust ingestion rate of 20

193
mg/day (Jones-Otazo et al., 2005) and average inhalation rate of 20 m3/day (Currado and Harrad, 1998)
and average adult weight of 70 kg.
Table 6.8 Comparison of predicted adult body burdens arising from average and median
daily exposures a to major target HBCDDs with observed levels in human milk in this study
-HBCDD -HBCDD -HBCDD
Average intake (ng/day)
Dust 41.00 19.00 80.00
Diet c 16.77 5.40 7.43
Diet d 203.44 105.43 112.24
Air 0.79 0.30 4.80
Median intake (ng/day)
Dust 9.20 2.70 3.00
Diet c 18.18 5.41 8.51
Diet d 203.44 105.43 112.24
Air 0.03 0.02 2.00
Average predicted body burdens (ng/g lw)
Dust 0.51 0.07 0.26
Diet c 0.21 0.02 0.02
Diet d 2.55 0.38 0.37
Air 0.01 0.001 0.02
Sum c 0.73 0.09 0.31
Sum d 3.07 0.45 0.65
Median predicted body burdens (ng/g lw)
Dust 0.12 0.01 0.01
Diet c 0.34 0.03 0.05
Diet d 2.55 0.38 0.37
Air 0.0004 0.0001 0.01
Sum c 0.34 0.03 0.05
Sum d 2.66 0.39 0.39
Observed body burdens (ng/g lw)
Average 2.10 0.25 0.90
Median 1.90 0.23 0.73 a) Values below LOQ were assumed to be 1/2 LOQ; b) Based on average adult dust ingestion rate of 20 mg/day
(Jones-Otazo et al., 2005) and average inhalation rate of 20 m3/day (Currado and Harrad, 1998) and average adult
weight of 70 kg; c) Values based on food samples collected in 2015 (chapter 5); d) Values based on food samples in
a previous study (UK Food Standards Agency, 2006).

194
For HBCDDs, the predicted body burdens were lower than the observed levels of individual
HBCDDs in UK human milk when using the estimated dietary intake values of HBCDDs from
this study. This may be attributable to our focus on meat-related food samples in our study while
HBCDDs showed highest levels in vegetable, fruit and milk in previous UK studies compared
with meat and fish (Driffield et al., 2008; UK Food Standards Agency, 2006). As the levels of
∑HBCDDs in meat-related food samples in this study were comparable to this previous study
(UK Food Standards Agency, 2006), we also used the dietary intake estimated values of
HBCDDs in the previous study to predict HBCDDs body burden. This resulted in closer
agreement between the predicted and observed body burdens of individual HBCDDs. This
indicates that it is important to collect vegetables, fruits, milk and high water content food
samples when investigating the dietary intake estimation of HBCDDs.
To our knowledge, this is the first attempt to predict the body burden of EFRs in human milk. In
general, the predicted adult body burdens were in agreement with the observed levels in human
milk. As these predicted body burdens were based on assumed half-lives and absorption
efficiencies of EFRs extrapolated from known values for PBDEs, the good agreement between
predicted and observed body burdens indicates our target EFRs possess similar physicochemical
properties to PBDEs. However, more study is critical to obtain empirical values of the
bioaccessibility via various exposure routes and human half-lives for EFRs.
In this study, dietary exposure was shown to be the main contributor to UK adult body burdens
of DBE-DBCH and EH-TBB (64%-73%), while dust ingestion plays a more important role in
driving body burdens of BTBPE, BEH-TEBP, and DBDPE (accounting for 61%-83% of the
whole body burden) in UK adults.

195
In conclusion, good agreement was achieved between predicted and observed body burdens for
our target PBDEs, HBCDDs and EFRs given the simplicity of the used PK model, the scarcity of
information about crucial parameters like the half-lives of target compounds in human tissues,
and uncertainties about the bioaccessibility of target chemicals. Additionally, we have not
considered exposure via pathways including dermal contact with dust and flame-retarded
materials which may make important contributions.
Table 6.9 Comparison of predicted adult body burdens arising from average and median
daily exposures a to major target EFRs with observed levels in human milk samples
-DBE-DBCH -DBE-DBCH EH-TBB BTBPE BEH-TEBP DBDPE
Average intake (ng/day)
Dust 0.26 0.30 0.97 21.00 14.00 20.00
Diet 8.20 49.84 3.34 5.79 6.04 15.71
Air 2.30 1.70 0.17 0.31 0.17 0.44
Median intake (ng/day)
Dust 0.16 0.18 0.19 1.50 2.60 6.50
Diet 7.72 49.59 3.48 4.19 6.75 9.53
Air 1.70 1.20 0.05 0.13 0.04 0.10
Average predicted body burdens (ng/g lw)
Dust 0.01 0.02 0.04 0.15 0.10 0.003
Diet 0.43 2.61 0.15 0.04 0.04 0.003
Air 0.21 0.15 0.02 0.002 0.001 0.001
Sum 0.65 2.78 0.21 0.19 0.14 0.01
Median predicted body burdens (ng/g lw)
Dust 0.01 0.01 0.01 0.01 0.02 0.001
Diet 0.40 2.60 0.16 0.03 0.05 0.002
Air 0.15 0.11 0.005 0.001 0.0003 0.0001
Sum 0.57 2.72 0.17 0.04 0.07 0.003
Observed body burdens (ng/g lw)
Average 0.67 2.50 0.21 0.15 0.25 --
Median 0.60 1.20 0.16 <0.1 <0.1 <0.78
a) Values below LOQ were assumed to be 1/2 LOQ; b) Based on average adult dust ingestion rate of 20 mg/day
(Jones-Otazo et al., 2005) and average inhalation rate of 20 m3/day (Currado and Harrad, 1998) and average adult
weight of 70 kg; c) The average value were not calculated as the DF < 50%.

196
6.5 Conclusion
This chapter provides the first data on the levels of EFRs in UK human milk. The most
frequently detected compounds were α-DBE-DBCH, β-DBE-DBCH and EH-TBB. We also
examined the relationship between our estimated intakes via different pathways and the body
burdens using a simple one-compartment PK model. The results of this showed predicted adult
body burdens to be in agreement with observed levels in human milk for all studied FRs. In
summary, dust ingestion appears to constitute the major exposure pathway for adults to BDE
209, BTBPE, BEH-TEBP, and DBDPE, while dietary exposure was the major exposure pathway
contributing to body burdens of HBCDDs, tri-hexa BDEs, DBE-DBCH and EH-TBB.

197
CHAPTER 7 Summary and
Conclusions
The main achievements of this thesis relative to its objectives are summarised below:
7.1 The optimisation and validation of analytical methodology
Different extraction and clean-up methods were compared and applied successfully to a
variety of samples including air, dust, diet and human milk.
Analytical methods based on GC-NCI-MS were optimised and validated for the
separation and analysis of emerging and legacy FRs, as well as DBE-DBCH and DDC-
CO isomers.
7.2 Food, an e-waste processing area in Vietnam
A number of EFRs were found in chicken, fish, and pork samples from an e-waste
processing site in Vietnam, as well as high levels of HBCDDs. The most abundant EFR
detected was DDC-CO.
Some enantioselective enrichment of both - and -HBCDD was observed in chicken
samples.
For most of our target compounds, the main contributors to dietary exposure of both
adults and children were chicken liver and chicken eggs. Estimated daily dietary intakes
of HBCDDs were higher than those reported from other countries.
This study provides evidence that EFRs are already entering the waste stream leading to
environmental contamination when such waste is treated in an unregulated fashion. The

198
elevated concentrations of DDC-CO are of particular note. We hypothesise that over time,
environmental contamination with EFRs will rise as increasing numbers of products
containing these chemicals reach the end of their useful life.
7.3 Dust and air, UK
In both homes and offices, the more volatile EFRs included in this study such as DBE-
DBCH and PBBz were detected frequently in indoor air. In contrast to indoor air in this
study, the less volatile compounds were more frequently detected in office and house
dust. These include: DDC-CO, TBBPA-BDBPE and DBDPE.
The most abundant compounds in air were -DBE-DBCH and -DBE-DBCH in both
homes and offices. However, TBBPA-BDBPE was the most abundant compound in home
and office dust, followed by BEH-TEBP, BTBPE, and DBDPE.
The fβ-DBE-DBCH values fell between 0.32-2.88 (median value: 0.85) in indoor dust which
is lower than observed in the commercial product (1.0) but significantly higher than we
detected in indoor air (0.53-1.0; median =0.73; p<0.01).
PBDEs were the predominant FR class monitored to be detected in homes, contributing
44 % of ∑FRs. In contrast, EFRs were the principal contributor to ∑FRs in offices,
accounting for 83% of ∑FRs. Similarly, PBDEs were the predominant FR class in home
dust, contributing 66 % ∑FRs, while EFRs dominated in in office dust, accounting for
51% of ∑FRs.
Concentrations of some PBDEs are lower and those of some EFRs higher than in
previous UK studies, with such contrasting temporal trends suggesting replacement of
PBDEs by EFRs.

199
7.4 Food, UK
This is the first investigation of concentrations of EFRs in UK food samples. α-DBE-
DBCH, β-DBE-DBCH, EH-TBB, BTBPE, BEH-TEBP and DBDPE were detected in UK
food samples. β-DBE-DBCH was the most frequently detected and the predominant
compound in food samples.
The fβ-DBE-DBCH values (1.20 to 220) in our food samples exceed those detected in UK
indoor dust (0.32 to 2.88) (p < 0.01), indoor air (0.53 to 1.0) (p < 0.01) and the
commercial product (1.0), suggesting diastereomer-specific environmental
degradation/metabolism and/or isomerisation in the food chain.
The median value of fβ-DBE-DBCH in liver (80) in this study was substantially higher than
those found in meat (5.9), fish (6.1, tuna not included), eggs (7.1), and cheese (2.1)
suggesting that the uptake and metabolism of DBE-DBCH isomers is species- and
organism-dependent.
The levels of ∑PBDEs in this study are higher than those recorded in previous studies in
the UK conducted in 2003-2004 and 2006 (UK Food Standards Agency, 2006; UK Food
and Environment Research Agency, 2009) suggesting a gradual shift over time of PBDEs
from the indoor to the outdoor environment and thus our food supply.
7.5 Human milk, UK
Concentrations of our target EFRs in archived human milk samples (collected in 2010)
(human milk group 1) and human milk samples collected from 2014-2015 (human milk
group 2) were investigated for the first time. The DFs of all EFRs in human milk group 1
were lower than those in human milk group 2 even though the sample size of the latter is

200
smaller than the former, indicating the more widespread usage of these EFRs currently
than hitherto.
β-DBE-DBCH showed the highest DFs and concentrations in both human milk groups
which is similar to the findings in UK diet samples indicating the high bioaccumulative
potential in human milk. To our knowledge, this is the first report of β-DBE-DBCH in
human milk samples.
The values of fβ-DBE-DBCH ranged from 0.88 to 608, with a median of 9.6 which is
significantly higher than observed in UK indoor air (0.53-1.0) (p < 0.001) and dust (0.32-
2.88) (p < 0.001), indicating diastereomer-specific environmental
degradation/metabolism and/or isomerisation in humans. Of note, fβ-DBE-DBCH values in
human milk were statistically indistinguishable to those in diet samples (p > 0.05)
indicating the relatively higher abundance of β-DBE-DBCH compared with α-DBE-
DBCH may also result from dietary exposure to DBE-DBCH.
PBDEs are the predominant FR class in human milk, contributing 50% ∑FRs, followed
by EFRs.
7.6 Human exposure, UK
The estimated mean dietary intakes of ∑EFRs in the UK were 89 and 26 ng/day for
adults and toddlers, respectively, which are substantially higher than those received via
inhalation (4.3 and 0.66 ng/day for adults and toddlers, respectively) and comparable to
those intake via dust ingestion (27 and 38 ng/day for adults and toddlers, respectively).
In this study, dust ingestion appears to constitute the major exposure pathway for adults
to BDE-209, BTBPE, BEH-TEBP, and DBDPE, while dietary exposure was the major
exposure pathway contributing to body burdens of HBCDDs, tri-hexa BDEs, DBE-

201
DBCH and EH-TBB.
7.7 Comparison of FRs intake to human body burdens
Predicted body burdens appear reasonably close to measurements for PBDEs in this
study. This is consistent with the hypothesis that the main exposure route of PBDEs is
gradually shifting from indoor air and dust to our diet following declining use of PBDEs
(Harrad and Diamond, 2006). In this study, dietary intakes were the major exposure
pathway contributing to PBDE body burdens (56%-85% for tri-hexa BDEs) in the UK
population except for BDE-209 - for which dust ingestion accounted for ~90% of overall
body burden.
For HBCDDs, observed levels of individual HBCDDs in UK human milk exceeded the
predicted body burdens obtained when using the estimated dietary intake values of
HBCDDs from this study. This may be attributable to our focus on meat-related food
samples in our study while HBCDDs showed highest levels in vegetable, fruit and milk
in previous UK studies compared with meat and fish (Driffield et al., 2008; UK Food
Standards Agency, 2006).
This is the first attempt to predict the body burden of EFRs in human milk. In general, the
predicted adult body burdens were in agreement with the observed levels in human milk.
As these predicted body burdens were based on assumed half-lives and absorption
efficiencies of EFRs extrapolated from known values for PBDEs, the good agreement
between predicted and observed body burdens indicates our target EFRs possess similar
physicochemical properties to PBDEs. However, more study is critical to obtain
empirical values of the bioaccessibility via various exposure routes and human half-lives
for EFRs.

202
7.8 Research gaps and future perspectives
Following the phase-out of PBDEs and HBCDDs due to health concerns, there is increasing
demands for EFRs, some of which potentially show PBT characteristics and may pose health
risks to human and wildlife, especially those produced and used in high volumes. Therefore,
further investigations are needed to:
Enhance communication with EFR producers and end-users in order to identify EFRs
likely to be present in the environment.
Gather more data on concentrations of EFRs, PBDEs and HBCDDs in samples relevant
to human exposure including indoor air, dust and diet to investigate the relative
importance of various exposure pathways in future and further examine the impacts of
recent controls on the use and production of EFRs and “legacy” FRs. More data are also
required to identify the levels of EFRs in outdoor air.
Further understanding of the transfer mechanisms of EFRs from commercial products
(e.g. foam chair, sofa, TV, computer, printer and fridge) to indoor air and dust as well as
the causes of variability (e.g. temperature, ventilation rates, room size and the number of
appliance) in EFR levels in indoor environments such as office and home.
Investigate the human bioaccessibility of EFRs via different human exposure pathways
like dust ingestion, dermal contact and air inhalation as well as pharmacokinetic data (e.g.
half-lives) of those compounds to better predict the body burdens of those compounds in
different human tissues.
Improve knowledge of the potential adverse health effects/toxicity of EFRs to facilitate
risk assessment of EFRs for human beings and enable the determination of a tolerable
daily intake for EFRs.

203
Better understanding the degradation pathways and rates of EFRs in environment and
biota and the factors such as temperature, exposure concentrations and chemical structure
affecting the generation of metabolites and degradation rates.
Elucidate the relationship between the intake of EFRs through different human exposure
pathways for different age groups and the resultant body burdens to assess the relative
significance of each exposure route. More biomonitoring studies based on human milk
and serum are desirable as well as studies based on less invasive media such as hair,
saliva, and faeces specifically for infants and children.

204
References
A A Nomeir, P M Markham, B I Ghanayem, M.C., 1993. Disposition of the flame retardant 1,2-
bis(2,4,6-tribromophenoxy)ethane in rats following administration in the diet. Drug Metab.
Dispos. 21, 209–214.
Abdallah, M., 2009. Investigating the sources and magnitude of human exposure to halogenated
organic pollutants using advanced methods for environmental analysis. The University of
Birmingham.
Abdallah, M. A., Harrad, S., Collins, C., & Tilston, E., 2009. Preliminary assessment of
bioaccessibility of HBCDs from human GIT following indoor dust ingestion using a
physiologically based extraction test (PBET). Organohalogen Compd. 71, 100-104.
Abdallah, M.A.-E., Harrad, S., 2010. Modification and calibration of a passive air sampler for
monitoring vapor and particulate phase brominated flame retardants in indoor air:
application to car interiors. Environ. Sci. Technol. 44, 3059–65.
Abdallah, M.A.-E., Harrad, S., 2011. Tetrabromobisphenol-A, hexabromocyclododecane and its
degradation products in UK human milk: Relationship to external exposure. Environ. Int.
37, 443–448.
Abdallah, M.A.-E., Harrad, S., 2014. Polybrominated diphenyl ethers in UK human milk:
implications for infant exposure and relationship to external exposure. Environ. Int. 63,
130–6.
Abdallah, M.A.E., Harrad, S., Covaci, A., 2008. Hexabromocyclododecanes and

205
tetrabromobisphenol-A in indoor air and dust in Birmingham, UK: Implications for human
exposure. Environ. Sci. Technol. 42, 6855–6861.
Abdallah, M.A.-E., Harrad, S., Covaci, A., 2008. Hexabromocyclododecanes and
Tetrabromobisphenol-A in Indoor Air and Dust in Birmingham, UK: Implications for
Human Exposure. Environ. Sci. Technol. 42, 6855–6861.
Abdallah, M.A.-E., Tilston, E., Harrad, S., Collins, C., 2012. In vitro assessment of the
bioaccessibility of brominated flame retardants in indoor dust using a colon extended model
of the human gastrointestinal tract. J. Environ. Monit. 14, 3276–3283.
Abdallah, M.A.E., Pawar, G. and Harrad, S., 2015a. Effect of bromine substitution on human
dermal absorption of polybrominated diphenyl ethers. Environmental science & technology,
49(18), pp.10976-10983.
Abdallah, M.A.E., Pawar, G. and Harrad, S., 2015b. Evaluation of 3D-human skin equivalents
for assessment of human dermal absorption of some brominated flame retardants.
Environment international, 84, pp.64-70.
Alaee, M., Arias, P., Sjödin, A., Bergman, Å., 2003. An overview of commercially used
brominated flame retardants, their applications, their use patterns in different
countries/regions and possible modes of release. Environ. Int. 29, 683–689.
Ali, N., Dirtu, A.C., Eede, N. Van den, Goosey, E., Harrad, S., Neels, H., ’t Mannetje, A.,
Coakley, J., Douwes, J., Covaci, A., 2012a. Occurrence of alternative flame retardants in
indoor dust from New Zealand: Indoor sources and human exposure assessment.
Chemosphere 88, 1276–1282.

206
Ali, N., Harrad, S., Goosey, E., Neels, H., Covaci, A., 2011a. “Novel” brominated flame
retardants in Belgian and UK indoor dust: Implications for human exposure. Chemosphere
83, 1360–1365.
Ali, N., Harrad, S., Muenhor, D., Neels, H., Covaci, A., 2011b. Analytical characteristics and
determination of major novel brominated flame retardants (NBFRs) in indoor dust. Anal.
Bioanal. Chem. 400, 3073–3083.
Ali, N., Van den Eede, N., Dirtu, a. C., Neels, H., Covaci, a., 2012b. Assessment of human
exposure to indoor organic contaminants via dust ingestion in Pakistan. Indoor Air 22, 200–
211.
Alivernini, S., Battistelli, C.L., Turrio-Baldassarri, L., 2011. Human milk as a vector and an
indicator of exposure to PCBs and PBDEs: temporal trend of samples collected in Rome.
Bull. Environ. Contam. Toxicol. 87, 21–5.
Antignac, J.-P., Cariou, R., Maume, D., Marchand, P., Monteau, F., Zalko, D., Berrebi, A.,
Cravedi, J.-P., Andre, F., Le Bizec, B., 2008. Exposure assessment of fetus and newborn to
brominated flame retardants in France: preliminary data. Mol. Nutr. Food Res. 52, 258–265.
Antignac, J.-P., Cariou, R., Zalko, D., Berrebi, A., Cravedi, J.-P., Maume, D., Marchand, P.,
Monteau, F., Riu, A., Andre, F., Le Bizec, B., 2009. Exposure assessment of French women
and their newborn to brominated flame retardants: determination of tri- to deca-
polybromodiphenylethers (PBDE) in maternal adipose tissue, serum, breast milk and cord
serum. Environ. Pollut. 157, 164–73.
Arinaitwe, K., Muir, D.C.G., Kiremire, B.T., Fellin, P., Li, H., Teixeira, C., 2014.

207
Polybrominated diphenyl ethers and alternative flame retardants in air and precipitation
samples from the Northern Lake Victoria Region, East Africa. Environ. Sci. Technol. 48,
1458–1466.
Arsenault, G., Lough, A., Marvin, C., McAlees, A., McCrindle, R., MacInnis, G., Pleskach, K.,
Potter, D., Riddell, N., Sverko, E., Tittlemier, S., Tomy, G., 2008. Structure characterization
and thermal stabilities of the isomers of the brominated flame retardant 1,2-dibromo-4-(1,2-
dibromoethyl)cyclohexane. Chemosphere 72, 1163–1170.
Asnake, S., Pradhan, A., Kharlyngdoh, J.B., Modig, C., Olsson, P.-E., 2015. The brominated
flame retardants TBP-AE and TBP-DBPE antagonize the chicken androgen receptor and act
as potential endocrine disrupters in chicken LMH cells. Toxicol. Vitr. 29, 1993–2000.
Bakker, M.I., de Winter-Sorkina, R., de Mul, A., Boon, P.E., van Donkersgoed, G., van Klaveren,
J.D., Baumann, B. a, Hijman, W.C., van Leeuwen, S.P.J., de Boer, J., Zeilmaker, M.J., 2008.
Dietary intake and risk evaluation of polybrominated diphenyl ethers in The Netherlands.
Mol. Nutr. Food Res. 52, 204–216.
Batterman, S., Godwin, C., Chernyak, S., Jia, C., Charles, S., 2010. Brominated flame retardants
in offices in Michigan, USA. Environ. Int. 36, 548–56.
Bearr, J.S., Mitchelmore, C.L., Roberts, S.C., Stapleton, H.M., 2012. Species specific differences
in the in vitro metabolism of the flame retardant mixture, Firemaster® BZ-54. Aquat.
Toxicol. 124-125, 41–47.
Bearr, J.S., Stapleton, H.M., Mitchelmore, C.L., 2010. Accumulation and DNA damage in
fathead minnows (Pimephales promelas) exposed to 2 brominated flame-retardant mixtures,

208
Firemaster 550 and Firemaster BZ-54. Environ. Toxicol. Chem. 29, 722–9.
Belfroid, A., van den Berg, M., Seinen, W., Hermens, J., van Gestel, K., 1995. Uptake,
bioavailability and elimination of hydrophobic compounds in earthworms ( Eisenia andrei )
in field-contaminated soil. Environ. Toxicol. Chem. 14, 605–612.
Bergh, C., Torgrip, R., Emenius, G., Östman, C., 2011. Organophosphate and phthalate esters in
air and settled dust - a multi-location indoor study. Indoor Air 21, 67–76.
Bergman, Å., Rydén, A., Law, R.J., de Boer, J., Covaci, A., Alaee, M., Birnbaum, L., Petreas, M.,
Rose, M., Sakai, S., Van den Eede, N., van der Veen, I., 2012. A novel abbreviation standard
for organobromine, organochlorine and organophosphorus flame retardants and some
characteristics of the chemicals. Environ. Int. 49, 57–82.
Brock, W.J., Schroeder, R.E., McKnight, C. a., VanSteenhouse, J.L., Nyberg, J.M., 2010. Oral
Repeat Dose and Reproductive Toxicity of the Chlorinated Flame Retardant Dechlorane
Plus. Int. J. Toxicol. 29, 582–593.
Brominated Flame Retardants (BFRs) in Food. EFSA Journal 2012;10(10):2908. [125 pp.]
Available online: www.efsa.europa.eu/efsajournal
BSEF (2006). Bromine Science and Environmental Forum, Available at: http://www.bsef.com/
Burreau, S., Zebühr, Y., Broman, D., Ishaq, R., 2004. Biomagnification of polychlorinated
biphenyls (PCBs) and polybrominated diphenyl ethers (PBDEs) studied in pike (Esox
lucius), perch (Perca fluviatilis) and roach (Rutilus rutilus) from the Baltic Sea.
Chemosphere 55, 1043–1052.

209
Buser, H.R., 1986. Polybrominated dibenzofurans and dibenzo-p-dioxins: thermal reaction
products of polybrominated diphenyl ether flame retardants. Environ. Sci. Technol. 20,
404–408.
Cantón, R.F., Sanderson, J.T., Letcher, R.J., Bergman, A., van den Berg, M., 2005. Inhibition and
induction of aromatase (CYP19) activity by brominated flame retardants in H295R human
adrenocortical carcinoma cells. Toxicol. Sci. 88, 447–55.
Cao, Z., Xu, F., Covaci, A., Wu, M., Yu, G., Wang, B., Deng, S., Huang, J., 2014. Differences in
the seasonal variation of brominated and phosphorus flame retardants in office dust.
Environ. Int. 65, 100–6.
Cequier, E., Ionas, A.C., Covaci, A., Marcé, R.M., Becher, G., Thomsen, C., 2014. Occurrence of
a broad range of legacy and emerging flame retardants in indoor environments in Norway.
Environ. Sci. Technol. 48, 6827–35.
Cetin, B., Odabasi, M., 2008. Atmospheric concentrations and phase partitioning of
polybrominated diphenyl ethers (PBDEs) in Izmir, Turkey. Chemosphere 71, 1067–1078.
Chen, D., Bi, X., Zhao, J., Chen, L., Tan, J., Mai, B., Sheng, G., Fu, J., Wong, M., 2009.
Pollution characterization and diurnal variation of PBDEs in the atmosphere of an E-waste
dismantling region. Environ. Pollut. 157, 1051–7.
Chen, K., Zheng, J., Yan, X., Yu, L., Luo, X., Peng, X., Yu, Y., Yang, Z., Mai, B., 2014.
Dechlorane Plus in paired hair and serum samples from e-waste workers: Correlation and
differences. Chemosphere 123, 43–47.

210
Chu, S., Gauthier, L.T., Letcher, R.J., 2012. Alpha and beta isomers of
tetrabromoethylcyclohexane (TBECH) flame retardant: depletion and metabolite formation
in vitro using a model rat microsomal assay. Environ. Sci. Technol. 46, 10263–70.
Covaci, A., Gerecke, A.C., Law, R.J., Voorspoels, S., Kohler, M., Heeb, N. V, Leslie, H., Allchin,
C.R., de Boer, J., 2006. Hexabromocyclododecanes (HBCDs) in the Environment and
Humans: A Review. Environ. Sci. Technol. 40, 3679–3688.
Covaci, A., Harrad, S., Abdallah, M.A.E., Ali, N., Law, R.J., Herzke, D., de Wit, C.A., 2011.
Novel brominated flame retardants: A review of their analysis, environmental fate and
behaviour. Environ. Int. 37, 532–556.
Cristale, J., Lacorte, S., 2013. Development and validation of a multiresidue method for the
analysis of polybrominated diphenyl ethers, new brominated and organophosphorus flame
retardants in sediment, sludge and dust. J. Chromatogr. A 1305, 267–275.
Crump, D., Chiu, S., Gauthier, L.T., Hickey, N.J., Letcher, R.J., Kennedy, S.W., 2011. The effects
of Dechlorane Plus on toxicity and mRNA expression in chicken embryos: a comparison of
in vitro and in ovo approaches. Comp. Biochem. Physiol. C. Toxicol. Pharmacol. 154, 129–
34.
Currado, G.M., Harrad, S., 1998. Comparison of polychlorinated biphenyl concentrations in
indoor and outdoor air and the potential significance of inhalation as a human exposure
pathway. Environ. Sci. Technol. 32, 3043–3047.
D’Hollander, W., Roosens, L., Covaci, A., Cornelis, C., Reynders, H., Campenhout, K. Van,
Voogt, P. De, Bervoets, L., 2010. Brominated flame retardants and perfluorinated

211
compounds in indoor dust from homes and offices in Flanders, Belgium. Chemosphere 81,
478–487.
Davis, E.F., Stapleton, H.M., 2009. Photodegradation Pathways of Nonabrominated Diphenyl
Ethers, 2-Ethylhexyltetrabromobenzoate and Di(2-ethylhexyl)tetrabromophthalate:
Identifying Potential Markers of Photodegradation. Environ. Sci. Technol. 43, 5739–5746.
de Geus, H.J., Wester, P.G., de Boer, J., Brinkman, U.A., 2000. Enantiomer fractions instead of
enantiomer ratios. Chemosphere 41, 725–727.
de la Torre, A., Sverko, E., Alaee, M., Martínez, M.Á., 2011. Concentrations and sources of
Dechlorane Plus in sewage sludge. Chemosphere 82, 692–7.
de Winter-Sorkina R, Bakker MI, van Donkersgoed G, van K.J., 2003. Dietary intake of
brominated flame retardants by the Dutch population - National Institute for Public Health
and the Environment.
Devanathan, G., Subramanian, A., Sudaryanto, A., Takahashi, S., Isobe, T., Tanabe, S., 2012.
Brominated flame retardants and polychlorinated biphenyls in human breast milk from
several locations in India: Potential contaminant sources in a municipal dumping site.
Environ. Int. 39, 87–95.
Dirtu, A.C., Covaci, A., 2010. Estimation of Daily Intake of Organohalogenated Contaminants
from Food Consumption and Indoor Dust Ingestion in Romania. Environ. Sci. Technol. 44,
6297–6304.
Dodson, R.E., Perovich, L.J., Covaci, A., Van den Eede, N., Ionas, A.C., Dirtu, A.C., Brody, J.G.,

212
Rudel, R.A., 2012. After the PBDE Phase-Out: A Broad Suite of Flame Retardants in
Repeat House Dust Samples from California. Environ. Sci. Technol. 46, 13056–13066.
Domingo, J.L., Martí-Cid, R., Castell, V., Llobet, J.M., 2008. Human exposure to PBDEs
through the diet in Catalonia, Spain: Temporal trend: A review of recent literature on dietary
PBDE intake. Toxicology 248, 25–32.
Drage, D.S., Newton, S., Wit, C.A. De, Harrad, S., 2016. Concentrations of legacy and emerging
fl ame retardants in air and soil on a transect in the UK West Midlands. Chemosphere 148,
195–203.
Driffield, M., Harmer, N., Bradley, E., Fernandes, A.R., Rose, M., Mortimer, D., Dicks, P., 2008.
Determination of brominated flame retardants in food by LC–MS/MS: diastereoisomer-
specific hexabromocyclododecane and tetrabromobisphenol A. Food Addit. Contam. Part A
25, 895–903.
Dungey, S and Akintoye, L., 2007. Environmental Risk Evaluation Report: 1, 1’-(Ethane-1, 2-
diyl) bis [penta-bromobenzene](CAS: 84852-53-9).
Dunn, R.L., Huwe, J.K., Carey, G.B., 2010. Biomonitoring polybrominated diphenyl ethers in
human milk as a function of environment, dietary intake, and demographics in New
Hampshire. Chemosphere 80, 1175–82.
Egloff, C., Crump, D., Chiu, S., Manning, G., McLaren, K.K., Cassone, C.G., Letcher, R.J.,
Gauthier, L.T., Kennedy, S.W., 2011. In vitro and in ovo effects of four brominated flame
retardants on toxicity and hepatic mRNA expression in chicken embryos. Toxicol. Lett. 207,
25–33.

213
Eljarrat, E., Gorga, M., Gasser, M., Díaz-Ferrero, J., Barceló, D., 2014. Dietary Exposure
Assessment of Spanish Citizens to Hexabromocyclododecane through the Diet. J. Agric.
Food Chem. 62, 2462–2468.
Eljarrat, E., Guerra, P., Marti, E., Farre, M., Alvarez, J.G., Lo, M., Barcelo, D., Technol, E.S.,
Asap, A., Mart, E., E, M.F., 2009. Hexabromocyclododecane in Human Breast Milk :
Levels and Enantiomeric Patterns Hexabromocyclododecane in Human Breast Milk : Levels
and Enantiomeric Patterns. Environ. Sci. Technol. 43, 1940–1946.
ESIS (2010). European Chemical Substance Information System. European Commission, Joint
Research Centre, European Chemicals Bureau.
Ezechiáš, M., Svobodová, K., Cajthaml, T., 2012. Hormonal activities of new brominated flame
retardants. Chemosphere 87, 820–824.
Fang, M., Stapleton, H.M., 2014. Evaluating the Bioaccessibility of Flame Retardants in House
Dust Using an In Vitro Tenax Bead-Assisted Sorptive Physiologically Based Method.
Environ. Sci. Technol. 48, 13323–13330.
Fängström, B., Athanassiadis, I., Odsjö, T., Norén, K., Bergman, A., 2008. Temporal trends of
polybrominated diphenyl ethers and hexabromocyclododecane in milk from Stockholm
mothers, 1980-2004. Mol. Nutr. Food Res. 52, 187–93.
Feo, M.L., Barón, E., Eljarrat, E., Barceló, D., 2012. Dechlorane Plus and related compounds in
aquatic and terrestrial biota: a review. Anal. Bioanal. Chem. 404, 2625–2637.
Fink U, Hajduk F, Wei Y, Mori H (2008). Flame Retardants. SRI Consulting SCUP Report Flame

214
Retardants.
Fernandes, A., Smith, F., Petch, R., Panton, S., Carr, M., Mortimer, D., Tlustos, C., Rose, M.,
2010. The Emerging BFRs Hexabromobenzene (HBB), Bis (246-tribromophenoxy) ethane
(BTBPE), and Decabromodiphenylethane (DBDPE) in UK and Irish Foods. Proc. BFR
2010, Kyoto, Japan 90028.
Frederiksen, M., Vorkamp, K., Thomsen, M., Knudsen, L.E., 2009. Human internal and external
exposure to PBDEs - A review of levels and sources. Int. J. Hyg. Environ. Health 212, 109–
134.
Fromme, H., Hilger, B., Kopp, E., Miserok, M., Völkel, W., 2014. Polybrominated diphenyl
ethers (PBDEs), hexabromocyclododecane (HBCD) and “novel” brominated flame
retardants in house dust in Germany. Environ. Int. 64, 61–8.
Fromme, H., Körner, W., Shahin, N., Wanner, A., Albrecht, M., Boehmer, S., Parlar, H., Mayer,
R., Liebl, B., Bolte, G., 2009. Human exposure to polybrominated diphenyl ethers (PBDE),
as evidenced by data from a duplicate diet study, indoor air, house dust, and biomonitoring
in Germany. Environ. Int. 35, 1125–1135.
Gandhi, N., Bhavsar, S.P., Gewurtz, S.B., Tomy, G.T., 2011. Can biotransformation of BDE-209
in lake trout cause bioaccumulation of more toxic, lower-brominated PBDEs (BDE-47, -99)
over the long term? Environ. Int. 37, 170–177.
Gao, S., Wang, J., Yu, Z., Guo, Q., Sheng, G., Fu, J., 2011. Hexabromocyclododecanes in
Surface Soils from E-Waste Recycling Areas and Industrial Areas in South China:
Concentrations, Diastereoisomer- and Enantiomer-Specific Profiles, and Inventory.

215
Environ. Sci. Technol. 45, 2093–2099.
Gauthier, L.T., Potter, D., Hebert, C.E., Letcher, R.J., 2008. Temporal Trends and Spatial
Distribution of Non-polybrominated Diphenyl Ether Flame Retardants in the Eggs of
Colonial Populations of Great Lakes Herring Gulls. Environ. Sci. Technol. 43, 312–317.
Gemmill, B., Pleskach, K., Peters, L., Palace, V., Wautier, K., Park, B., Darling, C., Rosenberg,
B., McCrindle, R., Tomy, G.T., 2011. Toxicokinetics of tetrabromoethylcyclohexane
(TBECH) in juvenile brown trout (Salmo trutta) and effects on plasma sex hormones.
Aquat. Toxicol. 101, 309–317.
Geyer, H.J., Schramm, K.-W., Darnerud, P.O., Aune, M., Feicht, A., Fried, K.W., Henkelmann,
B., Lenoir, D., Schmid, P., Mcdonald, T. a, 2004. Terminal elimination half-lives of the
brominated flame retardants TBBPA , HBCD , and lower brominated PBDEs in humans.
Organohalogen Compd. 66, 3820–3825.
Gómara, B., Herrero, L., Pacepavicius, G., Ohta, S., Alaee, M., González, M.J., 2011.
Occurrence of co-planar polybrominated/chlorinated biphenyls (PXBs), polybrominated
diphenyl ethers (PBDEs) and polychlorinated biphenyls (PCBs) in breast milk of women
from Spain. Chemosphere 83, 799–805.
Goscinny, S., Vandevijvere, S., Maleki, M., Overmeire, I. Van, Windal, I., Hanot, V., Blaude, M.-
N., Vleminckx, C., Loco, J. Van, 2011. Dietary intake of hexabromocyclododecane
diastereoisomers (α-, β-, and γ-HBCD) in the Belgian adult population. Chemosphere 84,
279–288.
Gouteux, B., Alaee, M., Mabury, S. a., Pacepavicius, G., Muir, D.C.G., 2008. Polymeric

216
brominated flame retardants: Are they a relevant source of emerging brominated aromatic
compounds in the environment? Environ. Sci. Technol. 42, 9039–9044.
Guerra, P., Alaee, M., Jiménez, B., Pacepavicius, G., Marvin, C., MacInnis, G., Eljarrat, E.,
Barceló, D., Champoux, L., Fernie, K., 2012. Emerging and historical brominated flame
retardants in peregrine falcon (Falco peregrinus) eggs from Canada and Spain. Environ. Int.
40, 179–86.
Guo, J., Li, Z., Sandy, A.L., Li, A., 2014. Method development for simultaneous analyses of
multiple legacy and emerging organic chemicals in sediments. J. Chromatogr. A 1370, 1–8.
Hakk, H., Larsen, G., Bowers, J., 2004. Metabolism, tissue disposition, and excretion of 1,2-
bis(2,4,6-tribromophenoxy)ethane (BTBPE) in male Sprague-Dawley rats. Chemosphere
54, 1367–74.
Hale, R.C., Alaee, M., Manchester-Neesvig, J.B., Stapleton, H.M., Ikonomou, M.G., 2003.
Polybrominated diphenyl ether flame retardants in the North American environment.
Environ. Int. 29, 771–9.
Hamers, T., 2006. In Vitro Profiling of the Endocrine-Disrupting Potency of Brominated Flame
Retardants. Toxicol. Sci. 92, 157–173.
Haneke, K.E., 2002. Tetrabromobisphenol A bis(2,3-dibromopropyl ether) [21850- 44-2] Review
of Toxicological Literature. National Institute of Environmental Health Sciences, Integrated
Laboratory Systems, Inc., North Carolina.
Hardy, M.L., Margitich, D., Ackerman, L., Smith, R.L., 2002. The subchronic oral toxicity of

217
ethane, 1,2-bis(pentabromophenyl) (Saytex 8010) in rats. Int. J. Toxicol. 21, 165–170.
Harju, M., Heimstad E. S., Herzke D., Sandanger T., Posner S., Wania F., 2009. "Emerging
“new” brominated flame retardants in flame retarded products and the environment." SFT
report 2462.
Harner, T., Shoeib, M., 2002. Measurements of octanol-air partition coefficients (KOA) for
polybrominated diphenyl ethers (PBDEs): Predicting partitioning in the environment. J.
Chem. Eng. Data 47, 228–232.
Harrad, S., Abdallah, M.A.E., 2011. Brominated flame retardants in dust from UK cars - Within-
vehicle spatial variability, evidence for degradation and exposure implications.
Chemosphere 82, 1240–1245.
Harrad, S., Abdallah, M.A.E., Covaci, A., 2009a. Causes of variability in concentrations and
diastereomer patterns of hexabromocyclododecanes in indoor dust. Environ. Int. 35, 573–9.
Harrad, S., Abdallah, M.A.E., Rose, N.L., Turner, S.D., Davidson, T.A., 2009b. Current-Use
Brominated Flame Betardants in Water, Sediment, and Fish from English Lakes. Environ.
Sci. Technol. 43, 9077–9083.
Harrad, S., de Wit, C.A., Abdallah, M.A.E., Bergh, C., Björklund, J.A., Covaci, A., Darnerud,
P.O., de Boer, J., Diamond, M., Huber, S., Leonards, P.E.G., Mandalakis, M., Östman, C.,
Haug, L.S., Thomsen, C., Webster, T.F., 2010. Indoor contamination with
hexabromocyclododecanes, polybrominated diphenyl ethers, and perfluoroalkyl
compounds: An important exposure pathway for people? Environ. Sci. Technol. 44, 3221–
3231.

218
Harrad, S., Hazrati, S., Ibarra, C., 2006a. Concentrations of polychlorinated biphenyls in indoor
air and polybrominated diphenyl ethers in indoor air and dust in Birmingham, United
Kingdom: implications for human exposure. Environ. Sci. Technol. 40, 4633–4638.
Harrad, S., Diamond, M., 2006b. New Directions: Exposure to polybrominated diphenyl ethers
(PBDEs) and polychlorinated biphenyls (PCBs): Current and future scenarios. Atmos.
Environ. 40, 1187–1188.
Harrad, S., Ibarra, C., Abdallah, M.A.E., Boon, R., Neels, H., Covaci, A., 2008a. Concentrations
of brominated flame retardants in dust from United Kingdom cars, homes, and offices:
Causes of variability and implications for human exposure. Environ. Int. 34, 1170–1175.
Harrad, S., Ibarra, C., Diamond, M., Melymuk, L., Robson, M., Douwes, J., Roosens, L., Dirtu,
A.C., Covaci, A., 2008b. Polybrominated diphenyl ethers in domestic indoor dust from
Canada, New Zealand, United Kingdom and United States. Environ. Int. 34, 232–238.
Harrad, S., Wijesekera, R., Hunter, S., Halliwell, C., Baker, R., 2004. Preliminary assessment of
UK human dietary and inhalation exposure to polybrominated diphenyl ethers. Environ. Sci.
Technol. 38, 2345–2350.
Hassine, S. Ben, Ameur, W. Ben, Gandoura, N., Driss, M.R., 2012. Determination of chlorinated
pesticides, polychlorinated biphenyls, and polybrominated diphenyl ethers in human milk
from Bizerte (Tunisia) in 2010. Chemosphere 89, 369–77.
He, M.J., Luo, X.J., Chen, M.Y., Sun, Y.X., Chen, S.J., Mai, B.X., 2012. Bioaccumulation of
polybrominated diphenyl ethers and decabromodiphenyl ethane in fish from a river system
in a highly industrialized area, South China. Sci. Total Environ.

219
He, M.J., Luo, X.J., Yu, L.H., Liu, J., Zhang, X.L., Chen, S.J., Chen, D., Mai, B.X., 2010.
Tetrabromobisphenol-A and hexabromocyclododecane in birds from an e-waste region in
South China: influence of diet on diastereoisomer- and enantiomer-specific distribution and
trophodynamics. Environ. Sci. Technol. 44, 5748–54.
Hoh, E., Zhu, Hites, R.A., 2005. Novel Flame Retardants, 1,2-Bis(2,4,6-tribromophenoxy)ethane
and 2,3,4,5,6-Pentabromoethylbenzene, in United States’ Environmental Samples. Environ.
Sci. Technol. 39, 2472–2477.
Howard, P.H., Muir, D.C.G., 2010. Identifying new persistent and bioaccumulative organics
among chemicals in commerce. Environ. Sci. Technol. 44, 2277–85.
Janák, K., Covaci, A., Voorspoels, S., Becher, G., 2005. Hexabromocyclododecane in Marine
Species from the Western Scheldt Estuary: Diastereoisomer- and Enantiomer-Specific
Accumulation. Environ. Sci. Technol. 39, 1987–1994.
Janák, K., Sellström, U., Johansson, A.K., Becher, G., de Wit, C.A., Lindberg, P., Helander, B.,
2008. Enantiomer-specific accumulation of hexabromocyclododecanes in eggs of predatory
birds. Chemosphere 73, S193–S200.
Johnson, P.I., Stapleton, H.M., Mukherjee, B., Hauser, R., Meeker, J.D., 2013. Associations
between brominated flame retardants in house dust and hormone levels in men. Sci. Total
Environ. 445-446, 177–184.
Johnson-Restrepo, B., Kannan, K., 2009. An assessment of sources and pathways of human
exposure to polybrominated diphenyl ethers in the United States. Chemosphere 76, 542–
548.

220
Jones-Otazo, H.A., Clarke, J.P., Diamond, M.L., Archbold, J.A., Ferguson, G., Harner, T.,
Richardson, G.M., Ryan, J.J., Wilford, B., 2005. Is house dust the missing exposure
pathway for PBDEs? An analysis of the urban fate and human exposure to PBDEs. Environ.
Sci. Technol. 39, 5121–5130.
Kajiwara, N., Y. Noma, and H. Takigami, 2007. Photolytic debromination of Deca-BDE and
DBDPE in flame-retarded plastics. Organohalogen Compd. 69, 924-8.
Kang, J.H., Kim, J.C., Jin, G.Z., Park, H., Baek, S.Y., Chang, Y.S., 2010. Detection of
Dechlorane Plus in fish from urban-industrial rivers. Chemosphere 79, 850–4.
Kang, Y., Wang, H.S., Cheung, K.C., Wong, M.H., 2011. Polybrominated diphenyl ethers
(PBDEs) in indoor dust and human hair. Atmos. Environ. 45, 2386–2393.
Kavlock, R.J., Daston, G.P., DeRosa, C., Fenner-Crisp, P., Gray, L.E., Kaattari, S., Lucier, G.,
Luster, M., Mac, M.J., Maczka, C. and Miller, R., 1996. Research needs for the risk
assessment of health and environmental effects of endocrine disruptors: a report of the US
EPA-sponsored workshop. Environmental health perspectives, 104(Suppl 4), p.715.
Karlsson, M., Julander, A., van Bavel, B., Hardell, L., 2007. Levels of brominated flame
retardants in blood in relation to levels in household air and dust. Environ. Int. 33, 62–69.
Khalaf, H., Larsson, A., Berg, H., McCrindle, R., Arsenault, G. and Olsson, P.E., 2009.
Diastereomers of the brominated flame retardant 1, 2-dibromo-4-(1, 2 dibromoethyl)
cyclohexane induce androgen receptor activation in the hepg2 hepatocellular carcinoma cell
line and the lncap prostate cancer cell line. Environmental health perspectives, pp.1853-
1859.

221
Kierkegaard, A., Björklund, J., Fridén, U., 2004. Identification of the Flame Retardant
Decabromodiphenyl Ethane in the Environment. Environ. Sci. Technol. 38, 3247–3253.
Kierkegaard, A., Sellström, U., McLachlan, M.S., 2009. Environmental analysis of higher
brominated diphenyl ethers and decabromodiphenyl ethane. J. Chromatogr. A 1216, 364–
375.
Kim, U.-J., Lee, I.-S., Kim, H.S., Oh, J.-E., 2011. Monitoring of PBDEs concentration in
umbilical cord blood and breast milk from Korean population and estimating the effects of
various parameters on accumulation in humans. Chemosphere 85, 487–93.
Knudsen, G. a., Jacobs, L.M., Kuester, R.K., Sipes, I.G., 2007. Absorption, distribution,
metabolism and excretion of intravenously and orally administered tetrabromobisphenol A
[2,3-dibromopropyl ether] in male Fischer-344 rats. Toxicology 237, 158–167.
Kuramochi, H., Takigami, H., Scheringer, M., Sakai, S.-I., 2014. Estimation of physicochemical
properties of 52 non-PBDE brominated flame retardants and evaluation of their overall
persistence and long-range transport potential. Sci. Total Environ. 491-492, 108–17.
La Guardia, M.J., Hale, R.C., Harvey, E., 2006. Detailed Polybrominated Diphenyl Ether
(PBDE) Congener Composition of the Widely Used Penta-, Octa-, and Deca-PBDE
Technical Flame-retardant Mixtures. Environ. Sci. Technol. 40, 6247–6254.
La Guardia, M.J., Hale, R.C., Harvey, E., 2007. Evidence of debromination of
decabromodiphenyl ether (BDE-209) in biota from a wastewater receiving stream. Environ.
Sci. Technol. 41, 6663–6670.

222
Labunska, I., Abdallah, M.A.-E., Eulaers, I., Covaci, A., Tao, F., Wang, M., Santillo, D.,
Johnston, P., Harrad, S., 2015. Human dietary intake of organohalogen contaminants at e-
waste recycling sites in Eastern China. Environ. Int. 74, 209–220.
Labunska, I., Harrad, S., Santillo, D., Johnston, P., Yun, L., 2013. Domestic duck eggs: An
important pathway of human exposure to PBDEs around E-waste and scrap metal
processing areas in Eastern China. Environ. Sci. Technol. 47, 9258–9266.
Labunska, I., Harrad, S., Wang, M., Santillo, D., Johnston, P., 2014. Human Dietary Exposure to
PBDEs Around E-Waste Recycling Sites in Eastern China. Environ. Sci. Technol. 48, 5555–
5564.
Larsson, A., Eriksson, L. a, Andersson, P.L., Ivarson, P., Olsson, P.-E., 2006. Identification of the
brominated flame retardant 1,2-dibromo-4-(1,2-dibromoethyl)cyclohexane as an androgen
agonist. J. Med. Chem. 49, 7366–7372.
Law, K., Halldorson, T., Danell, R., Stern, G., Gewurtz, S., Alaee, M., Marvin, C., Whittle, M.,
Tomy, G., 2006a. Bioaccumulation and trophic transfer of some brominated flame
retardants in a Lake Winnipeg (Canada) food web. Environ. Toxicol. Chem. 25, 2177.
Law, K., Palace, V.P., Halldorson, T., Danell, R., Wautier, K., Evans, B., Alaee, M., Marvin, C.,
Tomy, G.T., 2006b. Dietary accumulation of hexabromocyclododecane diastereoisomers in
juvenile rainbow trout (Oncorhynchus mykiss) I: Bioaccumulation parameters and evidence
of bioisomerization. Environ. Toxicol. Chem. 25, 1757–1761.
Letcher, R.J., Marteinson, S.C., Fernie, K.J., 2014. Dietary exposure of American kestrels (Falco
sparverius) to decabromodiphenyl ether (BDE-209) flame retardant: Uptake, distribution,

223
debromination and cytochrome P450 enzyme induction. Environ. Int. 63, 182–190.
Li, X. and Yang, L. and Liu, E. and Xu, W., 2004. Research on the risk characteristics of
decabrominated diphenyl ethane. Prog Saf Sci Technol. In: Proc Int Symp B. pp. 2164–
2166.
Li, H., Zhang, B., Wei, Y., Wang, F., Lydy, M.J., You, J., 2014. Bioaccumulation of Highly
Hydrophobic Organohalogen Flame Retardants from Sediments: Application of
Toxicokinetics and Passive Sampling Techniques. Environ. Sci. Technol. 48, 6957–6964.
Li, H., Zhang, Q., Wang, P., Li, Y., Lv, J., Chen, W., Geng, D., Wang, Y., Wang, T., Jiang, G.,
2012. Levels and distribution of hexabromocyclododecane (HBCD) in environmental
samples near manufacturing facilities in Laizhou Bay area, East China. J. Environ. Monit.
14, 2591–2597.
Li, P., Wu, H., Li, Q., Jin, J., Wang, Y., 2015. Brominated flame retardants in food and
environmental samples from a production area in China: concentrations and human
exposure assessment. Environ. Monit. Assess. 187, 719.
Li, Y., Yu, L., Wang, J., Wu, J., Mai, B., Dai, J., 2013. Accumulation pattern of Dechlorane Plus
and associated biological effects on rats after 90 d of exposure. Chemosphere 90, 2149–
2156.
Liagkouridis, I., Cousins, A.P., Cousins, I.T., 2015. Physical–chemical properties and evaluative
fate modelling of “emerging” and “novel” brominated and organophosphorus flame
retardants in the indoor and outdoor environment. Sci. Total Environ. 524-525, 416–426.

224
Lignell, S., Aune, M., Glynn, A., Cantillana, T., Fridén, U., 2012. Levels of persistent
halogenated organic pollutants ( POP ) in mother ’ s milk from first-time mothers in
Uppsala , Sweden – results from 2008 / 2010 and temporal trends Levels of persistent
halogenated organic pollutants ( POP ) in mother ’ s milk from f.
Liu, H., Zhou, Q., Wang, Y., Zhang, Q., Cai, Z., Jiang, G., 2008. E-waste recycling induced
polybrominated diphenyl ethers, polychlorinated biphenyls, polychlorinated dibenzo-p-
dioxins and dibenzo-furans pollution in the ambient environment. Environ. Int. 34, 67–72.
Liu, L.Y., He, K., Hites, R.A., Salamova, A., 2016. Hair and Nails as Noninvasive Biomarkers of
Human Exposure to Brominated and Organophosphate Flame Retardants. Environ. Sci.
Technol. 50, 3065–3073.
Liu, L.Y., Salamova, A., Hites, R.A., 2014. Halogenated flame retardants in baby food from the
United States and from China and the estimated dietary intakes by infants. Environ. Sci.
Technol. 48, 9812–8.
Lorber, M., 2008. Exposure of Americans to polybrominated diphenyl ethers. J. Expo. Sci.
Environ. Epidemiol. 18, 2–19.
Ma, W.L., Liu, L.Y., Qi, H., Sun, D.Z., Shen, J.M., Wang, D.G., Li, Y.F., 2011. Dechlorane plus
in multimedia in northeastern Chinese urban region. Environ. Int. 37, 66–70.
Ma, Y., Salamova, A., Venier, M., Hites, R.A., 2013. Has the Phase-Out of PBDEs Affected Their
Atmospheric Levels? Trends of PBDEs and Their Replacements in the Great Lakes
Atmosphere. Environ. Sci. Technol. 47, 11457–11464.

225
Malarvannan, G., Isobe, T., Covaci, A., Prudente, M., Tanabe, S., 2013. Accumulation of
brominated flame retardants and polychlorinated biphenyls in human breast milk and scalp
hair from the Philippines: Levels, distribution and profiles. Sci. Total Environ. 442, 366–
379.
Mankidy, R., Ranjan, B., Honaramooz, A., Giesy, J.P., 2014. Effects of novel brominated flame
retardants on steroidogenesis in primary porcine testicular cells. Toxicol. Lett. 224, 141–
146.
Matthews HB, 1984. Head of Chemical Disposition Group, National Institute of Environemntal
Health Sciences. Letter with attachments to D. Canter. National Toxicology Program.
Bethesda, MD. November 16, 1984. As cited by Nomeir et al., 1993.
McGregor, D.B., Brown, A.G., Howgate, S., McBride, D., Riach, C., Caspary, W.J., Carver, J.H.,
1991. Responses of the L5178Y mouse lymphoma cell forward mutation assay. V: 27 coded
chemicals. Environ. Mol. Mutagen. 17, 196–219.
Mckinney, M. a., Letcher, R.J., Aars, J., Born, E.W., Branigan, M., Dietz, R., Evans, T.J.,
Gabrielsen, G.W., Peacock, E., Sonne, C., 2011a. Flame retardants and legacy contaminants
in polar bears from Alaska, Canada, East Greenland and Svalbard, 2005–2008. Environ. Int.
37, 365–374.
Mckinney, M.A., Dietz, R., Sonne, C., De Guise, S., Skirnisson, K., Karlsson, K.,
Steingr??msson, E., Letcher, R.J., 2011b. Comparative hepatic microsomal
biotransformation of selected PBDEs, including decabromodiphenyl ether, and
decabromodiphenyl ethane flame retardants in Arctic marine-feeding mammals. Environ.

226
Toxicol. Chem. 30, 1506–1514.
Melymuk, L., Robson, M., Helm, P. a., Diamond, M.L., 2012. PCBs, PBDEs, and PAHs in
Toronto air: Spatial and seasonal trends and implications for contaminant transport. Sci.
Total Environ. 429, 272–280.
Möller, A., Xie, Z., Cai, M., Zhong, G., Huang, P., Cai, M., Sturm, R., He, J., Ebinghaus, R.,
2011a. Polybrominated diphenyl ethers vs alternate brominated flame retardants and
Dechloranes from East Asia to the Arctic. Environ. Sci. Technol. 45, 6793–9.
Möller, A., Xie, Z., Sturm, R., Ebinghaus, R., 2011b. Polybrominated diphenyl ethers (PBDEs)
and alternative brominated flame retardants in air and seawater of the European Arctic.
Environ. Pollut. 159, 1577–1583.
Muir, D.C.G., Howard, P.H., 2006. Are there other persistent organic pollutants? A challenge for
environmental chemists. Environ. Sci. Technol. 40, 7157–7166.
Munschy, C., Héas-Moisan, K., Tixier, C., Boulesteix, L., Morin, J., 2011. Classic and novel
brominated flame retardants (BFRs) in common sole (Solea solea L.) from main nursery
zones along the French coasts. Sci. Total Environ. 409, 4618–27.
Nakari, T., Huhtala, S., 2009. In vivo and in vitro toxicity of decabromodiphenyl ethane, a flame
retardant. Environ. Toxicol. 25, 333–338.
Newton, S., Sellström, U., de Wit, C. a, 2015. Emerging Flame Retardants, PBDEs, and
HBCDDs in indoor and outdoor media in Stockholm, Sweden. Environ. Sci. Technol. 49,
2912–2920.

227
Nomeir, A.A., Markham, P.M., Ghanayem, B.I., Chadwick, M., 1993. Disposition of the flame
retardant 1,2-bis(2,4,6-tribromophenoxy)ethane in rats following administration in the diet.
Drug Metab. Dispos. 21, 209–14.
Noyes, P.D., Haggard, D.E., Gonnerman, G.D., Tanguay, R.L., 2015. Advanced morphological -
behavioral test platform reveals neurodevelopmental defects in embryonic zebrafish
exposed to comprehensive suite of halogenated and organophosphate flame retardants.
Toxicol. Sci. 145, 177–95.
NPCA (2008). Emerging “New” Brominated Flame Retardants in Flame Retarded Products and
the Environment. Norwegian Pollution Control Authority.
Nyholm, J.R., 2009. Persistency , bioaccumulation and toxicity assessment of selected
brominated flame retardants som med vederbörligt tillstånd av Rektorsämbetet vid Umeå
universitet.
Nyholm, J.R., Asamoah, R.K., van der Wal, L., Danielsson, C., Andersson, P.L., 2010a.
Accumulation of Polybrominated Diphenyl Ethers, Hexabromobenzene, and 1,2-Dibromo-
4-(1,2-dibromoethyl)cyclohexane in Earthworm (Eisenia fetida). Effects of Soil Type and
Aging. Environ. Sci. Technol. 44, 9189–9194.
Nyholm, J.R., Lundberg, C., Andersson, P.L., 2010b. Biodegradation kinetics of selected
brominated flame retardants in aerobic and anaerobic soil. Environ. Pollut. 158, 2235–40.
Official Journal of the European Union, 9 May 2008, Judgment of the Court of 1April 2008
(2008/C116/04).

228
OSPAR. OSPAR List of Chemicals for Priority Action. http:// http://www.ospar.org/work-
areas/hasec/chemicals/priority-action (Update 2007).
Park, B.J., Palace, V., Wautier, K., Gemmill, B., Tomy, G., 2011. Thyroid axis disruption in
juvenile brown trout (Salmo trutta) exposed to the flame retardant β-
tetrabromoethylcyclohexane (β-TBECH) via the diet. Environ. Sci. Technol. 45, 7923–7.
Patisaul, H.B., Roberts, S.C., Mabrey, N., McCaffrey, K.A., Gear, R.B., Braun, J., Belcher, S.M.,
Stapleton, H.M., 2013. Accumulation and endocrine disrupting effects of the flame retardant
mixture Firemaster® 550 in rats: an exploratory assessment. J. Biochem. Mol. Toxicol. 27,
124–36.
Peng, H., Wan, Y., Zhang, K., Sun, J., Hu, J., 2014. Trophic transfer of dechloranes in the marine
food web of Liaodong Bay, north China. Environ. Sci. Technol. 48, 5458–66.
Perelló, G., Martí-Cid, R., Castell, V., Llobet, J.M., Domingo, J.L., 2009. Concentrations of
polybrominated diphenyl ethers, hexachlorobenzene and polycyclic aromatic hydrocarbons
in various foodstuffs before and after cooking. Food Chem. Toxicol. 47, 709–15.
Pettersson-Julander, A., van Bavel, B., Engwall, M., Westberg, H., 2004. Personal air sampling
and analysis of polybrominated diphenyl ethers and other bromine containing compounds at
an electronic recycling facility in Sweden. J. Environ. Monit. 6, 874.
Pradhan, A., Asnake, S., Kharlyngdoh, J.B., Modig, C., Olsson, P.-E., 2015. In silico and
biological analysis of anti-androgen activity of the brominated flame retardants ATE, BATE
and DPTE in zebrafish. Chem. Biol. Interact. 233, 35–45.

229
Pradhan, A., Kharlyngdoh, J.B., Asnake, S., Olsson, P.-E., 2013. The brominated flame retardant
TBECH activates the zebrafish (Danio rerio) androgen receptor, alters gene transcription
and causes developmental disturbances. Aquat. Toxicol. 142-143, 63–72.
Public Health England and Food Standards Agency, National Diet and Nutrition Survey: results
from Years 1 to 4 (combined) of the rolling programme for 2008 and 2009 to 2011 and 2012
- Publications - GOV.UK. 2014. https://www.gov.uk/government/statistics/national-diet-
and-nutrition-survey-results-from-years-1-to-4-combined-of-the-rolling-programme-for-
2008-and-2009-to-2011-and-2012 (accessed 5.14.14).
Qi, H., Li, W.L., Liu, L.Y., Zhang, Z.F., Zhu, N.Z., Song, W.W., Ma, W.L., Li, Y.F., 2014. Levels,
distribution and human exposure of new non-BDE brominated flame retardants in the
indoor dust of China. Environ. Pollut. 195, 1–8.
Qiu, X., Marvin, C.H., Hites, R.A., 2007. Dechlorane Plus and Other Flame Retardants in a
Sediment Core from Lake Ontario. Environ. Sci. Technol. 41, 6014–6019.
Qiu, X., Zhu, T., Hu, J., 2010. Polybrominated diphenyl ethers (PBDEs) and other flame
retardants in the atmosphere and water from Taihu Lake, East China. Chemosphere 80,
1207–1212.
Qu, G., Liu, A., Wang, T., Zhang, C., Fu, J., Yu, M., Sun, J., Zhu, N., Li, Z., Wei, G., Du, Y., Shi,
J., Liu, S., Jiang, G., 2013. Identification of tetrabromobisphenol A allyl ether and
tetrabromobisphenol A 2,3-dibromopropyl ether in the ambient environment near a
manufacturing site and in mollusks at a coastal region. Environ. Sci. Technol. 47, 4760–7.
Rahm, S., Green, N., Norrgran, J., Bergman, A., 2005. Hydrolysis of environmental

230
contaminants as an experimental tool for indication of their persistency. Environ. Sci.
Technol. 39, 3128–33.
Reistad, T., Fonnum, F., Mariussen, E., 2006. Neurotoxicity of the pentabrominated diphenyl
ether mixture, DE-71, and hexabromocyclododecane (HBCD) in rat cerebellar granule cells
in vitro. Arch. Toxicol. 80, 785–796.
Reistad, T., Mariussen, E., Fonnum, F., 2005. The effect of a brominated flame retardant,
tetrabromobisphenol-A, on free radical formation in human neutrophil granulocytes: The
involvement of the MAP kinase pathway and protein kinase C. Toxicol. Sci. 83, 89–100.
Riddell, N., Arsenault, G., Klein, J., Lough, A., Marvin, C.H., McAlees, A., McCrindle, R.,
MacInnis, G., Sverko, E., Tittlemier, S., Tomy, G.T., 2009. Structural characterization and
thermal stabilities of the isomers of the brominated flame retardant 1,2,5,6-
tetrabromocyclooctane (TBCO). Chemosphere 74, 1538–1543.
Roberts, S.C., Macaulay, L.J., Stapleton, H.M., 2012. In vitro metabolism of the brominated
flame retardants 2-ethylhexyl-2,3,4,5-tetrabromobenzoate (TBB) and bis(2-ethylhexyl)
2,3,4,5-tetrabromophthalate (TBPH) in human and rat tissues. Chem. Res. Toxicol. 25,
1435–41.
Roosens, L., Abdallah, M.A.E., Harrad, S., Neels, H., Covaci, A., 2009a. Exposure to
Hexabromocyclododecanes (HBCDs) via Dust Ingestion, but Not Diet, Correlates with
Concentrations in Human Serum: Preliminary Results. Environ. Health Perspect. 117,
1707–1712.
Roosens, L., Abdallah, M.A.E., Harrad, S., Neels, H., Covaci, A., 2009b. Factors Influencing

231
Concentrations of Polybrominated Diphenyl Ethers (PBDEs) in Students from Antwerp,
Belgium. Environ. Sci. Technol. 43, 3535–3541.
Roosens, L., D’Hollander, W., Bervoets, L., Reynders, H., Van Campenhout, K., Cornelis, C.,
Van Den Heuvel, R., Koppen, G., Covaci, A., 2010. Brominated flame retardants and
perfluorinated chemicals, two groups of persistent contaminants in Belgian human blood
and milk. Environ. Pollut. 158, 2546–2552.
Rose, M., Fernandes, A., Mortimer, D., Baskaran, C., 2015. Contamination of fish in UK fresh
water systems: Risk assessment for human consumption. Chemosphere 122, 183–9.
Ruan, T., Wang, Y.W., Wang, C., Wang, P., Fu, J.J., Yin, Y.G., Qu, G.B., Wang, T., Jiang, G.B.,
2009. Identification and Evaluation of a Novel Heterocyclic Brominated Flame Retardant
Tris(2,3-dibromopropyl) Isocyanurate in Environmental Matrices near a Manufacturing
Plant in Southern China. Environ. Sci. Technol. 43, 3080–3086.
Ryan, J.J., Rawn, D.F.K., 2014. The brominated flame retardants, PBDEs and HBCD, in
Canadian human milk samples collected from 1992 to 2005; concentrations and trends.
Environ. Int. 70, 1–8.
Sahlström, L.M.O, Sellström, U., de Wit, C.A., 2012. Clean-up method for determination of
established and emerging brominated flame retardants in dust. Anal. Bioanal. Chem. 404,
459–466.
Sahlström, L.M.O., Sellström, U., de Wit, C.A., Lignell, S., Darnerud, P.O., 2014. Brominated
flame retardants in matched serum samples from Swedish first-time mothers and their
toddlers. Environ. Sci. Technol. 48, 7584–92.

232
Sahlström, L.M.O., Sellström, U., de Wit, C.A., Lignell, S., Darnerud, P.O., 2015. Estimated
intakes of brominated flame retardants via diet and dust compared to internal concentrations
in a Swedish mother-toddler cohort. Int. J. Hyg. Environ. Health 218, 422–32.
Salamova, A., Hermanson, M.H., Hites, R.A., 2014. Organophosphate and halogenated flame
retardants in atmospheric particles from a European Arctic site. Environ. Sci. Technol. 48,
6133–40.
Saunders, D.M.V., Higley, E.B., Hecker, M., Mankidy, R., Giesy, J.P., 2013. In vitro endocrine
disruption and TCDD-like effects of three novel brominated flame retardants: TBPH, TBB,
& TBCO. Toxicol. Lett. 223, 252–259.
Schecter, A., Haffner, D., Colacino, J., Patel, K., Päpke, O., Opel, M., Birnbaum, L., 2010.
Polybrominated Diphenyl Ethers (PBDEs) and Hexabromocyclodecane (HBCD) in
Composite U.S. Food Samples. Environ. Health Perspect. 118, 357–362.
Schecter, A., Harris, T.R., Brummitt, S., Shah, N., Paepke, O., 2008. PBDE and HBCD
Brominated Flame Retardants in the USA, Update 2008: Levels in Human Milk and Blood,
Food, and Environmental Samples. Epidemiology 19, S76–S76.
Schecter, A., Pavuk, M., Päpke, O., Ryan, J.J., Birnbaum, L., Rosen, R., 2003. Polybrominated
diphenyl ethers (PBDEs) in U.S. mothers’ milk. Environ. Health Perspect. 111, 1723–1729.
Schlabach, M., 2011. Brominated flame retardants (BFR) in the Nordic environment. Nordic
Council of Ministers.
Schuhmacher, M., Kiviranta, H., Ruokojärvi, P., Nadal, M., Domingo, J.L., 2009. Concentrations

233
of PCDD/Fs, PCBs and PBDEs in breast milk of women from Catalonia, Spain: a follow-up
study. Environ. Int. 35, 607–13.
She, J., Holden, A., Sharp, M., Tanner, M., Williams-Derry, C., Hooper, K., 2007.
Polybrominated diphenyl ethers (PBDEs) and polychlorinated biphenyls (PCBs) in breast
milk from the Pacific Northwest. Chemosphere 67, S307–17.
She, Y.Z., Wu, J.P., Zhang, Y., Peng, Y., Mo, L., Luo, X.J., Mai, B.X., 2013. Bioaccumulation of
polybrominated diphenyl ethers and several alternative halogenated flame retardants in a
small herbivorous food chain. Environ. Pollut. 174, 164–170.
Shi, T., Chen, S.J., Luo, X.J., Zhang, X.L., Tang, C.M., Luo, Y., Ma, Y.J., Wu, J.P., Peng, X.Z.,
Mai, B.X., 2009. Occurrence of brominated flame retardants other than polybrominated
diphenyl ethers in environmental and biota samples from southern China. Chemosphere 74,
910–916.
Shi, Z., Jiao, Y., Hu, Y., Sun, Z., Zhou, X., Feng, J., Li, J., Wu, Y., 2013. Levels of
tetrabromobisphenol A, hexabromocyclododecanes and polybrominated diphenyl ethers in
human milk from the general population in Beijing, China. Sci. Total Environ. 452-453, 10–
8.
Shi, Z.X., Wu, Y.N., Li, J.G., Zhao, Y.F., Feng, J.F., 2009. Dietary exposure assessment of
Chinese adults and nursing infants to tetrabromobisphenol-A and
hexabromocyclododecanes: Occurrence measurements in foods and human milk. Environ.
Sci. Technol. 43, 4314–4319.
Shoeib, M., Harner, T., Webster, G.M., Sverko, E., Cheng, Y., 2012. Legacy and current-use

234
flame retardants in house dust from Vancouver, Canada. Environ. Pollut. 169, 175–182.
Shy, C.G., Huang, H.L., Chao, H.R., Chang-Chien, G.P., 2012. Cord blood levels of thyroid
hormones and IGF-1 weakly correlate with breast milk levels of PBDEs in Taiwan. Int. J.
Hyg. Environ. Health 215, 345–51.
Sifleet, S.D., 2009. Toxicology of decabromodiphenyl ether in avian embryos: disposition of the
flame retardant BDE-209 in yolk-injected chicken embryos (Gallus gallus). The College of
William and Mary.
Sjödin, A., Carlsson, H., Thuresson, K., Sjölin, S., Bergman, Å., Östman, C., 2001. Flame
Retardants in Indoor Air at an Electronics Recycling Plant and at Other Work
Environments. Environ. Sci. Technol. 35, 448–454.
Sjödin, A., Patterson Jr, D.G., Bergman, A., 2003. A review on human exposure to brominated
flame retardants--particularly polybrominated diphenyl ethers. Environ. Int. 29, 829.
Someya, M., Suzuki, G., Ionas, A.C., Tue, N.M., Xu, F., Matsukami, H., Covaci, A., Tuyen, L.H.,
Viet, P.H., Takahashi, S., Tanabe, S., Takigami, H., 2015. Occurrence of emerging flame
retardants from e-waste recycling activities in the northern part of Vietnam. Emerg. Contam.
Stapleton, H.M., 2006. Instrumental methods and challenges in quantifying polybrominated
diphenyl ethers in environmental extracts: a review. Anal. Bioanal. Chem. 386, 807–817.
Stapleton, H.M., Alaee, M., Letcher, R.J., Baker, J.E., 2004. Debromination of the Flame
Retardant Decabromodiphenyl Ether by Juvenile Carp (Cyprinus carpio) following Dietary
Exposure. Environ. Sci. Technol. 38, 112–119.

235
Stapleton, H.M., Allen, J.G., Kelly, S.M., Konstantinov, A., Klosterhaus, S., Watkins, D.,
McClean, M.D., Webster, T.F., 2008. Alternate and New Brominated Flame Retardants
Detected in U.S. House Dust. Environ. Sci. Technol. 42, 6910–6916.
Stapleton, H.M., Brazil, B., Holbrook, R.D., Mitchelmore, C.L., Benedict, R., Konstantinov, A.,
Potter, D., 2006. In vivo and in vitro debromination of decabromodiphenyl ether (BDE 209)
by juvenile rainbow trout and common carp. Environ. Sci. Technol. 40, 4653–4658.
Stenzel, A., Goss, K.-U., Endo, S., 2013. Determination of polyparameter linear free energy
relationship (pp-LFER) substance descriptors for established and alternative flame
retardants. Environ. Sci. Technol. 47, 1399–406.
Stieger, G., Scheringer, M., Ng, C.A., Hungerbühler, K., 2014. Assessing the persistence,
bioaccumulation potential and toxicity of brominated flame retardants: Data availability and
quality for 36 alternative brominated flame retardants. Chemosphere 116, 118–123.
Stockholm Convention on POPs. 2009. Gov. Unite to step-up Reduct. Glob. DDT Reli. Add Nine
New Chem. Under Int. Treaty.
http://chm.pops.int/Convention/Pressrelease/COP4Geneva8May2009/tabid/542/language/en
-US/Default.aspx
Su, G., Liu, X., Gao, Z., Xian, Q., Feng, J., Zhang, X., Giesy, J.P., Wei, S., Liu, H., Yu, H., 2012.
Dietary intake of polybrominated diphenyl ethers (PBDEs) and polychlorinated biphenyls
(PCBs) from fish and meat by residents of Nanjing, China. Environ. Int. 42, 138–143.
Sun, R.X., Luo, X.J., Tan, X.X., Tang, B., Li, Z.R., Mai, B.X., 2015. An eight year (2005-2013)
temporal trend of halogenated organic pollutants in fish from the Pearl River Estuary, South

236
China. Mar. Pollut. Bull. 93, 61–7.
Sun, Y., Luo, X., Mo, L., Zhang, Q., Wu, J., Chen, S., Zou, F., Mai, B., 2012. Brominated flame
retardants in three terrestrial passerine birds from South China: geographical pattern and
implication for potential sources. Environ. Pollut. 162, 381–8.
Sun, Y.X., Xu, X.R., Hao, Q., Luo, X.J., Ruan, W., Zhang, Z.W., Zhang, Q., Zou, F.S., Mai, B.X.,
2014. Species-specific accumulation of halogenated flame retardants in eggs of terrestrial
birds from an ecological station in the Pearl River Delta, South China. Chemosphere 95,
442–447.
Sverko, E., Tomy, G.T., Reiner, E.J., Li, Y.-F., McCarry, B.E., Arnot, J.A., Law, R.J., Hites, R.A.,
2011. Dechlorane plus and related compounds in the environment: a review. Environ. Sci.
Technol. 45, 5088–98.
Szymańska, J.A., Piotrowski, J.K., 2000. Hepatotoxicity of monobromobenzene and
hexabromobenzene: effects of repeated dosage in rats. Chemosphere 41, 1689–1696.
Takigami, H., Suzuki, G., Hirai, Y., Sakai, S.I., 2009. Brominated flame retardants and other
polyhalogenated compounds in indoor air and dust from two houses in Japan. Chemosphere
76, 270–277.
Tao, F., Matsukami, H., Suzuki, G., Tue, N.M., Viet, P.H., Takigami, H., Harrad, S.J., 2016.
Emerging Halogenated Flame Retardants and Hexabromocyclododecanes in Food Samples
From an E-Waste Processing Area in Vietnam. Environ. Sci. Process. Impacts.
THE EUROPEAN STANDARD EN 1528-2. 1996. Fatty Food — Determination of pesticides

237
and polychlorinated biphenyls (PCBs), part 2: Extraction of fat, pesticides and PCBs, and
determination of fat content.
Thoma, H., Hutzinger, O., 1987. Pyrolysis and GC/MS-analysis of brominated flame retardants
in on-line operation. Chemosphere 16, 1353–1360.
Thomann, R. V, 1989. Bioaccumulation model of organic chemical distribution in aquatic food
chains. Environ. Sci. Technol. 23, 699–707.
Thomsen, C., Stigum, H., Frøshaug, M., Broadwell, S.L., Becher, G., Eggesbø, M., 2010.
Determinants of brominated flame retardants in breast milk from a large scale Norwegian
study. Environ. Int. 36, 68–74.
Thuresson, K., Björklund, J.A., de Wit, C.A., 2012. Tri-decabrominated diphenyl ethers and
hexabromocyclododecane in indoor air and dust from Stockholm microenvironments 1:
levels and profiles. Sci. Total Environ. 414, 713–21.
Thuresson, K., Höglund, P., Hagmar, L., Sjödin, A., Bergman, Å.̊, Jakobsson, K., 2006. Apparent
half-lives of hepta- to decabrominated diphenyl ethers in human serum as determined in
occupationally exposed workers. Environ. Health Perspect. 114, 176–181.
Tian, M., Chen, S.J., Wang, J., Shi, T., Luo, X.J., Mai, B.X., 2011a. Atmospheric Deposition of
Halogenated Flame Retardants at Urban, E-Waste, and Rural Locations in Southern China.
Environ. Sci. Technol. 45, 4696–4701.
Tian, M., Chen, S.J., Wang, J., Zheng, X.B., Luo, X.J., Mai, B.X., 2011b. Brominated Flame
Retardants in the Atmosphere of E-Waste and Rural Sites in Southern China: Seasonal

238
Variation, Temperature Dependence, and Gas-Particle Partitioning. Environ. Sci. Technol.
45, 8819–8825.
Tian, S., Zhu, L., Bian, J., Fang, S., 2012. Bioaccumulation and metabolism of polybrominated
diphenyl ethers in carp (Cyprinus carpio) in a water/sediment microcosm: Important role of
particulate matter exposure. Environ. Sci. Technol. 46, 2951–2958.
Toms, L.-M.L., Bartkow, M.E., Symons, R., Paepke, O., Mueller, J.F., 2009. Assessment of
polybrominated diphenyl ethers (PBDEs) in samples collected from indoor environments in
South East Queensland, Australia. Chemosphere 76, 173–178.
Toms, L.-M.L., Guerra, P., Eljarrat, E., Barceló, D., Harden, F.A., Hobson, P., Sjodin, A., Ryan,
E., Mueller, J.F., 2012. Brominated flame retardants in the Australian population: 1993-
2009. Chemosphere 89, 398–403.
Toms, L.M.L., Hearn, L., Kennedy, K., Harden, F., Bartkow, M., Temme, C., Mueller, J.F., 2009.
Concentrations of polybrominated diphenyl ethers (PBDEs) in matched samples of human
milk, dust and indoor air. Environ. Int. 35, 864–869.
Tomy, G.T., Palace, V.P., Pleskach, K., Ismail, N., Oswald, T., Danell, R., Wautier, K., Evans, B.,
2007a. Dietary Exposure of Juvenile Rainbow Trout (Oncorhynchus mykiss) to 1,2-
bis(2,4,6-tribromo- phenoxy)ethane: Bioaccumulation Parameters, Biochemical Effects,
and Metabolism. Environ. Sci. Technol. 41, 4913–4918.
Tomy, G.T., Thomas, C.R., Zidane, T.M., Murison, K.E., Pleskach, K., Hare, J., Arsenault, G.,
Marvin, C.H., Sverko, E., 2008a. Examination of Isomer Specific Bioaccumulation
Parameters and Potential In vivo Hepatic Metabolites of syn- and anti -Dechlorane Plus

239
Isomers in Juvenile Rainbow Trout ( Oncorhynchus mykiss ). Environ. Sci. Technol. 42,
5562–5567.
Tomy, G.T., Pleskach, K., Arsenault, G., Potter, D., Mccrindle, R., Marvin, C.H., Sverko, E.,
Tittlemier, S., 2008b. Identification of the novel cycloaliphatic brominated flame retardant
1,2-dihromo-4-(1,2-dibromoethyl)cyclo-hexane in Canadian arctic beluga (Delphinapterus
leucas). Environ. Sci. Technol. 42, 543–549.
Tomy, G.T., Pleskach, K., Ismail, N., Whittle, D.M., Helm, P.A., Sverko, E., Zaruk, D., Marvin,
C.H., 2007b. Isomers of Dechlorane Plus in Lake Winnipeg and Lake Ontario Food Webs.
Environ. Sci. Technol. 41, 2249–2254.
Törnkvist, A., Glynn, A., Aune, M., Darnerud, P.O., Ankarberg, E.H., 2011. PCDD/F, PCB,
PBDE, HBCD and chlorinated pesticides in a Swedish market basket from 2005 – Levels
and dietary intake estimations. Chemosphere 83, 193–199.
Tue, N.M., Sudaryanto, A., Minh, T.B., Isobe, T., Takahashi, S., Viet, P.H., Tanabe, S., 2010.
Accumulation of polychlorinated biphenyls and brominated flame retardants in breast milk
from women living in Vietnamese e-waste recycling sites. Sci. Total Environ. 408, 2155–
2162.
Tue, N.M., Takahashi, S., Suzuki, G., Isobe, T., Viet, P.H., Kobara, Y., Seike, N., Zhang, G.,
Sudaryanto, A., Tanabe, S., 2013. Contamination of indoor dust and air by polychlorinated
biphenyls and brominated flame retardants and relevance of non-dietary exposure in
Vietnamese informal e-waste recycling sites. Environ. Int. 51, 160–167.
UK Food Standards Agency. Brominated Chemicals:UK Dietary Intakes, 10/2006

240
(http://www.food.gov.uk/multimedia/pdfs/ fsis1006.pdf), accessed 10/1/2008.
UNEP. Stockholm Convention on Persistent Organic Pollutants. http://chm.pops.int/default.aspx
(accessed November 19, 2014).
US EPA (1997). Exposure factors handbook. General factors. EPA/600/P-95/002, vol.
1.Washington, DC: US Government Printing Office.
US EPA (2002). Child-specific exposure factors handbook. EPA-600-P-00-002B. Washington,
DC: National Center for Environmental Assessment.
US EPA (2008a). Estimation Programs Interface Suite™ for Microsoft® Windows, v 3.20.
United States Environmental Protection Agency, Washington, DC, USA.
US EPA (2008b). Toxicological review of decabromodiphenyl ether (BDE-209). United States
Environmental Protection Agency, Washington, DC, USA.
US EPA (2009). IUCLID data set for Dechlorane Plus. Available online: http://
www.epa.gov/chemrtk/pubs/summaries/dechlorp/c15635rr3.pdf.
Van den Eede, N., Dirtu, A.C., Ali, N., Neels, H., Covaci, A., 2012. Multi-residue method for the
determination of brominated and organophosphate flame retardants in indoor dust. Talanta
89, 292–300.
Van den Steen, E., Covaci, A., Jaspers, V.L.B., Dauwe, T., Voorspoels, S., Eens, M., Pinxten, R.,
2007. Accumulation, tissue-specific distribution and debromination of decabromodiphenyl
ether (BDE 209) in European starlings (Sturnus vulgaris). Environ. Pollut. 148, 648–653.
van Leeuwen, S.P.J., de Boer, J., 2008. Brominated flame retardants in fish and shellfish – levels

241
and contribution of fish consumption to dietary exposure of Dutch citizens to HBCD. Mol.
Nutr. Food Res. 52, 194–203.
Venier, M., Hites, R.A., 2008. Flame Retardants in the Atmosphere near the Great Lakes.
Environ. Sci. Technol. 42, 4745–4751.
Verreault, J., Gebbink, W. a, Gauthier, L.T., Gabrielsen, G.W., Letcher, R.J., 2007. Brominated
flame retardants in glaucous gulls from the Norwegian Arctic: more than just an issue of
polybrominated diphenyl ethers. Environ. Sci. Technol. 41, 4925–31.
Voorspoels, S., Covaci, A., Jaspers, V.L.B., Neels, H., Schepens, P., 2007. Biomagnification of
PBDEs in three small terrestrial food chains. Environ. Sci. Technol. 41, 411–416.
Voorspoels, S., Covaci, A., Neels, H., Schepens, P., 2007. Dietary PBDE intake: A market-basket
study in Belgium. Environ. Int. 33, 93–97.
Vorkamp, K., Bossi, R., Riget, F.F., Skov, H., Sonne, C., Dietz, R., 2015. Novel brominated
flame retardants and dechlorane plus in Greenland air and biota. Environ. Pollut. 196, 284–
91.
Vorkamp, K., Thomsen, M., Frederiksen, M., Pedersen, M., Knudsen, L.E., 2011.
Polybrominated diphenyl ethers (PBDEs) in the indoor environment and associations with
prenatal exposure. Environ. Int. 37, 1–10.
Wan, Y., Zhang, K., Dong, Z., Hu, J., 2013. Distribution is a major factor affecting
bioaccumulation of decabrominated diphenyl ether: Chinese sturgeon (Acipenser sinensis)
as an example. Environ. Sci. Technol. 47, 2279–2286.

242
Wang, F., Wang, J., Dai, J., Hu, G., Luo, X., Mai, B., 2010. Comparative tissue distribution,
biotransformation and associated biological effects by decabromodiphenyl ethane and
decabrominated diphenyl ether in male rats after a 90-day oral exposure study. Environ. Sci.
Technol. 44, 5655–5660.
Wang, J., Ma, Y.J., Chen, S.J., Tian, M., Luo, X.J., Mai, B.X., 2010. Brominated flame retardants
in house dust from e-waste recycling and urban areas in South China: implications on
human exposure. Environ. Int. 36, 535–41.
Wang, J., Tian, M., Chen, S.J., Zheng, J., Luo, X.J., An, T.C., Mai, B.X., 2011. Dechlorane Plus
in house dust from E-waste recycling and urban areas in South China: Sources, degradation,
and human exposure. Environ. Toxicol. Chem. 30, 1965–1972.
Wegmann, F., Cavin, L., MacLeod, M., Scheringer, M., Hungerbühler, K., 2009. The OECD
software tool for screening chemicals for persistence and long-range transport potential.
Environ. Model. Softw. 24, 228–237.
WHO (1995). Tetrabromobisphenol A and derivatives. Environmental Health Criteria 172.
Geneve
Wilford, B.H., Harner, T., Zhu, J., Shoeib, M., Jones, K.C., 2004. Passive Sampling Survey of
Polybrominated Diphenyl Ether Flame Retardants in Indoor and Outdoor Air in Ottawa,
Canada: Implications for Sources and Exposure. Environ. Sci. Technol. 38, 5312–5318.
Wilford, B.H., Shoeib, M., Harner, T., Zhu, J., Jones, K.C., 2005. Polybrominated Diphenyl
Ethers in Indoor Dust in Ottawa, Canada: Implications for Sources and Exposure. Environ.
Sci. Technol. 39, 7027–7035.

243
Wong, F., Kurt-Karakus, P., Bidleman, T.F., 2012. Fate of brominated flame retardants and
organochlorine pesticides in urban soil: volatility and degradation. Environ. Sci. Technol.
46, 2668–74.
Wu, B., Liu, S., Guo, X., Zhang, Y., Zhang, X., Li, M., Cheng, S., 2012. Responses of Mouse
Liver to Dechlorane Plus Exposure by Integrative Transcriptomic and Metabonomic
Studies. Environ. Sci. Technol. 46, 10758–10764.
Wu, J.P., Guan, Y.T., Zhang, Y., Luo, X.J., Zhi, H., Chen, S.J., Mai, B.X., 2010a.
Trophodynamics of hexabromocyclododecanes and several other non-PBDE brominated
flame retardants in a freshwater food web. Environ. Sci. Technol. 44, 5490–5.
Wu, J.P., Guan, Y.T., Zhang, Y., Luo, X.J., Zhi, H., Chen, S.J., Mai, B.X., 2011. Several current-
use, non-PBDE brominated flame retardants are highly bioaccumulative: Evidence from
field determined bioaccumulation factors. Environ. Int. 37, 210–215.
Wu, J.P., Zhang, Y., Luo, X.J., Wang, J., Chen, S.J., Guan, Y.T., Mai, B.X., 2010b. Isomer-
Specific Bioaccumulation and Trophic Transfer of Dechlorane Plus in the Freshwater Food
Web from a Highly Contaminated Site, South China. Environ. Sci. Technol. 44, 606–611.
Xian, Q., Siddique, S., Li, T., Feng, Y., Takser, L., Zhu, J., 2011. Sources and environmental
behavior of dechlorane plus — A review. Environ. Int. 37, 1273–1284.
Yang, C., 2014. Persistent organic pollutants in lacustrine environments. University of
Birmingham.
Yang, R., Wei, H., Guo, J., Li, A., 2012. Emerging brominated flame retardants in the sediment

244
of the Great Lakes. Environ. Sci. Technol. 46, 3119–26.
Yu, Y., Hung, H., Alexandrou, N., Roach, P., Nordin, K., 2015. Multiyear Measurements of
Flame Retardants and Organochlorine Pesticides in Air in Canada’s Western Sub-Arctic.
Environ. Sci. Technol. 49, 8623–8630.
Yu, Y.X., Pang, Y.P., Li, C., Li, J.L., Zhang, X.Y., Yu, Z.Q., Feng, J.L., Wu, M.H., Sheng, G.Y.,
Fu, J.M., 2012. Concentrations and seasonal variations of polybrominated diphenyl ethers
(PBDEs) in in- and out-house dust and human daily intake via dust ingestion corrected with
bioaccessibility of PBDEs. Environ. Int. 42, 124–131.
Yu, Z., Lu, S., Gao, S., Wang, J., Li, H., Zeng, X., Sheng, G., Fu, J., 2010. Levels and isomer
profiles of Dechlorane Plus in the surface soils from e-waste recycling areas and industrial
areas in South China. Environ. Pollut. 158, 2920–2925.
Zegers, B.N., Mets, A., Van Bommel, R., Minkenberg, C., Hamers, T., Kamstra, J.H., Pierce,
G.J., Boon, J.P., 2005. Levels of hexabromocyclododecane in harbor porpoises and common
dolphins from western European seas, with evidence for stereoisomer-specific
biotransformation by cytochrome P450. Environ. Sci. Technol. 39, 2095–2100.
Zheng, J., Luo, X.J., Yuan, J.G., Wang, J., Wang, Y.T., Chen, S.J., Mai, B.X., Yang, Z.Y., 2011.
Levels and sources of brominated flame retardants in human hair from urban, e-waste, and
rural areas in South China. Environ. Pollut. 159, 3706–3713.
Zheng, X.B., Luo, X.J., Zeng, Y.H., Wu, J.P., Mai, B.X., 2014. Sources, gastrointestinal
absorption and stereo-selective and tissue-specific accumulation of Dechlorane Plus (DP) in
chicken. Chemosphere 114, 241–246.

245
Zheng, X.B., Luo, X.J., Zheng, J., Zeng, Y.H., Mai, B.X., 2015. Contaminant sources,
gastrointestinal absorption, and tissue distribution of organohalogenated pollutants in
chicken from an e-waste site. Sci. Total Environ. 505, 1003–1010.
Zheng, X.B., Wu, J.P., Luo, X.J., Zeng, Y.H., She, Y.Z., Mai, B.X., 2012. Halogenated flame
retardants in home-produced eggs from an electronic waste recycling region in South China:
Levels, composition profiles, and human dietary exposure assessment. Environ. Int. 45,
122–128.
Zhou, S.N., Buchar, A., Siddique, S., Takser, L., Abdelouahab, N., Zhu, J., 2014. Measurements
of Selected Brominated Flame Retardants in Nursing Women: Implications for Human
Exposure. Environ. Sci. Technol. 48, 8873–8880.
Zhu, J., Feng, Y., Shoeib, M., 2007. Detection of Dechlorane Plus in residential indoor dust in the
city of Ottawa, Canada. Environ. Sci. Technol. 41, 7694–7698.

246
Appendix: List of Publications
1. Tao, F., Matsukami, H., Suzuki, G., Tue, N.M., Viet, P.H., Takigami, H. and Harrad, S.J.,
2016. Emerging halogenated flame retardants and hexabromocyclododecanes in food
samples from an e-waste processing area in Vietnam. Environmental Science: Processes &
Impacts, 18, pp.361-370.
2. Van den Eede, N., Tomy, G., Tao, F., Halldorson, T., Harrad, S., Neels, H. and Covaci, A.,
2016. Kinetics of tris (1-chloro-2-propyl) phosphate (TCIPP) metabolism in human liver
microsomes and serum. Chemosphere, 144, pp.1299-1305.
3. Labunska, I., Abdallah, M.A.E., Eulaers, I., Covaci, A., Tao, F., Wang, M., Santillo, D.,
Johnston, P. and Harrad, S., 2015. Human dietary intake of organohalogen contaminants at e-
waste recycling sites in Eastern China. Environment international, 74, pp.209-220.
4. Liu, W., Li, H., Tao, F., Li, S., Tian, Z. and Xie, H., 2013. Formation and contamination of
PCDD/Fs, PCBs, PeCBz, HxCBz and polychlorophenols in the production of 2, 4-D
products. Chemosphere, 92(3), pp.304-308.
5. Liu, W., Tao, F., Zhang, W., Li, S. and Zheng, M., 2012. Contamination and emission factors
of PCDD/Fs, unintentional PCBs, HxCBz, PeCBz and polychlorophenols in chloranil in
China. Chemosphere, 86(3), pp.248-251.