asp design for the minnelusa formation under low-salinity
TRANSCRIPT
Fuel xxx (2012) xxx–xxx
Contents lists available at SciVerse ScienceDirect
Fuel
journal homepage: www.elsevier .com/locate / fuel
ASP design for the Minnelusa formation under low-salinity conditions: Impactsof anhydrite on ASP performance
Casey S. Gregersen, Mahdi Kazempour, Vladimir Alvarado ⇑Department of Chemical and Petroleum Engineering, University of Wyoming, Laramie, WY 82071, USA
h i g h l i g h t s
" We designed ASP blends based only on fluid–fluid interactions and phase behavior." We compared recovery from model rock (less reactive) with rock containing anhydrite." Geochemical observations and modeling show why anhydrite affects water chemistry." Our results explain why NaOH should be used in contrast with Na2CO3 in Minnelusa rock.
a r t i c l e i n f o
Article history:Received 16 February 2012Received in revised form 5 June 2012Accepted 7 June 2012Available online 3 July 2012
Keywords:Chemical floodingASPMinnelusaAnhydritepH buffering
0016-2361/$ - see front matter � 2012 Elsevier Ltd. Ahttp://dx.doi.org/10.1016/j.fuel.2012.06.051
⇑ Corresponding author. Tel.: +1 307 766 6464; faxE-mail address: [email protected] (V. Alvarado).
Please cite this article in press as: Gregersen CSperformance. Fuel (2012), http://dx.doi.org/10.1
a b s t r a c t
Alkali–surfactant–polymer (ASP), surfactant–polymer (SP) and alkali–polymer (AP) flooding have beenrecognized as potentially effective Chemical Enhanced Oil Recovery (EOR) techniques. The alkali in ASPor AP flooding blends interacts with formation minerals, markedly with anhydrite in the case of eoliandeposits. As a result, water chemistry after the injection of an engineered chemical blend is unlikely tobe governed only by fluid–fluid interactions at reservoir conditions. To investigate rock-fluid interactions,Berea and available rock samples from an oil-bearing Minnelusa reservoir in Wyoming, an eoalian forma-tion, are used in coreflooding experiments. Further, a robust ASP blend at optimal salinity was designed forthe DC Minnelusa crude oil. Secondary waterflooding, tertiary ASP injection, polymer drive and finally abrine flush are subsequently completed in coreflooding experiments. Oil recovery, pressure drop, surfac-tant concentration, pH, and viscosity are measured during or immediately after each experiment; waterchemistry is analyzed in effluent samples. Findings show the potential of the chemical blends to improveoil recovery significantly under low-salinity conditions (<12,000 ppm) of the DC formation at present.Also, rock type recovery dependence highlights the importance of rock-fluid interactions. The results ofthis study can be applied to reservoirs at low salinity conditions and/or where anhydrite is present.
� 2012 Elsevier Ltd. All rights reserved.
1. Introduction
Alkali–surfactant–polymer (ASP) flooding owes its success tothe synergy of the individual components of Enhanced-Oil Recov-ery (EOR) blends. Alkali offers several benefits including promotingcrude oil emulsification, increasing aqueous-phase ionic strengthleading to regulation of phase behavior of the injected surfactant,and lowering interfacial tension (IFT) to ultralow values in pres-ence of surfactant. Alkali can also reduce costs by limiting theamount of surfactant needed in two ways. First, alkali reduces sur-factant adsorption by increasing the rock surface’s negative chargedensity, making it preferentially water-wet [1–3]. Second, alkali re-acts with the acids in the crude oils to produce in situ soaps, which
ll rights reserved.
: +1 307 766 6777.
et al. ASP design for the Minne016/j.fuel.2012.06.051
in turn broadens the optimal salinity range. This is the key toextending the three-phase region (or ultra-low IFT region), becausethe soap generated creates a micro-emulsion phase that can coex-ist with oil and water [3–6].
Surfactants work in ASP flooding to lower the IFT betweentrapped oil and brine, to aid to mobilize and contribute to the for-mation of oil banks. IFT reduction lowers capillary forces and al-lows for the oil bank to flow more freely without renewedtrapping [4,6–8].
Polymer increases the viscosity of the aqueous phase as well asreduces water permeability due to mechanical entrapment, conse-quently resulting in more favorable mobility ratio. With a moreviscous phase, the collected oil bank can be more easily movedthrough the reservoir and eventually into the producing well [9].Polymer flooding alone helps to accelerate oil production over sec-ondary waterflooding. With ASP flooding, reservoir productive lifeis extended and significantly more oil can be produced 1. In
lusa formation under low-salinity conditions: Impacts of anhydrite on ASP

2 C.S. Gregersen et al. / Fuel xxx (2012) xxx–xxx
general, ASP flooding is an approach that synergizes the advanta-ges of alkali, surfactant, and polymer in order to increase in situcapillary number. This results in the favorable scenario of de-creased residual oil saturation [10].
The first ASP field pilots were conducted in the Minnelusa for-mation. The first test was carried out in the West Kiehl Field lo-cated in Crook County of Wyoming. In this case, no injectivityproblems were detected and 23% of the original oil in place (OOIP)was recovered [10]. The incremental cost (chemicals, facilities,implementation, etc.) was estimated at 2.13 $/bbl and no forma-tion damage was observed [11]. Next came the Cambridge field,a Minnesula field located contiguous to the Kiehl field. In this case,ASP flooding increased recovery by 28% of OOIP (1,143,000 bbls)and incremental costs were estimated at 2.42 $/bbl. In the caseof the Kiehl field, the ASP blend featured Sodium Carbonate(Na2CO3) and 0.1 wt.% Petrostep B-100 [12]. Later, thesetechniques were implemented in other fields such as Tanner field,Mellott Ranch, and Driscoll Creek. The Tanner field formulationcontained 1 wt.% Sodium Hydroxide (NaOH) and 0.1% activeORS-41HF. The projected incremental OOIP was 17%, based onexperiments and results from pilot tests [13].
Other successful field projects have taken place in Oklahomaand in China [14]. Results from the Daqing oil field in China indi-cated that surfactant did not produce ultra-low water–oil IFT val-ues. However, the addition of 1 wt.% NaOH enabled them toreach this condition. Another ASP project designed through phasebehavior analyses, coreflooding, and single well pilots took placein Oman. In this case, the blend was made up of 0.3 wt.% manufac-tured surfactant and 1 wt.% Na2CO3 [15].
Implementation of an optimum ASP blend can be difficult attimes due to many uncertainties, i.e. heterogeneities, interferencefrom adjacent wells, surface facilities, mixing of blend, rock-fluidinteractions, mineralogy, clay content, and other reservoir com-plexities [15]. More specifically, ASP flooding is unlikely to workfor all Minnelusa reservoirs. Limitations include high water hard-ness, high reservoir temperature, and chemical consumption prop-erties of reservoir rock [16,17]. However, one study of 120Minnelusa fields revealed that 130 million barrels of incrementaloil could potentially be recovered using ASP formulations [1].
In this paper, static (bottle tests) and dynamic tests (corefloo-ding) are carried out to develop an ASP blend for the conditions ofthe DC field. This Minnelusa reservoir has two important character-istics that impact the blend selection. First, the formation is likely tocontain a significant amount of anhydrite that is typical of mostMinnelusa fields in Wyoming. Second, the formation current rela-tive low salinity water (< 12,000 ppm), resulting from fresh waterinjection. The challenges of the ASP design for this field are sustain-ing high pH conditions and finding a surfactant with optimumsalinity at low ionic strength, also able to tolerate a high calciumconcentration. Finally, we also investigate the impact of alkali typeand speculate on reasons why NaOH works better than Na2CO3.
2. Experiments
2.1. Rheology
A rheological analysis of polymer and alkaline–surfactant–poly-mer (ASP) solutions is carried out with an ARES Rheometer in par-allel plate geometry using 50-mm plates. Blend viscosity ismeasured as a function of shear rate from 5–100 Hz.
Table 1DC synthetic reservoir brine.
Ion Na+ K+ Ca2+ Mg2+ HCO�3 Cl� SO2�4
pH TDS
Conc. (ppm) 1,315 71 456 63 509 30 3,400 7.95 6,174
2.2. Interfacial tension
The crude oil-brine interfacial tension is measured using theSpinning Drop Tensiometer SITE100. Crude oil form the DC field
Please cite this article in press as: Gregersen CS et al. ASP design for the Minneperformance. Fuel (2012), http://dx.doi.org/10.1016/j.fuel.2012.06.051
in Wyoming is used in all the experiments. Two types of experi-mental conditions are set for IFT determination:
� Alkali weight fraction sweeps at constant surfactant and NaClconcentrations.� NaCl weight fraction sweep at constant surfactant and alkali
concentrations.
These experiments were done to compare IFT values with visualphase behavior results. All the IFT measurements were completedat 48 �C and at 5000 rpm.
2.3. Surfactant concentration
Surfactant concentration is measured through titration. First, atitration standard is generated using 1 wt.% total surfactant atthe same brine composition as the ASP flooding design. To carryout the titration, 1 mL of standard sample is added to deionizedwater, di-methyl blue indicator and chloroform. Then, the titratingsolution, 0.04 M Hyamine, is added until the solution reached thetitration point. The volume of spent titrant (Hyamine) is recordedand used as the standard titration volume. To measure the surfac-tant concentration of effluent samples, 1 mL aliquots are takenfrom each effluent sample. Then, recorded titration volumes ofthe samples are divided by the standard titration volume to givethe surfactant concentration.
2.4. Screening procedure to find suitable surfactant and alkali agents
Prior to experimentation, considerable research efforts wentinto designing a robust ASP blend. The main goal when designingthe surfactant blend was to find a combination that would workwell at lower salinities. Table 1 shows the DC field produced waterchemistry. The target salinity when screening for surfactants wasset between 2000 and 12,000 ppm based on the TDS value fromTable 1.
From the literature review, it was concluded that surfactantswith a larger carbon chain length, increased branching, and multi-ple Propylene Oxide groups (PO groups) would work ideally forlowering optimal salinity [18–21,8].
Increasing branching and molecular weight of surfactants canhave multiple benefits. High molecular weight sulfonates can beproperly balanced to match the brine-oil system and thus be moreeffective oil recovery agents. Further, chain length can tailor thesurfactant to a specific crude oil, i.e. longer carbon chains make itmore compatible with hydrophobic crude oils than do alcohol-based surfactants with lower carbon numbers. The greatest benefitfrom increasing the length the chain for this application is the re-sulted lowering of optimal salinity. Evidence of this lies in increas-ing chain length from C15–18 to C20–24 results in an optimalsalinity decrease for internal olefin sulfonates (IOS) [18].
The reason high carbon number IOS surfactants display desir-able phase behavior is not solely due to the relationship with lowIFT, but is also due to branched hydrophobic structures preventingordered arrays and viscous phases from forming. This branching isideal when the double bond occurs internally rather than at the endof the surfactant molecule, which is a characteristic of IOS. Otherimportant attributes of IOS is that they are good at high and lowtemperatures [19]. Researchers at the University of Texas at Austin
lusa formation under low-salinity conditions: Impacts of anhydrite on ASP

C.S. Gregersen et al. / Fuel xxx (2012) xxx–xxx 3
also discuss favorable tolerance as well as reduced adsorption forhighly branched surfactants [20]. Based on all of this, and the factthat IOS are low in cost due to large scale manufacturing, it wasdecided that IOS would be the optimal co-surfactant.
Propylene oxide groups decrease optimal salinity in that theymake the surfactant more hydrophobic [21]. In addition to lower-ing optimal salinity, adding these PO groups will higher solubiliza-tion, broaden the ultralow IFT region and increase calciumtolerance and affinity. The mechanism works in that adding POgroups to the surfactant chain helps to increase interface affinityof the molecules which in turn increases the breadth of the salinityregion where high solubilization and ultralow IFT occur. When POand EO (Ethylene oxide groups) are added between hydrophobicand hydrophilic groups, further extension in aqueous and oleicphases can occur. However, EO groups are not desirable herebecause they increase optimal salinity and decrease solubilityratio [19]. Thus, one of the major advantages of PO groups is thatthey allow for ultra-low IFT’s at a wide range due to high oilsolubilization [8].
The following commercial surfactants were screened for re-search purposes (all from Stepan): NEODOL-67–7PO-Sulfate (PS1),IOS C15–18 (PS2), IOS C20–24 (PS3-B), 16–17alcohol–13PO-Sulfate(PS13-D), Alky Xylene Sulfonate (A6). Of these surfactants, the twoAlcohol Ether Sulfates (PS1 and PS13-D) and the Xylene Sulfonate(A6) were used as main surfactants. The other two Internal OlefinSulfonates (PS2 and PS3-B) were used as co-surfactants. The maindifference between PS1 and PS13-D is that PS1 has 7 PO groupswhereas PS13-D has 13 PO groups. Additionally, the hydrophobicparts of these two surfactants are different: the hydrophobe of S1is 16–17 carbon, branched, NEODOL product whereas S13D is a13 carbon, isotridecyl product. The difference between PS2 andPS3-B is that PS3-B has a longer chain length/molecular weight.The ratio of main surfactant to co-surfactant is 3:1. Initially1.5 wt.% of main surfactant was used with 0.5 wt.% of co-surfactant.The following combinations were tested:
� Blend 1: 1.5 wt.% PS13-D, 0.5 wt.% PS3-B.� Blend 2: 1.5 wt.% PS1, 0.5 wt.% PS2.� Blend 3: 1.5 wt.% PS1, 0.5 wt.% PS3-B.
All of these combinations were tested over salinity scans from5000–35,000 ppm NaCl at a 1:1 aqueous phase to oil ratio. (Note:All experimental phase behavior tests were run at a 1:1 ratio).Once the optimal blend was discovered (Blend 1), this amountwas cut in half to 0.75 wt.% and 0.25 wt.% and will be referred toas Blend 5. At this point A6 was also tested with PS3-B:
� Blend 4: 0.75 wt.% A6, 0.25 wt.% PS3-B (0–20,000 ppm NaCl).� Blend 5: (Blend 1) 0.75 wt.% PS13-D, 0.25 wt.% PS3-B (0–2,000
ppm NaCl).
Using Xylene Sulfonate (A6) in Blend 4 revealed poor solubility,so it was decided to continue on with Blend 5 as the optimal blend.Research at Rice University indicates that a similar surfactant/co-surfactant combination to Blend 5 worked very effectively. How-ever, favorable results only occurred when both are used togetherrather than individually. Another study by Lin et al. showed prom-ising results with a similar surfactant blend again along with theaddition of Na2CO3 [8]. This leads to the effect of alkali, whichwas tested on all surfactant blends, but only results from Blend 5are presented. Both NaOH and Na2CO3 were tested. Both alkaliswere also tested with DC crude oil alone in the absence of surfac-tant. All of these blends were screened from the NaCl weight frac-tion range of 0–20,000 ppm.
In order to test solubility and stability of Blend 5 with alkali, acloud point test was used. In this test, ran from 0–20,000 ppm
Please cite this article in press as: Gregersen CS et al. ASP design for the Minneperformance. Fuel (2012), http://dx.doi.org/10.1016/j.fuel.2012.06.051
NaCl, all components are dissolved into an aqueous solution andplaced in an oven at reservoir temperature for one week. Cloudi-ness is then determined through visual observation.
2.5. Experimental setup
DC reservoir temperature, 48 �C, corresponding to the shallowreservoir depth for Minnelusa was set in all experiments. SyntheticDC formation brine composition from Table 1 was also used. Thetypical source of injection water in the Powder River Basin, wheremost of the Minnelusa reservoirs are located, is the Fox Hills for-mation. To mimic the injection water source, 1600 ppm NaCl brineis used for waterflooding and preparing chemical solutions. DC oilis collected and used in these experiments after filtering and cen-trifuging to remove fines. This oil has a viscosity of 83 cP (at48 �C) and an acid number of 0.43 mg KOH/gr oil.
2.6. Coreflooding experiments
Based on phase behavior results, Blend 5 was selected for threecorefloods. In the first two, everything was kept the same, exceptfor the rock to investigate the impact of rock-fluid interaction onthe performance of the ASP blend. A Berea core was used in thefirst experiment and a sample of Minnelusa core was used in thesecond. In the third coreflooding test, another sample Minnelusaformation plug was used. In this test, the concentrations of surfac-tant and alkali were 50% of the values in the first two tests.
To begin the coreflooding procedures, the cores were first char-acterized (porosity, permeability, weight dry, weight wet, length,diameter, and total pore volume). The cores were then vacuum sat-urated for one day and allowed to age in the synthetic DC forma-tion brine within the core holder at 48 �C and under 500 psiconfining pressure for a week. The core plugs were water-saturatedwith this same brine. To measure connate brine permeability, theinjection flow rate was varied from 0.5–0.7 ml/min and the pres-sure drop along the core was recorded. The cores were floodedwith DC oil at a rate of 0.5 ml/min (2.16 ft/day) for 2.5 pore vol-umes (PVs). Effluent samples were collected using an automatedfraction collector to determine initial water and oil saturationswithin the core through material balance calculations. After aginga minimum of 10 days, cores were waterflooded with injectionbrine containing 1600 ppm NaCl for 8 PVs to establish residualoil saturation. Before initiating the tertiary chemical flooding, per-meability was measured at residual oil saturation. The cores werethen injected with 1 PV of the ASP blend followed by a 1 PV poly-mer (P) slug consisting of the injection brine and 1000 ppmFloppam 3330S. To complete the coreflood, a 5 PV waterflood ofinjection brine was run. At the conclusion of the final waterflood,the permeability of the core was again measured. Pressure dropwas recorded for all flooding activities and plotted along with oilrecovery. Flow rates for waterflooding and chemical flooding wereheld constant at 0.5 ml/min.
For the first two experiments, the chemical ASP blend containedBlend 5: (0.75% PS13-D and 0.25%PS3-B), 1 wt.% NaOH, and 2000ppm Flopaam 3330S prepared in 1600 ppm NaCl brine. For thethird ASP flooding test, the chemical blend contained 0.375%PS13-D and 0.125% PS3-B, 0.5 wt.% NaOH and 2000 ppm Flopaam3330S prepared in 1600 ppm NaCl brine.
3. Results and discussion
3.1. Phase behavior and optimum salinity (bottle tests)
The phase behavior of 1 wt.% total surfactant solution versusNaCl weight fraction is shown in Fig. 1. It can be noticed that the
lusa formation under low-salinity conditions: Impacts of anhydrite on ASP

4 C.S. Gregersen et al. / Fuel xxx (2012) xxx–xxx
optimum salinity of Blend 5 in this study without alkali is higherthan 35,000 ppm of NaCl, a value greater than formation salinity.
The phase behavior of Blend 5 + 1 wt.% Na2CO3 while varyingNaCl weight fraction is shown in Fig. 2. The presence of Na2CO3
yields somewhat lower optimum salinity at approximately30,000 ppm of the total salinity (NaCl + Na2CO3), though it is stillnot in the range of formation salinity. Keeping everything elsethe same, Na2CO3 was replaced with NaOH to investigate the effectof alkali type on phase behavior. In this situation, generated in situsoaps impact on changing optimum salinity to lower values is ob-served (Fig. 3). NaOH reduces the optimum salinity significantlyand into the range of the DC formation. It also broadens the desir-able phase behavior region (Type III and Type II�) of the mixture ofsurfactant and soap.
To investigate the role of alkali in lowering optimum salinity inmore detail, an additional set of phase behavior screening tests wasperformed without surfactant. The phase behavior of DC oil and1 wt.% Na2CO3 at varying salinities is shown in Fig. 4. Here, Na2CO3
emulsifies oil at salinity lower than 35,000 ppm of NaCl. The opti-
Fig. 1. Phase behavior of DC oil and 1 wt.% surfacta
Fig. 2. Phase behavior of DC oil and 1 wt.% surfactant + 1 wt
Please cite this article in press as: Gregersen CS et al. ASP design for the Minneperformance. Fuel (2012), http://dx.doi.org/10.1016/j.fuel.2012.06.051
mum phase behavior takes place at roughly 32,500 ppm of NaCl,which is higher than the formation salinity. NaOH, on the otherhand, emulsifies a significant amount of DC oil, shows favorablephase behavior in terms of lowering optimum salinity, and alsodisplays a wider type III and II� region (Fig. 5).
The optimum salinity of the mixture can be obtained as follows[22]:
logðOptmixÞ ¼ xsoap logðOptsoapÞ þ ð1� xsoapÞ logðOptsurf :Þ ð1Þ
where xsoap is the mole fraction of generated soap by alkali-organicacid interaction. Eq. (1) shows that the optimum salinity of mixturelowers if the generated soap has a lower optimum salinity than sur-factant. This explains why the blend of 1 wt.% Surfactant + 1 wt.%NaOH yields a lower optimum salinity as compared to 1 wt.% sur-factant alone or 1 wt.% surfactant + 1 wt.% Na2CO3. Generated soapsby NaOH appear to have lower optimum salinity values than thosefrom Na2CO3(Figs. 4 and 5). Hence, for DC crude oil at reservoir con-ditions, it is more efficient to use NaOH as an alkaline agent (moreinformation is provided in Appendix A).
nt with varying NaCl weight fraction (at 48 �C).
.% Na2CO3 with varying NaCl weight fraction (at 48 �C).
lusa formation under low-salinity conditions: Impacts of anhydrite on ASP

Fig. 3. Phase behavior of DC oil and 1 wt.% surfactant + 1 wt.% NaOH with varying NaCl weight fraction (at 48 �C).
Fig. 4. Phase behavior of DC oil and 1 wt.% Na2CO3 with varying NaCl weight fraction (at 48 �C).
C.S. Gregersen et al. / Fuel xxx (2012) xxx–xxx 5
To explore the potential of a more economical blend, i.e. lowerconcentration of alkali and surfactant, the concentration of NaOHwas screened at both 1 and 0.5 wt.% surfactant. Results are shownin Figs. 6 and 7. As shown in Figs. 6 and 7, there seems to be aninterval for the concentration of NaOH to operate at optimum con-ditions (here from 2000 to 10,000 ppm) at both 1 and 0.5 wt.% sur-factant. This indicates that a certain amount of NaOH in solution isnecessary to generate sufficient soap and to increase the mole frac-tion of the soap, as per Eq. (4). On the other hand, the concentrationof alkali should be less than a threshold value, because it can sup-press optimum conditions and cause phase behavior to transition
Please cite this article in press as: Gregersen CS et al. ASP design for the Minneperformance. Fuel (2012), http://dx.doi.org/10.1016/j.fuel.2012.06.051
from type III to type II+ [4,23]. Additionally, as discussed before,Na2CO3 does not contribute to lowering optimum salinity. In addi-tion to the aforementioned advantages of NaOH, other resultsinvolving rock-fluid interactions obtained by Kazempour et al.[17] showed that in the presence of anhydrite, pH buffering ofthe injected alkali is significant. Used as a typical alkali in EOR,NaOH is a better candidate to overcome the pH buffering problemand raise the pH to the required level for saponification. However,this alkali can cause secondary mineral precipitation [17]. Based onall the evidence presented, NaOH was selected as the alkali forcoreflooding experiments.
lusa formation under low-salinity conditions: Impacts of anhydrite on ASP

Fig. 5. Phase behavior of DC oil and 1 wt.% NaOH with varying NaCl weight fraction (at 48 �C).
Fig. 6. Phase behavior of DC oil and 1 wt.% surfactant with varying NaOH weight fraction in 1600 ppm NaCl brine (at 48 �C).
6 C.S. Gregersen et al. / Fuel xxx (2012) xxx–xxx
3.2. Fluids and interfacial properties
Results from rheological analysis show that the polymer solu-tions all exhibit bulk shear-thinning behavior, i.e. the viscosity de-creases with increasing shear rate. As shown Fig. 8, the viscosity ofASP blend is higher than the viscosity of polymeric solution at dif-ferent shear rates which is mainly due the higher concentration ofpolymer in ASP blend (2000 compared to 1000 ppm). The results ofIFT measurements at different NaCl and alkali weight fractions aredepicted in Fig. 9. As shown (top figure), Blend 5 with the weightfractions of NaOH and Na2CO3 kept constant and NaCl varied, re-sults provide ultra-low IFT between DC crude oil and brine in awide range of salinity. The minimum IFT for both alkalis occursat approximately 10,000 ppm of NaCl, although the minimum va-lue for NaOH (point A) is somewhat lower than Na2CO3 (point B)which agrees with the visual phase behavior. Fig. 9 (bottom figure)shows that at constant NaCl weight fraction and varied amounts of
Please cite this article in press as: Gregersen CS et al. ASP design for the Minneperformance. Fuel (2012), http://dx.doi.org/10.1016/j.fuel.2012.06.051
NaOH and Na2CO3, even 1 wt.% surfactant alone can reduce IFT sig-nificantly and adding alkali enhances IFT reduction. Also usingNaOH allows for lower IFT values as compared to using Na2CO3,though not significantly. It should be pointed out that at higherweight fractions of NaCl (15,000–30,000-region M in Fig. 9), theIFT values between oil and aqueous phases for both Na2CO3 andNaOH become closer and their corresponding visual phase behav-ior becomes quite similar as well (Fig. 9-top).
3.3. ASP flooding experiments
Pressure drop across the core was acquired and plotted with oilrecovery for each of the three coreflooding experiments. The re-sults of the first ASP flood on the Berea core are shown in Fig. 10.Here, the injection of the ASP blend in tertiary mode recovered al-most all of the residual oil left behind after secondary waterfloo-ding. As shown, the generated oil bank by ASP was produced
lusa formation under low-salinity conditions: Impacts of anhydrite on ASP

Fig. 7. Phase behavior of DC oil and 0.5 wt.% surfactant with varying NaOH weight fraction in 1600 ppm NaCl brine (at 48 �C).
Fig. 8. Viscosity of ASP (used in first two flooding experiments) and P blends vs.shear rate (at 48 �C).
Fig. 9. IFT vs. NaCl weight fraction with alkali weight fraction kept constant (top)and IFT vs. Alkali weight fraction with NaCl weight fraction kept constant (bottom)(at 48 �C).
C.S. Gregersen et al. / Fuel xxx (2012) xxx–xxx 7
mostly during polymer drive and subsequent post brine flooding.Note that recovery factors in all coreflooding experiments are esti-mates with approximately 5% error. De-emulsifiers or emulsionbreakers could have been used to reduce this error, but in orderto accurately measure surfactant concentration, they were notused. Produced emulsions types were identified through opticalmicroscopy. It was observed that W/O emulsions in this experi-ment were not stable and turned into O/W emulsions after oneday.
Surfactant concentration and pH (Fig. 10) show that the injectedamount of surfactant and alkali were high enough to sustain favor-able conditions for chemical flooding in this test. Additionally, evenafter switching to a 4 PV post waterflood, the pH of effluentremained higher than 10. This indicates no active mechanism toirreversibly buffer pH under this test’s conditions. Effluent samplesalso displayed traces of surfactant even after 4 PVs of waterfloodinglending to favorable surfactant retention. As mentioned earlier, per-meability of oil and water at different steps were calculated and arereported in Table 2.
The second ASP flooding experiment was done keeping every-thing the same, except rock type. Here the experiment was per-
Please cite this article in press as: Gregersen CS et al. ASP design for the Minneperformance. Fuel (2012), http://dx.doi.org/10.1016/j.fuel.2012.06.051
formed on a Minnelusa core plug, which is known to containanhydrite. From Fig. 11, the proposed ASP formulation is shownto perform well, yielding 30% incremental recovery after secondarywaterflooding.
lusa formation under low-salinity conditions: Impacts of anhydrite on ASP

Fig. 10. Pressure drop and oil recovery data obtained from first ASP flood in Bereasandstone (top) and measured pH and surfactant concentration at effluent samples(bottom).
Table 2Permeability values for oil and water at different steps (first ASP test).
Description Permeability (mD)
Initial brine permeability (Sw = 1) 55.5Oil permeability at Swi 218.7Brine permeability at Sor 24.1Brine permeability at the end of the test 27.4
Fig. 11. Pressure drop and oil recovery data obtained from second ASP flood inMinnelusa sandstone (top) and measured pH and surfactant concentration ateffluent samples (bottom).
8 C.S. Gregersen et al. / Fuel xxx (2012) xxx–xxx
There are some interesting differences between the first andsecond ASP experiments resulting from the mineralogical differ-ences. In the second ASP experiment, both O/W and W/O emul-sions were produced. The emulsions turned out very stablewhen compared to the first ASP flooding test results (not shown).The apparent more stable W/O emulsions here could be attributedto the higher concentration of calcium ion in the second test. Asshown in published work [17], when anhydrite is present thereis always a certain amount of calcium in the aqueous phase thatdepends on pH. A relationship between W/O emulsion stabilityand calcium concentration has been observed with crudes fromWyoming at low brine salinity [24]. In contrast with the resultswith the Berea core, pH at effluent decreased down to 8(Fig. 11) during the post waterflood on the Minnelusa core. Thisindicates an irreversible sink for OH� under the conditions of thistest. This sink might result from precipitation of secondary miner-als [17].
Please cite this article in press as: Gregersen CS et al. ASP design for the Minneperformance. Fuel (2012), http://dx.doi.org/10.1016/j.fuel.2012.06.051
Fig. 12 visually compares the collected effluent samples of thefirst and second ASP tests. It can be observed that the designedASP blend performed better in the Berea as compared to the Min-nelusa core, which is attributed to the different mineralogy, partic-ularly anhydrite. Unlike the first ASP flood on Berea, during thesecond ASP flooding test, some particles accumulated in the col-lected samples tubes (Fig. 13). This might be a sign of fine migra-tion or secondary mineral precipitation under the conditions ofthe second ASP flood. The fines were analyzed to find out their ori-gin. Fig. 13 indicates that the accumulated particles in the sampletubes were mainly calcite, generated by rock-fluid interaction dur-ing the NaOH invasion in presence of anhydrite and dolomite as re-ported [17].
The distribution of anhydrite along the core after ASP floodingis depicted in Fig. 14. This shows two important facts, first, anhy-drite is distributed all throughout the core and secondly, anhydritedissolution took place mainly in the inlet section and partially inthe mid-section of the core. Permeability of oil and water at differ-ent steps of this test were calculated as well and are reported inTable 3.
The results of the third ASP flood using another Minnelusa coreare shown in Fig. 15. As aforementioned, the main difference be-tween second and third experiments is a 50% decrease in the con-centration of surfactant and alkali. It can be observed that an evensmaller amount of designed surfactant blend and NaOH is able toimprove recovery factor, although the incremental recovery after
lusa formation under low-salinity conditions: Impacts of anhydrite on ASP

Fig. 12. Comparison of effluent samples between the first and second ASP tests.
Fig. 13. The analysis of produced fines within second ASP test.
C.S. Gregersen et al. / Fuel xxx (2012) xxx–xxx 9
secondary waterflooding of this test is not as significant as secondcoreflood (15% compared to 30%).
3.4. Effect of Ca2+ ion on the performance of the designed ASP blend
As speculated earlier, the recovery from the injection of the ASPblend in the Minnelusa plug was lower than that in Berea likelydue to the presence of anhydrite. To test this hypothesis, a specific
Please cite this article in press as: Gregersen CS et al. ASP design for the Minneperformance. Fuel (2012), http://dx.doi.org/10.1016/j.fuel.2012.06.051
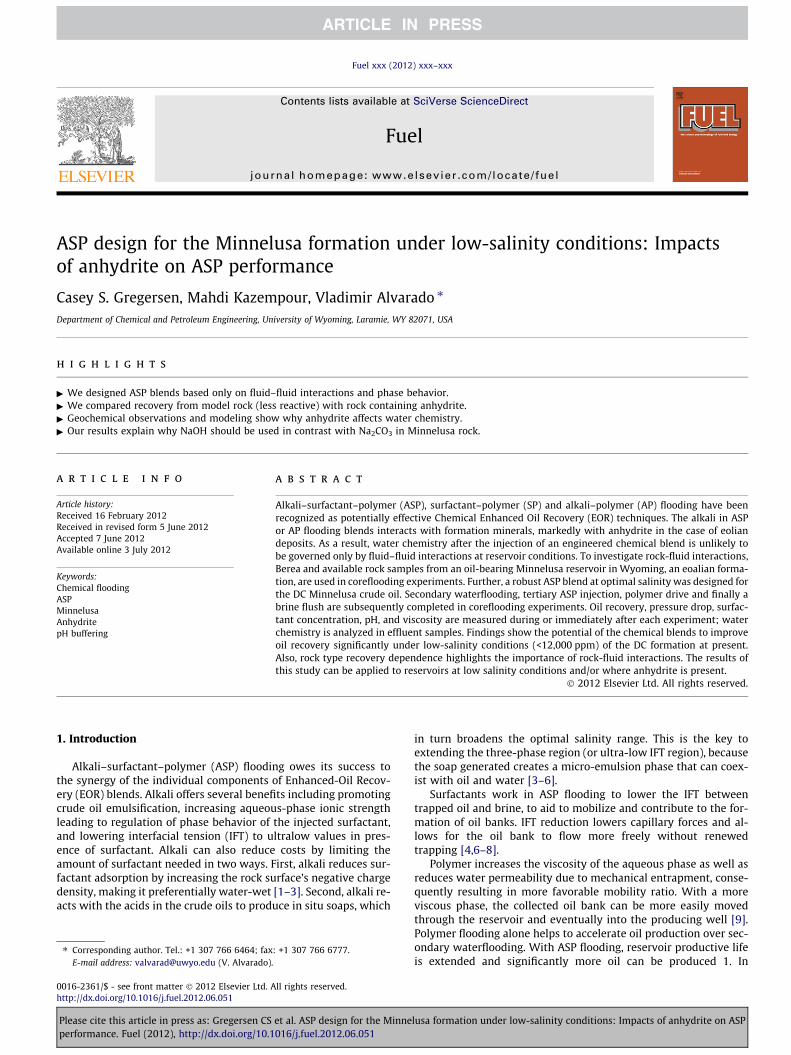
bottle test was carried out to investigate the presence of calciumion on the performance of the ASP blend. For each bottle, differentamounts of CaCl2.2H2O were added to the blend of 1 wt.%NaOH + 1500 ppm of NaCl + 1 wt.% surfactant and mixed thor-oughly. After one hour in the oven at 48 � C precipitation was ob-served. The solution was extracted through a filter in 6 mLaliquots into pipettes for the representative aqueous phase. Next,6 mL of DC crude oil was added to complete the bottle test exper-
lusa formation under low-salinity conditions: Impacts of anhydrite on ASP

Fig. 14. Anhydrite distribution along the Minnelusa core after the second ASP flooding test: (a) inlet section of the core, (b) midsection of the core, and (c) outlet section of thecore (light-gray color represents anhydrite).
Table 3Permeability values for oil and water at different steps (second ASP test).
Description Permeability (mD)
Initial brine permeability (Sw = 1) 152Oil permeability at Swi 429Brine permeability at Sor 42.5Brine permeability at the end of the test 78.8
Fig. 15. Pressure drop and oil recovery data obtained from third ASP flood inMinnelusa sandstone (top) and measured pH and surfactant concentrations ateffluent (bottom).
10 C.S. Gregersen et al. / Fuel xxx (2012) xxx–xxx
iment (as sketched in Fig. 16). It should be mentioned that at eachstep, the added amount of calcium chloride was selected to keepthe salinity constant, shown in Fig. 3. The purpose for this sequencewas to mimic the effect that anhydrite plays in reacting with NaOHto cause calcium precipitation. However, some calcium still existsin the system, which can have a detrimental effect on the phasebehavior of the surfactant-soap system as shown in Fig. 17. It canbe observed that the presence of calcium ion in the aqueous phaseinhibits the ASP blend from performing well by reducing its abilityto emulsify oil. At a high concentrations of calcium (above700 ppm), the designed ASP blend in this study might not improveoil recovery as well as expected.
Further investigation into harmful effects that Calcium ionscaused on the surfactant-soap system are shown in Table 4. Here,surfactant concentration was tracked at various amounts of Ca2+
following the appointment procedure. Results show that surfactantweight fraction was only reduced from 8–14% after CaCl2.2H2O wasadded, indicating that Ca2+ was not causing significant surfactantdropout. It could be conjectured that Ca2+ causes unfavorablephase behavior to either the generated in situ soaps or the surfac-tant synthetic. As a result, the surfactant-soap system becomesineffective.
Cloud point test results reveal that at reservoir temperature, theaqueous phases with 1 wt.% surfactant and 1 wt.% NaOH at salinityabove 15,000 ppm of NaCl showed poor solubility and stability.This should not affect the ASP flooding design, as the DC formationis less the 12,000 ppm TDS.
Appendix B presents forward simulation results that indicatethat the selected ASP blend could improve oil recovery significantlyat field scale.
Please cite this article in press as: Gregersen CS et al. ASP design for the Minnelusa formation under low-salinity conditions: Impacts of anhydrite on ASPperformance. Fuel (2012), http://dx.doi.org/10.1016/j.fuel.2012.06.051
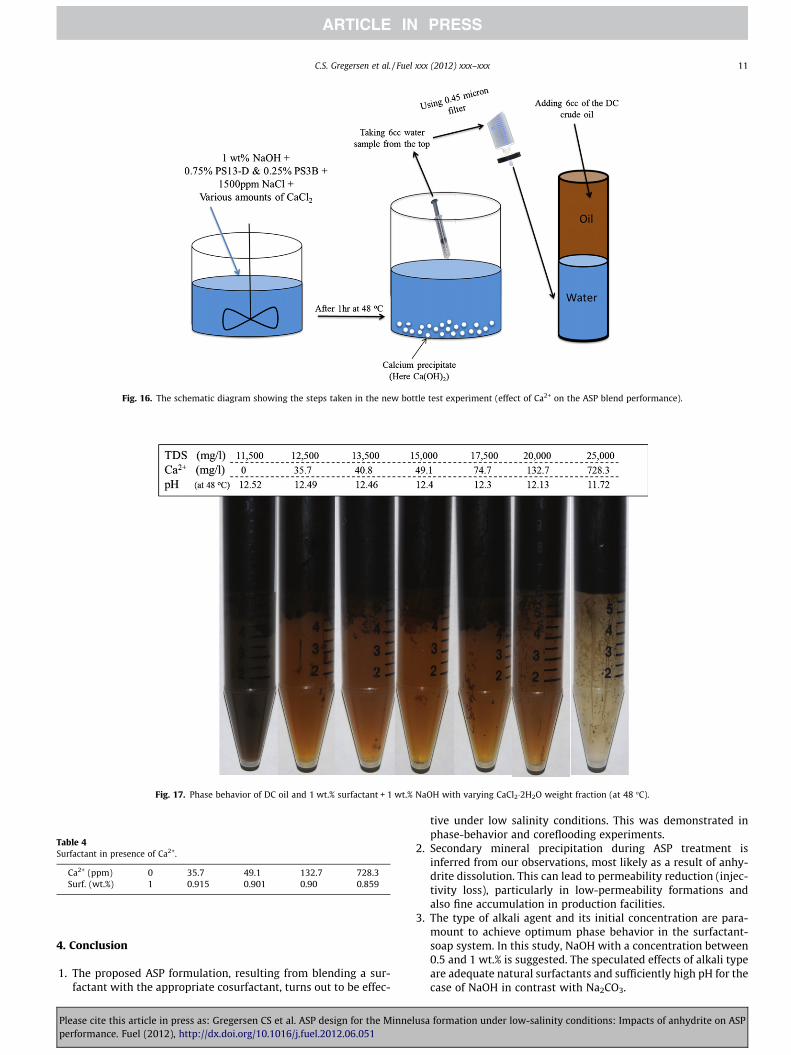
Fig. 16. The schematic diagram showing the steps taken in the new bottle test experiment (effect of Ca2+ on the ASP blend performance).
Fig. 17. Phase behavior of DC oil and 1 wt.% surfactant + 1 wt.% NaOH with varying CaCl2�2H2O weight fraction (at 48 �C).
Table 4Surfactant in presence of Ca2+.
Ca2+ (ppm) 0 35.7 49.1 132.7 728.3Surf. (wt.%) 1 0.915 0.901 0.90 0.859
C.S. Gregersen et al. / Fuel xxx (2012) xxx–xxx 11
4. Conclusion
1. The proposed ASP formulation, resulting from blending a sur-factant with the appropriate cosurfactant, turns out to be effec-
Please cite this article in press as: Gregersen CS et al. ASP design for the Minneperformance. Fuel (2012), http://dx.doi.org/10.1016/j.fuel.2012.06.051
tive under low salinity conditions. This was demonstrated inphase-behavior and coreflooding experiments.
2. Secondary mineral precipitation during ASP treatment isinferred from our observations, most likely as a result of anhy-drite dissolution. This can lead to permeability reduction (injec-tivity loss), particularly in low-permeability formations andalso fine accumulation in production facilities.
3. The type of alkali agent and its initial concentration are para-mount to achieve optimum phase behavior in the surfactant-soap system. In this study, NaOH with a concentration between0.5 and 1 wt.% is suggested. The speculated effects of alkali typeare adequate natural surfactants and sufficiently high pH for thecase of NaOH in contrast with Na2CO3.
lusa formation under low-salinity conditions: Impacts of anhydrite on ASP
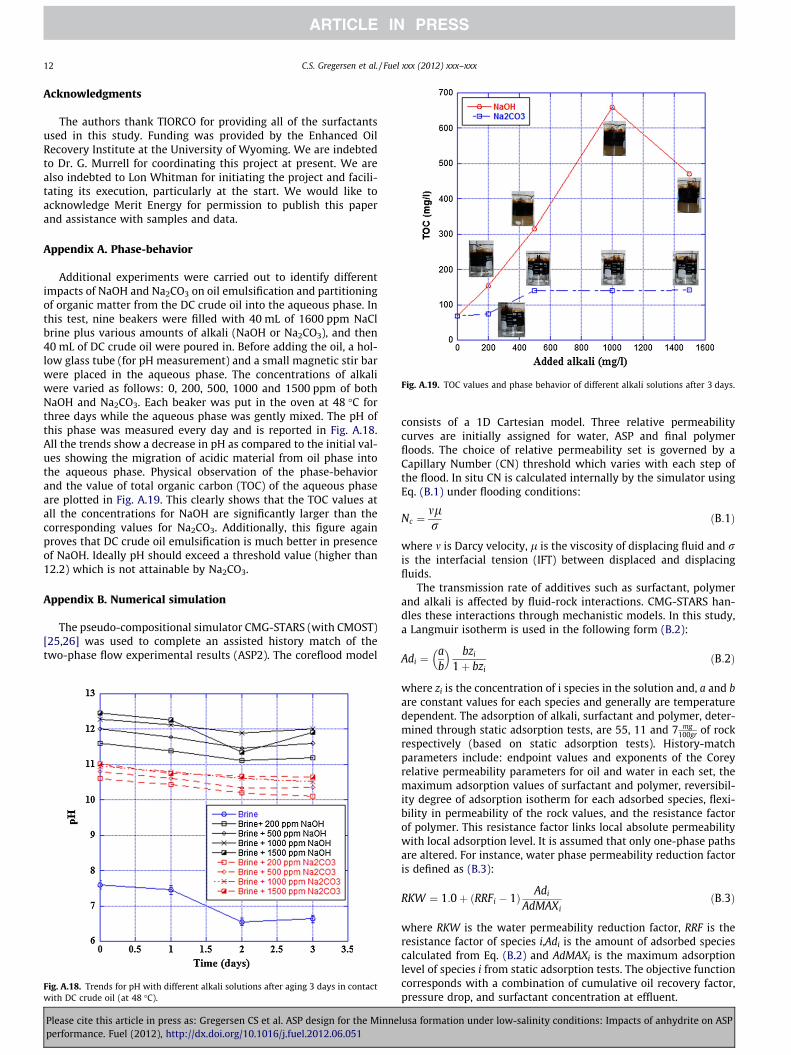
Fig. A.19. TOC values and phase behavior of different alkali solutions after 3 days.
12 C.S. Gregersen et al. / Fuel xxx (2012) xxx–xxx
Acknowledgments
The authors thank TIORCO for providing all of the surfactantsused in this study. Funding was provided by the Enhanced OilRecovery Institute at the University of Wyoming. We are indebtedto Dr. G. Murrell for coordinating this project at present. We arealso indebted to Lon Whitman for initiating the project and facili-tating its execution, particularly at the start. We would like toacknowledge Merit Energy for permission to publish this paperand assistance with samples and data.
Appendix A. Phase-behavior
Additional experiments were carried out to identify differentimpacts of NaOH and Na2CO3 on oil emulsification and partitioningof organic matter from the DC crude oil into the aqueous phase. Inthis test, nine beakers were filled with 40 mL of 1600 ppm NaClbrine plus various amounts of alkali (NaOH or Na2CO3), and then40 mL of DC crude oil were poured in. Before adding the oil, a hol-low glass tube (for pH measurement) and a small magnetic stir barwere placed in the aqueous phase. The concentrations of alkaliwere varied as follows: 0, 200, 500, 1000 and 1500 ppm of bothNaOH and Na2CO3. Each beaker was put in the oven at 48 �C forthree days while the aqueous phase was gently mixed. The pH ofthis phase was measured every day and is reported in Fig. A.18.All the trends show a decrease in pH as compared to the initial val-ues showing the migration of acidic material from oil phase intothe aqueous phase. Physical observation of the phase-behaviorand the value of total organic carbon (TOC) of the aqueous phaseare plotted in Fig. A.19. This clearly shows that the TOC values atall the concentrations for NaOH are significantly larger than thecorresponding values for Na2CO3. Additionally, this figure againproves that DC crude oil emulsification is much better in presenceof NaOH. Ideally pH should exceed a threshold value (higher than12.2) which is not attainable by Na2CO3.
Appendix B. Numerical simulation
The pseudo-compositional simulator CMG-STARS (with CMOST)[25,26] was used to complete an assisted history match of thetwo-phase flow experimental results (ASP2). The coreflood model
Fig. A.18. Trends for pH with different alkali solutions after aging 3 days in contactwith DC crude oil (at 48 �C).
Please cite this article in press as: Gregersen CS et al. ASP design for the Minneperformance. Fuel (2012), http://dx.doi.org/10.1016/j.fuel.2012.06.051
consists of a 1D Cartesian model. Three relative permeabilitycurves are initially assigned for water, ASP and final polymerfloods. The choice of relative permeability set is governed by aCapillary Number (CN) threshold which varies with each step ofthe flood. In situ CN is calculated internally by the simulator usingEq. (B.1) under flooding conditions:
Nc ¼mlr ðB:1Þ
where m is Darcy velocity, l is the viscosity of displacing fluid and ris the interfacial tension (IFT) between displaced and displacingfluids.
The transmission rate of additives such as surfactant, polymerand alkali is affected by fluid-rock interactions. CMG-STARS han-dles these interactions through mechanistic models. In this study,a Langmuir isotherm is used in the following form (B.2):
Adi ¼ab
� � bzi
1þ bziðB:2Þ
where zi is the concentration of i species in the solution and, a and bare constant values for each species and generally are temperaturedependent. The adsorption of alkali, surfactant and polymer, deter-mined through static adsorption tests, are 55, 11 and 7 mg
100gr of rockrespectively (based on static adsorption tests). History-matchparameters include: endpoint values and exponents of the Coreyrelative permeability parameters for oil and water in each set, themaximum adsorption values of surfactant and polymer, reversibil-ity degree of adsorption isotherm for each adsorbed species, flexi-bility in permeability of the rock values, and the resistance factorof polymer. This resistance factor links local absolute permeabilitywith local adsorption level. It is assumed that only one-phase pathsare altered. For instance, water phase permeability reduction factoris defined as (B.3):
RKW ¼ 1:0þ ðRRFi � 1Þ Adi
AdMAXiðB:3Þ
where RKW is the water permeability reduction factor, RRF is theresistance factor of species i,Adi is the amount of adsorbed speciescalculated from Eq. (B.2) and AdMAXi is the maximum adsorptionlevel of species i from static adsorption tests. The objective functioncorresponds with a combination of cumulative oil recovery factor,pressure drop, and surfactant concentration at effluent.
lusa formation under low-salinity conditions: Impacts of anhydrite on ASP

C.S. Gregersen et al. / Fuel xxx (2012) xxx–xxx 13
The results of the second ASP flood were history-matched intwo different scenarios and the best-matched cases were usedfor forward simulations to forecast the performance of the pro-posed ASP blend in a field scale situation.
As a first step, sensitivity analysis was performed to find theweight factor of each manipulating variable on each term of theobjective function. In this sensitivity analysis, the objective func-tion had three terms: cumulative oil recovery, pressure drop, andsurfactant concentration. It turns out that the most dominantparameters affecting oil recovery are the curvature of the oil rela-tive permeability curve at high CN, the endpoint value of the waterrelative permeability curve at high CN, and also the resistance fac-
Fig. B.20. Results of history mat
Fig. B.21. Results of history match
Please cite this article in press as: Gregersen CS et al. ASP design for the Minneperformance. Fuel (2012), http://dx.doi.org/10.1016/j.fuel.2012.06.051
tor of polymer. For pressure drop, the degree of reversibility of sur-factant adsorption, the endpoint value of the water relativepermeability curve at high CN, and the adsorption of polymerand its degree of reversibility are the most important conditions.Additionally, the amount of adsorbed surfactant and its degree ofreversibility are the key parameters which impact produced sur-factant concentration. Further, the results of sensitivity analysiswere used to build an appropriate influence matrix.
In the first scenario, the objective function is cumulative oilrecovery factor. Results of the automated history match processshown in Fig. B.20 reveal that the history matching of oil recovery
ch process of first scenario.
process for second scenario.
lusa formation under low-salinity conditions: Impacts of anhydrite on ASP

14 C.S. Gregersen et al. / Fuel xxx (2012) xxx–xxx
factor was successful and the error of objective function comparedto experimental data was 2.4%.
In the second scenario, the objective function has two equallyweighted terms, cumulative oil recovery factor and pressure drop.Additionally, in this case, the surfactant concentration was selectedas a monitoring parameter. This scenario yields a larger error com-pared to the first one, although it is more representative (Fig. B.21).The best matched case has 9.96% error compared to experimentaldata. The observed larger error in this case can be attributed tothe generation of emulsions and microemulsions and their mobili-zation in porous media, which can possibly affect both pressuredrop and oil recovery under the conditions of this test.
In the next step, the optimum solutions from scenario one andtwo were taken to forward simulation to predict the efficiency ofthe found blend on a field scale. This hypothetical field case is a3D model corresponding a heterogeneous quarter of a 5-spot pat-tern containing five layers with vertical communication. The 3Dmodel is 288 � 288 � 20 m (x � y � z) in size with 100 � 100 � 5Cartesian grid blocks along the x, y, and z directions, respectively.
Fig. B.22. Results of forward simulation using t
Fig. B.23. Results of forward simulation using th
Please cite this article in press as: Gregersen CS et al. ASP design for the Minneperformance. Fuel (2012), http://dx.doi.org/10.1016/j.fuel.2012.06.051
The permeability in the x and y directions are the same and verticalpermeability is one tenth of the lateral permeability. Each layer hasdifferent permeability and thickness which varies from top to bot-tom as follows: 80, 90, 100, 110, 120 mD and 4, 5, 4, 5, 2 m respec-tively. The injection rate was kept constant during flooding steps at909 m3/day and the producing well worked at a minimum bottomhole pressure of 500 psi. The flooding sequence was as follows:4 PV injection of water, 0.3 PV injection of ASP blend, 0.3 PV injec-tion of polymeric solution, and 2 more PV of re-injected water. Thechemical composition of ASP and polymeric blends were kept thesame as the ones used in the first two ASP flooding tests of thisstudy.
The results of the forward simulation on the basis of the ob-tained optimum solution in the first scenario are plotted inFig. B.22. Fig. B.22 shows that eventually ASP flooding can recoversignificant amounts of oil compared to waterflooding alone,although, there is a large lag time between ASP injection and oilbank generation. The results of forward simulation on the basisof obtained optimum solution in the second scenario are plotted
he best matched case in the first scenario.
e best matched case in the second scenario.
lusa formation under low-salinity conditions: Impacts of anhydrite on ASP

C.S. Gregersen et al. / Fuel xxx (2012) xxx–xxx 15
in Fig. B.23. Similar to the results of the first scenario, the results ofthe second one reveals that the ASP injection yields significant oilrecovery compared to just waterflooding. In contrast to the firstforward simulation, oil bank generation took place right afterswitching to post brine flooding indicating that there is no largedelay.
References
[1] Manrique EJ, Muci VE, Gurfinkel ME. EOR field experiences in carbonatereservoirs in the United States. SPE Reserv Eval Eng 2007;10(6):667–86.
[2] Ehrlich R, Hasiba HH, Raimondi P. Alkaline waterflooding for wettabilityalteration–evaluating a potential field application. J Petrol Technol1974;26(12):1335–43.
[3] Wyatt K, Pitts MJ, Surkalo H. Mature waterfloods renew oil production byalkaline–surfactant–polymer flooding. SPE 78711, presented at SPE EasternRegional Meeting, Lexington, Kentucky, USA; 2002.
[4] Hirasaki GJ, Miller CA, Puerto M. Recent advances in surfactant EOR. SPE J2011;16(4):889–907.
[5] Ibrahim ZB, Manap AAA, Hamid PA, Hon VY, Lim PH, Wyatt K. Laboratoryaspect of chemical EOR processes evaluation for malaysian oilfields. SPE100943, presented at the SPE Asia Pacific Oil and Gas Conference andExhibition, Adelaide, Australia; 2006.
[6] Lake LW. Enhanced oil recovery. Englewood Cliffs, NJ: Prentice-Hall; 1989.[7] Gao P, Towler BF, Li Y, Zhang X. Integrated evaluation of surfactant–polymer
floods. SPE 129590, presented at the SPE EOR conference at oil and gas WestAsia, Muscat; 2010.
[8] Liu S, Zhang DL, Yan W, Puerto M, Hirasaki GJ, Miller CA. Favorable attributes ofalkaline–surfactant–polymer flooding. SPE J 2008;13(1):5–16.
[9] Gao S, Li H, Li H. Laboratory investigation of combination of alakaline–surfactant–polymer for daqing EOR. SPE Reserv Eng 1995;10(3):194–7.
[10] Clark S, Pitts M, Smith S. Design and application of an alkaline–surfactant–polymer recovery system to the west Kiehl field. SPE Adv Technol Ser1993;1(1):172–9.
[11] Meyers J, Pitts M, Wyatt K. Alkaline–surfactant–polymer flood of the WestKiehl, Minnelusa Unit. SPE 24144, presented at the SPE/DOE improved oilrecovery symposium,Tulsa, Oklahoma; 1992.
Please cite this article in press as: Gregersen CS et al. ASP design for the Minneperformance. Fuel (2012), http://dx.doi.org/10.1016/j.fuel.2012.06.051
[12] Vargo J, Turner J, Vergnani B, Pitts MJ, Wyatt K, Surkalo H, et al. Alkaline–surfactant–polymer flooding of the Cambridge Minnelusa field. SPE ReservEval Eng 2000;3(6):552–8.
[13] Pitts M.J, Dowling P, Wyatt K, Surkalo H, Adams C. Alkaline–surfactant–polymer flood of the tanner field. SPE 100004, presented at the SPE/DOEsymposium on improved oil recovery in Tulsa, Oklahoma; 2006.
[14] Wang C, Wang B, Cao X, Li H. Application and design of alkaline–surfactant–polymer system to close well spacing pilot Gudong oilfield. SPE 38321,presented at the SPE western regional meeting, Long Beach, California; 1997.
[15] Stoll M, Al-Shureqi H, Finol J, Al-Harthy SA, Oyemade SN, Kruijf Ad, et al.Alkaline/surfactant/polymer flood: from the laboratory to the field. SPE ReservEval Eng 2011;14(6):702–12.
[16] Wyatt K, Pitts M.J, Surkalo H, Griffith L. Alkaline–surfactant–polymertechnology potential of the Minnelusa trend, powder river basin. SPE 29565,presented at the low permeability reservoir symposium, Denver, Colorado,USA; 1995.
[17] Kazempour M, Sundstrom E, Alvarado V. Geochemical modeling andexperimental evaluation of high-pH floods: impact of water–rockinteractions in sandstone. Fuel 2012;92(1):216–30.
[18] Barnes J.R, Smit J, Smit J, Shpakoff G, Raney K.H, Puerto M. Development ofsurfactants for chemical flooding at difficult reservoir conditions. SPE 113313,presented at the SPE/DOE symposium on improved oil recovery, Tulsa,Oklahoma, USA; 2008.
[19] Levitt D, Jackson A, Heinson C, Britton LN, Malik T, Dwarakanath V, et al.Identification and evaluation of high-performance EOR surfactants. SPE ReservEval Eng 2009;12(2):243–53.
[20] Wade WH, Morgan JC, Jacobson JK. Low interfacial tensions involving mixturesof surfactants. Soc Petrol Eng J 1977;17(2):122–8.
[21] Wu Y, Shuler P.J, Blanco M, Tang Y, Goddard W.A. A study of branched alcoholpropoxylate sulfate surfactants for improved oil recovery. SPE 95404,presented at the SPE annual technical conference and exhibition, Dallas,Texas; 2005.
[22] Salager JL, Bourrel M, Schechter RS, Wade WH. Mixing rules for optimumphase-behavior formulations of surfactant–oil–water systems. Soc Petrol Eng J1979;19(5):271–8.
[23] Liu S, Miller CA, Li RF, Hirasaki G. Alkaline/surfactant/polymer processes: widerange of conditions for good recovery. SPE J 2010;15(2):282–93.
[24] Alvarado V, Wang X, Moradi M. Role of acid components and asphaltenes inwyoming water-in-crude oil emulsions. Energy Fuels 2011;25(10):4606–13.
[25] CMG-STARS. Calgary, Alberta: Computer Modeling Group Limited; 2011.[26] CMG-CMOST. Calgary, Alberta: Computer Modeling Group Limited; 2011.
lusa formation under low-salinity conditions: Impacts of anhydrite on ASP