asierican am ans in w york ne city - asian american … am ans in w york ne city: a decade of...
TRANSCRIPT

AsiAn AmericAns in new York citY: A DecADe of DynAmic chAnge 2000-2010
April 2012

22
TAble of conTenTs
Foreword 4
executive summArY 5
introduction 11
chApter 1: Demographic Changes 13
chApter 2: Children and Seniors 26
chApter 3: Civic Engagement 44
chApter 4: Economic Status and Contributions 50
chApter 5: Implications 63

3
research team
Howard ShihCensus Programs Director, Asian American Federation
Peiyi XuResearch Intern, Asian American Federation
cover design and report Layout by
Rebecca Lee
special thanks to
Cao K. O and Jo-Ann Yoo for their feedback.
photo credits
Page 10: Neha Gautam
Page 11,12,26: Charles B. Wang Community Health Center
Page 24: Minkwon Center for Community Action
Page 13, 29, 35, 42, 50, 54: Gary Fong
Page 44: Chhaya CDC
Page 45: Filipino American Health Services, Inc.
Page 64: SAYA! South Asian Youth Action
Faces of Asian Americans on the cover and throughout the report are from photos by the member agencies of the Asian American Federation.
Copyright ©2012 Asian American Federation
Suggested Citation
Asian American Federation (2012). Asian Americans in New York City: A Decade of Dynamic Change 2000-2010. New York, NY.

44
foreworD
Asian Americans in New York City: A Decade of Dynamic Change 2000-2010 represents a new snapshot of our communities showing that with the increasing growth and diversity come new challenges and opportunities.
The report raises important issues regarding the future of the Asian community in New York City. As our population shifts to new neighborhoods, how will government agencies and community service providers respond to the needs in our community. As the number of Asians actively participating in our political process, whether as candidates, voters or donors, how will Asians negotiate the new challenges and responsibilities of their new place at the table? Increasing economic contributions of Asian New Yorkers bring up questions of how Asian small businesses, which are more likely to have paid employees, expand and grow from local to regional to even international markets.
We hope that the report will stimulate discussions within our communities, with elected officials, policy makers and community leaders that will result in policies rooted in data and the hard won experiences of our member agencies.
This report is the first in a series of reports based on the 2010 Census and the American Community Survey. Through research, the Federation hopes to broaden public understanding of the Asian American community, stimulate discussion of community concerns, support our member agencies in addressing community needs, and inform policies that advance the well-being of Asian Americans.
The Asian American Federation would like to thank the Wallace H. Coulter Foundation for their continued support to raise awareness of the importance and utility of the decennial censuses and the American Community Survey in our communities.
Cao K. O
Executive Director
Asian American Federation

5
execuTive summAry
Asian Americans in New York City: A Decade of Dynamic Change 2000-2010 is a first detailed look at Asian New Yorkers based on the recent data releases from the 2010 Census and the new American Community
Survey. The report covers demographic changes that have occurred in the past decade, using the 2000 and 2010 Census population counts to paint a detailed picture of the growth and diversity of the Asian community in the city. The status of Asian children and seniors is reviewed by examining changes in poverty, language access, education and health insurance coverage. In addition, living situations and marital status for Asian seniors is reported. Civic engagement data for Asians is presented on naturalization rates, language access, and voter registration and participation. Finally, data on income, poverty, educational attainment, English ability, employment, industry and occupations employing Asians, Asian-owned businesses, and the impact of the Great Recession on Asian New Yorkers are presented.
Demographic ChangesCItywIDE
Between 2000 and 2010, the Asian community in New York City was the fastest growing major race and ethnic group, growing by 30 percent.
Asian child population grew by 16 percent, the only major race and ethnic group to show an increase. Most of the numeric growth came from Chinese, Bangladeshi, Pakistani and Japanese children. All of the net growth in Asian children came from the native-born population.
The number of Asian seniors grew by 64 percent, far outpacing Hispanic seniors at 42 percent. Most of the numeric growth came from Chinese, Indian, Korean and Filipino seniors.
Asians are now 13.9 percent of the population in New York City, up from 10.9 percent in 2000.
QuEEnS
Home to 49 percent of all Asians as well as Asian children and seniors in New York City.
For the first time, more Asians than blacks resided in Queens, making Asians the third largest ethnic group in the borough, behind non-Hispanic whites and Hispanics.
Five out of seven Asian majority neighborhoods were in Queens.
Most of the increase in Asian children in the borough occurred in the Chinese and Bangladeshi communities. Queens also saw a major decline in Indian and Korean children.
Asian senior population growth occurred in a wide range of Asian groups: Chinese, Indian, Korean, Filipino and Bangladeshi communities all added between 1,000 to 8,000 seniors.
Brooklyn
Home to 25 percent of all Asian New Yorkers, 29 percent of Asian children and 22 percent of Asian seniors.
More Asian children moved into Brooklyn than non-Hispanic white children, the second fastest growing group. Growth came from the Chinese, Bangladeshi, and Pakistani children. Number of Indian children in borough declined.
table ES1: Asian Population by Borough

6
Growth in the Asian senior population came mostly from the Chinese community. Three-quarters of Asian seniors were Chinese.
Home to the largest Pakistani and Vietnamese populations in New York City.
MAnhAttAn
Home to 18 percent of all Asian New Yorkers, 12 percent of Asian children and 20 percent of Asian seniors.
Much of the growth in Asian children in Manhattan came among Koreans, Indians and Japanese. Chinese child population dropped slightly.
Home to the largest Japanese population in New York City.
Home to the largest Japanese senior population in New York City, whose members were most likely to live alone compared with the other Asian groups.
Bronx
Home to 5 percent of all Asian New Yorkers, 6 percent of Asian children, and 3 percent of Asian seniors.
Growth in Asian children came from Bangladeshi community, balanced by a drop in the Indian and Korean child populations.
Home to the largest Cambodian population in New York City, but the population shrank by 13 percent.
ASIAn nEIghBorhooDS
The number of Asian majority Neighborhood Tabulation Areas (NTA) increased from two in 2000, Flushing, Queens, and Chinatown, Manhattan, to seven in 2010, adding Queensboro Hill, East Flushing, Elmhurst-Maspeth, Murray Hill in Queens; and Sunset Park East in Brooklyn.
Smaller areas with majority Asian populations include portions of:
Koreatown, Manhattan
Bayside-Oakland Gardens and Jamaica Hills, Queens.
Manhattan’s Chinatown was the only large Asian NTA which saw a decrease in population, losing 15 percent
All losses came from Asian children (28 percent decrease) and working-age adults (16 percent decrease).
Asian senior population grew by 4 percent.
ASIAn grouPS
The ethnic groups with the largest numeric increases in population were Chinese (+126,113), Bangladeshis (+33,519) and Indians (+26,468).
table ES2: Population by Asian group for new york City

7
Children Asian children were
distributed exactly the same as all children in New York City across preschool, elementary, middle and high school age groups.
Asian children had higher poverty rates than non-Hispanic white children, at 22 percent and 16 percent respectively.
Bangladeshi children saw highest poverty rates among Asian groups, going up 7 percentage points to 42 percent poverty rate.
Child poverty rates fell for Vietnamese and Chinese, down 11 percentage points and 5 percentage points respectively.
Poverty rates for Filipino children, while low, went up 4 percentage points.
While Chinese remained the spoken Asian language group with the largest number of limited English proficient (LEP) speakers among children, Nepali and Japanese speaking children with LEP both went up by several hundred individuals.
Across all income levels, Asian children were much more likely than non-Hispanic white children to attend public school by wide margin.
Chinese children were more likely to drop out than non-Hispanic white children.
Status dropout rates (persons age 16 to 24 years not enrolled in school and did not graduate high school) for Chinese were 22 percent, compared with 16 percent for non-Hispanic white.
Asian children were slightly less likely to have health insurance than the other major race and ethnic groups, with 6 percent of Asian children not covered versus 3 to 5 percent for the other groups.
Korean children were twice as likely not to have health insurance, with 10 percent not covered.
Seniors Asian seniors were tied for
the youngest median age along with Hispanic seniors, but saw the biggest jump in median age last decade, indicating a aging elderly population.
Asian seniors were more likely to be living in family households than the other major race and ethnic groups.
Vietnamese were the only Asian group who had less than half of their seniors living in a married-couple household.
More than one in three Japanese seniors lived alone, a rate nearly as high as non-Hispanic white seniors.
Filipinos and Vietnamese seniors were as likely as
black and Hispanic seniors to be living in a single head of household family.
Majority of Asian seniors were married.
Only among Bangladeshis, Pakistanis and Vietnamese were less than half of seniors married.
The poverty rate of Asian seniors and non-Hispanic white seniors increased 1 percentage point, while other groups saw declines in poverty rate.
Bangladeshi seniors had the highest poverty rate of 34 percent, but had the largest drop in poverty rate since 2000 among the Asian groups.
Chinese senior had the largest increase in senior poverty rates among the Asian groups.
Japanese and Filipino were the only groups with senior poverty rates lower than 10 percent.
Asians were less likely to receive Social Security benefits than the other major race and ethnic groups.
Bangladeshi, Indian and Pakistani seniors were far less likely to receive Social Security than other Asian groups.
Only Japanese seniors received Social Security at the same rates as non-Hispanic whites.

8
As expected, the percent of seniors receiving Supplemental Security Income (SSI) were higher in groups with high poverty rates.
Pakistani seniors received SSI at a similar rate as non-Hispanic whites, despite their much higher poverty rate.
For the Asian languages spoken by seniors, the majority of speakers had LEP.
Over 90 percent of Chinese, Korean and Vietnamese speaking seniors had LEP.
Only Tagalog and Hindi speakers had LEP rates below 50 percent.
Asian seniors were more than twice as likely to have no health insurance coverage as the other major race and ethnic groups.
One in three Bangladeshi seniors had no health insurance.
Pakistani seniors made up for lack of access to Medicare through private insurance, with 13 percent of Pakistani seniors having private coverage.
Civic Engagement Asians represented 11
percent of the citizen voting-age population (CVAP) in New York City, up from 7 percent in 2000.
Asian CVAP grew by 53 percent, far outpacing the
other three largest race and ethnic groups.
Bangladeshi CVAP more than tripled from 2000.
Chinese remained the Asian language most spoken by voting-age citizens with limited English proficiency (LEP) at nearly 140,000.
Korean was the second largest with nearly 23,000 LEP speakers
Bengali-speaking voting-age citizens more than doubled in size, to over 16,000.
Asians were less likely to be registered to vote than the other three major race and ethnic groups, with potentially more than 300,000 voting-age citizens yet to be registered. The reasons Asians gave for not registering reveal potential need for voter education.
Despite this, Asians have become 8 percent of registered voters in New York City during the 2004-2010 time period, compare to 4 percent during 1994-2000.
Asians were more likely to say they were not eligible to vote, do not know how to register or had difficulty understanding English as reasons for not registering.
Asians were more than twice as likely to cite being too busy as the reason for not voting compared to the other
three major race and ethnic groups.
Economic Status and ContributionsThe ethnic diversity in the Asian community is matched by the economic diversity in our communities. While many Asian New Yorkers match the image of the model minority myth, an equal number struggle at the margins of our society.
InCoME AnD PovErty
Growth in median income for Asian families lagged behind that of black and non-Hispanic white families.
Non-Hispanic white New Yorkers were more than twice as likely as Asian New Yorkers to earn $200,000 or more.
Filipinos had the highest median household and family incomes and the lowest poverty rates. However, Filipinos were less likely to earn $200,000 or more than their fellow Asian New Yorkers and median incomes fell by 9 percent from the year 2000.
Median incomes in Bangladeshi, Filipino, Indian, Japanese, and Pakistani families dropped after adjusting for inflation.
One in three Bangladeshis lived in poverty, highest among all groups. Bangladeshis also had the biggest jump in poverty rates among the Asian groups.

9
Pakistani and Vietnamese poverty rates were higher than black poverty rates.
EDuCAtIonAl AttAInMEnt
Asians had the second highest rate of adults with no high school diploma in the city, behind that of Hispanics.
Asian adults also had the second highest rates of college graduates and post-graduate degree holders, behind that of non-Hispanic whites.
EMPloyMEnt
Asians continued to have the highest labor force participation rates in the city among the four largest race and ethnic groups.
Filipinos had the highest labor force participation rates in the city among the top eight Asian groups.
Bangladeshi and Pakistani women had very low labor force participation rates compared to the other groups. Bangladeshi and Pakistani men had the highest rates.
Asian workers had the largest jump in unemployment rates going from 6.6 percent in 2000 to 7.7 in the 2006-2010 time period, compared to the other major race and ethnic groups.
Bangladeshi workers saw the largest jump among Asian groups in unemployment
rates going from 5.3 percent in 2000 to 9.7 percent in 2006-2010.
The four largest Asian groups, Chinese, Filipino, Indian, and Korean, all saw increases in their unemployment rates.
Women in three largest South Asian groups had the highest unemployment rates among the Asian groups.
InDuStrIES AnD oCCuPAtIonS
The health care and social assistance industry sector employed the most Asian workers as well as the most workers citywide.
Asian workers were overrepresented in food services, wholesale trade and manufacturing industry sectors and were underrepresented in arts, entertainment, and recreation; public administration; educational services; and construction industry sectors.
While more than half of non-Hispanic white workers in New York City were employed in the management, professional, and related occupations, only thirty-seven percent of Asian workers were employed in the same fields.
Asian workers were overrepresented in production, transportation, and material moving occupations and were
underrepresented in natural resources, construction, and maintenance occupations.
BuSInESS ownErShIP
Asian-owned businesses contributed $38 billion worth of sales, receipts or value of shipments and employed more than 160 thousand paid workers in 2007, the most recent data available.
A growing number of Asian-owned businesses were from Asian groups outside the six largest Asian categories. Businesses owned by these Asians groups combined to nearly equal the number of Korean-owned businesses in the city. These owners were most likely Bangladeshi and Pakistanis.
Asian firms were most overrepresented in accommodation and food services; transportation and warehousing; and wholesale trade sectors.
Asian firms were most underrepresented in arts, entertainment, and recreation; information; and finance and insurance sectors.
Almost one in five Korean and Pakistani working males were self-employed.
Vietnamese self-employment rates went up nearly 5 percentage points, from 10 percent to nearly 15 percent of employed workers.

10
Impact of great recession on Asian new yorkersData on unemployment rates, household income and poverty rates seem to suggest that Asian New Yorkers suffered disproportionately to the other major race and ethnic groups.
Unemployment rates edged up higher for Asians than for the other three groups. The result was the estimated number of Asians looking for work went up 56 percent, from 31,263 Asians during 2005-2007 to 48,805 Asians during 2008-2010.
Overall poverty rates for Asians edged up higher compared with other groups.
Asian and black children living with their families showed a statistically significant increase in poverty rates.
Working-age Asians saw the largest increase in poverty rates among the major race and ethnic groups.

11
inTroDucTion
With nearly one in seven New Yorkers claiming Asian
heritage, the tremendous growth in the Asian community has greatly reshaped our city over the past decades. With the sheer size also comes vast diversity, with immigrants coming from all over the Asian continent, as well as second and third generations of Asian Americans making their home in New York City.
Asian Americans in New York City: A Decade of Dynamic Change 2000-2010 is a first detailed look at Asian New Yorkers based on the recent data releases from the 2010 Census and the new American Community Survey. Our goal for this report is three-fold. First, the diversity and rapid growth in our communities requires careful examination of disaggregated data on all Asians in order to understand our communities with the goal of providing culturally and linguistically appropriate services. Second, the report seeks to build awareness and improve accessibility around the vast data resources available to our communities. Finally, we hope that the report will not

12
only answer the most frequent questions asked about our communities, but also provoke new areas of inquiry.
This report is organized into four chapters. The first chapter deals with the demographic changes that have occurred in the past decade, using the 2000 and 2010 Census population counts to paint a detailed picture of the growth and diversity of the Asian community in the city. The second chapter focuses on children and seniors, reviewing population changes, poverty, language access, education and health insurance coverage. The third chapter on civic engagement in the Asian community presents data on naturalization rates, language access, and voter registration and participation. The fourth chapter summarizes the economic status and contributions of Asian New Yorkers. Data on income, poverty, educational attainment, English ability, employment, industry and occupations employing Asians, and Asian-owned businesses are presented. The chapter concludes with a special section on the impact of the Great Recession on Asian New Yorkers by comparing the 2005-2007 and the 2008-2010 American Community Surveys.
The report uses two primary sources of data the full count decennial censuses of 2000 and 2010 and the detailed social, economic and housing data captured in the long-form of
the 2000 Census and the new 2006-2010 American Community Survey (ACS). The American Community Survey represents a radical shift in how data on our communities are collected. Previously, this data was collected once every ten years as part of the decennial census through the “long form.” The Census Bureau began full implementation of the American Community Survey in 2005 to replace the long form decennial census. The purpose was to enable the annual production of social, economic and housing statistical estimates on our communities, rather than once a decade.
The demographic sections of the report covering total population and age breakdowns rely on the full count data of the 2000 and 2010 Censuses, allowing us to include the full range of Asian ethnic groups reported by the Census Bureau. The remaining
socioeconomic sections will be limited to major race and ethnic groups living in the city: Asians, blacks, Hispanics, and non-Hispanic whites; as well as the eight largest Asian groups. We are restricted to the larger Asian groups because our primary source of ACS data is the Public Use Microdata Sample which has a limited sample size making the estimated characteristics of small populations statistically inaccurate.

13
ChApter 1
DemogrAphic chAnges in new york ciTy’s AsiAn populATion
The decennial census provides a detailed demographic snapshot of communities once every ten years. The Federation’s 2010 Census Outreach Campaign was focused on making the latest count the most accurate as possible for the Asian community by assuring our communities that participation was safe and important.
As a result we have data that gave us a detailed portrait of Asian American communities in New York City for the first time in ten years. The data revealed that Asian New Yorkers continued to grow in number and covered more neighborhoods than ever before. New Asian groups have taken root in our city and established groups have been moving and expanding to new neighborhoods.
This chapter will discuss the Asian New Yorker population in context with blacks, Hispanics and whites through the lens of the 2010 Census.1 We will cover the population changes citywide and within each borough and highlight key Asian neighborhoods. We will conclude with a discussion of the demographic changes in each of the Asian groups in the city.

14
Citywide: Asians were Fastest growing group
Between 2000 and 2010, the Asian community in New York City was the fastest growing major race and ethnic group.2
The number of Asian New Yorkers went up by 262,142 residents, or 30 percent, from 2000.
Asians are now 13.9 percent of the population in New York City, up from 10.9 percent in 2000.
table 1.1: Population for Major race and Ethnic groups in new york City
Boroughs: Asian Population was the only group that grew in All Boroughs
Asian population was the only one to grow in all five boroughs. The number of Hispanics in Manhattan fell 3 percent, while blacks and non-Hispanic whites saw drops in population in three out of five boroughs. Great variation in size and ethnicity exists among the five boroughs, as summarized in the following findings.
QuEEnS
For the first time, more Asians than blacks resided in Queens, making Asians the third largest ethnic group in the borough, behind non-Hispanic whites and Hispanics. If growth rates in Queens continue at their current pace for all groups, then Asians will become the largest ethnic group in Queens sometime this decade. The next chapter will describe how seniors and children have impacted the growth in the Asian population in Queens.
Five of the seven Asian majority Neighborhood Tabulation Areas (NTA)3 were in Queens
1. Flushing (71% Asian) 2. Queensboro Hill (67% Asian)
3. East Flushing (61% Asian) 4. Elmhurst-Maspeth (58% Asian)
5. Murray Hill (54% Asian)
Five Largest Asian NTAs (see Table 1.7)
1. Flushing 2. Elmhurst 3. Murray Hill
4. Jackson Heights 5. South Ozone Park

dem
oG
rAph
ics
15
Astoria saw a 12.7 percent decrease to 13,885 Asians.
Largest Asian Groups in Queens:
1. Chinese 2. Indian 3. Korean
4. Filipino 5. Bangladeshi
table 1.2: Population for Major race and Ethnic groups in Queens Borough
Brooklyn
While Brooklyn’s Asian population grew faster than Queens on a percent basis, Queens added 119,314 additional Asian residents compared to Brooklyn’s 78,217 residents. The next chapter will describe how important Asian children were to the growth of Brooklyn’s Asian population.
Sunset Park East (53% Asian) became an Asian majority NTA last decade.
Five Largest Asian NTAs (see Table 1.7)
1. Sunset Park East 2. Bensonhurst West 3. Bensonhurst East
4. Dyker Heights 5. Borough Park
Largest Asian Groups in Brooklyn:
1. Chinese 2. Indian 3. Pakistani
4. Filipino 5. Bangladeshi
Home to New York City’s largest Pakistani and Vietnamese population
table 1.3: Population for Major race and Ethnic groups in Brooklyn Borough

16
MAnhAttAn
While Manhattan’s Asian population grew overall, Chinatown NTA in Manhattan saw a steep decline in Asian population (15.2 percent). Also, the nearby SoHo-Tribeca-Civic Center-Little Italy NTA Asian population fell by 3.1 percent, but the number of Asians in Battery Park City-Lower Manhattan NTA more than doubled in size with a mix of Chinese, Indians and Koreans moving in. The next chapter will describe how Asian children were an important component of the loss of Asian population in Chinatown.
One majority Asian NTA: Chinatown (65% Asian)
Five Largest Asian NTA (see Table 1.7)
1. Chinatown 2. Lower East Side 3. SoHo-Tribeca-Civic Center-Little Italy
4. Upper West Side 5. Lenox Hill-Roosevelt Island
Largest Asian Groups in Manhattan:
1. Chinese 2. Indian 3. Korean
4. Japanese 5. Filipino
Home to New York City’s largest Japanese population
table 1.4: Population for Major race and Ethnic groups in Manhattan Borough
Bronx
Home to New York City’s largest Cambodian population, but the population declined by 13 percent.
Five Largest Asian NTA (see Table 1.7)
1. Norwood 2. Parkchester 3. Pelham Parkway
4. Westchester-Unionport 5. Van Nest-Morris Park-Westchester Square
Largest Asian Groups in Bronx:
1. Indian 2. Bangladeshi 3. Chinese
4. Filipino 5. Vietnamesetable 1.5: Population for Major race and Ethnic groups in Bronx Borough

dem
oG
rAph
ics
17
StAtEn ISlAnD
Largest Asian Groups in Staten Island:
1. Chinese 2. Indian 3. Filipino
4. Korean 5. Pakistani
Home to New York City’s largest Sri Lankan population
table 1.6: Population for Major race and Ethnic groups in Staten Island
table 1.7: neighborhood tabulation Areas with largest Asian Populations

18
neighborhoods: Expanding Boundaries
Departing from the NTA definition of neighborhoods, four areas across the city were made of contiguous Census tracts that were majority Asian in both 2000 and 2010:
Chinatown in Manhattan
Sunset Park in Brooklyn
Jackson Heights and Elmhurst in Queens
Flushing in Queens
The majority Asian areas in Sunset Park, Jackson Heights-Elmhurst, and Flushing continued to expand geographically, covering more Census tracts in 2010 than in 2000.
In 2010, contiguous Census tracts in Koreatown, Manhattan; Bayside-Oakland Gardens and Jamaica Hills, Queens; and Bensonhurst, Brooklyn; emerged as majority Asian areas.
Figure 1.1: Maps of Asian Majority Census tracts in 2000 and 2010

dem
oG
rAph
ics
19
Asian groups: great variation in growth rates
Great variation existed among the many Asian groups living in the city. New Asian groups have established themselves in New York City while the largest Asian groups continue to grow at a steady pace.
The fastest growing Asian ethnic groups in New York City were the Hmong, Taiwanese, Bangladeshi, and Laotians, with all four groups more than doubled in size from 2000 to 2010.
The ethnic groups with the largest numeric increases in population were Chinese (+126,113), Bangladeshis (+33,519) and Indians (+26,468).
For most of the Asian groups in New York City, Queens was home to the largest share of their population, except for:
Brooklyn: Pakistanis and Vietnamese Manhattan: Japanese
Bronx: Cambodians Staten Island: Sri Lankans
table 1.8: Population Changes for Asian groups in new york City

20
table 1.9: Distribution of Asian groups Across Boroughs
ChInESE
Chinese remained the largest Asian group in New York City, with more than half a million residents, growing by 34 percent from 2000 to 2010. Queens had 40 percent of Chinese New Yorkers, with Brooklyn close behind with 36 percent. Manhattan had 20 percent of Chinese, with Staten Island and the Bronx far behind at 3 percent and 2 percent respectively. Chinese were also the largest Asian group in four of the five boroughs, with the only exception being the Bronx, where they were the third largest.
The Chinese population in Staten Island grew the fastest (76 percent) among the five boroughs. Brooklyn (43 percent) and Queens (40 percent) had similar growth rates, while Manhattan (10 percent) and the Bronx (6 percent) were significantly outpaced by the other three boroughs.
Chinese neighborhoods were concentrated around Flushing, Queensboro Hill, Bayside, Oakland Gardens in Northeastern Queens; Elmhurst in Queens; Chinatown
in Manhattan; and Sunset Park, Bensonhurst and Sheepshead Bay in Brooklyn.
While most of the neighborhoods with large Chinese American populations maintained double digit growth rates, the Chinatown and SoHo-Tribeca-Civic Center-Little Italy NTAs saw declines in the Chinese population of 17 percent and 19 percent respectively. In addition, the Lower East Side NTA saw only a 6 percent increase in the Chinese population.

dem
oG
rAph
ics
21
InDIAn
Indian New Yorkers were the second largest Asian group in the city at 232,696 residents. Indians were tied with Cambodians for the slowest growth rate at 13 percent. Most Indians lived in Queens (61 percent) with 14 percent in Brooklyn, 13 percent in Manhattan, 9 percent in the Bronx and 3 percent in Staten Island. Indians were the largest Asian group in the Bronx, and the second largest in the other four boroughs.
The Indian population grew the fastest in Manhattan at 70 percent, with the other boroughs far behind at 9 percent for Queens, 8 percent for Staten Island, 5 percent for the Bronx, and 3 percent for Brooklyn.
Two NTAs stood out in the Indian community, South Ozone Park and Richmond Hill, each with more than 15,000 Indians. Jackson Heights was next largest with 7,823 residents. Bellerose, Floral Park-Glen Oaks, and Flushing in Queens also had high concentrations of Indians. In the Bronx, Indians tended to reside in the Norwood, Westchester-Unionport and Parkchester NTAs.
The Elmhurst and Flushing NTAs in Queens each saw 26 percent declines in the Indian population from 2000 to 2010. The Astoria NTA saw a 37 percent decrease. All three NTAs saw a net decrease of between seventeen and eighteen hundred Indians. Growth has been in various NTAs in Southeast Queens around South Ozone Park and Richmond Hill, in Northeast Queens around Bellerose, and across Manhattan.
korEAn
Koreans were the third largest Asian group in the city, growing by 14 percent to 102,820 in 2010. A large majority of Koreans resided in Queens (64 percent), with 21 percent in Manhattan, 9 percent in Brooklyn, and 3 percent each in the Bronx and Staten Island.
The Korean community in Manhattan grew at the fastest pace (86 percent); while in Brooklyn saw a 20 percent growth and Queens 4 percent. Staten Island and the Bronx saw a net decrease in the Korean population, 5 percent and 24 percent declines respectively.
The Korean population is concentrated in the northeastern neighborhoods of Queens: Murray Hill, Flushing, Bayside-Bayside Hills, Oakland Gardens and East Flushing were the top five NTAs. In Manhattan, Koreatown remained the largest concentration of Koreans.
There has been a major shift in the Korean community, with Elmhurst, central Flushing, Jackson Heights, Sunnyside, and Woodside seeing large declines in the Korean population. Flushing had a net loss of 2,738 Koreans and Elmhurst lost a net of 2,036 Koreans. Meanwhile Bayside, Fresh Meadows, Murray Hill, East Flushing and Douglaston had between 1,000 to more than 2,200 Koreans moving into those areas. Lower Manhattan also saw an increase of just over one thousand Koreans.
FIlIPIno
Filipinos were the fourth largest Asian group in the city with 78,030 residents. The Filipino
population grew by 26 percent in the last decade. More than half (54 percent) of Filipinos lived in Queens, with 17 percent residing in Manhattan, 13 percent in Brooklyn, and 8 percent each in the Bronx and Staten Island.
Manhattan’s Filipino community grew the fastest at 31 percent, followed closely by Brooklyn at 29 percent and Queens at 26 percent. The population grew by 19 percent and 18 percent in the Bronx and Staten Island respectively.
The greatest concentrations of Filipinos were found in Queens in neighborhoods such as Elmhurst, Woodside, Hillcrest, Jamaica Estates, Queens Village and Bellerose. Of the NTAs with more than one thousand Filipino residents, only the Astoria NTA saw a decline in population, down 16 percent from 2000 to 2010.
BAnglADEShI
Bangladeshis became the fastest growing population among the five largest Asian groups, doubling in size from 28,269 to 61,788, growing 119 percent during the last decade. Bangladeshis also had the second highest numeric growth in population among all Asian groups.
Bangladeshis were most likely to reside in Queens at 62 percent, while 20 percent were in Brooklyn, 14 percent in the Bronx, 3 percent in Manhattan, and 1 percent in Staten Island. Bangladeshis were the fastest growing Asian group in the Bronx and Staten Island with growth rates of 253 percent and 453 percent respectively. Bangladeshis are now the second largest Asian group in the Bronx,

22
up from sixth largest, surpassing Chinese, Filipinos, Koreans and Vietnamese. In the other boroughs, Queens saw a 109 percent increase in the Bangladeshi population, Brooklyn 99 percent, and Manhattan 69 percent.
The NTAs with the largest Bangladeshi populations were Jamaica, Jackson Heights, Briarwood-Jamaica Hill, Kensington-Ocean Parkway, Elmhurst, and Woodside, all in Queens with the exception of Kensington-Ocean Parkway in Brooklyn. The Bangladeshi community in the Bronx is centered on the Parkchester NTA, with a new concentration emerging in the Norwood NTA. Another concentration of Bangladeshis was west of Bayside Cemetery, straddling three NTAs: Ozone Park, Cypress Hills-City Line, and East New York.
Two NTAs with more than one thousand Bangladeshis saw a drop from 2000 to 2010. Astoria dropped 25 percent to 2,231 in 2010, and Steinway NTA dropped 10 percent to 1,009 Bangladeshis in 2010.
PAkIStAnI
The number of Pakistanis in New York City grew 35 percent to 46,369 in 2010, making them the sixth largest Asian group in the city. Brooklyn had the highest share of Pakistanis among the five boroughs, with 43 percent of the population. Queens was home to 39 percent of the Pakistani community, with the remaining three borough having 6 percent each. Pakistanis more than doubled in Manhattan at 110
percent and Staten Island at 105 percent, while the Bronx saw a 58 percent growth rate, Brooklyn 40 percent, and Queens 16 percent.
The NTAs with the most Pakistanis were Bensonhurst, Brighton Beach, Flatbush and Midwood in Brooklyn and Briarwood-Jamaica Hill and Jackson Heights in Queens.
JAPAnESE
The Japanese population in New York City grew by 20 percent to a total of 31,742 in 2010. The majority of Japanese (52 percent) lived in Manhattan, with 25 percent in Queens, 19 percent in Brooklyn, 3 percent in the Bronx, and 1 percent in Staten Island.
Brooklyn saw the fastest growth in Japanese residents, increasing 93 percent from 2000 to 2010. Queens was next with a 31 percent growth rate, followed by 19 percent in the Bronx, 3 percent in Manhattan, and no growth in Staten Island.
Japanese were spread throughout Manhattan with the Upper West Side, Yorkville, Lenox Hill-Roosevelt Island, Lincoln Square, and Turtle Bay-East Midtown NTAs having more than one thousand Japanese. Outside of Manhattan, Astoria and Forest Hills NTAs in Queens had more than one thousand Japanese.
vIEtnAMESE
The Vietnamese community in the city grew 26 percent to 16,378 in 2010. Brooklyn had the most Vietnamese New Yorkers (31 percent), with Queens close behind with 26 percent, the Bronx with 22 percent, and Manhattan with 18
percent. While Staten Island only had 3 percent of the Vietnamese population, the borough saw the largest growth with nearly twice (97 percent) as many Vietnamese in 2010 than in 2000. Manhattan saw a 73 percent increase in the number of Vietnamese, Brooklyn with 26 percent growth, Queens with 16 percent, and the Bronx with 7 percent.
The Vietnamese community was concentrated in the Kingsbridge Heights NTA west of Bronx Park, and Pelham Parkway and Allerton-Pelham Gardens NTAs to the east of Bronx Park. Many Vietnamese also settled around the Chinatowns across the city, especially Sunset Park and Bensonhurst.
tAIwAnESE
The Taiwanese community in the city had the second fastest growth rate among all Asian groups at 149 percent. Of the 13,682 Taiwanese residents, 66 percent lived in Queens, 24 percent in Manhattan, 8 percent in Brooklyn, and 1 percent each in the Bronx and Staten Island. Brooklyn saw the fastest growth in the Taiwanese population at 249 percent. Manhattan was second at 210 percent, followed by Queens at 129 percent, Staten Island at 66 percent, and the Bronx at 63 percent.
Flushing and the surrounding NTAs of Murray Hill, East Flushing and Bayside, remain the center of the Taiwanese community in New York City. There is an additional concentration around Forest Hills and Rego Park.

dem
oG
rAph
ics
23
ASIAn grouPS wIth FEwEr thAn tEn thouSAnD rESIDEntS
The thai population in the city grew 45 percent to 7,244 in 2010. The majority of Thai New Yorkers lived in Queens (57 percent), with nearly a quarter (23 percent) in Manhattan. Brooklyn had 12 percent, the Bronx 6 percent, and Staten Island 2 percent. The Thai community is centered on Elmhurst, with more than twice as many Thais living in the Elmhurst NTA than the next largest NTA of Jackson Heights.
The number of Indonesians in New York City grew 59 percent to 4,791 residents in 2010. Indonesians resided predominantly in Queens (71 percent). Manhattan had 14 percent of Indonesian New Yorkers, Brooklyn with 12 percent, the Bronx with 2 percent and Staten Island with 1 percent. Indonesians were more concentrated geographically than any other Asian group. Nearly one in four (23 percent) Indonesians lived in the Elmhurst NTA, which was the highest concentration of any one Asian group in an NTA.
The Sri lankan population in New York City grew to 4,369 in 2010, up 65 percent. Staten Island was the most popular borough for Sri Lankans with 40 percent living there, unique among Asian groups in the city. Queens had 35 percent of Sri Lankan New Yorkers, with 13 percent in Manhattan, 6 percent in Brooklyn, and 5 percent in the Bronx. Sri Lankans were largely spread out in the northern neighborhoods of Staten
Island. There were also some concentrations of Sri Lankans in southeastern Queens in Richmond Hill and Jamaica.
The Malaysian community grew by 41 percent to 3,220 residents in 2010. Half of Malaysians resided in Queens, 24 percent in Manhattan, 22 percent in Brooklyn, 3 percent in Staten Island, and 1 percent in the Bronx. Malaysians lived primarily in neighborhoods with large Chinese populations, such as Flushing and Elmhurst in Queens, Chinatown in Manhattan, and Bensonhurst and Sunset Park in Brooklyn.
The number of Cambodians in New York City grew by 13 percent from 2000 to 2010, and tied with Indians as the lowest growth rate among all the Asian groups. Of the 2,591 Cambodians in the city, 46 percent lived in the Bronx, 29 percent in Brooklyn, 12 percent in Queens, 8 percent in Manhattan, and 5 percent in Staten Island. However, the Cambodian population in the Bronx declined by 13 percent. Cambodians resided in neighborhoods to either side of Bronx Park in NTAs such as Bedford Park-Fordham North and Kingsbridge Heights as well as Bronxdale and Allerton-Pelham Gardens.
The population of laotians more than doubled from 2000 to 2010, growing to 664 residents at a 110 percent rate. Laotians were spread out across the city with no discernible concentrations in neighborhoods.
The hmong were the smallest Asian group in the city with 83
persons. The few Hmong living in the city were spread out with no discernible concentrations in particular neighborhoods.
What was the “other Asian, specified” category in Census 2000 has been divided into four groups: Bhutanese, Burmese, Nepalese, and a new “Other Asian, specified” category. Adding these four new groups together and comparing the total with the old “Other Asian” category in 2000 shows that together they grew by 302 percent, a faster rate than all other specified Asian Alone categories, except for the Hmong.4
In the 2010 Census, 6,187 nepalese were counted, making them the twelfth largest Asian group in the city. Nepalese had the highest concentration of any Asian group in one borough, with 86 percent of the community living in Queens. Brooklyn had just 6 percent of the Nepalese population, Manhattan 5 percent, the Bronx 3 percent, and Staten Island 1 percent.
Nepalese resided primarily in the Elmhurst, Jackson Heights, Sunnyside, Woodside neighborhoods in Queens. Smaller concentration of Nepalese could be found in Ridgewood in Queens and in Flatbush in Brooklyn.
Burmese were 4,132 strong, found predominantly in Queens (57 percent) and Brooklyn (30 percent). Manhattan had 8 percent of the Burmese population, Staten Island 3 percent, and the Bronx had 2 percent of Burmese New Yorkers. Burmese resided in

24
primarily the Elmhurst, Jackson Heights, Sunnyside, Woodside neighborhoods in Queens, and Bensonhurst in Brooklyn.
Burmese immigration has also been largely through refugee arrivals. Burmese refugees into the United States ramped up in 2007 increasing from 1,612 in 2006 to 13,896 in 2007. Burmese refugees continue to arrive in large numbers with 18,139 in 2008, 18,202 in 2009 and 16,693 in 2010. Most of these Burmese refugees were from ethnic minority groups, such as Chin, Karen, and Karenni, from Burma/Myanmar.
Bhutanese were the second smallest Asian group with 388 people counted. Bhutanese could be found predominantly in Queens (64 percent) and the Bronx (27 percent). Manhattan had 7 percent of the Bhutanese population, Brooklyn 2 percent, and Staten Island did not have any Bhutanese in the 2010 Census. Bhutanese resided in primarily the Elmhurst, Jackson Heights, Sunnyside, and Woodside neighborhoods in Queens, and Williamsbridge and Kingsbridge Heights NTAs in the Bronx.
Bhutanese immigration has been largely through refugee arrivals beginning in 2008. Bhutanese refugees into the United States increased from basically zero in 2001 to 2007 to 5,320 in 2008; 13,452 in 2009 and 12,363 in 2010. Almost all of the Bhutanese refugees are Nepali-speaking.
1. the data in this chapter includes anyone who identifies as Asian in whole or in part. Since 2000, the Census Bureau has put in provisions for multiple responses in race categories. As a result, the Census Bureau produces two different tabulations for racial groups. tables reporting single “race alone” in Census Bureau terminology refer to persons who marked only one race. this type of data is most useful when looking to add different racial groups together to avoid double counting individuals. when discussing distinct populations individually, this report uses the more inclusive “race alone or in combination” data. Because this data is a tally of responses, there may be an overlap of individuals who responded with more than one Asian group; therefore, “race alone or in combination” results should not be totaled across groups to create new categories (i.e. one should not add up all the individual Asian alone or in combination categories data to estimate a “total Asians Alone or in Combination” population).
2. while the Census Bureau follows office of Management and Budget guidelines and defines five major race groups (American Indian and Alaskan native, Asian, black, native hawaiian and Pacific Islander, and white) and one ethnicity (hispanic origin), this report focuses on the four largest major race and ethnic groups in new york City: Asian, black, hispanic and non-hispanic white. there is some overlap between Asian and black data and hispanic data as hispanics can be of any race.
3. Most of this chapter will use the new york City Department of City Planning’s neighborhood tabulation Areas (ntA) as definitions for neighborhoods in the city.
4. the “other Asian” analysis used the Asian Alone data to avoid double-counting. See Endnote 1.

dem
oG
rAph
ics
25
Figure 1.2: Asian population in new york City in 2010 by Census tract

2626
ChApter 2:
AsiAn chilDren AnD seniors in new york ciTy
Building on the results from the demographic analysis of the Asian community from the previous chapter, we will examine two specific populations: children and seniors. The past decade has seen some major shifts and growth in those two groups. This chapter will use the 2010 Census to examine the population changes and age distributions and the 2006-2010 American Community Survey (ACS) to explore poverty, language needs, and health insurance coverage for these two groups. In addition, we will look at public school enrollment and status dropout rates for Asian children and living arrangements and Social Security for Asian seniors.

chiLd
ren &
senio
rs
27
ChildrenWhile New York City saw some major declines in the number of children overall, defined here as those under the age of 18 years, the Asian child population increased over the past decade.
CItywIDE PoPulAtIon ChAngES
The Asian child population was the only one among the four largest race and ethnic groups that saw citywide gains in population, growing by 16 percent. The number of black children fell by 17 percent, Hispanics decreased by 5 percent, and non-Hispanic whites dropped 4 percent. More than one in eight children in New York City was Asian, up from one in ten in 2000.
Almost all of the numeric increase this past decade in Asian children came from Chinese1, Bangladeshis, Pakistanis and Japanese New Yorkers.
The Indian and Korean populations each lost a little over2,000 children over the last decade.
Using 2006-2010 ACS data, the growth in the Asian child population has occurred almost exclusively among the native born.
Native-born Asian child population grew by 30 percent from 2000 to the 2006-2010 time period.
Asian immigrant child population fell by 23 percent over the same time period.
Among the eight largest Asian groups, only in Filipino and Japanese communities did the immigrant child population increase, each by 5 percent.
table 2.1: Child Population in new york City

28
Borough AnD nEIghBorhooD PoPulAtIon ChAngES
All five boroughs saw increases in the number of Asian children. But behind the headline numbers, several shifts in population occurred.
Brooklyn had the largest numeric growth in Asian children with over 13,000 additional residents, more than the increase of 12,000 non-Hispanic white children.
The Chinese community had the largest increase with 8,847 more children.
Bangladeshis and Pakistanis combined added 3,907 children.
Indians saw a drop of just over 1,000 children.
Chinese children were 60 percent of the Asian population while Indians were second at 12 percent.
Queens remains home to largest number of Asian children in the city with 49 percent of the total citywide population (see Table 2.4).
The number of Asian children in Queens exceeded the number of black children sometime last decade. Asians were 25 percent of the child population in 2010, up from 20 percent in 2000. Blacks were 24 percent of the child population, down from 27 percent in 2000.
Most of the increase in the number of Asian children in Queens came in the Chinese and Bangladeshi communities.
Queens also saw a major decline in the number of Indian and Korean children.
Chinese remained the largest group in Queens at 33 percent of the Asian population, with Indians close behind at 29 percent.
In Manhattan, Korean, Indian and Japanese communities added the most children.
Chinese remain the largest group but saw a slight numeric decline in the number of children.
Among Asian children in the Bronx, growth in the Bangladeshi community was balanced by a drop in the Indian and Korean communities.
Indian and Bangladeshi children outnumbered Chinese children in the Bronx.
Staten Island’s growth in the Asian child population was mainly in the Chinese community.
table 2.2: numeric Change in Child Population by Borough

chiLd
ren &
senio
rs
29
table 2.3: Population group Share of Child Population for Each Borough
Among Asian groups, the distribution of children among the boroughs varied greatly.
Queens had a majority of children from the Bangladeshi, Filipino, Indian, Korean, and Taiwanese communities in New York City. Queens also was home to the second largest portion of Chinese, Pakistani and Vietnamese children.
Brooklyn had the largest share of children in the Chinese, Pakistani and Vietnamese community.
Manhattan had the largest group of Japanese children in New York City.
The Bronx was home to one in four Vietnamese children.

30
table 2.4: Child Population Distribution Across Boroughs by Population group
Within the NTA definitions of neighborhoods, some major shifts in Asian child population occurred during the last decade.2 The neighborhood analysis used Asian alone or in Combination data from the 2010 Census.
Sunset Park East in Brooklyn added 3,147 Asian children, the largest numeric increase among NTAs. Additionally, several NTAs added more than 1,000 Asian children: Bensonhurst West, Bensonhurst East, and Dyker Heights in Brooklyn and Jamaica in Queens.
Manhattan’s Chinatown saw a decrease of 1,858 Asian children in its population. Astoria in Queens lost 1,070 Asian children.
table 2.5: neighborhood tabulation Areas with greatest numeric Changes in Asian Child Population

chiLd
ren &
senio
rs
31
AgE DIStrIButIon
Asian children were distributed across age groups nearly identically with all children in New York City. The only age group that stood out was for non-Hispanic white children under the age of 5.
table 2.6: Children by Age groups for Population groups in new york City in 2010
PovErty rAtE
Asian child poverty rates3 lay between the higher back and Hispanic rates on one hand and the lower non-Hispanic white rate on the other. The disaggregated data from the ACS is vital to revealing the hidden high child poverty rates among specific Asian sub-groups.
The child poverty rate for Asian New Yorkers remained higher than that of non-Hispanic whites.
Between 2000 and the 2006-2010 time period, the poverty rate of Asian children dropped 2 percentage points, black children dropped 3 percentage points, Hispanics dropped 2 percentage points, and non-Hispanic whites remained unchanged.
table 2.7: Poverty rates for Children in new york City

32
Bangladeshi children not only had the highest poverty rate but also were significantly worse off now than in 2000.
While Vietnamese and Chinese children continued to have poverty rates above 20 percent, both groups were better off now compared to 2000. The child poverty rates declined by 11 percentage points for Vietnamese and 4.5 percentage points for Chinese respectively.
Even though Filipino children had a poverty rate lower than 10 percent, they are worse off now than in 2000. Filipinos were the only other group after Bangladeshis that experienced a notable increase in child poverty.
Child poverty rates varied across borough and population groups.
In Queens, the poverty rate of Asian children was essentially equal to that of black children.
Compared with non-Hispanic whites, Asian children were much more likely to be living in poverty in four of the five boroughs.
In Brooklyn, three in five Bangladeshi children lived in poverty. Brooklyn also had the highest poverty rates in the five boroughs for Filipino and Japanese children.
Manhattan had the highest child poverty rates for the Chinese and Korean communities.
Vietnamese child poverty rates were highest in the Bronx.
Indian child poverty rates approached one in three in the Bronx, Brooklyn, and Queens.
While Brooklyn had the highest child poverty rates in the Pakistani community, the Bronx was not far behind.
table 2.8: Poverty rates for Children by Borough

chiLd
ren &
senio
rs
33
lAnguAgES SPokEn At hoME AnD EnglISh ABIlIty
Among children who spoke an Asian language at home, almost all of limited English proficient (LEP) children spoke Chineses. However, the number of Chinese LEP speakers declined overall, while a number of other Asian languages saw big increases in LEP speakers. Given the sample size in the ACS Public Use Microdata Sample, the smaller percent changes are inconclusive.
Nepali saw the largest percentage increase in LEP speakers as the city saw increased immigration from Nepalese and Nepali-speaking Bhutanese families. These numbers will continue to rise as the United States continues to admit Nepali-speaking Bhutanese under a refugee resettlement plan.
The increase in the number of Japanese-speaking LEP children matched in increase in the number of Japanese children overall and the increase in the number of foreign-born Japanese mentioned earlier in the chapter.
table 2.9: limited English Proficiency rates for Children Age 5-17 years old who Spoke an Asian language at home
PuBlIC SChool EnrollMEnt
Asian families were dependent on the public school system to educate their children. As noted in Table 2.10, enrollment rates of Asian children between five and seventeen years of age were generally similar to black and Hispanic children in the city’s public school system. Across all income categories, Asian families were much more likely than non-Hispanic white families to enroll their children in public schools.
table 2.10: Percent of Students Age 5-17 years old in Public Schools by household Income

34
StAtuS DroPout rAtES
Status dropout rate is defined as persons age 16-24 not enrolled in school and not having a high school diploma or equivalent. While Asians had the second lowest dropout rate among four major race and ethnic group, right above that of non-Hispanic whites, a wide range of dropout rates existed among eight largest Asian groups, ranging from a high of 22 percent for Chinese to 0 percent for Japanese. Among those eight groups, only Chinese were more likely to dropout than non-Hispanic whites.
hEAlth InSurAnCE CovErAgE
The American Community Survey only began to collect health insurance coverage data in 2008. This report uses the 2008-2010 ACS for health insurance coverage, which only reported data for the seven largest Asian groups: Chinese, Indian, Korean, Filipino, Bangladeshi, Pakistani and Japanese.
table 2.12: Child health Insurance Coverage by Population group
Asian children were slightly less likely to be covered by health insurance than the other three major race and ethnic groups.
Korean children had the highest uninsured rates among the seven Asian groups at over one in ten. High rates of self-employment among Korean parents are a likely cause.
The majority of Filipino, Japanese and Korean children had private insurance coverage.
The majority of Bangladeshi, Indian and Pakistani children had public insurance coverage.
table: 2.11: Status Dropout rates for Age 16-24

chiLd
ren &
senio
rs
35
Seniors
Asian seniors, defined here as persons age 65 years and older, grew far faster than the other major race and ethnic groups, up 64 percent compared with the next fastest group, Hispanics, at 42 percent. As New York City’s Asian population continues to age, new services and infrastructure need to be in place to help the growing and diversifying population.
CItywIDE PoPulAtIon ChAngES
Among seniors, Asians had the highest growth rate citywide, while non-Hispanic whites had the only decrease in population.
One in ten seniors in New York City was Asian, up from one in fourteen in 2000.
Among eight largest Asian groups, Chinese was the only group with senior population larger than ten thousand persons in 2000. In 2010 senior population of both Indian and Koreans passed the ten thousand person threshold.
The Chinese population was the greatest numerical contributors to the growth in the Asian senior population.
table 2.13: Citywide Senior Population by race groups

36
Borough AnD nEIghBorhooD PoPulAtIon ChAngES
The last decade saw a major shift in senior population among the boroughs. While non-Hispanic white seniors left the outer boroughs, Manhattan saw more than ten thousand additional non-Hispanic white seniors move in. Hispanics added seniors in all five boroughs, while blacks added seniors in all boroughs except for Manhattan.
Asian seniors had the highest growth rate in all five boroughs among four major race and ethnic groups.
Queens saw the largest numeric increase in Asian seniors, with Brooklyn adding less than half as many Asian seniors.
The largest numeric increases of senior population from 2000 to 2010 took place for Chinese (+7,982) and Indians (+5,329) in Queens, and Chinese (+6,645) in Brooklyn.
table 2.14: numeric Change in Senior Population for Population groups by Borough

chiLd
ren &
senio
rs
37
The Census data also reveals the mix of Asian groups in each borough.
Around three-quarters of Asian seniors in Brooklyn and Manhattan were Chinese.
In the other three boroughs, the four largest Asian senior groups (Chinese, Filipino, Indian, and Korean) made up the bulk of the Asian senior population.
In Queens and Staten Island, Chinese were the largest Asian senior group.
In the Bronx, Indians were the largest.
Asian seniors in Queens are on pace to pass black seniors in population to become the second largest major race and ethnic group in the borough.
table 2.15: Share of Senior Population by Population groups for Each Borough
The distribution of each population group across the boroughs has implications for providing services to seniors.
Queens had the majority share of the Bangladeshi, Filipino, Indian, Korean, and Taiwanese seniors; and the largest share of the remaining groups, save for Manhattan which had the largest share of Japanese seniors.
Brooklyn was home to about one-third of Chinese, Pakistani and Vietnamese seniors living in New York City.
One-quarter of Vietnamese seniors lived in the Bronx.
While the largest share of the Pakistani and Vietnamese communities of all ages lived in Brooklyn, the largest share of Pakistani and Vietnamese seniors lived in Queens.
Chinese seniors were spread fairly evenly among Brooklyn, Manhattan and Queens.

38
table 2.16: Senior Population Distribution Across Boroughs by Population group
While the vast majority of NTAs saw some growth in Asian senior population, several key NTAs added more than one thousand Asian seniors during the last decade.
Flushing, Queens, added 2,664 Asian seniors, the largest numeric increase among NTAs. Additionally, several NTAs added more than one thousand Asian seniors: Murray Hill, Queens (+1,519); Bensonhurst West, Brooklyn (+1,426); Elmhurst, Queens (+1,307); Lower East Side, Manhattan (+1,125) and Bensonhurst East, Brooklyn (+1,076).
The SoHo-Tribeca-Civic Center-Little Italy NTA in Manhattan was the only NTA with more than one thousand Asian seniors to see a decrease of Asian seniors (-172) during the last decade.

chiLd
ren &
senio
rs
39
MEDIAn AgE For SEnIorS
Median age for Asian and Hispanic seniors rose during the last decade, indicating that the growth in the older senior populations was much faster than the growth in the younger senior populations.
Asian and Hispanic seniors remain tied for the lowest median age at 72.0 years.
The gap in median ages between males and females was the smallest among Asian seniors at 0.7 years. All other groups had a gap of 1.3 or more years.
lIvIng SItuAtIonS
Asian seniors were more likely to be living in a family household and to be married than seniors of the other major race and ethnic groups.
The majority of Asian seniors lived in a married-couple family household.
Of the Asian sub-groups, Vietnamese were the only group who had less than half of their seniors living in a married-couple household.
More than one in three Japanese seniors lived alone, a rate nearly as high as non-Hispanic white seniors.
Filipinos and Vietnamese seniors were as likely as black and Hispanic seniors to be living in a single head of household family.
A majority of Asian seniors themselves were married.
Only among Bangladeshis, Pakistanis and Vietnamese were less than half of seniors married.table 2.18: household type, group Quarters and Marital Status for Seniors in new york City by Population group
table 2.17: Median Age for Seniors by Major race and Ethnic groups in new york City

40
PovErty AnD SoCIAl SECurIty
Asian seniors were the most economically vulnerable members of the Asian community. For seniors age 65 or older, the poverty rate of Asians ranked the second highest among four major race and ethnic groups, right below that of Hispanics. The poverty rate of Asian seniors and non-Hispanic white seniors increased 1 percentage point, while that of black seniors dropped 4 percentage points and that of Hispanic seniors dropped 2 percentage points. Part of the reason for high poverty rates among Asian seniors is that they were less likely to receive Social Security benefits than other groups.
Bangladeshi seniors had the highest poverty rate of 34 percent, but had the largest drop in poverty rate since 2000 among the Asian groups.
Chinese senior had the largest increase in senior poverty rates among the Asian groups.
Japanese and Filipino were the only groups with senior poverty rates lower than 10 percent.
Asians were less likely to receive Social Security benefits than the other major race and ethnic groups.
Bangladeshi, Indian and Pakistani seniors were far less likely to receive Social Security than other Asian groups.
Only Japanese seniors received Social Security at the same rates as non-Hispanic whites.
As expected, the percent of seniors receiving Supplemental Security Income (SSI) were higher in groups with high poverty rates.
Pakistani seniors received SSI at a similar rate as non-Hispanic whites, despite their much higher poverty rate.
table 2.19: Citywide Poverty rate of Seniors

chiLd
ren &
senio
rs
41
Asian seniors were the only group with increases of poverty rate in all five boroughs. Manhattan saw the greatest increase in poverty rate up 4 percentage points, followed by Brooklyn (3 percentage points), Bronx (2 percentage points), Staten Island (2 percentage points), and Queens (0.3 percentage points).
Asian seniors in the Bronx had the highest poverty rates with Brooklyn and Manhattan close behind.
The Bronx had the highest poverty rates for Bangladeshi, Indian and Korean seniors compared to the other boroughs.
Brooklyn had the highest poverty rates for Vietnamese seniors.
Manhattan had the highest poverty rates for Chinese seniors.
Queens had highest poverty rates for Pakistani seniors.
Staten Island had highest poverty rates for Filipino and Japanese seniors.
Korean senior poverty rates were close to or well over one in three seniors in four of the five boroughs.
Chinese senior poverty rates were all above 20 percent in all five boroughs.
table 2.20: Poverty rate of Seniors by Borough

42
lAnguAgES SPokEn At hoME AnD EnglISh ABIlIty
Language issues were an important cause for social isolation among Asian seniors as well as a major barrier to obtaining needed services.
Among seniors who spoke an Asian language at home, the vast majority of seniors with limited English proficiency (LEP) spoke a Chinese dialect.
Over 90 percent of Chinese, Korean and Vietnamese speaking seniors had LEP.
Only Tagalog and Hindi speakers had LEP rates below 50 percent.
Only Vietnamese speakers saw no appreciable change in the number of LEP seniors.
table 2.21: limited English Proficiency rates of Seniors

chiLd
ren &
senio
rs
43
hEAlth InSurAnCE CovErAgE
Asian seniors were more than twice as likely to have no health insurance coverage.
Asian seniors had a lower rate of public coverage than the other major race and ethnic groups.
Unsurprisingly, the Asian senior groups with the highest poverty rates also had the highest Medicaid coverage rates.
Medicaid coverage did little to make up for the gap in Medicare coverage in the Asian senior community. The percent covered by Medicare was virtually identical to the total percent covered by public insurance.
Bangladeshi and Pakistani seniors in particular had difficulty obtaining health insurance.
As Pakistani seniors had lower poverty rates than Bangladeshi seniors, Pakistani seniors were able to partially make up for lack of public coverage through private health insurance.
table 2.22: Senior health Insurance Coverage by Population group
1. the 2010 Census reports taiwanese population group data separate from Chinese. the 2006-2010 ACS does not.
2. neighborhood tabulation Areas (ntA) are defined by the new york City Department of City Planning.
3. this report uses the federal poverty thresholds as outlined by the u.S. Census Bureau at: http://www.census.gov/hhes/www/poverty/data/threshld/index.html. the thresholds are based on income by family size and the number of children.

44
ChApter 3
civic engAgemenT
The growth in the Asian community in New York City has reached a critical mass where demographic changes are inevitably resulting in increased civic participation. The higher naturalization rates of Asians and large waves of immigrations have boosted the citizen voting age population in the Asian community by 53 percent. This potential pool of voters, however, face a number of challenges to registering and voting, including difficulty with English, uncertainty over eligibility and the registration process, and busy schedules, revealing a need for more voter education and assistance..
This section uses data from the 2000 Census, the 2006-2010 American Community Survey, and the 2004, 2006, 2008 and 2010 Current Population Survey November Supplement on Voting and Registration.

civic en
GA
Gem
ent
4545
Immigration
Asian New Yorkers had the highest proportion of immigrants compared to the other three largest race and ethnic groups.
The native-born Asian population grew at a faster rate than of the immigrant Asian population. As a result, the share of native-born Asians in the city has gone up.
By comparison, immigrant share of the Hispanic population was held steady at 41 percent between 2000 and 2006-2010.
Of the top eight Asian ethnic groups in the city, Vietnamese and Pakistanis have slightly lower immigrant shares of their population.
table 3.1: Immigrant Share of Eight largest Asian groups in new york City
Figure 3.1: Immigrant Share of Asian Alone or in Combination Population

4646
naturalization rate
Asians entering the U.S. before 1990 have the highest naturalization rates among the four largest race and ethnic groups. Asians entering the U.S. between 1990 and 1999 had the second highest naturalization rate.
Asian immigrants naturalized faster than Hispanic immigrants across all time periods.
Japanese had much lower naturalization rates than the other Asian groups.
Korean immigrants arriving between 1990 to the present were naturalizing at lower rates than other Asian groups, except for Japanese.
table 3.2: naturalization rate among Immigrant groups in new york City, 2006-2010
Citizen voting-Age Population
Asians represent 11 percent of the citizen voting-age population (CVAP) in New York City, up from 7 percent in 2000.
Asian citizen voting-age population grew by 53 percent, far outpacing the other three largest race and ethnic groups.
Bangladeshi citizen voting-age population more than tripled from 2000.

civic en
GA
Gem
ent
4747
table 3.3: Citizen voting-Age Population in new york City
language needs of voting-Age Citizens
Chinese remains the Asian language most spoken by voting-age citizens with limited English proficiency (LEP).
Bengali-speaking voting-age citizens more than doubled in size, crossing the ten thousand population threshold during the last decade. Bengali speakers also had similar LEP rates as Chinese and Korean speakers.
Although there are more than fourteen thousand Hindi speakers in New York City in the 2006-2010 time period, only thirty-seven hundred declared themselves to be LEP.
table 3.4: top Asian languages Spoken at home by Citizen voting-Age Population in new york City

4848
voter registration and Participation
Voter registration and participation data is available every two years in the November Supplement to the Current Population Survey (CPS). The CPS has a much smaller sample size than the ACS. To make up for the small sample size, the data was aggregated across the 2004, 2006, 2008, and 2010 November CPS Supplement. Asian sub-group data was not collected in the CPS.
votEr rEgIStrAtIon
Asians were less likely to be registered to vote than the other three major race and ethnic groups. Despite this, Asians have become eight percent of registered voters in New York City during the 2004-2010 time period, compare to 4 percent during 1994-2000.
Asians were also less likely to respond to the voting questions in the CPS than the other three groups.
Combined with the data in Table 3.3, potentially more than three hundred thousand Asian voting-age citizens have yet to be registered.
rEASonS For not rEgIStErIng
The reasons Asians gave for not registering reveal potential need for voter education.
Asians were more likely to say they were not eligible to vote, do not know how to register or cite difficulty with English as reasons for not registering.
table 3.6: reason for not registering for Citizen voting Age Population in new york City
table 3.5: voter registration rates for Citizen voting Age Population in new york City

civic en
GA
Gem
ent
4949
votEr PArtICIPAtIon
The potential impact of the growing citizen voting-age Asians in New York City last decade was diluted by low voting registration and participation rates.
The majority of registered Asian voters ended up casting a vote, but Asian voters still have the lowest voter turnout rate among the major race and ethnic groups.
table 3.7: voter Participation for new york City
rEASonS For not votIng
Asians were more than twice as likely to cite being too busy as the reason for not voting compared to the other three major groups.
Only two percent of Asians voted by mail in New York City, compared with five percent of non-Hispanic whites, while both Asian and non-Hispanic whites cited being away from home as the primary reason for not voting at similar rates, suggesting a need to educate Asian voters about absentee ballots.
Asians were less likely to cite voter apathy or disinterest as reasons for not voting.
table 3.8: reasons given for not voting by registered voters in new york City

50
ChApter 4:
economic sTATus AnD conTribuTions
The ethnic diversity in the Asian community is matched by our economic diversity. While many Asian New Yorkers match the image of the model minority myth, an equal number struggle at the margins of our society.
This section will reveal the income gaps and poverty1 that exist in our communities. We will also discuss how education and language impact the economic outcomes among Asian New Yorkers. We will conclude by examining the economic contributions of all Asian New Yorkers by both workers and business owners.

econ
om
ics
5151
Income and Poverty
The most recent figures from the 2006-2010 ACS demonstrate that Asian New Yorkers continue to lag behind non-Hispanic whites, belying the model minority myth. The data also show drops in median income among some Asian groups which had been performing well economically in the past.
Median incomes for Asian household and families grew at a similar pace as the citywide figures.
Growth in median income for Asian families lagged behind that of black and non-Hispanic white families.
Non-Hispanic white New Yorkers were more than twice as likely as Asian New Yorkers to earn $200,000 or more.
Among the top eight Asian groups in the city:
Filipinos had the highest median household and family incomes and the lowest poverty rates. However, Filipinos were less likely to earn $200,000 or more than their fellow Asian New Yorkers and median incomes fell by 9 percent from the year 2000.
Bangladeshi, Filipino and Pakistani households saw median incomes fall after adjusting for inflation.
Median incomes in Bangladeshi, Filipino, Indian, Japanese, and Pakistani families also dropped after adjusting for inflation.
One in three Bangladeshis lived in poverty, highest among all the population groups in Table 4.1. Bangladeshis also had the biggest jump in poverty rates among the Asian groups.
Pakistani and Vietnamese poverty rates were higher than black poverty rates.
Poverty rates for Filipinos went up slightly and stayed the same for Koreans despite an overall citywide decrease in poverty rates.
table 4.1: Income and Poverty Measures by Population groups in new york City

5252
Educational Attainment
A major split in educational attainment by adults age 25 and over exists in the Asian community. Among the four largest race and ethnic groups:
Asians had the second highest rate of adults with no high school diploma in the city, behind that of Hispanics.
Asian adults also had the second highest rates of college graduates and post-graduate degree holders, behind that of non-Hispanic whites.
Among the eight Asian groups, a strong relationship existed between poverty rates, income and educational attainment.
The three groups with the highest poverty rates, Bangladeshis, Pakistanis and Vietnamese, also had the highest rates of adults with no high school diplomas.
Filipinos had the highest college graduate rates, which helps explain the high median household incomes. However, Filipinos were less likely to earn post-graduate degrees, which may have resulted in the lower percentage of Filipinos earning $200,000 or more.
By contrast, Japanese New Yorkers had the highest share of post-graduate degree holders as well as the highest percentage of personal income of $200,000 or more.
table 4.2 Educational Attainment for Adults Age 25 years and older for new york City

econ
om
ics
5353
language Ability of working Age AdultsThe ability to use English in a workplace setting is vital to opening up economic opportunities for new immigrants. The limited English proficiency rate data from the 2006-2010 ACS reveal that learning English continues to be a challenge for new immigrant communities.
During 2006-2010, just less than half (49 percent) of Asian New Yorkers of working age (18 to 64 years of age) had limited English proficiency (LEP), close to the 51 percent figure in 2000. For comparison, Hispanic New Yorkers had an LEP rate of 46 percent during the 2006-2010 time period. Citywide, the LEP rate was one in four
Of the top eight Asian groups in the city, only Filipinos and Indians had LEP rates close to the citywide LEP rate.
labor Force ParticipationAll population groups examined in this report showed increases in labor force participation rates, which is the percentage of the population age 16 years or older who were either employed or actively looking for work.
Asians continued to have the highest labor force participation rates in the city among the four largest race and ethnic groups.
Filipinos had the highest labor force participation rates in the city among the top eight Asian groups.
Bangladeshi and Pakistani women had very low labor force participation rates compared to the other groups. Bangladeshi and Pakistani men had the highest rates.
Figure 4.1 limited English Proficiency rates for working Age Asians in the top Eight Asian groups in new york City
table 4.3: labor Force Participation rates for People Age 16 years or older for new york City

5454
unemployment rateWhile Asian New Yorkers were most active in the labor force, unemployment rates crept up in the Asian community.
Asian workers had the largest jump in unemployment rates going from 6.6 percent in 2000 to 7.7 in the 2006-2010 time period. Nevertheless, Asians had the second lowest unemployment rate among the four largest race and ethnic groups.
Bangladeshi workers saw the largest jump in unemployment rates going from 5.3 percent in 2000 to 9.7 percent in 2006-2010.
The four largest Asian groups, Chinese, Filipino, Indian, and Korean, all saw increases in their unemployment rates.
Women in three largest South Asian groups had the highest unemployment rates among the Asian groups.
table 4.4: unemployment rates for People Age 16 years or older for new york City

econ
om
ics
5555
Industries Employing Asian workersThe diversity in the Asian labor force in New York City is reflected in the wide range of industries that employ Asian workers.
The health care and social assistance industry sector employed the most Asian workers as well as the most workers citywide.
Other industry sectors that employed a large share of Asian New Yorkers include, in order of share size, retail trade; professional, scientific, and management, and administrative, and waste management services; finance and insurance, and real estate and rental and leasing; food services; manufacturing; and other services.2
A close examination of the distribution of workers among the industry sectors indexed to the citywide share of employment for each sector reveals industries where each race and ethnic group is either overrepresented (positive index value in Table 4.5) or underrepresented (negative index value in Table 4.5).
Asian workers were overrepresented in food services, wholesale trade and manufacturing.
Asian workers were underrepresented in arts, entertainment, and recreation; public administration; educational services; and construction.
Each of the eight largest Asian groups was overrepresented in a variety of industries for employment:
Bangladeshi: food services; transportation, warehousing, and utilities; retail trade; and accommodations sectors.
Chinese: food services; manufacturing; and wholesale trade.
Filipino: health care and social assistance; and accommodations sectors.
Indian: transportation, warehousing, and utilities; and wholesale trade.
Japanese: information; arts, entertainment, and recreation; wholesale trade; professional, scientific, and management, and administrative, and waste management services; and food services.
Koreans: other services, wholesale trade, and retail trade.
Pakistanis: transportation, warehousing, and utilities; and retail trade.
Vietnamese: other services, manufacturing, accommodations, and food services.table 4.5(a): relative representation of workers by Industry Sector and Population group in new york City (Indexed to Citywide Share of workers)

5656
table 4.5(b): relative representation of workers by Industry Sector and Population group in new york City (Indexed to Citywide Share of workers)
table 4.5(c): relative representation of workers by Industry Sector and Population group in new york City (Indexed to Citywide Share of workers)

econ
om
ics
5757
occupations held by Asian workersThe city’s economy is dominated by office based work with more than 60 percent of workers in management, professional, and related occupations and in sales and office occupations.
While more than half of non-Hispanic white workers in New York City were employed in the management, professional, and related occupations, only thirty-seven percent of Asian workers were employed in the same fields.
Asian workers were overrepresented in production, transportation, and material moving occupations and were underrepresented in natural resources, construction, and maintenance occupations.
Each of the top eight Asian groups in the city was overrepresented in a variety of occupational categories.
Bangladeshis, Chinese, Indians, Pakistanis and Vietnamese were overrepresented in production, transportation, and material moving occupations.
Filipino, Japanese, and Korean workers were overrepresented in management, professional, and related occupations.
Bangladeshis were also overrepresented in sales and office occupations while Pakistanis were overrepresented in natural resources, construction, and maintenance occupations.
table 4.6: relative representation of workers by occupation Category and Population group in new york City (Indexed to Citywide Share of workers)

5858
Self-EmploymentWhile overall self-employment rates in the Asian community were below that of non-Hispanic whites, a closer examination of the separate Asian groups reveal high rates of entrepreneurship in the Asian community.
Vietnamese self-employment rates went up nearly 5 percentage points, from 10 percent to nearly 15 percent of employed workers.
Almost one in five Korean and Pakistani working males were self-employed.
Korean, Japanese, and Vietnamese working females were more likely to be self-employed than all other groups, including non-Hispanic whites.
table 4.7: Self-employment rates for Employed Persons Age 16 or older in new york City
Asian-owned Businesses in new york CityThe Survey of Business Owners conducted every five years as part of the Census Bureau’s Economic Census provides snapshots of the Asian-owned business community. Asian-owned businesses were defined as businesses where the majority share of ownership was held by a person or persons who identified at least part Asian. The last two surveys covered calendar years 2002 and 2007, just missing the recent financial crisis. The next Survey of Business Owners covering 2012 will be conducted starting late 2012 through early 2013.
A citywide look at Asian-owned businesses in context with other groups show that Asian entrepreneurs were a growing share of the economic activity in the city, contributing $38 billion worth of sales, receipts or value of shipments and employing more than 160 thousand paid workers in 2007.
Asian-owned firms grew faster than firms citywide by all measures in Table 4.8 except for average wages per paid employee, which grew slightly slower in Asian-owned firms compared with firms citywide.

econ
om
ics
5959
While the total number of firms was similar among Asians, Black and Hispanics, Asian-owned firms had more total sales, receipts or value of shipments and more paid employees than Black- and Hispanic-owned businesses combined.
Asian-owned firms were as likely as white-owned firms to have paid employees
Average sales, receipt or value of shipments of firms were higher than black- and Hispanic-owned firms.
table 4.8: Characteristics of Business owners by Population group of Majority owners in new york City
The Survey of Business Owners reported several interesting trends for seven Asian categories.
A growing number of Asian-owned businesses were from Asian groups outside the six largest Asian categories. Businesses owned by these Asians groups combined to nearly equal the number of Korean-owned businesses in the city. These owners were most likely Bangladeshi and Pakistanis, given the high rates of self-employment described in the previous section and growing size of both communities.
Two in five Korean-owned firms had paid employees, the highest share among the seven Asian categories.
However, Chinese-owned businesses had the largest number of firms, total number of paid employees, and total sales, receipt or value of shipments.
Filipino-owned firms had the highest number of paid employees per firm.
Average wages were highest among Indian-owned firms.
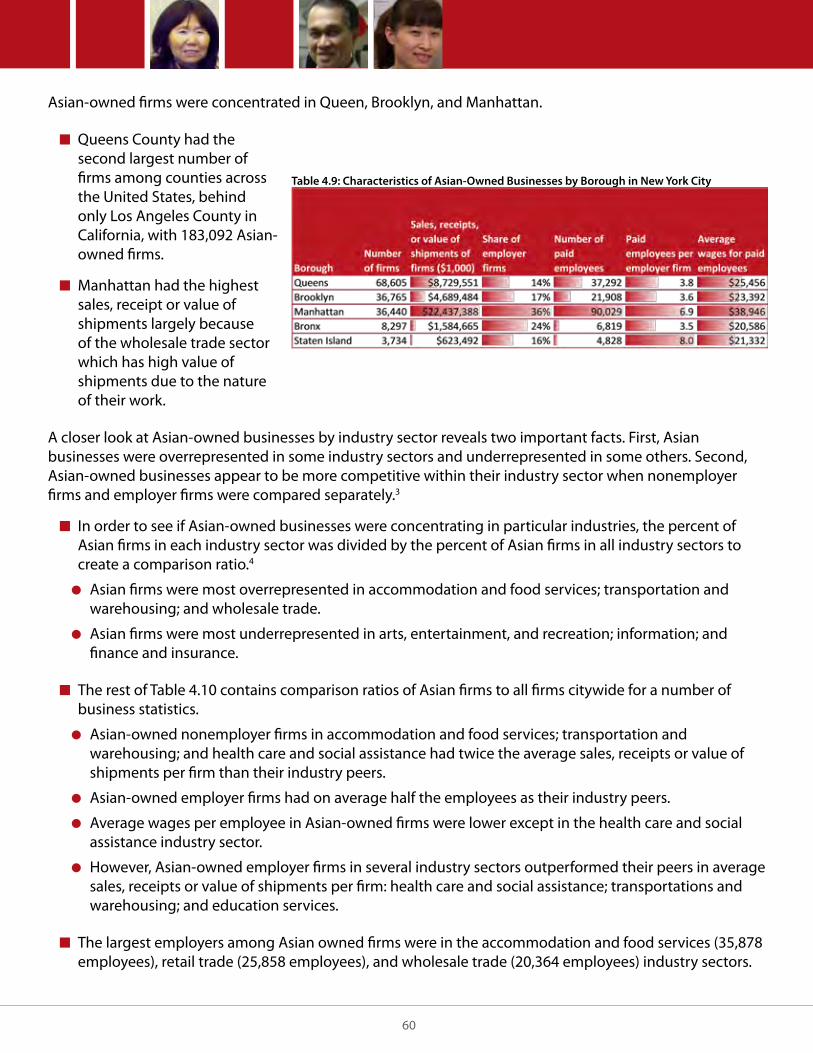
6060
Asian-owned firms were concentrated in Queen, Brooklyn, and Manhattan.
Queens County had the second largest number of firms among counties across the United States, behind only Los Angeles County in California, with 183,092 Asian-owned firms.
Manhattan had the highest sales, receipt or value of shipments largely because of the wholesale trade sector which has high value of shipments due to the nature of their work.
A closer look at Asian-owned businesses by industry sector reveals two important facts. First, Asian businesses were overrepresented in some industry sectors and underrepresented in some others. Second, Asian-owned businesses appear to be more competitive within their industry sector when nonemployer firms and employer firms were compared separately.3
In order to see if Asian-owned businesses were concentrating in particular industries, the percent of Asian firms in each industry sector was divided by the percent of Asian firms in all industry sectors to create a comparison ratio.4
Asian firms were most overrepresented in accommodation and food services; transportation and warehousing; and wholesale trade.
Asian firms were most underrepresented in arts, entertainment, and recreation; information; and finance and insurance.
The rest of Table 4.10 contains comparison ratios of Asian firms to all firms citywide for a number of business statistics.
Asian-owned nonemployer firms in accommodation and food services; transportation and warehousing; and health care and social assistance had twice the average sales, receipts or value of shipments per firm than their industry peers.
Asian-owned employer firms had on average half the employees as their industry peers.
Average wages per employee in Asian-owned firms were lower except in the health care and social assistance industry sector.
However, Asian-owned employer firms in several industry sectors outperformed their peers in average sales, receipts or value of shipments per firm: health care and social assistance; transportations and warehousing; and education services.
The largest employers among Asian owned firms were in the accommodation and food services (35,878 employees), retail trade (25,858 employees), and wholesale trade (20,364 employees) industry sectors.
table 4.9: Characteristics of Asian-owned Businesses by Borough in new york City

econ
om
ics
6161
table 4.10: Comparison ratios of Asian-owned Firms to All Firms for various Business Statistics by Industry Sector in new york City
Impact of great recession on Asian new yorkers
The American Community Survey also allows timely assessments of major events on the American population. Comparing the 2005-2007 ACS with the 2008-2010 ACS provides a before and after picture of Asians and Asian groups to measure impact of the Great Recession.
Data on unemployment rates, household income and poverty rates seem to suggest that Asian New Yorkers suffered disproportionately to the other major race and ethnic groups.
Unemployment rates edged up higher for Asians than for the other three groups. The result was the estimated number of Asians looking for work went up 56 percent, from 31,263 Asians during 2005-2007 to 48,805 Asians during 2008-2010.
Median incomes fell slightly more on a real dollar basis, though the difference was not statistically significant.
Overall poverty rates for Asians edged up higher than for the other groups.
Asian and Black children living with their families showed a statistically significant increase in poverty rates.
Working-age Asians saw the largest increase in poverty rates among the major race and ethnic groups.

6262
table 4.11 Impact of great recession on Major race and Ethnic groups in new york City
note: Bold outlined data indicate statistically significant changes between 2005-2007 and 2008-2010 at 90% confidence interval.
1. For definition of poverty, see endnote 3 in Chapter 2.
2. For the employment data in the 2000 Census and the American Community Survey, the “other Services” industry sector includes repair and maintenance services; personal care and laundry services; religious, grantmaking, civic, professional, and similar organizations; and private households.
3. nonemployer firms are businesses that do not have paid employees; in other words, the owners or related family members who were unpaid are the only workers. Employer firms are businesses with paid employees.
4. this ratio is identical to the parity index concept used by social scientists to compare socioeconomic data across race groups normalized to a comparison group. the ratio assumes that if all industries were equally attractive to Asian business owners, then the measure would be equal to 1 for each industry sectors. values over 1 mean that Asian firms were relatively overrepresented in the sector. values under 1 mean underrepresentation. For example, in new york City, Asian-owned businesses were 16 percent of all businesses in the city. An industry with 32 percent Asian-owned businesses would have an index value of 2.0 (32 percent divided by 16 percent) and one should conclude that Asian business owners were overrepresented in this sector.

63
ChApter 5:
implicATions
Asian Americans experienced dynamic growth in the past decade – 30% overall population growth, more diversified ethnically, population shifts, the emergence of new Asian majority neighborhoods, and contrasting economic diversity. This report concludes with an overview of the implications of our findings on the Asian American Federation’s three focus areas: health and human services, economic opportunity and civic engagement. These implications are by no means comprehensive and serve to stimulate discussion, raise policy questions, and provoke new areas of inquiry.
From a health and human service perspective, the shifts of Asians between neighborhoods and the growing presence of smaller Asian groups raises new questions for government and local institutions in addressing quality of life concerns that exist in expanding immigrant populations and neighborhoods. In the seven Asian majority Asian neighborhoods, how prepared are local hospitals and community health centers in providing culturally competent health care to neighborhood residents? What is the capacity of local service organizations in responding to local needs? On a citywide perspective, how are the needs of the diverse segments of the Asian American population, especially among the small but fast growing ethnic groups (e.g. Bangladeshi), being addressed by existing service organizations?
The patterns of growth in the Asian child population raise specific issues regarding service provision. With increasing cultural and linguistic diversity, how effective and prepared are local schools in addressing children’s learning needs and in engaging their parents? As Asian families with children settle and expand to new neighborhoods, is there sufficient availability of affordable child care and early childhood education? How are Asian children being affected by the city’s efforts to revamp early childhood education and Out of School Time systems?
Asian elders, the fastest growing segment of Asian New Yorkers, continue to face poverty and language barriers. As was the case in 2000, Asian seniors continue to be less likely to receive Social Security benefits and more likely
to be uninsured than seniors of the other major race and ethnic groups. There ought to be an examination of how Asian seniors are being affected by health care reform and by the state’s current Medicaid re-design. Improving living conditions, health insurance coverage, and retirement protection for those who do not qualify for Social Security are important policy consideration. With so many Asian seniors experiencing language and cultural barriers, having programs that assist seniors in navigating the system to gain access to government benefits, health insurance programs, as well as other needed services would be necessary. Also needed is greater availability of culturally appropriate services including assisted living, geriatric mental health, and long term care.

6464
Turning to economic opportunity, the factors that have contributed to high poverty rates in certain segments of our population need to be examined and addressed. Increasing the availability of affordable housing, improving economic opportunities for immigrants, and enhancing health insurance coverage for the self-employed and those employed by small businesses are important policy considerations. Investing in programs that improve immigrants’ English proficiency, as well as skill building and educational programs that address the large percentage of Asians without high school diplomas would help the working poor. Similarly, it should be a high priority to insure that children from low-income families are healthy, ready for school and able to succeed, and that there is income security for their families.
Asian-owned businesses are playing an increasingly important
role in fueling the local economy. Programs that support immigrant entrepreneurship and community economic development should be considered as part of an overall job creation strategy. As more businesses in the community thrive, they could become part of the solution to the working poor conditions. Much emphasis has been made by all levels of government on the importance of small business, yet many of Asian small businesses have limited access to capital, technical assistance, and major procurement programs that would help them to expand their businesses. Programs that invest in Asian American entrepreneurs and strengthen Asian business organizations such as chambers of commerce would produce long term economic benefits to the community and the city as a whole.
Finally, on civic engagement, the data suggest that Asians have the potential to become a significant
voting population in the city. In many neighborhoods, where the Asian is the majority or a critical mass, how will the community flex their civic muscles and grow our voice? However, more voter education and assistance to increase voter registration and to help registered Asian voters overcome barriers to voter participation is needed. What additional efforts can be made to conduct voter registration and education in areas with growing immigrant communities? The most common reasons for not registering to vote as cited in this report suggested that there is a need to educate and inform potential voters regarding the importance of voting, voter eligibility, the registration process and the availability of language assistance. The more significant the Asian voter population becomes the greater ability that Asian New Yorkers could advocate for more responsive policies.
This report provides only a snapshot view of the status of Asian New Yorkers. The Federation looks forward to creating a dialogue among our partners, policy makers, philanthropic institutions, and the broader community on the issues raised by this report. From this dialogue, we will work to develop further research to assess community needs and to inform policies that impact the Asian American community.

65
AbouT The AsiAn AmericAn feDerATion
MISSIon
The Asian American Federation is a nonprofit organization that works to advance the civic voice and well-being of Asian Americans. We provide leadership to the Asian American community through philanthropy, policy research and strengthening community nonprofits.
ABout uS
Established in 1989, the Federation represents and works with 46 nonprofit agencies in the fields of health & human services, education, economic development, civic participation and social justice. Together, we address Asian American needs and give voice to our communities.
whAt wE Do
philanthropy: We promote giving and volunteerism to connect resources to needs. Our Asian American Community Fund provides grants to support programs and services.
research & Advocacy: We initiate research to assess community needs, to improve service access and to inform policies. We conduct advocacy on issues affecting our communities and our agencies. Our Census Information Center expands local access to census data and publishes up-to-date demographic profiles of Asian Americans.
nonprofit support: We provide training, consultation and assistance to help member agencies strengthen and improve their governance, management capabilities and operational infrastructure. We also help agencies access funding and facilitate partnerships and collaboration.
special initiatives: We make targeted efforts to respond to emerging issues as well as events or circumstances that impact our communities.
rElAtED PuBlICAtIonS
Asian American Federation (October 2008). Working but Poor: Asian American Poverty in New York City. New York, NY.
Asian American Federation (June 2008). Revitalizing Chinatown Businesses: Challenges and Opportunities. New York, NY.
Asian American Federation (November 2005). Economic Characteristics of Asian Americans in the New York Metropolitan Area. New York, NY.
Asian American Federation (February 2003). Asian American Elders in New York City: A Study of Health, Social Needs, Quality of Life and Quality of Care. New York, NY.

66
BoArD oF DIrECtorS
george h. wang, Esq., Chairperson Partner, Haynes and Boone, LLP
gary S. Moriwaki, Esq., Vice Chairperson Partner, Fox Rothschild LLP
theresa h. yoon, Treasurer
Muzaffar Chishti, Esq., Secretary Director, Migration Policy Institute, New York University School of Law
Jeffrey Chin Partner, Ernst & Young, LLP (Retired)
david c. chung Chairman and Chief Executive Officer, 3LAB, Inc.
richard C. hsia, Esq. Executive Vice President & General Counsel, Wright Risk Management Company, Inc.
Paul D. C. huang President, C. J. Huang Foundation
Setsuko Matsunaga nishi, Ph.D. Principal Investigator, Japanese American Life Course Project
Professor Emerita, City University of New York
Ekta Singh Partner, Ernst & Young, LLP
Dennis Swanson President of Station Operations, FOX Television Stations Group
grace lyu volckhausen Commissioner, New York City Commission on Human Rights
Sunil wadhwa Director of Client Services, Gravitas Technology Inc.
william wong
honorAry BoArD
Senator Daniel k. Inouye, Chairperson
yung Duk kim, Ph.D.
loida nicolas lewis
oscar l. tang
Procopio u. yanong, M.D.
StAFF
Cao k. o Executive Director
winnie li Fiscal Manager
howard Shih Census Programs Director
Michelle tong Donor Relations Director
Anne wang Development Manager
Jo-Ann yoo Managing Director of Community Services

67

120 Wall Street, 9th FloorNew York, NY 10005
Tel: 212-344-5878Fax: 212-344-5636
www.aafederation.org
Report Funded by the wallace h. coulter Foundation.The statements made and views expressed are solely the responsibility of the authors.