asian paints - result...
TRANSCRIPT
Edelweiss Research is also available on www.edelresearch.com, Bloomberg EDEL <GO>, Thomson First Call, Reuters and Factset. Edelweiss Securities Limited
Asian Paints’ (APL) Q2FY18 consolidated sales (up 15% YoY) came slightly ahead of estimates, while EBITDA (up 13.6% YoY) and adj. PAT (up 7.5% YoY) came in line with estimates. With continuing impact of GST within trade channel in July, decorative volumes grew ~8% YoY (in line with our estimates) though comparatively softer than Kansai Nerolac’s volume growth of 18% YoY and APL’s historical run-rate of >10%. With no price hikes in the quarter and sustained inflationary raw material scenario, gross margin plummeted by 308bps YoY to 41.3% (lowest in ~3 years). Anticipated volume recovery, price hikes, and government’s housing push lend growth and margin comfort. Maintain ‘BUY’ on dips.
Festivity steers volume growth; margins soft Standalone sales grew 16.1% YoY (better than 7.3% YoY reported in Q1FY18) led by ~8% YoY volume growth. While volume growth was lower than that reported by Kansai Nerolac (18% YoY), revenue growth of both companies was almost similar. In international operations, while Nepal, Bangladesh, Oman and Bahrain posted good revenue growth, Egypt and Ethiopia were affected by currency devaluation which impacted overall growth. While automotive coatings joint venture (JV) witnessed subdued demand, performance of industrial coatings JV was satisfactory. Higher RM cost continued to exert pressure on gross margin (fell by 308bps YoY). However, tight leash on costs restricted the decline in EBITDA margin to mere 23bps YoY.
Q2FY18 conference call: Key takeaways Early festive season helped in volume uptick in Q2FY18. APL is unsure whether demand revival was on account of festive season or more structural in nature. The company stated it has not lost market share in the segments where it is present. In past 2 quarters, there has been no change in product mix. Ess Ess on LTL basis clocked double digit volume growth.
Outlook and valuations: Positive; maintain ‘BUY’ We expect APL to be key beneficiary of recovery in GDP, rising urbanisation and government’s housing push. Hence, we expect decorative volumes to recoup from H2FY18. As we raise FY19E EPS by 2.4%, our target price is pegged at INR1,273 (INR1,249 earlier), based on target multiple of 45x FY19E EPS. Maintain ‘BUY/SO’. At CMP, the stock trades at 43.2x FY19E EPS.
RESULT UPDATE
ASIAN PAINTSVolume looks up; inflationary input cost a drag
EDELWEISS 4D RATINGS
Absolute Rating BUY
Rating Relative to Sector Outperform Risk Rating Relative to Sector Medium Sector Relative to Market Underweight
MARKET DATA (R: ASPN.BO, B: APNT IN)
CMP : INR 1,223 Target Price : INR 1,273 52-week range (INR) : 1,262 / 849 Share in issue (mn) : 959.2 M cap (INR bn/USD mn) : 1,173 / 18,028 Avg. Daily Vol.BSE/NSE(‘000) : 1,143.0
SHARE HOLDING PATTERN (%)
Current Q1FY18 Q4FY17
Promoters * 52.8 52.8 52.8
MF's, FI's & BK’s 8.5 8.5 7.7
FII's 17.5 17.5 18.1
Others 21.0 21.2 21.4 * Promoters pledged shares (% of share in issue)
: 11.8
PRICE PERFORMANCE (%)
Stock Nifty
EW FMCG Index
1 month 0.8 2.4 1.9 3 months 5.8 2.4 0.2
12 months 8.7 17.2 19.9
Abneesh Roy +91 22 6620 3141 [email protected] Alok Shah +91 22 6620 3040 [email protected] Rajiv Berlia +91 22 6623 3377 [email protected]
India Equity Research| Consumer Goods
October 24, 2017
Financials (INR mn)
Year to March Q2FY18 Q2FY17 % change Q1FY18 % change FY17 FY18E FY19E
Net rev. 42,652 37,095 15.0 38,152 11.8 152,902 168,083 200,619 EBITDA 8,011 7,054 13.6 6,654 20.4 30,214 31,434 41,006 Adjusted Profit 5,262 4,893 7.5 4,382 20.1 20,162 20,679 27,143 Dilu. EPS (INR) 5.5 5.1 7.5 4.6 20.1 21.0 21.6 28.3 Dilu.P/E (x) 58.2 56.7 43.2 EV/EBITDA (x) 38.4 36.8 28.0 ROAE (%) 26.4 24.1 27.9

Consumer Goods
2 Edelweiss Securities Limited
Table 1: Trends at a glance
**Q1FY17 onwards numbers are as per IND AS
Table 2: Segmental performance (Standalone)
Table 3: Segmental performance (Consolidated)
Source: Company, Edelweiss research
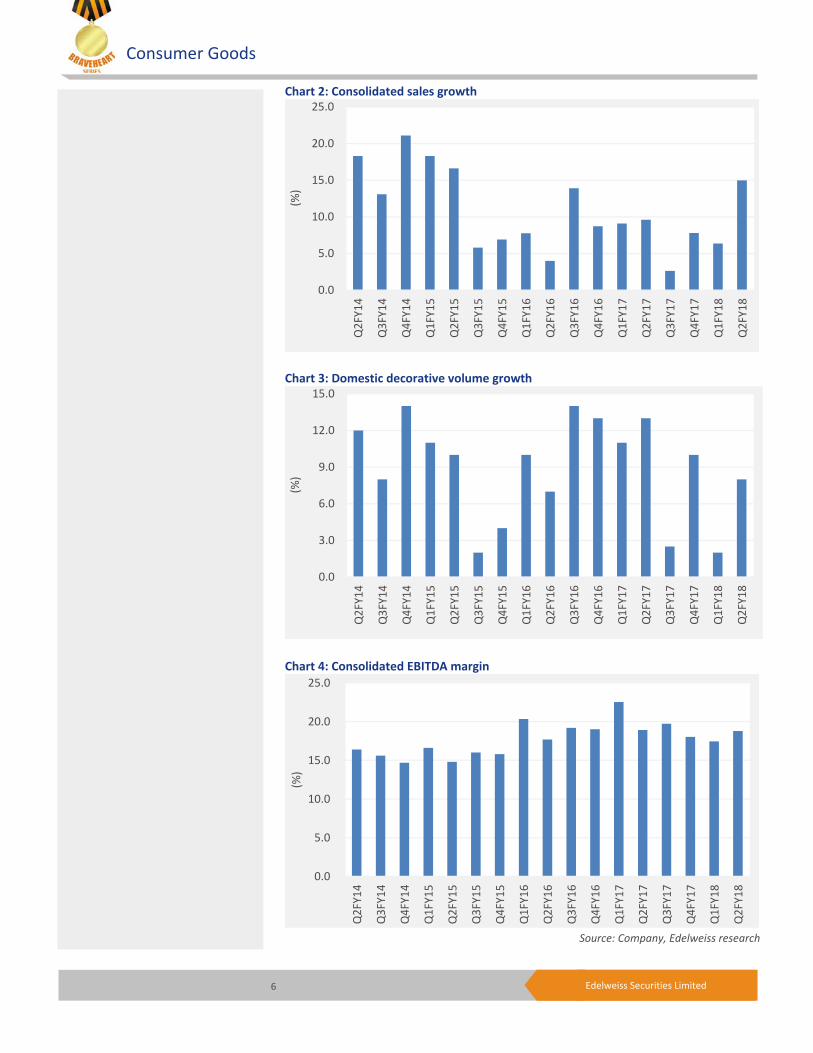
Q1FY16 Q2FY16 Q3FY16 Q4FY16 Q1FY17 Q2FY17 Q3FY17 Q4FY17 Q1FY18 Q2FY18Domestic decorative volume growth (% YoY) 10.0 7.0 14.0 13.0 11.0 12.0 3.0 10.0 2.0 8.0Consolidated sales growth (% YoY) 7.8 4.0 13.9 8.7 9.1 9.6 2.6 7.8 6.4 15.0Consolidated gross margin (%) 42.8 42.8 47.1 45.4 47.2 44.5 44.0 43.8 42.8 41.3Consolidated staff costs (% of revenue) 7.1 7.0 5.9 7.3 7.6 7.4 6.7 6.7 7.5 6.6 Consolidated other expenses (% of revenue) 15.3 18.1 21.9 19.0 17.1 18.2 17.6 19.1 17.9 15.9 Consolidated EBITDA growth (% YoY) 21.9 15.2 37.2 24.7 20.0 17.3 (1.2) 2.1 (18.5) 13.6Consolidated EBITDA margin (%) 20.4 17.7 19.2 19.0 22.6 18.9 19.7 18.0 17.4 18.8Standalone sales growth (% YoY) 7.2 2.3 13.2 11.5 8.8 9.4 0.7 9.4 7.3 16.1Standalone gross margin (%) 47.5 43.6 48.3 50.1 48.5 45.7 44.4 44.5 43.8 42.2Standalone EBITDA growth (% YoY) 25.1 11.4 31.9 23.9 19.9 17.6 (1.2) 3.4 (18.2) 14.1Standalone EBITDA margin (%) 20.6 18.9 20.9 19.3 24.5 20.3 19.7 19.2 18.6 20.0Ess Ess revenue (INR mn) 237 251 284 326 332 395 349 427 295 418Ess Ess EBIT (INR mn) (53) (93) (74) (73) (30) (33) (44) (80) (65) (78)
Segment revenue (INR mn) Q2FY18 Q2FY17 YoY growth Paints 35,604 35,137 1.3Home Improvement (only Ess Ess) 418 395 5.7Total 36,022 35,532 1.4
Paints 7,439 6,502 14.4Home Improvement (only Ess Ess) (78) (33) NMTotal 7,362 6,470 13.8
Paints 20.9 18.5 239Home Improvement (18.6) (8.2) NMTotal 20.4 18.2 223
Segment PBIT (INR mn)
PBIT margins (%)
Segment revenue (INR mn) Q2FY18 Q2FY17 YoY growth Paints 41,893 40,990 2.2Home Improvement (both Sleek and Ess Ess) 849 796 6.6Total 42,742 41,786 2.3
Paints 8,010 7,117 12.5Home Improvement (both Sleek and Ess Ess) (98) (78) NMTotal 7,912 7,039 12.4
Paints 19.1 17.4 176Home Improvement (11.6) (9.8) NMTotal 18.5 16.8 167
Segment PBIT (INR mn)
PBIT margins (%)
Asian Paints
3 Edelweiss Securities Limited
Q2FY18 conference call | Key takeaways Overall economy
• It has been challenging times. GDP trajectory has been on downward trend.
• Global economy continues to face challenges of low inflation and geo-political tensions.
• Early festive season helped in volume uptick in Q2FY18. Festive demand for paint companies starts in July.
• The company is unsure of whether demand revival is purely on account of festive season or it is structural in nature. Management remains cautiously optimistic on demand recovery.
• It is too early to comment on whether unorganised segment has been losing market share. Some unorganised players have started being tax compliant.
GST & others
• The impact of GST continued through July and a recovery of sorts was seen only in September.
• All significant dealers have migrated to GST network.
• Overall, there has been no change in the tax rate for APL.
• Marginal benefit was availed owing to input tax credit received on GST. The company does not have any major line item where the benefit of input tax credit would be substantial.
Paints
• Decorative segment in India registered high single digit volume growth. Hence, there was recovery from Q1FY18 which was however impacted by destocking due to GST.
• APL does not think it has lost market share in the segments where it is present.
• The Automotive Coatings JV (PPG-AP) witnessed subdued demand in the auto OEM and general industrial segments. Performance of Industrial Coatings JV (AP-PPG) was satisfactory.
• Competition could be growing at different volume growth rates owing to the region or product in which it is present.
• Within affordable housing, if it is only white wash and cement paint, then APL would not be a beneficiary. However, the company has seen that those houses typically come for re-painting where big paint companies set to benefit.
• Labour cost would be 60-70% of overall cost of paint.
• In international operations, units in Nepal, Bangladesh, Oman and Bahrain witnessed good top-line growth. However, currency devaluation in Egypt and forex unavailability in Ethiopia impacted overall performance of International operations.
• There were no price revisions in Q2FY18. Total price increase has been ~5.7% thus far in CY17. APL has not taken any price hike since it believes that gross margins are still reasonably healthy.
• In the past 2 quarters, there has been no product mix change.
• Inaugurated the 5,000MT plant in Indonesia. Launched product in that market this fiscal. APL is distributing through a manufacturer who was earlier manufacturing for it. It has now started appointing distributors who would sell in turn to the small distributors. Will wait for FY18 to end before it calls out the performance. The company
Consumer Goods
4 Edelweiss Securities Limited
is using APL brand only. It is tougher than India to set up distributor network in Indonesia.
Home improvement
• Both segments of the home improvement business – kitchen under Sleek and Bath under Ess Ess, performed significantly better than the first quarter.
• APL is currently a very small player in the home improvement space. Products under this segment are sold on pan-India basis.
• Q1FY18 was disappointing since impact of GST was felt more in this segment than in paint business. APL will re-look at its performance for one more quarter before branching into other segments.
• For Sleek there was a minor adjustment on account of excise.
• Ess Ess on LTL basis clocked double digit volume growth.
Other businesses
• APL has just entered the adhesive segment, though the size is too small.
Margins
• On sequential basis, raw material (RM) prices remained stable, helped to an extent by the strong currency. COGS on sequential basis remained higher since high RM cost in Q1FY18 was used in Q2FY18 as well.
• RM prices continue to remain higher and APL will take appropriate action to counter such increase in RM cost.
• Tio2 prices spurted on sequential basis.
• Crude goes into solvent based products which is 15% of product range. Harvey storm led to increase in input prices.
• Other expenditure remained flat on cost rationalisation of various overheads done by management.
• Increased digital spends within advertisements.
Capex
• Of the capex outlay of INR12bn for FY18, INR10bn will be towards new capacity additions at Vizag and Mysore. These plants would be capitalised and operationalised in FY19. APL has yet to sign an agreement with the government to avail any tax breaks.
• Other non-current assets have increased on account of government’s tax receivables and advances paid for capex related items.
Dealers
• Dealer level inventory position, on an average, stood below normal levels.
• Some addition at dealers’ end at industry level happened. Exceptional item & others
• There was no major one-off in other income. Base quarter had dividend income.
• Exceptional item was the profit from sale of Caribbean investment. There was no tax impact on sale of investment. Divestment was done since the subsidiaries did not compliment the company’s existing portfolio.
Asian Paints
5 Edelweiss Securities Limited
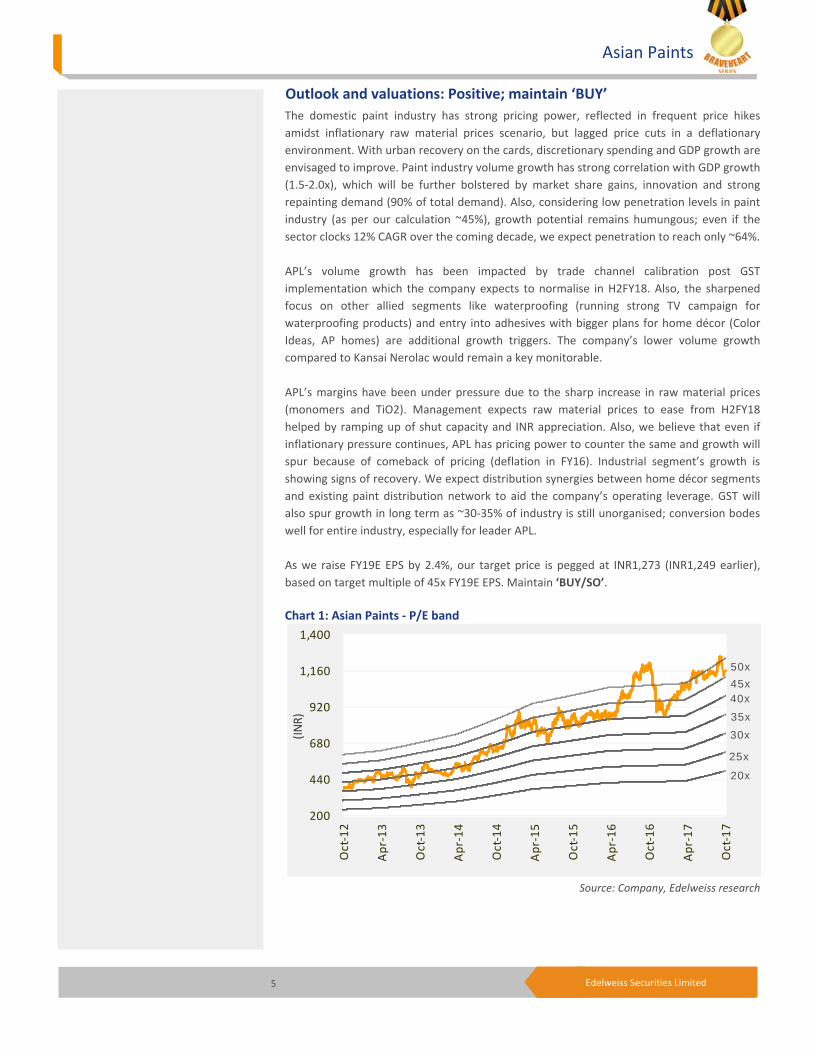
Outlook and valuations: Positive; maintain ‘BUY’ The domestic paint industry has strong pricing power, reflected in frequent price hikes amidst inflationary raw material prices scenario, but lagged price cuts in a deflationary environment. With urban recovery on the cards, discretionary spending and GDP growth are envisaged to improve. Paint industry volume growth has strong correlation with GDP growth (1.5-2.0x), which will be further bolstered by market share gains, innovation and strong repainting demand (90% of total demand). Also, considering low penetration levels in paint industry (as per our calculation ~45%), growth potential remains humungous; even if the sector clocks 12% CAGR over the coming decade, we expect penetration to reach only ~64%. APL’s volume growth has been impacted by trade channel calibration post GST implementation which the company expects to normalise in H2FY18. Also, the sharpened focus on other allied segments like waterproofing (running strong TV campaign for waterproofing products) and entry into adhesives with bigger plans for home décor (Color Ideas, AP homes) are additional growth triggers. The company’s lower volume growth compared to Kansai Nerolac would remain a key monitorable. APL’s margins have been under pressure due to the sharp increase in raw material prices (monomers and TiO2). Management expects raw material prices to ease from H2FY18 helped by ramping up of shut capacity and INR appreciation. Also, we believe that even if inflationary pressure continues, APL has pricing power to counter the same and growth will spur because of comeback of pricing (deflation in FY16). Industrial segment’s growth is showing signs of recovery. We expect distribution synergies between home décor segments and existing paint distribution network to aid the company’s operating leverage. GST will also spur growth in long term as ~30-35% of industry is still unorganised; conversion bodes well for entire industry, especially for leader APL. As we raise FY19E EPS by 2.4%, our target price is pegged at INR1,273 (INR1,249 earlier), based on target multiple of 45x FY19E EPS. Maintain ‘BUY/SO’.
Chart 1: Asian Paints - P/E band
Source: Company, Edelweiss research
200
440
680
920
1,160
1,400
Oct
-12
Apr-
13
Oct
-13
Apr-
14
Oct
-14
Apr-
15
Oct
-15
Apr-
16
Oct
-16
Apr-
17
Oct
-17
(INR)
20x
30x
35x
45x
25x
40x
50x
Consumer Goods
6 Edelweiss Securities Limited
Chart 2: Consolidated sales growth
Chart 3: Domestic decorative volume growth
Chart 4: Consolidated EBITDA margin
Source: Company, Edelweiss research
0.0
5.0
10.0
15.0
20.0
25.0
Q2F
Y14
Q3F
Y14
Q4F
Y14
Q1F
Y15
Q2F
Y15
Q3F
Y15
Q4F
Y15
Q1F
Y16
Q2F
Y16
Q3F
Y16
Q4F
Y16
Q1F
Y17
Q2F
Y17
Q3F
Y17
Q4F
Y17
Q1F
Y18
Q2F
Y18
(%)
0.0
3.0
6.0
9.0
12.0
15.0
Q2F
Y14
Q3F
Y14
Q4F
Y14
Q1F
Y15
Q2F
Y15
Q3F
Y15
Q4F
Y15
Q1F
Y16
Q2F
Y16
Q3F
Y16
Q4F
Y16
Q1F
Y17
Q2F
Y17
Q3F
Y17
Q4F
Y17
Q1F
Y18
Q2F
Y18
(%)
0.0
5.0
10.0
15.0
20.0
25.0
Q2F
Y14
Q3F
Y14
Q4F
Y14
Q1F
Y15
Q2F
Y15
Q3F
Y15
Q4F
Y15
Q1F
Y16
Q2F
Y16
Q3F
Y16
Q4F
Y16
Q1F
Y17
Q2F
Y17
Q3F
Y17
Q4F
Y17
Q1F
Y18
Q2F
Y18
(%)

Asian Paints
7 Edelweiss Securities Limited
Table 4: Standalone snapshot (INR mn)
Source: Company, Edelweiss research
Table 5: Pricing summary
Source: Company, Edelweiss research
Year to March Q2FY18 Q2FY17 % Change Q1FY18 % ChangeNet sales 36,022 31,020 16.1 32,029 12.5 COGS 20,809 16,859 23.4 18,013 15.5 Staff costs 2,020 1,927 4.8 2,060 (1.9) Other expenditure 5,992 5,922 1.2 5,985 0.1 Total expenditure 28,821 24,708 16.6 26,058 10.6 EBITDA 7,201 6,313 14.1 5,971 20.6 Depreciation 772 731 5.6 758 1.8 EBIT 6,429 5,582 15.2 5,213 23.3 Interest 50 44 13.0 43 15.9 Other income 638 848 (24.7) 861 (25.9) PBT 7,018 6,386 9.9 6,032 16.4 Exceptional item 0 0 NA 0 NATax expenses 2,284 2,033 12.3 2,022 12.9 Net profit 4,735 4,353 8.8 4,010 18.1
COGS 57.8 54.3 342 56.2 153 Staff expenses 5.6 6.2 (60) 6.4 (82) Others 16.6 19.1 (246) 18.7 (205) EBITDA 20.0 20.3 (36) 18.6 135 PAT 13.1 14.0 (89) 12.5 62 Tax rate 32.5 31.8 70 33.5 (99)
As % of net revenues
Date Price hikeMay-17 ~2.6-2.7Mar-17 3.0 Mar-16 (2.0) Mar-15 (1.9) Jun-14 1.2 May-14 1.0 Feb-14 2.1 Sep-13 1.8 Aug-13 1.0 May-13 1.2 Jan-13 (0.2) May-12 3.2 Mar-12 2.1 Mar-12 1.4 Dec-11 2.2 Jul-11 1.3 Jun-11 2.5 May-11 4.4 Q4FY11 1.0 Dec-10 3.0 Aug-10 1.2 Jul-10 2.6 May-10 4.2

Consumer Goods
8 Edelweiss Securities Limited
Table 6: Kansai Nerolac Q2FY18 performance (INR mn)
Source: Company, Edelweiss research
Note: Quarterly nos. are Standalone
Year to March Q2FY18 Q2FY17 % change Q1FY18 % changeNet Sales 11,618 9,999 16.2 11,702 (0.7)Other operating income 26 22 15.8 34 (24.5)Total Income 11,644 10,021 16.2 11,736 (0.8)Cost of goods sold 6,965 5,739 21.4 7,069 (1.5)Gross profit 4,679 4,282 9.3 4,667 0.3Staff costs 585 495 10.0 532 10.0Other expenditure 1,881 1,805 4.2 2,063 (8.8)Total expenditure 2,466 2,300 7.2 2,595 (5.0)EBITDA 2,213 1,983 11.6 2,073 6.8Depreciation 187 172 8.9 181 3.6EBIT 2,026 1,811 11.9 1,892 7.1Other income 142 294 (51.8) 199 (28.7)Interest and financial charges - - NM - - PBT 2,168 2,105 3.0 2,091 3.7Provision for taxation 722 712 1.4 683 5.7Core Profit 1,446 1,393 3.8 1,408 2.7Exceptional - - NM - NMMinority interest - - NM - NMReported PAT 1,446 1,393 3.8 1,408 2.7Paid up Capital (Re 1 each) 539 539 - 539 - EPS 2.7 2.6 3.8 2.6 2.7as % of net salesCOGS 59.8 57.3 255 60.2 (42) Staff costs 8.4 9.3 (87) 7.5 87 Other expenditure 27.0 31.5 (444) 29.2 (217) EBITDA 19.0 19.8 (78) 17.7 135 EBIT 17.4 18.1 (67) 16.1 128 PBT 18.6 21.0 (239) 17.8 80 Net profit 12.4 13.9 (148) 12.0 42 Tax rate 33.3 33.8 (53) 32.7 62

Asian Paints
9 Edelweiss Securities Limited
Financial snapshot (INR mn) Year to March Q2FY18 Q2FY17 % change Q1FY18 % change YTD18 FY18E FY19E Net revenues 42,652 37,095 15.0 38,152 11.8 80,805 168,083 200,619 Raw material costs 25,042 20,637 21.3 21,812 14.8 46,855 95,848 110,698 Employee expenses 2,822 2,663 6.0 2,862 (1.4) 5,683 11,814 13,827 Other expenses 6,777 6,741 0.5 6,825 (0.7) 13,602 28,987 35,088 Total expenditure 34,641 30,041 15.3 31,499 10.0 66,140 136,649 159,612 EBITDA 8,011 7,054 13.6 6,654 20.4 14,665 31,434 41,006 Depreciation 889 833 6.8 905 (1.8) 1,794 3,714 4,281 EBIT 7,122 6,221 14.5 5,749 23.9 12,871 27,720 36,725 Other income 534 793 (32.6) 783 (31.8) 1,317 2,763 3,178 Interest 88 59 48.9 80 10.2 167 374 382 Add: Prior period items Add: Exceptional items 675 55 1,126.7 - 675 - -Profit before tax 8,243 7,010 17.6 6,452 27.8 14,696 30,109 39,521 Provision for taxes 2,459 2,200 11.8 2,160 13.8 4,619 9,635 12,647 Minority interest (152) (138) NA (90) NA (242) (205) (269) Associate profit share Profit- Discontinued Ops Reported net profit 5,937 4,948 20.0 4,382 35.5 10,319 20,679 27,143 Adjusted Profit 5,262 4,893 7.5 4,382 20.1 9,644 20,679 27,143 Diluted shares (mn) 959 959 959 959 959 959 Adjusted Diluted EPS 5.5 5.1 7.5 4.6 20.1 10.1 21.6 28.3 Diluted P/E (x) 56.7 43.2 EV/EBITDA (x) 36.8 28.0 ROAE (%) 24.1 27.9 As % of net revenues COGS 58.7 55.6 57.2 58.0 57.0 55.2 Employee cost 6.6 7.2 7.5 7.0 7.0 6.9 Other expenses 15.9 18.2 17.9 16.8 17.2 17.5 EBITDA 18.8 19.0 17.4 18.1 18.7 20.4 EBIT 16.7 16.8 15.1 15.9 16.5 18.3 PBT 19.3 18.9 16.9 17.4 17.9 19.7 Adjusted net profit 12.0 12.8 11.2 11.6 12.2 13.4 Tax rate 29.8 31.4 33.5 32.9 32.0 32.0
Consumer Goods
10 Edelweiss Securities Limited
Company Description Asian Paints is the largest paints company in India and figures among the top 10 players in the world. The company has 25 manufacturing plants in 17 countries, serving consumers in 65 countries globally. The decorative segment accounts for almost 70% of the overall paints market. Paints sales in domestic and international markets contributed 81% and 13%, respectively, to the company’s consolidated revenue; chemical sales accounted for the balance. Among Asian Paints’ international businesses, while the Middle East contributes the lion’s share at 51% to revenue, the Caribbean contributes 14%. Asia and South Pacific contribute 27% and 8%, respectively. Investment Theme The paints industry is expected to post robust volume growth led by strong repainting demand and from construction. Growth in the repainting segment, accounting for about 90% of decorative demand, is on account of good demand in rural and small towns. Further, expected growth in construction activity over the next five years creates opportunity for fresh painting. Though Asian Paints is expected to grow ahead of the market on account of its pricing strategy at the lower end, higher growth in premium products, brand equity and distribution strength, moderation in real estate and auto segments can act as barrier. Key Risks A slowdown in the economy is the biggest risk for the paints industry, as about 75% of demand for decorative paints arises from repainting, which, in turn, depends heavily on the country’s economic condition. A rise in crude oil price and rupee depreciation could hurt the company’s margin as crude derivatives account for majority of Asian Paints’ input costs.

11 Edelweiss Securities Limited
Asian Paints
Financial Statements
Income statement (INR mn)
Year to March FY16 FY17 FY18E FY19E
Net revenue 142,715 152,902 168,083 200,619Materials costs 80,497 84,306 95,848 110,698Employee costs 9,895 10,863 11,814 13,827Other Expenses 19,021 21,255 22,305 26,928Ad. & sales costs 5,611 6,263 6,682 8,159EBITDA 27,692 30,214 31,434 41,006Depreciation 2,756 3,388 3,714 4,281EBIT 24,936 26,826 27,720 36,725Add: Other income 2,134 2,626 2,763 3,178Less: Interest Expense 407 306 374 382Profit Before Tax 26,663 29,146 30,109 39,521Less: Provision for Tax 8,445 9,480 9,635 12,647Less: Minority Interest (334) (496) (205) (269)Reported Profit 18,028 20,162 20,679 27,143Exceptional Items (525) - - -Adjusted Profit 18,552 20,162 20,679 27,143Shares o /s (mn) 959 959 959 959Adjusted Basic EPS 19.3 21.0 21.6 28.3Diluted shares o/s (mn) 959 959 959 959Adjusted Diluted EPS 19.3 21.0 21.6 28.3Adjusted Cash EPS 22.2 24.6 25.4 32.8Dividend per share (DPS) 7.5 7.9 9.1 11.9Dividend Payout Ratio(%) 48.0 45.5 50.5 50.5
Common size metrics
Year to March FY16 FY17 FY18E FY19E
Materials costs 56.4 55.1 57.0 55.2Staff costs 6.9 7.1 7.0 6.9Ad. & sales costs 3.9 4.1 4.0 4.1Other expenses 13.3 13.9 13.3 13.4EBITDA margins 19.4 19.8 18.7 20.4EBIT margins 17.5 17.5 16.5 18.3Net Profit margins 12.8 12.9 12.2 13.4
Growth ratios (%)
Year to March FY16 FY17 FY18E FY19E
Revenues 9.5 7.1 9.9 19.4EBITDA 25.6 9.1 4.0 30.5PBT 28.9 9.3 3.3 31.3Adjusted Profit 26.1 8.7 2.6 31.3EPS 26.1 8.7 2.6 31.3
Key Assumptions
Year to March FY16 FY17 FY18E FY19E
Macro
GDP(Y-o-Y %) 7.9 6.6 7.1 7.7 Inflation (Avg) 4.9 4.5 4.0 4.5 Repo rate (exit rate) 6.8 6.3 5.8 5.8 USD/INR (Avg) 65.5 67.1 66.0 66.0Company
Sales assumptions
Sales growth-paints std 8.2 8.3 14.0 20.5 Sales growth-chemicals 29.8 18.0 10.0 15.0 Volume growth-standalone 10.2 10.3 8.0 13.5 Price change-standalone (2.0) (2.0) 6.0 7.0 Subsidiary sales growth 14.0 8.3 17.6 12.5 Cost assumptions
COGS as % of sales (Con) 56.4 55.1 57.0 55.2 COGS as % of sales (std) 55.7 54.3 52.2 50.4 Staff cost (% of sales) 6.9 7.1 7.0 6.9 Std Staff cost (% sales) 3.9 4.1 3.7 3.8 Con A&P (% of sales) 3.9 4.1 4.0 4.1 Dom A&P (% of sales) 3.9 4.1 3.7 3.8 Financial assumptions
Tax rate (Consol) 31.7 32.5 32.0 32.0 Capex (INR mn) 10,767 3,791 10,000 10,000 Debtor days 30 31 30 30 Inventory days 97 100 95 90 Payable days 71 76 67 67 Cash conversion cycle 56 56 58 53 Dep. (% gross block) 9.3 9.4 8.8 8.2
12 Edelweiss Securities Limited
Consumer Goods
Peer comparison valuation
Market cap Diluted P/E (X) EV / EBITDA (X) ROAE (%)
Name (USD mn) FY18E FY19E FY18E FY19E FY18E FY19E
Asian Paints 18,028 56.7 43.2 36.8 28.0 24.1 27.9Berger Paints 4,095 53.1 39.8 32.0 24.4 27.5 31.7Pidilite Industries 6,308 44.8 36.4 30.2 24.3 24.9 26.1Median - 49.0 38.1 31.4 24.7 24.5 27.0AVERAGE - 46.8 37.5 31.1 25.0 32.9 35.9
Source: Edelweiss research
Cash flow metrics
Year to March FY16 FY17 FY18E FY19E
Operating cash flow 22,354 18,102 25,131 29,010Investing cash flow (4,628) (4,393) (8,925) (10,000)Financing cash flow (8,262) (6,493) (11,017) (14,289)Net cash Flow 9,464 7,217 5,190 4,721Capex (10,767) (3,791) (10,000) (10,000)Dividend paid (8,645) (9,169) (10,443) (13,707)
Profitability and efficiency ratios
Year to March FY16 FY17 FY18E FY19E
ROAE (%) 30.6 26.4 24.1 27.9ROACE (%) 42.8 37.4 33.8 39.2Inventory Days 97 100 95 90Debtors Days 30 31 30 30Payable Days 71 76 67 67Cash Conversion Cycle 56 56 58 53Current Ratio 2.0 2.2 2.4 2.5Gross Debt/EBITDA 0.1 0.2 0.2 0.1Net Debt/Equity (0.2) (0.2) (0.2) (0.3)Interest Coverage Ratio 61.3 87.7 74.1 96.2
Operating ratios
Year to March FY16 FY17 FY18E FY19E
Total Asset Turnover 2.1 1.8 1.8 1.9Fixed Asset Turnover 4.7 4.6 4.6 4.8Equity Turnover 2.4 2.1 2.0 2.1
Valuation parameters
Year to March FY16 FY17 FY18E FY19E
Adj. Diluted EPS (INR) 19.3 21.0 21.6 28.3Y-o-Y growth (%) 30.4 8.7 2.6 31.3
Adjusted Cash EPS (INR) 22.2 24.6 25.4 32.8Diluted P/E (x) 63.2 58.2 56.7 43.2P/B (x) 18.0 15.4 13.6 11.8EV / Sales (x) 8.1 7.6 6.9 5.7EV / EBITDA (x) 41.9 38.4 36.8 28.0Dividend Yield (%) 0.6 0.7 0.7 1.0
Balance sheet (INR mn)
As on 31st March FY16 FY17 FY18E FY19E
Share capital 959 959 959 959Reserves & Surplus 64,289 75,064 85,300 98,736Shareholders' funds 65,248 76,023 86,259 99,695Minority Interest 3,837 3,755 3,550 3,281Short term borrowings 2,507 5,193 5,007 4,822Long term borrowings 726 411 396 381Total Borrowings 3,233 5,603 5,403 5,203Long Term Liabilities 1,338 1,569 1,569 1,569Def. Tax Liability (net) 2,950 3,430 3,430 3,430
Sources of funds 76,606 90,380 100,211 113,178
Gross Block 34,921 37,203 47,203 57,203Net Block 30,562 29,567 35,853 41,572Capital work in progress 1,066 2,575 1,500 1,500Intangible Assets 3,602 3,455 3,455 3,455Total Fixed Assets 35,229 35,597 40,808 46,527Non current investments 11,268 13,007 13,007 13,007Cash and Equivalents 20,095 21,526 26,715 31,436Inventories 19,982 26,269 24,947 27,295Sundry Debtors 11,917 14,466 13,585 16,489Loans & Advances 3,691 7,116 7,116 7,116Other Current Assets 3,408 6,056 6,056 6,056Current Assets (ex cash) 38,998 53,907 51,703 56,956Trade payable 15,651 19,228 17,594 20,320Other Current Liab 13,334 14,428 14,428 14,428Total Current Liab 28,984 33,656 32,022 34,748Net Curr Assets-ex cash 10,013 20,251 19,682 22,209
Uses of funds 76,606 90,380 100,211 113,178
BVPS (INR) 68.0 79.3 89.9 103.9
Free cash flow (INR mn)
Year to March FY16 FY17 FY18E FY19E
Reported Profit 18,028 20,162 20,679 27,143Add: Depreciation 2,756 3,388 3,714 4,281Interest (Net of Tax) 278 206 254 260Others 319 (397) (85) (147)Less: Changes in WC (973) 5,259 (570) 2,527Operating cash flow 22,354 18,102 25,131 29,010Less: Capex 10,767 3,791 10,000 10,000Free Cash Flow 11,586 14,311 15,131 19,010
13 Edelweiss Securities Limited
Asian Paints
Top 10 holdings
Perc. Holding Perc. Holding
Life Insurance Corp Of India 5.6 Ojasvi Trading 4.9 Vanguard Group Inc 1.5 Blackrock 1.3 Jpmorgan Chase & Co 0.7 Aberdeen Asset Managers 0.6 Trilogy Global Advisors LLC 0.5 TIAA Cref 0.5 FMR LLC 0.5 Franklin Resources 0.5
*as per last available data
Insider Trades Reporting Data Acquired / Seller B/S Qty Traded No Data Available
*in last one year
Bulk Deals Data Acquired / Seller B/S Qty Traded Price No Data Available
*in last one year
Additional Data
Directors Data Ashwin Choksi Non-executive Chairman Ashwin Dani Non-executive Vice ChairmanMs. Amrita Vakil Non-executive Director Mahendra Choksi Non-executive Director Malav Dani Non-executive Director Abhay Vakil Non-executive Director K.B.S. Anand MD & CEO Ms. Vibha Paul Non-Executive Independent DirectorDeepak Satwalekar Non-Executive Independent Director S. Sivaram Non-Executive Independent DirectorMahendra Shah Non-Executive Independent Director S. Ramadorai Non-Executive Independent DirectorM. K. Sharma Non-Executive Independent Director Vibha Paul Rishi Non-Executive Independent Director
Auditors - Deloitte Haskin & Sells
*as per last annual report

14 Edelweiss Securities Limited
Company Absolute
reco
Relative
reco
Relative
risk
Company Absolute
reco
Relative
reco
Relative
Risk Asian Paints BUY SO M Bajaj Corp HOLD SU H
Berger Paints BUY SO L Britannia Industries BUY SO L
Colgate HOLD SP M Dabur BUY SO M
Emami BUY SO H GlaxoSmithKline Consumer Healthcare
HOLD SU M
Godrej Consumer BUY SO H Hindustan Unilever HOLD SP L
ITC HOLD SP M Marico BUY SO M
Nestle Ltd HOLD SP L Pidilite Industries BUY SO M
United Spirits HOLD SP H
RATING & INTERPRETATION
ABSOLUTE RATING
Ratings Expected absolute returns over 12 months
Buy More than 15%
Hold Between 15% and - 5%
Reduce Less than -5%
RELATIVE RETURNS RATING Ratings Criteria
Sector Outperformer (SO) Stock return > 1.25 x Sector return
Sector Performer (SP) Stock return > 0.75 x Sector return
Stock return < 1.25 x Sector return
Sector Underperformer (SU) Stock return < 0.75 x Sector return
Sector return is market cap weighted average return for the coverage universe within the sector
RELATIVE RISK RATINGRatings Criteria
Low (L) Bottom 1/3rd percentile in the sector
Medium (M) Middle 1/3rd percentile in the sector
High (H) Top 1/3rd percentile in the sector
Risk ratings are based on Edelweiss risk model
SECTOR RATING Ratings Criteria
Overweight (OW) Sector return > 1.25 x Nifty return
Equalweight (EW) Sector return > 0.75 x Nifty return
Sector return < 1.25 x Nifty return
Underweight (UW) Sector return < 0.75 x Nifty return
15 Edelweiss Securities Limited
Asian Paints
Edelweiss Securities Limited, Edelweiss House, off C.S.T. Road, Kalina, Mumbai – 400 098. Board: (91-22) 4009 4400, Email: [email protected]
Aditya Narain
Head of Research
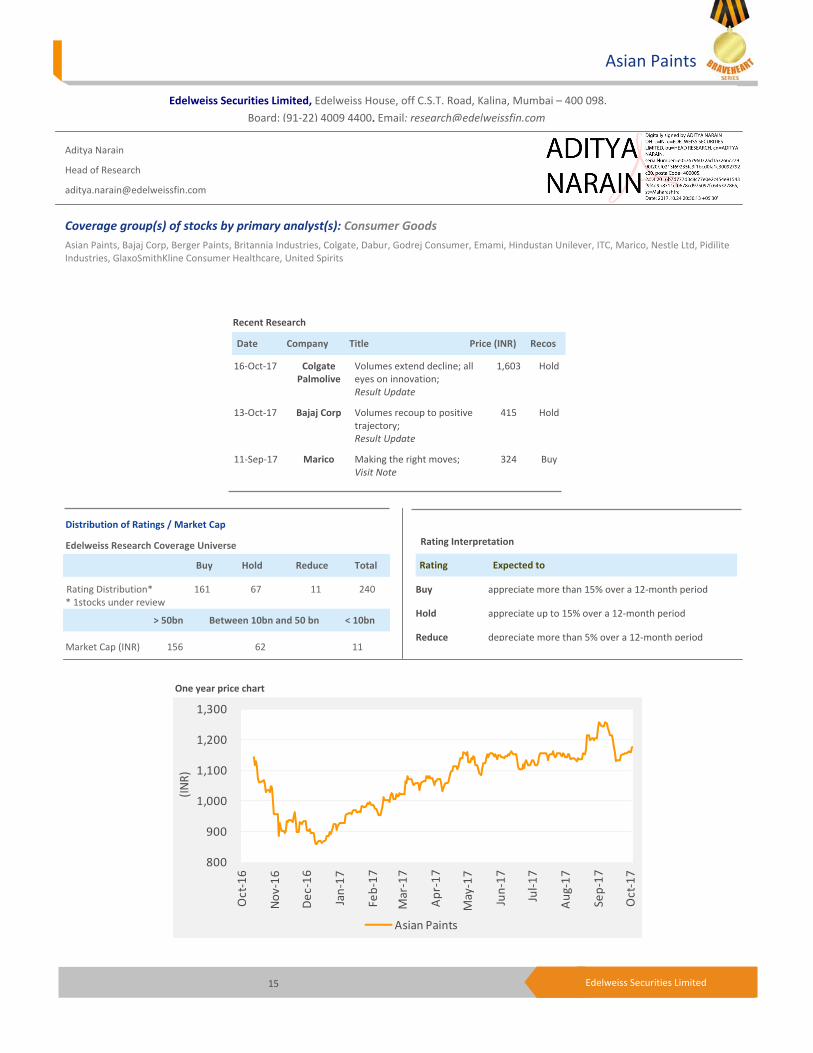
Coverage group(s) of stocks by primary analyst(s): Consumer Goods Asian Paints, Bajaj Corp, Berger Paints, Britannia Industries, Colgate, Dabur, Godrej Consumer, Emami, Hindustan Unilever, ITC, Marico, Nestle Ltd, Pidilite Industries, GlaxoSmithKline Consumer Healthcare, United Spirits
Distribution of Ratings / Market Cap
Edelweiss Research Coverage Universe
Rating Distribution* 161 67 11 240* 1stocks under review
Market Cap (INR) 156 62 11
Date Company Title Price (INR) Recos
Recent Research
16-Oct-17 Colgate Palmolive
Volumes extend decline; all eyes on innovation; Result Update
1,603 Hold
13-Oct-17 Bajaj Corp Volumes recoup to positive trajectory; Result Update
415 Hold
11-Sep-17 Marico Making the right moves; Visit Note
324 Buy
> 50bn Between 10bn and 50 bn < 10bn
Buy Hold Reduce Total
Rating Interpretation
Buy appreciate more than 15% over a 12-month period
Hold appreciate up to 15% over a 12-month period
Reduce depreciate more than 5% over a 12-month period
Rating Expected to
One year price chart
800
900
1,000
1,100
1,200
1,300
Oct
-16
Nov-
16
Dec-
16
Jan-
17
Feb-
17
Mar
-17
Apr-
17
May
-17
Jun-
17
Jul-1
7
Aug-
17
Sep-
17
Oct
-17
(INR)
Asian Paints
16 Edelweiss Securities Limited
Consumer Goods
DISCLAIMER
Edelweiss Securities Limited (“ESL” or “Research Entity”) is regulated by the Securities and Exchange Board of India (“SEBI”) and is licensed to carry on the business of broking, depository services and related activities. The business of ESL and its Associates (list available on www.edelweissfin.com) are organized around five broad business groups – Credit including Housing and SME Finance, Commodities, Financial Markets, Asset Management and Life Insurance.
This Report has been prepared by Edelweiss Securities Limited in the capacity of a Research Analyst having SEBI Registration No.INH200000121 and distributed as per SEBI (Research Analysts) Regulations 2014. This report does not constitute an offer or solicitation for the purchase or sale of any financial instrument or as an official confirmation of any transaction. Securities as defined in clause (h) of section 2 of the Securities Contracts (Regulation) Act, 1956 includes Financial Instruments and Currency Derivatives. The information contained herein is from publicly available data or other sources believed to be reliable. This report is provided for assistance only and is not intended to be and must not alone be taken as the basis for an investment decision. The user assumes the entire risk of any use made of this information. Each recipient of this report should make such investigation as it deems necessary to arrive at an independent evaluation of an investment in Securities referred to in this document (including the merits and risks involved), and should consult his own advisors to determine the merits and risks of such investment. The investment discussed or views expressed may not be suitable for all investors.
This information is strictly confidential and is being furnished to you solely for your information. This information should not be reproduced or redistributed or passed on directly or indirectly in any form to any other person or published, copied, in whole or in part, for any purpose. This report is not directed or intended for distribution to, or use by, any person or entity who is a citizen or resident of or located in any locality, state, country or other jurisdiction, where such distribution, publication, availability or use would be contrary to law, regulation or which would subject ESL and associates / group companies to any registration or licensing requirements within such jurisdiction. The distribution of this report in certain jurisdictions may be restricted by law, and persons in whose possession this report comes, should observe, any such restrictions. The information given in this report is as of the date of this report and there can be no assurance that future results or events will be consistent with this information. This information is subject to change without any prior notice. ESL reserves the right to make modifications and alterations to this statement as may be required from time to time. ESL or any of its associates / group companies shall not be in any way responsible for any loss or damage that may arise to any person from any inadvertent error in the information contained in this report. ESL is committed to providing independent and transparent recommendation to its clients. Neither ESL nor any of its associates, group companies, directors, employees, agents or representatives shall be liable for any damages whether direct, indirect, special or consequential including loss of revenue or lost profits that may arise from or in connection with the use of the information. Our proprietary trading and investment businesses may make investment decisions that are inconsistent with the recommendations expressed herein. Past performance is not necessarily a guide to future performance .The disclosures of interest statements incorporated in this report are provided solely to enhance the transparency and should not be treated as endorsement of the views expressed in the report. The information provided in these reports remains, unless otherwise stated, the copyright of ESL. All layout, design, original artwork, concepts and other Intellectual Properties, remains the property and copyright of ESL and may not be used in any form or for any purpose whatsoever by any party without the express written permission of the copyright holders.
ESL shall not be liable for any delay or any other interruption which may occur in presenting the data due to any reason including network (Internet) reasons or snags in the system, break down of the system or any other equipment, server breakdown, maintenance shutdown, breakdown of communication services or inability of the ESL to present the data. In no event shall ESL be liable for any damages, including without limitation direct or indirect, special, incidental, or consequential damages, losses or expenses arising in connection with the data presented by the ESL through this report.
We offer our research services to clients as well as our prospects. Though this report is disseminated to all the customers simultaneously, not all customers may receive this report at the same time. We will not treat recipients as customers by virtue of their receiving this report.
ESL and its associates, officer, directors, and employees, research analyst (including relatives) worldwide may: (a) from time to time, have long or short positions in, and buy or sell the Securities, mentioned herein or (b) be engaged in any other transaction involving such Securities and earn brokerage or other compensation or act as a market maker in the financial instruments of the subject company/company(ies) discussed herein or act as advisor or lender/borrower to such company(ies) or have other potential/material conflict of interest with respect to any recommendation and related information and opinions at the time of publication of research report or at the time of public appearance. ESL may have proprietary long/short position in the above mentioned scrip(s) and therefore should be considered as interested. The views provided herein are general in nature and do not consider risk appetite or investment objective of any particular investor; readers are requested to take independent professional advice before investing. This should not be construed as invitation or solicitation to do business with ESL.
17 Edelweiss Securities Limited
Asian Paints
ESL or its associates may have received compensation from the subject company in the past 12 months. ESL or its associates may have managed or co-managed public offering of securities for the subject company in the past 12 months. ESL or its associates may have received compensation for investment banking or merchant banking or brokerage services from the subject company in the past 12 months. ESL or its associates may have received any compensation for products or services other than investment banking or merchant banking or brokerage services from the subject company in the past 12 months. ESL or its associates have not received any compensation or other benefits from the Subject Company or third party in connection with the research report. Research analyst or his/her relative or ESL’s associates may have financial interest in the subject company. ESL and/or its Group Companies, their Directors, affiliates and/or employees may have interests/ positions, financial or otherwise in the Securities/Currencies and other investment products mentioned in this report. ESL, its associates, research analyst and his/her relative may have other potential/material conflict of interest with respect to any recommendation and related information and opinions at the time of publication of research report or at the time of public appearance.
Participants in foreign exchange transactions may incur risks arising from several factors, including the following: ( i) exchange rates can be volatile and are subject to large fluctuations; ( ii) the value of currencies may be affected by numerous market factors, including world and national economic, political and regulatory events, events in equity and debt markets and changes in interest rates; and (iii) currencies may be subject to devaluation or government imposed exchange controls which could affect the value of the currency. Investors in securities such as ADRs and Currency Derivatives, whose values are affected by the currency of an underlying security, effectively assume currency risk.
Research analyst has served as an officer, director or employee of subject Company: No
ESL has financial interest in the subject companies: No
ESL’s Associates may have actual / beneficial ownership of 1% or more securities of the subject company at the end of the month immediately preceding the date of publication of research report.
Research analyst or his/her relative has actual/beneficial ownership of 1% or more securities of the subject company at the end of the month immediately preceding the date of publication of research report: No
ESL has actual/beneficial ownership of 1% or more securities of the subject company at the end of the month immediately preceding the date of publication of research report: No
Subject company may have been client during twelve months preceding the date of distribution of the research report.
There were no instances of non-compliance by ESL on any matter related to the capital markets, resulting in significant and material disciplinary action during the last three years except that ESL had submitted an offer of settlement with Securities and Exchange commission, USA (SEC) and the same has been accepted by SEC without admitting or denying the findings in relation to their charges of non registration as a broker dealer.
A graph of daily closing prices of the securities is also available at www.nseindia.com
Analyst Certification:
The analyst for this report certifies that all of the views expressed in this report accurately reflect his or her personal views about the subject company or companies and its or their securities, and no part of his or her compensation was, is or will be, directly or indirectly related to specific recommendations or views expressed in this report.
Additional Disclaimers
Disclaimer for U.S. Persons This research report is a product of Edelweiss Securities Limited, which is the employer of the research analyst(s) who has prepared the research report. The research analyst(s) preparing the research report is/are resident outside the United States (U.S.) and are not associated persons of any U.S. regulated broker-dealer and therefore the analyst(s) is/are not subject to supervision by a U.S. broker-dealer, and is/are not required to satisfy the regulatory licensing requirements of FINRA or required to otherwise comply with U.S. rules or regulations regarding, among other things, communications with a subject company, public appearances and trading securities held by a research analyst account.
This report is intended for distribution by Edelweiss Securities Limited only to "Major Institutional Investors" as defined by Rule 15a-6(b)(4) of the U.S. Securities and Exchange Act, 1934 (the Exchange Act) and interpretations thereof by U.S. Securities and Exchange Commission (SEC) in reliance on Rule 15a 6(a)(2). If the recipient of this report is not a Major Institutional Investor as specified above, then it should not act upon this report and return the same to the sender. Further, this report may not be copied, duplicated and/or transmitted onward to any U.S. person, which is not the Major Institutional Investor.

18 Edelweiss Securities Limited
Consumer Goods
Access the entire repository of Edelweiss Research on www.edelresearch.com
In reliance on the exemption from registration provided by Rule 15a-6 of the Exchange Act and interpretations thereof by the SEC in order to conduct certain business with Major Institutional Investors, Edelweiss Securities Limited has entered into an agreement with a U.S. registered broker-dealer, Edelweiss Financial Services Inc. ("EFSI"). Transactions in securities discussed in this research report should be effected through Edelweiss Financial Services Inc. Disclaimer for U.K. Persons
The contents of this research report have not been approved by an authorised person within the meaning of the Financial Services and Markets Act 2000 ("FSMA"). In the United Kingdom, this research report is being distributed only to and is directed only at (a) persons who have professional experience in matters relating to investments falling within Article 19(5) of the FSMA (Financial Promotion) Order 2005 (the “Order”); (b) persons falling within Article 49(2)(a) to (d) of the Order (including high net worth companies and unincorporated associations); and (c) any other persons to whom it may otherwise lawfully be communicated (all such persons together being referred to as “relevant persons”). This research report must not be acted on or relied on by persons who are not relevant persons. Any investment or investment activity to which this research report relates is available only to relevant persons and will be engaged in only with relevant persons. Any person who is not a relevant person should not act or rely on this research report or any of its contents. This research report must not be distributed, published, reproduced or disclosed (in whole or in part) by recipients to any other person. Disclaimer for Canadian Persons
This research report is a product of Edelweiss Securities Limited ("ESL"), which is the employer of the research analysts who have prepared the research report. The research analysts preparing the research report are resident outside the Canada and are not associated persons of any Canadian registered adviser and/or dealer and, therefore, the analysts are not subject to supervision by a Canadian registered adviser and/or dealer, and are not required to satisfy the regulatory licensing requirements of the Ontario Securities Commission, other Canadian provincial securities regulators, the Investment Industry Regulatory Organization of Canada and are not required to otherwise comply with Canadian rules or regulations regarding, among other things, the research analysts' business or relationship with a subject company or trading of securities by a research analyst. This report is intended for distribution by ESL only to "Permitted Clients" (as defined in National Instrument 31-103 ("NI 31-103")) who are resident in the Province of Ontario, Canada (an "Ontario Permitted Client"). If the recipient of this report is not an Ontario Permitted Client, as specified above, then the recipient should not act upon this report and should return the report to the sender. Further, this report may not be copied, duplicated and/or transmitted onward to any Canadian person. ESL is relying on an exemption from the adviser and/or dealer registration requirements under NI 31-103 available to certain international advisers and/or dealers. Please be advised that (i) ESL is not registered in the Province of Ontario to trade in securities nor is it registered in the Province of Ontario to provide advice with respect to securities; (ii) ESL's head office or principal place of business is located in India; (iii) all or substantially all of ESL's assets may be situated outside of Canada; (iv) there may be difficulty enforcing legal rights against ESL because of the above; and (v) the name and address of the ESL's agent for service of process in the Province of Ontario is: Bamac Services Inc., 181 Bay Street, Suite 2100, Toronto, Ontario M5J 2T3 Canada. Disclaimer for Singapore Persons
In Singapore, this report is being distributed by Edelweiss Investment Advisors Private Limited ("EIAPL") (Co. Reg. No. 201016306H) which is a holder of a capital markets services license and an exempt financial adviser in Singapore and (ii) solely to persons who qualify as "institutional investors" or "accredited investors" as defined in section 4A(1) of the Securities and Futures Act, Chapter 289 of Singapore ("the SFA"). Pursuant to regulations 33, 34, 35 and 36 of the Financial Advisers Regulations ("FAR"), sections 25, 27 and 36 of the Financial Advisers Act, Chapter 110 of Singapore shall not apply to EIAPL when providing any financial advisory services to an accredited investor (as defined in regulation 36 of the FAR. Persons in Singapore should contact EIAPL in respect of any matter arising from, or in connection with this publication/communication. This report is not suitable for private investors.
Copyright 2009 Edelweiss Research (Edelweiss Securities Ltd). All rights reserved