asian agricultural markets: export potential for inland...
TRANSCRIPT

Asian agricultural markets: export potential for inland
N e w South Wales
Asian agricultural markets: .
export potential for inland N e w South Wales
Report by ABARE and AUSTRADE
May 1997
0 AUS? T R A D E ABARE

Asian agricultural markets: export potential for inland New South Wales, Report by ABARE and AUSTRADE, Canberra.
Australian Bureau of Agricultural and Resource Economics GPO Box 1563 Canberra 2601
Telephone (06) 272 2000 Facsimile (06) 272 2001 Internet http://www.abare.gov.au
ABARE is a professionally independent government economic research agency.

ASIAN AGRICULTURAL MARKETS
Summary
Over the past three decades the importance of the Asian markets have grown and they are
now the most important destination for many of the agricultural products grown in the
inland region of New South Wales. The importance of the Asian markets for farmers in this
region has been recognised by Senator the Hon David Brownhill, Parliamentary Secretary
to the Ministers for Trade and Primary Industries and Energy, and as a result ABARE and
Austrade collaborated on compiling this report.
The rapidly growing Asian markets offer considerable potential for expanding agricultural
trade. Indeed, many examples of growth in Asian imports of Australian agricultural
products were identified by Austrade officers in reviewing Asian import trends.
While there are indications of considerable oppo~tunities for exports of agricultural
products that are or could be produced in inland New South Wales, there are nevertheless
considerable hurdles to overcome in establishing and maintaining an export market in Asia.
Of particular importance are the trade barriers (tariffs and other trade measures) used in
various countries and the cultural differences between Asian countries and Australia. In
addition, the Asian market has become the focus of attention of many agricultural exporters
and prospective Australian exporters will need to compete with these exporters as well as
domestic Asian producers on quality, consistency of supply and price.

ASIAN AGRICULTURAL MARKETS
1 Introduction
The aim in this report is to provide to growers and marketers in inland New South Wales
an indication of the potential for growth in agricultural exports to markets in Asia. The
nature of agricultural production in inland New South Wales is outlined in the next section.
In section 3 the trends in Asian agricultural imports are discussed and detailed in an
extensive table compiled from information provided by Austrade officers based in various
Asian countries and from statistical and tariff data provided by the Department of Foreign
Affairs and Trade. As well as discussing the opportunities for Australian exports, in section
3 recognition is given to the need for market development by exporters and the potential
problems and trade baniers exporters may face. Finally, to assist those interested in
seeking further information or assistance in pinpointing export opportunities or developing
an export potential a list of contacts is given.
Table 1 : Agricultural exports to Asia: selected major commodities 1985-86 1990-91 1995-96 Main Asian market
kt k t k t
Wheat 6325 5564 7835 China Feed barley 745 559 na Japan Malting barley 157 824 na China Wool 255 278 324 China Beef and veal 123 31 0 460 Japan cotton 213 31 1 281 China Chickpeas 0 133 9 0 Pakistan Apples 1 1 12 2 0 Malaysia Pears 15 12 6 Singapore Cheese 19 3 2 6 5 Japan
Over the past three decades many Asian countries have experienced rapid economic
growth. Along with this growth, they are gradually liberalising their economies, which is
encouraging expansion of trade and an inflow of capital investment. Real incomes have
been rising more rapidly than in other regions and are likely to continue to grow strongly.
Furthermore, industrialisation and urbanisation are occurring rapidly. These factors have
contributed to a shift away from traditional diets toward more Western consumption
patterns. Consumption of non-traditional agricultural produce, such as wheat, beef and
barley has been increasing in these countries and Australian exports of such products to this
region have increased considerably over the past decade (Figures 1 and 2).

ASIAN AGRICULTURAL MARKETS
For many agricultural commodities, Asia has become increasingly important for Australian
exporters and has replaced traditional markets, such as Europe, as Australia's major export
destination (table 1 and figures 3 to 6). The importance of Asia in Australia's agricultural
exports is expected to grow in the future as import demand for food in the Asian region
continues to expand and further efforts are made by Australian exporters to secure market
share.
Figure 3: Top 6 fruit export Figure 4: Top 6 vegetable export
destinations 1988-89 to 1995-96 destinations 1988-89 to 1995-96
UK
US Hong Kong
Bangladesh Malaysia
Malaysia Germany
Japan Hong Kong
Singapore Singapore
India 0 100 200 300 400
0 100 200 $ million
$ million
Source: Mackay 1997 Source: Mackay 1997

ASIAN AGRICULTURAL MARKETS
In addition to raw agricultural produce, exports of Australian processed foods to Asia have
exhibited considerable growth in the past ten years. In 1995-96 nine out of Australia's top
twelve export destinations for highly processed foods were in the Asian region (table 2).
Japan was Australia's dominant export market in 1995-96, taking 28 per cent (almost $1
billion) of our total food and beverage exports (Rogers 1997).
Table 2: Top 12 export destinations for Australian
highly processed food products, 1995-96
1 Country Value of exports Share I
New Zealand
Philippines
1 Taiwan 238.2 6.9 1 I Hong Kong 21 1.9 6.2 1 ( Malaysia 205.3 6.0 1 1 Singapore 189 5.5 1 I Thailand 175.5 5.1 1 I Saudi Arabia 94.8 2.8 1 I United States 79.6 2.3 1 ( Indonesia 78.2 2.2 (
Republic of Korea 55.9 1.6
Total 3404.4 82.6
Source: ABS data prepared for the Australian Food Council

ASIAN AGRICULTURAL MARKETS
2 Inland New South Wales' diverse agricultural production
The inland region of New South Wales is one of Australia's most important and diverse
agricultural regions with the potential to grow all temperate crops, including those requiring
irrigation, and to produce a variety of livestock products. It covers the area west of the
Great Dividing Range to the southern, northern and western New South Wales borders.
Soil types and climatic conditions in the region vary enormously. Soils range from basaltic
and granitic in the eastern part of the region, through grey and brown heavy clays, red
brown earths, and sandy loarns further to the west. Rainfall ranges from up to 700
millimetres in the eastern part of the region to 400 millimetres in the south and as low as
200 millimetres in the far west.
Almost all of this region, except for the north western comer of the state is contained in the
Murray-Darling Basin. The Murray-Darling Basin contains 42 per cent of all Australian
farms and produces wool, wheat, cereals, sheep, cattle, dairy produce, cotton, rice,
oilseed, pulses, wine, fruit and vegetables. The New South Wales inland region accounts
for 56 per cent of the total Murray-Darling Basin and is used to grow all broadacre cereals,
oilseeds and pulses grown in Australia as well as the majority of irrigated commodities
grown in Australia, including cotton, rice, fruits and vegetables.
There are four major areas which make up the Inland New South Wales region. These are:-
north-western New South Wales, central western New South Wales, south western New
South Wales, which are all in the wheat sheep zone, and far western New South Wales,
which is in the pastoral zone. The wheat sheep zone has a climate and topography that
generally allows regular cropping in addition to the grazing of sheep and beef cattle on a
more intensive basis than the pastoral zone. The pastoral zone is characterised by extensive
grazing of native pastures and small scale cropping.
North Western New South Wales
This is the major producing area for wheat, barley, cattle and cotton. In 1993-94 two
million tonnes of wheat and half a million tonnes of barley were produced in north western
New South Wales. This sub region is also the major cotton producing area in Australia,
accounting for around 70 per cent of Australia's cotton production, as well as being a major
cattle producing region. In 1993-94 nearly half of the New South Wales inland regions'
cattle sales occurred here.
5

ASIAN AGRICULTURAL MARKETS
Australian broadacre zones and regions
2. North Western NSW
3. Central Western NSW
4. South Western NSW
Central Western New South Wales
This is the major producing area for wool, as well as being a major producer of wheat and
other cereals, cattle, and fruit and vegetables. Nearly 50 000 tonnes of wool were produced
in central New South Wales in 1993-94.
South Western New South Wales
Encompassing the Murray Irrigation Area, this area is the predominant producer within the
Western region of rice, fruit, wine and some vegetables. Almost all of Australia's rice is
grown in the three major irrigation areas within this region, these being the Munumbidgee
Irrigation Area, Colearnbally Irrigation Area, and the Murray Valley Irrigation Districts,
The Murrumbidgee Inigation Area is also Australia's second largest wine growing region.

ASIAN AGRICULTURAL MARKETS - - -
In addition 35 per cent of Australia's citrus production comes from south western New
South Wales, mainly in the form of Valencia oranges.
Far Western New South Wales
This area is situated entirely within the pastoral zone and is the least productive of the four
western areas due to the semi arid and arid nature of much of the land. The major
agricultural commodities within this region are lambs, wool, cattle, and wheat.
Table 3 : Major Agricultural commodities produced in Inland New South Wales
Commodity Production 1993-94 a Major area
Cattle/calves 1490 2
SheepAambs 16708 4
Wool 165 3
Wheat 5000 2
Barley 1300 2
Maize 93 4
Chickpeas 30 2
Field peas 35 4
Soy beans 42 4
Cottonseed 560 2
Rice 1000 4
Tomatoes 85 4
Onions 24 4
a. All tigum in '000 tonnes except cattlelcalves and Sheepnambs which are 'WO sales

ASIAN AGRICULTURAL MARKETS
3 Growth in Asian imports ,of agricultural products
Many of the agricultural commodities and processed food products for which Asian import
demand has been increasing are grown in the Inland New South Wales region. Table 4
illustrates the growth over the five years to 1995 in imports of a range of agricultural
products for individual Asian countries, both in total and for imports sourced from
Australia. The table was compiled by Austrade through their officers, based in countries
throughout Asia, who pinpointed which Australian commodities they believed to have the
greatest future import potential. This was based on import trends over the previous five
years and through market analysis and direct contact with importers.
For each of the commodities examined it is possible by using the table to examine the
overall change in agricultural imports by countries within the Asian region, and the change
in imports to these countries sourced from Australia. This illustrates which markets we
have lost or gained import market share, and those where Australia's import market share
has remained stagnant. For example, while Philippine cotton imports sourced from
Australia have increased by over 28 per cent in the five years to 1995, overall cotton
imports to the Philippines have increased by just 10 per cent during the same period.
Although imports have grown considerably for some products Australia has lost market
share to other agricultural exporters such as the US, Canada, New Zealand, South Africa
and South American countries. For example, while pear imports to Singapore have
increased by over 13 per cent in the 5 years to 1995, those sourced from Australia have
actually declined by nearly 18 per cent during this period.
It should be noted that this table only illustrates past trends and is not intended to be used as
a forecasting tool. Instead the table provides an indication of future potential for trade
between Australia and the Asian region for a broad range of agricultural commodities.
Also, for several of the major commodities grown in the New South Wales inland region,
including wheat, barley, and rice, single desk sellers such as the Australian Wheat Board
are used to market and export Australian produce and due to confidentiality Australian
export figures are unable to be presented.

ASIAN AGRICULTURAL MARKETS
Impediments to trade
From the table it can be seen that potential export markets exist for growers in the New
South Wales inland region for many agricultural products. However, it is also clear that
there are impediments and limitations to such trade. The onus is on the exporter to
undertake considerable research on identifying opportunities plus the impediments to trade
and to be aware that considerable market development is also necessary to establish and
maintain profitable trade with Asia. A brief overview of some of the impediments faced by
exporters to the Asian region is given below.
One of the major impediments for exports of Australian produce into the Asian market is
the high level of tariff protection which currently exists in many of the major Asian
importing countries. The effect of the tariff is to raise the price of the imported good in the
imported country. However, the level of tariff, or import duty, varies between commodities
and countries as illustrated in table 4. Several of Australia's major export markets
throughout Asia, including Indonesia, Thailand, The Philippines, and Taiwan have
maintained high levels of import duty for most commodities while others, such as Hong
Kong and Singapore have removed almost all tariff barriers for agricultural imports.
Tariff and non-tariff measures are used by the aforementioned countries as a means of
supporting domestic industries and minimising dependence on imported produce. In
general, the highest rates of import duty exist for fruits, vegetables, wine, bovine meat, and
processed juices and jams. However, as a result of the Uruguay round of negotiations
under the General Agreement on Tariffs and Trade import duties in all developing countries
in the Asian region are to be reduced by an average of 24 per cent by 2004, with minimum
cuts of 10 per cent for any specific agricultural commodity (Vanzetti et al. 1994). In
addition, further pressure for reductions in impediments to trade in the Asian region may
occur as a result of the World Trade Organisation round of negotiations due to commence
in 1999 and through regional groupings such as the Asia Pacific Economic Cooperation
(APEC). Any resulting reductions in tariffs or non-tariff barriers would assist in improving
export opportunities for Australia into the Asian region (see Implications of APEC for
Australian agriculture 1996).
When developing export markets within the Asian region, Australian exporters of
agricultural produce also need to consider the different import measures which exist in the
various Asian countries. These measures differ markedly between countries and products
ASIAN AGRICULTURAL MARKETS
and include:- health, food safety and technical standards, import and customs laws, import
licensing, exchange controls and voluntary restraint arrangements. In some instances these
are used to limit the quantity of imports which may enter a country or to increase the price
of imports in that country (Tarchalski et al. 1996). Many of these impediments are indicated
in table 4, however, this is not a comprehensive list and up to date complete information
should be obtained prior to commencing export market development (see the contact list at
the end of this report).
Market development
While the situation varies between commodities, continuity of supply and provision of
consistent high quality of the produce to meet Asian markets requirements must be
considered by Australian exporters. Considerable market research and development is
necessary on several key issues, such as quality, competitive pricing and cultural
differences.

ASIAN AGRICULTURAL MARKETS
Australian exporters to the Asian region need to be able to meet the volumes and continuity
of supply that is demanded by the Asian market. This may be achieved through cooperative
marketing schemes such as Riversun or focussing on meeting demand during the Asian off
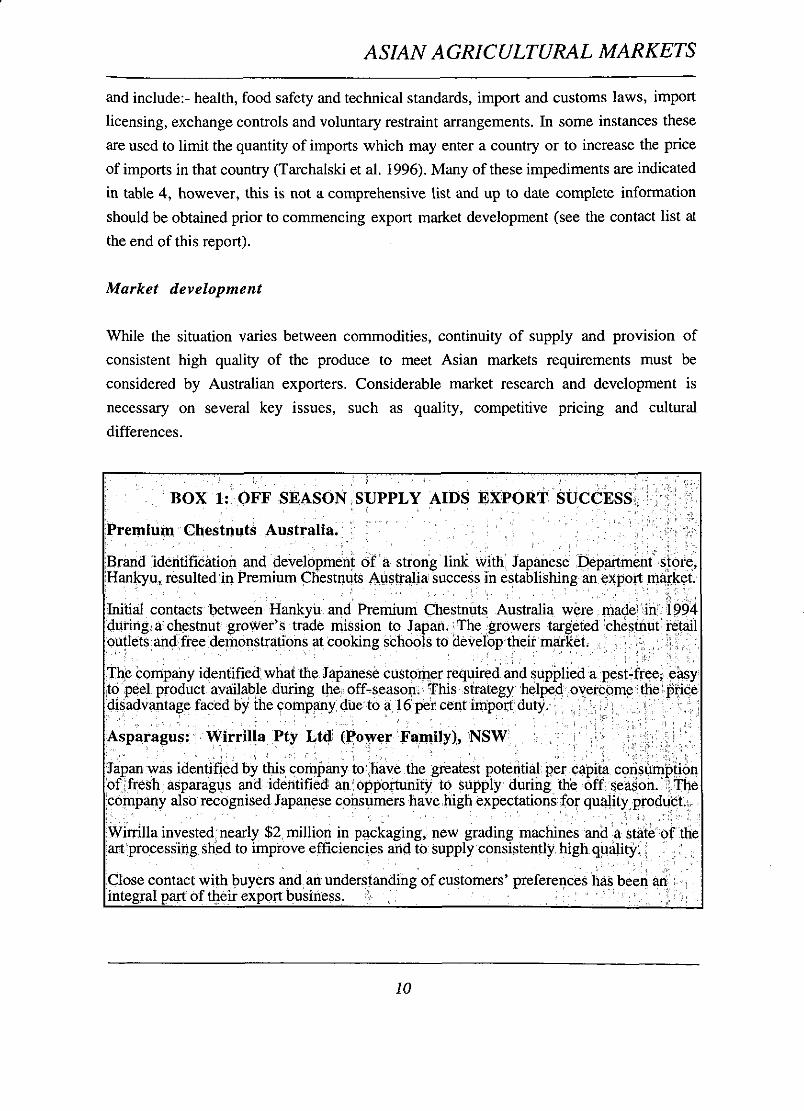
season as illustrated by the case studies in box I.
Consistent quality is a crucial concern in the Asian market. As a result quality control
through the entire growing and packaging process is very important for Australian
exporters (see box 2).
C r e q Gold Onions 'is'

ASIAN AGRICULTURAL MARKETS
Cultural differences need to be taken into account in conducting business. Cultural
differences may also necessitate different packaging and product development than for the
Australian market. In box 3 an example is given of how the differences in culture can
provide an export opportunity.
In conclusion, although past market trends indicate that substantial opportunities exist for
the export of Australian, and inland New South Wales, agricultural produce into the Asian
region, impediments to trade will still exist in the future. Furthermore, Australian exporters
will face strong competition from other agricultural exporters. It is important that this is
considered by Australian exporters when determining future export strategies for their
produce into the Asian region.

ASIAN AGRICULTURAL MARKETS
References
Mackay, A., Moody, J. and Petrushevski, N. 1997, 'The changing face of horticulture in
Australia-a statistical perspective', in Proceedings of MARE'S National Agricultural and
Resources Outlook Conference, Canberra, 4-6 February, Outlook 97, vol. 1, Agriculture,
pp 305-315.
Podbury, T., Ladlow, S., Mai, Y,. Atisuthaphot, A. and Rose, R. 1996, 'Implications of
APEC for Australian agriculture', in Proceedings of ABARE's National Agricultural and
Resources Outlook Conference, Canberra, 6-8 February, Outlook 96, vol. 1, Agriculture,
pp 29-46.
Rogers, M. 1997, 'Food markets-capturing emerging opportunities', in Proceedings of
MARE'S National Agricultural and Resources Outlook Conference, Canberra,
4-6 February, Outlook 97, vol. 1 , Agriculture, pp 27-37.
Tarchalski, T., Rees, R., Roberts, I., Cockinos, A. and Whish-Wilson, P. 1996,
'ASEAN wheat markets: prospects for their liberalisation', Australian Commodities,
vol. 3, no. 1, p. 63.
Vanzetti, D., Melanie, J. and Barry, G. 1994, 'South East Asia: agriculture post Uruguay
Round', Australian Commodities, vol. 1, no. 2, p 256.

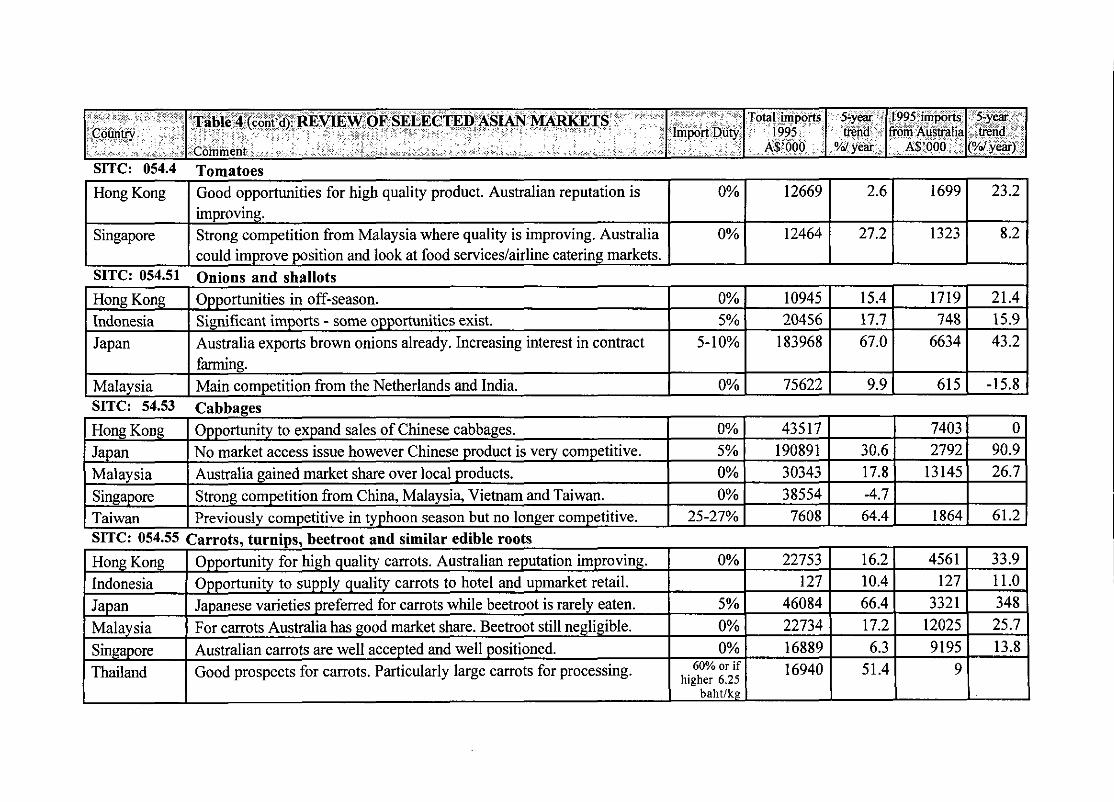
TABLE 4: REVIEW OF SELECTED ASIAN MARKETS FOR RURAL BASED PRODUCTS
5-year vend
(Yd year)
SITC: 054.1 potatoes
Japan Philippines SITC: 054.23
Japan
Malaysia
5-year trend
?'d year
Country
11.3 24.8
8.6
Philippines Singapore
1995 imports from Australia
AS'000
Import Duty Comment
demand, particularly chickpeas, field peas and pigeon peas, is likely to remain strong at about 3 million tonne a year. Excellent opportunities for Tyson chickpeas and Dun peas. Opportunities also for pigeon peas, green moong and black matpe. Fresh peas not permitted. Some potential for frozen peas. Potential for bulk dried green peas. Mainly from USA and Canada.
Total impons 1995
AS'000
-5.5 12.1 20.0
3.6
Hong Kong Malaysia Singapore
export. Significant market for dried mung beans. Not a big market. Singapore used to re-export to Indian subcontinent.
0% 5% 0%
1247 1927
12776
Opportunities in off-season. Australian potatoes premium priced but growing a market niche. Quality and price are important. Main competitors are China, the Netherlands and Indonesia. (Indonesia's data not captured.)
4 17 yenlkg
3%
6850 19345 11336
*52689 SITC: 054.21 Peas
I India ('94)* 1 Indian production of pulses is likely to fall short of demand so import
Other beans
20% 0%
13960 7661
71.1
-0.8
56107 16633
-7.9 -15.3
Broad beans prohibited. Demand for azuki, soy, red and other types for use in processed foods. e.g. tofu (soy), manju (red beans). Organic grown vegetables are also beginniig to gain wide market recognition. Mainly bulk imports and often reprocessed into canned products for
10.0
11.8
25.4 -9.3
289 829
417 yenlkg
0%
284
403
3150 51
-0.3 16.6
143767
21907
SITC: 054.4 Tomatoes
I Hong Kong I Good opportunities for high quality product. Australian reputation is I 0% I 12669 ( 2.6 1 1699 1 23.2 1
( farming. Malaysia ( Main competition from the Netherlands and India. S I X : 54.53 Cahhsoes
Singapore
SITC: 054.51
Hong Kong Indonesia Japan
Hong Kong I Opportunity to expand sales of Chinese cabbages. Japan I No market access issue however Chinese product is very competitive.
improving. Strong competition from Malaysia where quality is improving. Australia could improve position and look at food serviceslairline catering markets. Onions and shallots Opportunities in off-season. Significant imports - some opportunities exist. Australia exports brown onions already. Increasing interest in contract
Malaysia 1 Australia gained market share over local products. Singapon: 1 Strong competition from China, Malaysia, Vietnam and 'l'aiwan.
I Taiwan ( Previously competitive in typhoon season but no longer competitive. SITC: 054.55 Carrots, turnips, beetroot and similar edible roots Hong Kong I Opportunity for high quality carrots. Australian reputation improving. Indonesia ( Opportunity to supply quality carrots to hotel and upmarket retail. Japan I Japanese varieties preferred for carrots while beetroot is rarely eaten. Malaysia 1 For carrots Australia has good market share. Beetroot still negligible. Singapore I Australian carrots are well accepted and well positioned. Thailand I Good prospects for carrots. Particularly large carrots for processing.

>year trend
(Yd year)
SITC: 054.58 Mushrooms and truffles
Taiwan 1 Annual quota of 600 tonnes in 1997. May increase next year.
Counny
Malaysia Singapore
lmpon Duty Table 4 (cont'd): REVIEW OF SELECTED ASIAN MARKETS
Comment
0% I 11284 1 3.2 Hong Kong 6888 1 68.2
working with local Korean authorities, and two import agents. Australian citrus posing strong competition to USA and China. Emphasise quality and price. Competition from USA & South Africa.
Total imports 1995
AVO00
Limited demand for champignons.
2 32
9363 17548 7302
Japan SITC: 054.61
Hong Kong Japan
SITC: 057.1
Hong Kong Indonesia Japan
Korea
-38.8
-8.5 58.5 12.8
10% 0%
5-year trend
O/d year
1995 imports from Australia
A6'000
Good potential for small/brown mushrooms but price sensitive. 1 4.8-5% 1 403069 1 23.8 Sweet corn
58208 84680
16.1 8.9
8.7 74.6 10.4
98.7
Limited demand for sweet corn. Sporadic Australian exports. Good potential if the Australian industry were to focus on consistent supply and quality.
12.2 0.1
0% 12.5%
21928 19597
5922 79653
14.2 0.7
241 164 28767
263889
20827
Oranges, mandarins Opportunities to expand sales. Tough competition from USA. Australia is the dominant supplier of citrus. Recent market opening provides a good opportunity, however inconsistent Australian supply remains an issue (quality and volume). Expect improvement after market liberalised in July 1997. AHC are
0% 25% 18.4- 40% 50%
I I negotiated one-desk trading with Itochu who will purchase all 1 1 I I 1 I
Hong Kong Indonesia Japan
I I production for two years once quarantine restrictions are lifted in June I I I I I I
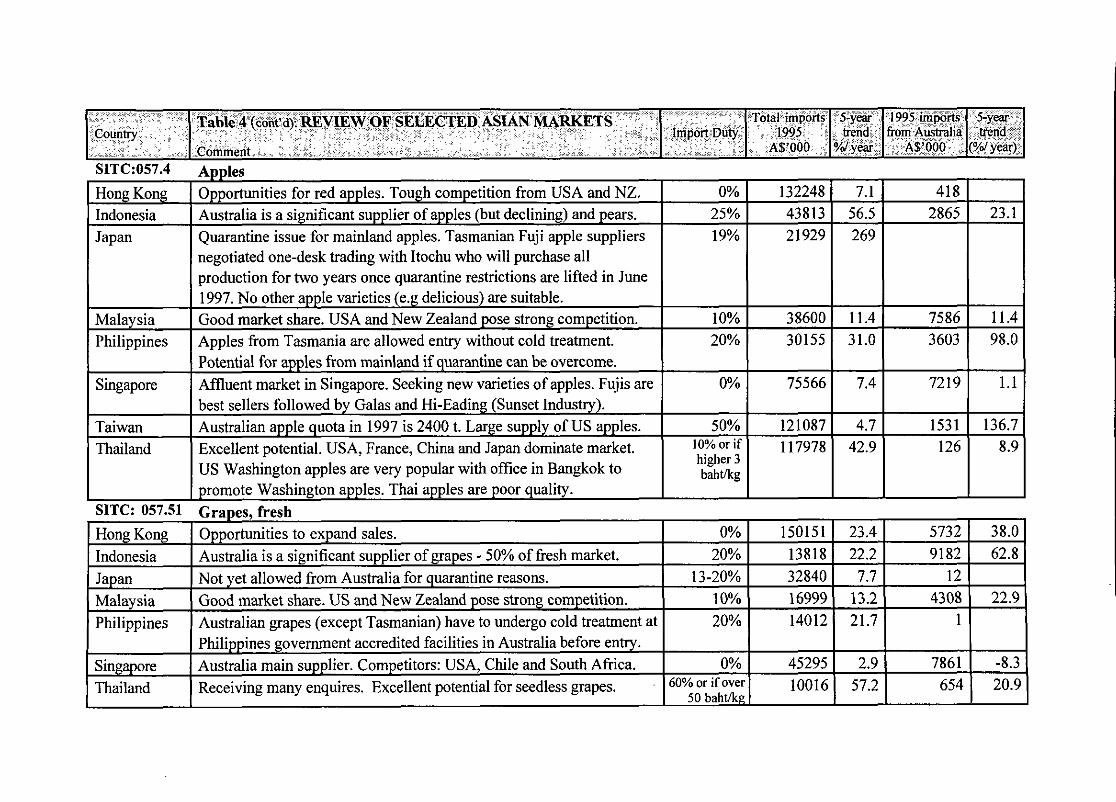
Opportunities foired apples. Tough competition from USA and NZ. Australia is a significant supplier of apples (but declining) and pears. Quarantine issue for mainland apples. Tasmanian Fuji apple suppliers
Malaysia Philippines
0% 25% 19%
Singapore
Taiwan Thailand
1997. No other apple varieties (e.g delicious) are suitable. Good market share. USA and New Zealand pose strong competition. Apples from Tasmania are allowed entry without cold treatment.
Singapore Thailand
132248 43813 21929
Potential for apples from mainland if quarantine can be overcome. Affluent market in Singapore. Seeking new varieties of apples. Fujis are best sellers followed by Galas and Hi-Eading (Sunset Industry). Australian apple quota in 1997 is 2400 t. Large supply of US apples. Excellent potential. USA, France, China and Japan dominate market. US Washington apples are very popular with ofice in Bangkok to promote Washington apples. Thai apples are poor quality.
10% 20%
- - Philippines government accredited facilities in Australia before entry. Australia main supplier. Competitors: USA, Chile and South Africa. Receiving many enquires. Excellent potential for seedless grapes.
7.1 56.5 269
38600 30155
0%
50% 10% or if higher 3 bahtlkg
SITC: 057.51 Grapes, fresh
75566
121087 11 7978
0% 20%
13-20% 1 OYO 20%
Hong Kong Indonesia Japan Malaysia Philippines
0% 60% or if over
50 bahtkg
418 2865
150151 13818 32840 16999 14012
Opportunities to expand sales. Australia is a significant supplier of grapes - 50% of fresh market. Not yet allowed from Australia for quarantine reasons. Good market share. US and New Zealand pose strong competition. Australian grapes (except Tasmanian) have to undergo cold treatment at
45295 10016
23.1

SITC: 057.76 Walnuts
( Hong Kong 1 Competition from USA and Chiia extremely strong. Some opportunities 1 OYO 1 102021 -16.3) 2 1
Counby
I repackaged resulting in a high price product. Australia has had some initial success with Chestnuts but Australian production problems mean I
Table 4 (cont'd): REVIEW OF SELECTED ASIAN MARKETS
Comment
Japan
I that export volume is currently small. I I I I I Taiwan I Potential if quality good and price competitive. SITC:057.91 Mplnns
..----mm"
Hon Kon -1 85461 6.2 7101 ( 12.6
Import Duty
to expand sales of almonds and cashews. Generally there is no bulk market for nuts in Japan. US and other suppliers do export nuts to the market, usually in bulk where they are
10%
Singapore
Total imports 1995
A$'000
1995 imports h m Australia
A$'000
5-year trend
'Yd year
50058
S I X : 057.92 Pears and quinces I Hong Kong I Strong competition from Chile. Opportunities for Packam pears and I 67728 1 -1.1 1 413 1 -40.4 1
Rockmelons are supplied to Singapore. Australia not competitive with Malaysia's honeydews and watermelons.
5-year m n d
('Yd year)
23.1
0%
368
39728 17.9 4055 24.1
. .
packaging. Opportunity if pursued especially 100% pure juice. Thailand Opportunity especially orange and apple juices. Thai companies now 30% or if
higher 10- 5119
manufacture with US oranges, hence market is more price sensitive. 25 b a h t k ~
- --
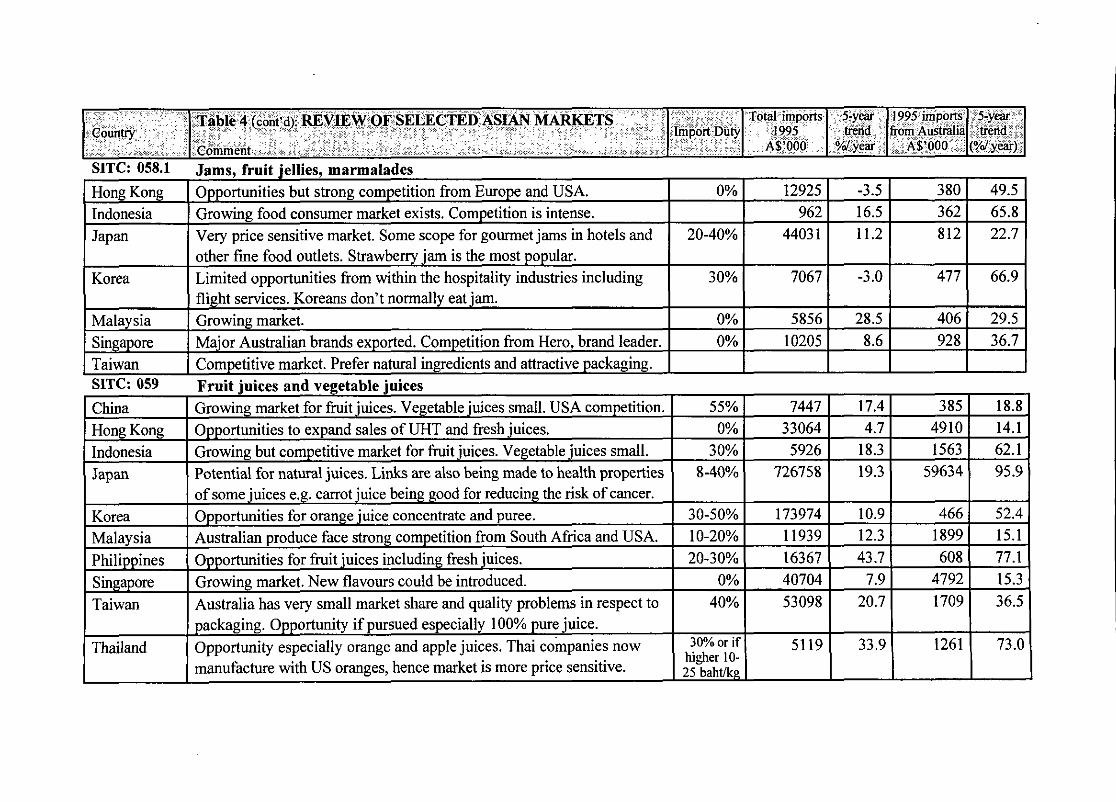
SITC: 058.1 Jams, fruit jellies, marmalades
1995 imports h m Australia
A6'000 Country
5-year bend
(Yd year)
Table 4 (cont'd): REVIEW OF SELECTED ASIAN MARKETS
Comment
Hong Kong Indonesia Japan
Korea
Malaysia Singapore Taiwan
5-year bend
Yd year Import Duty
0%
20-40%
30%
0% 0%
Opportunities but strong competition from Europe and USA. Growing food consumer market exists. Competition is intense. Very price sensitive market. Some scope for gourmet jams in hotels and other fine food outlets. Strawberry jam is the most popular. Limited opportunities from within the hospitality industries including flight services. Koreans don't normally eat jam. Growing market. Major Australian brands exported. Competition from Hero, brand leader. Competitive market. Prefer natural ingredients and attractive packaging.
'Total imports 1995
A6'000
12925 962
4403 1
7067
5856 10205
SITC: 059 Fruit juices and vegetable juices China Growing market for fruit juices. Vegetable juices small. USA competition. 55% 7447 Hong Kong Opportunities to expand sales of UHT and fresh juices. 0% 33064 Indonesia Growing but competitive market for fruit juices. Vegetable juices small. 30% 5926 J a ~ a n Potential for natural juices. Links are also being made to health properties 8-40% 726758

I I own label. I J SITC: 292.69 Other live plants including mushroom spawn Hong Kong I Opportunities to expand sales of selected potted plants. I 0% I 13680 1 13.6 1 30 1 35.1 Singapore I Availability of cheap sources from Malaysia. 0% I 23125 1 12.8 1 18 1 6.9
5-year trend
(Yd year)
SITC: 061.6 Natural honey
Japan
5-year trend
O/d year Counhy
10.2 -3.7
SITC: 292.71 Cut flowers
Singapore
1995 imports from Australia
A$'000 Import Duty
Table 4 (cont'd): REVIEW OF SELECTED ASIAN MARKETS
Comment
Japan
Total imports 1995
AS'000
21.9 2.6
Indonesia Japan Singapore
rising. Austrade is undertaking major promotions in this area. Australian native plants very popular but emphasis on quality and observing quarantine requirements. Opportunities for traditional cut flowers. Sales expansion in native flowers must be supported by market promotion. Peak buying period
, during festive seasons. Foliage for ornamental purposes Quarantine issues with seed pod bearing foliage otherwise some
295 359 30%
Market exists for consumer and industrial bulk product. Australia is currently supplying natural and organic natural honey. Australia is major supplier. Retailers packing Australian honey under
614
14
Hong Kong
Indonesia
614 55342
-12.7
7.1
0% Opportunities to expand sales of traditional cut flowers. Sales expansion in native flowers must be supported by market promotion. Imported cut flower market insignificant at present, but demand is
32102
86
3.0
-9.0
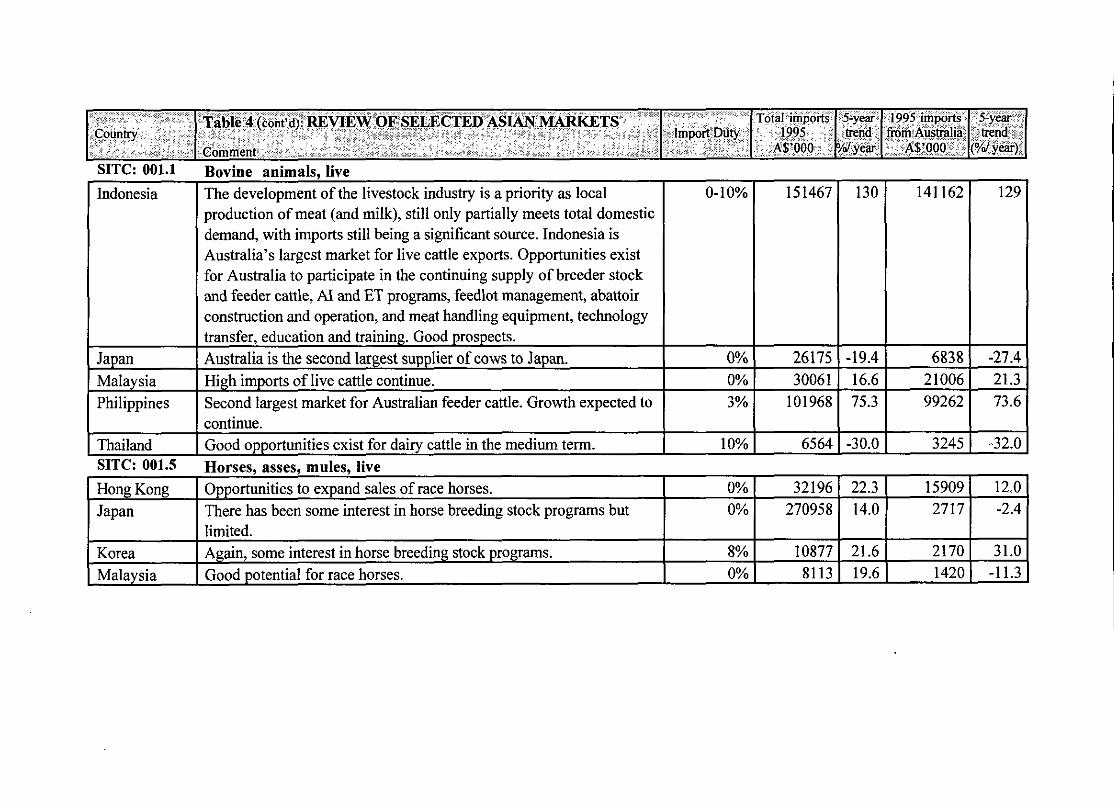
SITC: 001.1 Bovine animals, live r Indonesia I The development of the livestock industry is a priority as local 0-10% 1 1514671 130 1 141162 1 129 1
I production of meat (and milk), still only partially meets total domestic demand, with imports still being a significant source. Indonesia is I Australia's largest market for live cattle exports. Opportunities exist for Australia to participate in the continuing supply of breeder stock and feeder cattle, A1 and ET programs, feedlot management, abattoir
ear trend
year lmpoli Duty Country
Table 4 (cont'd): REVIEW OF SELECTED ASIAN MARKETS
Comment
1995 imports from Australia
A6'000
Japan
5-year trend
(O'dyear)
-
Malaysia I High imports of live cattle continue.
Korea I Again, some interest in horse breeding stock programs. 8% 1 108771 21.6 1 21701 31.0 Malaysia 1 Good potential for race horses. I 0% 1 8113 1 19.6 1 1420 1 -11.3
construction and operation, and meat handling equipment, technology transfer, education and training. Good prospects. Australia is the second largest supplier of cows to Japan.
0% I 30061 1 16.6 1 210061 21.3
I continue. I I I I I Philippines I Second largest market for Australian feeder cattle. Growth expected to I 3% 1 101968 1 75.3 1 99262 1 73.6
Thailand I Good opportunities exist for dairy cattle in the medium term.
0%
10% 1 6564 1 -30.0 1 3245 1 -32.0 SITC: 001.5 Horses, asses, mules, live Hong Kong I Opportunities to expand sales of race horses. I 0% I 32196 1 22.3 1 15909 1 12.0 Japan I There has been some interest in horse breeding stock programs but 270958 1 14.0 1 2717 1 -2.4
26175 -19.4 6838 -27.4 .
5-year trend
(Yd year)
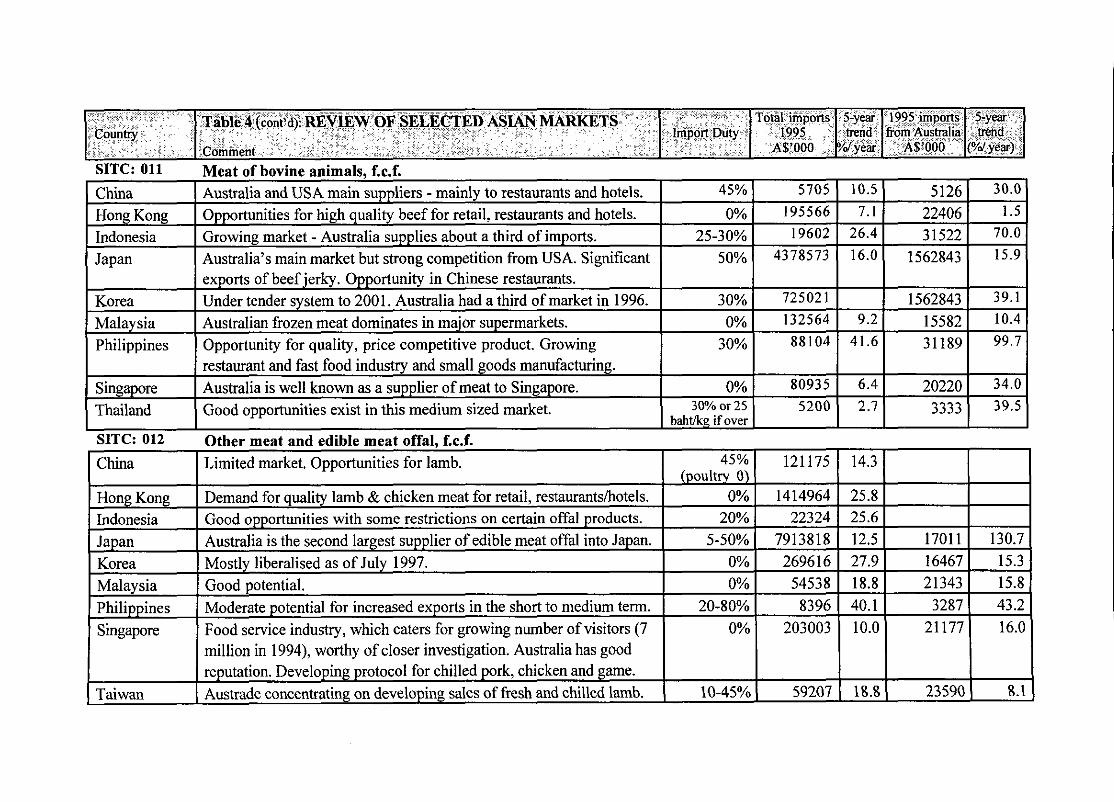
SITC: 011 Meat of bovine animals, f.c.f.
1995 imports from Australia
A%'000
Korea Malaysia Philippines
SITC: 012 Other meat and edible meat offal f.c.f.
Counhy
Singapore Thailand
Import Duty Table 4 (cont'd): REVlEW OF SELECTED ASLAN MARKETS
Comment
10.5 7.1
26.4 16.0
China Hong Kong Indonesia Japan -
exports of beef jerky. Opportunity in Chinese restaurants. Under tender system to 2001. Australia had a third of market in 1996. Australian fkozen meat dominates in major supermarkets. Opportunity for quality, price competitive product. Growing
5-year trend
year
45%
0% 25-30%
50%
Australia and USA main suppliers - mainly to restaurants and hotels. Opportunities for high quality beef for retail, restaurants and hotels. Growing market - Australia supplies about a third of imports. Australia's main market but strong competition from USA. Significant
restaurant and fast food industry and small goods manufacturing. Australia is well known as a supplier of meat to Singapore. 0% 80935
Good o~~or tuni t ies exist in this medium sized market. 30% or 25 5200
5126 22406 31522
1562843
5705 195566
19602 4378573
30% 0%
30%
30.0 1.5
70.0 15.9
6.4 2.7
725021 132564 88104
20220 3333
9.2 41.6
34.0 39.5
1562843 15582 31189
39.1 10.4 99.7
sources. I I I I I Niche market but demand for delicacies and smallgoods growing. 0% I 6401 ( 8.1 1 51 1 -0.9
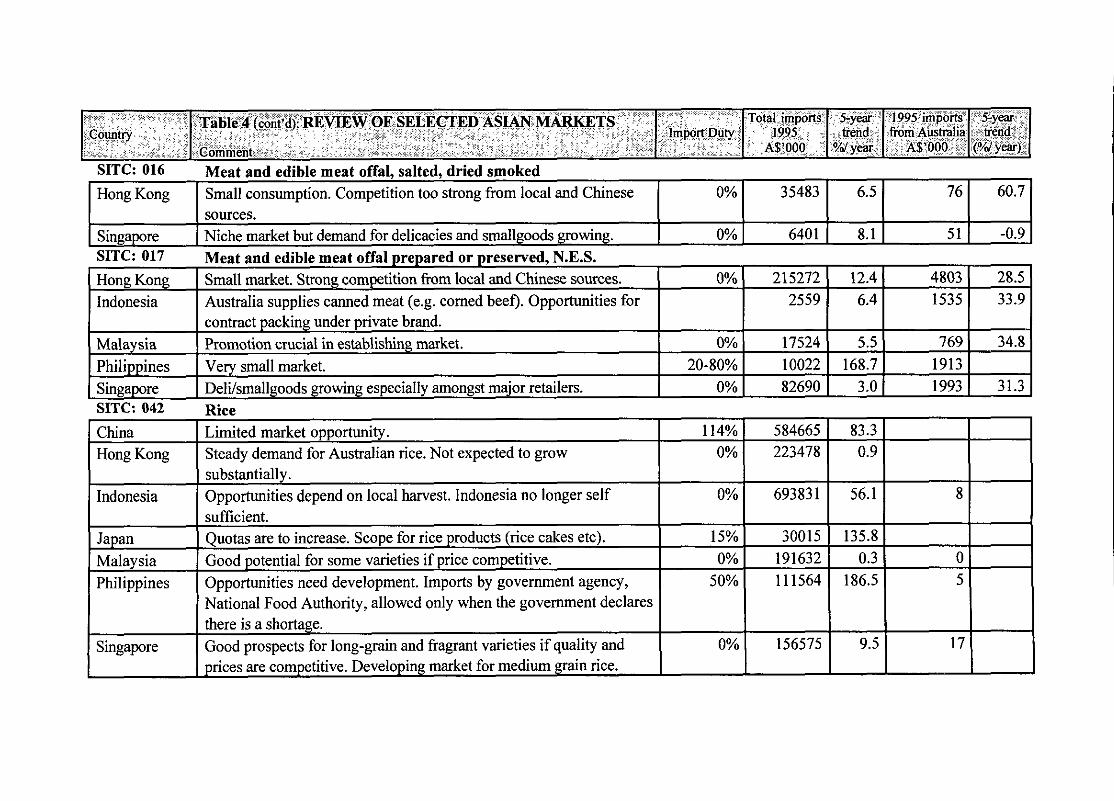
SITC: 016 Meat and edible meat offal, salted, dried smoked
SITC: 042
China Hong Kong
Indonesia
I Hong Kong I Small consumption. Competition too strong fiom local and Chinese ( 0%
Japan Malaysia Philippines
76 35483 1 6.5
Singapore
60.7
Rice Limited market opportunity. 114% Steady demand for Australian rice. Not expected to grow 0% substantially. Opportunities depend on local harvest. Indonesia no longer self 0%
Quotas are to increase. Scope for rice products (rice cakes etc). 15%
Good potential for some varieties if price competitive. 0%
Opportunities need development. Imports by government agency, 50% National Food Authority, allowed only when the government declares there is a shortage. Good prospects for long-grain and fragrant varieties if quality and 0% prices are competitive. Developing market for medium grain rice.

SITC: 043 Barley
1995 imports from Ausnalia
A$'000
5-year Import Duty trend
year Country
SITC: 045 Other cereals
5-year trend
(O/d year)
Table 4 (cont'd): REVIEW OF SELECTED ASIAN MARKETS
Comment
SITC: 044 Maize
20.3 6.6 7.6
China Japan Korea
8 25
91.2% 46 yen/Kg
5-30%
Australia is major supplier - especially malting barley. Exports are already occurring for use in the alcohol brewing industry. Under quota.
3% 0%
0% 0%
106 yeniKg
0% 40% or if over 2.75 baht1Kg
876291 273.4) I 5861361 -4.11 127111 -21.7
China ( High potential as China needs to increase livestock feed. Japan I Australia exports buckwheat and buckwheat noodles to Japan. SITC: 046 Meal and flour of wheat and flour of meslin
324391 387965 20267
70579 58897
46918 9079
Hong Kong Indonesia
Japan
Singapore Thailand
Competition too strong from Asian suppliers and local flour industry. Due to the large growth in the market for instant noodles, cakes and biscuits, consumption of wheat flour risen by 14% a year since 1990. Accordingly, the government has raised the number of companies permitted to produce wheat flour. Australia is main supplier of wheat. USA is exporting frozen pancake and waffle mixtures for processing. Opportunities for Australian companies to export similar products. Australia, Canada and USA supplies wheat to one flour miller - Prima.
Good potential.
8.4 31.4
12.0
6.4 -7.8
1424 249
243 556
-8.4 29.4
59.3
39.7 6.5

I suppliers. Indonesia I Malt - For brewing - opportunities exist
SITC: 048 Cereal preparations including malt, macaroni
( Macaroni - Local production + some imports. Japan I Dry pasta (including macaroni, spaghetti) are already exported from
China Hong Kong
Australia to Japan. Very competitive market. Catering and institutional players are also interested in importing frozen macaroni and other
Malt - particularly for brewing. Little demand locally in HK. Macaroni - growing demand. Competition strong from European
I pasta. Korea I Malt - some opportunities. Koreans are large beer consumers. Growing
Malaysia
Philippines
market. Malt - Australia enjoys major market share for beer processing. Macaroni - Strong competition from Italy. Malt - big market. Australia already a major supplier of malt to local
Singapore Thailand 8944481 20.8 ( 7678 ( 110.8 1
higher 10.00
breweries. Malt - cereal in breakfast is a growing market. Malt - Good potential. Many breweries have established production facilities in Thailand, includes Heineken, Carlsberg (opening plant NO.^), Klosters. Macaroni - Small but growing potential.
Import Duly 1995 imports
from Australia A$'000
5-year trend
(W year)
Total imports
1995 A$'000
5-year trend
Yd year

I orders. Taiwan 1 Australian product higher priced than other imports, due to cost of I 0%) 50770) 41.11 531 1 162.1
S I X : 081.1 Hay and fodder
I I shipping. I SITC: 08.11 Cereal straw and husks
) Japan 1 Australia exports here are connected to Hay Joint Action Group I 0%1 119488) 7.2) 172 1 I
1995 impons from Ausbalia
A6'000 Country
5-year trend
(?/d year) Import Duty
Table 4 (cont'd): REVIEW OF SELECTED ASIAN MARKETS
Comment
Japan I Austrade helped establish Hay Joint Action Group which secured 5.0 0% ( 920945
SITC: 081.3 Oil-cake and other solid residues from oilseeds
Total imports
1995 AS'OOO
5-yew trend
Yd year
42731
25
-4.5
Indonesia Malaysia Philippines
5% 0%
3-30%
Opportunities exist. Major competition from local palm oil industry. Small market with China and Hong Kong as major suppliers.
282624 146286 275590
28.6 22.3
7.8

t. a"<~S~* ,$ , , , ."," ..*<" .,,,: >,..>
'Country ?':.,
,~ " . , . . . ,. . ,. , . , , - ~
. . " n: _"). .-
SITC: 112.1
Indonesia
Japan
Korea
Malaysia I-- Philippines t- Singapore
1 Thailand
Wine Opportunities to expand sales. Australia has a significant share of the market, particularly in Bali, but heavy restrictions exist on the development of this trade in Indonesia. There is currently a wine consumption boom in Japan. Greater coordination, focus and resources needed in wine promotion to gain significant market share. Whilst wine consumption is still small in Korea, significant potential exists for Australia to increase its market share as wine appreciation continues to grow at the quality end of the market. Domestic growth 40% per annum. Strong increase in volumes from Australia.
Market for Australian wine is small as Filipinos prefer beer to wine. Target market would be expatriates, young urban professionals and high income group. Market for Australian wines is steadily growing (S$6 million current year - double that of 5 years ago). 200% growth in Australian sales in each of the last two years to about 2% of the market in 1996. US wine had 45% and France 29%. Excellent prospects for growth, especially for red wine. Opportunities for Australian suppliers due to strong market growth. But future growth may be slowed if another excise tax increase of 10% is imposed following the increase in excise tax to 40% in August 1996.
RM354 Per Da1(100%
Vol Per Lihe
higher 20.00

SITC: 222.1 Ground nuts Japan I Limited market opportunity for organic product. Food safety issue. 726 yenlkd 53419 1 -6.5 ( 31 1 Philippines I Significant opportunities particularly as ingredient for ice cream, biscuit I 30% 1 46192 1 55.5 1 - - - . . I and confectionery products. Principal source is China. Singapore 1 Limited opportunity. Strong prices from Malaysia and China. 0% I 57474 1 6.3 1 135 1 6.3
SITC: 222.7 Safflower seeds Japan I Limited market opportunity for organic product Food safety an issue. I OYo 1 36833 1 8.6 1 2167 1 9.6 1