asia-pacific wealth report(2010)
TRANSCRIPT

8/8/2019 Asia-Pacific Wealth Report(2010)
http://slidepdf.com/reader/full/asia-pacific-wealth-report2010 1/32
AaPa Wealth rept
2010

8/8/2019 Asia-Pacific Wealth Report(2010)
http://slidepdf.com/reader/full/asia-pacific-wealth-report2010 2/32
State of Asia-Pacific Wealth 4
2009 in Review: Asia-Pacific Showed Resilience in the Face 8
of the Global Downturn
Asia-Pacific HNWIs Favored Equities and Real Estate 14
in Portfolios in 2009
Real Estate Was a Preferred Financial Investment 18
for Asia-Pacific HNWIs in 2009
Asia-Pacific HNWIs Seek Out Tangible-Asset Investments 21
Spotlight: Wealth Management Firms in Asia-Pacific Face 24
Unique Challenges in Adapting Their Strategies to Meet
New Client Demands
Methodology 30
Contnts

8/8/2019 Asia-Pacific Wealth Report(2010)
http://slidepdf.com/reader/full/asia-pacific-wealth-report2010 3/32
TO OUR READERS,
Capgemini and Merrill Lynch Global Wealth Management ar plasd to prsnt th 2010 Asia-Pacific Wealth Report ,
or fifth annal in-dpth look at th hih nt worth (HNW) marktplac in th rion. Th rport bilds on th sccss
of th World Wealth Report , now in its 14th yar. Both rports ar th rslt of an xtnsiv collaboration btwn or two
firms, stdyin th ky trnds that affct hih nt worth individals (HNWIs).
Th past yar, 2009, saw a rsrnc in th nmbr and walth of Asia-Pacific HNWIs that fw miht hav prdictd jst a yar bfor. Bt whil many Asia-Pacific markts srd back to lif in 2009, th fallot from th crisis is vidnt
in HNWIs’ nw invstmnt bhaviors and attitds.
This rport xamins th post-crisis shifts in HNWIs’ asst allocations, rflctin an asin of crisis fars and a
catios rtrn to markts. Bt it also looks bhind ths spcifics at th mor fndamntal chans in HNWIs’
invstmnt prioritis.
W find that Asia-Pacific HNWIs, mch lik thir contrparts lobally, want to bttr ndrstand xactly what thy ar
invstin in, whr it is hld and how it is vald, and thy ar dmandin mor val-addd advic and invstmnt
options that proprly alin with thir risk profils and invstmnt oals. For walth manamnt firms, ths nds
translat into nw dmands—and crat challns that ar niq to th Asia-Pacific rion.
W look in particlar at how nw HNW-clint dmands ar pttin intns prssr on prodct and srvic offrins
and clint srvicin modls—and ndrscorin th critical shorta of walth manamnt capabilitis in th rion.
Manain this prssr, and implmntin nw clint-drivn stratis ffctivly, will b critical as walth manamnt
firms position thmslvs to captr th normos potntial that still lis ahad in Asia-Pacific.
It is a plasr to prsnt this yar’s rport, and w hop yo draw val from its insihts.
Asia-Pacific Walth Rport
Sallie Krawcheck
President, Global Wealth &Investment ManagementBank o America
Bertrand Lavayssière
Managing DirectorGlobal Financial ServicesCapgemini
8/8/2019 Asia-Pacific Wealth Report(2010)
http://slidepdf.com/reader/full/asia-pacific-wealth-report2010 4/32
4 2010 AsiA-PAcific WEALTH rEPorT
1 HNWIs are defined as those having investable assets of US$1 million or more, excluding primary residence, collectibles, consumables and consumer durables
ASIA-PACIFIC HNWI POPULATION RECOUPED CRISIS-RELATED LOSSES
Hon Kon and India witnssd th stronst HNWI-
poplation rowth (104.4% and 50.9% rspctivly),followd by Taiwan (42.3%), rcovrin most of thlosss mad in 2008. In 2008, th HNWI poplationsof Hon Kon and India had xprincd th larstprcnta dclins in th rion.
Japan and China still hav th larst HNWI
poplations in th rion. Japan alon accontd for54.6% of Asia-Pacific HNWIs, down only marinally from 56.8% in 2008.
Region’s HNWIs and Their Wealth Are StillHighly Concentrated
Th top thr markts—Japan, China and Astralia—accontd for 76.1% of th Asia-Pacif ic HNWIpoplation and 70.0% of its walth in 2009 (s Fir2). Japan and China tothr accontd for 70.4% of totalAsia-Pacific HNWI poplation and 64.6% of its walthat th nd of 2009, p from 51.8% and 62.8% rspctivly a yar bfor.
Asia-Pacific’s population of high net worth individuals (HNWIs1 ) grew substantially in size and wealth in
2009, rebounding beyond levels seen in 2007 before the financial crisis. The HNWI population and itswealth gained 25.8% and 30.9% respectively, since 2008. By the end o 2009, there were some 3.0 million Asia-Paciic HNWIs, equaling the number in Europe or the irst time, and their wealth totaled US$9.7 trillion.
Hong Kong and India, which experienced the world’s largest declines in HNWI population and wealth in
2008, experienced the strongest resurgence in 2009. The population o HNWIs grew 104.4% in Hong Kong,almost reaching pre-crisis levels, and 50.9% in India. HNWI wealth in Hong Kong and India jumped 108.9% and53.8% respectively amid strong growth in both market and macroeconomic drivers o wealth.
The Asia-Pacific HNWI population and wealth remain highly concentrated. Japan, China and Australiatogether accounted or 76.1% o Asia-Paciic’s HNWI population in 2009, down only slightly rom 77.4% in 2008.Japan and China commanded around 65% o total Asia-Paciic HNWI wealth.
Stat of Asia-
Pacific WalthStat of Asia-Pacific Walth
Asia-Pacific HNWI Segment Showed
Substantial Gains Th Asia-Pacific HNWI poplation rw 25.8% to som3.0 million in 2009 (s Fir 1), catchin p witherop for th first tim, aftr fallin 14.2% in 2008.HNWI walth ros 30.9% to uS$9.7 trillion, mor thanrasin 2008 losss, and srpassin th uS$9.5 trillion in walth hld by erop’s HNWIs in 2009. Th rcovry was fld by strnth in both macroconomic andmarkt drivrs of walth (see “2009 in Review” ).
Rional-spcific f indins for 2009 incldd thfollowin:
Th HNWI poplations of all major Asia-Pacific
HNWI markts xcpt Hon Kon mor thanrcopd th sharp losss of 2008 to nd th yar atlvls jst abov thos sn in 2007.
Th thr Asia-Pacific markts that witnssd th
larst ains in HNWI walth wr Hon Kon(108.9%), India (53.8%) and Taiwan (49.6%).

8/8/2019 Asia-Pacific Wealth Report(2010)
http://slidepdf.com/reader/full/asia-pacific-wealth-report2010 5/32
52010 AsiA-PAcific WEALTH rEPorT
sTATE of AsiA-PAcific WEALTH
FIguRe 1. Asia-Paciic HNWI Population, 2006–2009 (by Market)
(000s)
2009200820072006
1,484
343
15799
88
20
100
117
149
138
154
169
118123
96
12910584
413
364
477
174
1271278382
1,5171,366
1,650
24
24
19
6668
7871
36
44
5076
42376158
2.6m 2.8m 2.4m 3.0m
CAGR 2006–2008 -3.4% Growth 2008–2009 25.8%
Number
of
HNWIs
(000s)
0
500
1,000
1,500
2,000
2,500
3,000
Other Markets 11.1%
Indonesia 28.3%
Taiwan 42.3%
Singapore 32.7%
Hong Kong 104.4%
Thailand 19.6%
India 50.9%
Japan 20.8%
China 31.0%
Australia 34.4%
South Korea 21.2%
Annual Change
2008−2009
Note: (a) All chart numbers are rounded; (b) “Other Markets” includes Kazakhstan, Malaysia, Myanmar, New Zealand, Pakistan, Philippines, Sri Lanka and VietnamSource: Capgemini Lorenz curve analysis, 2010
FIguRe 2. Distribution o Asia-Paciic HNWI Wealth, 2009 (by Market)
(%)
Total: US$9.7 Trillion
40.3%
24.3%
5.4%
4.9%
3.5%
2.7%
2.4%
0.8%
3.9%
3.8%
7.8%
Japan 3,892
China 2,347
Singapore 369
India 477
Australia 519
South Korea 340
Other Markets 749
Indonesia80
Thailand 232
Taiwan 264
Asia-Pacic HNWIWealth by market, 2009
Annual Change2008–2009
(US$ billion)
Hong Kong 379
22.4%
40.4%
35.6%
53.8%
36.7%
23.2%
11.6%30.6%
22.2%
49.6%
108.9%
Note: (a) All chart numbers are rounded; (b) “Other Markets” includes Kazakhstan, Malaysia, Myanmar, New Zealand, Pakistan, Philippines, Sri Lanka and VietnamSource: Capgemini Lorenz curve analysis, 2010

8/8/2019 Asia-Pacific Wealth Report(2010)
http://slidepdf.com/reader/full/asia-pacific-wealth-report2010 6/32
2010 AsiA-PAcific WEALTH rEPorT6
sTATE of AsiA-PAcific WEALTH
Japan is by far th larst sinl HNWI markt inAsia-Pacific. Alon it accontd for 54.6% of thAsia-Pacific HNWI poplation and 40.3% of its walth at th nd of 2009. Howvr, rowth in Japan’sHNWI smnt was modst compard with othrmarkts in th rion, d to th slowdown in Japan’s
macroconomic rowth and th rlativly wak prformanc of its stock markts. Japan’s qity-marktcapitalization ros jst 6.1% in 2009 compard with anavra of 87.9%2 across othr Asian markts. ThHNWI poplation rw 20.8% to 1.7 million and walth ros 22.4% to uS$3.9 trillion.
China rmaind th scond-larst HNWI bas in thrion, with 477,000 HNWIs, p 31.0% from thprvios yar. Stock-markt capitalization in Chinasoard mor than 100% in 2009, as th conomy rw ata rapid 8.6% pac.
Astralia, which still has th third-larst HNWIpoplation amon Asia-Pacific markts, boncd back in 2009 aftr many of thos who had falln into th“mass afflnt”3 catory in 2008 raind thirHNWI stats. Movmnt in and ot of th HNWIcatory is rlativly frqnt in Astralia, whr 91.1%of all HNWIs ar in th lowst (uS$1 million–uS$5million) walth band.
In India, th HNWI poplation and its walth rw
50.9% and 53.8% rspctivly in 2009, mor thanrcopin th losss of 2008, with rsrnt stockshlpin to driv th rcovry. India’s stock-marktcapitalization mor than dobld in 2009 aftr droppin64.1% in 2008. Importantly, thoh, HNWI walth wasalso drivn in India by th strnth in th ndrlyinconomy, which rw 6.8% in 2009.
Taiwan’s HNWI poplation also showd on of thsharpst rowth rats in th rion (42.3%) aftr TaiwanStock exchan capitalization jmpd 84.5%. Thatsharp incras was fld by nws that Taiwan and
China wr notiatin a financial mmorandm of ndrstandin (Mou) that wold lad to ratrcross-straits coopration on trad and invstmnt andlibralization of financial markts.
Hong Kong Saw Strong Gains but Could NotRecoup the Record Losses of 2008
Th HNWI poplations of Hon Kon and Indiaxprincd th stronst rowth in nmbrs and walthin th world in 2009, bt thos ains had followd th
world’s larst dclins in 2008. In India, th HNWIpoplation and its walth flly rcovrd to pr-crisislvls, bt in Hon Kon, th nmbr of HNWIs at thnd of 2009 was still only 79% of th nmbr at th ndof 2007, bcas th starin dclins of 2008otwihd th hfty ains of 2009.
Hon Kon’s HNWI rcovry in 2009 followdsinificant ains in th ky markt drivrs of walth,particlarly qitis and ral stat. Hon Kon’spoplation of HNWIs is spcially snsitiv to pricmovmnts in ths asst classs for a nmbr of rasons.
For on thin, thy hold most of thir walth in ths twoasst classs. In fact, of all Hon Kon HNWI assts in2009, 52% was hld in ithr qitis or ral stat—andanothr 6% was in th form of altrnativ invstmnts. Allthr of ths asst classs tnd to b volatil, rsltin inpotntially lar swins in HNWI walth lvls.
Hon Kon’s HNWI nmbrs also tnd to flctat widly bcas a sinificant nmbr of Hon Kon HNWIs ar inth uS$1 million–uS$5 million walth band. As a rslt, whn asst prics plnd in 2008, many HNWIs in thislowr band qickly droppd into th “mass afflnt”
brackt—bt thn jst as qickly raind thir HNWIstats as asst prics rcovrd in 2009.
Ultra-HNWI Ranks and Wealth Showed Hefty Gains in 2009
Th Asia-Pacific ultra-HNWI4 poplation and its walth xpandd 36.7% and 42.6% rspctivly in 2009(s Fir 3), postin ains that far xcdd th avrarowth amon th nral HNWI poplation.
At th nd of 2009, ultra-HNWIs rprsntd only 0.6%of th total Asia-Pacific HNWI poplation, clos to th
lobal ultra-HNWI/HNWI ratio, bt accontd for24.5% of total HNWI walth in Asia. That is lss thanth lobal avra of 35.5%, bt is consistnt withhistorical trnds. Of th rion’s ultra-HNWIs, 57.0% wr from Japan and China.
2 World Federation of Exchanges, 2010; Capgemini analysis, 20103 The “mass affluent” are defined as individuals with investable assets of US$100,000 to US$1,000,000
4 Ultra-HNWIs are defined as those having investable assets of US$30 million or more, excluding primary residence, collectibles, consumables, and consumer durables

8/8/2019 Asia-Pacific Wealth Report(2010)
http://slidepdf.com/reader/full/asia-pacific-wealth-report2010 7/32
2010 AsiA-PAcific WEALTH rEPorT 7
sTATE of AsiA-PAcific WEALTH
China and India Are Expected to Be the Fastest-Expanding Asia-Pacific HN WI Segments inComing Years
Emerging Asia (China, India, Indonsia and Thailand)is fast bcomin th main nin of rowth in thAsia-Pacific rion (see “2009 in Review” ), and its HNWIpoplation showd robst rowth of 33.2% in 2009, with walth p 40.4%. goin forward, China and India arlikly to rmain th fastst-rowin HNWI smnts inth world, basd on th positiv otlook for markt andmacroconomic drivrs of walth for thos conomisand th Asia-Pacific rion as a whol.
Fastr conomic rowth and th rsltant improvmntin bsinss conditions shold propl xpansion in thHNWI smnt sinc bsinss ownrship and incomtothr accont for th majority (73%) of all HNWI walth in Asia-Pacific xcldin Japan.
elswhr in Asia-Pacific, Newly Industrialized Asia (Sinapor, Hon Kon, Taiwan and Soth Kora) saw th fastst rowth in HNWI poplation and walth in2009 (40.4% and 49.2% rspctivly), mostly bcas of Hon Kon and Taiwan. Th rowth in th Nwly Indstrializd conomis is likly to modrat somwhat,and b otpacd by th rowth in HNWI walth inemrin Asia. In Industrialized Asia (Astralia, Japan
and Nw Zaland), th HNWI poplation and its walth ar likly to kp rowin, bt at a slowr pacthan in th rst of th rion. In 2009, th HNWIpoplation in Indstrializd Asia rw 21.9%, whil its walth ros 23.8%.
FIguRe 3. Number o HNWIs by Wealth Band, 2008–2009 (Global and Asia-Paciic)
Source: Capgemini Lorenz curve analysis, 2010
Number oIndividuals 2009
HNWI PopulationGrowth 2008–2009
HNWI WealthGrowth 2008–2009
% o Total HNWIWealth 2009
Global Asia-
PacifcGlobal
Asia-
PacifcGlobal
Asia-
PacifcGlobal
Asia-
Pacifc
93.1k(0.9%
o Total)
19.6k(0.6%
o Total)19.4% 36.7% 21.5% 42.6% 35.5% 24.5%
896.9k(8.9%
o Total)
240.9k(8.0%
o Total)18.4% 31.9% 18.3% 32.0% 21.9% 23.9%
9,053.4k(90.1%o Total)
2,761.9k(91.4%o Total)
16.9% 25.3% 17.1% 25.9% 42.6% 51.6%US$1m–US$5m
Millionaire “Net Door”
US$5m–US$30m“Mid-Tier Millionaire”
>US$30mUltra-HNWI

8/8/2019 Asia-Pacific Wealth Report(2010)
http://slidepdf.com/reader/full/asia-pacific-wealth-report2010 8/32
8 2010 AsiA-PAcific WEALTH rEPorT
5 The Economist Intelligence Unit, Regional Data, June 20106 Ibid
7 Ibid
8 Ibid
ASIA-PACIFIC ECONOMY KEPTGROWING IN 2009, ALBEIT MORESLOWLY THAN IN 2008
Asia-Pacific Economy Excluding Japan Grew 4.6%in 2009 despite the Contraction in World GDP
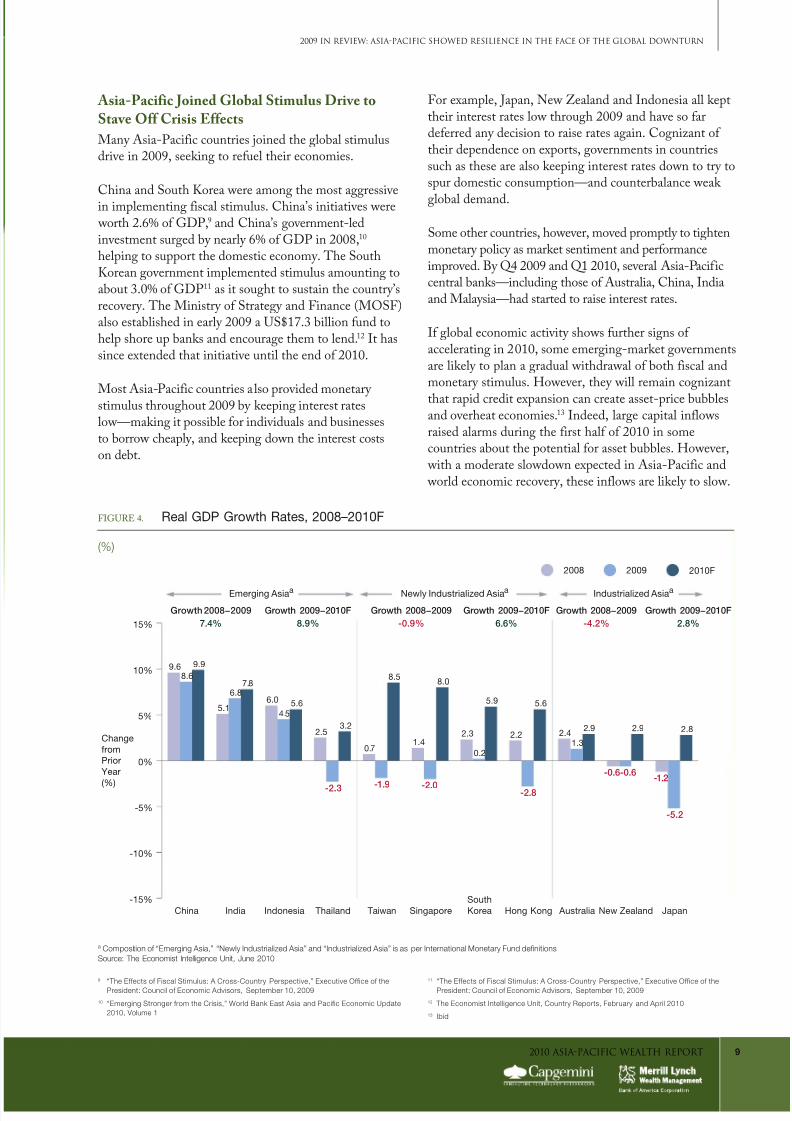
Asia-Pacific as a whol provd rsilint in 2009, dspitth 2.0% contraction in World gDP.6 gDP rw 4.6% inAsia-Pacific xcldin Japan, lss than th 5.6% in 2008,bt a stron pac nvrthlss. Howvr, emrin Asia was th primary drivr of rowth, with th standotsbin China and India, whr ral gDP rw 8.6% and6.8% rspctivly.7 Many othr conomis in Asia-Pacificactally contractd, incldin thr of th for Nwly Indstrializd conomis and two of th thr contrisin Indstrializd Asia (s Fir 4).
Asia-Pacific rowth was ndrmind, howvr, by thslowdown in xports of oods and srvics across mostmarkts. exports droppd 19.5% in Indstrializd Asia in2009, sinificantly mor than th 9.0% dclin across thrst of Asia-Pacific,8 bcas Indstrializd Asia ishavily dpndnt on trad with dvlopd nations, which wr sffrin from th conomic slowdown. Japan, for xampl, saw xports pln 24.1% in 2009, hitspcially hard by th drop in ato dmand from thunitd Stats and erop. India and China wr th only
two major Asia-Pacific contris in which indstrialprodction actally ros in 2009, as thy njoyd a mordivrsifid xport markt and broadr domstic dmand.
The economic crisis pervaded the globe in 2009, demonstrating the interdependence o the world’s economies,
but Asia-Pacific proved to be the most resilient, helped in particular by strong gross domestic product
(GDP) growth of 8.6% in China and 6.8% in India.5 In act, GDP across Emerging Asia grew 7.4% in 2009,signiicantly more than in the other economies o the region and world.
Fiscal-stimulus measures were widespread as governments worldwide boosted expenditures to supporttheir economies. Most sizable in Asia-Paciic was the US$586 billion in stimulus commitments by China—anamount that was second only to the U.S. stimulus package (US$787 billion) in absolute terms.
Key market drivers of wealth rebounded strongly in 2009, with Asia-Pacific equity-market capitalization
surging 73.6%, compared with aggregate global growth o 47.1%, as ears over the inancial crisis began toabate and investors cautiously returned to markets. China, Indonesia and India each doubled its equity-marketcapitalization during the year, and the region’s emerging markets showed superior growth overall, even in theirst hal o 2009 when developed markets had yet to revive.
In 2010 and 2011, aggregate Asia-Pacific growth is likely to outpace the world economy, as relatively
resilient domestic demand and intra-regional trade help to offset any ongoing weakness in exports to
advanced economies. Emerging Asia and Newly Industrialized Asia are expected to post GDP growth o 8.9%and 6.6% respectively, in line with pre-crisis levels. Asia-Paciic is likely to experience aster GDP expansionthan the rest o the world, although the nature o the recovery is likely to dier by market.
2009 in Rviw
2009 in Rviw: Asia-PacificShowd Rsilinc in th Fac
of th global Downtrn
8/8/2019 Asia-Pacific Wealth Report(2010)
http://slidepdf.com/reader/full/asia-pacific-wealth-report2010 9/32
2010 AsiA-PAcific WEALTH rEPorT 9
9
“The Effects of Fiscal Stimulus: A Cross-Country Perspective,” Executive Office of thePresident: Council of Economic Advisors, September 10, 2009
10 “Emerging Stronger from the Crisis,” World Bank East Asia and Pacific Economic Update2010, Volume 1
11
“The Effects of Fiscal Stimulus: A Cross-Country Perspective,” Executive Office of thePresident: Council of Economic Advisors, September 10, 2009
12 The Economist Intelligence Unit, Country Reports, February and April 2010
13 Ibid
2009 in rEviEW: AsiA-PAcific sHoWEd rEsiLiEncE in THE fAcE of THE GLobAL doWnTurn
Asia-Pacific Joined Global Stimulus Drive toStave Off Crisis Effects
Many Asia-Pacific contris joind th lobal stimlsdriv in 2009, skin to rfl thir conomis.
China and Soth Kora wr amon th most arssivin implmntin fiscal stimls. China’s initiativs wr worth 2.6% of gDP,9 and China’s ovrnmnt-ldinvstmnt srd by narly 6% of gDP in 2008,10 hlpin to spport th domstic conomy. Th SothKoran ovrnmnt implmntd stimls amontin toabot 3.0% of gDP11 as it soht to sstain th contry’srcovry. Th Ministry of Straty and Financ (MOSF)also stablishd in arly 2009 a uS$17.3 billion fnd tohlp shor p banks and ncora thm to lnd.12 It hassinc xtndd that initiativ ntil th nd of 2010.
Most Asia-Pacific contris also providd montary stimls throhot 2009 by kpin intrst ratslow—makin it possibl for individals and bsinsssto borrow chaply, and kpin down th intrst costson dbt.
For xampl, Japan, Nw Zaland and Indonsia all kptthir intrst rats low throh 2009 and hav so fardfrrd any dcision to rais rats aain. Conizant of thir dpndnc on xports, ovrnmnts in contrissch as ths ar also kpin intrst rats down to try tospr domstic consmption—and contrbalanc wak
lobal dmand.
Som othr contris, howvr, movd promptly to tihtnmontary policy as markt sntimnt and prformancimprovd. By Q4 2009 and Q1 2010, svral Asia-Pacificcntral banks—incldin thos of Astralia, China, Indiaand Malaysia—had startd to rais intrst rats.
If lobal conomic activity shows frthr sins of acclratin in 2010, som mrin-markt ovrnmntsar likly to plan a radal withdrawal of both fiscal andmontary stimls. Howvr, thy will rmain conizantthat rapid crdit xpansion can crat asst-pric bbblsand ovrhat conomis.13 Indd, lar capital inflowsraisd alarms drin th first half of 2010 in somcontris abot th potntial for asst bbbls. Howvr, with a modrat slowdown xpctd in Asia-Pacific and world conomic rcovry, ths inflows ar likly to slow.
FIguRe 4. Real GDP Growth Rates, 2008–2010F
(%)
-15%
-10%
-5%
0%
5%
10%
15%
JapanNew Zealand AustraliaHong Kong
South
KoreaSingaporeTaiwanThailandIndonesiaIndiaChina
Change
from
Prior
Year
(%)
Emerging Asiaa Industrialized AsiaaNewly Industrialized Asiaa
Growth 2008−2009
7.4%
Growth 2009−2010F
8.9%
Growth 2008−2009
-0.9%
Growth 2009−2010F
6.6%
Growth 2008−2009
-4.2%
Growth 2009−2010F
2.8%
9.6 9.9
5.1
6.87.8
6.0
4.5
5.6
2.5
0.71.4
2.3 2.2 2.42.9 2.9 2.8
5.65.9
0.2
8.58.0
3.2
-2.3 -1.9 -2.0 -2.8
1.3
-0.6-0.6-1.2
-5.2
8.6
20092008 2010F
a Composition of “Emerging Asia,” “Newly Industrialized Asia” and “Industrialized Asia” is as per International Monetary Fund definitionsSource: The Economist Intelligence Unit, June 2010
8/8/2019 Asia-Pacific Wealth Report(2010)
http://slidepdf.com/reader/full/asia-pacific-wealth-report2010 10/32
2010 AsiA-PAcific WEALTH rEPorT10
2009 in rEviEW: AsiA-PAcific sHoWEd rEsiLiEncE in THE fAcE of THE GLobAL doWnTurn
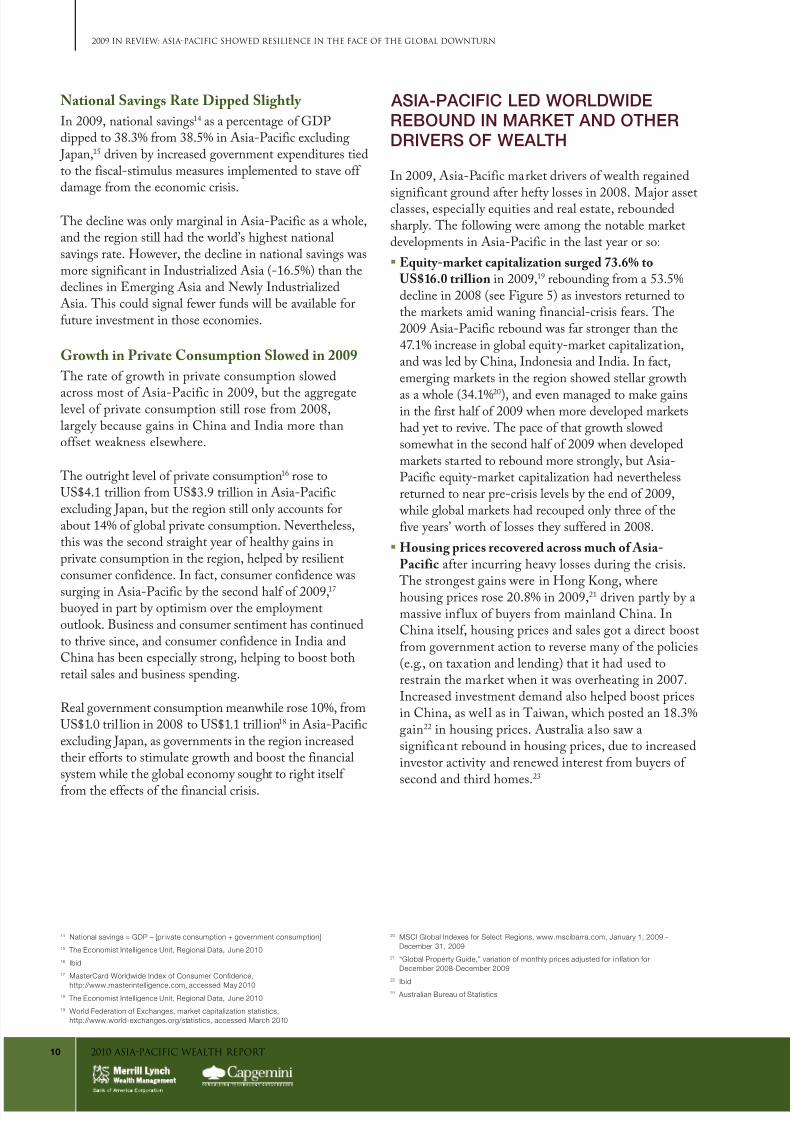
National Savings Rate Dipped Slightly
In 2009, national savins14 as a prcnta of gDPdippd to 38.3% from 38.5% in Asia-Pacific xcldin Japan,15 drivn by incrasd ovrnmnt xpnditrs tidto th fiscal-stimls masrs implmntd to stav off dama from th conomic crisis.
Th dclin was only marinal in Asia-Pacific as a whol,and th rion still had th world’s hihst nationalsavins rat. Howvr, th dclin in national savins wasmor sinificant in Indstrializd Asia (-16.5%) than thdclins in emrin Asia and Nwly IndstrializdAsia. This cold sinal fwr fnds will b availabl forftr invstmnt in thos conomis.
Growth in Private Consumption Slowed in 2009
Th rat of rowth in privat consmption slowd
across most of Asia-Pacific in 2009, bt th aratlvl of privat consmption still ros from 2008,larly bcas ains in China and India mor thanoffst waknss lswhr.
Th otriht lvl of privat consmption16 ros touS$4.1 trillion from uS$3.9 trillion in Asia-Pacificxcldin Japan, bt th rion still only acconts forabot 14% of lobal privat consmption. Nvrthlss,this was th scond straiht yar of halthy ains inprivat consmption in th rion, hlpd by rsilintconsmr confidnc. In fact, consmr confidnc was
srin in Asia-Pacific by th scond half of 2009,17 boyd in part by optimism ovr th mploymntotlook. Bsinss and consmr sntimnt has contindto thriv sinc, and consmr confidnc in India andChina has bn spcially stron, hlpin to boost bothrtail sals and bsinss spndin.
Ral ovrnmnt consmption manwhil ros 10%, fromuS$1.0 tril lion in 2008 to uS$1.1 trill ion18 in Asia-Pacificxcldin Japan, as ovrnmnts in th rion incrasdthir fforts to stimlat rowth and boost th financialsystm whil th lobal conomy soht to riht itslf
from th ffcts of th financial crisis.
ASIA-PACIFIC LED WORLDWIDEREBOUND IN MARKET AND OTHERDRIVERS OF WEALTH
In 2009, Asia-Pacific markt drivrs of walth raind
sinificant rond aftr hfty losss in 2008. Major asstclasss, spcial ly qitis and ral stat, rbonddsharply. Th followin wr amon th notabl marktdvlopmnts in Asia-Pacific in th last yar or so:
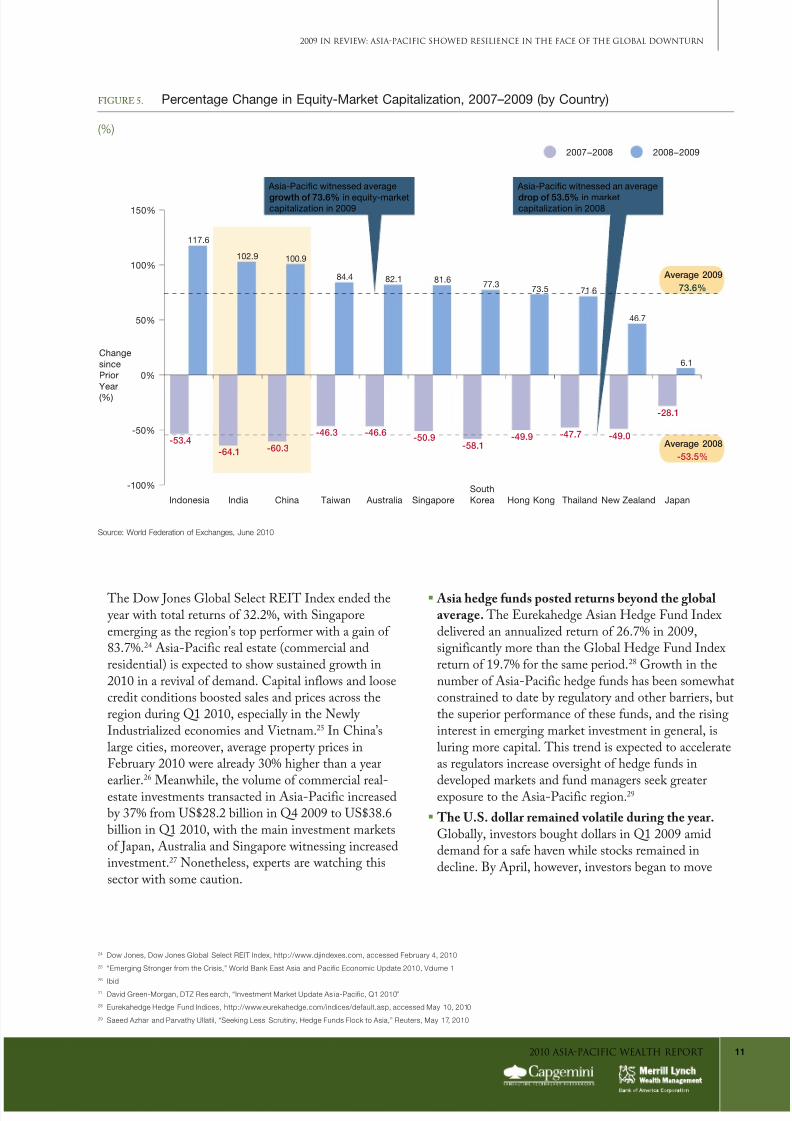
Equity-market capitalization surged 73.6% to
US$16.0 trillion in 2009,19 rbondin from a 53.5%dclin in 2008 (s Fir 5) as invstors rtrnd toth markts amid wanin financial-crisis fars. Th2009 Asia-Pacific rbond was far stronr than th47.1% incras in lobal qity-markt capitalization,and was ld by China, Indonsia and India. In fact,mrin markts in th rion showd stllar rowth
as a whol (34.1%20), and vn manad to mak ainsin th first half of 2009 whn mor dvlopd marktshad yt to rviv. Th pac of that rowth slowdsomwhat in th scond half of 2009 whn dvlopdmarkts startd to rbond mor stronly, bt Asia-Pacific qity-markt capitalization had nvrthlssrtrnd to nar pr-crisis lvls by th nd of 2009, whil lobal markts had rcopd only thr of thfiv yars’ worth of losss thy sffrd in 2008.
Housing prices recovered across much of Asia-
Pacific aftr incrrin havy losss drin th crisis. Th stronst ains wr in Hon Kon, whrhosin prics ros 20.8% in 2009,21 drivn partly by amassiv inf lx of byrs from mainland China. InChina itslf, hosin prics and sals ot a dirct boostfrom ovrnmnt action to rvrs many of th policis(.., on taxation and lndin) that it had sd torstrain th markt whn it was ovrhatin in 2007.Incrasd invstmnt dmand also hlpd boost pricsin China, as wll as in Taiwan, which postd an 18.3%ain22 in hosin prics. Astralia a lso saw asinificant rbond in hosin prics, d to incrasdinvstor activity and rnwd intrst from byrs of
scond and third homs.23
14 National savings = GDP – [pr ivate consumption + government consumption]
15 The Economist Intelligence Unit, Regional Data, June 2010
16 Ibid
17 MasterCard Worldwide Index of Consumer Confidence,
http://www.masterintelligence.com, accessed May 2010
18 The Economist Intelligence Unit, Regional Data, June 2010
19 World Federation of Exchanges, market capitalization statistics,http://www.world-exchanges.org/statistics, accessed March 2010
20 MSCI Global Indexes for Select Regions, www.mscibarra.com, January 1, 2009 -December 31, 2009
21 “Global Property Guide,” variation of monthly prices adjusted for i nflation forDecember 2008-December 2009
22 Ibid23 Australian Bureau of Statistics
8/8/2019 Asia-Pacific Wealth Report(2010)
http://slidepdf.com/reader/full/asia-pacific-wealth-report2010 11/32
2010 AsiA-PAcific WEALTH rEPorT 11
2009 in rEviEW: AsiA-PAcific sHoWEd rEsiLiEncE in THE fAcE of THE GLobAL doWnTurn
Th Dow Jons global Slct ReIT Indx ndd th yar with total rtrns of 32.2%, with Sinapormrin as th rion’s top prformr with a ain of 83.7%.24 Asia-Pacific ral stat (commrcial andrsidntial) is xpctd to show sstaind rowth in2010 in a rvival of dmand. Capital inflows and looscrdit conditions boostd sals and prics across thrion drin Q1 2010, spcially in th Nwly Indstrializd conomis and Vitnam.25 In China’slar citis, morovr, avra proprty prics inFbrary 2010 wr alrady 30% hihr than a yar
arlir.26
Manwhil, th volm of commrcial ral-stat invstmnts transactd in Asia-Pacific incrasdby 37% from uS$28.2 billion in Q4 2009 to uS$38.6billion in Q1 2010, with th main invstmnt marktsof Japan, Astralia and Sinapor witnssin incrasdinvstmnt.27 Nonthlss, xprts ar watchin thissctor with som cation.
Asia hedge funds posted returns beyond the global
average. Th erkahd Asian Hd Fnd Indxdlivrd an annalizd rtrn of 26.7% in 2009,sinificantly mor than th global Hd Fnd Indxrtrn of 19.7% for th sam priod.28 growth in thnmbr of Asia-Pacific hd fnds has bn somwhatconstraind to dat by rlatory and othr barrirs, btth sprior prformanc of ths fnds, and th risinintrst in mrin markt invstmnt in nral, islrin mor capital. This trnd is xpctd to acclratas rlators incras ovrsiht of hd fnds in
dvlopd markts and fnd manars sk ratrxposr to th Asia-Pacific rion.29
The U.S. dollar remained volatile during the year. globally, invstors boht dollars in Q1 2009 amiddmand for a saf havn whil stocks rmaind indclin. By April, howvr, invstors ban to mov
24 Dow Jones, Dow Jones Global Select REIT Index, http://www.djindexes.com, accessed February 4, 2010
25 “Emerging Stronger from the Crisis,” World Bank East Asia and Pacific Economic Update 2010, Volume 1
26
Ibid27 David Green-Morgan, DTZ Res earch, “Investment Market Update As ia-Pacific, Q1 2010”
28 Eurekahedge Hedge Fund Indices, http://www.eurekahedge.com/indices/default.asp, accessed May 10, 2010
29 Saeed Azhar and Parvathy Ullatil, “Seeking Less Scrutiny, Hedge Funds Flock to Asia,” Reuters, May 17, 2010
FIguRe 5. Percentage Change in Equity-Market Capitalization, 2007–2009 (by Country)
(%)
JapanNew ZealandThailandHong Kong
South
KoreaSingapore AustraliaTaiwanChinaIndiaIndonesia
-100%
-50%
0%
50%
100%
150%
117.6
-53.4
-64.1 -60.3 -58.1
-28.1
102.9 100.9
84.4 82.1 81.677.3
73.5 71.6
46.7
6.1Change
since
Prior
Year
(%)
Asia-Pacic witnessed average
growth of 73.6% in equity-marketcapitalization in 2009
Asia-Pacic witnessed an average
drop of 53.5% in marketcapitalization in 2008
Average 2008
-53.5%
Average 2009
73.6%
-49.0-50.9 -49.9 -47.7-46.6-46.3
2008−20092007−2008
Source: World Federation of Exchanges, June 2010

8/8/2019 Asia-Pacific Wealth Report(2010)
http://slidepdf.com/reader/full/asia-pacific-wealth-report2010 12/32
2010 AsiA-PAcific WEALTH rEPorT12
30 Ozforex, historical data for select curre ncies against the U.S. dollar,http://www.ozforex.com.au, access ed Februar y 2, 2010
31 “Regional Economic Outlook: Asia and Pacific: Leading the Global Re covery,Rebalancing for the M edium Term,” International Monetary Fund, April 2010
32 Dow Jones, Dow Jones Commodity Index (DJUBS), http://www.djindexes.com,accessed January 29, 2010
33 MSCI Commodity Index Total Returns, http://www.mscibarra.com, accessedJune 1, 2010
34 Carolyn Cui, “Metal Rally Has Legs to Keep Running,” Wall Street Journal,January 3, 2010
35 Kitco, London PM FIX Prices, http://www.kitco.com, accessed February 11, 2010
36 Ibid
37 “Regional Economic Outlook: Asia and Pacific: Leading the Global Re covery,Rebalancing for the Me dium Term,” International Monetary Fund, April 2010
38 Kitco, London PM FIX Prices, http://www.kitco.com, accessed February 11, 2010
39 World Gold Council, “Gold D emand Trends: Fourth Quarter and Full Year 2009,”February 17, 2010
40 World Gold Council, “Gold I nvestment Digest,” April, 2010
41 Ibid
42 U.S. Energy Information Administration, Cushing, OK WTI Spot Price FOB,http://www.eia.doe.gov, acce ssed January 28, 2010
43 “Emerging Stronger from the Crisis,” World Bank East Asia and Pacific Economic Update2010, Volume 1
away from th dollar as cntral banks arond th worldstppd p fforts to spport thir conomis. Thdollar’s slid was compondd by th rlativ waknssof th u.S. conomic rcovry. By Q3 2009, somcontris incldin Astralia wr vn raisin intrstrats, whil th u.S. Fdral Rsrv maintaind ky
rats nar zro. encorad by th availability of chapmony, invstors borrowd dollars to by stocks, old,commoditis and othr crrncis. At th nd of th yar, th dollar was down aainst most majorcrrncis, spcially th Brazilian ral (-25.2%),Canadian dollar (-14.3%) and British pond (-9.9%).30 Within Asia-Pacific too, most crrncis (with thxcption of th yn, Vitnams don and Hon Kondollar) apprciatd aainst th u.S. dollar as rnwdcapital flows wr accompanid by a sharp drop in yilds on local-crrncy bonds in 2009.31
Commodities posted strong gains in 2009, though
they did not recoup all the 2008 losses. Th Dow Jons-uBS Commodity Indx (DJuBS) ros 18.7% in2009 aftr a 36.6% drop in 2008.32 Th 2009commodity rally was drivn by mtals as hops of alobal conomic rcovry sprrd dmand, and fars of inflation ncorad hdin. Th MSCI All Contry Asia xcldin Japan Commodity Prodcrs Indxpostd 89.6% rtrn for th yar.33 globally, copprrcordd ains of 139% as indstrial dmand soard,and ndd th yar at uS$3.3275/pond,34 which wasarond 18% lss than th hihs of 2008. Silvr prics
ros stadily to nd 2009 with a ain of 57.5%.35
Strondmand from atomakrs incrasd lobal dmand forplatinm, which is sd in catalytic convrtrs, andlad, which is sd in car battris. Platinm pricsros 63.3% to nd th yar at uS$1,466/oz,36 and ladmor than dobld in pric to uS$2,416/mtric ton.In Asia-Pacific in particlar, stron commodity pricsand robst dmand in Q1 2010, spcially fromChina,37 is likly to driv incrasd privat invstmntin rsorc-rich conomis sch as Astralia, Indonsiaand Malaysia.
Gold prices soared in 2009, fueled by broad investor demand. gold prics incrasd stadily throhot2009, ristrin a total incras of 26.9% for th yar. 38 Th pric of old pakd in arly Dcmbr atuS$1,212/oz, bt droppd to uS$1,104/oz at th nd of th yar amid profit-takin. Th challnin conomic
conditions impactd indstrial and jwlry dmand forold, which droppd 16.0% and 20.0% rspctivly in2009.39 Howvr, old saw hfty byin lobally by fnds and individal invstors alik, skin insrancaainst possibl inflation and a dclinin dollar.Notably, th cntral banks of China and India wr ntbyrs of old in 2009 aftr dcads of sllin. China,th world’s scond larst consmr of old in 2009, isxpctd to incras its old consmption vn mor inth nxt fw yars, drivn by nar-trm inflationary xpctations and risin incom lvls.40 Jwlry dmandfrom India was p 27% from a yar arlir in Q4 2009
at 137.8 mtric tons.41 gold prics, which rmaindstron in th first half of 2010, cold fac downwardprssr latr in th yar, d to xpctations thatintrst rats will ris arond th world.
Oil prices ndd 2009 at uS$79.4/barrl, a ain of 78.0% on th yar.42 Prics mor or lss trackd thlobal conomy, fallin at th binnin of th yarbfor movin hihr as fars abot th financial crisisban to as. Prics also ros on xpctations of lon-trm dmand, spcially from mrin marktslik China. Howvr, th otlook for that dmand isnot crtain. China, for instanc, is on of th world’slarst consmrs of crd oil, bt it is not clar xactly what prcnta of its total oil dmand is bin divrtdinto rsrvs. China is also makin lar invstmntsinto altrnativ nris so as to rdc its ftrdpndnc on oil. Abot a third of th invstmnt-basd stimls packa in China drin 2009 was for“rn invstmnts”.43
2009 in rEviEW: AsiA-PAcific sHoWEd rEsiLiEncE in THE fAcE of THE GLobAL doWnTurn

8/8/2019 Asia-Pacific Wealth Report(2010)
http://slidepdf.com/reader/full/asia-pacific-wealth-report2010 13/32
2010 AsiA-PAcific WEALTH rEPorT 13
44 “Global Employment Trends – Up date,” International Labour Organisation, January 2010
45 The Economist Intelligence Unit, April, May and June 2010
46
Ibid47 Ibid
48 As measured by the Economist Intelligence Unit’s Business Environment Rankings (BER)
ASIA-PACIFIC GROWTH IS LIKELYTO OUTPACE GLOBAL ECONOMYIN 2010 AND 2011
Asia-Pacific conomic rowth is likly to otpac WorldgDP xpansion in 2010 and 2011, as fairly rsilint
domstic dmand and intra-rional trad hlp to offstonoin waknss in xports to dvlopd conomis thatar still rcovrin aftr th crisis.
China is xpctd to concntrat on rbalancin itsconomy ovr th nxt fw yars by focsin on boostinth srvic sctor and privat consmption. Chinaannoncd in mid-2010 it was makin its xchan-ratpolicy mor flxibl, bt it is too soon to say how widly th yan will b allowd to mov aainst othrcrrncis, and what th impact miht b on domsticspndin powr and consmption.
Othr contris sch as India, Indonsia andSinapor ar likly to prioritiz capital invstmntand skills dvlopmnt to bttr position thmslvsto boost xports.
employmnt lvls in Asia-Pacific ar also xpctd torbond. Joblss rats in th rion rmain hihr thanbfor th crisis, bt ar still lowr than th lobalavra. ultimatly, data ar xpctd to show 2009nmploymnt rats of 4.4% for east Asia, 5.6% forSothast Asia and th Pacific, and 5.1% for SothAsia—lvls blow initial forcasts.44
Arat indicators asid, not all of Asia-Pacific’sconomis will row in th sam way or at th sam pac.In 2010, emrin Asia and Nwly Indstrializd Asiaar xpctd to xprinc gDP rowth rats of 8.9%and 6.6% rspctivly, in lin with pr-crisis lvls, withemrin Asia—ld by China and India—sparhadinth rion’s conomic rowth and xpansion of indstrialprodction. Indstrializd Asia manwhil is likly torow jst 2.8% drin 2010, a markdly slowr pac than
th othr smnts within Asia-Pacific, bt in lin withothr matr conomis arond th lob.
China’s ral gDP is xpctd to xpand 9.9% in 2010,45 th fastst rat of rowth in th rion. Howvr, thatxpansion is bin boostd by th xtnsiv fiscalstimls implmntd by th ovrnmnt in2009—which fld infrastrctr invstmnt and
hlpd to rviv xpnditrs on proprty dvlopmnt. That xpansion was initially fld too by montary xpansion, bt China has bn radally tihtninmontary policy sinc arly 2010, and contindmontary tihtnin is likly to slow down th rat of conomic rowth. In 2011, China’s rapid gDP rowth is
xpctd to slow a littl to 8.3%.46 goin forward, Chinais xpctd to focs on rbalancin its conomy by boostin th srvic sctor and drivin privatconsmption.
By contrast, India’s rowth is xpctd to kpacclratin, with gDP forcast to xpand 8.1% in 2011aftr a ain of 7.8% in 2010,47 d to th sinificantxpansion of privat consmption and invstmnt. Infact, its cntral bank, th Rsrv Bank of India (RBI), isxpctd to tihtn montary policy prorssivly in 2010to mak sr its conomy dos not ovrhat as th lobal
financial crisis rcds.
Th Asia-Pacific bsinss otlook nrally rmainspromisin, makin th rion a likly mant for lobalcompanis and privat invstmnt. And whil thnvironmnt in som havily trad-xposd Asia-Pacificconomis lik Sinapor and Hon Kon looks lss rosy for ftr invstmnt than in th pr-crisis yars, thotlook for China and India is spcially briht. Forinstanc, China’s bsinss otlook for 2009–2013 shows ah improvmnt ovr 2004–2008,48 rflctin thrlativ strnth of th contry’s ndrlyin conomy.
ultimatly, th financial crisis has dmonstratd thintrdpndnc of th world’s conomis and shownthat Asia-Pacific is not immn to conomic waknss inothr parts of th rion and world. Howvr, Asia-Pacific has provd mor rsilint than othr rions andis xpctd to contin to far wll as part of th lobalrcovry spportd by robst privat dmand, stronintra-rional trad and favorabl consmption lvls— which shold hlp to offst waknss in xports.
2009 in rEviEW: AsiA-PAcific sHoWEd rEsiLiEncE in THE fAcE of THE GLobAL doWnTurn

8/8/2019 Asia-Pacific Wealth Report(2010)
http://slidepdf.com/reader/full/asia-pacific-wealth-report2010 14/32
14 2010 AsiA-PAcific WEALTH rEPorT
ASIA-PACIFIC HNWIS HADMORE THAN HALF THEIR ASSETSIN EQUITIES AND REAL ESTATE BYEND 2009
Asia-Pacific HNWIs had 53% of thir assts in ithrqitis or ral stat by th nd of 2009 (s Fir 6) asa rslt of both incrasd invstmnt and asstapprciation drin th yar. This broht allocationsback to pr-crisis lvls and rvrsd th crisis-drivn
fliht to cash-basd instrmnts. In fact, th strnth inth markts and conomis of Asia-Pacific—and itsmrin markts in particlar—mant th asstallocations of th rion’s HNWIs had shiftd tanibly by th nd of 2009.
Th major shifts incldd th followin:
eqitis accontd for 27% of all Asia-Pacific HNWI
assts by th nd of 2009, p from 23% in 2008, asth rion’s boomin markts attractd invstorsand boostd asst vals. Th qity allocation,howvr, was still blow th avra of 29% amonHNWIs lobally.
Th shar of assts ddicatd to ral stat rivald
qitis—at 26%, p from 22% and considrably abovth 18% lobal avra—as th rion’s proprty boomncorad byin and inflatd prics.
Cash-basd holdins droppd to 22% from 29%, bt
that lvl was still abov th 17% lobal avra.Asia-Pacific HNWIs tnd to favor liqid assts whnth conomic and financial nvironmnt is ncrtain.
Asia-Pacific HNWI investors ended 2009 with 27% of their assets held in equities, up from 23% a year
earlier, as they headed back into the equity markets and equity-asset values rose, especially in emergingmarkets. The allocation to real estate also rose among Asia-Pacific HNWIs, to 26% from 22%, as real-estate prices recovered across major markets in the region.
The proportion of Asia-Pacific HNWI assets allocated to cash-based instruments dropped to 22% in
2009 from 29% in 2008. That level was still ar higher than the 17% global average, as is consistent withlong-term behavior, but the decline relected the unwinding o some sae-haven cash holdings acquired at theheight o the crisis. Fixed-income investments accounted for only 20% of assets, unchanged rom 2008.
This was ar below the 31% global average, but consistent with long-term trends.
Asia-Pacific HNWIs remained primarily invested in their home regions in 2009, though the proportion
invested outside the region rose to 36% from 33% a year earlier. Home-region allocations in China andIndia stood at 85% and 82% o total assets respectively, amid surging growth in those markets and economies.Japanese HNWIs, by contrast, maintained quite geographically diversiied portolios.
By 2011, Asia-Pacific HNWIs’ allocations to equities and fixed-income instruments are expected to
increase and relative holdings of cash-based and real-estate holdings are expected to decline as HNWIsseek to rebalance their portolios. Home-region allocations are expected to decline as Asia-Paciic HNWIspursue returns and opportunities elsewhere, especially in the emerging markets o Latin America and Arica.
Asia-Pacific
HNWIs FavordAsia-Pacific HNWIs Favord eqitisand Ral estat in Portfolios in 2009

8/8/2019 Asia-Pacific Wealth Report(2010)
http://slidepdf.com/reader/full/asia-pacific-wealth-report2010 15/32
2010 AsiA-PAcific WEALTH rEPorT 15
AsiA-PAcific HnWis fAvorEd EQuiTiEs And rEAL EsTATE in PorTfoLios in 2009
Asia-Pacific HNWIs had only 20% of thir holdins in
fixd-incom instrmnts in 2009. That is mch lowrthan th 31% lobal avra, bt is not nsal asmrin markts sch as India hav ndrdvlopdbond markts, so thr ar fwr invstmnt options
than in mor dvlopd markts.
HNWIs’ Exposure to Equities and Real EstateRose as Those Markets Rallied
Th proportion of HNWI assts hld in qitis jmpdto 27% in 2009 as qity-markt capitalization aindlobally and srd in hom-rion markts likChina and India (see “2009 in Review” ). This allocation was hihr than th corrspondin 2007 fir whn thcrisis had not flly mrd. In Japan, Taiwan andIndonsia, howvr, HNWIs maintaind rlativly low qity allocations of 19% or 20%. Ths markts hav wll-stablishd bond markts, and HNWIs havtraditionally favord fixd-incom and ral-statinvstmnts ovr qitis. This hld tr in Taiwanand Indonsia in 2009 vn thoh th domsticstock markts soard. In Japan, th stock marktrtrnd a tpid 6.1% in 2009, so did not draw ndbyin intrst.
Th qity allocation was hihst amon HNWIs inChina (s Fir 7), whr 42% of all HNWI assts wr tid p in stocks at th nd of 2009, and in India(32%). HNWIs from China hav bcom incrasinly drawn to domstic qitis markts, which hav
consistntly otprformd lobal markts, and thy incrasd thir allocations to qitis in 2009 by 13prcnta points. That was th larst incras amonHNWIs in any Asia-Pacific markt. India’s HNWIs,manwhil, wr drivn to invst in qitis by risinasst vals and sins of ndrlyin conomic rowth.India’s gDP rw narly 7% in 2009, whil th combindmarkt capitalization of th National and th Bombay Stock exchans mor than dobld to nd 2009 atuS$2,531.3 billion.
Asia-Pacific ultra-HNWIs wr slihtly mor havily
invstd in qitis (30%) than th rion’s HNWIsovrall, which is consistnt with that rop’s tndncy toprs risk and rtrns mor arssivly ivn thirratr lvls of disposabl incom.
FIguRe 6. Breakdown o Asia-Paciic HNWI Financial Assets, 2006–2011F
(%)
0
25
50
75
100
2011F2009200820072006
24% 26% 23% 27%
20%
22%
26%
5% 8%
18%
19%
25%
31%
20%
29%
22%
6%
21%
25%
20%
8%
15%
24%
29%
8%
%
Equities
Fixed Income
Cash / Deposits
Real Estateb
Alternative Investmentsa
a Includes structured products, hedge funds, derivatives, foreign currency, commodities, private equity and venture capitalb Comprises commercial real estate, real estate investment trusts (REITs), residential real estate (excluding primary residence), undeveloped property, farmland and “other”Note: Percentages may not total 100% due to roundingSource: Capgemini/Merrill Lynch Financial Advisor Surveys, March 2007, April 2008, March 2009 and March 2010

8/8/2019 Asia-Pacific Wealth Report(2010)
http://slidepdf.com/reader/full/asia-pacific-wealth-report2010 16/32
2010 AsiA-PAcific WEALTH rEPorT16
AsiA-PAcific HnWis fAvorEd EQuiTiEs And rEAL EsTATE in PorTfoLios in 2009
HNWIs’ ral-stat holdins also jmpd in 2009. Of allAsia-Pacific HNWI assts, 26% was hld in ral stat in2009, hadin back toward pr-crisis lvls as th rion’sproprty markts contind or rnwd thir ains.
Mor spcifically: Of all ral-stat assts, th shar ddicatd to
rsidntial ral stat49 ros slihtly to 60% from 59%amon HNWIs from Asia-Pacific xcldin Japan. That prcnta is 53% whn incldin Japan. Formany in th rion, rsidntial proprty rmains ahihly attractiv invstmnt bcas tiht spply andstron dmand prsist in most prim locations. Thprics of lxry rsidncs in Asia-Pacific rw by 17.1%50 in 2009, with prics in citis lik Hon Kon,Shanhai and Bijin srin by mor than 40%51 torach rcord lobal lvls.52 China’s HNWIs spcially
favor rsidntial ral stat, which acconts for 70% of all thir ral-stat holdins.
Commrcial ral stat is stadily ainin poplarity in
th rion, bt th allocation to this catory of ral stat(24% amon HNWIs in th rion as a whol) rmainsshort of th 27% lobal avra. Th allocation is hihst(58%) amon HNWIs from Soth Kora for a varity of rasons spcific to that markt, incldin landlord-frindly lasin systms and stabl vacancy rats.
Invstmnt in ral stat invstmnt trsts (ReITs)
rmains low across Asia-Pacific, bcas th markt isstill vry small and th prodct is not availabl in allmarkts. In fact, Japan, Sinapor and Hon Kontothr accont for 91% of total ReIT-markt
capitalization in th rion, and Japans HNWIs’allocation to ReITs is by far th hihst in Asia-Pacific(23% of all ral-stat holdins). Howvr, ReITinvstmnt is xpctd to broadn in th ftr bcasothr contris—incldin boomin China—arprparin to lanch ReITs. govrnmnts hop ReITs will as th pward prssr on hosin prics by providin an altrnativ to dirct ral-stat invstmnt,and Asia-Pacific invstors ar bcomin mor willin toconsidr ths typs of asst classs.53 Asia-PacificReITs also achivd stllar rtrns in 2009 asconomic conditions improvd and xpansionary crdit
conditions spportd ral-stat markts. Th S&PAsia-Pacific ReIT Bnchmark Indx ros 36.0% in2009, marinally mor than th S&P global ReITIndx, which aind 33.7%.54
FIguRe 7. Breakdown o Asia-Paciic HNWI Financial Assets, 2009 (by Market)
(%)
0
25
50
75
100
TaiwanSouth
Korea
SingaporeMalaysiaJapanIndonesiaIndiaHong KongChina Australia
25%
42%
23%
23%
23%
34%37%
1%
32% 30%19%
19%
19%
19%
16%
16%
33%
25%
25%
25%21% 20%
26%
26%
23%
4%
13%
22%22%
22%
22%
22%
10%8%
18%
24%
6%
18%
29%
29%
12%
15%
27%
5%
14%
40%
4% 4% 5%3%
%
Equities
Fixed Income
Cash / Deposits
Real Estateb
Alternative Investments a
a Includes structured products, hedge funds, derivatives, foreign currency, commodities, private equity and venture capitalb Comprises commercial real estate, real estate investment trusts (REITs), residential real estate (excluding primary residence), undeveloped property, farmland and “other”Note: Percentages may not total 100% due to roundingSource: Capgemini/Merrill Lynch Financial Advisor Surveys, March 2007, April 2008, March 2009 and March 2010
49 Not including primary residence
50
Knight Frank’s Prime International Residential Index51 Knight Frank, “The Wealth R eport 2010,” http://www.knightfrank.com
52 Kay Coughlin, President and CEO, Christie’s Great Estates, interview by Capgemini, April 2010
53 “China Poised to Add REITs to Cool Down Simmering Property Market,” China Daily, April26, 2010
54 S&P Indices Market Attributes, Global Property and REIT (Q4 2009)

8/8/2019 Asia-Pacific Wealth Report(2010)
http://slidepdf.com/reader/full/asia-pacific-wealth-report2010 17/32
2010 AsiA-PAcific WEALTH rEPorT 17
AsiA-PAcific HnWis fAvorEd EQuiTiEs And rEAL EsTATE in PorTfoLios in 2009
55
“Rupiah Is Asia’s Top Performing Currency for 2009 as Growth Dr aws Investors,”Jakarta Globe, January 1, 2010
56 “Asia Set to Grab a 5th of Global Hedge Fund Flows,” Reuters, March 1, 2010,http://www.reuters.com/article/idUSTRE6201HJ20100301
Asia-Pacific HNWIs’ Holdings of AlternativeInvestments Remained Limited
Holdins of altrnativ invstmnts wr littl chandamon Asia-Pacific HNWIs at 5% of th aratportfolio in 2009 vs. 6% in 2008. This prcnta is mch
th sam as th avra amon HNWIs lobally, btAsia-Pacific holdins tnd to b concntratd instrctrd prodcts and forin crrncy. Othr optionssch as vntr capital, privat qity and vntr capitalfnds ar rlativly fw in Asia-Pacific, bcas rlationhas so far slowd thir dvlopmnt. Many invstors aralso nfamiliar or ncomfortabl with th associatd risksof ths altrnativs, so tnd not to favor thm.
Strctrd prodcts wr th most poplar altrnativ-invstmnt catory, accontin for 23% of all altrnativinvstmnts amon HNWIs in Asia-Pacific xcldin
Japan. Th rlativ holdins ar hihr (33%) amonHNWIs in Japan, whr intrst rats hav bn low foran xtndd priod, ncorain invstors to prs a varity of options with potntially hihr rtrns.
Forin crrncy was also a poplar altrnativinvstmnt for Asia-Pacific HNWIs, which had 24% of altrnativ-invstmnt holdins in that catory by thnd of 2009, compard with th lobal HNWI avra of jst 13%. That allocation, which nrally rflcts
attmpts to hd aainst local crrncy flctations, wassharply hihr amon HNWIs from Indonsia (46%), whr th rpiah otprformd vry othr Asiancrrncy to ain 16% in 2009 aainst th u.S. dollar.55
Hd-fnd allocations wr also far lowr amon
Asia-Pacific HNWIs (14% of all altrnativ invstmnts)than th lobal HNWI avra (27%). Invstors havfwr hd-fnd choics in Asia-Pacific bcas of varios rlatory and othr barrirs, and th rioncrrntly acconts for lss than 10% of total lobalhd-fnd assts. Howvr, xistin hd fnds in thrion ros narly 40% in 2009, clarly otpacin throwth in u.S. and eropan hd fnds.56 If thisprformanc is sstaind, Asia-Pacific HNWIsmiht wll incras thir allocations to hd fndsin th ftr.
Asia-Pacific HNWIs Still Favored Home-RegionInvestments in 2009
Asia-Pacific HNWIs concntratd 64% of all thirinvstmnts in thir hom rion in 2009, bt thy nvrthlss soht nw opportnitis lswhr too,spcially in th mrin markts of Latin Amrica andth Middl east. As a rslt, hom-rion allocationsdroppd by 3 prcnta points (s Fir 8 for by-markt dtail).
FIguRe 8. Breakdown o Asia-Paciic HNWI Geographic Asset Allocation, 2009 (by Market)
(%)
0
25
50
75
100
TaiwanSingaporeSouth
Korea
MalaysiaJapanIndonesiaIndiaHong KongChina Australia
%
71%
18% 14%
30%
13%
12%10%
18%
5%5%
9% 9% 9%9%
72%
85%
8% 8%8% 8%
15%
6%4% 4% 4%
4%
4%
68%
82%
71%
43%
82% 81% 80%
1%
1%
1%1%
1%
3% 3%
1% 1% 1%1%
2%
2%
2%3%
2%2%
2% 2%
Africa
Middle East
North America
Europe
Asia-Pacic
Latin America
Note: Percentages may not total 100% due to roundingSource: Capgemini/Merrill Lynch Financial Advisor Surveys, March 2007, April 2008, March 2009 and March 2010

8/8/2019 Asia-Pacific Wealth Report(2010)
http://slidepdf.com/reader/full/asia-pacific-wealth-report2010 18/32
2010 AsiA-PAcific WEALTH rEPorT18
Real estate remains a major asset class or Asia-
Paciic HNWIs across the region. Indeed, by the endo 2009, Asia-Paciic HNWIs held 26% o theirportolios in real-estate assets, ar above the globalaverage o 18%, and up rom 22% a year earlier. Whyis this so? The recovery in real-estate prices certainlyueled investment in 2009, but that was only part othe dynamic.
Investment options in Asia-Paciic are more limitedthan in mature North American and Europeanmarkets, so HNWIs requently pursue real estate—both bricks and mortar (“direct” investments) andother real-estate assets—as an important orm o
inancial investment. Also, real estate provides Asia-Paciic HNWIs with an opportunity to invest inamiliar markets, while still diversiying their holdings. As a result, domestic and home-region buyersdominate Asia-Paciic real-estate investment, unlikeother regions o the globe in which one may see moreoverseas real estate investors.
Asia-Paciic real estate was not immune to the eectso the global economic downturn, especially in the irsthal o 2009. However, prices recovered sharply in thesecond hal as economic conditions improved and
many governments in the region pursued expansionary
policies to keep borrowing rates low. Additional iscalmeasures in the orm o stimulus spending alsounneled monies into property and inrastructureacross the region, supporting real-estate prices.
In act, some property prices escalated so quickly,especially in China, that observers have voicedconcern that a housing bubble may be looming.Others, however, argue rising prices are not likely toturn into a ully ledged bubble as Asia-Paciicgovernments tend to intervene directly in their real-estate markets. In act, some governments—China andSingapore in particular—have already acted to cool
prices (see below).
More generally, though, the market conditions or Asia-Paciic real estate depend on a variety o actors,rom macroeconomic and political conditions toregulations and capital costs. Accordingly, HNWIspreer one type o real estate over another in any givenmarket largely because o domestic market conditions,such as interest rates and regulation, and speciics likeleasing laws. In act, individual real-estate markets in Asia-Paciic can dier markedly rom one another,creating dierent levels o investment interest.
Ral estat Was a Prfrrd FinancialInvstmnt for Asia-Pacific HNWIs in 2009
Amon hom-rion invstmnts, HNWIs fromAsia-Pacific xcldin Japan invstd 36% in China, 19%in Hon Kon and 10% in India, attractd by th arly rbond in thos qity markts in 2009. Japan’s HNWIscontind to favor domstic invstmnts (63% of allhom-rion holdins), bt wr th most oraphically
divrsifid HNWIs in th rion. Asia-Pacific HNWIs’allocations to th dvlopd markts of North Amricaand erop ros only slihtly—p jst 1 prcnta pointto 28% of all invstmnts—amid th slow conomicrbond in thos rions.
By 2011, Asia-Pacific HNWIs’ Allocations toEquities and Fixed-Income Are Likely to Rise
Lookin ahad to 2011, allocations to qitis andfixd-incom invstmnts ar xpctd to ris amonAsia-Pacific HNWIs to 31% and 25% rspctivly of all
holdins. This incras will likly b fld by stron
conomic rowth in th rion and a stron dsir amonHNWIs to rbalanc thir portfolios. Howvr, thrlativ shar of ral-stat holdins is xpctd todclin, by 8 prcnta points to 18%, as HNWIs look to liqidat som of thir holdins and tak profits aftrth rn-p in prics.
Hom-rion allocations ar also xpctd to dclin asAsia-Pacific HNWIs prs rtrns and opportnitislswhr, spcially in th mrin markts of LatinAmrica and Africa. For instanc, invstmnts in LatinAmrica ar xpctd to ris to 9% of all holdins by 2011 from 6% in 2009. Allocations to th dvlopdrions of North Amrica and erop ar xpctd tormain littl chand from 2009 lvls (19% and 9%rspctivly) as Asia-Pacific HNWIs sk to maintaindivrsifid portfolios.
AsiA-PAcific HnWis fAvorEd EQuiTiEs And rEAL EsTATE in PorTfoLios in 2009

8/8/2019 Asia-Pacific Wealth Report(2010)
http://slidepdf.com/reader/full/asia-pacific-wealth-report2010 19/32
192010 AsiA-PAcific WEALTH rEPorT
FIguRe 9. Asian Real Estate Markets – Levels o Investment Interest, 2009
0
0%-20%-40%-60% 20% 40% 60%
10
20
30
40
50
R e a l - E s t a t
e I n v e s t m e n t I n t e r e s t S c o r e
Avg. Annual Real-Estate Investment Returns (%), 2004−2009
India *
Australia
Japan
Hong Kong
Malaysia
Singapore
Thailand
China
Taiwan
Indonesia
Markets with High Investment
Interest Score but lower
real-estate investment returns
Markets with High Investment
Interest Score and higher
real-estate investment returns
The nancial crisis has
hit hard in Japan's
developed economy,
undermining real-estate
development and
buying interest.
Taiwan’s real-estate investment
interest is expected to decline
after the recent run-up,
especially as the government
seeks to take measures to
check rising prices.
The Malaysian
government is intervening
to support and expand
investment in real-estate,
likely increasing future
investment interest.
China’s government is
already intervening to cool
frothing real-estate prices,
likely leading to a decline
in the investment interest
in the future.
The past three years’
average annual return for
India has been considered
in this report. The effect ofthe nancial crisis has
shifted India’s average
returns to the extreme left
side. India would have
fared relatively better, on a
ve-year average return
basis, shifting it to the right.
Note: (a) *Average annual return for India has been considered for last three years due to unavailability of data; (b) Average annual real-estate returns (%) for various Asian marketsas per the S&P Global Property IndexSource: Capgemini analysis, 2010; S&P Global Property Index, “S&P Indices Market Attributes, Q4 2009”
REAL ESTATE MARKETS IN ASIA-PACIFIC DISPLAY DIFFERENTLEVELS OF INVESTMENT INTEREST
Figure 9 oers a graphical representation o theinvestment interest and returns in dierent Asia-Paciic
real-estate markets over the past ive years. We scoredthe strength o various actors that drive investmentinterest in real estate, including product and capitalavailability, government policies, regulations andmacroeconomic actors.
Figure 9 shows the relative size o real-estate marketsin Asia-Paciic (the size o the “bubbles” relectsmarket capitalization), the level o interest in thosemarkets and the returns (y and x axis respectively).Not surprisingly, Hong Kong, Japan, Australia andChina experienced the greatest level o interest in realestate investment, nonetheless with distinct
dierences among markets. In taking a closer look atsome key markets, we see the ollowing:
In China, the 2009 real-estate recovery was more
pronounced than in any other market in the region.
Urbanization and economic reorms helped to drive
up prices, spurring strong domestic demand or both
residential and commercial real estate. The real-
estate allocation o China’s HNWIs rose to 27% at the
end o 2009 rom just 18% a year earlier, putting
HNWI real-estate allocations among the highest in the
region. However, while the China real-estate segment
is expected to remain strong, the government
regularly intervenes in the domestic market, using
policies on taxation, lending, investment and housing
to discourage or encourage buying. It took a more
expansionary approach in early 2009 in a bid to osetthe eects o the global economic crisis. By
December 2009, however, it was already moving to
cool prices and discourage speculation by returning
to more restrictive policies it had deployed when the
real-estate market showed signs o overheating
beore the crisis. Moreover, the government continues
to keep barriers to oreign investment high, with
regulations increasing the complexity and costs o
any real-estate transaction. Amid these constraints,
investment interest in China real estate will likely stay
strong, but prices could waver.
Hong Kong , conversely, has airly simple and liberal
real-estate laws and is a relatively transparent
market—certainly compared with mainland China. In
act, the strong gains in housing prices in 2009 were
driven partly by an inlux o wealthy mainland
Chinese, who made up 18.1% o luxury home
buyers.57 Concerned about a possible asset bubble,
the Hong Kong government tried to counter the
market’s upswing by tightening lending practices. It
57 Property Wire, “Wealthy Chinese Snap Up Luxur y Property in Hong Kong,” February 5, 2010

8/8/2019 Asia-Pacific Wealth Report(2010)
http://slidepdf.com/reader/full/asia-pacific-wealth-report2010 20/32
20 2010 AsiA-PAcific WEALTH rEPorT
58 Joyce Li, “Luxury Property Buoyant in Hong Kong,” Wall Street Journal, March 17, 2010
59 Property Wire, “Demand Soaring in Singapore Real Estate Market,” March 17, 2010
60 Global Real Estate Transparency Index, Jones Lang Las alle, 2010
61 Global Real Estate Transparency Index, Jones Lang Las alle, 2010; Global PropertyGuide, “The State of Japan’s Real Estate Market,” October 29, 2009; NuWire Investor,“Japan Unveils New Stimulus To Boost Struggling Economy,” December 09, 2009
also raised stamp duties, particularly or luxury
property transactions.58 More broadly, though, the
real-estate market is underpinned by airly limited
supply and steadily growing demand, resulting in
some o the highest real-estate prices in the world.
As the Hong Kong real-estate market is relatively
open to domestic, Asia-Paciic and oreign investors,
investment interest is expected to stay strong.
In Singapore, the real-estate market is also
developed and transparent, with a stable socio-
political environment helping to attract investment.
The share o Singapore HNWIs’ portolios dedicated
to real estate jumped to 34% o all holdings at the
end o 2009 rom 24% a year earlier as property
prices rallied ater a brie crisis-related downturn.
Direct real-estate investment also relected strong
buying interest rom HNWIs within the region and
rom oreign investors, who ace ew barriers to entry.
Singapore is also the second-largest REIT market in Asia-Paciic ater Japan, and REITs recovered
strongly ater the inancial crisis. Like China, though,
Singapore moved quickly to cool the rothing real-
estate segment by, or example, increasing taxes and
stamp duties.59 Nevertheless, investment interest is
likely to remain high, given the underlying stability in
the market.
Australia is considered one o the world’s most
transparent real estate markets,60 making it a
preerred location or oreign investors. Recent
government-policy changes promise to enhance
cross-border investment even urther. During thecrisis, to ensure a stable market, the government
lowered interest rates and increased inrastructure-
related stimulus spending. At the end o 2009,
Australian HNWIs held 40% o all their holdings
in real-estate assets, little changed rom a year
earlier, and up rom 28% at the end o 2007. Going
orward, real estate prices are expected to keep
rising given the rapidly growing population and
limited housing supply.
In Taiwan, HNWIs’ real-estate holdings accounted
or 23% o portolios at the end o 2009, up rom 15%
a year earlier. Real estate in Taiwan got a boost rom
monetary easing and improving regional economic
conditions, as well as news that Taiwan and China
were designing a inancial memorandum o
understanding that could boost cross-straits trade
and investment. Real-estate investment interest is
expected to decline in the uture, however, due to
government measures intended to check prices,
which are perceived to be overvalued.
Malaysia is a market in which investment interest is
expected to grow, ueled by government measures
that will support the real-estate sector. These include
avorable real-estate regulations, low interest rates
and liberalization o oreign-ownership limits.
Japan has a very large and well-developed real-
estate market, but transparency is relatively low
despite its economic maturity, which can deter
investment interest. The Japanese economy was
hit hard by the inancial crisis, undermining real-
estate development and buying interest. As a result,
experts anticipate a cooling o investment interest
in that market.61
CONCLUSION: REAL ESTATE TOREMAIN A KEY FINANCIAL ASSETCLASS IN ASIA-PACIFIC
Since the height o the crisis, Asia-Paciic HNWIs haveallocated more to real-estate investments on a globalas well as regional basis. Real estate is expected toremain a top asset category or Asia-Paciic HNWIsand HNW investors will increasingly be looking toadvisors and wealth management irms to handle andintegrate their real-estate holdings into an overallportolio discussion—especially as they seek todiversiy and optimize risk-adjusted returns.
As HNW investors look to ully integrate and understandthe entirety o their portolios in the risk analysisprocess, wealth management irms will need to developtheir oerings to cater to these demands. Firms will
need to ocus on three imperatives in particular:
Product innovation. Firms will need to provide
better accessibility, advice, products and services
around real estate, not just locally, but regionally and
globally. This extends beyond the obvious inancing
aspects and into managing indirect investment
opportunities, including private equity real estate,
unds o unds, etc. Firms will succeed i they can
provide innovation and accessibility to this important
asset class, while navigating changing regulations
and market conditions across the region. Demand or
real-estate assets is expected to remain high so whilesome major global institutions may have centers o
excellence in real estate, local and regional irms may
need to shore up their product availability and
services around real estate.
Specialization. Firms may need to involve
specialists/advisors in their advisory and product-
development processes. Advisors will also need to
be well-inormed about regulations, tax implications
and other issues contingent to buying and selling

8/8/2019 Asia-Pacific Wealth Report(2010)
http://slidepdf.com/reader/full/asia-pacific-wealth-report2010 21/32
212010 AsiA-PAcific WEALTH rEPorT
62 Asian Public Real Estate Association (APREA), 2010 – excludes figures from Australia
63
Michael Plummer and Jef f Rabin, Artvest Par tners, interviewed by Capgemini, New York, April-June 201064 Categories of passion investment researched for the World Wealth Report series
65 Michael Plummer and Jef f Rabin, Artvest Par tners, interviewed by Capgemini, New York, April-June 2010
real-estate assets in any given market. Increasingly,
strategic partnerships between global advisory and
local consulting irms are springing up to provide
specialized services in this ield.
REITs. The Asian REIT market, while still developing,
has nevertheless seen capitalization grow to US$70
billion in 2009 rom just US$2 billion in 2001.62 With
many more markets considering REIT legislation,
including China, investment demand is expected to
rise. Deregulation in countries such as Malaysia could
also make it easier or both domestic and oreign
investors to buy REITs. Firms have a good
opportunity to transer knowledge rom more
developed REIT markets into their Asia-Paciic
operations, and develop regional REIT platorms/
strategies in line with local REIT legislation to provide
customized oerings to their HNWI clients.
Asia-Pacific HNWIs Sk Ot Tanibl-Asst Invstmnts
Luxury goods makers and auction houses arereporting booming demand rom Asia-Paciic asthe region continues to see HNWI wealth grow asterthan in other regions. However, these purchasesby HNWIs are indicative o the broader ainity Asia-Paciic investors have or tangible goods—and theestablished role o physical assets in inancial-investment strategies.
In the 2010 World Wealth Report, we looked at anemerging global trend in which some HNWIs areapproaching their passion investments as “investor-collectors.”63 These HNWIs see purchases o Art,
Jewelry, Gems and Watches and other categories otangible assets64 as good alternatives to purely inancialinvestments, and they acquire tangible assets partly ortheir potential to gain value. This is certainly part o thepsyche or Asia-Paciic HNWIs, who have long pursuedphysical investments such as gold and jewelry becauseo their tangible value, proven returns and relativesaety—and their potential to hedge against inancialpressures such as inlation and currency risk.
In act, while many inancial markets around the globehave begun to recover ater the crisis, Asia-PaciicHNWIs have continued to broaden their interests in
investments outside o inancial markets. HNWIs’interests in tangible assets now include a wide rangeo passion investments, including Art, Wine and manyOther Collectibles. Notably, though, while Asia-PaciicHNWIs are acting partly as “investor-collectors”65 inmaking these acquisitions, they also have along-standing ainity or tangible assets as part oa diverse portolio.
HNWIs ARE DRIVEN TO INVEST INTANGIBLE ASSETS BY MORE THANECONOMICS
Economic considerations, such as inancial returns,ear o inlation and currency risk, have clearlycontributed to the increase in HNWI investments intangible-asset classes worldwide. Some Asia-Paciicmarkets also lack the array o investment optionsavailable in more developed markets, making tangibleassets an easy choice. But some sociocultural actorsalso drive the partiality Asia-Paciic HNWIs have orsome o these assets. For example:
In some parts o Emerging Asia (China, India,
Indonesia and Thailand), the wealthy are wary o
sophisticated inancial instruments and are more
conservative in their investment strategies. Investing
in tangible assets is also key to ensuring true
diversiication and protecting against certain orms o
risk or many HNWIs in markets where the inancial
markets are more volatile or less predictable.
Rising aluence in the region has boosted demand or
all types o tangible assets in recent years, attracting
more auction houses and luxury goods retailers to sella broader array o assets into the market, and
providing more options or Asia-Paciic HNWIs.
Among the newly wealthy, status is oten revered,
prompting some HNWIs to acquire luxury assets such
as Art, luxury automobiles, etc., to enhance their
reputation and provide a means to display their wealth.
Traditions and cultural underpinnings inluence the
buy-and-hold approach o gold investments rom
HNWIs in countries such as India and China.

8/8/2019 Asia-Pacific Wealth Report(2010)
http://slidepdf.com/reader/full/asia-pacific-wealth-report2010 22/32
22 2010 AsiA-PAcific WEALTH rEPorT
66 Brook Larmer, “The Real Price of Gold,” National Geographic, January 200967 Refers only to India, China, Hong Kong, Taiwan, Japan, Indonesia and Vietnam
68 Capgemini analysis, 2010
69 “Antwerp Diamond Day Celebrated,” China Daily, June 8, 2010, http://www.chinadaily.com.cn/china/2010expo/2010-06/08/content_9947489.htm
70 “2009 Art Market Trends,” March 2010, Artprice.com
71 The International Art Mar ket 2007-2009, Trends in Ar t Trade during Recession, TEFAF
In 2009, auction houses rom all over the world alsoreported strong buying interest rom Asia-PaciicHNWIs or tangible assets such as high-end jewelry,gems, Art, and Fine Wine. That buying interest hasincreased so much that both Sotheby’s and Christie’snow count Hong Kong as their No. 3 auction center,ollowing London and New York. Indeed, Asia-Paciic
investors have clearly become a orce in these markets,as evidenced by the ollowing:
While Hong Kong is still the region’s predominant
buyer o polished diamonds, retail demand is surging
in China, where diamonds have become revered as
wedding tokens and sought ater by the young and
newly wealthy. For example, Belgian oicials recently
said they expected one in every two polished
diamonds rom Antwerp to be sold to a Chinese
buyer within ive years.69 (Antwerp is a major global
distribution center or diamonds.)
China has become the third-largest Art auction
market globally ater increasing its share rom 7.2%
o the global Fine Art auction market in 2008 to 17.4%
in 2009.70 Elsewhere in Asia-Paciic, other Art markets
are smaller in size, but have been growing steadily.
India’s market, or example, grew 6% in 2009.71
Traditionally, Art markets in Asia-Paciic have largely
been conined to China, India, Indonesia and more
recently Hong Kong. However, recent auctions in
Singapore have been very successul and with good
government support or Art, Singapore is increasingly
becoming the hub o South East Asia Art auctions.
Sotheby’s Asia reported that 57% o the wine sold at
its auctions in 2009 was acquired by Asian buyers,
mostly rom mainland China. Wine is an attractive
category or many new “investor-collectors” as it has
a lower entry point and is more readily accessible.
TANGIBLE ASSETS OFFER NEWOPPORTUNITY FOR WEALTHMANAGEMENT FIRMS
Asia-Paciic HNWIs have clearly become seriousbuyers o all kinds o tangible assets in recent years,
giving wealth management irms an opportunity tooer more services related to these asset classes,including storage services, diversiication services andadvice on regulatory and tax implications.
For wealth management irms, the main challenge liesin building requisite expertise, since their experiencewith these services has oten been limited to date.Some irms have started to oer more advice oninvestments such as art and gold as a way or
GOLD HOLDS SPECIAL APPEAL FOR ASIA-PACIFIC HNWIs
Asia-Paciic HNWIs have long valued gold because it isa relatively liquid asset and has the potential to hedgeagainst inlation and currency risk, but it also holdsspecial cultural appeal. It is widely used in celebrations,
including weddings and religious observances incertain countries, which uels continual demand. InIndia, or instance, gold is equated with ortune, anddespite meager per-capita income levels, thepopulation has hoarded up to 18,000 tons o gold—more than 40 times the amount held in the country’scentral bank.66
In act, Asia-Paciic67 is the largest gold-consumingregion in the world, accounting or 44% o the world’sconsumer demand in 2009. India and China togetheraccounted or more than one-third. Notably, while 72%o global consumer demand is or jewelry, Asian
HNWIs also invest heavily in bullion (bars and coins),which can be easily stored yet readily bought or sold.
This also relects the general preerence Asia-PaciicHNWIs have or buying physical assets, rather thanexchange-traded unds (ETFs) or gold options, eventhough these alternatives are available. Asian HNWIs,more so than their global counterparts, are more likelyto take physical delivery o gold.
HNWIs FROM DEVELOPING ASIAPREFER “JEWELRY, GEMS AND
WATCHES” AS A CATEGORY; THOSEFROM INDUSTRIALIzED ECONOMIESFAVOR “LUxURY COLLECTIBLES”
Asia-Paciic HNWIs’ preerence or durable, tangibleinvestments is evident too in their purchases o passioninvestments. O Asia-Paciic HNWIs’ total suchinvestments in 2009, 61% was dedicated to thecategories o Jewelry, Gems and Watches, Art andOther Collectibles, up rom 52% in 2006.68 However,preerences are not uniorm across Asia-Paciic.
For example, HNWIs rom the Industrialized economiesin Asia-Paciic (e.g., Australia, Japan) avor LuxuryCollectibles such as jets, yachts and luxuryautomobiles. Those rom Emerging Asia are more likelyto esteem Jewelry, Gems and Watches (see Figure 10).
Notably, HNWIs rom the Newly Industrializedeconomies o Hong Kong, Singapore and Taiwanallocated as much as 20% o their passion investmentsin 2009 to Other Collectibles, the category thatincludes wines, coins, memorabilia, antiques, etc.

8/8/2019 Asia-Pacific Wealth Report(2010)
http://slidepdf.com/reader/full/asia-pacific-wealth-report2010 23/32
232010 AsiA-PAcific WEALTH rEPorT
investors to diversiy their portolios and hedgeagainst risks such as inlation and currency exposure.But this is new territory or many o them, as HNWIshave typically turned to domain experts in the past tomanage their speciic tangible-assets interests. Anassociated challenge or irms is the measurementand attribution o portolio perormance. As tangible-
asset holdings become more diverse, or instance, itbecomes more diicult to value these holdings, andincorporate those valuations into portolio-perormance tracking.
Ultimately, wealth management irms may considerestablishing stronger partnerships with auctionhouses, storage acilities and trading irms to expandtheir oerings in this area. Indeed, the SingaporeFreePort, which has its own state-o-the-artmaximum-security vault, equipped to housecollections and other valuables, oers even non-residents and investor-collectors a place to store
valuables, collections and other tangible assets.
Asia-Paciic HNWIs are likely to continue investing intangible-asset classes to diversiy their portolios incoming years, even as inancial markets eventuallyrecover. Wealth management irms need to plan theirstrategy or serving these clients well—especiallysince the ranks o the wealthy are likely to expandgiven the region’s positive economic outlook andrising levels o wealth.
In particular, irms will need to:
Understand the drivers o demand (cultural, inancial,
etc.) and the role o tangible assets in HNWI
portolios (diversiication, saety, hedge, etc.).
Take proper account o tangible assets in portolio
measurement and management, as well as in
diversiication strategies.
Make sure advisors are properly educated on these
issues so as to provide appropriate and value-added
products and services to the right HNWI segments.
Consider partnerships with third parties (auction
houses, reeports, storage acilities) to ensure client
access to value-added services.
Stay abreast o the regulatory and tax implications
o buying and selling tangible assets in dierent
markets.
While inancial markets may be recovering, tangibleassets will continue to be a preerred asset class or Asia-Paciic HNWIs or reasons that go ar beyondeconomics. And importantly, while some tangibleassets may have particular cultural signiicance, othersare simply seen by HNWIs as preerred alternatives tosophisticated and opaque inancial products—products that many associate directly with the inancialmeltdown. Wealth management irms will need tounderstand the enduring role o these tangible assetsto serve Asia-Paciic HNWIs eectively.
FIguRe 10. Breakdown o Asia-Paciic HNWI Passion Investments, 2009 (by Market)
(%)
0
25
50
75
100
TaiwanSingapore South
Korea
MalaysiaJapanIndonesiaIndiaHong KongChina Australia
%
32%
26%
30%
20%
24%
12%
9% 5%5%
17%
33%
27%
16%
12%
13% 10% 20%9%
18% 16%16%
20%20%
7%
30%
11%
16%
29%
13%
4%8%6%
7%
6%
34%
7%
36% 36%
17%
7%
26% 23%
23%20%
21%29% 29% 27%
27%
22%
28%
30%
2% 2%1% 1% 1%2%
Miscellaneous
a
Sports Investmentsb
Art
Jewelry, Gems &
Watches
Luxury Collectiblesd
Other Collectiblesc
a “Miscellaneous” represents club memberships, travel, guns, musical instruments, etc. b “Sports Investments” represents sports teams, sailing, race horses, etc.c “Other Collectibles” represents coins, wine, antiques, etc. d “Luxury Collectibles” represents automobiles, boats, jets, etc.Note: Percentages may not total 100% due to roundingSource: Capgemini/Merrill Lynch Financial Advisor Survey, March 2010

8/8/2019 Asia-Pacific Wealth Report(2010)
http://slidepdf.com/reader/full/asia-pacific-wealth-report2010 24/32
24 2010 AsiA-PAcific WEALTH rEPorT
NEW TRAITS EMERGE IN ASIA-PACIFIC HNWIs POST-CRISIS
Th rcnt lobal financial crisis markd th sddn ndof a lon bll markt in Asia-Pacific. This was a stnnindvlopmnt for th rion’s HNWIs, who had com toxpct sinificant rtrns on almost any invstmntstraty. Morovr, fw had flly ralizd th xtnt to which th fat of Asia-Pacific’s markts was connctd toothr rions of th world.
In th aftrmath of th crisis, Asia-Pacific HNWIs wrforcd to rvalat thir invstmnt oals, stratis,asst allocations and risk profils. And mch likinvstors arond th world, Asia-Pacific HNWIs hav
dvlopd a hihtnd snsitivity to risk, ar nrally mor catios abot invstin, ar kn to achiv morbalancd asst allocations in thir portfolios and ar mornad in thir rlationships with walth manamntfirms and advisors.
In fact, whil many of Asia-Pacific’s stock marktsrbondd sharply in 2009, Asia-Pacific HNWIsnrally did not rsh hadlon into th rcovry. Rathr,post-crisis, Asia-Pacific HNWIs ar:
More sensitive to the threat of losses than the hope of
returns. Whil stock markts across Asia-Pacific srdin rcovry, many HNWIs did not pln back into thmarkts as thy miht hav pr-crisis whn rtrnssmd almost arantd. This cation illstrats thnw awarnss amon Asia-Pacific HNWIs that any pward markt trnd can b fltin ivn thstarin losss many markts sffrd drin thcrisis, and short-trm stratis in prsit of rtrnsmiht not b th bst track, ivn som clints’ lonr-trm financial oals. This mor discrnin and oal-basd approach to invstin marks a distinct shift inpsych amon Asia-Pacific HNWIs compard with
bfor th crisis.
More aware of their true risk appetite. Risk awarnss was lss prononcd drin th bll markt, whn Asia-Pacific HNWIs may hav takn risks that xcdd
thir actal risk apptit bt sldom qstiond thosinvstmnt dcisions as portfolios nrally nratdood rtrns anyway.
More engaged in interactions with advisors and wealth
management firms. Bfor th crisis, firms andadvisors wr abl to satisfy clints with a rlativly limitd slction of prodcts—nrally thos prodcdin-hos. Now, Asia-Pacific HNW clints want a widrchoic of prodcts, yt mor cstomization, as wll asmor d dilinc. Thy ar takin lonr to commit,prolonin th invstmnt cycl.
More focused on balanced asset allocation.
Whnmarkts wr continally risin, th main focs of Asia-Pacific HNW invstors was on prsin rtrns,rathr than achivin balancd asst allocations orliqidity in portfolios. Bt thos who wr hihly lvrad lost th most walth drin th crisis, andralizd thir portfolios lackd adqat liqidity. Now, walth manamnt firms ar hlpin HNWIs torvalat how to achiv mor balanc in thir asstallocations so as to mt lonr-trm objctivs, sch asfndin thir rtirmnt or othr financial oals, schas capital prsrvation vs. cration.
Th post-crisis attitds of Asia-Pacific HNWIs rflctthir fndamntal nd to bttr ndrstand what thy ar invstin in, whr it’s hld and how it is vald, as wll as thir dsir for val-addd advic and invstmntchoics that ar consistnt with thir risk profils andinvstmnt oals. For walth manamnt firms, thsnds translat into nw dmands in thr critical aras:
Transparency and Simplicity. Many HNW clints fltblindsidd by crisis-rlatd losss bcas thy had notflly ndrstood th prodcts, valations, risks,
Asia-Paciic HNWIs, like their counterparts globally, have been orever changed by the eects o the globalinancial crisis. But as wealth management irms try to adapt their strategies to meet the new needs o HNWclients, they ace issues o investor diversity, industry maturity, market evolution and regulation that are uniqueto the region, and which make it challenging to implement strategic change.
Spotliht: WeALTH MANAgeMeNT FIRMS IN ASIA-PACIFICFACe uNIQue CHALLeNgeS IN ADAPTINg THeIR
STRATegIeS TO MeeT NeW CLIeNT DeMANDS

8/8/2019 Asia-Pacific Wealth Report(2010)
http://slidepdf.com/reader/full/asia-pacific-wealth-report2010 25/32
2010 AsiA-PAcific WEALTH rEPorT 25
sPoTLiGHT 2010
prformanc, and f strctrs in which thy wrinvolvd. Now, thy xpct fllr prodct disclosrstatmnts, so thy know xactly what thy arinvstin in, and thy xpct bttr and mor frqntrportin of portfolio activity and prformanc.
Value of Advice. As HNW clints considr thirinvstmnt choics in mor dtail, thy incrasinly xpct spcializd and objctiv invstmnt advic and want to b sr th proposd invstmnt stratis alin with thir financial oals and risk profil.
Portfolio and Risk Management. Aftr th losss of th crisis, Asia-Pacific HNWIs ar spcially kn tondrstand whr th risks li in thir portfolios and toachiv mor balancd asst allocations. As a rslt,thy want mor vidnc (.., risk-scnario analysis) toid thir invstmnt dcisions.
Notably, Asia-Pacific HNWIs’ xpctations ar vry similar to thos of thir HNW contrparts worldwid,bt thir dmands crat spcial and challninimplications for walth manamnt firms in Asia-Pacific. As firms sk to adapt thir stratis to srvHNWIs mor ffctivly, nw clint dmands arspcially xrtin intns prssr on product andservice offerings and client servicing models. In thprocss, th critical shorta of walth manamnttalent in th rion is bcomin vry vidnt.
Asia-Pacific Wealth Management Firms Are
Tackling Challenges in Products and Services,Client Servicing Models and Talent
Walth manamnt offrins ar constantly volvin,bt thr was littl rason for Asia-Pacific firms tochan radically drin th xtndd bll markt, whninvstmnt rtrns cold b fond fairly asily, andHNW clints wr widly accptin of th prodctchoics proposd by firms—vn thoh offrins rlidhavily on in-hos prodcts.
Post-crisis, howvr, Asia-Pacific walth manamnt
firms will nd to work hard to satisfy th nw andvolvin nds of thir HNW clints. In skin todlivr a proposition that mts HNWIs’ lvatdstandards, firms will nd to rvalat th prodcts andsrvics thy offr, and th way in which thy intract with and srvic clints—as wll as th oprationalspport ndd to dlivr on that proposition. This task isnot asy in a rion whr markts ar hihly divrs, andstraty xction can vary widly btwn sb-rionsand vn typs of firms within sb-rions.
Products and ServicesMtin Asia-Pacific HNWIs’ dmands for an xpanddor spcializd prodct offrin may sond asy noh,bt shiftin prodct and srvic offrins dfy th statsqo amon many walth manamnt firms. RionalFirms in particlar hav contind to rly on propritary
prodcts lon aftr Firms in mor dvlopd marktshav mbracd opn architctrs and hih-nd srvicsto dlivr to nich smnts or broadn thir offrins.
Som Asia-Pacific firms wr not motivatd to vr farfrom propritary prodcts in th past, bcas thy coldprotct marins and fs (which ar hihr on in-hosprodcts) withot displasin HNW clints. In fact,clints wr nrally happy with thir rtrns in thrion’s boom yars and wr larly indiffrnt tocomptin prodcts. Now, howvr, Asia-Pacific f irmscold los HNW clints if thy cannot provid thm with
accss to a mor comprhnsiv and rlvant offrin thattrly alins with thir individal risk and asst allocationprioritis—rardlss of whthr th prodcts ar sorcdfrom in-hos or from third partis.
Othr firms, rconizin that rality, ar alrady ravitatin toward opn architctrs and prodctpartnrships to widn thir prodct offrins and/orspplmnt xprtis. Bt whil ths approachs arprovn in dvlopd markts, thr ar sinificantrprcssions in Asia-Pacific whr bsinss modls,popl, oranizations, procsss and tchnoloy hav lonbn alind bhind th propritary-prodct approach.Som global Firms in th rion hav alrady startdlvrain a “idd” opn architctr, in whichprodcts ar prslctd from th “opn markt” andtmplatd to fit varios risk scnarios, mch lik modlportfolios. This is dsind to tak th sswork ot of th qation for lss xprincd advisors. Howvr,ivn th financial crisis, ths sam f irms rconiz thy nd to adopt a mor holistic and tailord approach todlivr what clints ar now dmandin.
As a rslt, adoptin an opn architctr, for instanc,has varios consqncs that prsnt nmroschallns to Asia-Pacific firms, incldin:
Client reporting and due diligence. If on firm offrsanothr’s prodcts, it will nd to mt rportin andcomplianc standards arond thos third-party prodctsas wll as its own. For a firm rliant on propritary prodcts, this will man chanin procsss andprotocols to captr additional lal disclaimrs anddisclosrs, valations and prformanc trackin, tc.

8/8/2019 Asia-Pacific Wealth Report(2010)
http://slidepdf.com/reader/full/asia-pacific-wealth-report2010 26/32
2010 AsiA-PAcific WEALTH rEPorT26
sPoTLiGHT 2010
Thy will also nd to b abl to show rportin onpotntial volatility attribtd to thos prodcts on clintstatmnts and rcords.
Advice on third-party products. Firms will nd totrain advisors to b proficint in discssin prodctspcifics and risks, incldin ways in which in-hosand third-party prodcts compar and contrast inmtin a clint’s financial oals and risk apptit.
Risk modeling. To proprly mana risk and balancasst allocations, firms will nd to b abl to valthird-party prodcts accratly, track thirprformanc and proprly ndrstand th corrlationsto in-hos and othr third-party prodcts in aclint’s portfolio. This will rqir nw modlsand nw capabilitis.
Other operational issues. Platforms will nd to bintratd to nsr samlss accss to third partis
and thir prodcts, as wll as th information (..,disclosrs) arond th prodcts.
evn if firms can ovrcom th challns of implmntin opn architctrs and partnrships, thsstratis cannot ovrcom all th challns of dsinincomprhnsiv prodct and srvic offrins in Asia-Pacific. Aftr all, diffrnt markts ar at diffrnt stasin thir dvlopmnt, and rlation may limit ky prodcts and srvics in a ivn firm’s offrin.
For xampl, th prodct ran (s Fir 11) ismanifold in Indstrializd Asia (Japan, Astralia, Nw Zaland), bt mdim to low, dpndin on th prodct,in th markts of Nwly Indstrializd Asia (Sinapor,Hon Kon, Soth Kora and Taiwan) and emrinAsia (China, India, Indonsia and Thailand).
This crats challns for firms whn thir HNW clints hav sophisticatd prodct nds, bt offrins arlimitd by th matrity of a contry’s financial systm orby prodct-spcific rlation. In Japan, for xampl,HNWIs show considrabl intrst in sccssionplannin, bt rlation prohibits trst srvics thatmiht b commonly fond in North Amrica or erop. Ths, firms nd to work within th rlatory framwork to find altrnativs for clints.
In contris lik India, ReITs, fixd-incom instrmnts
and commoditis markts ar still ndrdvlopd.Additionally, th activitis of crtain walth manamntfirms (.., forin vs. rional vs. local) may also blimitd by rlation.
Nvrthlss, it is clar that to mt th post-crisis ndsof Asia-Pacific HNWIs—and to catr ffctivly toHNWIs as th rion’s markts matr and th lvl of afflnc riss—walth manamnt firms nd toposition thmslvs now to row sccssflly. Tooprationaliz thir stratis for xpandin and
FIguRe 11. Maturity o Wealth Management Product Oerings in Various Sub-Regions within Asia-Paciic
Commodities
Derivatives
Exchange-Traded Funds
Hedge Funds
Loan Products
Private Equity
Insurance ProductsForeign Currency
Money Market Products
Fixed Income
Deposits and Savings
Structured Products
Real Estate
Equities
Industrialized Asia(Japan, Australia,
New Zealand)
Newly Industrialized Asia(Hong Kong, South Korea,
Singapore, Taiwan)
Emerging Asia(China, India,
Indonesia, Thailand)
Product Oerings
Sub-Regionswithin Asia-Pacifc
Very Low
Low
Medium
High
Very High
Source: Capgemini analysis, 2010

8/8/2019 Asia-Pacific Wealth Report(2010)
http://slidepdf.com/reader/full/asia-pacific-wealth-report2010 27/32
2010 AsiA-PAcific WEALTH rEPorT 27
sPoTLiGHT 2010
cstomizin prodcts, srvics and rlatd advic, many firms ar focsin on ncssary and rlatd chans inthir clint srvicin modl.
Client Servicing ModelsProdct and srvic stratis hav consqncs for
othr aspcts of walth manamnt oprations. Asfirms mov to opn architctrs, for xampl, not allthir popl may b knowldabl noh to addrssclint concrns abot prodct choic and sitability. Tooprationaliz prodct and srv ic stratis, som firmsar thrfor movin to clint srvicin modls that poolthir spcialists (.., prodct, risk, sctor/indstry xprts) cntrally.
Th spcialist pool can spport advisors in thirintractions with HNW clints whn advisors mihtothrwis b ill-qippd to hlp clints ndrstand th
array of prodcts, or xplain how th prodct choics alin with a clint’s portfolio stratis and financial oals.
Post-crisis, tam-basd advisory modls ar aininprominnc ovr individal advisory modls, bcas thy dlivr bnfits that alin wll with th chanin ndsof Asia-Pacific HNWIs, spcially:
Asset Allocation and Risk Management Expertise. Invstmnt and Portfolio Spcialists can hlp HNWIsto achiv mor balancd portfolio allocations in lin with thir invstmnt oals and risk apptits. Thy can
also mak sr to provid clints with adqat dtailon spcifics sch as liqidity, lock-p priods, rtrns,tc., and offr in-dpth rsarch on th risk particlarsof both in-hos and third-party prodcts, scnarioanalysis and prodct volatility.
Specialized, Consistent, Value-Added Advice. Thspcialists ar domain xprts and th modl nablsth Firm to dlivr consistnt advic vn if thclint-facin advisor chans. Th modl also providsfor a ddicatd advisor to maintain th clintrlationship, with hlp from th spcialists as ndd. Th modl allows HNWIs to intract with spcialistsand discss invstmnt choics mor thorohly,dmonstratin th val of advic.
Firms can also adapt ths tam modls accordin to thsiz of thir talnt pool, th firm’s siz, oraphic rach,
tart smnt, tc. For xampl, som firms s thcor-tam spcialists only for spcific clint nds thatcannot b mt by th front-lin advisor alon. By brininin a spcialist on an ad hoc basis, advisors can providclints with accss to a tam of xprts and spcialists thatar dirctly rlvant to thir nds at a ivn tim.
global banks miht s anothr adaptation that maksavailabl a tam of spcialists at th had offic and at thrional lvl (s Fir 12). This provids an vn widr st of spcialtis to th HNW clint (.., xprtsacross mor markts, indstry sctors and invstmnt
FIguRe 12. Core Team Model, Adapted to Suit Firms with a Large Geographic Footprint
Source: Capgemini analysis, 2010
Distributed Specialist Team Model
Specialists in theteam have expertisein diverse areas suchas fnancial markets,investment products,fnancial planning,corporate fnancing,
legal and audit, etc.
Senior fnancial advisoracts as a mentor to
junior fnancial advisor
Provide supportaccording to thespecial wealthmanagementneeds o HNWIs
Conduct trainingson standardiedproducts or advisorsand provide requiredsales support
Provide producttraining and support
Senior Financial Advisor
Financial Advisor
Client
Specialist Team(Headquarter)
Specialist Team(Regional Ofce)

8/8/2019 Asia-Pacific Wealth Report(2010)
http://slidepdf.com/reader/full/asia-pacific-wealth-report2010 28/32
2010 AsiA-PAcific WEALTH rEPorT28
sPoTLiGHT 2010
72
Capgemini/Merrill Lynch Financial Advisor Survey, 201073 Capgemini Executive Interviews, July 2010
prodcts, and in mor aras, sch as corporat financin,lal and adit). A variation of that modl provids snioradvisors as mntors to lss-xprincd tam mmbrs,ncorain knowld transfr.
Notably, thoh, ths clint srvicin modls hav
inhrnt challns. For on, spcialists oftn prfr to bot in th fild, and don’t ncssarily want to b “poold”bhind th scns. Thr ar also compnsation isss totackl, bcas only th rlationship manar has dirctaccss to th clint, bt clint profitability is clarly thrslt of th pool’s fforts.
Morovr, firms sin a spcialist-pool modl still ndto nsr thy dlivr aainst othr prioritis for Asia-Pacific HNWIs, incldin transparency . HNW clintsincrasinly xpct transparncy from firms as wll as thprodcts offrd, risk attribts, dtails on f strctrs,firm disclosrs, tc. So firms will nd to train thirclint srvicin oranization to ndrstand andcommnicat abot prodcts, risks and f strctrs,and dlivr appropriat and frqnt pdats on portfoliostats and prformanc.
In fact, th tam modls rqir a critical mass of spcialists to vn fnction, lt alon b ffctiv. Not allfirms in Asia-Pacific hav (or can acqir) noh talntto oraniz thmslvs in this way—or in nral to mtth mor xactin post-crisis standards of HNW clints.
Talent Management Adaptin to nw HNW nds is actally cratin intnsprssr on th “popl” straty at Asia-Pacific walthmanamnt firms. Post-crisis, for xampl, advisorsmst ndrstand asst allocation and risk manamntprincipls, provid d dilinc on prodcts and xplaincomptitors’ offrins. Bt xprtis is in short spply inAsia-Pacific, whr many advisors ar rlativly yonand inxprincd.
Data72 show that narly 60% of advisors in Asia-Pacific
xcldin Japan ar no mor than 40 yars old. By contrast, 85% of advisors in North Amrica and 50% inerop ar ovr a 40. Morovr, th avra advisor inAsia-Pacific xcldin Japan has jst 9.3 yars of xprinc and has bn at his/hr walth manamntfirm for lss than six yars. This compars with anavra in North Amrica of 23.8 yars of xprinc and20 yars of tnr.
Not srprisinly, thn, th most rnt nd of Asia-Pacific walth manamnt firms today is to train anddvlop front-lin advisors to mt nw clintxpctations. Spcifically, indstry xctivs bliv tharas in which advisors most nd additional trainin andspport ar advisory skills, domain knowld and
prodct knowld (s Fir 13).
Indd, firms ar alrady invstin sinificantly intrainin thir advisors, bcas thy s advisorcomptncy as a diffrntiator in today’s markts. Firmsar mployin mntorin systms to shar knowld andpartnrin xprincd advisors with mor jnior staff.Bdts ar incrasin to nsr advisors ar proprly qalifid and can dmonstrat th comptncis now xpctd by HNW clints, incldin spcialistknowld of prodcts (incldin thos from a thirdparty), risk manamnt and othr spcifics of invstin
stratis (.., bhavioral financ). gradat traininand/or intrnship prorams ar bin dsind intrnally or in allianc with local nivrsitis to tap into a widrbas of ftr talnt.
Bt to fill th talnt piplin, firms ar also lookin athirin intrnally from diffrnt fnctions within th widr oranization, and not jst hirin fromcomptitors—th straty on which most firms still rly.And in th hihly comptitiv markt, firms also nd aproactiv straty for rtainin talnt. Advisor rtntionis asir for a firm prcivd to hav a ood brand nam.Advisors ar also mor likly to stay at a firm thatspports thm with a wid ran of prodct offrins forclints, and provids thm with a dfind carr path andopportnitis for dvlopmnt. Nonthlss,compnsation and othr rmnration rmain importantcritria, althoh oranizational cltr (sch as work/lif balanc) is also a factor.73
Dvisin stratis sch as ths to acqir, dvlop andrtain advisor talnt for th lonr trm will b th ky tosccssfl rowth for walth manamnt firms in
Asia-Pacific, as talnt is alrady scarc and dmand isxpctd to kp rowin. And critically, any broadrattmpt to improv oprations, incldin prodctand srvic offrins and clint srvicin modls, willb thratnd if th rqisit skills and comptncisar lackin.
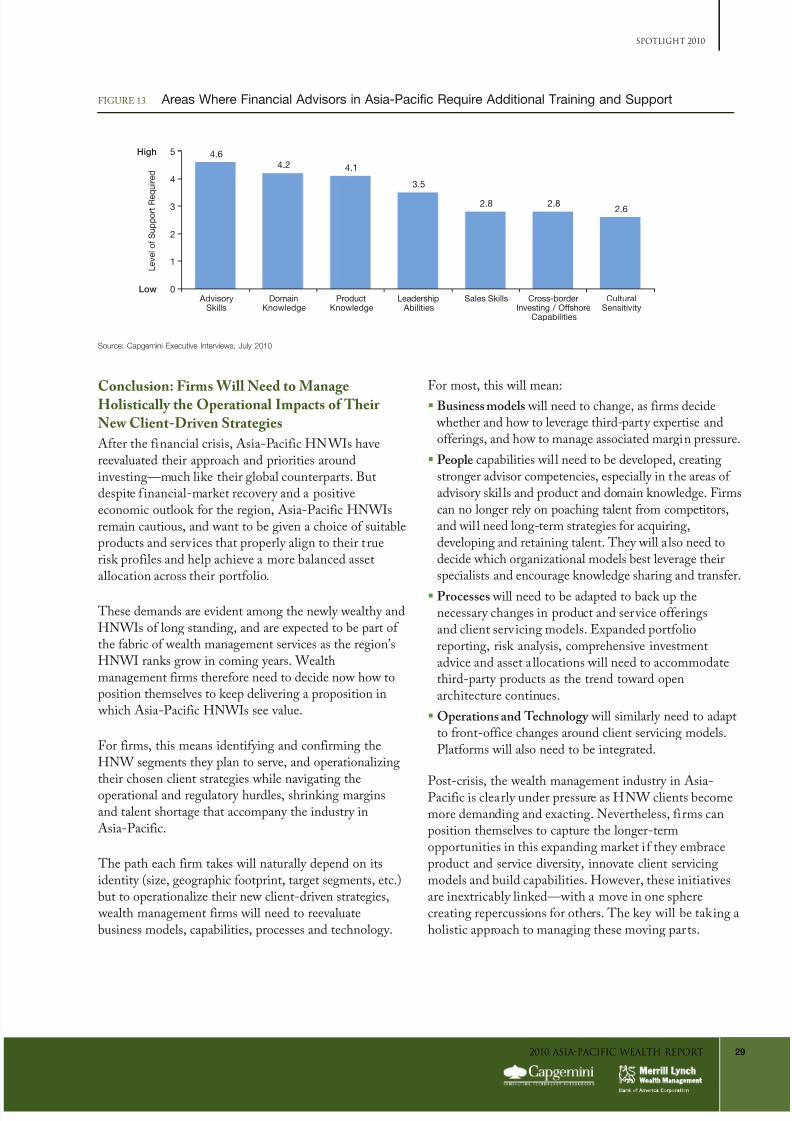
8/8/2019 Asia-Pacific Wealth Report(2010)
http://slidepdf.com/reader/full/asia-pacific-wealth-report2010 29/32
2010 AsiA-PAcific WEALTH rEPorT 29
sPoTLiGHT 2010
Conclusion: Firms Will Need to ManageHolistically the Operational Impacts of Their New Client-Driven Strategies
Aftr th financial crisis, Asia-Pacific HNWIs havrvalatd thir approach and prioritis arondinvstin—mch lik thir lobal contrparts. Btdspit f inancial-markt rcovry and a positivconomic otlook for th rion, Asia-Pacific HNWIsrmain catios, and want to b ivn a choic of sitablprodcts and srvics that proprly alin to thir trrisk profils and hlp achiv a mor balancd asstallocation across thir portfolio.
Ths dmands ar vidnt amon th nwly walthy andHNWIs of lon standin, and ar xpctd to b part of th fabric of walth manamnt srvics as th rion’sHNWI ranks row in comin yars. Walthmanamnt firms thrfor nd to dcid now how toposition thmslvs to kp dlivrin a proposition in which Asia-Pacific HNWIs s val.
For firms, this mans idntifyin and confirmin thHNW smnts thy plan to srv, and oprationalizin
thir chosn clint stratis whil naviatin thoprational and rlatory hrdls, shrinkin marinsand talnt shorta that accompany th indstry inAsia-Pacific.
Th path ach firm taks will natrally dpnd on itsidntity (siz, oraphic footprint, tart smnts, tc.)bt to oprationaliz thir nw clint-drivn stratis, walth manamnt firms will nd to rvalatbsinss modls, capabilitis, procsss and tchnoloy.
For most, this will man:Business models will nd to chan, as firms dcid whthr and how to lvra third-party xprtis andoffrins, and how to mana associatd marin prssr.
People capabilitis will nd to b dvlopd, cratinstronr advisor comptncis, spcially in th aras of advisory skil ls and prodct and domain knowld. Firmscan no lonr rly on poachin talnt from comptitors,and will nd lon-trm stratis for acqirin,dvlopin and rtainin talnt. Thy will also nd todcid which oranizational modls bst lvra thirspcialists and ncora knowld sharin and transfr.
Processes will nd to b adaptd to back p thncssary chans in prodct and srvic offrinsand clint srvicin modls. expandd portfoliorportin, risk analysis, comprhnsiv invstmntadvic and asst allocations will nd to accommodatthird-party prodcts as th trnd toward opnarchitctr contins.
Operations and Technology will similarly nd to adaptto front-offic chans arond clint srvicin modls.Platforms will also nd to b intratd.
Post-crisis, th walth manamnt indstry in Asia-Pacific is clarly ndr prssr as HNW clints bcommor dmandin and xactin. Nvrthlss, firms canposition thmslvs to captr th lonr-trmopportnitis in this xpandin markt if thy mbracprodct and srvic divrsity, innovat clint srvicinmodls and bild capabilitis. Howvr, ths initiativsar inxtricably linkd—with a mov in on sphrcratin rprcssions for othrs. Th ky will b takin aholistic approach to manain ths movin parts.
FIguRe 13. Areas Where Financial Advisors in Asia-Paciic Require Additional Training and Support
0
1
2
3
4
5
CulturalSensitivity
Cross-borderInvesting / Offshore
Capabilities
Sales SkillsLeadership Abilities
ProductKnowledge
DomainKnowledge
AdvisorySkills
4.64.2 4.1
3.5
2.8 2.82.6
High
L e v e l o f S u p p o r t R e
q u i r e d
Low
Source: Capgemini Executive Interviews, July 2010

8/8/2019 Asia-Pacific Wealth Report(2010)
http://slidepdf.com/reader/full/asia-pacific-wealth-report2010 30/32
30 2010 AsiA-PAcific WEALTH rEPorT
The 2010 Asia-Pacific Wealth Report ocuses on 12 core markets: Australia, China,
Hong Kong, India, Indonesia, Japan, Malayasia, New Zealand, Singapore, South Korea,
Taiwan and Thailand. These markets together account or more than 95.0% o the
region’s GDP. The market-sizing model includes 18 countries and territories in its
Asia-Paciic coverage. The Economic Review section covers 11 o these core markets
excluding Malaysia. The Asset Allocation covers 10 markets excluding New Zealand
and Thailand. The Real Estate sidebar covers 10 o these core markets excluding New
Zealand and South Korea.
We estimate the size and growth o wealth in various regions using the Capgemini
Lorenz curve methodology, which was originally developed during consulting
engagements with Merrill Lynch in the 1980s. It is updated on an annual basis to
calculate the value o HNWI inancial wealth at a macro level.
The model is built in two stages: irst, the estimation o total wealth by country, and
second, the distribution o this wealth across the adult population in that country. Total
wealth levels by country are estimated using national account statistics rom
recognized sources, such as the International Monetary Fund and the World Bank, to
identiy the total amount o national savings in each year. These are summed over time
to arrive at total accumulated country wealth.
As this captures inancial assets at book value, the inal igures are adjusted based on
world stock indexes to relect the market value o the equity por tion o HNWI wealth. In
conjunction with the Economist Intelligence Unit’s eorts to provide the most accurate
data, select historical igures have been updated since publication in previous reports.
In 2005, we revised the methodology to move rom reporting only annual regional
indings to include country-level inormation. Wealth distribution, which diers by
country, is based on ormulized relationships between wealth and income. Data on
income distribution is provided by the World Bank, Global Insight, Economist
Intelligence Unit and countries’ national statistics. We then use the resulting Lorenz
curves to distribute wealth across the adult population in each country. To arrive at
inancial wealth as a proportion o total wealth, we use statistics rom countries with
available data to calculate their inancial wealth igures and extrapolate these indings
to the rest o the world. Each year, we continue to enhance our macroeconomic model
with increased analysis o domestic economic actors that inluence wealth creation.
We work with colleagues around the globe rom several irms to best account or the
impact o domestic, iscal and monetary policies over time on HNWI wealth generation.
Our inancial asset wealth igures include the values o private equity holdings stated at
book value as well as all orms o publicly quoted equities, bonds, unds and cash
deposits. It excludes collectibles, consumables, consumer durables and real estateused or primary residences. Oshore investments are theoretically accounted or, but
only insoar as countries are able to make accurate estimates o relative lows o
property and investment in and out o their jurisdictions. We account or undeclared
savings in the report.
Given exchange-rate luctuations over recent years, especially with respect to the U.S.
dollar, we assess the impact o currency luctuations on our results. From our analysis,
we conclude that our methodology is robust and exchange rate luctuations do not
have a signiicant impact on the results. The translation to U.S. dollars is made using a
yearly average exchange rate. The WWR model calculates cumulative wealth in U.S.
dollar terms using a time series o data going back over 100 years, so the impact o a
sharp currency appreciation or a year or two has a negligible impact.
The inormation contained herein was obtained rom various sources; we do not guarantee itsaccuracy or completeness nor the accuracy or completeness o the analysis relating thereto.
This research report is or general circulation and is provided or general inormation only; any
party relying on the contents hereo does so at its own risk.
We would like to thank the following people for helping to compile this report:
Ilana van dr Lind, William Sllivanand Nikhil Shind from Capmini, forthir ovrall ladrship for this yar’srport; Sankt gpta, Dhawal Jadhav,Ashish Kanchan, Rajat Pal, and David Wilson, for rsarchin, compilin and writin th findins, as wll as providinin-dpth markt analysis; Bhshan Joshi,Lai Kin Foon, Wayn Li, and mmbrsfrom th Capmini Walth Manamnt
Practic, for thir insihts and indstry knowld. Additionally, Karn Schnidrand Lisa Bohnr for thir onoinspport lobally.
Slna Morris, Chia-Pck Won, andSnny Won from Mrrill Lynch, whoprovidd dirction, accss, indstry prspctiv and rsarch to nsrdvlopmnt of topical isss binaddrssd in th Financial Srvicsindstry; en gan Lim, Francis Li,Miwa Ohmori, Chris Slby, Atl Sinh, Wilson So, Sharmila Whlan and othr
Mrrill Lynch snior xctivs, whoprovidd xprt advic on indstry trnds.
W wold also lik to thank th hndrdsof financial advisors and rional xprtsfrom Capmini, Mrrill Lynch and othrinstittions who participatd in srvysand xctiv intrviws to validatfindins and add dpth to th analysis. W xtnd a spcial thanks to thos firmsthat av s insihts into vnts that arimpactin th Walth Manamntindstry on a lobal basis as wll as thosthat participatd in this yar’s Financial
Advisor Srvy and facilitatd thHNWI Clint Srvy.
ABN AMRO Bank Sinapor; ANZPrivat Bank; Artvst Partnrs; BNPParibas India; CIMB Invstmnt Bank;Citirop; Dtsch Bank Sinapor;HSBC India; ICICI Bank Ltd; JMFinancial Srvics Pvt Ltd; Kotak Mahindra Bank Ltd; Moran Stanly Privat Walth Manamnt India;National Astralia Bank; RliarMacqari Walth Manamnt; RoyalBank of Canada; Royal Bank of Scotland(Privat Bank) India; Standard ChartrdBank; unitd Ovrsas Bank.
Mthodoloy Mthodoloy

8/8/2019 Asia-Pacific Wealth Report(2010)
http://slidepdf.com/reader/full/asia-pacific-wealth-report2010 31/32
2010 AsiA-PAcific WEALTH rEPorT 31
METHodoLoGy
CAPGEMINI FINANCIAL SERVICES
Capmini, on of th world’s formost providrs of consltin, tchnoloy and otsorcin srvics, nabls its clints to transformand prform throh tchnolois. Capmini provids its clints with insihts and capabilitis that boost thir frdom to achivsprior rslts throh a niq way of workin, th Collaborativ Bsinss exprinc ™. Th grop rlis on its lobal dlivry modl calld Rihtshor®, which aims to t th riht balanc of th bst talnt from mltipl locations, workin as on tam tocrat and dlivr th optimm soltion for clints. Prsnt in mor than 30 contris, Capmini rportd 2009 lobal rvns of
euR 8.4 billion and mploys 90,000 popl worldwid.
Capmini’s walth manamnt practic can hlp firms from straty throh to implmntation. Basd on or niq insihts intoth siz and potntial of tart markts across th lob, w hlp clints implmnt nw clint stratis, adapt thir practic modls,and nsr soltions and costs ar appropriat rlativ to rvn and profitability xpctations. W frthr hlp firms dvlop, andimplmnt th oprational infrastrctrs—incldin opratin modls, procsss, and tchnolois—rqird to rtain xistinclints and acqir nw rlationships.
For mor information on how w can hlp yo, plas visit www.capmini.com/financialsrvics
For local wbsits and or stratic partnrs in Asia-Pacific, plas visit www.capmini.com/locations/asia_pacific
Select Capgemini Asia-Pacific Off ices
Capgemini Corporate Headquarters
Beijing +86 10 656 37 388
Chennai +91 44 6633 1000
Hong Kong +852 3512 3888
Hyderabad +91 40 2312 5000
Mumbai +91 22 6755 7000
Pune +91 20 2760 1000
Shanghai +86 21 6182 2688
Singapore +65 6224 6620
Sydney +61 2 9293 4000
Taipei +886 2 8780 0909
Paris +33 1 47 54 52 00 New York +1 212 314 8000
Mrrill Lynch global Walth Manamnt (gWM) is a ladin providr of comprhnsiv walth manamnt and invstmntsrvics for individals and bsinsss lobally. With mor than 15,100 Financia l Advisors and approximatly $1.4 trillion inclint assts as of Jn 30, 2010, it is amon th larst bsinsss of its k ind in th world. Mor than two-thirds of gWMrlationships ar with clints who hav a nt worth of $1 mil lion or mor. Within gWM, th Privat Bankin & Invstmntgrop provids tailord soltions to ltra hih nt worth clints, offrin both th intimacy of a botiq and th rsorcs of aprmir lobal financia l srv ics company. Ths clints ar srvd by mor than 160 Privat Walth Advisor tams, alon withxprts in aras sch as invstmnt manamnt, concntratd stock manamnt and intrnrational walth transfr stratis.Mrrill Lynch Walth Manamnt is part of Bank of Amrica Corporation.
MERRILL LYNCH GLOBAL WEALTH MANAGEMENT
Select Merrill Lynch Asia-Pacific Offices
Bangkok +662 685 3548Beijing +86 10 6535 2788
Fukuoka +81 92 715 0030
Hong Kong +852 2844 5678
Mumbai +91 22 6632 8000
Nagoya +81 52 217 2900
Osaka +81 6 6344 1258
Seoul +82 2 3707 0400Shanghai +86 21 6132 4888
Singapore +65 6331 3888
Sydney +61 2 9225 6500
Taipei +886 2 8758 3600
Tokyo +81 3 6225 8300
Pasadena +1 626 817 6888
San Francisco +1 415 693 5500
New York +1 212 236 2128
Select U.S. Cities Serving Asian Clients

8/8/2019 Asia-Pacific Wealth Report(2010)
http://slidepdf.com/reader/full/asia-pacific-wealth-report2010 32/32
For more inormation, please contact: [email protected]
For Capgemini press inquiries, please contact:
Lisa Boughner at +1-312-451-8338
For Merrill Lynch Wealth Management press inquiries, please contact:
Chia-Peck Wong at +852-2161-7746 (Asia-Paciic)
Selena Morris at +1-212-236-2272 (Global)
© 2010, Merrill Lynch and Capgemini. All rights reserved.
©2010 Capgemini and Merrill Lynch Wealth Management. All Rights Reserved. Capgemini and Merrill
Lynch Wealth Management, their services mentioned herein as well as their respective logos, are
trademarks or registered trademarks o their respective companies. All other company, product and
service names mentioned are the trademarks o their respective owners and are used herein with no
intention o trademark inringement. No part o this document may be reproduced or copied in any ormor by any means without written permission rom Capgemini and Merrill Lynch Wealth Management.
Disclaimer:
The material herein is or inormational purposes only and is not directed at, nor intended or
distribution to or use by, any person or entity in any country where such distribution or use would be
contrary to law or regulation or which would subject Bank o America Corporation or its subsidiaries,
including Merrill Lynch, or Capgemini to any licensing or registration requirement within such country.
This is not intended to be either a speciic oer by any Bank o America or Merrill Lynch entity to sell or
provide, or a speciic invitation to apply or, any particular inancial account, product or service. Bank o
America and Merrill Lynch do not oer accounts, products or services in jurisdictions where they are
not permitted to do so, and, thereore, the Merrill Lynch Wealth Management business is not available
in all countries or markets.
Bank o America Corporation is not an Authorised Deposit-taking Institution within the meaning o the
Banking Act 1959 o Australia nor is it regulated by the Australian Prudential Regulation Authority.
The inormation contained herein is general in nature and is not intended, and should not be construed,
as proessional advice or opinion provided to the user, nor a recommendation o any particular
approach. This document does not purport to be a complete statement o the approaches or steps that
may be appropriate or the user, does not take into account the user’s speciic investment objectives or
risk tolerance and is not intended to be an invitation to eect a securities transaction or to otherwise
participate in any investment service. Rather, this document is meant solely to provide potentially
helpul inormation to the user and is provided on an “as-is” basis.
Capgemini and Merrill Lynch disclaim any and all warranties o any kind concerning any inormation
contained in this document.