asia pacific daily 1 august 2016 - cimb · eye on macau vol.37: jul mass table analysis- ......
TRANSCRIPT
Equity research│August 1, 2016
IMPORTANT DISCLOSURES, INCLUDING ANY REQUIRED RESEARCH CERTIFICATIONS, ARE PROVIDED AT THE END OF THIS REPORT. IF THIS REPORT IS DISTRIBUTED IN THE UNITED STATES IT IS DISTRIBUTED BY CIMB SECURITIES (USA), INC. AND IS CONSIDERED THIRD-PARTY AFFILIATED RESEARCH.
Powered by the EFA Platform
Asia Pacific Daily - 1 August 2016
Equity Research Reports…
▌IDEA OF THE DAY | Vietnam Strategy Note - Vietnam’s stock market at an 8-year high | P2 Vietnam’s VN-Index (VNI) broke out of its two-year trading range, while CIMB’s top picks outperformed the VNI by 14% YTD (vs. 30% outperformance in 2015) Sentiment is being boosted by the removal of foreign ownership limits (FOL) on Vinamilk and other stocks, as well as by growing confidence in the new government Valuation is still reasonable at 13x FY16 P/E, versus 13% expected EPS growth The VNI already hit our 648 target price (+12%), so we’re lifting our target price by 7% to 694 (+20%); we expect the VNI to test (but not break) the 700 level in Q4.
———————————————————————————————————————————————————————————————————————————————————————
▌Australia BHP Billiton (ADD, tp:A$26.30) - One offs tipped for result | P3 Byron Energy (ADD, tp:A$0.44▲) - SM71 valuation underpins a higher price | P4 CYBG PLC (HOLD, tp:A$3.75) - 3Q16 trading update | P5 Mineral Deposits (ADD, tp:A$0.96) - June Q production and HY (loss) | P6 ———————————————————————————————————————————————————————————————————————————————————————
▌China/Hong Kong Want Want China (HOLD, tp:HK$5.00▼) - Reporting currency changed to Rmb | P7 Wynn Macau (HOLD, tp:HK$11.93) - Helped by high win rate | P8 ———————————————————————————————————————————————————————————————————————————————————————
▌Indonesia Gudang Garam (ADD, tp:Rp92,000.00▼) - Seasonal pressure | P9 Mayora Indah (ADD, tp:Rp46,000.00) - Recovery intact, margin hit by sugar | P10 Property Devt & Invt (OVERWEIGHT) - 2Q16 results: pressure on earnings remains | P11 ———————————————————————————————————————————————————————————————————————————————————————
▌South Korea Amorepacific Corp (ADD, tp:W520,000.00▼) - Focus on the big picture | P12 Industrial Bank of Korea (HOLD, tp:W12,700.00) - Stable but not attractive | P13 Samsung Card (ADD, tp:W59,000.00▲) - Capturing future growth | P14 ———————————————————————————————————————————————————————————————————————————————————————
▌Malaysia Felda Global Ventures (ADD, tp:RM2.08) - The way forward to improve earnings | P15 Malaysia Airports Holdings (ADD, tp:RM8.30▲) - Golden opportunity to accumulate | P16 Agribusiness (NEUTRAL) - Gauging sentiment on the palm oil sector | P17 Banks (OVERWEIGHT) - Jun 16 tracker – working hard to limit impaired loan ratios | P18 ———————————————————————————————————————————————————————————————————————————————————————
▌Singapore CDL Hospitality Trust (HOLD, tp:S$1.43▼) - 2QFY16: RevPAR decline re-accelerates | P19 Far East Hospitality Trust (HOLD, tp:S$0.65) - Blame it on June and the renovations | P20 mm2 Asia (HOLD, tp:S$0.73) - A beginning song | P21 Singapore Airlines (HOLD, tp:S$12.67▲) - Core earnings continue to be under pressure | P22 ———————————————————————————————————————————————————————————————————————————————————————
▌Taiwan Advanced Semiconductor (ADD, tp:NT$43.00▲) - Getting back on course | P23 Delta Electronics Inc (HOLD, tp:NT$177.00▲) - Steadily improving | P24 Innolux (HOLD, tp:NT$12.90▲) - Panel price hike already priced in | P25 ———————————————————————————————————————————————————————————————————————————————————————
▌Thailand Jasmine Broadband Internet Infrastructure Fund (ADD, tp:THB13.50) - Stable high yield with growth potential | P26 PTT (ADD, tp:THB389.00) - An attractive utilities gas play | P27 PTT Exploration And Production (ADD, tp:THB94.00) - Superior cost control is a key winning factor | P28
Sources: CIMB. COMPANY REPORTS
Showcasing CIMB Research Ideas
HKG: Gaming 28/07 Eye on Macau Vol.37: Jul mass table analysis- premium mass boost >PDF
———————————————————————————————————————————————————————————————————————————————————
THB: WHA Premium Growth Freehold and Leasehold REIT 26/07 Potential shelter from the storm >PDF
———————————————————————————————————————————————————————————————————————————————————
IND: Astra International 25/07 2Q preview: Slippery earnings, bright macro >PDF
———————————————————————————————————————————————————————————————————————————————————
TWN: General Interface Solution 24/07 Exploiting synergy from group consolidation >PDF
———————————————————————————————————————————————————————————————————————————————————
MAL: Strategy Note - Alpha Edge 20/07 Asia turning bullish >PDF
Regional Equity Research Contacts
Michael GREENALL, CFP Regional Head of Research/Head of Research Msia T: (60) 3 2261 9088 E: [email protected]
———————————————————————————————————————————————————————————————————————————————————
Show Style "View Doc Map"
CIMB Conference / Events |
CIMB 10th Annual Indonesia Conference 08-12 August 2016, Bali - Indonesia
———————————————————————————————————————————————————————————————————————————————————

Vietnam│Equity research│July 30, 2016
Strategy Note
THIS REPORT IS PREPARED IN ASSOCIATION WITH VNDIRECT SECURITIES CORPORATION. PLEASE SEE DISCLAIMER AND IMPORTANT NOTICES APPEARING AT THE END OF THIS DOCUMENT. IMPORTANT DISCLOSURES, INCLUDING ANY REQUIRED RESEARCH CERTIFICATIONS, ARE ALSO PROVIDED AT THE END OF THIS REPORT. THIRD-PARTY AFFILIATED RESEARCH.
Powered by the EFA Platform
Vietnam Strategy Vietnam’s stock market at an 8-year high
Vietnam’s VN-Index (VNI) broke out of its two-year trading range, while CIMB’s top ■picks outperformed the VNI by 14% YTD (vs. 30% outperformance in 2015)
Sentiment is being boosted by the removal of foreign ownership limits (FOL) on■Vinamilk and other stocks, as well as by growing confidence in the new government
Valuation is still reasonable at 13x FY16 P/E, versus 13% expected EPS growth■The VNI already hit our 648 target price (+12%), so we’re lifting our target price by■7% to 694 (+20%); we expect the VNI to test (but not break) the 700 level in Q4
Strong stock market performance, despite Brexit and weak H1 GDP Vietnam’s 1H16 GDP growth was below expectations, but stock prices continued rising because weak H1 growth ensures ample liquidity (M2 grew 20% yoy in H1), and the H1 economic statistics revealed strength behind the headline figures; growth was held back by low oil prices and Vietnam’s worst drought in decades, but consumer spending grew 8% yoy, buoyed by strong consumer confidence, and manufacturing output grew 10%.
Sentiment boosted by FOL removal & new government The elimination of foreign ownership limits (FOL) has a profound impact on Vietnam’s stock market because it will enable the participation of a much wider range of investors in the local market, and because foreigners will now be able to directly influence the stock prices of companies like Vinamilk (VNM’s FOL has been full for years). Lifting FOL’s also demonstrates the new government’s commitment to reforms, further solidifying the esteem investors have for the county’s new, technocratic politburo.
The VND exchange is stable The SBV implemented a more flexible currency management regime this year – so the VND only depreciated by about 1% YTD. The currency is also firm because Vietnam ran a US$1.7b trade surplus in 1H16 vs. a US$3.5b deficit in 1H15, and because in CPI inflation is 2.5%. We forecast a 1% C/A surplus and a 3% BoP surplus this year, supported by 6.7%/GDP of overseas remittances and 7.4%/GDP of FDI inflows.
Vietnam has a good “LEVIS” fit - so we’re lifting our target price 7% Vietnam’s stock market scores well on the “LEVIS” stock market analysis framework: (L)iquidity is abundant, FY16 (E)arnings growth prospects continue to look good (note that Vietnamese companies are just starting to report their H1 earnings figures & it’s too soon to look at FY17 earnings in Vietnam), (V)aluation is still reasonable on a PEG basis, (I) interest rates are a bit high – which is the only LEVIS criteria for which Vietnam does not “check the box”, and (S)entiment is very positive – as evidenced by strong consumer survey data. The market already hit our 2016 target for the VNI – so we’re raising our target price by another 7%; we like VNM, MWG, VIC, and PVS.
[ X ]
Figure 1: The VN-Index broke out of its long-standing trading range
SOURCES: CIMB, NEILSEN
▎Vietnam
Highlighted companies
Mobile World (ADD; TP VND144,000)
Vietnam’s leading mobile phone retailer is now aggressively growing its home electronics chain. The total number of its outlets doubled over the last year, so earnings grew 86% yoy in 5M15. MWG is trading at 12X FY16 P/E, versus ~50% expected EPS growth.
Vingroup (ADD; TP VND64,000)
Vietnam’s leading real estate developer is benefitting from the country’s buoyant property market. The company’s pre-sales surged 180% last year, which should drive 180% FY16 EPS growth. VIC is trading at a 20% discount-to-NAV.
Vinamilk (ADD; TP VND177,000)
Vietnam’s leading consumer company is a perpetual favourite with foreign investors – and the foreign ownership limits that previously restricted their VNM share purchases have now been eliminated. VNM is trading at 21x FY16 P/E vs 23% EPS growth
Ample liquidity to fuel asset prices
AC Nielsen’s VN Consumer Confidence
Analyst(s)
Michael KOKALARI, CFA
T (84) 90 797 4408 E [email protected]
Title:
Source:
Please fill in the values above to have them entered in your report
450
500
550
600
650
700
Jun-14 Sep-14 Dec-14 Mar-15 Jun-15 Sep-15 Dec-15 Mar-16 Jun-16
Title:
Source:
Please fill in the values above to have them entered in your report
0.0%
5.0%
10.0%
15.0%
20.0%
25.0%
30.0%
2009 2010 2011 2012 2013 2014 2015 5M16
M2 growth (yoy)
Title:
Source:
Please fill in the values above to have them entered in your report
80
85
90
95
100
105
110
115
4Q12 2Q13 4Q13 2Q14 4Q14 2Q15 4Q15
2
Mining│Australia│Equity research│July 29, 2016
IMPORTANT DISCLOSURES REGARDING COMPANIES THAT ARE THE SUBJECT OF THIS REPORT AND AN EXPLANATION OF RECOMMENDATIONS CAN BE FOUND AT THE END OF THIS DOCUMENT. MORGANS FINANCIAL LIMITED (ABN 49 010 669 726) AFSL 235410 - A PARTICIPANT OF ASX GROUP
Powered by EFA
BHP Billiton
One offs tipped for result
BHP has announced it will recognise a provision in the range of US$1.1-$1.3bn for ■the Samarco incident in its upcoming FY16 result.
The provision is equivalent to approximately half of the current estimate for ■Samarco’s funding obligations under the framework entered into in March.
In terms of cash outlays relating for Samarco, we assume approximately ■~US$250m is paid by BHP in FY17.
From FY18 onwards we assume Samarco will restart and self-fund ongoing ■remediation and compensation under the agreed framework.
The complex legal process continues in Brazil. ■
Provision added to expected one offs We have assumed US$1.2bn of provisions is recognised in the upcoming FY16 result, in addition to direct costs of ~US$100m (post tax). This combines with impairments already posted in the interim result in February, when BHP wrote down the book value of Samarco to zero, in addition to a large impairment against its US onshore O&G assets (primarily its gas interests). We now estimate combined one off charges of US$7.3bn in the FY16 earnings result, which we expect will see a reported NLAT of US$6.4bn (was NLAT of US$5.3bn) and underlying NPAT of US$832m (unchanged).
Heartening response We remain encouraged by the high priority BHP has made of the Samarco incident, with its quick and decisive action helping to jumpstart the extensive recovery process. The company has provided a further short-term debt facility of up to US$116m to its part-owned subsidiary Samarco in order to assist in continuing its work on the site.
Our Samarco assumptions In our base case, to be conservative we have assumed that Samarco cannot independently fund the near-term remediation and recovery work under the agreed framework. As a result we assume BHP and Vale split the expenses 50/50 during FY16 (~US$250m) and FY17 (~US$200m). We have estimated the direct costs by setting it in line with the agreed framework with an added (albeit small) contingency. Although there is a great deal of uncertainty around the timeframe for a possible restart of the Samarco operations, we have assumed the operations become active from early FY18 at which point we expect Samarco will start ‘self-funding’ the remediation costs.
No change in our thinking While we have revised our forecast reported NLAT for FY16, there have been no changes to our underlying earnings expectations or SOTP-valuation derived price target of A$26.30 per share. We believe Samarco/BHP/Vale will work through the legal process in Brazil and continue to responsibly support the recovery process. We maintain our Add recommendation, believing there is significant upside risk to BHP’s forward earnings from the stronger commodity price environment. The key risk to our call remains the potential for volatility around commodities in the short term.
SOURCE: MORGANS, COMPANY REPORTS
▎Australia
ADD (no change) Current price: A$19.97
Target price: A$26.30
Previous target: A$26.30
Up/downside: 31.7%
Reuters: BHP.AX
Bloomberg: BHP AU
Market cap: US$75,537m
A$100,342m
Average daily turnover: US$179.4m
A$241.5m
Current shares o/s 5,321m
Free float: 100.0%
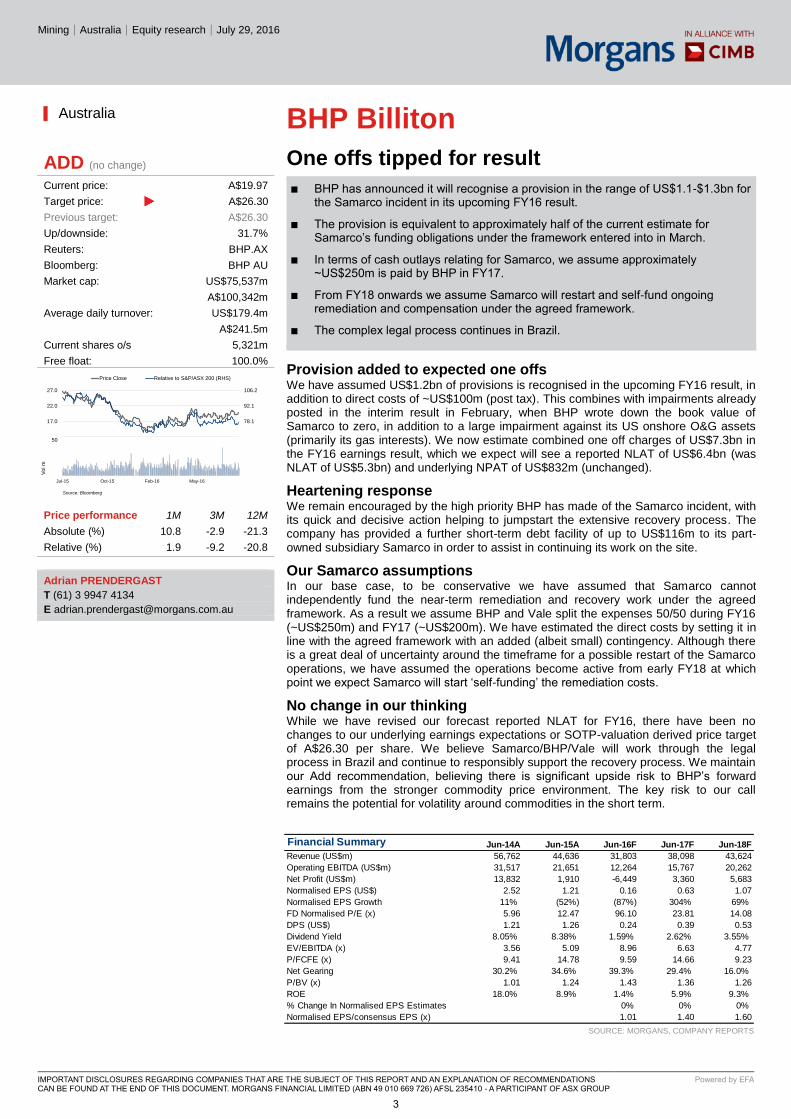
Price performance 1M 3M 12M
Absolute (%) 10.8 -2.9 -21.3
Relative (%) 1.9 -9.2 -20.8
Adrian PRENDERGAST
T (61) 3 9947 4134
Financial Summary Jun-14A Jun-15A Jun-16F Jun-17F Jun-18F
Revenue (US$m) 56,762 44,636 31,803 38,098 43,624
Operating EBITDA (US$m) 31,517 21,651 12,264 15,767 20,262
Net Profit (US$m) 13,832 1,910 -6,449 3,360 5,683
Normalised EPS (US$) 2.52 1.21 0.16 0.63 1.07
Normalised EPS Growth 11% (52%) (87%) 304% 69%
FD Normalised P/E (x) 5.96 12.47 96.10 23.81 14.08
DPS (US$) 1.21 1.26 0.24 0.39 0.53
Dividend Yield 8.05% 8.38% 1.59% 2.62% 3.55%
EV/EBITDA (x) 3.56 5.09 8.96 6.63 4.77
P/FCFE (x) 9.41 14.78 9.59 14.66 9.23
Net Gearing 30.2% 34.6% 39.3% 29.4% 16.0%
P/BV (x) 1.01 1.24 1.43 1.36 1.26
ROE 18.0% 8.9% 1.4% 5.9% 9.3%
% Change In Normalised EPS Estimates 0% 0% 0%
Normalised EPS/consensus EPS (x) 1.01 1.40 1.60
64.0
78.1
92.1
106.2
12.0
17.0
22.0
27.0
Price Close Relative to S&P/ASX 200 (RHS)
Source: Bloomberg
10
20
30
40
50
Jul-15 Oct-15 Feb-16 May-16
Vol m
3
Oil & Gas Exp & Prodn│Australia│Equity research│July 29, 2016
IMPORTANT DISCLOSURES REGARDING COMPANIES THAT ARE THE SUBJECT OF THIS REPORT AND AN EXPLANATION OF RECOMMENDATIONS CAN BE FOUND AT THE END OF THIS DOCUMENT. MORGANS FINANCIAL LIMITED (ABN 49 010 669 726) AFSL 235410 - A PARTICIPANT OF ASX GROUP
Powered by EFA
Byron Energy Ltd
SM71 valuation underpins a higher price
Funding has been secured and the development of SM71 is expected to occur ■over the coming year with production anticipated by mid-2017.
BYE has announced two farm-in partners for the drilling of the Bivouac Peak lease ■which is scheduled for 1H17.
Retain Add recommendation on an increased target price of A$0.44 (was A$0.38). ■
South Marsh Island 71 delivers Following the successful drilling of the SM71 well, which intersected hydrocarbons in four sands, BYE has announced a reserve increase. 2P reserves net to BYE stand at 2.271mmboe, up 508% and the well will be brought into production in 2017.
South Marsh Island 6 to not be re-entered Following ongoing drilling issues associated with SM6, BYE has decided not to re-enter the SM6 #2 well to complete the drilling down to the primary target (G20 Sand). BYE will plug and abandon the section of the SM6 #2 well that is below the F Sands and it will undertake an assessment of the SM6 project based solely on the net pay intersected in the F Sands.
Bivouac Peak to be drilled in 1H17 BYE has successfully secured third party funding for the drilling of a well in the Bivouac Peak lease in 1H17 (subject to permitting). Otto Energy (ASX: OEL) and Metgasco (ASX: MEL) have both announced they will farm in to the block which will result in BYE reducing its Working Interest to 35% and its Net Revenue Interest to 26.08%. As a result of these transactions, BYE will be required to fund US$1.4m for the initial well. In addition to announcing the two farm-out deals, BYE has received an independent resource estimate for the Bivouac Peak prospect. The current prospective resource estimate net to BYE is 11.9mmboe.
New loan facility to fund the commencement of production BYE has secured debt funding which will allow the company to bring the SM71 well into production. MEL will subscribe to an A$8.0m three year convertible note with BYE and has also been issued 10m unlisted BYE options with an exercise price of 25c and three year term.
Retain Add recommendation Following the drilling success witnessed at SM71 and the recent reserve and resource upgrades, our target price has increased to A$0.44 (from A$0.38). We believe the market will gain increased confidence following the recent farm-ins and funding agreement and expect upcoming drilling and development activity to attract market interest. Consequently we retain an Add recommendation on BYE.
SOURCE: MORGANS, COMPANY REPORTS
▎Australia
ADD (no change) Current price: A$0.14
Target price: A$0.44
Previous target: A$0.38
Up/downside: 213.1%
Reuters: BYE.AX
Bloomberg: BYE AU
Market cap: US$24.77m
A$32.91m
Average daily turnover: US$0.01m
A$0.01m
Current shares o/s 235.0m
Free float: 80.0%
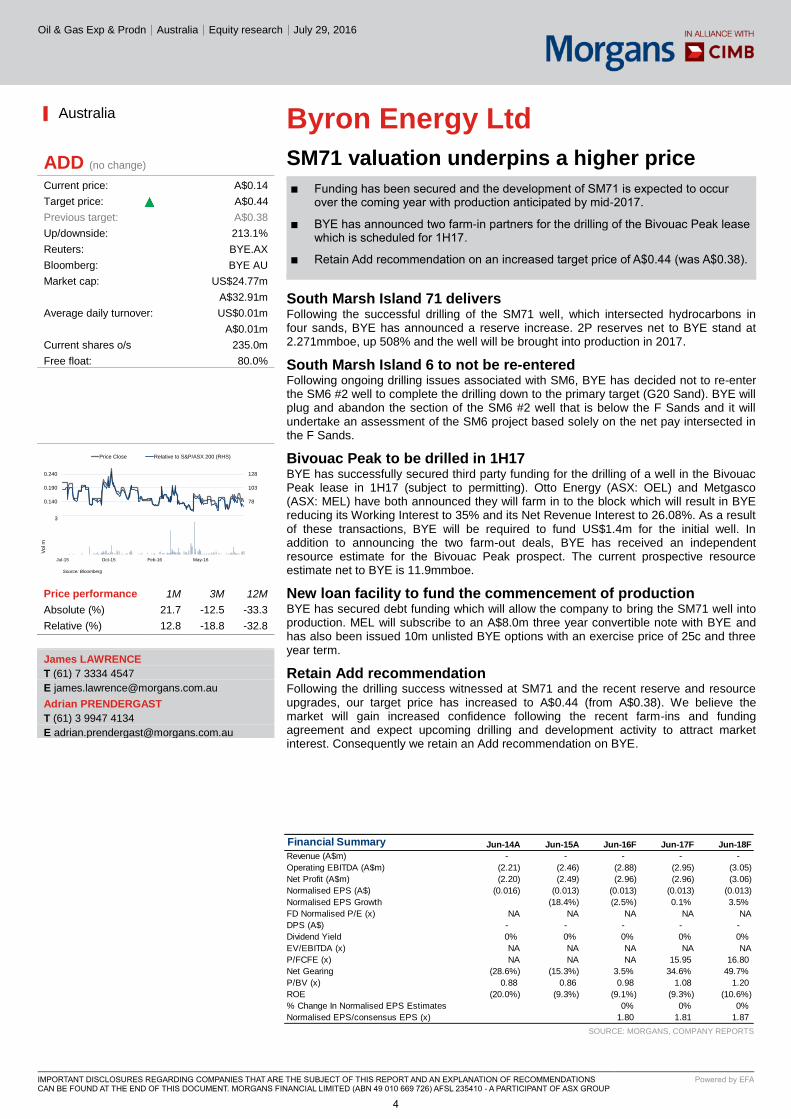
Price performance 1M 3M 12M
Absolute (%) 21.7 -12.5 -33.3
Relative (%) 12.8 -18.8 -32.8
James LAWRENCE
T (61) 7 3334 4547
Adrian PRENDERGAST
T (61) 3 9947 4134
Financial Summary Jun-14A Jun-15A Jun-16F Jun-17F Jun-18F
Revenue (A$m) - - - - -
Operating EBITDA (A$m) (2.21) (2.46) (2.88) (2.95) (3.05)
Net Profit (A$m) (2.20) (2.49) (2.96) (2.96) (3.06)
Normalised EPS (A$) (0.016) (0.013) (0.013) (0.013) (0.013)
Normalised EPS Growth (18.4%) (2.5%) 0.1% 3.5%
FD Normalised P/E (x) NA NA NA NA NA
DPS (A$) - - - - -
Dividend Yield 0% 0% 0% 0% 0%
EV/EBITDA (x) NA NA NA NA NA
P/FCFE (x) NA NA NA 15.95 16.80
Net Gearing (28.6%) (15.3%) 3.5% 34.6% 49.7%
P/BV (x) 0.88 0.86 0.98 1.08 1.20
ROE (20.0%) (9.3%) (9.1%) (9.3%) (10.6%)
% Change In Normalised EPS Estimates 0% 0% 0%
Normalised EPS/consensus EPS (x) 1.80 1.81 1.87
53
78
103
128
0.090
0.140
0.190
0.240
Price Close Relative to S&P/ASX 200 (RHS)
Source: Bloomberg
1
2
3
Jul-15 Oct-15 Feb-16 May-16
Vol m
4

Banks│Australia│Equity research│July 29, 2016
IMPORTANT DISCLOSURES REGARDING COMPANIES THAT ARE THE SUBJECT OF THIS REPORT AND AN EXPLANATION OF RECOMMENDATIONS CAN BE FOUND AT THE END OF THIS DOCUMENT. MORGANS FINANCIAL LIMITED (ABN 49 010 669 726) AFSL 235410 - A PARTICIPANT OF ASX GROUP
Powered by EFA
CYBG PLC
3Q16 trading update
No revision to guidance. ■
We have made no material changes to our cash EPS forecasts. ■
Our investment view remains unchanged. Cost-out story and potential Internal-■Ratings Based (IRB) accreditation remain the bright spots of the story. The outlook for income growth looks challenging as a result of a softer macroeconomic outlook.
We retain our HOLD recommendation and $3.75 price target. ■
Underlying mortgage growth softer than target The mortgage book grew at an annualised rate of 3.5% over 3Q16, compared with the Company’s target of annualised loan growth of 7-8%. Low growth over 3Q16 was partly the result of strong volume growth over 2Q16 stemming from the stamp duty change on 1 April. However, annualised mortgage book growth over the 9 months to 30 June 2016 was 8% despite assistance in 2Q16 from the change to stamp duty. After stripping out the positive impact this change, mortgage book growth over the same 9 months was likely below the Company’s target range. This belief is also supported by the fact that CYB’s mortgage balances grew 5.5% over the year to 31 May 2016.
NIM assisted by deposit re-pricing The net interest margin (NIM) for 3Q16 was 2.27%, up from 2.25% in 1H16. This increase largely appears to be attributable to the full period impact in 3Q16 of the reduction in liquid assets over 1H16 as well as the full period impact of deposit re-pricing which took place in 1H16. Strong SME loan growth of 13% annualised over 3Q16 also assisted the NIM through a favourable shift in the loan mix. We were expecting some lending margin contraction over 3Q16, however lending margins were likely stable over this period and perhaps this explains the softness in underlying mortgage book growth. We continue to expect the NIM to contract over our forecast period largely due to cuts to the Bank of England’s Bank Rate.
Cost guidance unchanged The Company has said that it is firmly on track to meet full year cost guidance of £730m.
No deterioration in asset quality The credit impairment charge for the 9 months to 30 June 2016 as a percentage of gross loans was 14bps. This compares with 19bps over 1H16 and 21bps over FY15. We continue to expect asset quality to deteriorate over our forecast period particularly in the SME loan book.
Investment view and changes to forecasts We have made no material changes to our cash EPS forecasts. Our 12-month pound target price is unchanged at £2.25. Our target price for the ASX-listed Chess Depository Interests (CDIs) is unchanged at $3.75 based on an AUDGBP cross-rate assumption of 0.600. Despite greater than 10% downside on a 12-month basis, we are maintaining our HOLD recommendation as the Capital Markets Update on September 13 is likely to include positive revisions to cost guidance.
SOURCE: MORGANS, COMPANY REPORTS
▎Australia
HOLD (no change) Current price: A$4.42
Target price: A$3.75
Previous target: A$3.75
Up/downside: -15.2%
Reuters: CYB.AX
Bloomberg: CYB AU
Market cap: US$2,932m
A$3,895m
Average daily turnover: US$23.10m
A$31.22m
Current shares o/s 879.3m
Free float: 100.0%
Price performance 1M 3M 12M
Absolute (%) 7.5 3
Relative (%) -1.4 -3.3
Azib Khan
T (61) 2 9043 7903
Financial Summary Sep-14A Sep-15A Sep-16F Sep-17F Sep-18F
Net Interest Income (£m) 785.0 787.0 809.5 832.4 859.1
Total Non-Interest Income (£m) 197.0 177.0 181.8 185.4 189.9
Operating Revenue (£m) 982 964 991 1,018 1,049
Total Provision Charges (£m) (74.0) (78.0) (63.2) (91.7) (128.8)
Net Profit (£m) (198.0) (225.0) 66.9 100.5 116.8
Normalised EPS (£) 0.19 0.15 0.14 0.18 0.19
Normalised EPS Growth 73.4% (20.9%) (6.4%) 27.7% 10.5%
FD Normalised P/E (x) 13.65 17.24 18.41 14.42 13.05
DPS (£) - - - 0.020 0.020
Dividend Yield 0.00% 0.00% 0.00% 0.79% 0.79%
BVPS (£) 2.89 3.92 4.04 4.15 4.26
P/BV (x) 0.88 0.65 0.63 0.61 0.59
ROE 6.54% 4.31% 3.45% 4.29% 4.61%
% Change In Normalised EPS Estimates 0.061% 0.380% (0.258%)
Normalised EPS/consensus EPS (x) 1.23 1.18 1.00
82.0
92.0
102.0
112.0
122.0
132.0
142.0
3.30
3.80
4.30
4.80
5.30
5.80
6.30
Price Close Relative to S&P/ASX 200 (RHS)
Source: Bloomberg
20
40
60
80
Feb-16 Mar-16 May-16 Jun-16
Vol m
5
Mining│Australia│Equity research│July 29, 2016
IMPORTANT DISCLOSURES REGARDING COMPANIES THAT ARE THE SUBJECT OF THIS REPORT AND AN EXPLANATION OF RECOMMENDATIONS CAN BE FOUND AT THE END OF THIS DOCUMENT. MORGANS FINANCIAL LIMITED (ABN 49 010 669 726) AFSL 235410 - A PARTICIPANT OF ASX GROUP
Powered by EFA
Mineral Deposits
June Q production and HY (loss)
After the first 180° dredge path turnaround and major scheduled maintenance in ■the March quarter, Grande Côte (MDL an effective 45%) returned to production, with 138.9kt of concentrate in the June quarter, with the focus on operational efficiency and consistency. We expect a lift to nameplate output over 2016, an EBITDA-positive December half year, and for the full 2016 year.
Tyssedal Titanium and Iron (MDL 50%) produced its first chloride-route titanium ■slag and high purity iron ore (HPPI) in January after a four-month shutdown, with production of titanium slag in the June quarter of 44.2kt, close to previous levels. TTI was EBITDA positive to the tune of US$6m in the June half. We anticipate increased production for the December half, and stronger cashflow.
Pigment prices have firmed with demand recovery and supply constraint expected ■to lead to stronger ilmenite and rutile pricing. Zircon prices have stabilised after inventory de-stocking. We model prices to strengthen from early 2017.
MDL reported an underlying loss of US$19.2m for the June half year. Our SOTP ■valuation and target remain at A$0.96/share, subject to the usual operational, jurisdictional, commodity price market and exchange rate risks.
GCO – production optimisation continues Heavy Media Concentrate (HMC) production at Grande Côte (TiZir 90%, MDL 50% of TiZir) was at 75% of previous levels for the June half year, after the dredge path turnaround and scheduled maintenance over six weeks in the March quarter and unscheduled stoppages in the June quarter, which limited ilmenite production to 92,783t in the quarter. We model increased production and operational efficiencies in the December half, and a return to EBITDA-positive status for the half, but model a net loss for CY 2016.
TTI – EBITDA positive already The TTI furnace was shut down in mid-September 2015 for a re-line and capacity upgrade, as well as for conversion to production of higher-value Chloride-route titanium slag. Production for the month of March was reported by MDL at 90% of pre-expansion capacity, and by our estimate 75% of the ultimate expanded nameplate. For the June quarter production was 44.2kt of slag. MDL reports that TTI was EBITDA positive for the June half. We model a full year positive NPAT for TTI.
Valuation – target and risk An underlying net loss of US$19.8m was reported for the June half. We have marginally lowered our production forecasts for 2016. Our valuation and target remain at A$0.96. Under the terms of the TiZir agreement with ERAMET (50% of TiZir), ERAMET has now advanced MDL A$7.2m to fund MDL’s contribution to TiZir’s obligations to its bondholders, and will continue to fund up to US$60m in total if necessary. In our view this substantially reduces the risks for TiZir in meeting its debt servicing obligations (US$275.0m) during this weak commodity market as plant optimisation continues. Risks to achieving our price target include operational, commodity price, exchange rate and geographic risks. Efficient operating performance and commodities pricing offers the most upside and downside risks to our target price.
SOURCE: MORGANS, COMPANY REPORTS
▎Australia
ADD (no change) Current price: A$0.46
Target price: A$0.96
Previous target: A$0.96
Up/downside: 111.9%
Reuters: MDL.AX
Bloomberg: MDL AU
Market cap: US$35.51m
A$47.17m
Average daily turnover: US$0.10m
A$0.14m
Current shares o/s 103.7m
Free float: 67.6%
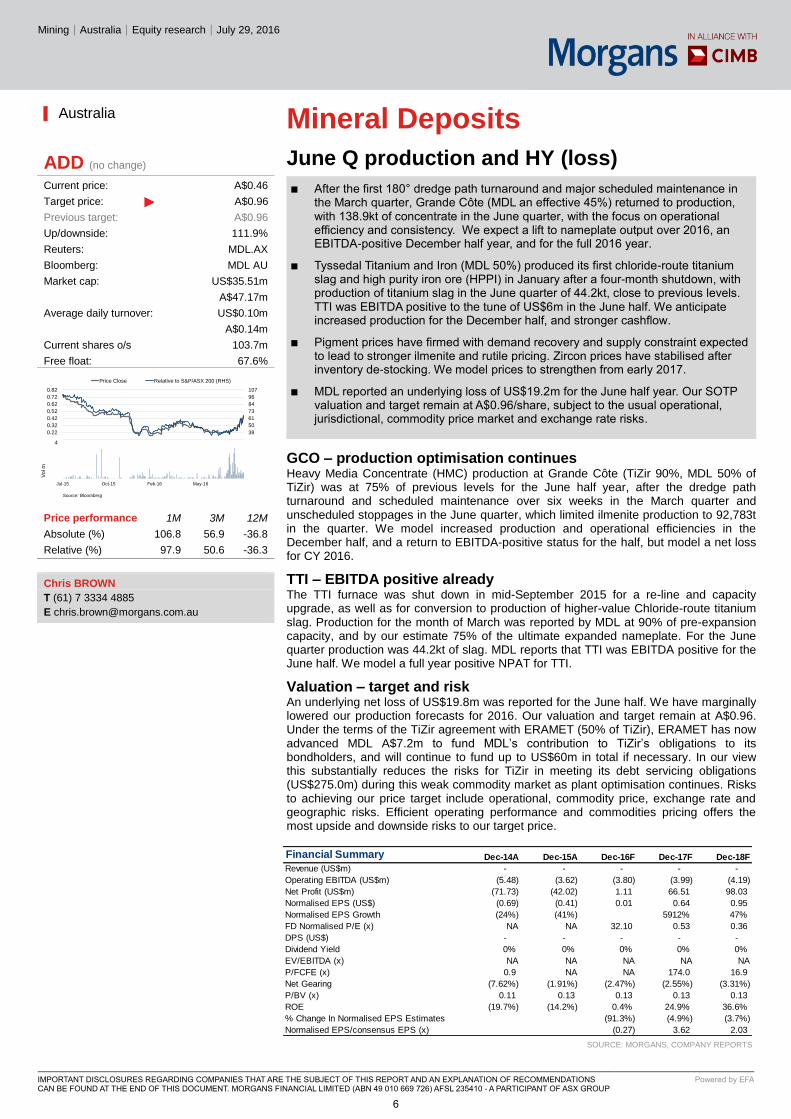
Price performance 1M 3M 12M
Absolute (%) 106.8 56.9 -36.8
Relative (%) 97.9 50.6 -36.3
Chris BROWN
T (61) 7 3334 4885
Financial Summary Dec-14A Dec-15A Dec-16F Dec-17F Dec-18F
Revenue (US$m) - - - - -
Operating EBITDA (US$m) (5.48) (3.62) (3.80) (3.99) (4.19)
Net Profit (US$m) (71.73) (42.02) 1.11 66.51 98.03
Normalised EPS (US$) (0.69) (0.41) 0.01 0.64 0.95
Normalised EPS Growth (24%) (41%) 5912% 47%
FD Normalised P/E (x) NA NA 32.10 0.53 0.36
DPS (US$) - - - - -
Dividend Yield 0% 0% 0% 0% 0%
EV/EBITDA (x) NA NA NA NA NA
P/FCFE (x) 0.9 NA NA 174.0 16.9
Net Gearing (7.62%) (1.91%) (2.47%) (2.55%) (3.31%)
P/BV (x) 0.11 0.13 0.13 0.13 0.13
ROE (19.7%) (14.2%) 0.4% 24.9% 36.6%
% Change In Normalised EPS Estimates (91.3%) (4.9%) (3.7%)
Normalised EPS/consensus EPS (x) (0.27) 3.62 2.03
27
38
50
61
73
84
96
107
0.12
0.22
0.32
0.42
0.52
0.62
0.72
0.82
Price Close Relative to S&P/ASX 200 (RHS)
Source: Bloomberg
1
2
3
4
Jul-15 Oct-15 Feb-16 May-16
Vol m
6

Food & Beverages│Hong Kong│Equity research│July 29, 2016
Company Note
IMPORTANT DISCLOSURES, INCLUDING ANY REQUIRED RESEARCH CERTIFICATIONS, ARE PROVIDED AT THE END OF THIS REPORT. IF THIS REPORT IS DISTRIBUTED IN THE UNITED STATES IT IS DISTRIBUTED BY CIMB SECURITIES (USA), INC. AND IS CONSIDERED THIRD-PARTY AFFILIATED RESEARCH.
Powered by the EFA Platform
Want Want China Reporting currency changed to Rmb
Want Want announced a change in reporting currency from US$ to Rmb. ■
We expect weak topline growth in 1H16 as cool weather impacted beverage and ■popsicle sales; rice cracker sales also likely underperformed due to earlier CNY.
We expect 1H16 sales to drop 2.8% yoy while earnings to grow 1.7% yoy in Rmb ■terms. In US$, sales and net profit will both fall 7.8% and 3.5% yoy respectively.
We cut FY16-18F earnings by 5.7-14.3% to reflect weaker topline growth. ■
Maintain Hold. While Want Want’s valuation is not expensive, we would like to see a ■recovery in demand for its core product, i.e. Hot Kid Milk.
Change in reporting currency Management announced adoption of Rmb as presentation currency to better reflect the underlying performance of the company, given over 90% of total revenue is generated in mainland China. The first restated financials will be presented in 1H16 results release.
Hot Kid milk sales worsened in 2Q16 According to the management, Hot Kid milk sales were flat yoy in 1Q16, but turned to negative growth in 2Q16 due to the intensified competition and cooler weather. Want Want recently launched room temperature kids’ yoghurt and high-end yoghurt drink in Jun and Jul, which should help to improve milk sales in 2H16. We now expect Hot Kid milk sales to fall 10.0% and 1.1% yoy respectively in US$ terms in 1H16 and 2H16.
Rice cracker to recover in 2H16 Rice cracker segment sales are highly correlated with the timing of the Chinese New Year (CNY). Due to an earlier CNY this year, we expect rice cracker sales to drop 3% yoy in 1H16. However, given CNY in 2017 will be even earlier, rice cracker sales should improve in 2H16. We now expect rice cracker sales to recover 8.7% yoy in 2H16.
Warmer July will help popsicles and jellies sales Cool weather in 2Q16 negatively impacted sales of popsicles and jellies. However, sales have picked up c.30% in Jul as it got increasingly warmer. Management also said it will launch new cake products in 2H16. We now expect snacks sales to drop 7.0% yoy in 1H16, but recover to positive 3.6% yoy growth in 2H16.
To benefit from lower milk powder price According to the management, international milk powder price procured by Want Want fell more than 20% yoy in 1H16. Want Want has accumulated inventories which will be sufficient for use until end-3Q16. We expect GPM expansion of 0.5% pt yoy to 43.0% in 1H16. Want Wat cut over 3,000 sales people in Sep/Oct 2015, hence we expect its distribution expenses ratio to drop 0.4pts yoy to 14.1% in 1H16. Management said it will continue to closely control the expenses ratios in 2H16.
Maintain Hold with lower DCF-based TP of HK$5.0 (WACC: 9.3%) Maintain Hold. Although Want Want’s valuation is not demanding, we would like to see more successful product launches. Want Want had US$1.4bn cash at end-FY15, which could support continuous share buy-back plan and limit further share price downside. Key upside risks include better-than-expected launch of new beverage products; downside risks include slower-than-expected recovery in Hot Kid milk sales and higher-than-expected promotional expenses.
▎Hong Kong
HOLD (no change) Consensus ratings*: Buy 3 Hold 16 Sell 6
Current price: HK$4.75
Target price: HK$5.00
Previous target: HK$5.60
Up/downside: 5.3%
CIMB / Consensus: -12.5%
Reuters: 0151.HK
Bloomberg: 151 HK
Market cap: US$7,784m
HK$60,388m
Average daily turnover: US$12.62m
HK$97.92m
Current shares o/s: 13,101m
Free float: 48.5% * Source: Bloomberg
Key changes in this note
FY16F Revenue decreased by 4.7%.
FY16F EPS decreased by 5.7%.
FY16F ROE decreased by 1.5%.
Source: Bloomberg
Price performance 1M 3M 12M Absolute (%) -13.6 -20.6 -41.1
Relative (%) -20.7 -24.5 -30
Major shareholders % held Tsai Eng Meng 48.0
Wen Hsien Cheng 3.5
Analyst(s)
Lei YANG, CFA
T (86) 21 5047 1771 x108 E [email protected]
[ X ]
SOURCE: COMPANY DATA, CIMB FORECASTS
Financial Summary Dec-14A Dec-15A Dec-16F Dec-17F Dec-18F
Revenue (US$m) 3,775 3,428 3,333 3,418 3,582
Operating EBITDA (US$m) 894.8 861.3 872.4 907.8 970.0
Net Profit (US$m) 620.5 542.1 572.7 593.6 634.5
Core EPS (US$) 0.047 0.041 0.044 0.045 0.048
Core EPS Growth (9.6%) (12.0%) 5.7% 3.6% 6.9%
FD Core P/E (x) 13.03 14.80 14.01 13.51 12.64
DPS (US$) 0.024 0.018 0.019 0.020 0.021
Dividend Yield 3.90% 2.95% 3.11% 3.23% 3.45%
EV/EBITDA (x) 8.73 9.03 8.60 7.90 7.07
P/FCFE (x) 334.0 20.1 15.6 13.8 13.9
Net Gearing (11.3%) (9.9%) (20.8%) (30.9%) (37.7%)
P/BV (x) 3.92 4.27 3.63 3.14 2.74
ROE 30.9% 27.5% 28.0% 24.9% 23.2%
% Change In Core EPS Estimates (5.7%) (10.9%) (14.3%)
CIMB/consensus EPS (x) 1.02 1.03 1.03
66.0
76.0
86.0
96.0
106.0
4.40
5.40
6.40
7.40
8.40
Price Close Relative to HSI (RHS)
50
100
150
Jul-15 Oct-15 Feb-16 May-16
Vo
l m
7

Gaming│Hong Kong│Equity research│July 29, 2016
Company Note
IMPORTANT DISCLOSURES, INCLUDING ANY REQUIRED RESEARCH CERTIFICATIONS, ARE PROVIDED AT THE END OF THIS REPORT. IF THIS REPORT IS DISTRIBUTED IN THE UNITED STATES IT IS DISTRIBUTED BY CIMB SECURITIES (USA), INC. AND IS CONSIDERED THIRD-PARTY AFFILIATED RESEARCH.
Powered by the EFA Platform
Wynn Macau Helped by high win rate
2Q16 property EBITDA of USD190m, 9% above expectations helped by a high VIP ■win rate of 3.98%.
Initial table allocation for new Wynn Palace at 100 tables, below market■expectations of 200-250 tables.
Premium mass segment strong with higher spending players returning.■Maintain hold with target price based on 16x FY16, EV/EBITDA, 1 s.d. above the■stock’s 4 year average. Upside risks include stronger ramp-up at Wynn Palace.
2Q16 EBITDA helped by a high win rate Wynn Macau’s 2Q16 property EBITDA reached USD190m (+10% yoy, flat qoq), 9% higher than consensus expectations. As VIP win rates during the quarter reached an abnormally high rate of 3.98%, this contributed USD20m to EBITDA. On a hold-normalized basis, reported EBITDA would have been about 2% below expectations. EBITDA margins reached 30% during the quarter (+170bp yoy, -160bp qoq). We expect EBITDA to increase 31% yoy with the opening of Wynn Palace.
Premium mass coming back Mass table wins were up 13% yoy which management attributed to the cultivation of new players and the return of premium mass players to the gaming market. This was consistent with our proprietary table analysis which showed that, on an overall market basis, ultra-premium mass tables with a minimum bet of HKD3k+/USD387+ comprised 14% of tables in 2Q16 vs. 12% in 2Q15. The return of premium mass players is a positive indication of recovery in the gaming market.
Lower initial table allocation The government has initially granted Wynn Macau 100 tables for the upcoming Wynn Palace project which is lower than the initial 150 tables granted for Galaxy Phase 2 and the 200 tables for Studio City. The 100-table initial allocation is lower than expected. However, we expect further table allocation in later stages similar to Galaxy Phase 2 and Studio City. With Sands Parisian opening three weeks after Wynn Palace, we believe the government is being prudent with new table grants to control table supply.
Shifting of resources Wynn Palace will open with 350 tables (100 new tables, 250 shifted from Wynn Macau). Wynn Macau will be left with 270 tables. The tables shifted from Wynn Macau will be from the VIP segment and not mass which are better performing tables at the property. Out of the 7,000 employees at Wynn Palace, 5,000 will be new employees and the remaining will be shifted from Wynn Macau. Wynn can save USD20-25m in payroll expenses from the employee shift. Wynn Palace will open on August 22, 2016.
Maintain hold Wynn Macau is the top performing gaming stock +47% YTD and is hence trading at 15x Bloomberg consensus EV/EBITDA, vs. 11x sector average. While Wynn Palace is likely to be the premier new property on Cotai and the lower initial table allocation is not likely to have a significant impact to earnings given table underutilization in Macau, we believe the positives are mostly priced in and hence would wait for a better entry point. Upside risks include stronger than expected ramp up of Wynn Palace.
▎Hong Kong
HOLD (no change) Consensus ratings*: Buy 12 Hold 9 Sell 4
Current price: HK$13.34
Target price: HK$11.93
Previous target: HK$11.93
Up/downside: -10.6%
CIMB / Consensus: -0.2%
Reuters: 1128.HK
Bloomberg: 1128 HK
Market cap: US$8,936m
HK$69,308m
Average daily turnover: US$16.00m
HK$124.2m
Current shares o/s: 5,196m
Free float: 27.7% * Source: Bloomberg
Key changes in this note
No changes
Source: Bloomberg
Price performance 1M 3M 12M Absolute (%) 21.9 17.6 -12.2
Relative (%) 12 13.9 -2.7
Major shareholders % held WM Cayman Holdings 72.2
Capital Group Companies 4.9
JP Morgan Chase 5.0
Analyst(s)
Michael TING
T (852) 2532 1121 E [email protected]
Jensen POON T (852) 25391350 E [email protected]
[ X ]
SOURCE: COMPANY DATA, CIMB FORECASTS
Financial Summary Dec-14A Dec-15A Dec-16F Dec-17F Dec-18F
Revenue (HK$m) 29,445 19,096 22,395 25,460 26,079
Operating EBITDA (HK$m) 7,952 4,032 5,279 6,806 7,051
Net Profit (HK$m) 6,445 2,433 2,264 3,420 3,655
Core EPS (HK$) 1.24 0.47 0.44 0.66 0.70
Core EPS Growth (16.4%) (62.3%) (7.0%) 51.1% 6.9%
FD Core P/E (x) 10.74 28.49 30.62 20.26 18.96
DPS (HK$) 1.75 0.60 0.43 0.65 0.70
Dividend Yield 13.1% 4.5% 3.2% 4.9% 5.2%
EV/EBITDA (x) 9.69 23.28 18.56 14.39 13.89
P/FCFE (x) 11.35 25.90 23.19 13.91 13.62
Net Gearing 111% 599% 659% 643% 627%
P/BV (x) 9.84 16.90 15.92 15.58 15.17
ROE 79.3% 43.7% 53.5% 77.7% 81.1%
% Change In Core EPS Estimates 0% 0% 0%
CIMB/consensus EPS (x) 1.03 1.02 0.96
62.0
82.8
103.7
5.9
10.9
15.9
Price Close Relative to HSI (RHS)
50
100
Jul-15 Oct-15 Feb-16 May-16
Vol m
8
Tobacco│Indonesia│Equity research│July 31, 2016
Company Note
IMPORTANT DISCLOSURES, INCLUDING ANY REQUIRED RESEARCH CERTIFICATIONS, ARE PROVIDED AT THE END OF THIS REPORT. IF THIS REPORT IS DISTRIBUTED IN THE UNITED STATES IT IS DISTRIBUTED BY CIMB SECURITIES (USA), INC. AND IS CONSIDERED THIRD-PARTY AFFILIATED RESEARCH.
Powered by the EFA Platform
Gudang Garam Seasonal pressure
GG’s 1H16 core net profit formed 41% of our FY16 forecast and 42% of consensus, ■below expectations, given seasonal average of 48% in FY11-15.
The deviation stemmed from lower-than-expected operating margin due to higher■advertising and promotion (A&P) spending, likely for its GG Mild brand.
Stripping out excise costs, GG’s 2Q16 gross margin (GPM) was resilient, rising by■1.4% yoy.
Maintain Add, with a lower target price of Rp92,000, still based on 21.5x CY17 P/E■(1 s.d. above 10-year mean).
Sales rose at a robust pace, thanks to favourable base GG’s 2Q16 revenue rose 10% yoy on the back of c.12% yoy price increase, suggesting negative volume growth, which was weaker than the industry’s flattish revenue growth in Jan-Jun 16 (based on two data surveys from third-party sources). GG’s domestic machine-made cigarette (SKM) revenue rose 11% qoq, higher than the 10% in 1Q16. SKM remains GG’s major revenue contributor (90% of 1H16 revenue).
Margins tanked due to excise duties and slow ASP increase GPM weakened 3.8% pts qoq and 60bp yoy in 2Q16, as the full impact of the excise duty increase (+14% yoy, 58% of COGS in 2Q16) weighed on margins. Furthermore, the company only increased ASP by c.2% (Feb 2016) in 1H16. Stripping out excise costs, GG’s 2Q16 GPM would have dipped by 90bp qoq but risen by 1.4% yoy. Ex-excise 2Q16 GPM was resilient and shows no wild fluctuations in raw material prices. We expect GPM to normalise on the back of ASP hike (typically in 2H).
Operating profit under seasonal pressure 2Q16 opex rose at a faster rate than revenue, increasing by 27% qoq and 21% yoy to 10.9% of revenue (vs. 9.1% in 1Q16). Consequently, operating margin (OPM) in 2Q16 fell to 9%, the lowest level in more than six years. Further scrutiny revealed that higher wages were the culprit behind the OPM weakness in 2Q16. Labour cost rose by 34% qoq and 33% yoy in 2Q16, probably because the company paid the 13
th month salary in
Jun 16, compared to Jul 15.
Balance sheet position 2Q16 capex tapered by 12% qoq and 24% yoy to Rp576bn (US$43.3m). This represents 49-62% of the company’s FY16 capex guidance of Rp2.0tr-2.5tr (US$150-188m), vs. CIMB FY16 estimate of Rp2tr, US$150m). GG continued to pay down its short-term debt, as 1H16 gross gearing declined by Rp750bn (US$56m) qoq to Rp11.8tr (US$887m), implying debt-to-equity ratio of 0.33x (vs. 0.54x in FY15). We expect debt to rise in 2H as: 1) GG paid dividends (Rp5tr in Jul 16) and 2) raw materials stocking up typically occurs in 2H (harvest time).
Maintain Add We cut our FY16-18 EPS forecasts by 3-5% to incorporate higher A&P spending. This lowers our target price to Rp92,000, still based on 21.5x CY17 /E (1 s.d. above 10-year mean). GG currently trades at 19x CY16 P/E and 16x CY17 P/E, making it one of the cheapest consumer staple stocks under our coverage. The risk is a lower-than-expected ASP hike as we estimate it to contribute c.10% revenue growth.
▎Indonesia
ADD (no change) Consensus ratings*: Buy 17 Hold 3 Sell 2
Current price: Rp67,525
Target price: Rp92,000
Previous target: Rp95,000
Up/downside: 36.2%
CIMB / Consensus: 20.0%
Reuters: GGRM.JK
Bloomberg: GGRM IJ
Market cap: US$9,909m
Rp129,924,040m
Average daily turnover: US$6.99m
Rp92,630m
Current shares o/s: 1,924m
Free float: 26.9% * Source: Bloomberg
Key changes in this note
FY16F EPS decreased by 4.86%.
FY17F EPS decreased by 2.91%.
FY18F EPS decreased by 3.35%.
Source: Bloomberg
Price performance 1M 3M 12M Absolute (%) -0.6 -2.5 43.7
Relative (%) -5.3 -10.3 33.2
Major shareholders % held Suryaduta Investama 66.8
Suryamitra Kusuma 6.3
Analyst(s)
Linda LAUWIRA
T (62) 21 3006 1734 E [email protected]
Margaretta OCTIANA T (62) 21 3006 1738 E [email protected]
[ X ]
SOURCE: COMPANY DATA, CIMB FORECASTS
Financial Summary Dec-14A Dec-15A Dec-16F Dec-17F Dec-18F
Revenue (Rpb) 65,186 70,366 78,159 88,237 99,632
Operating EBITDA (Rpb) 10,067 11,654 12,790 14,717 16,384
Net Profit (Rpb) 5,406 6,436 6,735 8,250 9,671
Core EPS (Rp) 2,803 3,317 3,500 4,288 5,026
Core EPS Growth 24.3% 18.3% 5.5% 22.5% 17.2%
FD Core P/E (x) 24.09 20.36 19.29 15.75 13.43
DPS (Rp) 800 800 2,609 1,750 2,144
Dividend Yield 1.18% 1.18% 3.86% 2.59% 3.17%
EV/EBITDA (x) 14.56 12.69 11.50 9.72 8.54
P/FCFE (x) 64.59 47.87 30.16 31.47 48.41
Net Gearing 50.0% 46.9% 42.9% 29.0% 19.7%
P/BV (x) 3.94 3.43 3.28 2.92 2.60
ROE 17.3% 18.0% 17.4% 19.6% 20.5%
% Change In Core EPS Estimates (4.86%) (2.91%) (3.35%)
CIMB/consensus EPS (x) 0.97 1.04 1.06
86.0
101.6
117.1
132.7
148.2
36,000
46,000
56,000
66,000
76,000
Price Close Relative to JCI (RHS)
2
4
6
Aug-15 Nov-15 Feb-16 May-16
Vol m
9
Food & Beverages│Indonesia│Equity research│July 31, 2016
Company Note
IMPORTANT DISCLOSURES, INCLUDING ANY REQUIRED RESEARCH CERTIFICATIONS, ARE PROVIDED AT THE END OF THIS REPORT. IF THIS REPORT IS DISTRIBUTED IN THE UNITED STATES IT IS DISTRIBUTED BY CIMB SECURITIES (USA), INC. AND IS CONSIDERED THIRD-PARTY AFFILIATED RESEARCH.
Powered by the EFA Platform
Mayora Indah Recovery intact, margin hit by sugar
We deem 1H16 core net profit of Rp696bn (US$53m, +27% yoy) in line, at 53/54% ■of our/consensus FY16 estimates, given the earlier festive season.
MYOR posted domestic sales recovery of 34% in 1H16 (vs. -16% in 1H15), which ■was strong even after taking into account the festivities in Jul.
2Q16 gross margin (GPM) declined by 250bp qoq due to the sugar price spike, the ■margin improvement remained evident in pushing for the sharp core profit rebound.
We maintain our FY16-18 EPS estimates, Add call and target price, still based on 3-■year mean forward rolling P/E of 29x.
Strong topline growth 1H16 sales rose 23% yoy, while 2Q16 sales increased 13% yoy (but -2% qoq). The yoy sales improvement was underpinned by domestic sales recovery, as it accounted for 57% of 1H16 revenue (vs. 53% in 1H15) and 60% of 2Q16 revenue (vs. 55% in 1Q16). This was partly due to the earlier timing of the Eid period on 6-7 Jul 2016. Management concurs with our view that domestic sales are firming up in 2016, after a soft 2015.
Sales mix changed slightly There was a slight change in 2Q16 sales mix, as the food processing contributed 53% of revenue (vs. 48% in 2Q15), while coffee/cocoa processing accounted for 47% (vs. 52% in 2Q15). Again, the change in the domestic festive celebration affected the mix.
Margin hurt by sugar price surge 2Q16 GPM declined by 250bp qoq and 330bp yoy, following margin contraction in food processing (-560bp yoy) and coffee/cocoa processing (-70bp yoy). The sugar price spike of c.25% YTD was the main culprit, as it accounted for c.26% of COGS. We estimate a 5% increase in sugar price would lower GPM by c.94bp. Weaker wheat price and improving coffee GPM (as price war subsides) are likely to offset margin pressure.
Forex loss in 1H16 versus gain in 1H15 MYOR had a cash hoard of Rp1.4tr (US$109.9m) in 2Q16, of which 64% was in US$. However, its entire gross debt amounting to Rp4.3tr (US$331.2m) is denominated in Rp. Hence, it recorded forex loss of Rp142bn (US$10.9m) in 1H16 vs forex gain of Rp112bn (US$8.5m) in 1H15. Note that export sales were Rp3.9tr (US$301.4m) in 1H16.
Balance sheet position largely unchanged 1H16 OCF was negative Rp400bn (US$30.5m), mainly due to: 1) higher labour costs as the 13
th month salary was paid in 2Q16, 2) higher working capital, due to the Eid period.
This pushed gross debt up 3% qoq, yet, net gearing declined to 51% in 2Q16 (vs. 58% in 2Q15). 1H16 capex was Rp150bn (US$11.5m), posting 23% of FY16 guidance.
Add rating and target price maintained MYOR will continue to benefit from the catalyst of improving mass consumers’ purchasing power, in our view. We maintain our EPS estimates but note that our FY16 sales forecast is 4% lower than MYOR’s guidance. Our target price is unchanged. Key risk is spike in raw material costs that could curtail margin recovery.
▎Indonesia
ADD (no change) Consensus ratings*: Buy 7 Hold 3 Sell 0
Current price: Rp39,700
Target price: Rp46,000
Previous target: Rp46,000
Up/downside: 15.9%
CIMB / Consensus: 21.8%
Reuters: MYOR.JK
Bloomberg: MYOR IJ
Market cap: US$2,708m
Rp35,505,616m
Average daily turnover: US$0.13m
Rp1,689m
Current shares o/s: 894.4m
Free float: 66.9% * Source: Bloomberg
Key changes in this note
No change
Source: Bloomberg
Price performance 1M 3M 12M Absolute (%) 1.9 12.6 45
Relative (%) -2.8 4.8 34.5
Major shareholders % held Unita Branindo 32.9
Public & others
Analyst(s)
Margaretta OCTIANA
T (62) 21 3006 1738 E [email protected]
Linda LAUWIRA T (62) 21 3006 1734 E [email protected]
[ X ]
SOURCE: COMPANY DATA, CIMB FORECASTS
Financial Summary Dec-14A Dec-15A Dec-16F Dec-17F Dec-18F
Revenue (Rpb) 14,169 14,819 16,860 19,154 22,199
Operating EBITDA (Rpb) 1,302 2,331 2,535 2,887 3,426
Net Profit (Rpb) 404 1,220 1,306 1,526 1,861
Core EPS (Rp) 464 1,244 1,460 1,706 2,081
Core EPS Growth (47%) 168% 17% 17% 22%
FD Core P/E (x) 85.49 31.91 27.20 23.27 19.07
DPS (Rp) 230.0 160.0 341.0 364.9 426.4
Dividend Yield 0.58% 0.40% 0.86% 0.92% 1.07%
EV/EBITDA (x) 30.32 16.19 14.80 12.99 10.90
P/FCFE (x) NA 37.9 NA 573.1 166.9
Net Gearing 95.4% 40.9% 29.8% 24.1% 17.6%
P/BV (x) 8.91 6.99 5.84 4.88 4.05
ROE 10.7% 24.6% 23.4% 22.8% 23.2%
CIMB/consensus EPS (x) 0.97 0.95 1.01
86.0
103.5
121.0
138.5
156.0
23,000
28,000
33,000
38,000
43,000
Price Close Relative to JCI (RHS)
100
200
300
400
Aug-15 Nov-15 Feb-16 May-16
Vol th
10
Property│Indonesia│Equity research│July 29, 2016
Sector Note
IMPORTANT DISCLOSURES, INCLUDING ANY REQUIRED RESEARCH CERTIFICATIONS, ARE PROVIDED AT THE END OF THIS REPORT. IF THIS REPORT IS DISTRIBUTED IN THE UNITED STATES IT IS DISTRIBUTED BY CIMB SECURITIES (USA), INC. AND IS CONSIDERED THIRD-PARTY AFFILIATED RESEARCH.
Powered by the EFA Platform
Property Devt & Invt 2Q16 results: pressure on earnings remains
SMRA and BSDE’s 1H16 net profit dropped 42-95% and missed our estimates. ■ PWON’s results, however, came broadly in line at 41% of our estimates. ■ Miss largely attributed to slower revenue recognition and margin contraction. ■ Relaxation of LTV in Aug and successful implementation of tax amnesty will be main ■catalysts for the sector. Maintain OW with BSDE and PWON as our top picks.
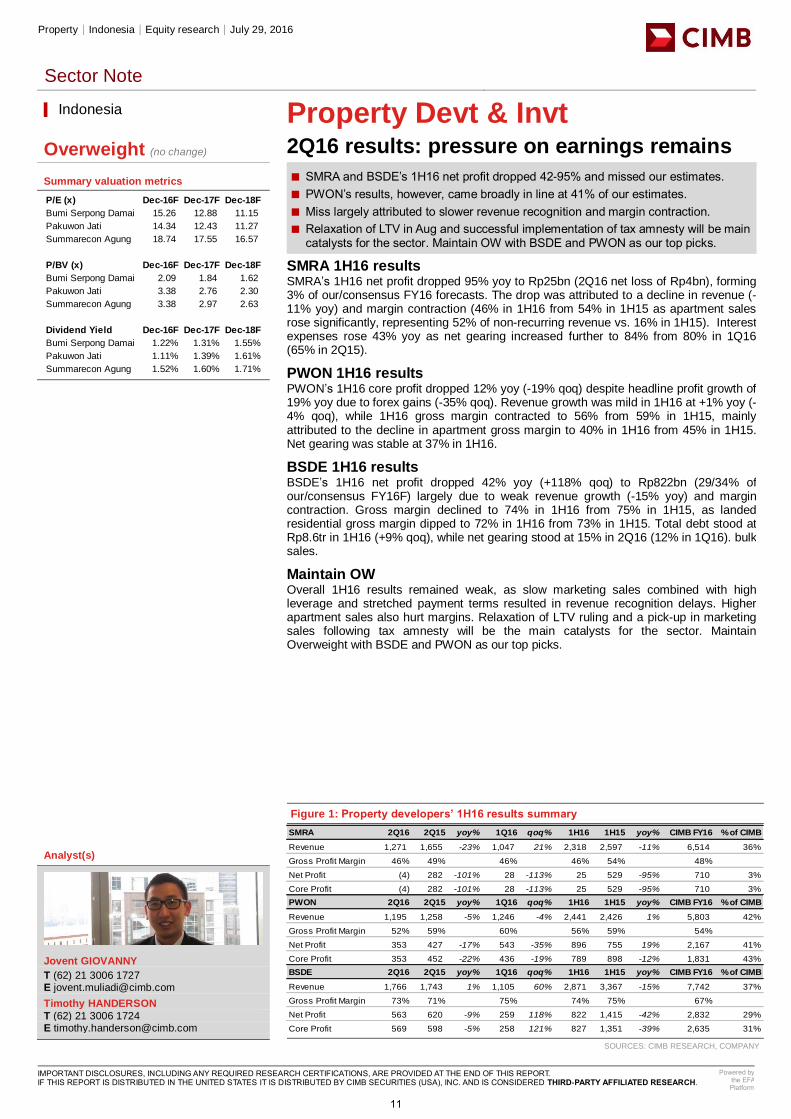
SMRA 1H16 results SMRA’s 1H16 net profit dropped 95% yoy to Rp25bn (2Q16 net loss of Rp4bn), forming 3% of our/consensus FY16 forecasts. The drop was attributed to a decline in revenue (-11% yoy) and margin contraction (46% in 1H16 from 54% in 1H15 as apartment sales rose significantly, representing 52% of non-recurring revenue vs. 16% in 1H15). Interest expenses rose 43% yoy as net gearing increased further to 84% from 80% in 1Q16 (65% in 2Q15).
PWON 1H16 results PWON’s 1H16 core profit dropped 12% yoy (-19% qoq) despite headline profit growth of 19% yoy due to forex gains (-35% qoq). Revenue growth was mild in 1H16 at +1% yoy (-4% qoq), while 1H16 gross margin contracted to 56% from 59% in 1H15, mainly attributed to the decline in apartment gross margin to 40% in 1H16 from 45% in 1H15. Net gearing was stable at 37% in 1H16.
BSDE 1H16 results BSDE’s 1H16 net profit dropped 42% yoy (+118% qoq) to Rp822bn (29/34% of our/consensus FY16F) largely due to weak revenue growth (-15% yoy) and margin contraction. Gross margin declined to 74% in 1H16 from 75% in 1H15, as landed residential gross margin dipped to 72% in 1H16 from 73% in 1H15. Total debt stood at Rp8.6tr in 1H16 (+9% qoq), while net gearing stood at 15% in 2Q16 (12% in 1Q16). bulk sales.
Maintain OW Overall 1H16 results remained weak, as slow marketing sales combined with high leverage and stretched payment terms resulted in revenue recognition delays. Higher apartment sales also hurt margins. Relaxation of LTV ruling and a pick-up in marketing sales following tax amnesty will be the main catalysts for the sector. Maintain Overweight with BSDE and PWON as our top picks.
[ X ]
Figure 1: Property developers’ 1H16 results summary
SOURCES: CIMB RESEARCH, COMPANY
▎Indonesia
Overweight (no change) Summary valuation metrics
Analyst(s)
Jovent GIOVANNY
T (62) 21 3006 1727 E [email protected]
Timothy HANDERSON
T (62) 21 3006 1724 E [email protected]
SMRA 2Q16 2Q15 yoy% 1Q16 qoq% 1H16 1H15 yoy% CIMB FY16 % of CIMB
Revenue 1,271 1,655 -23% 1,047 21% 2,318 2,597 -11% 6,514 36%
Gross Profit Margin 46% 49% 46% 46% 54% 48%
Net Profit (4) 282 -101% 28 -113% 25 529 -95% 710 3%
Core Profit (4) 282 -101% 28 -113% 25 529 -95% 710 3%
PWON 2Q16 2Q15 yoy% 1Q16 qoq% 1H16 1H15 yoy% CIMB FY16 % of CIMB
Revenue 1,195 1,258 -5% 1,246 -4% 2,441 2,426 1% 5,803 42%
Gross Profit Margin 52% 59% 60% 56% 59% 54%
Net Profit 353 427 -17% 543 -35% 896 755 19% 2,167 41%
Core Profit 353 452 -22% 436 -19% 789 898 -12% 1,831 43%
BSDE 2Q16 2Q15 yoy% 1Q16 qoq% 1H16 1H15 yoy% CIMB FY16 % of CIMB
Revenue 1,766 1,743 1% 1,105 60% 2,871 3,367 -15% 7,742 37%
Gross Profit Margin 73% 71% 75% 74% 75% 67%
Net Profit 563 620 -9% 259 118% 822 1,415 -42% 2,832 29%
Core Profit 569 598 -5% 258 121% 827 1,351 -39% 2,635 31%
P/E (x) Dec-16F Dec-17F Dec-18F
Bumi Serpong Damai 15.26 12.88 11.15
Pakuwon Jati 14.34 12.43 11.27
Summarecon Agung 18.74 17.55 16.57
P/BV (x) Dec-16F Dec-17F Dec-18F
Bumi Serpong Damai 2.09 1.84 1.62
Pakuwon Jati 3.38 2.76 2.30
Summarecon Agung 3.38 2.97 2.63
Dividend Yield Dec-16F Dec-17F Dec-18F
Bumi Serpong Damai 1.22% 1.31% 1.55%
Pakuwon Jati 1.11% 1.39% 1.61%
Summarecon Agung 1.52% 1.60% 1.71%
11

Personal Products│South Korea│Equity research│July 31, 2016
Company Note
IMPORTANT DISCLOSURES, INCLUDING ANY REQUIRED RESEARCH CERTIFICATIONS, ARE PROVIDED AT THE END OF THIS REPORT. IF THIS REPORT IS DISTRIBUTED IN THE UNITED STATES IT IS DISTRIBUTED BY CIMB SECURITIES (USA), INC. AND IS CONSIDERED THIRD-PARTY AFFILIATED RESEARCH.
Powered by the EFA Platform
Amorepacific Corp Focus on the big picture
2Q OP was 11.1% below our estimate, mainly due to retrospective booking of ■increased payroll cost (W8bn) and weak earnings in the hypermarket channel.
We expect exponential growth in the Chinese subsidiary, after it posted more than a ■50% yoy sales growth in 2Q, with higher OPM.
2Q net profit came in 7.3% below our forecast. Considering a comfortable base and ■strong China sales, earnings growth is likely to accelerate in 3Q.
We maintain our Add rating, with a lower target price of W520,000, based on a ■FY17F P/E of 31.0x (a 20% premium over the global cosmetics company average)
Mixed 2Q16, OP below our estimate and consensus AP’s 2Q operating profit (OP) was 11.1% below our estimate due to: 1) weak domestic hypermarket channel sales (-15% yoy), and 2) retrospective booking of increased payroll cost. However, despite tighter limits on the number of products each shopper is allowed to purchase across all brands, DFS sales jumped 40%, backed by strong overseas and online DFS sales which accounted for around 30% of DFS revenue. Sales from Aritaum increased only 2% yoy due to the revamping and relocation of some stores.
Surprisingly strong sales growth in Chinese subsidiary Its Chinese subsidiary’s 2Q16 earnings were impressive. Sales from the unit rose by more than 50% yoy. A major surprise was brisk sales for the major 3 brands (Innisfree, Sulwhasoo, Etude). Despite aggressive store expansion, OPM improved yoy backed by 1) robust growth in online sales (more than 80% yoy, accounting for 17% of total China revenue) 2) completion of restructuring in the Mamonde brand, 3) strong SSSG, and 4) full-scale growth by new brands (Ryo, IOPE).
High visibility for strong 3Q earnings Considering a comfortable comparison base in DFS and retrospective increased payroll cost in 3Q15, we expect OP growth to accelerate in 3Q. We also expect to see a strong recovery from Momonde in China, backed by aggressive store expansion (1,573 in 1Q16 to 1,764 in 2Q16) and successful brand renovation. While restructuring in Aritaum and weak hypermarket sales could weigh on domestic earnings, we believe this can be offset by a recovery in lucrative DFS and digital sales.
China business, differentiated growth likely to continue The growth of Korean-style stand-alone stores has been clearly proven again by AP’s 2Q earnings. Faster than expected growth in the number of stores is apparent in both Innisfree and Etude, where Innisfree has already opened all the stores initially targeted for this year (265 stores) through expansion into 2nd-tier cities. We expect to see positive earnings upside from these two brands with higher OPM backed by 1) robust growth in online channel, 2) faster than expected store expansion, and 3) strong SSSG.
Maintain Add, with lower target price of W520,000 We cut 16-17F EPS by 2-3% to factor in weaker than expected earnings in the MC&S and hypermarket channel. Despite robust growth in China, AP’s shares are trading range-bound since 2015. We expect an OP CAGR of 25% into FY18F, which we consider impressive for a consumer staple name. A strong long-term growth outlook with high visibility should support a high valuation premium, and we believe the recent pullback in 2Q16 presents a good buying opportunity for this high quality stock.
▎South Korea
ADD (no change) Consensus ratings*: Buy 33 Hold 2 Sell 0
Current price: W388,000
Target price: W520,000
Previous target: W530,000
Up/downside: 34.0%
CIMB / Consensus: 4.1%
Reuters: 090430.KS
Bloomberg: 090430 KS
Market cap: US$20,247m
W22,681,894m
Average daily turnover: US$34.60m
W40,009m
Current shares o/s: 58.46m
Free float: 50.7% * Source: Bloomberg
Key changes in this note
FY16-17F EPS decreased by 2-3%
Source: Bloomberg
Price performance 1M 3M 12M Absolute (%) -9.6 -4.8 -8.4
Relative (%) -12.7 -5.9 -7.3
Major shareholders % held Amore Pacific Group 35.4
Kyungbae Suh 10.7
National Pension Service 8.2
Analyst(s)
Hyunah JO
T (82) 2 6730 6132 E [email protected]
[ X ]
SOURCE: COMPANY DATA, CIMB FORECASTS
Financial Summary Dec-14A Dec-15A Dec-16F Dec-17F Dec-18F
Revenue (Wb) 3,874 4,767 5,928 7,048 8,128
Operating EBITDA (Wb) 700 920 1,489 1,762 1,792
Net Profit (Wb) 379 578 799 986 1,147
Normalised EPS (W) 6,482 9,878 13,637 16,799 19,537
Normalised EPS Growth 43.1% 52.4% 38.0% 23.2% 16.3%
FD Normalised P/E (x) 59.85 39.28 28.45 23.10 19.86
DPS (W) 650 1,350 1,700 1,900 2,100
Dividend Yield 0.17% 0.35% 0.44% 0.49% 0.54%
EV/EBITDA (x) 31.42 23.58 14.14 11.64 10.90
P/FCFE (x) 245.0 56.2 53.0 41.5 22.7
Net Gearing (25.0%) (30.5%) (40.8%) (44.6%) (52.8%)
P/BV (x) 7.93 6.78 5.60 4.57 3.78
ROE 14.0% 18.6% 21.6% 21.8% 20.9%
% Change In Normalised EPS Estimates (3.09%) (1.58%) (1.52%)
Normalised EPS/consensus EPS (x) 1.13 1.14 1.12
82.0
91.4
100.8
110.1
300,000
350,000
400,000
450,000
Price Close Relative to KOSPI (RHS)
200
400
600
Aug-15 Nov-15 Feb-16 May-16
Vol th
12
Banks│South Korea│Equity research│July 31, 2016
Company Note
IMPORTANT DISCLOSURES, INCLUDING ANY REQUIRED RESEARCH CERTIFICATIONS, ARE PROVIDED AT THE END OF THIS REPORT. IF THIS REPORT IS DISTRIBUTED IN THE UNITED STATES IT IS DISTRIBUTED BY CIMB SECURITIES (USA), INC. AND IS CONSIDERED THIRD-PARTY AFFILIATED RESEARCH.
Powered by the EFA Platform
Industrial Bank of Korea Stable but not attractive
1H16 PPOP came in line at 54% of our full-year forecast but lower credit costs led ■to a better-than-expected net profit (68% of our full-year forecast).
Steep SME growth was achieved in 1H but this is likely to slow down in 2H. ■
Cautious asset quality outlook ahead, in our view. ■
We expect continued uncertainties on the macro front to weigh on the share price. ■
We maintain a Hold rating with an unchanged target price of W12,700. ■
Core earnings broadly in line IBK reported a PPOP of W689bn (US$614m) and net profit of W287bn (US$256m) in 2Q16. PPOP was broadly in-line, but net profit was boosted by lower-than-expected credit costs which fell to 70bps, from 76bps in 1Q16. SG&A increased slightly due to the seasonal compensation (W61bn), resulting in a cost/income ratio of 41.9% vs. 36.5% in 1Q16. Similar to other banks, IBK’s cost control and provision charges were stable.
Lending growth likely to slow Revenue growth was stronger than expected as NIM was sustained qoq while loan growth at 2.9% qoq was the sector’s highest; SME loans grew 2.8% and household loans expanded 3.5% on a qoq basis. Considering its consistently high loan growth (4.6% year-to-date), the incremental loan growth in 2H16 would be limited, in our view. We expect risk weighted assets (RWA) to likely rise in 2H16.
The good and the bad in 2H16 Despite the BOK rate cut in Jun 16, the high proportion of debenture funding (49.5% of total funding in 2Q16) should provide IBK with some support on margin compression compared to the large banks. On the other hand, IBK saw its write-backs slashed by 6% yoy and NPL sales losses expanding by 63% yoy in 2Q16. This indicates rising credit risks in 2H16.
Lingering concerns There is no change to our view of the underlying earnings of IBK. However, uncertainty around the macro outlook for SMEs increase the mid/long-term earnings risks. We acknowledge that IBK’s fundamental earnings trend looks better than expected. However, in terms of share price momentum, we expect the government policy to re-capitalise policy banks (KDB and KEXIM) to continue to be a swing factor to IBK’s earnings.
Maintain Hold After being appointed for a conduit bank, IBK’s share price has corrected and it now trades at 0.41x 16F P/BV. Its stable earnings trend should support the current share price, but we think upside potential is limited. We maintain Hold, with no change to our P/BV based target price. A sudden deterioration/improvement of NPLs and government policy changes to SME loans are risks to our call.
▎South Korea
HOLD (no change) Consensus ratings*: Buy 18 Hold 10 Sell 3
Current price: W11,850
Target price: W12,700
Previous target: W12,700
Up/downside: 7.2%
CIMB / Consensus: -15.9%
Reuters: 024110.KS
Bloomberg: 024110 KS
Market cap: US$5,924m
W6,635,749m
Average daily turnover: US$12.93m
W15,018m
Current shares o/s: 631.8m
Free float: 48.3% * Source: Bloomberg
Key changes in this note
No change.
Source: Bloomberg
Price performance 1M 3M 12M Absolute (%) 5.8 -2.5 -8.1
Relative (%) 2.7 -3.6 -7
Major shareholders % held Ministry of Strategy and Finance 59.8
National Pension 8.21
Analyst(s)
Kathy PARK
T (82) 2 6730 6124 E [email protected]
[ X ]
SOURCE: COMPANY DATA, CIMB FORECASTS
Financial Summary Dec-14A Dec-15A Dec-16F Dec-17F Dec-18F
Net Interest Income (Wb) 4,511 4,631 4,756 5,078 5,419
Total Non-Interest Income (Wb) 44.9 158.7 190.4 205.7 222.1
Operating Revenue (Wb) 4,556 4,790 4,946 5,283 5,641
Total Provision Charges (Wb) (1,162) (1,193) (1,484) (1,672) (1,729)
Net Profit (Wb) 984 1,099 969 983 1,137
Normalised EPS (W) 1,521 1,697 1,478 1,495 1,739
Normalised EPS Growth 23.7% 11.5% (12.9%) 1.2% 16.3%
FD Normalised P/E (x) 7.79 6.98 8.02 7.92 6.81
DPS (W) 430.0 450.0 500.0 550.0 600.0
Dividend Yield 3.63% 3.80% 4.22% 4.64% 5.06%
BVPS (W) 24,234 26,606 27,554 28,683 29,916
P/BV (x) 0.49 0.45 0.43 0.41 0.40
ROE 6.54% 6.67% 5.46% 5.32% 5.94%
Normalised EPS/consensus EPS (x) 0.80 0.78 0.86
76.0
82.0
88.0
94.0
100.0
106.0
10,000
11,000
12,000
13,000
14,000
15,000
Price Close Relative to KOSPI (RHS)
2
4
6
Aug-15 Nov-15 Feb-16 May-16
Vo
l m
13
Finance Companies│South Korea│Equity research│July 31, 2016
Company Note
IMPORTANT DISCLOSURES, INCLUDING ANY REQUIRED RESEARCH CERTIFICATIONS, ARE PROVIDED AT THE END OF THIS REPORT. IF THIS REPORT IS DISTRIBUTED IN THE UNITED STATES IT IS DISTRIBUTED BY CIMB SECURITIES (USA), INC. AND IS CONSIDERED THIRD-PARTY AFFILIATED RESEARCH.
Powered by the EFA Platform
Samsung Card Capturing future growth
2Q16 results surpassed our estimates and were in line with upbeat consensus. ■
The beat came from above-industry volume growth and lower credit costs. ■
A surge in market share thanks to the alliance with SC bank and active marketing. ■
Capital management and high yielding asset growth should catalyse the stock. ■
Maintain Add and raise our SOP-based target price to W59,000. ■
Ahead of expectations SSC reported 2Q16 PPOP and net profit of W172bn (US$154m) and W84bn (US$75m) respectively, beating our estimates (10%) but largely in line with upbeat consensus. Its delinquency ratios continued to fall, keeping its credit costs at a low level of 1.4% (vs. 1.6% in 1Q16). Its interest expense also came down with average funding rate of 2.7% in 2Q16 vs. 2.8% in 1Q16. We believe the robust 2Q16 results reaffirmed our bullish call on Samsung Card given its strong volume growth and well managed credit costs.
Volume over price The market credit transaction volume reached its highest growth level since 2014 in 2Q16 (+10.1% yoy), according to Credit Finance Association. Individual consumption tax cuts and more merchants adopting credit card payments led the strong growth. SSC also reported a sharp rise in transaction volume (+14.9% yoy for personal credit cards), far outpacing the industry volume growth in 2Q16. We expect healthy volume growth to continue in 2H16, thanks to rising online shopping and expanded merchant coverage.
A key beneficiary of low interest rate SSC continued to expand its high yielding lending with the soaring instalment & auto-leasing in 2Q16 (+22% qoq, +84% yoy on a volume basis) as we expected. We acknowledge SSC has expanded its high yielding portfolio in its asset mix since 4Q15 (Fig. 5). SSC is a key beneficiary of low interest rates as it not only benefits from funding cost savings but also from improving asset quality.
Taking share The strategic alliance with SC (Standard Chartered) Bank and SSC’s active marketing initiatives led its credit purchase MS to jump up to 17.2% in 2Q16 (16.7% in 1Q16 and 16.4% in 2Q15). Credit cards’ merchant fee, fully implemented from Mar 16, was largely offset by robust high volume growth in 1H16. We are of view that SSC is clearly changing its growth strategies with more focus on high yielding products and volume growth.
Stay invested – Top pick in Korea financials SSC’s active growth strategy prompted us to revise up our EPS estimates by 8-22% and lower our payout assumptions to 74-90% in FY16-18F. Strong capital management and high-yielding assets growth will continue to serve as key catalysts. We maintain our Add rating and raise our SOP-based target price to W59,000. Key downside risks include a sudden rate hike and unexpected changes in Samsung Group’s restructuring.
▎South Korea
ADD (no change) Consensus ratings*: Buy 15 Hold 4 Sell 0
Current price: W43,150
Target price: W59,000
Previous target: W56,400
Up/downside: 36.7%
CIMB / Consensus: 28.7%
Reuters: 029780.KS
Bloomberg: 029780 KS
Market cap: US$4,463m
W4,999,311m
Average daily turnover: US$4.20m
W4,864m
Current shares o/s: 115.4m
Free float: 27.6% * Source: Bloomberg
Key changes in this note
FY16-18F Revenue increased by 9-10%.
FY16-18F EPS increased by 8-22%.
FY16-18F DPS decreased by 12-33%.
Source: Bloomberg
Price performance 1M 3M 12M Absolute (%) 5.2 11.2 16
Relative (%) 2.1 10.1 17.1
Major shareholders % held Samsung Life Insurance 71.9
Analyst(s)
Kathy PARK
T (82) 2 6730 6124 E [email protected]
[ X ]
SOURCE: COMPANY DATA, CIMB FORECASTS
Financial Summary Dec-14A Dec-15A Dec-16F Dec-17F Dec-18F
Net Interest Income (Wb) 2,727 2,960 3,173 3,447 3,703
Total Non-Interest Income (Wb) 794.4 341.8 235.9 191.7 205.4
Operating Revenue (Wb) 3,522 3,302 3,409 3,639 3,908
Total Provision Charges (Wb) (303.1) (272.6) (264.9) (294.2) (330.7)
Net Profit (Wb) 656.0 333.7 342.9 407.2 452.6
Normalised EPS (W) 5,685 2,892 2,971 3,529 3,922
Normalised EPS Growth 140% (49%) 3% 19% 11%
FD Normalised P/E (x) 7.59 14.92 14.52 12.23 11.00
DPS (W) 1,000 1,500 2,200 3,000 3,501
Dividend Yield 2.32% 3.48% 5.10% 6.95% 8.11%
BVPS (W) 55,375 57,957 58,995 62,524 66,446
P/BV (x) 0.78 0.74 0.73 0.69 0.65
ROE 10.4% 5.1% 5.1% 5.8% 6.1%
% Change In Normalised EPS Estimates 8.2% 22.4% 21.6%
Normalised EPS/consensus EPS (x) 1.01 1.16 1.21
74.0
85.3
96.5
107.8
119.0
27,000
32,000
37,000
42,000
47,000
Price Close Relative to KOSPI (RHS)
1
2
3
Aug-15 Nov-15 Feb-16 May-16
Vo
l m
14
Agribusiness│Malaysia│Equity research│July 30, 2016
Company Note
IMPORTANT DISCLOSURES, INCLUDING ANY REQUIRED RESEARCH CERTIFICATIONS, ARE PROVIDED AT THE END OF THIS REPORT. IF THIS REPORT IS DISTRIBUTED IN THE UNITED STATES IT IS DISTRIBUTED BY CIMB SECURITIES (USA), INC. AND IS CONSIDERED THIRD-PARTY AFFILIATED RESEARCH.
Powered by the EFA Platform
Felda Global Ventures The way forward to improve earnings
In an interview with the media, FGV’s CEO shared his plans for improving the ■group’s earnings and investors’ confidence in FGV shares
He also clarified that the group is not aware of any potential suitors for FGV ■
He also revealed potential plans to negotiate for lower land lease expenses ■
We are positive on the group’s plans to boost earnings via improved efficiency ■
We maintain our non-consensus Add call, with SOP target price of RM2.08 ■
Key highlights from interview with CEO In an interview with The Edge Weekly and Starbiz, Felda Global Ventures Holdings’ (FGV) President and CEO Datuk Zakaria Arshad said: (1) he plans to realise the full potential of FGV’s internal capabilities; (2) his biggest challenge is managing organisational behavior; (3) the focus this year is not M&A, reiterating that FGV is no longer in discussions on Eagle High; (4) he is not aware of any potential suitors from Tradewinds or any other companies; and (5) FGV is committed to 50% dividend payout.
Plans to improve earnings and boost investor confidence FGV’s CEO revealed that his mission is to improve the group’s bottomline and investors’ confidence in FGV shares. To achieve this, he is working to enhance the FFB yields for its estates, oil extraction rate of the group’s mills and contain administrative costs. FGV plans to consolidate 2 of its 71 palm oil mills to boost utilisation rate and cut RM100m administrative costs by this year. There are also plans to monetise non-core assets.
Looking at ways to reduce land lease costs The group is also exploring and negotiating for the best land lease agreements with its parent company, FELDA, in a bid to lower costs. This is still in progress, with nothing formulated yet. One possibility could involve reducing the land acreage that are marginal to reduce lease expenses. To recap, under the land lease agreement with FELDA, FGV pays a fixed lease of RM250 per annum and a 15% share of operating profit from the estates.
Some of the key targets for the estates FGV is targeting OER of 20.2% and FFB yield of 19 tonnes/ha. The group achieved its OER target but not FFB due to the El Nino impact. It also plans to reduce its costs of production for crude palm oil (CPO), which was RM1,824 per tonne in 1Q16 to an average of RM1,450 per tonne for 2016. The group withdrew its RSPO certificates due to issues with FELDA’s contractors. It plans to recertify 15 out of its 71 mills this year, and the remainder within the next three years
Positive on CEO’s plans; maintain Add The positive takeaways from the interview are FGV’s plans to lower lease expenses; and improve its estates’ productivity, both of which will help boost future earnings. We are neutral on the news that FGV is not aware of any potential suitors. We maintain our non-consensus Add rating, with unchanged SOP target price of RM2.08. Our SOP implies a P/BV of 1.2x for the group, which is still attractive relative to its Malaysian sector peers’ average of 1.9x. Downside risks include failure to execute plans to improve earnings.
▎Malaysia
ADD (no change) Consensus ratings*: Buy 1 Hold 6 Sell 9
Current price: RM1.85
Target price: RM2.08
Previous target: RM2.08
Up/downside: 12.2%
CIMB / Consensus: 55.3%
Reuters: FGVH.KL
Bloomberg: FGV MK
Market cap: US$1,660m
RM6,749m
Average daily turnover: US$2.99m
RM12.11m
Current shares o/s: 3,648m
Free float: 58.6% * Source: Bloomberg
Key changes in this note
No changes
Source: Bloomberg
Price performance 1M 3M 12M Absolute (%) 20.1 27.6 12.1
Relative (%) 19.4 28.8 14.8
Major shareholders % held Federal Land Development Authority 20.0
Felda Asset Holdings 13.7
Lembaga Tabung Haji 7.8
Analyst(s)
Ivy NG Lee Fang, CFA
T (60) 3 2261 9073 E [email protected]
[ X ]
SOURCE: COMPANY DATA, CIMB FORECASTS
Financial Summary Dec-14A Dec-15A Dec-16F Dec-17F Dec-18F
Revenue (RMm) 16,462 15,700 15,738 16,769 17,725
Operating EBITDA (RMm) 1,269 973 1,069 1,316 1,592
Net Profit (RMm) 306.4 139.6 162.5 334.1 516.0
Core EPS (RM) 0.10 (0.02) 0.04 0.09 0.14
Core EPS Growth 200% (123%) 106% 54%
FD Core P/E (x) 19.14 NA 41.53 20.20 13.08
DPS (RM) 0.10 0.04 0.03 0.06 0.10
Dividend Yield 5.41% 2.16% 1.62% 3.24% 5.41%
EV/EBITDA (x) 6.43 12.40 11.38 9.35 7.41
P/FCFE (x) 34.29 20.08 5.43 5.22 5.57
Net Gearing (9.2%) 33.4% 30.3% 27.7% 18.8%
P/BV (x) 1.06 1.05 1.04 1.02 1.00
ROE 5.45% (1.25%) 2.51% 5.10% 7.71%
CIMB/consensus EPS (x) 1.04 1.31 1.63
74.0
84.0
94.0
104.0
114.0
124.0
1.10
1.30
1.50
1.70
1.90
2.10
Price Close Relative to FBMKLCI (RHS)
50
100
Jul-15 Nov-15 Feb-16 May-16
Vo
l m
15
Airports│Malaysia│Equity research│July 29, 2016
Company Note
IMPORTANT DISCLOSURES, INCLUDING ANY REQUIRED RESEARCH CERTIFICATIONS, ARE PROVIDED AT THE END OF THIS REPORT. IF THIS REPORT IS DISTRIBUTED IN THE UNITED STATES IT IS DISTRIBUTED BY CIMB SECURITIES (USA), INC. AND IS CONSIDERED THIRD-PARTY AFFILIATED RESEARCH.
Powered by the EFA Platform
Malaysia Airports Holdings Golden opportunity to accumulate
MAHB’s group 1H16 core net profit of RM110m almost touched our previous full-■year forecast of RM121m, due to better-than-expected performance in Malaysia.
Turkey delivered a small 1H16 core net loss that was in line with our forecasts which ■had already been significantly reduced in our 15 May and 16 July reports.
This is an opportune time to accumulate MAHB, as the current share price does not ■factor in any PSC tariff hike, and prices ISG at an 80% discount to its intrinsic value.
We maintain Add, and raise our DCF-based target price to RM8.30, as we model ■higher Malaysian passenger traffic growth with price competition heating up.
Highlights of 2Q16 MAHB’s Malaysian operations delivered a RM54m core profit in 2Q16 vs. a loss of RM29m during last year’s 2Q. This exceeded our forecasts as lower bonus provisions kept a lid on staff costs. Istanbul Sabiha Gokcen (ISG) incurred a small core net loss of €1.2m in 2Q16, which was in line with expectations given the worsening security situation in Turkey, but disappointing against our expectations at the start of this year.
Traffic growth not particularly inspiring Malaysian 2Q16 pax traffic was flat against last year, but the pax mix improved with higher growth at KLIA MTB compared to klia2 (due to Malindo transferring to MTB from 15 March), and with international traffic growing as opposed to the decline seen in domestic traffic. The latter was related to Ramadan falling squarely in June this year. ISG saw its traffic growth slow down significantly to just 6% yoy in 2Q16, as tourist arrivals fell and airline expansion became more difficult with a congested runway.
What is in the share price? The current share price of RM5.85 implies an equity valuation of RM9.7bn for the group. Our DCF valuation of the Malaysian business is RM9.3bn assuming no PSC hikes, leaving a residual value of RM406m for ISG based on the current market cap. This compares against our DCF value of RM1.9bn for ISG. The market is therefore pricing ISG at an 80% discount to its long-term intrinsic value. We do not think such a large discount is appropriate or necessary, even in the face of near-term demand weakness.
Many catalysts ahead In the next 6-12 months, we believe that several catalysts in Malaysia will move the share price upwards. First, the Malaysian Aviation Commission is likely to revise up the PSC tariffs at klia2, finally permitting MAHB to earn a higher rate of return on its RM4.5bn investment. Second, MAS and Malindo, will both add capacity to the market in 2H16 and 2017. We have revised up our passenger traffic growth forecast for Malaysia in FY17 to 7%, from 4.7%, with potential upside bias.
The risks to our call With the risks to the Malaysian operations clearing, the key risk now lies in Turkey, which is undergoing political turmoil and may experience several more unpredictable terrorist attacks. However, the share price appears to have more than priced this in. A possible terrorist attack on Malaysian soil may also weaken MAHB’s outlook. Our target price assumes two consecutive PSC hikes of RM1/pax and RM10/pax for the domestic and international pax at klia2, respectively, in each of early-2017 and early-2018.
▎Malaysia
ADD (no change) Consensus ratings*: Buy 6 Hold 7 Sell 6
Current price: RM5.85
Target price: RM8.30
Previous target: RM7.25
Up/downside: 41.9%
CIMB / Consensus: 27.1%
Reuters: MAHB.KL
Bloomberg: MAHB MK
Market cap: US$2,397m
RM9,706m
Average daily turnover: US$2.84m
RM11.46m
Current shares o/s: 1,639m
Free float: 38.5% * Source: Bloomberg
Key changes in this note
FY16F Core EPS increased by 28%.
FY17F Core EPS increased by 22%.
FY18F Core EPS increased by 25%.
Source: Bloomberg
Price performance 1M 3M 12M Absolute (%) -7.7 -11.4 -0.7
Relative (%) -9.2 -10.4 1.7
Major shareholders % held Khazanah Nasional 36.6
Employees Provident Fund 13.1
Permodalan Nasional Berhad 11.8
Analyst(s)
Raymond YAP, CFA
T (60) 3 2261 9072 E [email protected]
[ X ]
SOURCE: COMPANY DATA, CIMB FORECASTS
Financial Summary Dec-14A Dec-15A Dec-16F Dec-17F Dec-18F
Revenue (RMm) 3,344 3,871 4,204 4,493 4,814
Operating EBITDA (RMm) 695 1,317 1,520 1,736 1,909
Net Profit (RMm) 748.6 37.7 (31.4) 81.5 211.0
Core EPS (RM) 0.12 0.01 0.09 0.17 0.23
Core EPS Growth (54%) (91%) 733% 83% 37%
FD Core P/E (x) 46.3 494.8 63.1 34.4 25.1
DPS (RM) 0.05 0.09 0.12 0.18 0.22
Dividend Yield 0.94% 1.45% 2.12% 3.04% 3.82%
EV/EBITDA (x) 18.38 10.87 9.35 8.01 7.06
P/FCFE (x) 10.96 NA 39.47 32.37 18.95
Net Gearing 58.4% 52.2% 50.3% 45.0% 37.4%
P/BV (x) 1.16 1.10 1.12 1.13 1.14
ROE 2.89% 0.23% 1.76% 3.27% 4.53%
% Change In Core EPS Estimates 27.5% 21.8% 25.0%
CIMB/consensus EPS (x) (0.26) 0.37 0.65
71.0
85.3
99.6
113.9
3.90
4.90
5.90
6.90
Price Close Relative to FBMKLCI (RHS)
5
10
15
Jul-15 Oct-15 Feb-16 May-16
Vol m
16
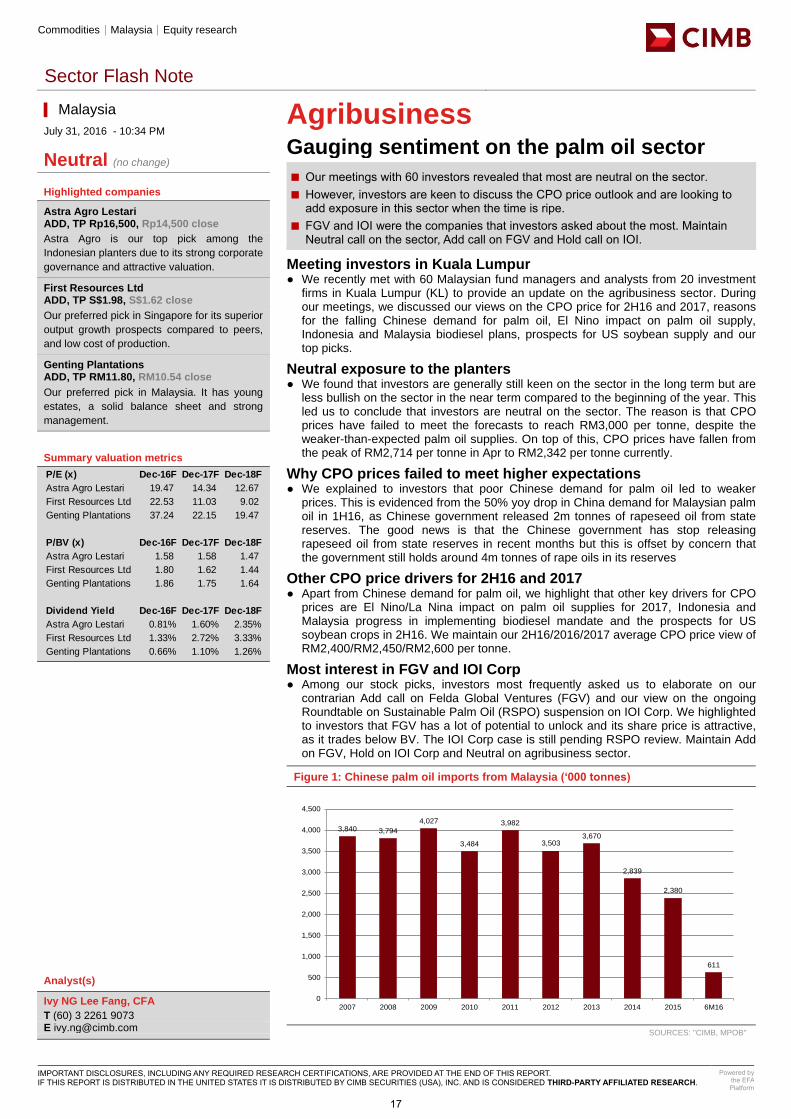
Commodities│Malaysia│Equity research
Sector Flash Note
IMPORTANT DISCLOSURES, INCLUDING ANY REQUIRED RESEARCH CERTIFICATIONS, ARE PROVIDED AT THE END OF THIS REPORT. IF THIS REPORT IS DISTRIBUTED IN THE UNITED STATES IT IS DISTRIBUTED BY CIMB SECURITIES (USA), INC. AND IS CONSIDERED THIRD-PARTY AFFILIATED RESEARCH.
Powered by the EFA Platform
Agribusiness Gauging sentiment on the palm oil sector
Our meetings with 60 investors revealed that most are neutral on the sector. ■ However, investors are keen to discuss the CPO price outlook and are looking to ■add exposure in this sector when the time is ripe.
FGV and IOI were the companies that investors asked about the most. Maintain ■Neutral call on the sector, Add call on FGV and Hold call on IOI.
Meeting investors in Kuala Lumpur ● We recently met with 60 Malaysian fund managers and analysts from 20 investment
firms in Kuala Lumpur (KL) to provide an update on the agribusiness sector. During our meetings, we discussed our views on the CPO price for 2H16 and 2017, reasons for the falling Chinese demand for palm oil, El Nino impact on palm oil supply, Indonesia and Malaysia biodiesel plans, prospects for US soybean supply and our top picks.
Neutral exposure to the planters ● We found that investors are generally still keen on the sector in the long term but are
less bullish on the sector in the near term compared to the beginning of the year. This led us to conclude that investors are neutral on the sector. The reason is that CPO prices have failed to meet the forecasts to reach RM3,000 per tonne, despite the weaker-than-expected palm oil supplies. On top of this, CPO prices have fallen from the peak of RM2,714 per tonne in Apr to RM2,342 per tonne currently.
Why CPO prices failed to meet higher expectations ● We explained to investors that poor Chinese demand for palm oil led to weaker
prices. This is evidenced from the 50% yoy drop in China demand for Malaysian palm oil in 1H16, as Chinese government released 2m tonnes of rapeseed oil from state reserves. The good news is that the Chinese government has stop releasing rapeseed oil from state reserves in recent months but this is offset by concern that the government still holds around 4m tonnes of rape oils in its reserves
Other CPO price drivers for 2H16 and 2017 ● Apart from Chinese demand for palm oil, we highlight that other key drivers for CPO
prices are El Nino/La Nina impact on palm oil supplies for 2017, Indonesia and Malaysia progress in implementing biodiesel mandate and the prospects for US soybean crops in 2H16. We maintain our 2H16/2016/2017 average CPO price view of RM2,400/RM2,450/RM2,600 per tonne.
Most interest in FGV and IOI Corp ● Among our stock picks, investors most frequently asked us to elaborate on our
contrarian Add call on Felda Global Ventures (FGV) and our view on the ongoing Roundtable on Sustainable Palm Oil (RSPO) suspension on IOI Corp. We highlighted to investors that FGV has a lot of potential to unlock and its share price is attractive, as it trades below BV. The IOI Corp case is still pending RSPO review. Maintain Add on FGV, Hold on IOI Corp and Neutral on agribusiness sector.
Figure 1: Chinese palm oil imports from Malaysia (‘000 tonnes)
SOURCES: "CIMB, MPOB"
3,840 3,794
4,027
3,484
3,982
3,5033,670
2,839
2,380
611
0
500
1,000
1,500
2,000
2,500
3,000
3,500
4,000
4,500
2007 2008 2009 2010 2011 2012 2013 2014 2015 6M16
▎Malaysia
July 31, 2016 - 10:34 PM
Neutral (no change)
Highlighted companies
Astra Agro Lestari ADD, TP Rp16,500, Rp14,500 close
Astra Agro is our top pick among the
Indonesian planters due to its strong corporate
governance and attractive valuation.
First Resources Ltd ADD, TP S$1.98, S$1.62 close
Our preferred pick in Singapore for its superior
output growth prospects compared to peers,
and low cost of production.
Genting Plantations ADD, TP RM11.80, RM10.54 close
Our preferred pick in Malaysia. It has young
estates, a solid balance sheet and strong
management.
Summary valuation metrics
Analyst(s)
Ivy NG Lee Fang, CFA
T (60) 3 2261 9073 E [email protected]
P/E (x) Dec-16F Dec-17F Dec-18F
Astra Agro Lestari 19.47 14.34 12.67
First Resources Ltd 22.53 11.03 9.02
Genting Plantations 37.24 22.15 19.47
P/BV (x) Dec-16F Dec-17F Dec-18F
Astra Agro Lestari 1.58 1.58 1.47
First Resources Ltd 1.80 1.62 1.44
Genting Plantations 1.86 1.75 1.64
Dividend Yield Dec-16F Dec-17F Dec-18F
Astra Agro Lestari 0.81% 1.60% 2.35%
First Resources Ltd 1.33% 2.72% 3.33%
Genting Plantations 0.66% 1.10% 1.26%
17

Financial Services│Malaysia│Equity research│July 31, 2016
Sector Note
IMPORTANT DISCLOSURES, INCLUDING ANY REQUIRED RESEARCH CERTIFICATIONS, ARE PROVIDED AT THE END OF THIS REPORT. IF THIS REPORT IS DISTRIBUTED IN THE UNITED STATES IT IS DISTRIBUTED BY CIMB SECURITIES (USA), INC. AND IS CONSIDERED THIRD-PARTY AFFILIATED RESEARCH.
Powered by the EFA Platform
Banks Jun 16 tracker – working hard to limit impaired loan ratios
Gross impaired loan (GIL) ratio only inched up 1bp mom to 1.66% in Jun 16. ■ The industry’s loan growth eased from 6.2% yoy in May 16 to 5.6% yoy in Jun 16. ■ In Jun 16, loan applications rose by 4% yoy but approvals fell by 21% yoy. ■ Lending rate rose by 6bp mom in Jun 16 but declined in Jul 16 following Bank ■Negara Malaysia’s (BNM) overnight policy rate (OPR) cut.
Maintain Overweight on banks premised on attractive valuations and better ■prospects in 2017. Our top pick is RHB Bank.
Gross impaired loan ratio stable mom… Against the various macro headwinds to banks’ asset quality, the industry’s GIL ratio inched up from 1.65% in May 16 to 1.66% in Jun 16. However, loan loss coverage fell from 91.2% in May 16 to 89.5% in Jun 16, resulting from the 0.7% mom drop in total provisions (including collective and individual assessment allowances) in Jun 16 against a 1.2% mom rise in GIL. We stick to our expectation of an increase in GIL ratio to 1.8% by year-end.
…but loan growth still heading south The industry’s loan growth continued to soften, from 6.2% yoy in May 16 to 5.6% yoy in Jun 16, the weakest since Aug 04. This was partly dragged down by the 18.2% yoy drop in loans classified as “others”. Momentum of the major loan segments also eased- from 6.2% yoy in May 16 to 6% yoy in Jun 16 for consumer loans and from 4.5% yoy to 4.2% yoy for business loans. In view of the weak YTD loan expansion, we will soon revise downwards our loan growth projection of 7-8% for 2016.
Continuous growth in applications Industry loan applications continued to advance by 3.9% yoy in Jun 16 (vs. 8.9% yoy rise in May 16). The growth was underpinned by the 201% yoy jump in the “other” segment but applications for residential mortgages and working capital loans fell by 7.1% yoy and 11.2% yoy, respectively, in Jun 16. Conversely, loan approvals plunged by 21% yoy in Jun 16, compared to a 2.2% yoy rise in May 16, mainly due to the higher base in Jun 15. In fact, Jun 16 approvals were above the Jan-May 16 average.
A temporary increase in lending rate Banks’ average lending rate (ALR) rose from 4.55% in May 16 to 4.61% in Jun 16 due to a 10bp increase in base rates (BRs) by Public Bank on 17 May 16 and CIMB Bank on 9 Jun 16. However, the ALR will drop in Jul 16 as the banks reduced their base rates by 10-23bp following the 25bp cut in OPR by BNM on 13 Jul 16. In Jul 16, banks also trimmed their fixed deposit rates by 15-25bp.
Maintain Overweight We retain our Overweight call on banks, given the potential re-rating catalysts of: (1) attractive valuations for most banks, and (2) better earnings growth in 2017. 2016 will be a tough year for banks with expected moderation in loan growth, rise in GIL ratio and rate cut. We envisage better earnings prospects for banks in 2017, when they would benefit from the government’s pump priming and the strong flow of construction projects that would create multiplier effect in the economy. RHB Bank is still our top pick.
[ X ]
Figure 1: Banking system’s total loans and yoy growth
SOURCES: BANK NEGARA MALAYSIA
▎Malaysia
Overweight (no change)
Highlighted companies
Malayan Banking Bhd ADD, TP RM10.10, RM8.02 close
We like Maybank for its extensive regional network and presence in underpenetrated markets like Indonesia and the Philippines. It is also ranked one of the top three in most market segments in Malaysia.
Public Bank Bhd HOLD, TP RM19.05, RM19.50 close
Against the slowdown in loan growth, Public Bank managed to maintain its loan momentum at 9.5% yoy in Jun 16 (or 9.1% yoy for Malaysian operations). This is above the industry pace of 6-7%.
RHB Bank Bhd ADD, TP RM6.20, RM5.09 close
We see better prospects for RHB Bank’s earnings in the longer term, catalysed by: (1) the benefits from the IGNITE 17 transformation programme, and (2) the drive for regional expansion.
Summary valuation metrics
Analyst(s)
Winson NG, CFA
T (60) 3 2261 9071 E [email protected]
4%
5%
6%
7%
8%
9%
10%
11%
12%
600,000
700,000
800,000
900,000
1,000,000
1,100,000
1,200,000
1,300,000
1,400,000
1,500,000
Jun-14 Sep-14 Dec-14 Mar-15 Jun-15 Sep-15 Dec-15 Mar-16 Jun-16
%RM m
Loans yoy growth
P/E (x) Dec-16F Dec-17F Dec-18F
Malayan Banking Bhd 11.40 10.05 9.25
Public Bank Bhd 14.77 13.40 12.19
RHB Bank Bhd 8.55 8.92 7.94
P/BV (x) Dec-16F Dec-17F Dec-18F
Malayan Banking Bhd 1.35 1.30 1.24
Public Bank Bhd 2.18 1.97 1.78
RHB Bank Bhd 0.87 0.81 0.75
Dividend Yield Dec-16F Dec-17F Dec-18F
Malayan Banking Bhd 6.40% 7.26% 7.89%
Public Bank Bhd 3.05% 3.36% 3.69%
RHB Bank Bhd 3.10% 3.36% 3.78%
18

REIT│Singapore│Equity research│July 29, 2016
Company Note
IMPORTANT DISCLOSURES, INCLUDING ANY REQUIRED RESEARCH CERTIFICATIONS, ARE PROVIDED AT THE END OF THIS REPORT. IF THIS REPORT IS DISTRIBUTED IN THE UNITED STATES IT IS DISTRIBUTED BY CIMB SECURITIES (USA), INC. AND IS CONSIDERED THIRD-PARTY AFFILIATED RESEARCH.
Powered by the EFA Platform
CDL Hospitality Trust 2QFY16: RevPAR decline re-accelerates
1H16 DPU of 4.45Scts (-5% yoy) was slightly below our estimate and consensus, ■forming 47% of our FY16 forecast. 2Q16 DPU at 24%.
Except for the magnitude in declines, underlying currents for 2Q16 were more or ■less the same as previous quarters.
Singapore: -9% yoy drop in RevPAR. Maldives: -27% yoy drop in RevPAR. ■ Japan: +6% yoy increase in RevPAR. UK: +19% yoy increase in RevPAR. ■ Weakness to persist, maintain Hold with a lower DDM-based target price. ■
2QFY16 results summary CDREIT posted a 1% yoy drop in NPI for 2Q16 as weaker Singapore and Maldives were partially offset by inorganic growth from the UK, growth from Japan hotels and incremental income from Claymore Connect. DPU was 2.23 Scts (-1% yoy). Note that 2Q16 DPU included income and capital distribution from the Japan Hotels (0.08 Scts) which was absent in 2Q15. From now onwards, distribution from Japan Hotels will occur twice yearly. Contribution from Oct-31 Mar will be distributed in 2Q and Apr-Sep in 4Q.
Singapore RevPAR decline re-accelerates Singapore Hotels’ revenue/NPI declined 8%/12% yoy in 2Q. The Singapore properties achieved occupancy of 83.5% (2Q15: 86.5%) and ARR of S$188 (-6% yoy), resulting in a 9% yoy drop in RevPAR to S$157. The magnitude of the decline was larger than the 7% in 1Q16. For 1H16, RevPAR fell 8% yoy to S$159 due to (i) renovations at M Hotel and Grand Copthrone Waterfront, (ii) absence of SEA Games in Jun and (iii) a “shocker” of a Jun. Hence, some of the trust’s hotels recorded double-digit declines in RevPAR.
Maldives: 26.6% decline in RevPAR in 2Q16 Maldives continued to be afflicted by the strength of the US dollar vs. the major source markets and weaker appetite for luxury markets. China, which is the top-source market, showed a 12% decline in arrivals for 5M16. We expect Angsana Velavaru to earn just slightly above its base rent of US$6m.
Japan, UK the growth drivers Japan’s RevPAR/NPI grew 6%/27% yoy in 2Q16 due to a robust market. Visitor arrivals grew 28% for 1H16 to 11.7m. In UK, Hilton Cambridge Hotel’s RevPAR rose 19% yoy due mainly to AEI which was completed in Apr 15 (bump in ARR). Underlying dynamics for Australia continue to be weak, but that is mitigated by the fixed-master lease structure. New Zealand continues to be robust and with the change in master lease on 17 Jun 16, we expect CDREIT to participate in the growth of Auckland.
Lowest yielding Hotel S-REIT; Hold maintained Barring another bad Jun, we expect 2H16 to be slightly better than 1H16. That said, we expect weakness in Singapore (incoming supply, poor corporate demand and poor quality of visitor arrivals) and Maldives to persist. We cut FY16 DPU by 2.5% to factor in 2Q16 results. We now expect Singapore RevPAR to fall 8.7% yoy in FY16 (prev. -8%). We cut FY17-18 DPU by c.2% on higher taxes. Hence, the lower DDM-based target price. We only project 3.8% total return for 2016.
▎Singapore
HOLD (no change) Consensus ratings*: Buy 8 Hold 8 Sell 1
Current price: S$1.47
Target price: S$1.43
Previous target: S$1.46
Up/downside: -2.5%
CIMB / Consensus: -2.0%
Reuters: CDLT.SI
Bloomberg: CDREIT SP
Market cap: US$1,077m
S$1,455m
Average daily turnover: US$1.49m
S$2.01m
Current shares o/s: 987.1m
Free float: 63.6% * Source: Bloomberg
Key changes in this note
FY16F DPU decreased by 2.5%.
FY17F DPU decreased by 1.5%.
FY18F DPU decreased by 1.8%.
Source: Bloomberg
Price performance 1M 3M 12M Absolute (%) 5 1 -9
Relative (%) -0.9 -1 2.1
Major shareholders % held CDL 36.4
Aberdeen 5.0
Schroders 4.0
Analyst(s)
YEO Zhi Bin
T (65) 6210 8669 E [email protected]
LOCK Mun Yee T (65) 6210 8606 E [email protected]
[ X ]
SOURCE: COMPANY DATA, CIMB FORECASTS
Financial Summary Dec-14A Dec-15A Dec-16F Dec-17F Dec-18F
Gross Property Revenue (S$m) 166.8 172.4 183.5 187.4 194.9
Net Property Income (S$m) 140.5 137.0 138.1 141.3 147.3
Net Profit (S$m) 122.5 58.4 81.6 84.4 89.6
Distributable Profit (S$m) 107.6 99.2 91.6 94.5 100.0
Core EPS (S$) 0.11 0.09 0.08 0.08 0.09
Core EPS Growth (0.0%) (16.6%) (8.1%) 2.8% 5.4%
FD Core P/E (x) 13.68 16.40 17.84 17.37 16.47
DPS (S$) 0.11 0.10 0.09 0.09 0.10
Dividend Yield 7.33% 7.07% 6.27% 6.42% 6.75%
Asset Leverage 31.6% 36.2% 36.1% 36.1% 36.1%
BVPS (S$) 1.65 1.59 1.58 1.57 1.56
P/BV (x) 0.89 0.92 0.93 0.94 0.94
Recurring ROE 6.54% 5.53% 5.19% 5.37% 5.70%
% Change In DPS Estimates (2.50%) (1.46%) (1.76%)
CIMB/consensus DPS (x) 0.93 0.93 0.95
90.0
95.0
100.0
105.0
110.0
1.200
1.300
1.400
1.500
1.600
Price Close Relative to FSSTI (RHS)
2
4
6
8
Jul-15 Oct-15 Feb-16 May-16
Vol m
19
REIT│Singapore│Equity research│July 29, 2016
Company Note
IMPORTANT DISCLOSURES, INCLUDING ANY REQUIRED RESEARCH CERTIFICATIONS, ARE PROVIDED AT THE END OF THIS REPORT. IF THIS REPORT IS DISTRIBUTED IN THE UNITED STATES IT IS DISTRIBUTED BY CIMB SECURITIES (USA), INC. AND IS CONSIDERED THIRD-PARTY AFFILIATED RESEARCH.
Powered by the EFA Platform
Far East Hospitality Trust Blame it on June and the renovations
1HFY16 DPU of 2.09 Scts (-6% yoy) was slightly below our expectation and ■consensus, forming 46% of our full-year estimate. 2Q16 at 22%.
Hotel RevPAR for 2Q16 was down 7.5% yoy due to renovation at Orchard Parade ■Hotel and an awful June.
Serviced residences RevPAU for 2Q16 was down 8.9% yoy due to weakness in ■corporate demand.
Trading conditions remain challenging; we maintain Hold with an unchanged TP. ■DPU cuts are offset by across-the-board reduction in Rf assumption.
2QFY16 results summary FEHT achieved a 2Q DPU of 1.01 Scts (-13% yoy) as trading conditions remained challenging. Consistent with what we have been hearing, June was an awful month for the hospitality industry as room demand suddenly evaporated. Additionally, there was the absence of the SEA Games which boosted Jun 15’s numbers. Thirdly, the refurbishment of public spaces at Orchard Parade impacted the trust more than it anticipated. Occupancy at Orchard Parade was shaved off by 10% pts in the quarter.
Hotel RevPAR for 2Q16 down 7.5% yoy to S$136 Hotel occupancy for 2Q16 dropped 1.4% pts yoy and 2.7% pts qoq to 85.3%. ADR dropped 6.1% yoy (flat qoq) to S$160. Hence, RevPAR dropped 7.5% yoy. For 1H16, RevPar decreased 3.9% yoy to S$138. With this set of results, an encouraging 1Q16 performance was thrown out of the window. We are now expecting hotel RevPAR to decrease 4.2% yoy for FY16 (previously flat yoy; FY15: -5.8%).
Serviced residences RevPAU for 2Q16 down 8.9% yoy to S$187 Serviced residences occupancy for 2Q16 dropped 3.3% pts yoy but improved 1.7% qoq to 86%. ADR dropped 5.4% yoy and 2.2% qoq to S$218. Hence, RevPAU dropped 8.9% yoy. For 1H16, RevPAU decreased 8.7% yoy to S$188. With the drop-off in oil & gas, the Manager is trying to re-position some of the properties to attract corporate customers from other trade sectors such as electronics and manufacturing.
Revenue strategy for hotels in the 2H The trust’s focus now is to keep occupancy high. With the drop-off in corporate demand, the Manager would target leisure travelers. That said, leisure travelers pay a lower rate vs. corporate customers. In addition, there is a limit to the volume of leisure travelers which FEHT’s hotels can attract as the properties are not positioned for group travel. Leisure made up 62% of hotel revenue in 2Q16 (2Q15: 54.7%; 1Q16: 61%).
Trading conditions remain challenging; Hold maintained Barring another bad June, we expect 2H16 to be slightly better than 1H16. The view is also supported by the fact that phase one of the AEI of Orchard Parade Hotel has completed; and the property should be in a better shape. Phase two of the AEI (room refurbishments) will commence next year. Also, Sep is a typically good month for Serviced Residences. Not to forget, F1 will be in town. Overall, as trading conditions remain challenging, we maintain Hold on the stock with an unchanged DDM-target price.
▎Singapore
HOLD (no change) Consensus ratings*: Buy 2 Hold 5 Sell 3
Current price: S$0.64
Target price: S$0.65
Previous target: S$0.65
Up/downside: 1.4%
CIMB / Consensus: -3.2%
Reuters: FAEH.SI
Bloomberg: FEHT SP
Market cap: US$852.0m
S$1,151m
Average daily turnover: US$0.35m
S$0.48m
Current shares o/s: 1,775m
Free float: 44.6% * Source: Bloomberg
Key changes in this note
FY16-18F DPU decreased by 4.8-5.8%.
Source: Bloomberg
Price performance 1M 3M 12M Absolute (%) 5.8 -3.8 -9.2
Relative (%) 3.1 -4.9 3.5
Major shareholders % held Far East Organization 53.3
Aberdeen 6.0
Vanguard Group 0.9
Analyst(s)
YEO Zhi Bin
T (65) 6210 8669 E [email protected]
LOCK Mun Yee T (65) 6210 8606 E [email protected]
[ X ]
SOURCE: COMPANY DATA, CIMB FORECASTS
Financial Summary Dec-14A Dec-15A Dec-16F Dec-17F Dec-18F
Gross Property Revenue (S$m) 121.7 114.6 110.3 111.6 116.3
Net Property Income (S$m) 110.0 103.7 101.1 102.5 107.1
Net Profit (S$m) 71.34 33.22 66.79 67.56 71.42
Distributable Profit (S$m)
Core EPS (S$) 0.045 0.039 0.037 0.037 0.039
Core EPS Growth (11.7%) (11.8%) (5.4%) 0.4% 4.9%
FD Core P/E (x) 14.36 16.28 17.21 17.15 16.35
DPS (S$) 0.051 0.046 0.044 0.044 0.046
Dividend Yield 8.03% 7.19% 6.81% 6.84% 7.15%
Asset Leverage 31.3% 32.4% 32.8% 33.1% 33.5%
BVPS (S$) 0.97 0.94 0.93 0.93 0.92
P/BV (x) 0.66 0.68 0.69 0.69 0.70
Recurring ROE 4.55% 4.11% 3.97% 4.01% 4.24%
% Change In DPS Estimates (4.83%) (5.76%) (5.68%)
CIMB/consensus DPS (x) 0.97 0.95 0.95
89.0
94.0
99.0
104.0
109.0
114.0
0.500
0.550
0.600
0.650
0.700
0.750
Price Close Relative to FSSTI (RHS)
2
4
6
Jul-15 Oct-15 Feb-16 May-16
Vol m
20
Media - Integrated│Singapore│Equity research
Company Flash Note
IMPORTANT DISCLOSURES, INCLUDING ANY REQUIRED RESEARCH CERTIFICATIONS, ARE PROVIDED AT THE END OF THIS REPORT. IF THIS REPORT IS DISTRIBUTED IN THE UNITED STATES IT IS DISTRIBUTED BY CIMB SECURITIES (USA), INC. AND IS CONSIDERED THIRD-PARTY AFFILIATED RESEARCH.
Powered by the EFA Platform
mm2 Asia
A beginning song
51/49 JV to partner with local established songwriter on music production. ■ Minimal investment and earnings contribution in the near term, but offers potential ■synergies and a music platform aimed towards the bigger China market.
No change to our forecasts, target price and Hold recommendation. ■
Movies, dramas, concerts, and now music production ● mm2 announced a 51:49 joint venture with local songwriter/ composer Dick Lee for
collaboration in music production and distribution, artist development, creative direction and consultancy.
● Music composers typically receive royalties from their songs, in various forms such as performance, publishing, reproduction and YouTube. Size of fees vary depending on a song’s popularity.
● While total investment is expected to be S$0.4m with minimal earnings contribution for FY17-19, we think mm2 can benefit from both broader content offerings and the uncovering of new talent. This also marks mm2’s next step towards becoming a more diversified entertainment group, following its acquisition of a 51% stake in Unusual Group. We believe there could be more plans in the pipeline.
A music platform aimed towards the bigger China market ● Dick Lee is one of Singapore’s best-known music personalities, with an established
track record in not only song composition, but also in plays and musicals. Some of his notable works comprise National Day theme song “Home” and Jacky Cheung’s “Snow.Wolf.Lake”, and he was appointed as creative director for Singapore’s 50th National Day Parade in 2015.
● We also note the rising popularity of Singaporean star Nathan Hartono, who was recently featured in season 1 of “Sing! China” and won praise from all four judges. This singing sensation could direct more attention towards the local entertainment scene.
● According to PWC “2015-19 China entertainment and media outlook”, China’s music market is projected to grow from US$790m in 2014 to US$1.05b in 2019, with digital sales and live music as the main drivers. Tailwinds for the industry include greater government support and a push for more licensed paid music services.
No change to forecasts; Hold rating maintained ● As there is little earnings contribution expected from this proposed JV, we retain our
FY3/17-19 forecasts and Hold recommendation. Our target price remains unchanged at S$0.73 (pegged to a CY17F P/E of 22x, the peer average). Re-rating catalyst would be earnings-accretive M&As and greater traction in North Asia; key downside risk is unexpected delay in production.
Figure 1: Record of acquisitions and partnerships
SOURCES: CIMB, COMPANY REPORTS
When? What? Who? Impact? How
much?
Apr-15Acquired 51% of
Vividthree Productions
Award-winning 3D
animation company
Expansion into high-margin 3D
animation services S$3.06m
Aug-15
Proposed acquisition of
Cathay Cineplexes and
Mega Cinemas in
Malaysia
5 cinemas in Malaysia
Offer recurring income to mm2,
and able to capture larger portion
of box office receipts
RM62m
Dec-15Acquisition of 70%
stake in Millinillion
Tech start-up developing
B2C mobile applications
and digital interactive
solutions
Expand content creation
capabilities and launch its own
OTT media streaming channels
S$0.35m
Feb-16Acquisition of 51% in
the Unusual Group
Leading event and concert
production company
Poised to become largest
entertainment group in Singapore,
with greater Asian presence
S$26m
Jul-16
51% joint venture with
Dick Lee on music
development
Business on music,
artistes, creative direction,
consultancy or related
industries
Minimal financial impact for FY16-
17, but potential synergies for
content creation in the form of
music for movies/ plays/
musicals.
S$0.20m
▎Singapore
July 29, 2016 - 6:12 PM
HOLD (no change) Consensus ratings*: Buy 1 Hold 1 Sell 0
Current price: S$0.68
Target price: S$0.73
Previous target: S$0.73
Up/downside: 8.0%
CIMB / Consensus: 9.6%
Reuters: MM2A.SI
Bloomberg: MM2 SP
Market cap: US$251.2m
S$339.4m
Average daily turnover: US$0.91m
S$1.23m
Current shares o/s 502.8m
Free float: 40.0% * Source: Bloomberg
Key financial forecasts
Source: Bloomberg
Price performance 1M 3M 12M
Absolute (%) 0.7 23.9 98.5
Relative (%) -5.2 21.9 109.6
Major shareholders % held Wee Chye Ang 52.2
Yeo Khee Seng 7.8
Phillip Apac Opp Fun 4.0
Analyst(s)
NGOH Yi Sin
T (65) 6210 8604 E [email protected]
William TNG, CFA T (65) 6210 8676 E [email protected]
Mar-16A Mar-17F Mar-18F
Net Profit (S$m) 8.18 14.88 18.18
Core EPS (S$) 0.018 0.028 0.035
Core EPS Growth 50.3% 53.7% 22.2%
FD Core P/E (x) 38.03 23.76 19.44
Recurring ROE 29.5% 25.1% 19.9%
P/BV (x) 8.25 4.29 3.52
DPS (S$) - - -
Dividend Yield 0% 0% 0%
87
119
151
183
215
247
0.240
0.340
0.440
0.540
0.640
0.740
Price Close Relative to FSSTI (RHS)
10
20
30
40
Jul-15 Oct-15 Feb-16 May-16
Vol m
21
Airlines│Singapore│Equity research│July 29, 2016
Company Note
IMPORTANT DISCLOSURES, INCLUDING ANY REQUIRED RESEARCH CERTIFICATIONS, ARE PROVIDED AT THE END OF THIS REPORT. IF THIS REPORT IS DISTRIBUTED IN THE UNITED STATES IT IS DISTRIBUTED BY CIMB SECURITIES (USA), INC. AND IS CONSIDERED THIRD-PARTY AFFILIATED RESEARCH.
Powered by the EFA Platform
Singapore Airlines Core earnings continue to be under pressure
■ SIA reported 1Q17 core net loss of S$46m due to weaker demand and yield pressures, implying that our full-year core profit forecast may be 7% too high.
■ In addition to larger cargo losses, SIA Engineering also reported a small loss on the back of lower fleet management revenue and higher bonus provisions.
■ The near-term outlook continues to be murky and we downgrade our core EPS forecasts by 7% on lower demand and load factor assumptions for SIA mainline.
■ We maintain Hold but raise our target price to S$12.67 (still based on CY16 P/BV of 1.1x, average since 2001), after factoring in exceptional disposal gains.
Highlights of 1Q17 The SIA group reported a core net loss in 1Q17 that was higher than the loss reported during last year’s 1Q on the back of much larger SIA Cargo losses and a dip into the red for SIAE. Although the group’s reported net profit almost tripled yoy to S$257m, it included S$151m in one-time recognition of ticket breakage revenue and a net S$141m gain from SIAE’s disposal of HAESL and special dividend from HAESL’s sale of SAESL.
No end to yield and demand pressures for SIA mainline SIA mainline reported an operating profit for 1Q17 vs. a 1Q16 loss due to lower fuel costs but the numbers would have been much better without a decline in loads and the fifth consecutive quarterly yield decline. Official guidance for SIA mainline remained pessimistic, pointing to intense competition, aggressive capacity injection by rival airlines, geopolitical concerns in markets like France and Turkey and yield pressures.
SIA Cargo severely challenged The cargo business reported its second consecutive quarter of relatively large losses, with a double-digit decline in yields more than offsetting any benefits enjoyed by low oil prices. With tepid global economic growth and overcapacity in the global airfreight markets, the challenges could last several more quarters.
SilkAir and Scoot continue to do well SilkAir reported decent 1Q17 profits, with higher loads, higher capacity and lower unit costs more than offsetting the high single-digit yield declines. SilkAir is operating with more 737-8s and fewer A319/320s than last year, helping it to boost fleet efficiency. Scoot, meanwhile, reported its third-consecutive quarterly profit, albeit a very thin one. We still think this is an excellent performance as yields only declined in the low single-digits despite raising capacity 53% yoy during 1Q17.
A350s helping SIA build new connectivity SIA has taken delivery of four A350-900 XWBs, which it uses to fly more economically to long and thin routes like Amsterdam and Johannesburg and to open up new secondary destinations like Dusseldorf. It will also use the plane to fly non-stop to San Francisco from October onwards, which will expand its offerings to the US and compete more effectively against one-stop services offered by rival North Asian carriers. However, these are longer-term, strategic initiatives, which may not yield immediate returns.
▎Singapore
HOLD (no change) Consensus ratings*: Buy 9 Hold 8 Sell 3
Current price: S$11.20
Target price: S$12.67
Previous target: S$12.42
Up/downside: 13.1%
CIMB / Consensus: -1.5%
Reuters: SIAL.SI
Bloomberg: SIA SP
Market cap: US$9,833m
S$13,285m
Average daily turnover: US$15.11m
S$20.57m
Current shares o/s: 1,169m
Free float: 44.0% * Source: Bloomberg
Key changes in this note
FY17F Core EPS decreased by 7.1%.
FY18F Core EPS decreased by 7.0%.
FY19F Core EPS decreased by 6.5%.
Source: Bloomberg
Price performance 1M 3M 12M Absolute (%) 7.5 -2.4 -1.4
Relative (%) 1.6 -4.4 9.7
Major shareholders % held Temasek Holdings 55.4
Analyst(s)
Raymond YAP, CFA
T (60) 3 2261 9072 E [email protected]
[ X ]
SOURCE: COMPANY DATA, CIMB FORECASTS
Financial Summary Mar-15A Mar-16A Mar-17F Mar-18F Mar-19F
Revenue (S$m) 15,500 15,092 15,081 15,490 16,218
Operating EBITDA (S$m) 1,883 2,088 2,241 2,491 3,034
Net Profit (S$m) 367.9 804.4 827.9 526.9 661.8
Core EPS (S$) 0.28 0.45 0.41 0.45 0.57
Core EPS Growth 25.5% 61.7% (9.5%) 11.1% 25.6%
FD Core P/E (x) 40.43 25.00 27.62 24.86 19.79
DPS (S$) 0.22 0.45 0.25 0.25 0.25
Dividend Yield 1.96% 4.02% 2.23% 2.23% 2.23%
EV/EBITDA (x) 5.24 5.27 5.13 5.52 5.40
P/FCFE (x) 12.95 46.12 NA NA NA
Net Gearing (28.9%) (18.9%) (14.7%) 1.2% 18.3%
P/BV (x) 1.05 1.03 0.97 0.94 0.91
ROE 2.53% 4.15% 3.62% 3.85% 4.68%
% Change In Core EPS Estimates (7.11%) (6.96%) (6.53%)
CIMB/consensus EPS (x) 0.89 0.60
92.0
99.0
106.0
113.0
120.0
127.0
9.40
9.90
10.40
10.90
11.40
11.90
Price Close Relative to FSSTI (RHS)
5
10
Jul-15 Oct-15 Feb-16 May-16
Vol m
22
Test & Assembly│Taiwan│Equity research│July 29, 2016
Company Note
IMPORTANT DISCLOSURES, INCLUDING ANY REQUIRED RESEARCH CERTIFICATIONS, ARE PROVIDED AT THE END OF THIS REPORT. IF THIS REPORT IS DISTRIBUTED IN THE UNITED STATES IT IS DISTRIBUTED BY CIMB SECURITIES (USA), INC. AND IS CONSIDERED THIRD-PARTY AFFILIATED RESEARCH.
Powered by the EFA Platform
Advanced Semiconductor Getting back on course
2Q16 results beat on better margins; 3Q16 guidance follows seasonal pattern. ■
We expect strength in EMS business to drive ASE’s 2H16 revenue to grow 16% yoy. ■
We look for smoother execution for HoldCo’s acquisition of SPIL, whereas the ■operational efficiency may come no earlier than 2018.
Our SOP-based target price rises to NT$43. Retain Add on attractive dividend yield. ■
2Q16 results beat on better margins ASE posted 2Q16 EPS of NT$0.61 (+12% qoq, -7% yoy), which trumped consensus and our estimates by 17%/5% on better-than-expected margins, especially in EMS business.
Getting more nitro squeeze in 2H16 ASE may also benefit from the surging demand that foundries are expecting in 2H16. We expect very strong revenue growth of 28% qoq in 3Q16. We believe ASE’s 2H16 topline may grow 16% yoy, mostly driven by its EMS business. As its EMS business increases its contribution in the revenue mix, its margin could be negatively impacted. Nevertheless, ASE’s FY16-18 ROE may still stay at c.15% if its asset turnover ratio improves from rising SiP volume and mitigate the margin decline.
EMS may remain to be a drag We believe its EMS business may still decelerate by 6% yoy. Management seems very reluctant to comment on anything that may be associated to its SiP project for Apple Watch. Revenues from other new SiP projects may remain insignificant in the next four quarters. We believe the current production scale of SiP has probably not attained profitability yet. Meanwhile, better-than-expected traditional EMS revenues may only add a few percentage points back to its yoy revenue growth.
Little risk for HoldCo to receive regulatory approval Regarding the execution of HoldCo’s acquisition of SPIL, we see minimal risk to the parties obtaining required regulatory approvals from various governments around the world (including China, Korea, Taiwan and the US). JCET and Amkor have set a precedent, although we note that the combined entity of ASE and SPIL would be the largest OSAT player in the world. We do not think HoldCo’s estimated global market share of 35% would present any serious antitrust concerns for the stakeholders.
More efficient operations may happen in the distant future ASE and SPIL expressed previously that they will maintain separate operations. We expect that redundant engineering resources may eventually be diverted to new R&D projects to create new value, and that redundant administration and sales resources may be trimmed off to improve opex. However, this may not happen before 2018 since the companies are expected to officially complete the M&A in not until 4Q17.
Maintain Add with appealing dividend yield Now that the struggles associated with the M&A are subdued, we expect less volatility in its earnings quality. Thus, we raise IC-ATM’s P/B from 1.5x to 1.6x. Our SOP-based target price rises to NT$43, which incorporates 1.6x IC-ATM’s BVPS and 15x EMS’s EPS in FY17. Given the current macroeconomic climate, ASE’s dividend yield (ranging 4.1-5.0% in FY14-16) may be attractive for cash parking purposes. Given 13% upside from the current share price level, we maintain Add on ASE.
▎Taiwan
ADD (no change) Consensus ratings*: Buy 17 Hold 10 Sell 0
Current price: NT$38.00
Target price: NT$43.00
Previous target: NT$39.00
Up/downside: 13.2%
CIMB / Consensus: 13.8%
Reuters: 2311.TW
Bloomberg: 2311 TT
Market cap: US$9,425m
NT$301,098m
Average daily turnover: US$23.81m
NT$768.2m
Current shares o/s: 7,888m
Free float: 66.1% * Source: Bloomberg
Key changes in this note
FY16/17F revenue increased by 9%/3%.
FY16/17F EPS increased by 31%/26%.
FY16-17F ROE increased by 2.7% pts.
Source: Bloomberg
Price performance 1M 3M 12M Absolute (%) 6.4 25.2 7
Relative (%) 1.8 18 2.1
Major shareholders % held ASE Enterprises Ltd. 16.8
Citibank & ASE Group Depositary Receipt 4.1
Cathay Life Insurance Co., Ltd. 2.8
Analyst(s)
Peter CHAN
T (886) 2 8729 8377 E [email protected]
Mike YANG T (886) 2 8729 8383 E [email protected]
[ X ]
SOURCE: COMPANY DATA, CIMB FORECASTS
Financial Summary Dec-14A Dec-15A Dec-16F Dec-17F Dec-18F
Revenue (NT$m) 256,591 283,303 296,492 329,184 346,970
Net Profit (NT$m) 23,629 19,479 23,340 24,443 26,180
Normalised EPS (NT$) 3.01 2.55 3.05 3.19 3.42
Normalised EPS Growth 49.2% (15.1%) 19.5% 4.7% 7.1%
FD Normalised P/E (x) 12.64 15.37 12.87 12.30 11.48
Price To Sales (x) 1.16 1.02 0.98 0.88 0.84
DPS (NT$) 2.00 1.60 1.66 1.67 2.09
Dividend Yield 5.27% 4.20% 4.37% 4.39% 5.49%
EV/EBITDA (x) 6.18 5.88 5.76 5.38 5.18
P/FCFE (x) 1.95 1.90 9.37 9.04 14.77
Net Gearing 26.0% 33.5% 38.3% 25.4% 20.3%
P/BV (x) 1.99 1.91 1.84 1.75 1.65
ROE 17.3% 12.7% 14.6% 14.6% 14.8%
% Change In Normalised EPS Estimates 25.8% 25.7% 7.4%
Normalised EPS/consensus EPS (x) 1.13 1.03 0.95
84.0
94.7
105.4
27.0
32.0
37.0
Price Close Relative to TAIEX (RHS)
50
100
150
Jul-15 Oct-15 Feb-16 May-16
Vol m
23

Technology Components│Taiwan│Equity research│July 29, 2016
Company Note
IMPORTANT DISCLOSURES, INCLUDING ANY REQUIRED RESEARCH CERTIFICATIONS, ARE PROVIDED AT THE END OF THIS REPORT. IF THIS REPORT IS DISTRIBUTED IN THE UNITED STATES IT IS DISTRIBUTED BY CIMB SECURITIES (USA), INC. AND IS CONSIDERED THIRD-PARTY AFFILIATED RESEARCH.
Powered by the EFA Platform
Delta Electronics Inc Steadily improving
Delta’s 2Q16 results were generally in line but the underlying trend suggests that ■automation is picking up and Eltek is seeing a steady margin recovery.
Power, energy saving and industrial automation will be the key areas for M&A. ■
Besides telecom power and automation, Delta sees growing demand from industrial ■fans, smartphone heatsink and passive components for automotive.
We are positive on Delta’s execution to deliver synergy from its M&As but maintain ■Hold as its valuation has already reached its upcycle average P/E of 20x.
Positive messages underlying the 2Q16 results Delta reported a 2Q16 net income of NT$4.3bn (+10.5% qoq, +13.1% yoy), which was generally in line with our expectations. Gross margin expanded to 28.1% from 26.9% in 1Q16 on (1) recovery of automation demand, and (2) margin improvement from Eltek. Opex was maintained at a high level but the 9.9% operating margin was better than we expected, though this was offset somewhat by the higher tax rate.
Industrial automation demand recovering Energy management sales were up 16% qoq in 2Q16, mainly due to faster-than- expected automation demand recovery in China amid ongoing labour shortage. Higher labour turnover and increase in labour costs have accelerated factory automation in China. Delta has changed its strategy to focus on only 15 industries and provide more customised solutions, instead of selling standardised products. Its internal factory automation and building automation are other key drivers for its automation business.
M&As continue to drive the growth Delta believes M&As will be its key focus for future growth as its organic growth from core businesses slow down. Power, energy saving and industrial automation are the key areas for expansion. Based on our observation in the past year, we are increasingly positive on Delta’s execution abilities to deliver synergy. The company has also built up its own M&A team and set up a standard of procedure (SOP) for due diligence.
Growing demand in various areas Looking into 2H16, Delta sees growing demand from (1) heatsink for smartphones, (2) industrial fans, and (3) passive components for automotive, while the demand for smartphones remains soft in 2016. The management has guided for better 3Q16 sales with margin expansion. Industrial automation and telecom power are the key drivers for margin. Decline in the power business was also less drastic than the company’s previous expectation.
Maintain Hold due to limited upside on valuation We fine tune our FY16-18 EPS forecasts but raise our target P/E from the cycle average of 15x to upcycle average of 20x (1 s.d. above the mean) to reflect the improving fundamentals. Our target price is therefore lifted to NT$177, based on 20x P/E in FY17. We maintain Hold for Delta as the current valuation seems fair to us, but any share price pullback might be a good entry point for long-term investors.
▎Taiwan
HOLD (no change) Consensus ratings*: Buy 20 Hold 7 Sell 1
Current price: NT$168.0
Target price: NT$177.0
Previous target: NT$140.0
Up/downside: 5.4%
CIMB / Consensus: 6.1%
Reuters: 2308.TW
Bloomberg: 2308 TT
Market cap: US$13,659m
NT$436,387m
Average daily turnover: US$21.54m
NT$695.2m
Current shares o/s: 2,598m
Free float: 78.0% * Source: Bloomberg
Key changes in this note
FY17-18F Revenue decreased by 4-5%.
FY16F EPS increased by 4%.
FY17-18F EPS decreased by 3-4%.
Source: Bloomberg
Price performance 1M 3M 12M Absolute (%) 7.3 12 7
Relative (%) 2.7 4.8 2.1
Major shareholders % held Hsiang Ta international 10.4
Ying Ta 8.5
Cheng Chung Hua 5.7
Analyst(s)
Felix PAN
T (886) 2 8729 8386 E [email protected]
James TAN T (886) 2 8729 8378 E [email protected]
[ X ]
SOURCE: COMPANY DATA, CIMB FORECASTS
Financial Summary Dec-14A Dec-15A Dec-16F Dec-17F Dec-18F
Revenue (NT$m) 190,635 203,452 217,400 226,963 239,290
Net Profit (NT$m) 20,699 18,715 20,599 23,077 25,580
Normalised EPS (NT$) 8.90 8.02 7.93 8.88 9.85
Normalised EPS Growth 14.3% (9.9%) (1.1%) 12.0% 10.8%
FD Normalised P/E (x) 18.82 20.95 21.18 18.91 17.06
Price To Sales (x) 2.15 2.08 2.01 1.92 1.82
DPS (NT$) 5.80 6.70 6.70 5.00 7.00
Dividend Yield 3.45% 3.99% 3.99% 2.98% 4.17%
EV/EBITDA (x) 12.40 12.39 12.76 11.55 10.45
P/FCFE (x) 14.99 NA NA 52.28 24.79
Net Gearing (24.3%) (15.7%) (0.4%) 2.8% 3.1%
P/BV (x) 3.99 3.51 3.42 3.17 3.01
ROE 22.1% 17.8% 16.4% 17.4% 18.1%
% Change In Normalised EPS Estimates 3.62% (2.91%) (3.67%)
Normalised EPS/consensus EPS (x) 1.03 1.02 0.98
83.0
94.7
106.3
118.0
120.0
140.0
160.0
180.0
Price Close Relative to TAIEX (RHS)
5
10
15
Jul-15 Oct-15 Feb-16 May-16
Vol m
24
Technology Components│Taiwan│Equity research│July 29, 2016
Company Note
IMPORTANT DISCLOSURES, INCLUDING ANY REQUIRED RESEARCH CERTIFICATIONS, ARE PROVIDED AT THE END OF THIS REPORT. IF THIS REPORT IS DISTRIBUTED IN THE UNITED STATES IT IS DISTRIBUTED BY CIMB SECURITIES (USA), INC. AND IS CONSIDERED THIRD-PARTY AFFILIATED RESEARCH.
Powered by the EFA Platform
Innolux Corporation Panel price hike already priced in
2Q loss per share (LPS) came in at NT$0.35, largely in line with our forecast of an ■LPS of NT$0.37.
We forecast 3Q/4Q EPS of NT$0.20/$0.47 thanks to the panel price turnaround. ■
We think INX is unlikely to be an AMOLED player in 2 years. The new LTPS fab’s ■business opportunities are also uncertain at this juncture.
We raise FY17-18F EPS by 10-15%. Raise target price to NT$12.9. Maintain Hold. ■
2Q16 loss narrows thanks to price hikes and mix improvement 2Q16’s sales amounted to NT$66.8bn (US$2.1bn; +18.4% qoq, -28.8% yoy), about 4.2% below our forecast. Panel price increases helped the GM/OPM, both of which improved by about 5% pts to 2.3%/-4.5%, and narrowed the LPS to NT$0.35 in 2Q, from NT$0.86 in 1Q. While unit shipments grew 13%, area shipment soared 25%, mainly thanks to increasing mid-large size TV panel sales, which are recovering following the Feb earthquake.
Swing to profit in 2H as panel prices likely to continue uptrend Without new capacity additions in 2016, INX’s 2H earnings drivers will come from product mix and price increases. While the company has guided for 3Q APS to be flattish on unit base, we estimate that area base ASP could still improve 5% qoq as panel price hikes are likely to continue until October. We forecast 3Q/4Q EPS of NT$0.20/$0.47 as OP margins improve to 3.2%/6.8%. We forecast 2016 LPS narrowing to NT$0.54, from a previous NT$0.97.
Unlikely to be an relevant AMOLED player in 2 years While Chinese firms are aggressively joining the OLED fray, the Taiwanese are behind in the game. Our recent field surveys with OLED supply chains suggest key equipment, critical material and production tools are fully booked by Korean and Chinese firms in the next 18-24 months. Investors who expect INX to leverage Sharp’s IGZO technology for producing OLED mobile display will be disappointed as the technology is suitable for producing OLED TV panels and unlikely to be commercialised in two years, in our view.
Uncertain business opportunities for new LTPS fab INX plans to ramp up the Gn6.0 LTPS capacity in 4Q16. This fab may help INX secure a display supply to Apple, which has been relying on INX’s parent company, Hoi Hai, for box building. However, we are concerned that the window of opportunity is closing as Apple will be gradually adopting OLED display for its iPhone from 2017. INX may have to find other customers or products to occupy its LTPS fab when it is up and running.
Target price rises from NT$10.0 to NT$12.9; maintain Hold We raise our target price to NT$12.9 based on 0.74x 2016 EV/CE (previously 0.60x FY16) as we lift ROCE assumptions from 5.5% to 5.7%. Our TP translates to 0.57x 2016 P/BV. We maintain Hold as we believe the panel price hike this time remains seasonal. As the market appears to have priced-in such expectations, share price upside is likely to be limited. Upside risks to our call include longer-than-expected price hike and industry consolidation, while downside risks are shorter-than-expected upcycles.
▎Taiwan
HOLD (no change) Consensus ratings*: Buy 10 Hold 12 Sell 0
Current price: NT$11.80
Target price: NT$12.90
Previous target: NT$10.00
Up/downside: 9.3%
CIMB / Consensus: 11.9%
Reuters: 3481.TW
Bloomberg: 3481 TT
Market cap: US$3,676m
NT$117,438m
Average daily turnover: US$18.61m
NT$608.8m
Current shares o/s: 9,954m
Free float: 86.5% * Source: Bloomberg
Key changes in this note
FY16F Revenue decreased by 3.8%.
FY16F ROE increased by 1.6%.
Source: Bloomberg
Price performance 1M 3M 12M Absolute (%) 12.4 18 5.4
Relative (%) 7.8 10.8 0.5
Major shareholders % held Chi Mei CO. 5.7
Vanguard group Inc. 2.9
Dimentional Fund 2.5
Analyst(s)
Eric LIN
T (886) 2 8729 8380 E [email protected]
James CHEN T (886) 2 8729 8382 E [email protected]
[ X ]
SOURCE: COMPANY DATA, CIMB FORECASTS
Financial Summary Dec-14A Dec-15A Dec-16F Dec-17F Dec-18F
Revenue (NT$m) 428,662 364,133 272,072 271,358 272,119
Net Profit (NT$m) 21,572 10,377 (5,380) 9,472 10,057
Normalised EPS (NT$) 2.21 1.06 (0.54) 0.95 1.01
Normalised EPS Growth 286% (52%) (151%) 6%
FD Normalised P/E (x) 5.33 11.09 NA 12.40 11.68
Price To Sales (x) 0.27 0.32 0.43 0.43 0.43
DPS (NT$) 0.15 0.70 0.20 0.00 0.18
Dividend Yield 1.27% 5.93% 1.69% 0.00% 1.48%
EV/EBITDA (x) 1.96 1.61 3.64 2.57 2.14
P/FCFE (x) 8.17 NA 42.24 5.49 6.74
Net Gearing 26.2% 3.2% 6.7% (2.1%) (10.5%)
P/BV (x) 0.51 0.49 0.52 0.50 0.48
ROE 10.2% 4.5% (2.4%) 4.1% 4.2%
% Change In Normalised EPS Estimates 44.3% 9.7% 14.7%
Normalised EPS/consensus EPS (x) 0.52 (14.87) 1.87
80.0
88.6
97.1
105.7
8.70
9.70
10.70
11.70
Price Close Relative to TAIEX (RHS)
100
200
300
Jul-15 Oct-15 Feb-16 May-16
Vo
l m
25
Telco - Others│Thailand│Equity research
Company Flash Note
IMPORTANT DISCLOSURES, INCLUDING ANY REQUIRED RESEARCH CERTIFICATIONS, ARE PROVIDED AT THE END OF THIS REPORT. IF THIS REPORT IS DISTRIBUTED IN THE UNITED STATES IT IS DISTRIBUTED BY CIMB SECURITIES (USA), INC. AND IS CONSIDERED THIRD-PARTY AFFILIATED RESEARCH.
Powered by the EFA Platform
Jasmine Broadband Internet Infrastructure Fund
Stable high yield with growth potential
■ 1H16 core net profit in line with expectation at 50% of our full-year forecast.
■ Recent borrowing of THB6bn at Jasmine increases asset injection possibility.
■ Maintain Add; catalysts are yield gap rebalancing with DIF and new asset injection.
In-line results ● JASIF reported 2Q16 core net profit of THB1.27bn, up 12.6% yoy and 2.7% qoq due
to higher optical fibre rental (OFC) income from Jasmine and lower interest expense after the settlement of advanced VAT payment and borrowing. JASIF’s 1H16 core net profit made up for 50% of our full-year forecast; we deem this as in line with our expectation. Management said the company will announce its quarterly dividend by next week and we expect THB0.23 DPS or 97.6% dividend payout ratio.
Positive implication from new borrowing at Jasmine level ● According to local newspapers, Siam Commercial Bank (SCB) has approved THB6bn
credit line to finance Jasmine’s fixed broadband network expansion project. The new borrowing indicates 1) more aggressive fixed broadband network expansion, 2) more aggressive capital management, and 3) more efficient capital structure leveraging the low interest rate environment.
● We see low default risk at Jasmine as its net debt to EBITDA will go up from “net cash” to 0.14x, which is still at a comfortable level. Meanwhile, we are positive with its fixed broadband network expansion as this will lead to a second round of asset injection, adding to JASIF’s value.
● Our calculation suggests THB1.8 incremental DCF per share at JASIF, if the second round of asset injection takes place. The difference of rental yield and borrowing rate should add THB0.2 incremental DPS to JASIF. Note that we have not factored this in our earnings and valuation estimates.
The relocation of electricity lines ● Our preliminary analysis shows that JASIF should see limited impact from the
government's THB49bn project to relocate 127.3km of aerial electricity line to below ground in five years. First, JASIF owns 82K km of OFC, of which only 25% is in Bangkok, the project's focus area. Second, we think there will be a financial limitation in this project as the project IRR is only 3-5% based on the study of Metropolitan Electricity Authority. Also, JASIF has already set aside THB70-80m a year for the cable relocation budget.
Maintain Add with THB13.5 target price ● As the 2Q16 results were in line, we maintain our estimates, DCF-based target price
and Add call on JASIF. Potential re-rating catalysts are still 1) the rebalancing of yield gap between DIF and JASIF (+4.2% upside), and 2) potential upside from new asset injections (+15.1% upside).
● Key risks are 1) 100% revenue concentration at Jasmine, and 2) the rental contract renewal in 2026 on unfavourable terms.
Figure 1: Results comparison
SOURCES: CIMB, COMPANY REPORTS
FYE Dec (THB m) 2QFY16 2QFY15 yoy % 1QFY16 qoq % 2QFY16 2QFY15 yoy % Prev.
chg chg Cum Cum chg FY16F
Revenue 1,342 1,210 10.9 1,309 2.5 2,651 1,858 42.7 5,448
EBITDA 1,273 1,142 11.5 1,241 2.6 2,515 1,754 43.3 5,032
EBITDA margin (%) 94.9 94.4 94.8 94.8 94.4 92.4
Net profit 1,273 1,130 12.6 1,240 2.6 2,512 1,736 44.7 5,007
Core net profit 1,273 1,131 12.6 1,240 2.7 2,512 1,736 44.7 5,007
Core EPS (THB) 0.23 0.21 12.6 0.23 2.7 0.46 0.32 44.7 0.91
DPS 0.23 0.21 7.6 0.22 2.7 0.45 0.32 39.3 0.89
Operating statistics
OFC (core km) 928,000 838,000 10.7 905,500 2.5 928,000 838,000 10.7 968,750
Rental rate (THB/month) 488 488 0.0 488 0.0 488 488 0.0 488
O&M cost rate (THB/month) 206 200 3.0 206 0.0 206 200 3.0 206
Dividend payout ratio 97.6% 102.2% 97.6% 97.6% 101.4% 97.6%
▎Thailand
July 30, 2016 - 11:04 PM
ADD (no change) Consensus ratings*: Buy 7 Hold 0 Sell 0
Current price: THB11.90
Target price: THB13.50
Previous target: THB13.50
Up/downside: 13.4%
CIMB / Consensus: 30.2%
Reuters: JASIF.BK
Bloomberg: JASIF TB
Market cap: US$1,880m
THB65,450m
Average daily turnover: US$4.55m
THB160.4m
Current shares o/s 5,500m
Free float: 52.6% * Source: Bloomberg
Key financial forecasts
Source: Bloomberg
Price performance 1M 3M 12M
Absolute (%) 13.3 26.6 19.6
Relative (%) 7.7 18.1 12.1
Major shareholders % held Jasmine International Plc. 33.3
Bangkok Bank Plc. 9.1
Mr Pete Bhodaramik 5.0
Analyst(s)
Pisut NGAMVIJITVONG
T (66) 2 657 9226 E [email protected]
Dec-16F Dec-17F Dec-18F
Net Profit (THBm) 5,007 5,390 5,549
Core EPS (THB) 0.91 0.98 1.01
Core EPS Growth 22.5% 7.7% 2.9%
FD Core P/E (x) 13.07 12.14 11.80
Recurring ROE 8.89% 9.57% 9.84%
P/BV (x) 1.16 1.16 1.16
DPS (THB) 0.89 0.96 0.99
Dividend Yield 7.50% 8.07% 8.31%
82.0
89.0
96.0
103.0
110.0
117.0
7.60
8.60
9.60
10.60
11.60
12.60
Price Close Relative to SET (RHS)
50
100
Jul-15 Nov-15 Feb-16 May-16
Vol m
26

Oil & Gas - Integrated│Thailand│Equity research│July 29, 2016
Company Note
IMPORTANT DISCLOSURES, INCLUDING ANY REQUIRED RESEARCH CERTIFICATIONS, ARE PROVIDED AT THE END OF THIS REPORT. IF THIS REPORT IS DISTRIBUTED IN THE UNITED STATES IT IS DISTRIBUTED BY CIMB SECURITIES (USA), INC. AND IS CONSIDERED THIRD-PARTY AFFILIATED RESEARCH.
Powered by the EFA Platform
PTT An attractive utilities gas play
We see utilities-like LNG terminals and pipeline transmission emerging as PTT’s ■new key core earnings drivers.
Gas price and volume, not the price of oil, will be PTT’s key growth engine. ■
LNG terminals and oil marketing and retail units are PTT’s two hidden gems. ■
The value of the oil retail and marketing unit will be unlocked, in our view, if listed in 2017. ■ We maintain our Add recommendation and SOP-based target price of THB389, still ■applying a 20% discount to reflect PTT’s holding company status.
Infrastructure and distribution underscore growth We believe PTT is now entering a new growth phase, driven by the low-risk, fee-based, volume-driven infrastructure business of LNG terminals and transmission pipelines, as well as the oil marketing and retail unit. We project these low-risk businesses to account for over 60% of PTT’s EBITDA and earnings for 2016-18, overshadowing its high-risk, margin-driven volatile Gas Separation Plant (GSP), gas sales and marketing (S&M), Exploration and Production (E&P), and downstream petrochemical and refinery units.
Volume over price We see PTT’s business model and earnings shifting from one dominated by oil to one dominated by gas, driven by rising earnings from its core gas businesses, which comprise five main units: GSPs, Gas S&M, Oil marketing, LNG terminals, and Gas pipeline transmission. The predominantly volume-driven, fee-based core gas earnings, we forecast, will outweigh PTT’s conventional oil-driven GRM and E&P, which are under pressure due to oversupply and weaker demand.
Two hidden gems We believe the market continues to underestimate PTT’s two new emerging crown jewels – LNG terminals and oil marketing assets. We project these two assets to be PTT’s future growth engines, generating EBITDA of over THB45-60bn over the next three years, underscoring PTT’s future earnings growth that will be linked much less to movements in the price of oil.
Retail marketing – on the growth path While oil-driven earnings for the gas station business have been a key organic growth driver for PTT, we think the rising earnings from retail businesses will be the next growth engine. These include PTT’s own Café Amazon coffee houses, 7-11 and Jiffy retail shops, and potential budget hotel and rental earnings, together generating over THB24bn in EBITDA in 2016F. PTT’s plan to potentially list this retail marketing asset by 2017 could further unlock value, potentially worth THB100-150bn based on 8-10x EV/EBITDA.
A new growth chapter Unlike in the past, we think investors should now see PTT as a gas-dominated, volume-driven energy play, driven by its core gas businesses of gas pipeline, LNG terminals, and oil marketing, rather than an oil-dominated, margin-driven E&P, refinery and petrochemical businesses. This should lead, in our view, to a share price rerating driven not only by earnings growth momentum but also increased earnings sustainability due to rising earnings from utilities-like LNG terminals and gas pipeline transmission.
▎Thailand
ADD (no change) Consensus ratings*: Buy 15 Hold 8 Sell 2
Current price: THB334.0
Target price: THB389.0
Previous target: THB389.0
Up/downside: 16.5%
CIMB / Consensus: 29.2%
Reuters: PTT.BK
Bloomberg: PTT TB
Market cap: US$27,351m
THB954,004m
Average daily turnover: US$45.08m
THB1,591m
Current shares o/s: 2,856m
Free float: 49.0% * Source: Bloomberg
Key changes in this note
No change
Source: Bloomberg
Price performance 1M 3M 12M Absolute (%) 7.1 10.2 6.4
Relative (%) 1 1.3 -1.9
Major shareholders % held Ministry of Finance 52.5
Vayupak Funds 15.6
Analyst(s)
Suwat SINSADOK, CFA, FRM
T (66) 2 657 9228 E [email protected]
[ X ]
SOURCE: COMPANY DATA, CIMB FORECASTS
Financial Summary Dec-14A Dec-15A Dec-16F Dec-17F Dec-18F
Revenue (THBm) 2,834,732 2,026,912 3,340,145 3,595,965 3,841,549
Operating EBITDA (THBm) 201,934 237,548 293,376 279,311 274,977
Net Profit (THBm) 55,795 19,936 85,956 93,156 95,260
Core EPS (THB) 19.53 21.33 30.09 32.61 33.35
Core EPS Growth (41.0%) 9.2% 41.1% 8.4% 2.3%
FD Core P/E (x) 17.10 15.66 11.10 10.24 10.01
DPS (THB) 14.00 11.00 21.07 22.83 23.35
Dividend Yield 4.19% 3.29% 6.31% 6.84% 6.99%
EV/EBITDA (x) 5.56 7.03 4.76 4.94 5.03
P/FCFE (x) 22.79 3.80 12.32 11.18 13.51
Net Gearing 27.3% 36.4% 37.8% 33.3% 31.3%
P/BV (x) 1.37 1.37 1.27 1.22 1.17
ROE 8.1% 8.7% 11.9% 12.1% 11.9%
% Change In Core EPS Estimates 0% 0% 0%
CIMB/consensus EPS (x) 1.07 1.06 1.00
71.0
80.7
90.4
100.2
180
230
280
330
Price Close Relative to SET (RHS)
10
20
30
40
Jul-15 Oct-15 Feb-16 May-16
Vol m
27
Oil & Gas Exp & Prodn│Thailand│Equity research│July 29, 2016
Company Note
IMPORTANT DISCLOSURES, INCLUDING ANY REQUIRED RESEARCH CERTIFICATIONS, ARE PROVIDED AT THE END OF THIS REPORT. IF THIS REPORT IS DISTRIBUTED IN THE UNITED STATES IT IS DISTRIBUTED BY CIMB SECURITIES (USA), INC. AND IS CONSIDERED THIRD-PARTY AFFILIATED RESEARCH.
Powered by the EFA Platform
PTT Exploration & Production Superior cost control is a key winning factor
The strong 2Q16 earnings were boosted by the lower-than-expected costs ■ ASP is likely to bottom in 3Q16 given that the rising oil prices will offset the declining ■gas prices in 2H16
We project weaker 2H16 earnings due to lower gas prices and rising costs ■
A strategic M&A for gas assets in 2016 will be a key share price catalyst ■ Maintain Add and DCF-based (WACC 10.5%) target price of THB94, based on 0.9x ■CY17 P/BV
Operational strength continues 2Q16 core earnings of THB5.5bn were 4% above our forecast and 2% above consensus estimate. 1H16 core earnings accounted for 51% of our 2016 earnings forecast but we maintain our EPS forecast as we now expect a weaker 2H. 2Q16 net profit was down 53% qoq at THB2.6bn due to a hedging loss of THB3.4bn. Key highlights: 1) lower sales volume (-3% qoq, -1% yoy) to 320kboed due to the lower oil sales from Montara; and 2) 4% qoq higher ASP to US$36.6/boe thanks to the higher oil price by US$11/bbl.
Cost control is key While total costs rose 6% qoq to US$30.3/boe, this was still lower than our and market expectations of US$31-32/boe, thanks to lower-than-expected exploration expenses at US$0.5/boe, down 37% qoq, on lower-than-expected write off expenses. Operating cost rose slightly to US$4.9/boe and SG&A jumped 90% qoq, but all in line with the company’s guidance of gradually rising costs from the 1Q16 bottom. Depreciation cost remained falt qoq at US$17.7/boe but is expected to rise slightly to US$19/boe in 2H16.
A weaker 2H16 outlook We expect weaker earnings in 2H16 given the rising overall costs to US$34/boe, bringing average cost to US$33/boe for 2016. This will be driven by the higher exploration, SG&A, and depreciation expenses, to reflect the higher exploration activities and higher sales volume from Montara. We expect a lower ASP due to lower gas prices from US$5.6/mmbtu in 2Q16 to US$5.5/mmbtu in 3Q16 and US$5.3/mmbtu in 4Q16, due to the gas price adjustments to reflect the lower oil prices in 3Q16.
Watch for M&As Given PTTEP’s low 1P reserve life of only 6 years, management has indicated that the company’s top priority is to boost its 1P reserve via M&As. We believe at least one acquisition could materialise in 2016 and we see this as a critically positive strategic move for PTTEP, thanks to its solid balance sheet and long-time operational expertise in gas exploration in Southeast Asia. As at end-2Q16 PTTEP had US$3.2bn in cash on hand and US$2.8bn in net cash, implying only 0.27x D/E.
Accumulate ahead of earnings recovery in 4Q16 After a share price run-up in 2Q16 we think PTTEP could consolidate in 3Q16 given the weaker oil price from US$52/bbl in Jun 16 to below US$45/bbl in Jul 16. We believe PTTEP’s earnings is likely to rebound from the bottom in 2Q16 driven by higher production volume and rising oil prices towards US$50/bbl again in 4Q16. At 0.75x CY17 P/BV, we think PTTEP looks attractive against its improving earnings and higher ROE. Maintain Add.
▎Thailand
ADD (no change) Consensus ratings*: Buy 7 Hold 8 Sell 12
Current price: THB83.00
Target price: THB94.00
Previous target: THB94.00
Up/downside: 13.3%
CIMB / Consensus: 32.8%
Reuters: PTTE.BK
Bloomberg: PTTEP TB
Market cap: US$9,447m
THB329,509m
Average daily turnover: US$35.13m
THB1,240m
Current shares o/s: 3,970m
Free float: 33.7% * Source: Bloomberg
Key changes in this note
No changes
Source: Bloomberg
Price performance 1M 3M 12M Absolute (%) 2.5 11.4 -7
Relative (%) -3.6 2.5 -15.3
Major shareholders % held PTT Plc 65.4
State Street Bank and Trust Co. 1.8
Analyst(s)
Suwat SINSADOK, CFA, FRM
T (66) 2 657 9228 E [email protected]
[ X ]
SOURCE: COMPANY DATA, CIMB FORECASTS
Financial Summary Dec-14A Dec-15A Dec-16F Dec-17F Dec-18F
Revenue (THBm) 247,817 185,771 143,599 178,424 190,014
Operating EBITDA (THBm) 171,833 131,088 83,645 125,552 144,465
Net Profit (THBm) 21,490 (31,590) 12,238 30,181 38,086
Core EPS (THB) 8.80 5.19 3.08 7.60 9.59
Core EPS Growth (39%) (41%) (41%) 147% 26%
FD Core P/E (x) 9.43 15.98 26.92 10.92 8.65
DPS (THB) 4.05 2.70 1.11 2.74 3.45
Dividend Yield 4.88% 3.25% 1.34% 3.30% 4.16%
EV/EBITDA (x) 1.78 2.35 3.67 2.40 1.88
P/FCFE (x) 3.9 NA 132.8 34.4 8.0
Net Gearing (5.4%) (4.9%) (5.1%) (5.9%) (11.9%)
P/BV (x) 0.80 0.81 0.81 0.76 0.72
ROE 8.76% 5.01% 2.99% 7.16% 8.51%
% Change In Core EPS Estimates 0% 0% 0%
CIMB/consensus EPS (x) 0.93 1.46 1.43
54.0
70.7
87.3
104.0
37.0
57.0
77.0
97.0
Price Close Relative to SET (RHS)
20
40
60
80
Jul-15 Oct-15 Feb-16 May-16
Vol m
28

Asia Pacific Daily│Equity research│August 1, 2016
7
REGIONAL HEAD
Michael Greenall Regional Head of Research & HOR Malaysia +60 (3) 2261 9088 [email protected]
COUNTRY HEADS OF RESEARCH
Ivy NG, CFA Bertram LAI Eric LIN Erwan TEGUH Pramod AMTHE Malaysia (Deputy Head) Hong Kong/China Taiwan Indonesia India +60 (3) 2261 9073 +852 2532 1111 +886 (2) 8729 8380 +62 (21) 3006 1720 +91 (22) 6602-5167 [email protected] [email protected] [email protected] [email protected] [email protected] Dohoon LEE Kenneth NG, CFA Kasem PRUNRATANAMALA, CFA South Korea Singapore Thailand +82 (2) 6730 6121 +65 6210 8610 +66 (2) 657 9221 [email protected] [email protected] [email protected] Michael KOKALARI, CFA Jose Paolo Deogracias Fontanilla Yolan SEIMON Vietnam Philippines Sri Lanka +84 907 974408 +63 (2) 888 7118 +94 (11) 2306273 [email protected] [email protected] [email protected] Coverage via partnership arrangement with Coverage via partnership arrangement with
SB Equities John Keells Stock Brokers
REGIONAL SECTOR HEADS
KJ KWANG Ivy NG, CFA Raymond YAP, CFA Offshore & Marine Plantations Transportation +82 (2) 6730 6123 +60 (3) 2261 9073 +60 (3) 2261 9072 [email protected] [email protected] [email protected]
29
Asia Pacific Daily│Equity research│August 1, 2016
8
DISCLAIMER WJV#05
The content of this report (including the views and opinions expressed therein, and the information comprised therein) has been prepared by and belongs to CIMB save that (i) if it is a report written by the analyst(s) of John Keells Stock Brokers (“John Keells”), it belongs to John Keells; (ii) if it is a report written by the analyst(s) of SB Equities Inc (“SBE”), it belongs to SBE; and (iii) if it is a report written by the analyst(s) of Morgans Financial Limited (“Morgans”), it belongs to Morgans. This report is distributed by CIMB and in respect of sections of the report relating to (i), (ii) and/or (iii) aforesaid, it is distributed pursuant to an arrangement between John Keells, SBE and Morgans respectively and none of the aforesaid parties is an affiliate of CIMB.
This report is not directed to, or intended for distribution to or use by, any person or entity who is a citizen or resident of or located in any locality, state, country or other jurisdiction where such distribution, publication, availability or use would be contrary to law or regulation.
By accepting this report, the recipient hereof represents and warrants that he is entitled to receive such report in accordance with the restrictions set forth below and agrees to be bound by the limitations contained herein (including the “Restrictions on Distributions” set out below). Any failure to comply with these limitations may constitute a violation of law. This publication is being supplied to you strictly on the basis that it will remain confidential. No part of this report may be (i) copied, photocopied, duplicated, stored or reproduced in any form by any means or (ii) redistributed or passed on, directly or indirectly, to any other person in whole or in part, for any purpose without the prior written consent of CIMB.
The information contained in this research report is prepared from data believed to be correct and reliable at the time of issue of this report. CIMB, John Keells, SBE and/or Morgans, as the case may be, may or may not issue regular reports on the subject matter of this report at any frequency and may cease to do so or change the periodicity of reports at any time. None of CIMB, John Keells, SBE or Morgans is under any obligation to update this report in the event of a material change to the information contained in this report. None of CIMB, John Keells, SBE or Morgans has any and none of them will accept any, obligation to (i) check or ensure that the contents of this report remain current, reliable or relevant, (ii) ensure that the content of this report constitutes all the information a prospective investor may require, (iii) ensure the adequacy, accuracy, completeness, reliability or fairness of any views, opinions and information, and accordingly, CIMB, John Keells, SBE and Morgans and their respective affiliates and related persons (and their respective directors, associates, connected persons and/or employees) shall not be liable in any manner whatsoever for any consequences (including but not limited to any direct, indirect or consequential losses, loss of profits and damages) of any reliance thereon or usage thereof. In particular, CIMB, John Keells, SBE and Morgans disclaim all responsibility and liability for the views and opinions set out in this report.
Unless otherwise specified, this report is based upon reasonable sources. Such sources will, unless otherwise specified, for market data, be market data and prices available from the main stock exchange or market where the relevant security is listed, or, where appropriate, any other market. Information on the accounts and business of company(ies) will generally be based on published statements of the company(ies), information disseminated by regulatory information services, other publicly available information and information resulting from our research.
Whilst every effort is made to ensure that statements of facts made in this report are accurate, all estimates, projections, forecasts, expressions of opinion and other subjective judgments contained in this report are based on assumptions considered to be reasonable as of the date of the document in which they are contained and must not be construed as a representation that the matters referred to therein will occur. Past performance is not a reliable indicator of future performance. The value of investments may go down as well as up and those investing may, depending on the investments in question, lose more than the initial investment. No report shall constitute an offer or an invitation by or on behalf of CIMB, John Keells, SBE or Morgans or their respective affiliates to any person to buy or sell any investments.
CIMB, John Keells, SBE and/or Morgans and/or their respective affiliates and related companies, their directors, associates, connected parties and/or employees may own or have positions in securities of the company(ies) covered in this research report or any securities related thereto and may from time to time add to or dispose of, or may be materially interested in, any such securities. Further, CIMB, John Keells, SBE and/or Morgans and/or their respective affiliates and related companies do and seek to do business with the company(ies) covered in this research report and may from time to time act as market maker or have assumed an underwriting commitment in securities of such company(ies), may sell them to or buy them from customers on a principal basis and may also perform or seek to perform significant investment banking, advisory, underwriting or placement services for or relating to such company(ies) as well as solicit such investment, advisory or other services from any entity mentioned in this report.
CIMB, John Keells, SBE and/or Morgans and/or their respective affiliates may enter into an agreement with the company(ies) covered in this report relating to the production of research reports. CIMB, John Keells, SBE and/or Morgans may disclose the contents of this report to the company(ies) covered by it and may have amended the contents of this report following such disclosure.
The analyst responsible for the production of this report hereby certifies that the views expressed herein accurately and exclusively reflect his or her personal views and opinions about any and all of the issuers or securities analysed in this report and were prepared independently and autonomously. No part of the compensation of the analyst(s) was, is, or will be directly or indirectly related to the inclusion of specific recommendations(s) or view(s) in this report. The analyst(s) who prepared this research report are prohibited from receiving any compensation, incentive or bonus based on specific investment banking transactions or for providing a specific recommendation for, or view of, a particular company. Information barriers and other arrangements may be established where necessary to prevent conflicts of interests arising. However, the analyst(s) may receive compensation that is based on his/their coverage of company(ies) in the performance of his/their duties or the performance of his/their recommendations and the research personnel involved in the preparation of this report may also participate in the solicitation of the businesses as described above. In reviewing this research report, an investor should be aware that any or all of the foregoing, among other things, may give rise to real or potential conflicts of interest. Additional information is, subject to the duties of confidentiality, available on request.
The term “John Keells Stock Brokers” shall, unless the context otherwise requires, mean each of John Keells Stock Brokers and its affiliates, subsidiaries and related companies. The term “SB Equities Inc.” shall, unless the context otherwise requires, mean each of SB Equities Inc. and its affiliates, subsidiaries and related companies. The term “Morgans Financial Limited” shall, unless the context otherwise requires, mean each of Morgans Financial Limited and its affiliates, subsidiaries and related companies. The term “CIMB” shall denote, where appropriate, the relevant entity distributing or disseminating the report in the particular jurisdiction referenced below, or, in every other case, CIMB Group Holdings
30
Asia Pacific Daily│Equity research│August 1, 2016
9
Berhad ("CIMBGH") and its affiliates, subsidiaries and related companies.
Country CIMB Entity Regulated by Hong Kong CIMB Securities Limited Securities and Futures Commission Hong Kong
India CIMB Securities (India) Private Limited Securities and Exchange Board of India (SEBI) Indonesia PT CIMB Securities Indonesia Financial Services Authority of Indonesia Malaysia CIMB Investment Bank Berhad Securities Commission Malaysia
Singapore CIMB Research Pte. Ltd. Monetary Authority of Singapore South Korea CIMB Securities Limited, Korea Branch Financial Services Commission and Financial Supervisory Service
Taiwan CIMB Securities Limited, Taiwan Branch Financial Supervisory Commission Thailand CIMB Securities (Thailand) Co. Ltd. Securities and Exchange Commission Thailand
Information in this report is a summary derived from individual research reports. As such, readers are directed to the individual research report or note to review the individual Research Analyst’s full analysis of the subject company. Important disclosures relating to the companies that are the subject of research reports published by CIMB, John Keells, SBE or Morgans, as the case may be, and the proprietary position by each of them and shareholdings of its Research Analysts’ who prepared the report in the securities of the company(s) are available in the individual research report.
This report does not purport to contain all the information that a prospective investor may require. CIMB, John Keells, SBE and Morgans and their respective affiliates do not make any guarantee, representation or warranty, express or implied, as to the adequacy, accuracy, completeness, reliability or fairness of any such information and opinion contained in this report. None of CIMB, John Keells, SBE, Morgans and their respective affiliates and related persons shall be liable in any manner whatsoever for any consequences (including but not limited to any direct, indirect or consequential losses, loss of profits and damages) of any reliance thereon or usage thereof.
This report is general in nature and has been prepared for information purposes only. It is intended for circulation amongst CIMB and its affiliates’ clients generally and does not have regard to the specific investment objectives, financial situation and the particular needs of any specific person who may receive this report. The information and opinions in this report are not and should not be construed or considered as an offer, recommendation or solicitation to buy or sell the subject securities, related investments or other financial instruments or any derivative instrument, or any rights pertaining thereto.
Investors are advised to make their own independent evaluation of the information contained in this research report, consider their own individual investment objectives, financial situation and particular needs and consult their own professional and financial advisers as to the legal, business, financial, tax and other aspects before participating in any transaction in respect of the securities of company(ies) covered in this research report.
The securities of such company(ies) may not be eligible for sale in all jurisdictions or to all categories of investors.
Australia : The distribution of this report is not an offer to buy or sell to any person within or outside Australia or a solicitation to any person within or outside of Australia to buy or sell any instrument described herein. This report is being issued outside Australia to a limited number of institutional investors and may not be provided to any person other than the original recipient and may not be reproduced or used for any other purposes.
Canada: This research report has not been prepared in accordance with the disclosure requirements of Dealer Member Rule 3400 – Research Restrictions and Disclosure Requirements of the Investment Industry Regulatory Organization of Canada. For any research report distributed by CIBC, further disclosures related to CIBC conflicts of interest can be found at https://researchcentral.cibcwm.com .
China: For the purpose of this report, the People’s Republic of China (“PRC”) does not include the Hong Kong Special Administrative Region, the Macau Special Administrative Region or Taiwan. The distributor of this report has not been approved or licensed by the China Securities Regulatory Commission or any other relevant regulatory authority or governmental agency in the PRC. This report contains only marketing information. The distribution of this report is not an offer to buy or sell to any person within or outside PRC or a solicitation to any person within or outside of PRC to buy or sell any instruments described herein. This report is being issued outside the PRC to a limited number of institutional investors and may not be provided to any person other than the original recipient and may not be reproduced or used for any other purpose.
France: Only qualified investors within the meaning of French law shall have access to this report. This report shall not be considered as an offer to subscribe to, or used in connection with, any offer for subscription or sale or marketing or direct or indirect distribution of financial instruments and it is not intended as a solicitation for the purchase of any financial instrument.
Germany: This report is only directed at persons who are professional investors as defined in sec 31a(2) of the German Securities Trading Act (WpHG). This publication constitutes research of a non-binding nature on the market situation and the investment instruments cited here at the time of the publication of the information.
The current prices/yields in this issue are based upon closing prices from Bloomberg as of the day preceding publication. Please note that neither the German Federal Financial Supervisory Agency (BaFin), nor any other supervisory authority exercises any control over the content of this report.
Hong Kong: This report is issued and distributed in Hong Kong by CIMB Securities Limited (“CHK”) which is licensed in Hong Kong by the Securities and Futures Commission for Type 1 (dealing in securities), Type 4 (advising on securities) and Type 6 (advising on corporate finance) activities. Any investors wishing to purchase or otherwise deal in the securities covered in this report should contact the Head of Sales at CIMB Securities Limited. The views and opinions in this research report are of CIMB, John Keells, SBE or Morgans, as the case may be, as of the date hereof and are subject to change. If the Financial Services and Markets Act of the United Kingdom or the rules of the Financial Conduct Authority apply to a recipient, our obligations owed to such recipient therein are unaffected. CHK has no obligation to update its opinion or the information in this research report.
This publication is strictly confidential and is for private circulation only to clients of CHK.
India: This report is issued and distributed in India by CIMB Securities (India) Private Limited (”CIMB India") which is registered with SEBI as a stock-broker under the Securities and Exchange Board of India (Stock Brokers and Sub-Brokers) Regulations, 1992, the Securities and
31

Asia Pacific Daily│Equity research│August 1, 2016
10
Exchange Board of India (Research Analyst) Regulations, 2014 (SEBI Registration Number INH000000669) and in accordance with the provisions of Regulation 4 (g) of the Securities and Exchange Board of India (Investment Advisers) Regulations, 2013, CIMB India is not required to seek registration with SEBI as an Investment Adviser.
The research analysts, strategists or economists principally responsible for the preparation of this research report are segregated from equity stock broking and merchant banking of CIMB India and they have received compensation based upon various factors, including quality, accuracy and value of research, firm profitability or revenues, client feedback and competitive factors. Research analysts', strategists' or economists' compensation is not linked to investment banking or capital markets transactions performed or proposed to be performed by CIMB India or its affiliates.”
Indonesia: This report is issued and distributed by PT CIMB Securities Indonesia (“CIMBI”). The views and opinions in this research report are our own as of the date hereof and are subject to change. If the Financial Services and Markets Act of the United Kingdom or the rules of the Financial Conduct Authority apply to a recipient, our obligations owed to such recipient therein are unaffected. CIMBI has no obligation to update its opinion or the information in this research report. Neither this report nor any copy hereof may be distributed in Indonesia or to any Indonesian citizens wherever they are domiciled or to Indonesian residents except in compliance with applicable Indonesian capital market laws and regulations.
This research report is not an offer of securities in Indonesia. The securities referred to in this research report have not been registered with the Financial Services Authority (Otoritas Jasa Keuangan) pursuant to relevant capital market laws and regulations, and may not be offered or sold within the territory of the Republic of Indonesia or to Indonesian citizens through a public offering or in circumstances which constitute an offer within the meaning of the Indonesian capital market law and regulations.
Ireland: CIMB is not an investment firm authorised in the Republic of Ireland and no part of this document should be construed as CIMB acting as, or otherwise claiming or representing to be, an investment firm authorised in the Republic of Ireland.
Malaysia: This report is issued and distributed by CIMB Investment Bank Berhad (“CIMB”) solely for the benefit of and for the exclusive use of our clients. If the Financial Services and Markets Act of the United Kingdom or the rules of the Financial Conduct Authority apply to a recipient, our obligations owed to such recipient therein are unaffected. CIMB has no obligation to update, revise or reaffirm its opinion or the information in this research reports after the date of this report.
New Zealand: In New Zealand, this report is for distribution only to persons who are wholesale clients pursuant to section 5C of the Financial Advisers Act 2008.
Singapore: This report is issued and distributed by CIMB Research Pte Ltd (“CIMBR”). CIMBR is a financial adviser licensed under the Financial Advisers Act, Cap 110 (“FAA”) for advising on investment products, by issuing or promulgating research analyses or research reports, whether in electronic, print or other form. Accordingly CIMBR is a subject to the applicable rules under the FAA unless it is able to avail itself to any prescribed exemptions.
Recipients of this report are to contact CIMB Research Pte Ltd, 50 Raffles Place, #19-00 Singapore Land Tower, Singapore in respect of any matters arising from, or in connection with this report. CIMBR has no obligation to update its opinion or the information in this research report. This publication is strictly confidential and is for private circulation only. If you have not been sent this report by CIMBR directly, you may not rely, use or disclose to anyone else this report or its contents.
If the recipient of this research report is not an accredited investor, expert investor or institutional investor, CIMBR accepts legal responsibility for the contents of the report without any disclaimer limiting or otherwise curtailing such legal responsibility. If the recipient is an accredited investor, expert investor or institutional investor, the recipient is deemed to acknowledge that CIMBR is exempt from certain requirements under the FAA and its attendant regulations, and as such, is exempt from complying with the following :
(a) Section 25 of the FAA (obligation to disclose product information);
(b) Section 27 (duty not to make recommendation with respect to any investment product without having a reasonable basis where you may be reasonably expected to rely on the recommendation) of the FAA;
(c) MAS Notice on Information to Clients and Product Information Disclosure [Notice No. FAA-N03];
(d) MAS Notice on Recommendation on Investment Products [Notice No. FAA-N16];
(e) Section 36 (obligation on disclosure of interest in securities), and
(f) any other laws, regulations, notices, directive, guidelines, circulars and practice notes which are relates to the above, to the extent permitted by applicable laws, as may be amended from time to time, and any other laws, regulations, notices, directive, guidelines, circulars, and practice notes as we may notify you from time to time. In addition, the recipient who is an accredited investor, expert investor or institutional investor acknowledges that a CIMBR is exempt from Section 27 of the FAA, the recipient will also not be able to file a civil claim against CIMBR for any loss or damage arising from the recipient’s reliance on any recommendation made by CIMBR which would otherwise be a right that is available to the recipient under Section 27 of the FAA, the recipient will also not be able to file a civil claim against CIMBR for any loss or damage arising from the recipient’s reliance on any recommendation made by CIMBR which would otherwise be a right that is available to the recipient under Section 27 of the FAA.
South Korea: This report is issued and distributed in South Korea by CIMB Securities Limited, Korea Branch (“CIMB Korea”) which is licensed as a cash equity broker, and regulated by the Financial Services Commission and Financial Supervisory Service of Korea. In South Korea, this report is for distribution only to professional investors under Article 9(5) of the Financial Investment Services and Capital Market Act of Korea (“FSCMA”).
Spain: This document is a research report and it is addressed to institutional investors only. The research report is of a general nature and not personalised and does not constitute investment advice so, as the case may be, the recipient must seek proper advice before adopting any investment decision. This document does not constitute a public offering of securities.
CIMB is not registered with the Spanish Comision Nacional del Mercado de Valores to provide investment services.
Sweden: This report contains only marketing information and has not been approved by the Swedish Financial Supervisory Authority. The
32

Asia Pacific Daily│Equity research│August 1, 2016
11
distribution of this report is not an offer to sell to any person in Sweden or a solicitation to any person in Sweden to buy any instruments described herein and may not be forwarded to the public in Sweden.
Switzerland: This report has not been prepared in accordance with the recognized self-regulatory minimal standards for research reports of banks issued by the Swiss Bankers’ Association (Directives on the Independence of Financial Research).
Taiwan: This research report is not an offer or marketing of foreign securities in Taiwan. The securities as referred to in this research report have not been and will not be registered with the Financial Supervisory Commission of the Republic of China pursuant to relevant securities laws and regulations and may not be offered or sold within the Republic of China through a public offering or in circumstances which constitutes an offer or a placement within the meaning of the Securities and Exchange Law of the Republic of China that requires a registration or approval of the Financial Supervisory Commission of the Republic of China.
Thailand: This report is issued and distributed by CIMB Securities (Thailand) Company Limited (“CIMBS”) based upon sources believed to be reliable (but their accuracy, completeness or correctness is not guaranteed). The statements or expressions of opinion herein were arrived at after due and careful consideration for use as information for investment. Such opinions are subject to change without notice and CIMBS has no obligation to update its opinion or the information in this research report.
If the Financial Services and Markets Act of the United Kingdom or the rules of the Financial Conduct Authority apply to a recipient, our obligations owed to such recipient are unaffected.
CIMB Securities (Thailand) Co., Ltd. may act or acts as Market Maker, and issuer and offerer of Derivative Warrants and Structured Note which may have the following securities as its underlying securities. Investors should carefully read and study the details of the derivative warrants in the prospectus before making investment decisions.
AAV, ADVANC, AMATA, ANAN, AOT, AP, BA, BANPU, BBL, BCP, BDMS, BEAUTY, BEC, BEM, BH, BJCHI, BLA, BLAND, BTS, CBG, CENTEL, CHG, CK, CKP, CPALL, CPF, CPN, DELTA, DTAC, EARTH, EGCO, EPG, GL, GLOW, GPSC, GUNKUL, HANA, HMPRO, ICHI, INTUCH, IRPC, ITD, IVL, JAS, KBANK, KCE, KKP, KTB, KTC, LH, LHBANK, LPN, M, MAJOR, MINT, PLANB, PLAT, PS, PTG, PTT, PTTEP, PTTGC, QH, ROBINS, RS, S, SAMART, SAMTEL, SAWAD, SCB, SCC, SCCC, SCN, SGP, SIRI, SPALI, SPCG, STEC, STPI, SVI, TASCO, TCAP, THAI, THCOM, TICON, TISCO, TMB, TOP, TPIPL, TRUE, TTA, TTCL, TTW, TU, UNIQ, UV, VGI, VNG, WHA, WORK.
Corporate Governance Report:
The disclosure of the survey result of the Thai Institute of Directors Association (“IOD”) regarding corporate governance is made pursuant to the policy of the Office of the Securities and Exchange Commission. The survey of the IOD is based on the information of a company listed on the Stock Exchange of Thailand and the Market for Alternative Investment disclosed to the public and able to be accessed by a general public investor. The result, therefore, is from the perspective of a third party. It is not an evaluation of operation and is not based on inside information.
The survey result is as of the date appearing in the Corporate Governance Report of Thai Listed Companies. As a result, the survey result may be changed after that date. CIMBS does not confirm nor certify the accuracy of such survey result.
Score Range: 90 - 100 80 - 89 70 - 79 Below 70 or No Survey Result
Description: Excellent Very Good Good N/A
United Arab Emirates: The distributor of this report has not been approved or licensed by the UAE Central Bank or any other relevant licensing authorities or governmental agencies in the United Arab Emirates. This report is strictly private and confidential and has not been reviewed by, deposited or registered with UAE Central Bank or any other licensing authority or governmental agencies in the United Arab Emirates. This report is being issued outside the United Arab Emirates to a limited number of institutional investors and must not be provided to any person other than the original recipient and may not be reproduced or used for any other purpose. Further, the information contained in this report is not intended to lead to the sale of investments under any subscription agreement or the conclusion of any other contract of whatsoever nature within the territory of the United Arab Emirates.
United Kingdom: In the United Kingdom and European Economic Area, this report is being disseminated by CIMB Securities (UK) Limited (“CIMB UK”). CIMB UK is authorized and regulated by the Financial Conduct Authority and its registered office is at 27 Knightsbridge, London, SW1X7YB. Unless specified to the contrary, this report has been issued and approved for distribution in the U.K. and the EEA by CIMB UK. Investment research issued by CIMB UK has been prepared in accordance with CIMB Group’s policies for managing conflicts of interest arising as a result of publication and distribution of investment research. This report is for distribution only to, and is solely directed at, selected persons on the basis that those persons: (a) are eligible counterparties and professional clients of CIMB UK; (b) have professional experience in matters relating to investments falling within Article 19(5) of the Financial Services and Markets Act 2000 (Financial Promotion) Order 2005 (as amended, the “Order”), (c) fall within Article 49(2)(a) to (d) (“high net worth companies, unincorporated associations etc”) of the Order; (d) are outside the United Kingdom subject to relevant regulation in each jurisdiction, or (e) are persons to whom an invitation or inducement to engage in investment activity (within the meaning of section 21 of the Financial Services and Markets Act 2000) in connection with any investments to which this report relates may otherwise lawfully be communicated or caused to be communicated (all such persons together being referred to as “relevant persons”). This report is directed only at relevant persons and must not be acted on or relied on by persons who are not relevant persons. Any investment or investment activity to which this report relates is available only to relevant persons and will be engaged in only with relevant persons.
Where this report is labelled as non-independent, it does not provide an impartial or objective assessment of the subject matter and does not constitute independent “investment research” under the applicable rules of the Financial Conduct Authority in the UK. Consequently, any such non-independent report will not have been prepared in accordance with legal requirements designed to promote the independence of investment research and will not subject to any prohibition on dealing ahead of the dissemination of investment research. Any such non-independent report must be considered as a marketing communication.
United States: This research report is distributed in the United States of America by CIMB Securities (USA) Inc, a U.S. registered broker-dealer and a related company of CIMB Research Pte Ltd, CIMB Investment Bank Berhad, PT CIMB Securities Indonesia, CIMB Securities (Thailand) Co. Ltd, CIMB Securities Limited, CIMB Securities (India) Private Limited, and is distributed solely to persons who qualify as “U.S. Institutional
33

Asia Pacific Daily│Equity research│August 1, 2016
12
Investors” as defined in Rule 15a-6 under the Securities and Exchange Act of 1934. This communication is only for Institutional Investors whose ordinary business activities involve investing in shares, bonds, and associated securities and/or derivative securities and who have professional experience in such investments. Any person who is not a U.S. Institutional Investor or Major Institutional Investor must not rely on this communication. The delivery of this research report to any person in the United States of America is not a recommendation to effect any transactions in the securities discussed herein, or an endorsement of any opinion expressed herein. CIMB Securities (USA) Inc, is a FINRA/SIPC member and takes responsibility for the content of this report. For further information or to place an order in any of the above-mentioned securities please contact a registered representative of CIMB Securities (USA) Inc.
Other jurisdictions: In any other jurisdictions, except if otherwise restricted by laws or regulations, this report is only for distribution to professional, institutional or sophisticated investors as defined in the laws and regulations of such jurisdictions.
Corporate Governance Report of Thai Listed Companies (CGR). CG Rating by the Thai Institute of Directors Association (Thai IOD) in 2015, Anti-Corruption Progress Indicator 2015.
AAV – Very Good, 3B, ADVANC – Excellent, 3A, AEONTS – Good, 1, AMATA – Very Good, 2, ANAN – Very Good, 3A, AOT – Very Good, 2, AP - Good, 3A, ASK – Very Good, 3B, ASP – Very Good, 4, BANPU – Very Good, 4, BAY – Very Good, 4, BBL – Very Good, 4, BCH – not available, no progress, BCP - Excellent, 5, BEM – not available, no progress, BDMS – Very Good, 3B, BEAUTY – Good, 2, BEC - Good, 3B, BH - Good, 2, BIGC - Excellent, 3A, BJC – Good, 1, BLA – Very Good, 4, 1, BTS - Excellent, 3A, CBG – Good, 1, CCET – not available, 1, CENTEL – Very Good, 3A, CHG – Good, 3B, CK – Excellent, 3B, COL – Very Good, 3A, CPALL – Good, 3A, CPF – Very Good, 3A, CPN - Excellent, 5, DELTA - Very Good, 3A, DEMCO – Very Good, 3A, DTAC – Excellent, 3A, EA – not available, 3A, ECL – Good, 4, EGCO - Excellent, 4, EPG – not available, 3B, GFPT - Very Good, 3A, GLOBAL – Very Good, 2, GLOW - Good, 3A, GPSC – not available, 3B, GRAMMY - Excellent, 3B, GUNKUL – Very Good, 1, HANA - Excellent, 4, HMPRO - Excellent, 3A, ICHI – Very Good, 3A, INTUCH - Excellent, 4, ITD – Good, 1, IVL - Excellent, 4, JAS – not available, 3A, JASIF – not available, no progress, JUBILE – Good, 3A, KAMART – not available, no progress, KBANK - Excellent, 4, KCE - Excellent, 4, KGI – Good, 4, KKP – Excellent, 4, KSL – Very Good, 2, KTB - Excellent, 4, KTC – Very Good, 3A, LH - Very Good, 3B, LPN – Excellent, 3A, M - Good, 2, MAJOR - Good, 1, MAKRO – Good, 3A, MALEE – not available, 2, MBKET – Good, 2, MC – Very Good, 3A, MCOT – Excellent, 3A, MEGA – Very Good, 2, MINT - Excellent, 3A, MTLS – Good, 2, NYT – Good, no progress, OISHI – Very Good, 3B, PLANB – Good, 3B, PS – Excellent, 3A, PSL - Excellent, 4, PTT - Excellent, 5, PTTEP - Excellent, 4, PTTGC - Excellent, 5, QH – Very Good, 2, RATCH – Excellent, 3A, ROBINS – Excellent, 3A, RS – Very Good, 1, SAMART - Excellent, 3B, SAPPE - Good, 3B, SAT – Excellent, 5, SAWAD – Good, 1, SC – Excellent, 3B, SCB - Excellent, 4, SCBLIF – not available, no progress, SCC – Excellent, 5, SCN – Good, 1, SCCC - Good, 3A, SIM - Excellent, 3B, SIRI - Good, 1, SPALI - Excellent, 3A, SPRC – not available, no progress, STA – Very Good, 1, STEC – Very Good, 3B, SVI – Very Good, 3A, TASCO – Very Good, 3A, TCAP – Very Good, 4, THAI – Very Good, 3A, THANI – Very Good, 5, THCOM – Excellent, 4, THRE – Very Good, 3A, THREL – Very Good, 3A, TICON – Very Good, 3A, TISCO - Excellent, 4, TK – Very Good, 3B, TKN – not available, no progress, TMB - Excellent, 4, TPCH – Good, 3B, TOP - Excellent, 5, TRUE – Very Good, 2, TTW – Very Good, 2, TU – Very Good, 3A, UNIQ – not available, 2, VGI – Excellent, 3A, WHA – Good, 3A, WORK – not available, no progress.
Comprises level 1 to 5 as follows:
Level 1: Committed
Level 2: Declared
Level 3: Established (3A: Established by Declaration of Intent, 3B: Established by Internal Commitment and Policy)
Level 4: Certified
Level 5: Extended.
CIMB Recommendation Framework
Stock Ratings Definition:
Add The stock’s total return is expected to exceed 10% over the next 12 months.
Hold The stock’s total return is expected to be between 0% and positive 10% over the next 12 months.
Reduce The stock’s total return is expected to fall below 0% or more over the next 12 months.
The total expected return of a stock is defined as the sum of the: (i) percentage difference between the target price and the current price and (ii) the forward net dividend yields of the stock. Stock price targets have an investment horizon of 12 months.
Sector Ratings Definition:
Overweight An Overweight rating means stocks in the sector have, on a market cap-weighted basis, a positive absolute recommendation.
Neutral A Neutral rating means stocks in the sector have, on a market cap-weighted basis, a neutral absolute recommendation.
Underweight An Underweight rating means stocks in the sector have, on a market cap-weighted basis, a negative absolute recommendation.
Country Ratings Definition:
Overweight An Overweight rating means investors should be positioned with an above-market weight in this country relative to benchmark.
Neutral A Neutral rating means investors should be positioned with a neutral weight in this country relative to benchmark.
Underweight An Underweight rating means investors should be positioned with a below-market weight in this country relative to benchmark.
34