asia in a global context - dbs bank in a global context... · pricing power “slacks ... rapid...
TRANSCRIPT

.
Confidential – Not For Redistribution
Asia in a Global Context

2 This material must be read in conjunction with the “Important Information” statement on the last page and is not for redistribution.
Table of Contents
Building Nikko AM’s Investment Capabilities
Asia in a Global Context
Asia in a Historical Context
China Playbook
The Coming “Big Rotation”
Japan: Asia’s Other Giant
The Sun is Rising in Japan
Asia: The 4 Key Themes for Asia
The Prescription: How to Invest in Asia’s Growth
Section 1
Section 2
Section 3
Section 4
Section 5
Section 6
Section 7
Section 8
Section 9

3 This material must be read in conjunction with the “Important Information” statement on the last page and is not for redistribution.
Asia Investment Timeline
Nikko AM’s Investment Professionals: Total 200 as of Mar. 2015
Spectrum of Investment Activeness
Building Nikko AM’s Investment Capabilities
We are an “Asia
based Global Asset
Management firm”
While we have built
out our in-region
capabilities, our 200
investment
professionals span
over all major
markets around the
world
Mar 2011 Acquired Tyndall AM
Sep 2011 Purchased DBS AM
Apr 2007 Acquired 40% stake in “Rong Tong Fund Management
Apr 2015 Apr 2014 Apr 2013 Apr 2012 Apr 2011 Apr 2008 Apr 2007
Oct 2013 New Asian Equity team joins from TAAM
Aug 2012 Invested in Ambit Investment
Advisors
Japan Singapore
& HK
Australia
& NZ Europe US
PMs 49 19 18 10 8
Analysts 24 11 9 5 3
Other 27 6 6 3 2
Total: 200 100 36 33 18 13
China Oceania SG & ASEAN India
Dec 1959
Japan
Dec 1959 Tokyo office opens

4 This material must be read in conjunction with the “Important Information” statement on the last page and is not for redistribution.
Building Nikko AM’s Investment Capabilities (continued)
As of 2014, Nikko
AM’s investment
professionals have
produced more than
50 Thought
Leadership pieces
focusing on all
regions across Asia

5 This material must be read in conjunction with the “Important Information” statement on the last page and is not for redistribution.
Building Nikko AM’s Investment Capabilities (continued)
Product Prioritization
“Barbell” investment capability will capture institutional client needs: high conviction-high alpha active strategies and cost-effective passive strategies
Globally-integrated, dynamic asset allocations will address the needs of both retail and institutional investors
Demand for asset
diversification and
risk mitigation is
driving the industry
to build skill-sets to
address both needs
We have the
solutions to meet
your demands Benchmark
Agnostic
Benchmark
Driven
Investment Philosophy
Distinctively
Active
Efficiently
Passive

6 This material must be read in conjunction with the “Important Information” statement on the last page and is not for redistribution.
Asia in a Global Context
Asia dominated by
two giants: China
and Japan
Although moderate
deflation may seem
abnormal and
therefore dangerous
to investors
accustomed to
secular inflation
since World War II,
short periods of
deflation have been
common in
American history¹
Prices have been
relatively stable over
the long term; they
were actually no
higher in 1940 than
in 1795¹
Deflation does not have to be Great Depression
Lower prices with moderate growth can be very good for the investment market…
“Goldilocks” 1Source: E. Kerschner, “Flations: Inflation and Deflation”, extracted as of 31 May 2015
Inflation is Coming
Monetarist view Zero to negative interest rates Excessive debt incurred by governments
Deflation is Coming
Developed Markets’ population growth = negative growth Pricing Power “slacks” Financial repression
Economists’ Debate:
The answer lies in extending the scope of economic history the last 200 years…
Source: CEIC, Morgan Stanley Research 13 April 2015. *Data as of March 2015 for China, Taiwan and Thailand; 4Q 20114 for HK and February 2015 for others.
Producer Price Deflation Across Asia
Source: Bloomberg, Bank of Singapore, extracted as of 31 May 2015

7 This material must be read in conjunction with the “Important Information” statement on the last page and is not for redistribution.
Asia in a Historical Context
Like China, U.S. in 19th Century was also primarily rural land that increased its urbanization and industrialization - becoming world manufacturing hub
In 1860s-1880s U.S., prices declined but productivity rose following effects of technology, increased reform and competition
Modern Asian economies have all followed similar pattern of growth – wild geese analogy
With Japan as the lead goose
China has become a late 20th Century global growth center following the Information Revolution and growing globalization
Headed in similar direction of increased openness and competitive trend
After around 20 years of secular deflation with low productivity and spending, Japan is finally taking steps to shift to inflationary mindset
China is an example
of Good Deflation –
following path of late
19th Century U.S.:
1) Rise of an
economic
superpower creating
unprecedented
productive capacity
2) Technological
breakthroughs in key
industries causing
oversupply
3) Globalization
U.S. CPI, 1800-1900
Source: Mises Institute, “Deflating the Deflation Myth”,
extracted as of 31 May 2015
China CPI, 1995-Present
Source: www.tradingeconomics.com, National Bureau of Statistics of China, extracted as of 31 May 2015

8 This material must be read in conjunction with the “Important Information” statement on the last page and is not for redistribution.
China Playbook
British referred to U.S.’ 19th Century growth and production as the “American System
of Manufactures”¹ – but the U.S. should now be switched with China
At end of 1999, China was ranked #7 largest economy with GDP USD $1.0 trn
As of 2013, it ranked #2 with GDP USD $9.2 trn, changing the global economic environment and creating new paradigm
However, it must slow down “catch-up growth” tactics be sustainable and avoid market crisis – opposite of Japan’s collapse of bubble after 1980s
During this Good
Deflationary period,
China is following
the footsteps of
Japan, Taiwan and
Korea
We believe China
will become nexus of
global equity
investing - not
because of growth
rate, but because of
previous trajectories
followed by the other
countries mentioned
However,
normalizing growth
trends leaves us
bearish on
commodities and oil
Source: 1Time, “How China is like 19th Century America”; World Bank; extracted as of 31 May 2015
No. Country GDP in 1999
(USDbn) No. Country
GDP in 2013 (USDbn)
1 U.S. 9,660 1 U.S. 16,768
2 Japan 4,432 2 China 9,240
3 Germany 2,196 3 Japan 4,919
4 U.K. 1,558 4 Germany 3,730
5 France 1,500 5 France 2,806
6 Italy 1,249 6 U.K. 2,678
7 China 1,083 7 Brazil 2,245
2013 China’s GDP greater than Germany, U.K. & France…COMBINED
+753% =9,214
Top 7 Economies by GDP, 1999 vs. 2013
Source: World Bank

9 This material must be read in conjunction with the “Important Information” statement on the last page and is not for redistribution.
China Playbook (continued)
China seen as following the same two-stage development processes as Japan, Taiwan and Korea did
Stage 1: (Japan 1950s-70s; China 1980s-00s)
Rapid economic growth and high productivity coinciding with capital controls and tightly
managed exchange rates
China’s growth has
been through
mobilizing
resources, moving
labor to cities and
increasing industrial
output
However Stage 1 of
Asia growth cannot
be sustained without
opening market
Source: World Bank, Gavekal, extracted as of 31 May 2015
Per-Capita GDP Per-Capita GDP Growth
Source: Barron’s, The Maddison-Project, 2013 version., Jan 2013 Note: 1990 International Geary-Khamis (GK) dollar: A hypothetical unit of currency that has the same purchasing power parity that the USD had in the U.S. in 1990

10 This material must be read in conjunction with the “Important Information” statement on the last page and is not for redistribution.
China Playbook (continued)
Stage 2: (Japan 1970s-90s; China now)
Loosened capital controls and freed up exchange rates leading to improved equity
performance
This process has been followed by opening of capital markets and competition – driving productivity
Slow-down will
create equity
investing
opportunities –
reform and market
opening lead to
greater competition,
profitability
Nominal GDP Nikkei Index
1960s 380% 170%
1970s 240% 180%
1980s 90% 510%
Decade-by-decade cumulative gains in Japan
Nominal GDP and the Nikkei Index
Source: Gavekal, extracted as of 31 May 2015

11 This material must be read in conjunction with the “Important Information” statement on the last page and is not for redistribution.
China Playbook (continued)
Positioning RMB as a global reserve currency
Qualified Foreign Institutional Investor (QFII & RQFII) program to attract capital into RMB-based EQ and FI
Shanghai-Hong Kong Stock Connect for cross-border sales of securities
Limited to mainland institutional or private investors with 500,000 yuan (~USD 80 thousand) on account, there has been recent news of lowering capital requirements for more participants
China is taking key
steps to open its
economy and capital
account
Source: SG Cross Asset Research/Economics, extracted as of 31 May 2015
China’s Reform Timeline

12 This material must be read in conjunction with the “Important Information” statement on the last page and is not for redistribution.
The Coming “Big Rotation”
Because of capital controls, China’s market cap is not reflected in Global Equity
Indices
China is ~15% of world GDP but only 2.4% of MSCI ACWI
Potentially grossly understated due to its semi-closed nature
If controls were relaxed, China’s weighting would jump from 2.4% to 4.8% of MSCI
AWI and from 18.8% to 37.5% of MSCI EM
As China removes
investment barriers,
it will become a
larger part of global
equity indices
Because of this, we
believe China’s
weighting in MSCI
will increase
significantly as
capital controls are
relaxed
Source: MSCI, The Conference Board Global Economic Outlook 2014, May 2014
Hypothetical Weight of MSCI ACWI Hypothetical Weight of MSCI EM

13 This material must be read in conjunction with the “Important Information” statement on the last page and is not for redistribution.
The Coming “Big Rotation” (continued)
China has 1,874
listed companies
with market cap
greater than USD
500mn
9x more companies
than in HK, Taiwan
and Korea
Number of Listed Companies Above USD 500mn Market Cap by Country
Source: Factset, Goldman Sachs Investment Research, March 6 2015

14 This material must be read in conjunction with the “Important Information” statement on the last page and is not for redistribution.
Japan: Asia’s Other Giant
Japan suffered from bad deflation for more than two decades
Policy errors, poor QE execution combined with bad demographics trend and strong currency
These all lead to prescription of first two Abenomic arrows
While Abenomics has yet to deliver inflation target of 2%, it created a boom for the stock market
China has seen the
mistakes made by
the lead goose
Japan’s Lost Decade
was the precursor
for Prime Minister
Abe’s first two
Arrows for re-growth
Source: WSJ, extracted as of 31 May 2015
Source: Reuters, extracted as of 31 May 2015

15 This material must be read in conjunction with the “Important Information” statement on the last page and is not for redistribution.
Japan: Asia’s Other Giant (continued)
High correlation between Nikkei and JPY depreciation between 2013-14 evidence
Though correlation starting to break down, we believe market is starting to price in two longer term effects of Abenomics – a “New Goldilocks” market
Stronger economic fundamentals
Corporate earnings growth
First two Arrows
have led yen to fall
by 40%, with stock
market almost
doubling – the best
performance in over
a decade
The percentage of
net cash-firms has
now risen to more
than 50%, which is
an overwhelmingly
high level compared
with past averages
and global trends
Breakdown of Currency-Equity Linkage Growth in Exports and Imports (YoY)
Source: Nikko Asset Management based on data from Bank of Japan as of 31 January 2015 Source: Gavekal Data, Macrobond as of 31 March 2015

16 This material must be read in conjunction with the “Important Information” statement on the last page and is not for redistribution.
The Sun is Rising in Japan
We are now seeing signs that the third Arrow is making effects in various aspects
Female participation rate - Women in management roles has risen from 6.9% in Jun 2012 to 8.3% in Jun 2014
Trade Agreements – Trans Pacific Partnership agreement expected to be reached by end of 2015 or early 2016
Corporate Governance - reforms leading to higher ROE and lower corporate tax rates, leading to investments
Companies that have announced reforms have recorded strong share price performance
52 companies that announced reforms since 2014 have outperformed TOPIX by average of 5.7% a month after their respective announcements¹
Ex: Yahoo Japan announced doubling year-end dividend on Mar. 19 2015
The third Abenomic
Arrow is underway,
influencing
Japanese companies
to make various
structural reforms
Source: Goldman Sachs, Factset as of 16 April 2015
TOPIX-relative Performance (Equal-weighted) of 52
companies that have announced reforms since 2014 Global Comparison of Net Cash-Firms
Source: Nomura and Nikko AM, based on TSE, MSCI and S&P data extracted as of 31 May 2015

17 This material must be read in conjunction with the “Important Information” statement on the last page and is not for redistribution.
The Sun is Rising in Japan (continued)
Japan to benefit most from TPP - Only 18% of Japan’s trade falls under free trade
agreements - South Korea’s 43%¹
GPIF has reallocated its weighting of Japanese equities from 12% to 25%¹
Total equity allocation from 24% to 50% - Domestic institutions expected to follow
Corporate Governance reforms leading to higher ROE and lower corporate tax rates – leading to investments²
Bottom-Up: average profit margin for listed companies rose to 4.61% in Q1-15 vs. last peak of 4.64% in Q4-07
Top-Down: Corporate profit margins (ex-financials) hitting a new high of 5.3% in 4Q-14
There are still
skeptics of the
Japanese market,
but they don’t realize
bull market is still
young
“A bull climbs many
walls of worries” –
we believe that the
equity gain is
sustainable
TPP participation,
GPIF reallocation
and Corporate
Governance Code
are catalysts for
Japan’s sustainable
equity growth
Source: 1 BCA Research, 2 Gavekal, extracted as of 31 May 2015 Source: Gavekal, as of 31 May 2015
U.S.

18 This material must be read in conjunction with the “Important Information” statement on the last page and is not for redistribution.
Asia: The 4 Key Themes
Taking into consideration demographics, wage growth and a burgeoning middle class, we have 4 Key investment themes for Asia:
‘Old Asia to New Asia’: Don’t look backwards
As ‘Old Asia’ evolves
into ‘New Asia’,
investors need to
consider where
growth will come
from in the future
We have identified
Four Key Themes
Healthcare Tourism Insurance Environment
Sector represents only 6% of Chinese GDP1
China one of lowest
health spenders as % of GDP, though urbanization creating growth
Medical Tourism: 5 of
Top 10 destinations in Asia2
Asia-Pac 2nd in no. of
tourism arrivals at
28.4%3
No. of outbound Chinese tourists has doubled in past 4 years - we expect it to double in 5 years
Share of total global premiums set to grow
Ageing populations will boost demand for life insurance in Ems4
Non-life insurance will
profit from increased
urbanization,
expanding middle
class and rising
economic wealth4
China & US agreement to tackle carbon dioxide emissions
China has pledged to make clean energy sources, such as solar
power, account for
20% of the country's
total energy
production by 2030
1Source: World Health Organization, as of August 2014 2Source: Medical Travel Quality Alliance. http://www.mtqua.org/providers/top-10-worlds-best-hospitals-for-medical-tourists-new/ 3Source: UN Economic and Social Commission for Asia Pacific Statistical Yearbook 2013, UN World Tourism Organization 4Source: Swiss Re sigma Study on World Insurance 2012

19 This material must be read in conjunction with the “Important Information” statement on the last page and is not for redistribution.
The Prescription: How to Invest in Asia’s Growth
China
Invest in sectors/companies that will perform well in a deflationary environment with increasing capital openness and competition
Reforms which happen every two decades in China are significant and happening now - Investment
opportunities abound in this environment
Sectors include Insurance, Environmental, Technology, Tourism, Consumption and Healthcare
Stock examples: China Medical System, China Taiping Insurance, CT Environmental, and
Sinopharm
Japan
Turnaround Opportunity: Undervalued global brands that are transforming their business portfolio
for high profitability
Improving Corporate Governance: Upside in capital efficiency (increase in Capex/M&A and
Shareholder Returns)
Stock examples: Sony, Nintendo and Toray
ASEAN
Structural drivers in place and remain bullish: Rise of affluence and consumerization driven by
young and fast growing labor force, rising middle class and increasing urbanization FDI will be ASEAN’s future lever for economic success driven by boom in infrastructure and greater
liberalization and connectivity in trade and services (e.g. ASEAN Economic Community by 2015)
Positive on Philippines, Indonesia and Singapore: Greatest opportunities are in logistics, financial services, consumer and infrastructure
Any securities shown are for illustration purposes only and are not stock recommendations.

20 This material must be read in conjunction with the “Important Information” statement on the last page and is not for redistribution.
The Prescription: How to Invest in Asia’s Growth (continued)
Buy Asia as your Core Holdings in a global diversified portfolio - Japan should outperform all Developed Markets as catalysts from Abe’s structural reforms unfold.
Asia is on a deflationary path as well as exporting deflation elsewhere. Include
long duration bonds in a balanced portfolio
Best combination: Long duration Asian Bonds and Asian Equity
Buy companies, not indices
Well researched, high conviction portfolios of emerging Asian brands in key sectors will outperform market indices which track the “Old Asia”.
The most effective
way for investing
into Asia involves
accessing the
relevant core
holdings, and
complementing this
with the appropriate
satellite solutions

Appendix

22 This material must be read in conjunction with the “Important Information” statement on the last page and is not for redistribution.
China Playbook (continued)
While usually strong
correlation between
equity market
returns and nominal
GDP growth, China
is outlier similar to
Japan in the 1980s
Source: Gavekal, extracted as of 31 May 2015
A-Share equity market starting in the 2000s was overvalued in P/E terms – with average ratio of 50
By 2012, the multiple fell in line to the EM average of 12

23 This material must be read in conjunction with the “Important Information” statement on the last page and is not for redistribution.
Reforms – A Key Element for 2015
Short term sacrifice
for sustainable
longer term growth –
India and China
most promising
Source: Goldman Sachs Global Investment Research 23 November 2014.
24 This material must be read in conjunction with the “Important Information” statement on the last page and is not for redistribution.
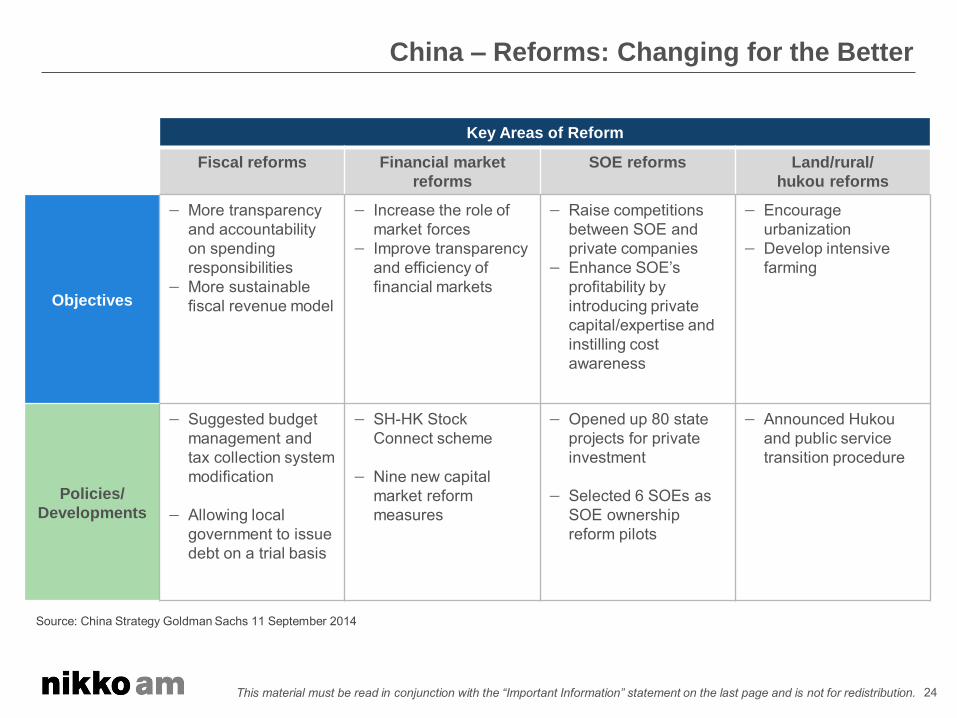
China – Reforms: Changing for the Better
Source: China Strategy Goldman Sachs 11 September 2014
Key Areas of Reform
Fiscal reforms Financial market
reforms
SOE reforms Land/rural/
hukou reforms
Objectives
More transparency and accountability on spending responsibilities
More sustainable fiscal revenue model
Increase the role of market forces
Improve transparency and efficiency of financial markets
Raise competitions between SOE and private companies
Enhance SOE’s
profitability by introducing private capital/expertise and instilling cost awareness
Encourage urbanization
Develop intensive farming
Policies/
Developments
Suggested budget management and tax collection system modification
Allowing local government to issue debt on a trial basis
SH-HK Stock Connect scheme
Nine new capital market reform measures
Opened up 80 state projects for private investment
Selected 6 SOEs as SOE ownership reform pilots
Announced Hukou and public service transition procedure

25 This material must be read in conjunction with the “Important Information” statement on the last page and is not for redistribution.
China – More Sustainable Future Growth
Share of GDP: More
consumption; less
fixed asset
investment
Less reliance on
factories (Old
China); More on
Healthcare, IT and
consumers (New
China)
Source: China Strategy Morgan Stanley 6 November 2014
Red line shows the relative performance of New China stocks compared to Old China
stocks. Green line shows the MSCI China movement.

26 This material must be read in conjunction with the “Important Information” statement on the last page and is not for redistribution.
Commodity Prices – Fall in Oil Price More Good than Bad
Short term concern for deflation
Positive for consumers
Oil prices – Driven
by supply not post-
crisis demand
decline
Short term concern
for deflation
Positive for
consumers
Source: Bloomberg, BofA Merrill Lynch Global Research 30 October 2014
Impact of 10% decline in oil prices on Current
Account Balance (% GDP)
Declining oil prices pose threat to deflation

27 This material must be read in conjunction with the “Important Information” statement on the last page and is not for redistribution.
Asia and Real Interest Rate
Real interest rates remain generally high in Asia
The largest economy in Asia has room and is poised to further ease monetary conditions
Room for Easier
Monetary Policy
Source: CEIC, Goldman Sachs Global Investment Research 4 March 2015

28 This material must be read in conjunction with the “Important Information” statement on the last page and is not for redistribution.
China Playbook (continued)
Chinese stocks are
not yet in a bubble
Source: BCA Research, May 2015

29 This material must be read in conjunction with the “Important Information” statement on the last page and is not for redistribution.
India – Structural Story Remains (Demographic Potential)
Consumption is a
structural theme
Youngest population
globally
Growing middle
class and
aspirations
A revival in
investments
Source: CEIC Data Research Limited, Citi Equity Research 10 September 2014
Consumer and Business Loans (% GDP)
Youngest Population Globally
Source: Edelweiss Research, December 2013
Source: Morgan Stanley 29 April 2015
New Investment Projects (INR Bn)

30 This material must be read in conjunction with the “Important Information” statement on the last page and is not for redistribution.
India – Stock Picking with Strong Macro Tailwind
Long-term ROE versus PB
Long term Sensex EPS growth versus PE
Market retracement
puts PER and PB
below historical
averages
Multi-year growth –
sectors and stocks
to emerge
Opportunities in
Infrastructure and
Cyclical industries
Source: CLSA May 2015
Source: CLSA September 2014

31 This material must be read in conjunction with the “Important Information” statement on the last page and is not for redistribution.
Tourism – Grown Steadily
Chinese tourist now a global phenomenon and will continue
Increasing disposal incomes, Currency depreciation vis-à-vis Renminbi, Relaxed visa restrictions
Asia-Pacific accounted for 28.4% of the world’s inbound tourists in 2011
Tourism receipts were US$362.6bn, +16.7%
Tourism arrivals were 284m, +8%
International tourism
has recovered to
exceed pre-crisis
(2008-09) levels
Source: UN Economic and Social Commission for Asia Pacific Statistical Yearbook 2013, UN World Tourism Organization.
Outbound tourists:
+16.3% in 2014 to 114m, est.
Source: China National Tourism Administration June 2014. Travel China Guide for 2013.
Any sectors shown are for illustration purposes only and are not to be construed as investment recommendations.
Inbound Tourism Arrivals, World Regions,
1995-2001

32 This material must be read in conjunction with the “Important Information” statement on the last page and is not for redistribution.
Environment
The World needs to change, beginning with the world’s two largest economies
China and US signed bilateral agreement on climate change
Emissions cap by 2030
Target 20% clean energy usage by 2030
Singapore Skyline, 20 Jun 2013 (Top) and 20 Jan 2011
Source: ADB Economics Working Paper Benjamin Sovacool June 2014 News.cn, Xinhuanet..net . APEC Meeting, Beijing November 2014
Share of Greenhouse Gas Emissions of Top 10 countries, 2010
Any sectors shown are for illustration purposes only and are not to be construed as investment recommendations.

33 This material must be read in conjunction with the “Important Information” statement on the last page and is not for redistribution.
Healthcare: 1) Aging population
900mn people of
over 65 years old in
2050 in Asia
Some countries
including Korea,
Thailand and China
are of rapidly ageing
demographics
Any sectors shown are for illustration purposes only and are not to be construed as investment recommendations.
Population of over 65 years, 2015E & 2050E
Source: IMS Institute as of October 2014
0
10
20
30
40
50
60
70
80
90
1990 2010 2030 2050 2070
Republic of Korea
Japan
Thailand
China
Malaysia
Indonesia
India
(%)Estimate
Population trend of over 65 years, 1990-2070E

34 This material must be read in conjunction with the “Important Information” statement on the last page and is not for redistribution.
Healthcare: 2) Current low healthcare spend and poor medical infrastructure
An improved living standard will lift healthcare demands in Asia
The current poor medical infrastructure in Asia implies huge opportunities for the healthcare market
Relationship Between Healthcare Related Expenditure (relative to GDP)
and GDP per capita (2012)
Healt
hcare
rela
ted
exp
en
dit
ure
(re
lati
ve t
o G
DP
)
GDP per capita
Number of Doctors and Beds per 1,000 people (2011)
Source: OECD (Health at a Glance 2013) as of Oct 2014
Source: WHO, IMF (World Economic Outlook, April 2014)

35 This material must be read in conjunction with the “Important Information” statement on the last page and is not for redistribution.
Stock Examples Within the 4 Key Themes
Tourism- Hana Tour
7/13 10/13 1/14 4/14 7/14 10/14 1/15 4/15
50,000
60,000
70,000
80,000
90,000
100,000
110,000
120,000
130,000
140,000
150,000
Source: FactSet Prices
Closing Price
17-May-2013 to 18-May-2015 (Daily) Price (Local Currency)
Hanatour Service, Inc.
Market Cap US$1.4b
Net Debt to
Equity
Net cash
EPS CAGR (’14-
16)
36%
ROE (FY15e) 18.2
P/E Ratio (FY15e) 30 X
Div Yield
(FY154e)
1.1%
Why we bought Hana Tour:
Market leader in Korea with 21% MS
Structural Growth in outbound travel,
driven by aging population, increasing leave entitlements and air seat supply
Recovery in consumption post the Sewel ferry accident
Meetings with management: 6
BUY 7/12 10/12 1/13 4/13 7/13 10/13 1/14 4/14 7/14 10/14 1/15 4/15
20
25
30
35
40
45
50
55
60
Source: FactSet Prices
Closing Price
18-May-2012 to 19-May-2015 (Daily) Price (Local Currency)
AIA Group Limited
Market Cap US$80bn
RBC Solvency
Ratio
430% (regulatory min.
150%)
EPS CAGR (’14-
16)
12.2%
ROE (FY15e) 11.5%
P/E Ratio (FY15e) 19.7 X
Div Yield
(FY154e)
1.1%
Why we bought AIA Group:
Long term structural demand for life
insurance across Asia as societies mature and wealth increases
Leading Life Insurance franchise – focused on highly profitable protection centric products
Most prudent investment allocation framework inline with insurance best principals
Largest capital reserves in Asia to sustain organic growth, dividends and to aid future bancassurance partnerships
Meetings with Management: 4
Insurance – AIA Group
Source: FactSet as of May 19, 2015 Source: FactSet as of May 20, 2015
BUY
Source: FactSet
Source: FactSet Any securities shown are illustration purposes only and are not intended as a recommendation to buy or hold these securities, and their continued inclusion in the Asia ex-Japan strategy’s representative portfolio is not guaranteed. Above information is based on historical data and does not guarantee future investment performance.

36 This material must be read in conjunction with the “Important Information” statement on the last page and is not for redistribution.
Stock Examples Within the 4 Key Themes (continued)
Environment – CT Environmental Group
Market Cap US$2.1b
Net Debt to
Equity
62%
EPS CAGR (’14-
16)
34.5%
ROE (FY15e) 26.5%
P/E Ratio (FY15e) 27 X
Div Yield (FY15e) 0.6%
Why we bought CT Environmental
Group:
Renewed, greater focus on
environment in13th FYP, particularly on water treatment
Dominant 3rd party industrial waste-water treatment player - a sector with high barriers to entry, with demonstrated ability to grow capacity
Reliance on a build-own-operate model offers higher profitability, lower working capital drain, and greater transparency
Meetings with Management: 1
Market Cap US$4.1b
Net Debt to
Equity
2.0%
EPS CAGR (’14-
16)
16.9%
ROE (FY15e) 29.1%
P/E Ratio (FY15e) 23.6x
Div Yield (FY15e) 1.2%
Why we bought China Medical
Systems:
Strong product portfolio established by
management team with track record of identifying drugs with good market potential & exclusivity
Well-established direct sales network with access to more than 12,000 hospitals in China
Key drugs in portfolio treat lifestyle diseases of today: depression, liver cirrhosis, heart failure
Best-in-class profitability and ROE
Meetings with Management: 8
Healthcare – China Medical System
7/13 10/13 1/14 4/14 7/14 10/14 1/15 4/15
0
2
4
6
8
10
12
Source: FactSet Prices
Closing Price
17-May-2013 to 19-May-2015 (Daily) Price (Local Currency)
CT Environmental Group Ltd.
BUY
Source: Bloomberg Source: FactSet
Any securities shown are illustration purposes only and are not intended as a recommendation to buy or hold these securities, and their continued inclusion in the Asia ex-Japan strategy’s representative portfolio is not guaranteed. Above information is based on historical data and does not guarantee future investment performance.
Source: FactSet as of May 20, 2015
7/12 10/12 1/13 4/13 7/13 10/13 1/14 4/14 7/14 10/14 1/15 4/15
2
4
6
8
10
12
14
16
Source: FactSet Prices
Closing Price
18-May-2012 to 20-May-2015 (Daily) Price (Local Currency)
China Medical System Holdings Ltd.
Source: FactSet as of May 20, 2015
BUY

37 This material must be read in conjunction with the “Important Information” statement on the last page and is not for redistribution.
Asia ex-Japan: Investment Approach
Style Agnostic
Stock selection and stock weightings driven by view and
conviction, not the benchmark
Mid to large cap, Preference for liquid stocks
Benchmark Unaware
Bottom-up Stock
Pickers
Fundamental
Research Driven
Universe
Focused Portfolios
Investment Horizon
Portfolios are predominantly constructed through bottom-up
stock selection
Identification of mis-priced stocks through fundamental
research
Portfolio holds between 40 to 60 stocks
Generally greater than 3 years
38 This material must be read in conjunction with the “Important Information” statement on the last page and is not for redistribution.
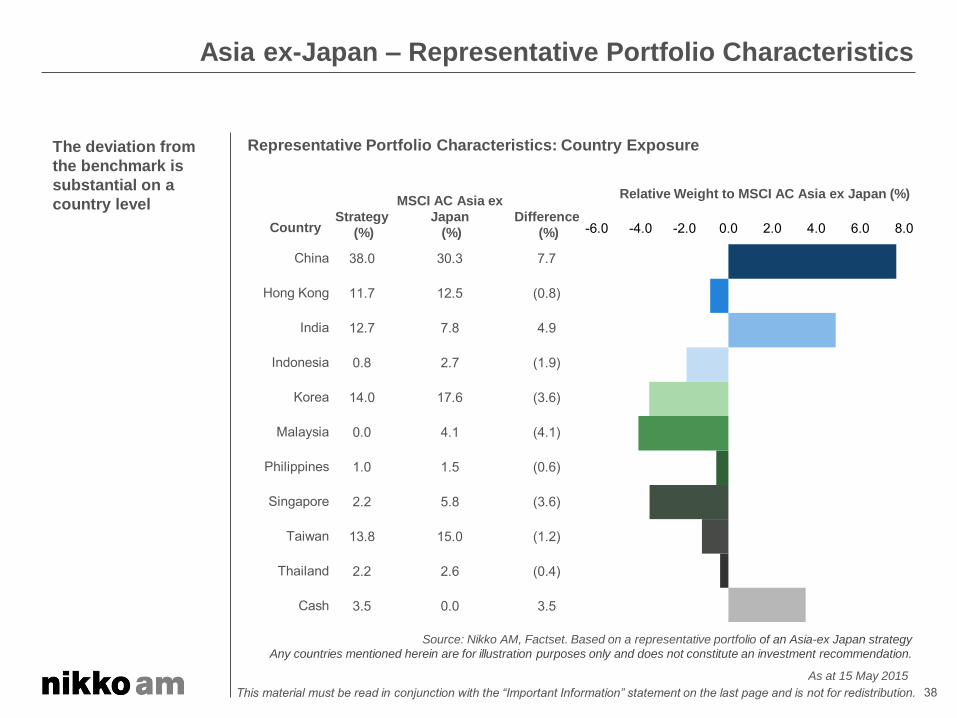
Asia ex-Japan – Representative Portfolio Characteristics
Representative Portfolio Characteristics: Country Exposure
The deviation from
the benchmark is
substantial on a
country level
Country Strategy
(%)
MSCI AC Asia ex
Japan
(%)
Difference
(%)
China 38.0 30.3 7.7
Hong Kong 11.7 12.5 (0.8)
India 12.7 7.8 4.9
Indonesia 0.8 2.7 (1.9)
Korea 14.0 17.6 (3.6)
Malaysia 0.0 4.1 (4.1)
Philippines 1.0 1.5 (0.6)
Singapore 2.2 5.8 (3.6)
Taiwan 13.8 15.0 (1.2)
Thailand 2.2 2.6 (0.4)
Cash 3.5 0.0 3.5
Relative Weight to MSCI AC Asia ex Japan (%)
Source: Nikko AM, Factset. Based on a representative portfolio of an Asia-ex Japan strategy
Any countries mentioned herein are for illustration purposes only and does not constitute an investment recommendation.
As at 15 May 2015
-6.0 -4.0 -2.0 0.0 2.0 4.0 6.0 8.0

39 This material must be read in conjunction with the “Important Information” statement on the last page and is not for redistribution.
Asia ex-Japan - Representative Portfolio Characteristics (continued)
Representative Portfolio Characteristics: Sector Exposure The deviation from
the benchmark is
substantial on a
sector level
Sector Strategy
(%)
MSCI AC
Asia ex
Japan
(%)
Difference
(%)
Consumer Discretionary 5.3 8.0 (2.7)
Consumer Staples 7.5 5.0 2.5
Energy 1.4 5.1 (3.6)
Financials 34.4 34.2 0.2
Healthcare 12.1 1.9 10.1
Industrials 4.2 9.0 (4.8)
Information Technology 20.9 21.8 (0.9)
Materials 0.0 4.7 (4.7)
Telecommunications 3.7 6.4 (2.7)
Utilities 7.0 3.9 3.1
Cash 3.5 0.0 3.5
Relative Weight to MSCI AC Asia ex Japan (%)
Source: Nikko AM, Factset. Based on a representative portfolio of an Asia-ex Japan strategy
Any sectors mentioned herein are for illustration purposes only and does not constitute an investment recommendation.
recommendation As at 15 May 2015
-6.0 -4.0 -2.0 0.0 2.0 4.0 6.0 8.0 10.0 12.0

40 This material must be read in conjunction with the “Important Information” statement on the last page and is not for redistribution.
Stock Examples Within Japan
Sony
Market Cap JPY 34.6bn
Net Debt to
Equity
-2%
EPS CAGR (’14-
16)
Back in black
ROE (FY15e) 6.0%
P/E Ratio (FY15e) 25.4 X
Div Yield (FY15e) 0.25%
Why we bought Sony:
Conviction on aggressive restructuring
under the new leadership (new CEO and CFO)
Sony brand is alive and asset sales have helped finance R&D for future business development.
Now ready to be on the offensive and leverage its capabilities in software, gaming and entertainment businesses.
Financial services business is solid.
New ROE target of 10%.
Market Cap JPY4.0bn
Net Debt to
Equity
68%
EPS CAGR (’14-
16)
48.8%
ROE (FY15e) 8.1%
P/E Ratio (FY15e) 18.1x
Div Yield (FY15e) 1.2%
Why we bought Toray:
Positive outlook on carbon fiber
demand and the company’s
competitive advantage.
Sole supplier to Boeing for its 787 Dreamliner. Recently won business from BMW, with plans to expand capacity.
New ROE target of 10%.
Toray
BUY
Source: Bloomberg Source: Bloomberg
Any securities shown are illustration purposes only and are not intended as a recommendation to buy or hold these securities, and their continued inclusion in the Japan Value equity strategy’s representative portfolio is not guaranteed. Above information is based on historical data and does not guarantee future investment performance.
Source: Bloomberg as of May 25, 2015 Source: Bloomberg as of May 25, 2015
0
500
1,000
1,500
2,000
2,500
3,000
3,500
4,000
4,500
Closing Price 30-Dec-2013 to 22-May-2015 (Daily)
0
200
400
600
800
1,000
1,200
Closing Price 30-Dec-2013 to 22-May-2015 (Daily)

41 This material must be read in conjunction with the “Important Information” statement on the last page and is not for redistribution.
Japan Value Equity: Investment Approach
Style Fundamental/Contrarian, Active Management
Mid to large cap, preference for liquid stocks
Bottom-up Stock
Pickers
Fundamental
Research Driven
Universe
Focused Portfolios
Investment Horizon
Portfolios are predominantly constructed through bottom-up
stock selection
Identification of mis-priced stocks and turnaround
opportunities through fundamental research
Portfolio holds approximately 80 to 100 stocks
Generally 3-5 years

.
42 This material must be read in conjunction with the “Important Information” statement on the last page and is not for redistribution.
Japan Value Equity– Strategy Characteristics
The data above is based on a representative account of the Japan Value Equity Strategy The graph and table are based on past data and do not guarantee future returns.
Any sectors mentioned herein are for illustration purposes only and does not constitute an investment recommendation.
The portfolio
maintains an
overweight position
in the Materials,
Industrials and
Consumer
Discretionary
sectors, while it is
underweight
Consumer Staples,
Health Care and
Financials
As at 31 March 2015
GICS10 Sectors 201503 Sector Allocation Vs. Benchmark QoQ Active Sector Exposure
SectorNo. of
StocksPortfolio TOPIX Difference
Energy 2 1.45% 0.89% 0.55%
Materials 15 13.04% 6.92% 6.12%
Industrials 24 23.21% 20.87% 2.34%
Consumer Discretionary 22 25.13% 21.72% 3.41%
Consumer Staples 2 3.27% 7.89% -4.62%
Health Care 2 1.72% 6.51% -4.79%
Financials 12 13.61% 17.42% -3.81%
Information Technology 12 11.01% 10.94% 0.07%
Telecommunication Services 2 3.00% 4.84% -1.84%
Utilities 2 2.37% 2.00% 0.38%
Other* 2.20% 0.00% 2.20%
Total 95 100.00% 100.00%
0% 5% 10% 15% 20% 25%
Portfolio TOPIX
-5% 0% 5% 10%
201412 201503
* Includes cash

43 This material must be read in conjunction with the “Important Information” statement on the last page and is not for redistribution.
Summary
Favorable macro environment for Asian equity active managers
Uneven growth
Lower inflation
Lower oil price
Better prepared for the US interest rate hike
Long term strong equity market performance and current cheap level of valuation
Reform is a key in 2015. Positive for China and India
Wage growth, demographics and growing middle class implies four
promising sectors in particular healthcare
Asia is still growing
strongly
Any sectors shown are for illustration purposes only and are not to be construed as investment recommendations.

44
Nikko Asset Management Asia Limited
12 Marina View, #18-02 Asia Square Tower 2, Singapore 018961 Tel: (65) 6500 5700 Fax: (65) 6534 5183 Co. Registration No. 198202562H
This document is prepared by Nikko Asset Management Co., Ltd. This document is for information only with no consideration given to the specific investment objective, financial situation and particular needs of any specific person. Any securities mentioned herein are for illustration purposes only and should not be construed as a recommendation for investment. You should seek advice from a financial adviser before making any investment. In the event that you choose not to do so, you should consider whether the investment selected is suitable for you. Investments in unit trusts are not deposits in, obligations of, or guaranteed or insured by Nikko Asset Management Asia Limited (“Nikko AM Asia”). Past performance or any prediction, projection or forecast is not indicative of future performance. The portfolios may use or invest in financial derivative instruments. The value of portfolios and income from them may fall or rise. Investments in the portfolios are subject to investment risks, including the possible loss of principal amount invested. The information contained herein may not be copied, reproduced or redistributed without the express consent of Nikko AM Asia. While reasonable care has been taken to ensure the accuracy of the information as at the date of publication, Nikko AM Asia does not give any warranty or representation, either express or implied, and expressly disclaims liability for any errors or omissions. Information may be subject to change without notice. Nikko AM Asia accepts no liability for any loss, indirect or consequential damages, arising from any use of or reliance on this document.
Important Information