asia connect center-hsg: a performance review of european institutional frameworks
TRANSCRIPT

MARKET ENTRY/EXPANSION FOR ASIAN COMPANIES IN EUROPE:
A CRITICAL REVIEW OF THE EUROPEAN
INSTITUTIONAL FRAMEWORK
Dr. Roger Moser
Director, Asia Connect Center, University of St.Gallen (HSG)
Adjunct Professor, IIM Udaipur,
Visiting Faculty, IIM Bangalore
www.acc.unisg.ch
[email protected] / [email protected] / [email protected]
Switzerland/India, 2013

Europe
• Combined the largest economy in the
world
• Largest economies: • Germany • France • United Kingdom • Italy • Spain
• Europe is marked by a large divide;
• Culture • Wealth • Institutions
Starting Point: Europe is still one of the most relevant and interesting markets in the world: Wealth, Innovation, Infrastructure, Consumer Markets…

Overview: From an institutional perspective, Europe is divided into three major areas [1/2].
EU 17 – Euro area EU – Souvereign
Description: Countries using the single Euro currency. Countries include: Austria, Belgium, Cyprus, Estonia, Finland, France, Germany, Greece, Ireland, Italy, Luxembourg, Malta, Netherlands, Portugal, Slovakia, Slovenia, Spain.
Description: Countries in the European Union, not using the Euro currency. Countries include: Bulgaria, Czech Republic, Denmark, Hungary, Latvia, Lithuania, Poland, Romania, Sweden, United Kingdom.

Overview: From an institutional perspective, Europe is divided into three major areas [2/2].
Non-EU
Description: Countries outside the European Union. Countries include: Albania, Belarus, Bosnia, Croatia, Iceland, Kosovo, Macedonia, Moldova, Montenegro, Norway, Serbia, Switzerland, Ukraine.
Comparison
Critical analysis is done through the comparison of six “exemplar” countries within the three separate regions. Seleted comparison variables (28 in total) are categorized according to personal wealth, country wealth and ease of doing business (see appendix for full details).
EU-17: France and Germany The two largest economies in the Eurozone. On monetary level, very intertwined due to its common currency, the Euro.
EU-Souvereign: Sweden and the UK Two strong economies of the Eurogroup, not using the single currency. Able to set (largerly) their own monetary policy concerning currency. Highly dependent upon Eurogroup however.
Non-EU: Norway and Switzerland Complete souvereign economies. Full-control over policy setting.

Status Quo: When comparing the three groups the non-EU members are performing best from an institutional perspective [1/2].
EU-17
EU-Souvereign
Non-EU
Non-EU performing best
Highest wealth, personal & finance • Highest GDP per capita • Highest national savings rate (to national GDP) • Lowest inflation rates • Switzerland shows highest quality of living • Norway ranks #1 in personal development
High security • Lowest national unemployment rates • Lowest crime rates Efficient government • High government spending per capita • Government budget surpluses Business friendly environment • Switzerland ranks #1 in 5 out of 7 criteria • Highest business investment rates (to national GDP)
Broad outperformance

#3 – EU-17
Germany scores significantly better than France • France scores lowest in ease of doing business, as
well as general country wealth indicators • Germany competitive in government efficiency and
costs of doing business
High equality • France, on the other hand, has the least number of
households living below the poverty line, this however goes at the cost of government efficieny (high government spending per capita, as well as a large budget deficit)
Business unfriendly environment • France has an excessive business-unfriendly
environment, scoring lowest on all 7 measures • Germany scores average
Significant within-group differences
#2 – EU-Souvereign
Large differences within group • Sweden performing significantly better than UK • Difference large in personal wealth indicators;
personal freedom, quality of living and inequality • GDP per capital, savings as well as inflation show
large differences, attributed to differing monetary strategies, and effect of crisis on important sectors
Country wealth indicators similar • Country governance, in institutional framework as
well as efficiency of legal framework, outperforms EU-17
• Infrastructure and government efficiency within the group score average overall
Business friendly environment • Competitive corporate income tax and social
security system • Burden of regulation is lower than the EU-17 group
Eurocrisis significantly impeding EU-17
Status Quo: When comparing the three groups the non-EU members are performing best from an institutional perspective [2/2].

Future developments in Europe: There is a lot of uncertainty about the further institutional developments in Europe [1/3].
Economical - crisis Low growth • Growth rates low, or even negative, for a sustained
period. Looking for growth in far-away countries • Inability to stimulate economy
Uncompetitiveness • Large economies uncompetitive, due to high labour
costs, uncooperative institutions
Access to financing • Investment is halted, due to banking crisis • Failure to create a platform for future growth
Debt - crisis
“Currency war”
Unsustainable debt levels • Due to shrinking GDP and government stimulants,
Government households becoming unsustainable Trade-off between stimulus and sustainability • Governments have to choose between stimulating
their economies and reducing unemployment, at the risk of going bankrupt (due to high debt yields)
Ineffective governments • Governments unwilling to make tough decisions,
due to fear of losing elections
Stimulus packages • Extensive stimulus packages introduced by various
national banks (US, Japan, UK) • Result in weaker currencies in countries that receive
stimulus (Dollar, Yen and Pound)
Adverse affects • “Stronger” countries see stronger currencies (due to
lower inflation expectations) • Puts a halt on export growth
• Countries with competitive, export driven, economies are to benefit
• Governments and national banks need the power to decisively act, to, e.g., stimulate the economy or reform their economies
• Access to financing and human development is crucial for long-term development

#2 – EU-Souvereign
Divide between countries • United Kingdom is facing increasing difficulties,
wherin stimulting measures are not taking the desired effect
• Sweden is stimulating the economy, still the budget deficit remains very small, and the economy is growing
Favourable business environment • Both countries show business friendly
environments, although Sweden’s costs of social security is significantly higher
Personal wealth • Sweden’s population has high wealth, savings levels
and social security, combined with lower inflation results in a confident economy
• UK has low wealth, social security and employment wherin confidence in the economy is low
Sustainable leading position
#1 – Non-EU
Effective action by governments • Both Switzerland and Norway have been acting
decisively during the crisis, protecting and stimulating their economies to good effect
• More power to act by governments, due to budget surpluses and strong economies
Investment in the future • Education and human development are important
factors within these countries, providing fertile ground for future development
• Leading business investment rates Business friendly environment • Economies prove attractive to companies, given the
ease of doing business as well as the superior living conditions within these countries
• Low inflation environments supporting further investments
Divide, Sweden model superior
Future developments in Europe: There is a lot of uncertainty about the further institutional developments in Europe [2/3].

#3 – EU-17 Non-effective government action • Budget pressures, due to EU regulation • Appropriate actions for all the Euro economies hard
to define, give the large differences between the individual economies
• Stimulation (like Japan, UK and US) fended off due to inflationary fears, holding back exports
Large economies impeded • Economies like Spain and France in difficulties, with
high budget deficits, high unemployment • Reforms in labour markets are not decisively
implemented by the governments (often with public unrest)
European wide recovery slow • Due to the intertwinement of the countries in the
single currency, healthier countries like Germany are slowed down due to lower demand for their products in the internal EU market
• Further integration (e.g. Eurobonds), to even out the differences between countries, will take a long time to materialize, if at all
Future Expectations EU-17
• Long-term low growth environment • High unemployment to sustain, due to low
confidence in the economy, resulting in low investments in new employment
• More displeasure amongst the population, due to unemployment, lower purchasing power (higher inflation), deteriorating infrastructure and investments in education Lower personal wealth
EU-Souvereign
• Large divide between separate countries, due to different monetary and political directions
• Sweden model to come out of the crisis with significant advantages over the UK, and the EU-17; especially in the personal wealth sphere
Non-EU • Strong growth of non-EU countries. Able to set their
own policies, with reliable governments and currencies, resulting in large confidence
• Low inflation; companies continue investing in these countries, at the expense of other European countries
Future developments in Europe: There is a lot of uncertainty about the further institutional developments in Europe [3/3].

Comparison: Indicators for an analysis of the three institutional ‘models’ in Europe.
Type Measure Source measure
Wealth indicators
Financial GDP per capita PPP (2012) Worldfactbook Absolute
Gross national savings, % of GDP (2011) World competitiveness report Percentage
Inflation rate (2011 year average) World competitiveness report Percentage
Below poverty line Worldfactbook
Security Organized crime World competitiveness report Rank 1-7 (+)
Job security (Unemployment) Worldfactbook Percentage
Personal Life expectancy Worldfactbook Absolute in years
Education/development HD Index - United Nations 0-1 (+)
Personal freedom Legatum Prosperity index Rank (worldwide)
Quality of living (capital city) Mercer Rank (worldwide)
Inequality index Gini index (Worldfactbook) 0-100 (100=unequality)
Country wealth indicators
Governance Institutional framework World competitiveness report Rank 1-7 (+) combined score
Efficiency of Legal framework World competitiveness report Rank 1-7 (+) combined score
Infrastructure Quality of overall infrastructure World competitiveness report Rank 1-7 (+) combined score
Quality of electricity supply World competitiveness report Rank 1-7 (+)
Mobile phone connections World competitiveness report Absolute/100
Government efficiency Government spending per capita Worldfactbook Absolute
Government spending / GDP (PPP) Worldfactbook Factor
Government budget surplus/deficit of GDP Worldfactbook Percentage
10 year bond interest yield Wall street journal Percentage
Investment Gross investment business/ GDP Worldfactbook Percentage
Doing Business
Costs Corporate income taxes KPMG report Percentage
Employer effective social security rates KPMG report $100,000 income Percentage
Employer effective social security rates KPMG report $300,000 income Percentage
Framework Irregular payments and bribes World competitiveness report Rank 1-7 (+)
cost of crime and violence World competitiveness report Rank 1-7 (+)
Bureaucracy Burden of regulation World competitiveness report Rank 1-7 (+)
Effective governance Legatum Prosperity index Rank (worldwide)
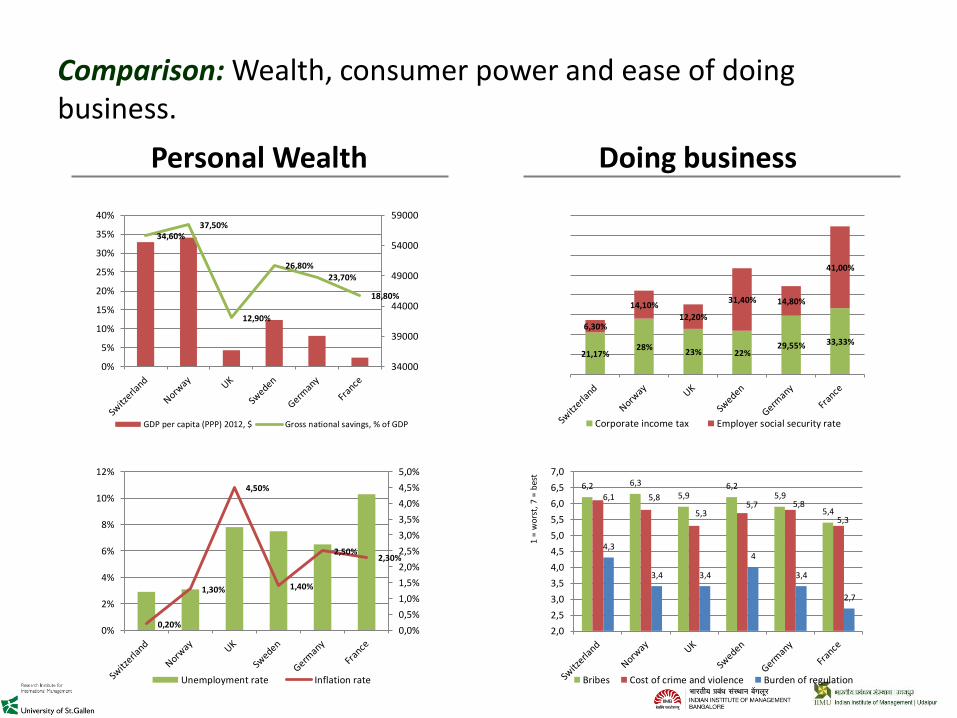
34,60% 37,50%
12,90%
26,80%
23,70%
18,80%
34000
39000
44000
49000
54000
59000
0%
5%
10%
15%
20%
25%
30%
35%
40%
GDP per capita (PPP) 2012, $ Gross national savings, % of GDP
0,20%
1,30%
4,50%
1,40%
2,50% 2,30%
0,0%
0,5%
1,0%
1,5%
2,0%
2,5%
3,0%
3,5%
4,0%
4,5%
5,0%
0%
2%
4%
6%
8%
10%
12%
Unemployment rate Inflation rate
Personal Wealth Doing business
21,17% 28%
23% 22% 29,55% 33,33%
6,30%
14,10%
12,20%
31,40% 14,80%
41,00%
Corporate income tax Employer social security rate
6,2 6,3
5,9 6,2
5,9
5,4
6,1 5,8
5,3 5,7 5,8
5,3
4,3
3,4 3,4
4
3,4
2,7
2,0
2,5
3,0
3,5
4,0
4,5
5,0
5,5
6,0
6,5
7,0
Bribes Cost of crime and violence Burden of regulation
1 =
wo
rst,
7 =
bes
t
Comparison: Wealth, consumer power and ease of doing business.

Country Wealth Government efficiency
54600 55300
36700
41700 39100
35500
26401
43767
18660
31723
18571
22107
15000
20000
25000
30000
35000
40000
45000
50000
55000
60000
GDP per capita (PPP) 2012, $ Government spending per capita
5,7 5,5
5,3
5,6
5
4,5
6,6
5,2
5,6 5,8
6,2 6,4
4,0
4,5
5,0
5,5
6,0
6,5
7,0
Legal framework efficiency Quality of infrastructure
0,62%
2,18%
1,77% 1,64%
1,30%
1,83%
-1,50%
-1,00%
-0,50%
0,00%
0,50%
1,00%
1,50%
2,00%
2,50%
-10%
-5%
0%
5%
10%
15%
Government budget surplus Government 10 year bond yield
1 =
wo
rst,
7 =
bes
t
0,20%
1,30%
4,50%
1,40%
2,50%
2,30%
0,00%
0,50%
1,00%
1,50%
2,00%
2,50%
3,00%
3,50%
4,00%
4,50%
5,00%
0%
5%
10%
15%
20%
25%
Gross business investment / GDP Inflation rate
Comparison: Country wealth and government efficiency.
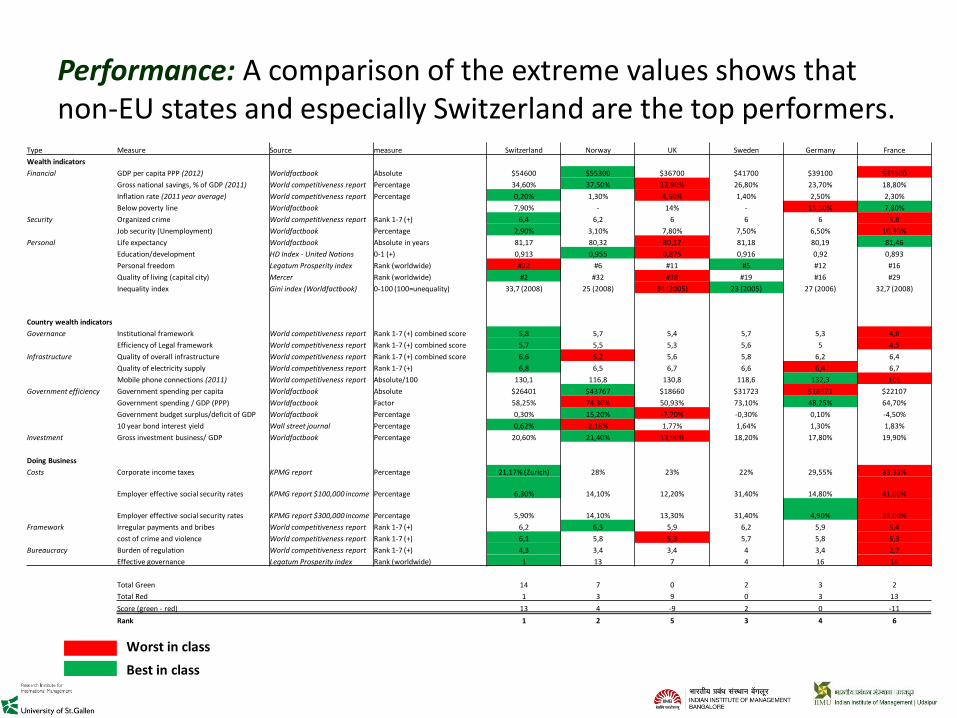
Best in class
Worst in class
Type Measure Source measure Switzerland Norway UK Sweden Germany France
Wealth indicators
Financial GDP per capita PPP (2012) Worldfactbook Absolute $54600 $55300 $36700 $41700 $39100 $35500
Gross national savings, % of GDP (2011) World competitiveness report Percentage 34,60% 37,50% 12,90% 26,80% 23,70% 18,80%
Inflation rate (2011 year average) World competitiveness report Percentage 0,20% 1,30% 4,50% 1,40% 2,50% 2,30%
Below poverty line Worldfactbook 7,90% - 14% - 15,50% 7,80%
Security Organized crime World competitiveness report Rank 1-7 (+) 6,4 6,2 6 6 6 5,8
Job security (Unemployment) Worldfactbook Percentage 2,90% 3,10% 7,80% 7,50% 6,50% 10,30%
Personal Life expectancy Worldfactbook Absolute in years 81,17 80,32 80,17 81,18 80,19 81,46
Education/development HD Index - United Nations 0-1 (+) 0,913 0,955 0,875 0,916 0,92 0,893
Personal freedom Legatum Prosperity index Rank (worldwide) #22 #6 #11 #5 #12 #16
Quality of living (capital city) Mercer Rank (worldwide) #2 #32 #38 #19 #16 #29
Inequality index Gini index (Worldfactbook) 0-100 (100=unequality) 33,7 (2008) 25 (2008) 34 (2005) 23 (2005) 27 (2006) 32,7 (2008)
Country wealth indicators
Governance Institutional framework World competitiveness report Rank 1-7 (+) combined score 5,8 5,7 5,4 5,7 5,3 4,8
Efficiency of Legal framework World competitiveness report Rank 1-7 (+) combined score 5,7 5,5 5,3 5,6 5 4,5
Infrastructure Quality of overall infrastructure World competitiveness report Rank 1-7 (+) combined score 6,6 5,2 5,6 5,8 6,2 6,4
Quality of electricity supply World competitiveness report Rank 1-7 (+) 6,8 6,5 6,7 6,6 6,4 6,7
Mobile phone connections (2011) World competitiveness report Absolute/100 130,1 116,8 130,8 118,6 132,3 105
Government efficiency Government spending per capita Worldfactbook Absolute $26401 $43767 $18660 $31723 $18571 $22107
Government spending / GDP (PPP) Worldfactbook Factor 58,25% 74,30% 50,93% 73,10% 48,25% 64,70%
Government budget surplus/deficit of GDP Worldfactbook Percentage 0,30% 15,20% -7,70% -0,30% 0,10% -4,50%
10 year bond interest yield Wall street journal Percentage 0,62% 2,18% 1,77% 1,64% 1,30% 1,83%
Investment Gross investment business/ GDP Worldfactbook Percentage 20,60% 21,40% 13,90% 18,20% 17,80% 19,90%
Doing Business
Costs Corporate income taxes KPMG report Percentage 21,17% (Zurich) 28% 23% 22% 29,55% 33,33%
Employer effective social security rates KPMG report $100,000 income Percentage 6,30% 14,10% 12,20% 31,40% 14,80% 41,00%
Employer effective social security rates KPMG report $300,000 income Percentage 5,90% 14,10% 13,30% 31,40% 4,90% 39,00%
Framework Irregular payments and bribes World competitiveness report Rank 1-7 (+) 6,2 6,3 5,9 6,2 5,9 5,4
cost of crime and violence World competitiveness report Rank 1-7 (+) 6,1 5,8 5,3 5,7 5,8 5,3
Bureaucracy Burden of regulation World competitiveness report Rank 1-7 (+) 4,3 3,4 3,4 4 3,4 2,7
Effective governance Legatum Prosperity index Rank (worldwide) 1 13 7 4 16 18
Total Green 14 7 0 2 3 2
Total Red 1 3 9 0 3 13
Score (green - red) 13 4 -9 2 0 -11
Rank 1 2 5 3 4 6
Performance: A comparison of the extreme values shows that non-EU states and especially Switzerland are the top performers.

Type Measure Switzerland Norway UK Sweden Germany France
Wealth indicators
Financial GDP per capita PPP (2012) 5 6 2 4 3 1
Gross national savings, % of GDP (2011) 5 6 1 4 3 2
Inflation rate (2011 year average) 6 5 1 4 2 3
Below poverty line 5 - 4 - 3 6
Security Organized crime 6 5 4 4 4 1
Job security (Unemployment) 6 5 2 3 4 1
Personal Life expectancy 4 3 1 5 2 6
Education/development 3 6 1 4 5 2
Personal freedom 1 5 4 6 3 2
Quality of living (capital city) 6 2 1 4 5 3
Inequality index 2 5 1 6 4 3
Country wealth indicators
Governance Institutional framework 6 5 3 5 2 1
Efficiency of Legal framework 6 4 3 5 2 1
Infrastructure Quality of overall infrastructure 6 1 2 3 4 5
Quality of electricity supply 6 2 5 3 1 5
Mobile phone connections 4 2 5 3 6 1
Government efficiency Government spending per capita 4 6 2 5 1 3
Government spending / GDP (PPP) 4 1 5 2 6 3
Government budget surplus/deficit of GDP 5 6 1 3 4 2
10 year bond interest yield 6 1 3 4 5 2
Investment Gross investment business/ GDP 5 6 1 3 2 4
Doing Business
Costs Corporate income taxes 6 3 4 5 2 1
Employer effective social security rates 6 3 5 2 4 1
Employer effective social security rates 5 3 4 2 6 1
Framework Irregular payments and bribes 5 6 3 5 3 1
cost of crime and violence 6 5 2 3 5 2
Bureaucracy Burden of regulation 6 4 4 5 4 1
Effective governance 6 3 4 5 2 1
Total Score 141 109 78 107 97 65
Rank 1 2 5 3 4 6
Performance: A comparison of all indicators shows that non-EU states and especially Switzerland are the top performers.

Getting started: Do not hesitate to contact the “Gateway-to-Europe Lab” of the ASIA CONNECT Center for support for your market entry/expansion activities in Europe.
ASIA CONNECT Center-HSG Dr. Roger Moser, Director University of St.Gallen Dufourstrasse 40a CH-9000 St.Gallen, Switzerland Tel: +41 71 224 73 54 E-mail: [email protected] Web: www.acc.unisg.ch