asia bond monitor asia bond monitor - asian...
TRANSCRIPT

ASIA BOND MONITORMarch 2014
Asia Bond Monitor March 2014
This publication reviews recent developments in East Asian local currency bond markets along with the outlook, risks, and policy options. It covers the 10 members of the Association of Southeast Asian Nations plus the People’s Republic of China; Hong Kong, China; and the Republic of Korea.
About the Asian Development Bank
ADB’s vision is an Asia and Pacific region free of poverty. Its mission is to help its developing member countries reduce poverty and improve the quality of life of their people. Despite the region’s many successes, it remains home to two-thirds of the world’s poor: 1.7 billion people who live on less than $2 a day, with 828 million struggling on less than $1.25 a day. ADB is committed to reducing poverty through inclusive economic growth, environmentally sustainable growth, and regional integration.
Based in Manila, ADB is owned by 67 members, including 48 from the region. Its main instruments for helping its developing member countries are policy dialogue, loans, equity investments, guarantees, grants, and technical assistance.
Asian Development Bank6 ADB Avenue, Mandaluyong City1550 Metro Manila, Philippineswww.adb.org
Printed in the Philippines Printed on recycled paper

ASIA BOND MONITORMarch 2014

The Asia Bond Monitor (ABM) is part of the Asian Bond Markets Initiative (ABMI), an ASEAN+3 initiative supported by the Asian Development Bank. This report is part of the implementation of a technical assistance project funded by the Investment Climate Facilitation Fund of the Government of Japan.
This edition of the ABM was prepared by a team from the Office of Regional Economic Integration (OREI) headed by Iwan J. Azis and supervised by OREI Director Arjun Goswami. The production of the ABM was led by Thiam Hee Ng and supported by the AsianBondsOnline (ABO) team. ABO team members include Angelica Andrea Cruz, Russ Jason Lo, Aldwin Mamiit, Carlo Monteverde, Rachelle Paunlagui, Roselyn Regalado, Angelo Taningco, and Shu Wang. Mitzirose Legal and Maria Criselda Lumba provided operational support; Kevin Donahue provided editorial assistance; and Principe Nicdao did the typesetting and layout.
How to reach us:Asian Development Bank Office of Regional Economic Integration6 ADB Avenue, Mandaluyong City1550 Metro Manila, PhilippinesTel +63 2 632 6688Fax +63 2 636 2183E-mail: [email protected]
Download the ABM athttp://www.asianbondsonline.adb.org/documents/abm_mar_2014.pdf
The Asia Bond Monitor—March 2014 was prepared by ADB’s Office of Regional Economic Integration and does not neces sarily reflect the views of ADB's Board of Governors or the countries they represent.
© 2014 Asian Development Bank
All rights reserved. Published in 2014. Printed in the Philippines.
ISSN 2219-1518 (Print), 2219-1526 (PDF)ISBN 978-92-9254-442-3 (Print), 978-92-9254-443-0 (PDF)Publication Stock No. RPS146338-2
Cataloging-in-Publication Data
Asian Development Bank.Asia Bond Monitor—March 2014.
Mandaluyong City, Philippines: Asian Development Bank, 2014.
1. Regionalism. 2. Subregional cooperation. 3. Economic development. 4. Asia.I. Asian Development Bank.
The views expressed in this publication are those of the authors and do not necessarily reflect the views and policies of the Asian Development Bank (ADB) or its Board of Governors or the governments they represent. ADB does not guarantee the accuracy of the data included in this publication and accepts no responsibility for any consequence of their use. Use of the term “country” does not imply any judgment by the authors or ADB as to the legal or other status of any territorial entity. “Asia” refers only to ADB’s Asian member economies.
ADB encourages printing or copying information exclusively for personal and noncommercial use with proper acknowledgment of ADB. Users are restricted from reselling, redistributing, or creating derivative works for commercial purposes without the express, written consent of ADB.
6 ADB Avenue, Mandaluyong City1550 Metro Manila, PhilippinesTel +63 2 632 4444Fax +63 2 636 4444www.adb.org
For orders, please contact:Public Information CenterFax +63 2 636 [email protected]
Printed on recycled paper

Contents
Emerging East Asian Local CurrencyBond Markets: A Regional UpdateHighlights �������������������������������������������������������������������������������������������������������������������� 2
Global and Regional Market Developments ������������������������������������������������������������������ 4
Bond Market Developments in the Fourth Quarter of 2013 ������������������������������������������� 8
Policy and Regulatory Developments ���������������������������������������������������������������������������� 23
Sukuk in Emerging East Asia: Trends and Future Challenges ����������������������������������������� 26
Market Summaries
People’s Republic of China ������������������������������������������������������������������������������������������������� 44
Hong Kong, China ������������������������������������������������������������������������������������������������������������� 50
Indonesia ����������������������������������������������������������������������������������������������������������������� 53
Republic of Korea ����������������������������������������������������������������������������������������������������� 59
Malaysia ������������������������������������������������������������������������������������������������������������������� 65
Philippines ���������������������������������������������������������������������������������������������������������������� 71
Singapore ���������������������������������������������������������������������������������������������������������������� 77
Thailand ������������������������������������������������������������������������������������������������������������������� 81
Viet Nam ������������������������������������������������������������������������������������������������������������������ 86


Emerging East Asian Local Currency Bond Markets: A Regional Update 1D R A F T - U N D E R E M B A R G O
Emerging East Asian Local Currency Bond Markets:A Regional Update
2 Asia Bond Monitor
HighlightsBond Market Outlook
Emerging East Asian bond markets remained relatively stable in 4Q13 amid the financial turmoil swirling in emerging markets.1 However, global liquidity is likely to tighten as the United States (US) Federal Reserve is expected to continue tapering its monthly asset purchases. Bond yields in the region have risen since the tapering began in December 2013, and could rise further in the months ahead.
Emerging East Asian exchange rates have been adversely affected by the sell-off, but on a much smaller scale than in other emerging markets due to strong economic fundamentals and stable domestic financial systems.
Risks to the region’s local currency (LCY) bond markets have increased. Specifically, the risks are (i) potential vulnerability to contagion effects, (ii) tighter liquidity conditions and rising inflation putting upward pressure on bond yields, and (iii) economies with high levels of foreign currency (FCY)-denominated debt being vulnerable to the impacts of currency depreciation.
LCY Bond Market Growth in Emerging East Asia
The LCY bond market in emerging East Asia ended 2013 with outstanding bonds totaling US$7.4 trillion, up 2.4% from the previous quarter and 11.7% from a year earlier. As a share of the region’s gross domestic product (GDP), the bond market stood at 56.5% in 4Q13, up from 56.2% in the previous quarter. In terms of bond market growth, Viet Nam recorded the most rapid quarter-on-quarter (q-o-q) expansion in 4Q13 at 14.8%, while Indonesia posted the highest year-on-year (y-o-y) growth rate at 20.1%. The amount of LCY bonds outstanding in the People’s Republic of China (PRC) remained the largest in emerging East Asia, accounting for 61% of the region’s total at the end of the year.
The region’s corporate bond market recorded growth rates of 3.0% q-o-q and 19.7% y-o-y in 4Q13, surpassing growth
1 Emerging East Asia refers to the People’s Republic of China; Hong Kong, China; Indonesia; the Republic of Korea; Malaysia; the Philippines; Singapore; Thailand; and Viet Nam.
rates in the government bond market of 2.0% q-o-q and 7.2% y-o-y. The fastest-growing corporate market in the region on a q-o-q basis was the Philippines at 8.7%, while on a y-o-y basis the PRC led all corporate bond markets with growth of 31.3%. For government bonds, the highest q-o-q growth rate was recorded in Viet Nam at 15.4%, and the highest y-o-y growth rate was in Indonesia at 20.9%.
In 4Q13, LCY bond issuance in emerging East Asia amounted to US$733 billion, down 13.5% from 3Q13 and 6.9% from 4Q12, due mainly to lower government bond sales. National governments and central banks and monetary authorities raised US$518 billion from LCY bond sales, down 23.4% from the previous quarter and 6.0% from a year earlier. Meanwhile, emerging East Asian LCY corporate bond issuance had a mixed performance in 4Q13, rising 25.3% q-o-q but falling 8.9% y-o-y to level off at US$216 billion.
Structural Developments in LCY Bond Markets
Government bonds are concentrated in medium- to long-term tenors in most emerging East Asian markets, particularly in the PRC, Indonesia, Malaysia, the Philippines, and Singapore. In contrast, short-term government bonds (maturities of 1 year to 3 years) are relatively popular in Hong Kong, China; the Republic of Korea; Thailand; and Viet Nam; where they comprise at least 40% of total government bonds outstanding.
For corporate bonds, 5- to 10-year tenors are dominant in most emerging East Asian markets, including the PRC, Malaysia, the Philippines, Singapore, Thailand, and Viet Nam.
Foreign holdings of the region’s LCY government bonds remained relatively stable in 4Q13. The share of foreign holdings of total government bonds outstanding in Indonesia remained the highest in the region at 32.5% at end-December 2013, followed by Malaysia at 29.4%. However, in 3Q13, the share of foreign holdings of government bonds in Japan, the Republic of Korea, and Thailand declined slightly.
Highlights 3
LCY Bond Yields
Government bond yields rose for most tenors in most emerging East Asian markets between end-June 2013 and end-December 2013 due in part to expectations of tapering by the Federal Reserve of its asset purchase program. Yield hikes during this period were most pronounced in the PRC, Indonesia, and Malaysia. Domestic conditions contributed to much of the increase in yields in the PRC and Indonesia.
In January 2014, government bond yields rose further in most markets except the PRC and Viet Nam where yields fell for all tenors. Yields rose the most in Indonesia and the Philippines.
Yield spreads between 2- and 10-year government bonds widened in most emerging East Asian economies between end-June 2013 and end-January 2014, as yields rose more at the longer-end of the curve.
Special Section: Sukuk in Emerging East Asia
The global sukuk market continued to post robust growth in 2013, having risen from only US$14.8 billion in 2001 to US$281.3 billion at the end of 2013. Malaysia is the largest sukuk market in emerging East Asia, accounting for nearly 60% of outstanding global sukuk.2
2 In the special section: Sukuk, data for emerging East Asia also include Brunei Darussalam.
Sukuk issuance remained strong in the region in 2013, with total issuance reaching US$91.7 billion for the year. Malaysia was the most active issuer with US$83.7 billion in new sukuk issuance, as Malaysia is seeking to develop itself as an offshore sukuk center for other countries. There has been interest from foreign issuers to issue MYR- and CNH-denominated sukuk in Malaysia.
Emerging East Asia (excluding Malaysia) accounts for only 6.0% of the world’s outstanding sukuk. Indonesia, Singapore, and Brunei Darussalam have established sukuk markets, but these markets lack the size and depth of the Malaysian market. Other markets like Hong Kong, China and Thailand have introduced regulations to develop Islamic finance.
Sukuk have great potential as a source of financing for infrastructure projects since the financing for such projects can easily be adapted to accommodate sukuk. Malaysia has already used sukuk to finance several large infrastructure projects, although the practice has yet to gain popularity outside Malaysia.
Governments face challenges in enacting the needed regulatory framework to make sukuk a viable alternative to conventional bonds. These challenges include standardizing sukuk structures, promoting price transparency, and harmonizing tax treatment for conventional bonds and sukuk.

4 Asia Bond MonitorGlobal and Regional Market DevelopmentsEmerging East Asian bond markets have remained relatively stable in spite of the turmoil impacting other emerging markets around the globe.3 The United States (US) Federal Reserve’s decision in January 2014 to reduce its monthly purchase of securities by US$10 billion—from US$75 billion to US$65 billion—came on the back of a similar cut in December 2013. Under its new Chair, Janet Yellen, the Federal Reserve has confirmed that it will continue the tapering process unless there is a significant change in the economic outlook. This suggests that liquidity in emerging East Asian economies is likely to tighten in the months ahead. Since the tapering began, bond yields in the region have risen, with further increases likely as the tapering continues.
While the announcement by the Federal Reserve in December 2013 elicited little reaction from the region’s bond markets, the decision in January 2014 to further reduce the pace of its bond buying program has had an impact on financial markets. This suggests that while tapering might have been the trigger, other country-specific factors could be driving the sell-off. Economies with large current account deficits and low levels of foreign exchange (FX) reserves are seen as being particularly vulnerable. The worst-affected countries were forced into undertaking drastic policy actions. For example, Argentina has devalued its currency and Turkey has raised its overnight lending rate by a massive 425 basis points (bps) to defend the Turkish lira.
Emerging East Asian exchange rates have also been adversely affected by the sell-off, though on a much smaller scale than in other emerging markets. This shows that investors have been distinguishing between stronger and weaker markets based on country-specific economic vulnerabilities and have not been treating all emerging economies as a homogeneous group. The region’s robust economic fundamentals, combined with a reliance on mainly local currency (LCY) financing, have allowed it to ride out the worst impacts of the global market turmoil. Policy reforms undertaken by emerging East Asian economies have led to stable monetary policies, more flexible exchange rates, and prudent
3 Emerging East Asia refers to the People’s Republic of China; Hong Kong, China: Indonesia; the Republic of Korea; Malaysia; the Philippines; Singapore; Thailand; and Viet Nam.
fiscal management, all of which have helped strengthen the region’s economic resilience.
The turmoil in emerging markets in the wake of US tapering has led to calls for greater policy coordination among countries given the strong spillover effects from the actions of the Federal Reserve. However, Federal Reserve decisions are likely to continue to be guided by domestic economic developments. Unless there is a major setback to the US recovery, the region’s economies should not expect a reprieve from tightening liquidity.
Despite the tapering, bond yields in the US showed a marginal decline in recent months. This likely reflects the role that US Treasuries play as a safe haven. When concerns arise over the health of emerging economies, investors prefer to park their savings in a safe and liquid asset. The US Treasury market, by virtue of being the world’s largest and most liquid market, tends to benefit from this market phenomenon.
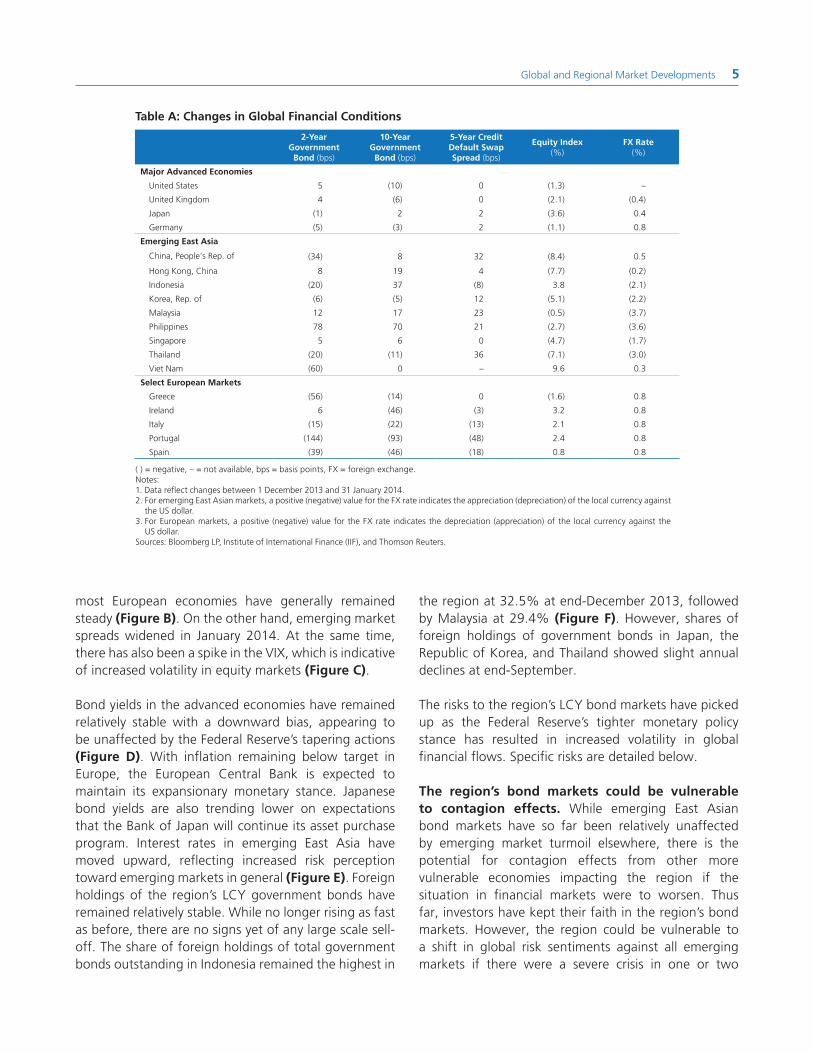
Bond markets in the region have been able to avoid the worst effects of the turmoil. Nevertheless, bond yields for most of the region’s economies increased between 1 December 2013 and 31 January 2014 (Table A). Among the region’s bond markets, Philippine 10-year yields rose the most, gaining 70 bps. Bond yields on 10-year maturities in Thailand and the Republic of Korea were the exception, however, and slightly decreased in December–January. Over the same period, most of the region’s currencies depreciated. The Malaysian ringgit and Philippines peso showed the largest declines at –3.7% and –3.6%, respectively. Meanwhile, the Chinese renminbi and Vietnamese dong were able to buck the regional trend and strengthen marginally in December–January.
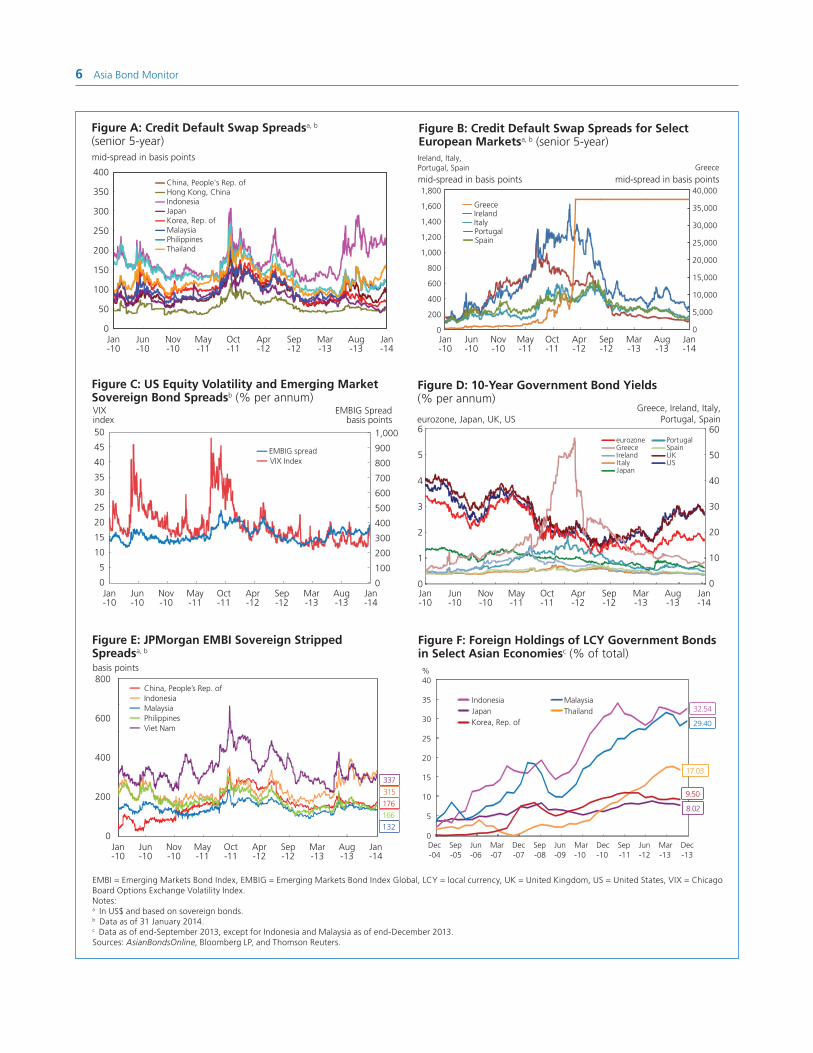
With emerging markets around the globe experiencing turmoil, investors’ risk perception has risen. The region’s economies have not been completely immune to the upheaval in global financial markets. For example, credit default swaps (CDSs) in the region have generally increased, particularly in Thailand due mainly to investor concerns over domestic political developments (Figure A). Meanwhile, the market turmoil has left European economies relatively unaffected. CDSs for
Global and Regional Market Developments 5
most European economies have generally remained steady (Figure B). On the other hand, emerging market spreads widened in January 2014. At the same time, there has also been a spike in the VIX, which is indicative of increased volatility in equity markets (Figure C).
Bond yields in the advanced economies have remained relatively stable with a downward bias, appearing to be unaffected by the Federal Reserve’s tapering actions (Figure D). With inflation remaining below target in Europe, the European Central Bank is expected to maintain its expansionary monetary stance. Japanese bond yields are also trending lower on expectations that the Bank of Japan will continue its asset purchase program. Interest rates in emerging East Asia have moved upward, reflecting increased risk perception toward emerging markets in general (Figure E). Foreign holdings of the region’s LCY government bonds have remained relatively stable. While no longer rising as fast as before, there are no signs yet of any large scale sell-off. The share of foreign holdings of total government bonds outstanding in Indonesia remained the highest in
Table A: Changes in Global Financial Conditions
2-Year Government
Bond (bps)
10-Year Government
Bond (bps)
5-Year Credit Default Swap Spread (bps)
Equity Index (%)
FX Rate (%)
Major Advanced Economies
United States 5 (10) 0 (1.3) –
United Kingdom 4 (6) 0 (2.1) (0.4)
Japan (1) 2 2 (3.6) 0.4
Germany (5) (3) 2 (1.1) 0.8
Emerging East Asia
China, People's Rep. of (34) 8 32 (8.4) 0.5
Hong Kong, China 8 19 4 (7.7) (0.2)
Indonesia (20) 37 (8) 3.8 (2.1)
Korea, Rep. of (6) (5) 12 (5.1) (2.2)
Malaysia 12 17 23 (0.5) (3.7)
Philippines 78 70 21 (2.7) (3.6)
Singapore 5 6 0 (4.7) (1.7)
Thailand (20) (11) 36 (7.1) (3.0)
Viet Nam (60) 0 – 9.6 0.3
Select European Markets
Greece (56) (14) 0 (1.6) 0.8
Ireland 6 (46) (3) 3.2 0.8
Italy (15) (22) (13) 2.1 0.8
Portugal (144) (93) (48) 2.4 0.8
Spain (39) (46) (18) 0.8 0.8
( ) = negative, – = not available, bps = basis points, FX = foreign exchange.Notes:1. Data reflect changes between 1 December 2013 and 31 January 2014.2. For emerging East Asian markets, a positive (negative) value for the FX rate indicates the appreciation (depreciation) of the local currency against
the US dollar. 3. For European markets, a positive (negative) value for the FX rate indicates the depreciation (appreciation) of the local currency against the
US dollar.Sources: Bloomberg LP, Institute of International Finance (IIF), and Thomson Reuters.
the region at 32.5% at end-December 2013, followed by Malaysia at 29.4% (Figure F). However, shares of foreign holdings of government bonds in Japan, the Republic of Korea, and Thailand showed slight annual declines at end-September.
The risks to the region’s LCY bond markets have picked up as the Federal Reserve’s tighter monetary policy stance has resulted in increased volatility in global financial flows. Specific risks are detailed below.
The region’s bond markets could be vulnerable to contagion effects. While emerging East Asian bond markets have so far been relatively unaffected by emerging market turmoil elsewhere, there is the potential for contagion effects from other more vulnerable economies impacting the region if the situation in financial markets were to worsen. Thus far, investors have kept their faith in the region’s bond markets. However, the region could be vulnerable to a shift in global risk sentiments against all emerging markets if there were a severe crisis in one or two
6 Asia Bond Monitor
Figure A: Credit Default Swap Spreadsa, b
(senior 5-year)
400
350
300
250
200
150
100
50
0Jan-10
Jun-10
Nov-10
May-11
Oct-11
Apr-12
Sep-12
Mar-13
Aug-13
Jan-14
Jan-10
Jun-10
Nov-10
May-11
Oct-11
Apr-12
Sep-12
Mar-13
Aug-13
Jan-14
Jan-10
Jun-10
Nov-10
May-11
Oct-11
Apr-12
Sep-12
Mar-13
Aug-13
Jan-14
Jan-10
Jun-10
Nov-10
May-11
Oct-11
Apr-12
Sep-12
Mar-13
Aug-13
Jan-14
Jan-10
Jun-10
Nov-10
May-11
Oct-11
Apr-12
Sep-12
Mar-13
Aug-13
Jan-14
mid-spread in basis points
China, People's Rep. ofHong Kong, China
Korea, Rep. ofJapan
MalaysiaPhilippinesThailand
Indonesia
Figure B: Credit Default Swap Spreads for Select European Marketsa, b (senior 5-year)
1,800
1,600
1,400
1,200
1,000
800
600
400
200
0
40,000
35,000
30,000
25,000
20,000
15,000
10,000
5,000
0
mid-spread in basis points mid-spread in basis points
Portugal
IrelandItaly
Greece
Spain
Ireland, Italy,Portugal, Spain Greece
800
600
400
200
0
basis points
Figure E: JPMorgan EMBI Sovereign Stripped Spreadsa, b
337
176
315
166132
Figure C: US Equity Volatility and Emerging Market Sovereign Bond Spreadsb (% per annum)
1,000
900
800
700
600
500
400
300
200
100
0
basis pointsindex50
45
40
35
30
25
20
15
10
5
0
Figure F: Foreign Holdings of LCY Government Bonds in Select Asian Economiesc (% of total)
Figure D: 10-Year Government Bond Yields(% per annum)
6
5
4
3
2
1
0
eurozone, Japan, UK, USGreece, Ireland, Italy,
Portugal, Spain60
50
40
30
20
10
0
JapanItalyIreland
eurozoneGreece
USUK
PortugalSpainEMBIG spread
VIX Index
China, People’s Rep. ofIndonesiaMalaysiaPhilippinesViet Nam
VIX EMBIG Spread
%40
35
30
25
20
15
10
5
0Dec-04
Sep-05
Jun-06
Mar-07
Dec-07
Sep-08
Jun-09
Mar-10
Sep-11
Dec-10
Mar-13
Dec-13
Jun-12
Indonesia MalaysiaJapan ThailandKorea, Rep. of 29.40
32.54
17.03
9.50
8.02
EMBI = Emerging Markets Bond Index, EMBIG = Emerging Markets Bond Index Global, LCY = local currency, UK = United Kingdom, US = United States, VIX = Chicago Board Options Exchange Volatility Index.Notes:a In US$ and based on sovereign bonds.b Data as of 31 January 2014.c Data as of end-September 2013, except for Indonesia and Malaysia as of end-December 2013.Sources: AsianBondsOnline, Bloomberg LP, and Thomson Reuters.
Global and Regional Market Developments 7
vulnerable economies. Further reforms may be needed in some of the region’s economies to improve their resilience in the face of possible contagion effects.
Tighter liquidity conditions and rising inflation could result in higher bond yields. Inflationary pressures have started picking up in several countries in the region. Some of the increases have been driven by the removal of subsidies, as in Malaysia, or supply shocks, as in the Philippines and Indonesia. At the same time, generally tighter global liquidity conditions will also push up interest rates. Further, if some emerging market currencies were to come under selling pressure, they might be forced to raise interest rates to stave off an attack.
Economies with high levels of foreign-currency-denominated debt are vulnerable to currency
depreciation. While the region’s sovereigns have mostly focused on issuing LCY bonds in recent years, corporates in some markets have taken advantage of plentiful liquidity in the US dollar market to issue more foreign currency (FCY) bonds. In 2013, for example, real estate companies in the People’s Republic of China (PRC) were major issuers of FCY bonds, partly because it is becoming more difficult for them to borrow from banks domestically due to tightening regulatory restrictions. Overall, the region’s G3 currency bond issuance in 2013 reached US$141.5 billion, of which US$128.4 billion originated in the corporate sector. Furthermore, G3 currency bond issuance by corporates represented 14.4% of total corporate bond issuance in emerging East Asia in 2013. If the region’s exchange rates were to fall, many corporates would face higher debt servicing costs at a time when domestic economic conditions would also likely be weakening.

8 Asia Bond MonitorBond Market Developmentsin the Fourth Quarter of 2013The emerging East Asian local currency bond market continued to expand in 4Q13 to reach US$7.4 trillion at end-2013, albeit with growth at a slightly slower pace as bond issuance declined.4
The size of the emerging East Asian local currency (LCY) bond market climbed to US$7.4 trillion at end-December 2013 from US$7.1 trillion at end-September 2013. The region’s bond market grew 2.4% quarter-on-quarter (q-o-q) in 4Q13 compared with 2.6% growth in 3Q13 (Figure 1a). The fastest-growing market on a q-o-q basis was in Viet Nam (14.8%), though this represented rapid growth from a low base, followed by Indonesia (6.8%) and the Philippines (4.0%). Other markets posted q-o-q growth rates of 2.9% or less.
4 Emerging East Asia refers to the People’s Republic of China; Hong Kong, China; Indonesia; the Republic of Korea; Malaysia; the Philippines; Singapore; Thailand; and Viet Nam.
On a year-on-year (y-o-y) basis, however, the emerging East Asian bond market grew more rapidly in 4Q13, rising 11.7%. However, the pace of growth in 4Q13 was down from 12.4% in the previous quarter (Figure 1b). Double-digit y-o-y growth rates were observed in most markets, including Indonesia (20.1%), Viet Nam (15.6%), the PRC (13.6%), the Philippines (10.2%), and the Republic of Korea (10.0%).
Growth in the region’s LCY bond market was driven by both the government and corporate bond sectors, which recorded broadly comparable q-o-q increases. In 4Q13, the LCY government bond market in emerging East Asia grew 2.0% q-o-q and 7.2% y-o-y (Table 1). The government sector continued to dominate the LCY bond market in the region, accounting for 61.7%
LCY = local currency, q-o-q = quarter-on-quarter.Notes:1. Calculated using data from national sources.2. Growth rates are calculated from LCY base and do not include currency
effects. 3. Emerging East Asia growth figures are based on end-December 2013 currency
exchange rates and do not include currency effects.4. For Hong Kong, China, 4Q13 corporate bonds outstanding based on
AsianBondsOnline estimates. For the Philippines, 4Q13 government bonds outstanding data carried over from November 2013. For Singapore, corporate bonds outstanding data based on AsianBondsOnline estimates. For Thailand, 4Q13 corporate bonds outstanding data based on Bank of Thailand’s November 2013 estimate.
Sources: People’s Republic of China (ChinaBond and Wind); Hong Kong, China (Hong Kong Monetary Authority); Indonesia (Bank Indonesia and Indonesia Stock Exchange); Republic of Korea (EDAILY BondWeb and The Bank of Korea); Malaysia (Bank Negara Malaysia); Philippines (Bureau of the Treasury and Bloomberg LP); Singapore (Monetary Authority of Singapore, Singapore Government Securities, and Bloomberg LP); Thailand (Bank of Thailand); and Viet Nam (Bloomberg LP).
Figure 1a: Growth of LCY Bond Markets in 3Q13 and 4Q13 (q-o-q, %)
4Q133Q13
20–10 15105–5 0
China, People’s Rep. ofHong Kong, China
IndonesiaKorea, Rep. of
MalaysiaPhilippinesSingapore
ThailandViet Nam
Emerging East Asia
LCY = local currency, y-o-y = year-on-year.Notes:1. Calculated using data from national sources.2. Growth rates are calculated from LCY base and do not include currency
effects. 3. Emerging East Asia growth figures are based on end-December 2013 currency
exchange rates and do not include currency effects.4. For Hong Kong, China, 4Q13 corporate bonds outstanding based on
AsianBondsOnline estimates. For the Philippines, 4Q13 government bonds outstanding data carried over from November 2013. For Singapore, corporate bonds outstanding data based on AsianBondsOnline estimates. For Thailand, 4Q13 corporate bonds outstanding data based on Bank of Thailand’s November 2013 estimate.
Sources: People’s Republic of China (ChinaBond and Wind); Hong Kong, China (Hong Kong Monetary Authority); Indonesia (Bank Indonesia and Indonesia Stock Exchange); Republic of Korea (EDAILY BondWeb and The Bank of Korea); Malaysia (Bank Negara Malaysia); Philippines (Bureau of the Treasury and Bloomberg LP); Singapore (Monetary Authority of Singapore, Singapore Government Securities, and Bloomberg LP); Thailand (Bank of Thailand); and Viet Nam (Bloomberg LP).
Figure 1b: Growth of LCY Bond Markets in 3Q13 and 4Q13 (y-o-y, %)
4Q133Q13
0 5 10 15 2520
China, People’s Rep. ofHong Kong, China
IndonesiaKorea, Rep. of
MalaysiaPhilippinesSingapore
ThailandViet Nam
Emerging East Asia

Bond Market Developments in the Fourth Quarter of 2013 9
Table 1: Size and Composition of LCY Bond Markets
4Q12 3Q13 4Q13 Growth Rate (LCY-base %) Growth Rate (US$-base %)Amount
(US$ billion)
% share
Amount(US$
billion)
% share
Amount(US$
billion)
% share
4Q12 4Q13 4Q12 4Q13
q-o-q y-o-y q-o-q y-o-y q-o-q y-o-y q-o-q y-o-y
China, People's Rep. of (PRC)
Total 3,811 100.0 4,307 100.0 4,454 100.0 3.0 11.2 2.3 13.6 3.9 12.4 3.4 16.9
Government 2,772 72.7 2,960 68.7 3,050 68.5 0.9 8.0 1.9 6.9 1.8 9.1 3.0 10.0
Corporate 1,040 27.3 1,347 31.3 1,405 31.5 9.3 20.8 3.1 31.3 10.2 22.0 4.3 35.1
Hong Kong, China
Total 177 100.0 193 100.0 194 100.0 0.9 5.1 0.5 9.2 0.9 5.3 0.5 9.2
Government 93 52.7 108 56.0 108 56.0 0.5 3.0 0.4 16.1 0.5 3.2 0.5 16.1
Corporate 84 47.3 85 44.0 85 44.0 1.3 7.6 0.5 1.6 1.3 7.8 0.5 1.5
Indonesia
Total 111 100.0 108 100.0 108 100.0 3.3 9.7 6.8 20.1 1.2 1.6 0.1 (3.3)
Government 92 82.8 89 82.5 90 83.3 2.2 6.6 7.9 20.9 0.1 (1.3) 1.1 (2.7)
Corporate 19 17.2 19 17.5 18 16.7 9.4 27.6 1.5 16.4 7.2 18.1 (4.8) (6.3)
Korea, Rep. of
Total 1,471 100.0 1,564 100.0 1,641 100.0 2.8 10.5 2.5 10.0 7.4 19.7 4.9 11.6
Government 572 38.9 601 38.4 626 38.2 0.9 3.7 1.9 7.9 5.4 12.3 4.3 9.4
Corporate 899 61.1 963 61.6 1,015 61.8 4.1 15.4 2.9 11.4 8.7 24.9 5.3 12.9
Malaysia
Total 327 100.0 305 100.0 312 100.0 2.8 19.9 2.9 2.2 2.9 24.2 2.4 (4.5)
Government 196 59.9 179 58.8 182 58.5 2.2 20.0 2.4 (0.2) 2.2 24.3 1.9 (6.8)
Corporate 131 40.1 126 41.2 130 41.5 3.9 19.8 3.7 5.9 3.9 24.1 3.2 (1.1)
Philippines
Total 99 100.0 99 100.0 101 100.0 6.9 19.9 4.0 10.2 8.9 28.2 1.9 1.8
Government 86 87.1 87 87.4 88 86.8 7.7 19.8 3.4 9.9 9.6 28.1 1.2 1.5
Corporate 13 12.9 13 12.6 13 13.2 2.3 20.7 8.7 12.4 4.1 29.1 6.4 3.9
Singapore
Total 231 100.0 240 100.0 242 100.0 2.2 14.1 1.4 8.3 2.7 21.1 0.8 4.8
Government 142 61.3 149 62.1 150 61.9 1.2 12.6 1.1 9.3 1.7 19.5 0.5 5.7
Corporate 89 38.7 91 37.9 92 38.1 3.9 16.4 1.9 6.7 4.4 23.6 1.3 3.2
Thailand
Total 279 100.0 286 100.0 275 100.0 4.1 19.8 0.9 5.7 4.9 23.6 (3.6) (1.2)
Government 221 79.3 224 78.5 214 77.7 3.6 17.7 (0.1) 3.5 4.4 21.4 (4.6) (3.2)
Corporate 58 20.7 61 21.5 61 22.3 6.3 28.8 4.8 14.0 7.2 32.8 0.1 6.6
Viet Nam
Total 25 100.0 25 100.0 29 100.0 18.0 43.1 14.8 15.6 18.2 44.4 14.9 14.2
Government 24 95.7 24 97.1 28 97.6 22.1 55.1 15.4 17.9 22.4 56.5 15.5 16.5
Corporate 1 4.3 0.7 2.9 0.7 2.4 (33.2) (47.6) (6.8) (36.0) (33.1) (47.1) (6.7) (36.7)
Emerging East Asia (EEA)
Total 6,532 100.0 7,126 100.0 7,355 100.0 3.0 11.9 2.4 11.7 4.6 15.1 3.2 12.6
Government 4,198 64.3 4,420 62.0 4,535 61.7 1.3 8.7 2.0 7.2 2.6 11.2 2.6 8.0
Corporate 2,333 35.7 2,706 38.0 2,820 38.3 6.3 18.1 3.0 19.7 8.5 22.9 4.2 20.9
Japan
Total 11,656 100.0 10,593 100.0 10,050 100.0 1.0 3.5 1.7 4.7 (9.3) (8.3) (5.1) (13.8)
Government 10,668 91.5 9,751 92.0 9,260 92.1 1.1 4.1 1.8 5.4 (9.1) (7.7) (5.0) (13.2)
Corporate 988 8.5 843 8.0 790 7.9 (0.6) (3.2) 0.4 (3.0) (10.7) (14.2) (6.3) (20.1)
Memo Item: India
Total 1,024 100.0 924 100.0 988 100.0 1.6 23.4 5.5 8.5 (2.3) 19.1 6.9 (3.5)
Government 804 78.5 707 76.5 761 77.0 0.7 23.5 6.2 6.4 (3.2) 19.2 7.6 (5.3)
Corporate 220 21.5 217 23.5 227 23.0 5.2 23.2 3.33 15.8 1.1 18.9 4.7 3.0
( ) = negative, LCY = local currency, q-o-q = quarter-on-quarter, y-o-y = year-on-year.Notes:1. For Hong Kong, China, 4Q13 corporate bonds outstanding based on AsianBondsOnline estimates. For the Philippines, 4Q13 government bonds outstanding data carried over from November
2013. For Singapore, corporate bonds outstanding data based on AsianBondsOnline estimates. For Thailand, 4Q13 corporate bonds outstanding data based on Bank of Thailand’s November 2013 estimate. For Japan, 4Q13 government and corporate bonds oustanding data carried over from November 2013.
2. Corporate bonds include issues by financial institutions.3. Bloomberg LP end-of-period LCY—US$ rates are used.4. For LCY base, emerging East Asia growth figures based on end-December 2013 currency exchange rates and do not include currency effects.5. Emerging East Asia comprises the People’s Republic of China; Hong Kong, China; Indonesia; the Republic of Korea; Malaysia; the Philippines; Singapore; Thailand; and Viet Nam.Sources: People’s Republic of China (ChinaBond and Wind); Hong Kong, China (Hong Kong Monetary Authority); Indonesia (Bank Indonesia and Indonesia Stock Exchange); Republic of Korea (EDAILY BondWeb and The Bank of Korea); Malaysia (Bank Negara Malaysia); Philippines (Bureau of the Treasury and Bloomberg LP); Singapore (Monetary Authority of Singapore, Singapore Government Securities, and Bloomberg LP); Thailand (Bank of Thailand); Viet Nam (Bloomberg LP); and Japan (Japan Securities Dealers Association).

10 Asia Bond Monitor
of total LCY bonds at end-December. All markets in emerging East Asia reported increases in their stock of government bonds in 4Q13 on a q-o-q and y-o-y basis, except for a marginal decline in Thailand on a q-o-q basis and in Malaysia on a y-o-y basis.
Growth in the government sector came mostly from increases in the stock of central bank bills and treasury bonds. In 4Q13, the stock of central bank bills rose in Indonesia, the Republic of Korea, and Singapore (Figure 2). (Central bank and monetary authorities issue central bank bills and bonds as part of their open market operations to contain inflation and manage liquidity.) The notable increase in Singapore’s stock of Monetary Authority of Singapore (MAS) bills was partly due to changes initiated by MAS to its issuance of short-term securities. Effective 12 June 2013, MAS ceased issuance of 3-month Singapore Government Securities (SGSs) and shifted to the issuance of 12-week MAS bills. MAS also stopped issuing 6-month SGSs and replaced them with 6-month MAS bills beginning in January of this year. These changes were initiated to improve liquidity management. In Indonesia, there was increased issuance of Sertifikat Bank Indonesia (SBI) in 4Q13, as part of measures to rein in inflation and mop-up excess liquidity, lifting the stock of central bank bills to US$8.0 billion at end-2013, the same level as a year earlier.
At the end of 2013, the outstanding amount of treasury bonds in the region stood at US$2.1 trillion, accounting for 47% of total government bonds in emerging East Asia. On a q-o-q basis, the stock of treasury bonds climbed in 4Q13 for all markets except in the Republic of Korea. Meanwhile, both the stock of treasury bills and central bank bonds declined for the region as a whole.
The LCY corporate bond market in emerging East Asia grew 3.0% q-o-q and 19.7% y-o-y in 4Q13. The corporate bond segment grew in all of the region’s bond markets except in Viet Nam, which saw a decline on both a q-o-q and y-o-y basis. Many corporates across the region decided to raise funds by issuing bonds in anticipation of higher borrowing costs in the future resulting from the United States (US) Federal Reserve’s decision to taper its monthly purchase of securities. The PRC’s corporate bond sector grew significantly in 4Q13, due mainly to increases in the stock of medium-term notes and local corporate bonds. A spike in issuance of medium-term notes in 4Q13 also contributed to the uptick in Malaysia’s
corporate bond stock. In the Philippines, quite a number of corporate firms issued bonds in 4Q13 to take advantage of the relatively low interest rates.
The PRC remained home to the largest LCY bond market in the region with outstanding bonds amounting to US$4.4 trillion. It accounted for 61% of total outstanding LCY bonds in emerging East Asia at end-2013. The PRC was followed by the Republic of Korea with a bond market size of US$1.6 trillion, driven by its large corporate bond market. Malaysia took the third spot with total bonds outstanding of US$312 billion.
The region’s ratio of LCY bonds outstanding to gross domestic product (GDP) was relatively stable at 56.5% in 4Q13 compared with 56.2% in 3Q13, but up from 54.4% in 4Q12 (Table 2). The Republic of Korea and Malaysia had the highest ratios of bonds to GDP in the region at end-2013.
The maturity structures of LCY government bond markets in the region are mostly concentrated in medium- to long-dated tenors, except in Hong Kong, China; the Republic of Korea; Thailand; and Viet Nam.
The maturity structures of LCY government bond markets in emerging East Asia are mostly concentrated
Notes:1. The People’s Republic of China ceased issuance of central bank bills in 3Q13.2. The Philippines has no central bank bills outstanding.Source: AsianBondsOnline.
Figure 2: Central Bank Bills Outstanding
100
90
80
70
60
50
40
30
20
10
0
Indo
nesi
a
Hon
g K
ong,
Chi
na
Kor
ea, R
ep. o
f
Mal
aysi
a
Sing
apor
e
Thai
land
Vie
t N
am
4Q12 3Q13 4Q13
US$ billion
Bond Market Developments in the Fourth Quarter of 2013 11
Table 2: Size and Composition of LCY Bond Markets (% of GDP)
4Q12 3Q13 4Q13
China, People’s Rep. of
Total 45.7 47.7 47.4
Government 33.2 32.8 32.5
Corporate 12.5 14.9 15.0
Hong Kong, China
Total 67.4 71.0 71.4
Government 35.5 39.8 39.9
Corporate 31.9 31.2 31.4
Indonesia
Total 13.2 13.9 14.4
Government 11.0 11.5 12.0
Corporate 2.3 2.4 2.4
Korea, Rep. of
Total 123.0 128.9 135.2
Government 47.9 49.5 51.6
Corporate 75.2 79.4 83.6
Malaysia
Total 106.2 103.2 105.7
Government 63.6 60.6 61.8
Corporate 42.6 42.6 43.9
Philippines
Total 38.5 38.2 38.8
Government 33.5 33.4 33.7
Corporate 5.0 4.8 5.1
Singapore
Total 81.6 84.3 85.0
Government 50.0 52.3 52.6
Corporate 31.6 32.0 32.4
Thailand
Total 74.9 75.3 72.6
Government 59.4 59.2 56.4
Corporate 15.5 16.2 16.2
Viet Nam
Total 16.1 14.3 16.9
Government 15.4 13.9 16.5
Corporate 0.7 0.4 0.4
Emerging East Asia
Total 54.4 56.2 56.5
Government 34.9 34.9 34.8
Corporate 19.4 21.3 21.7
Japan
Total 213.4 218.9 221.2
Government 195.3 201.5 203.8
Corporate 18.1 17.4 17.4
GDP = gross domestic product, LCY = local currency.Notes:1. Data for GDP is from CEIC. 4Q13 GDP figures carried over from 3Q13 except for the
People’s Republic of China, Indonesia, Japan, the Philippines, and Viet Nam.2. For Hong Kong, China, 4Q13 corporate bonds outstanding based on AsianBondsOnline
estimates. For the Philippines, 4Q13 government bonds outstanding data carried over from November 2013. For Singapore, corporate bonds outstanding data based on AsianBondsOnline estimates. For Thailand, 4Q13 corporate bonds outstanding data based on Bank of Thailand’s November 2013 estimate. For Japan, 4Q13 government and corporate bonds oustanding data carried over from November 2013.
Sources: People’s Republic of China (ChinaBond and Wind); Hong Kong, China (Hong Kong Monetary Authority); Indonesia (Bank Indonesia and Indonesia Stock Exchange); Republic of Korea (EDAILY BondWeb and The Bank of Korea); Malaysia (Bank Negara Malaysia); Philippines (Bureau of the Treasury and Bloomberg LP); Singapore (Monetary Authority of Singapore, Singapore Government Securities, and Bloomberg LP); Thailand (Bank of Thailand); Viet Nam (Bloomberg LP); and Japan (Japan Securities Dealers Association).
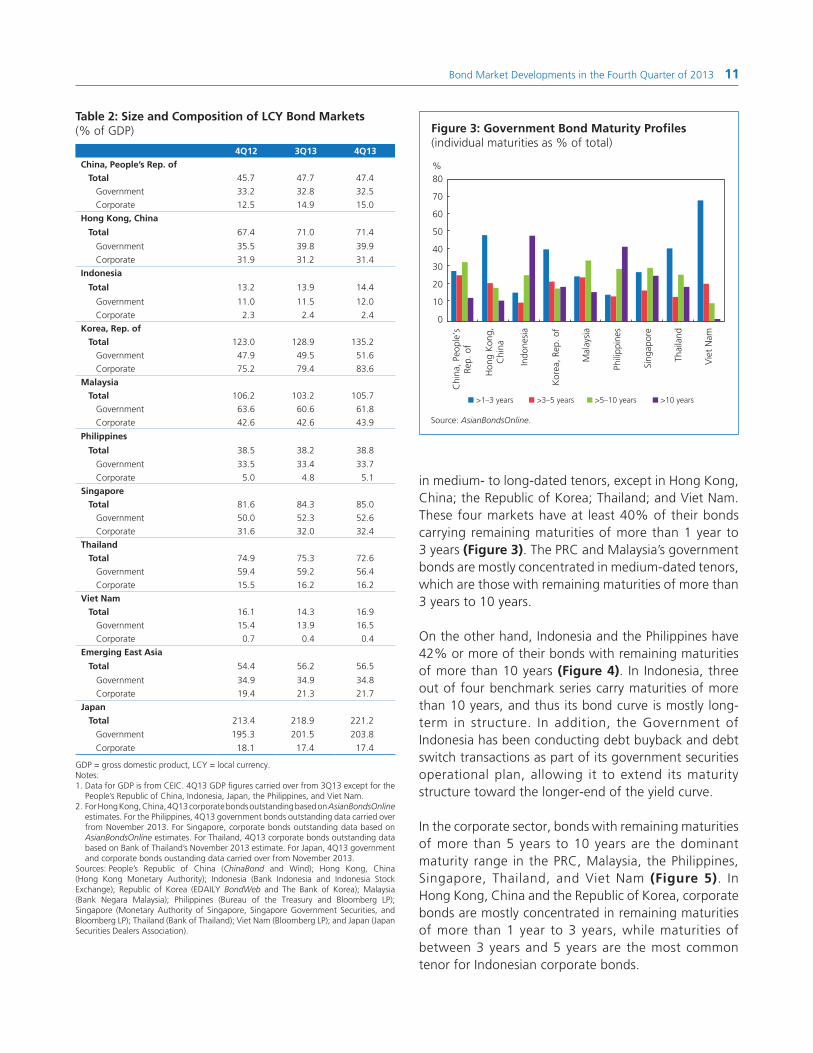
in medium- to long-dated tenors, except in Hong Kong, China; the Republic of Korea; Thailand; and Viet Nam. These four markets have at least 40% of their bonds carrying remaining maturities of more than 1 year to 3 years (Figure 3). The PRC and Malaysia’s government bonds are mostly concentrated in medium-dated tenors, which are those with remaining maturities of more than 3 years to 10 years.
On the other hand, Indonesia and the Philippines have 42% or more of their bonds with remaining maturities of more than 10 years (Figure 4). In Indonesia, three out of four benchmark series carry maturities of more than 10 years, and thus its bond curve is mostly long-term in structure. In addition, the Government of Indonesia has been conducting debt buyback and debt switch transactions as part of its government securities operational plan, allowing it to extend its maturity structure toward the longer-end of the yield curve.
In the corporate sector, bonds with remaining maturities of more than 5 years to 10 years are the dominant maturity range in the PRC, Malaysia, the Philippines, Singapore, Thailand, and Viet Nam (Figure 5). In Hong Kong, China and the Republic of Korea, corporate bonds are mostly concentrated in remaining maturities of more than 1 year to 3 years, while maturities of between 3 years and 5 years are the most common tenor for Indonesian corporate bonds.
Source: AsianBondsOnline.
Figure 3: Government Bond Maturity Profiles (individual maturities as % of total)
80
70
60
50
40
30
20
10
0
Indo
nesi
a
Kor
ea, R
ep. o
f
Mal
aysi
a
Phili
ppin
es
Sing
apor
e
Thai
land
Vie
t N
am
Chi
na, P
eopl
e’s
Rep.
of
Hon
g K
ong,
Chi
na
>3–5 years>1–3 years >5–10 years >10 years
%

12 Asia Bond Monitor
Foreign holdings of LCY government bonds have remained relatively stable.
Foreign investor holdings in the region’s LCY government bond markets remained relatively stable in 4Q13. Slight declines in the share of foreign ownership were noted in the Republic of Korea and Thailand at end-September, as well as in Japan (Figure 6). On the other hand, the share of foreign holdings in Indonesian government debt rose to 32.5% at end-2013, while the share of foreign holdings inched up to 29.4% in Malaysia.
Foreign inflows into emerging East Asian bond markets were volatile in 2013.
Foreign inflows into selected emerging East Asian bond markets were volatile in 2013 amid uncertainties relating to the US Federal Reserve’s tapering of its asset purchase program.5 From January through April, foreign bond inflows increased on the back of positive investor sentiment, but this trend reversed itself when the Federal Reserve began discussing tapering in May (Figure 7). Net foreign inflows into the region’s bond market were observed in September and October when the initiation of tapering was put on hold, but bond outflows were recorded again in December when the
5 The Republic of Korea and Thailand provide data on bond flows. For Indonesia and Malaysia, month-on-month (m-o-m) changes in foreign holdings are used as a proxy for bond flows.
Source: AsianBondsOnline.
Figure 4: Government Bonds—Maturities of More than 10 Years (% of total)
60
50
40
30
20
10
0
Indo
nesi
a
Kor
ea, R
ep. o
f
Mal
aysi
a
Phili
ppin
es
Sing
apor
e
Thai
land
Vie
t N
am
Chi
na, P
eopl
e’s
Rep.
of
Hon
g K
ong,
Chi
na
4Q134Q12
%
Source: AsianBondsOnline.
Figure 5: Corporate Bond Maturity Profiles (individual maturities as % of total)
70
60
50
40
30
20
10
0
Indo
nesi
a
Kor
ea, R
ep. o
f
Mal
aysi
a
Phili
ppin
es
Sing
apor
e
Thai
land
Vie
t N
am
Chi
na, P
eopl
e’s
Rep.
of
Hon
g K
ong,
Chi
na
>3–5 years>1–3 years >5–10 years >10 years
%
US decided to reduce its asset purchasing program by US$10 billion per month beginning in January 2014. Data in January, however, showed a slight recovery from the bond outflows seen in the second half of 2013.
In the Republic of Korea, net foreign bond investment turned positive in January, following 5 consecutive months of outflows, on account of a larger volume of
LCY = local currency.Note: Data as of end-December 2013, except for Japan, Thailand, and the Republic of Korea as of end-September 2013.Source: AsianBondsOnline.
Figure 6: Foreign Holdings of LCY Government Bonds (as % of total)
%
0
5
10
15
20
25
30
40
35
Indonesia MalaysiaJapan ThailandKorea, Rep. of
29.40
32.54
8.02
17.03
9.50
Dec-04
Sep-05
Jun-06
Mar-07
Dec-07
Sep-08
Jun-09
Mar-10
Sep-11
Dec-10
Mar-13
Dec-13
Jun-12

Bond Market Developments in the Fourth Quarter of 2013 13
Table 3: CNH Bonds Outstanding
4Q12 3Q13 4Q13 Growth Rate (%)
Amount (CNH billion)
% shareAmount
(CNH billion)% share
Amount (CNH billion)
% share3Q13 4Q13
q-o-q y-o-y q-o-q y-o-y
Total 309 100.0 359 100.0 358 100.0 0.2 49.2 (0.5) 15.8
Government 76 24.5 89 24.9 93 26.0 (7.9) 84.1 4.0 23.0
Corporate 233 75.5 270 75.1 265 74.0 3.1 40.6 (1.9) 13.5
( ) = negative, q-o-q = quarter-on-quarter, y-o-y = year-on-year.Note: CNH bonds are renminbi-denominated bonds issued in Hong Kong, China. Data includes certificates of deposits and bonds issued by foreign companies.Source: Central Money Markets Unit, Hong Kong Monetary Authority.
Notes:1. Data for Malaysia only up to December 2013.2. Based on end-December 2013 exchange rates to avoid currency effects.Sources: Indonesia Debt Management Office, Financial Supervisory Service, Bank Negara Malaysia, and Thai Bond Market Association.
Figure 7: Foreign Inflows in Select Emerging East Asian Bond Markets
10
8
6
4
2
0
–2
–4
–6Jan-13
Feb-13
Mar-13
Apr-13
May-13
Jun-13
Jul-13
Aug-13
Sep-13
Oct-13
Nov-13
Dec-13
Jan-14
Indonesia Korea, Rep. of Malaysia Thailand
US$ billion
bond purchases than redemptions. Investor interest in the Republic of Korea has been largely driven by its sound economic fundamentals and the country has been dubbed a new safe haven for foreign investors.
In Thailand, foreign investors were net bond buyers in the first 4 months of 2013 before becoming net sellers in May and June amid expectations of US Federal Reserve tapering. In the second half of 2013, foreign investor net purchases of Thai bonds were positive for all months except August and November. In January, Thailand incurred a net outflow of foreign capital from its LCY bond market amid concerns over the domestic political environment.
In Indonesia, foreign inflows into the bond market resumed in January 2014 after slight outflows were recorded in December, partly a result of improving
domestic factors. However, negative global sentiment for emerging market assets continues to dampen bond prices and put pressure on Indonesian bond yields.
CNH bond issuance remains robust.
Demand for CNH bonds remains robust , with outstanding CNH deposits in Hong Kong, China reaching CNH860 billion in December from CNH730 billion in September. Total outstanding bonds reached CNH358 billion at end-2013 (Table 3).
The CNH market still offers lower borrowing costs for issuers from the PRC versus comparable onshore bonds. The PRC government issued CNH10 billion worth of 2-, 3-, and 5-year bonds in 4Q14. The coupon of the bonds averaged 158 basis points (bps) lower than prevailing onshore yields.
There have been a number of efforts by the PRC to expand the availability of renminbi financing in other offshore financial centers. For example, the development of the Singapore CNH bond market accelerated with the announcement in February 2013 that the Singapore branch of Industrial and Commercial Bank of China would act as the renminbi clearing bank in Singapore. In addition, a memorandum of understanding on renminbi business cooperation was signed by PBOC and MAS.
In July, the PRC government widened participation in the Renminbi Qualified Institutional Investor Program (RQFII) to include other offshore financial centers such as London; Singapore; and Taipei,China. RQFII allows financial institutions to invest offshore renminbi in the PRC’s financial markets subject to quotas. On 22 October, it was announced that Singapore was given a CNY50 billion RQFII quota.
14 Asia Bond Monitor
Table 4: LCY-Denominated Bond Issuance (gross)
4Q12 3Q13 4Q13Growth Rate(LCY-base %)
Growth Rate(US$-base %)
Amount (US$ billion)
% shareAmount
(US$ billion)% share
Amount (US$ billion)
% share4Q13 4Q13
q-o-q y-o-y q-o-q y-o-y
China, People’s Rep. of (PRC)
Total 227 100.0 328 100.0 225 100.0 (32.2) (3.5) (31.5) (0.7)
Government 118 52.1 264 80.4 149 66.4 (44.0) 23.0 (43.4) 26.6
Central Bank 0 0.0 65 19.9 4 1.6 (94.7) – (94.6) –
Treasury and Other Govt. 118 52.1 198 60.4 146 64.8 (27.3) 20.1 (26.5) 23.6
Corporate 109 47.9 64 19.6 76 33.6 16.3 (32.2) 17.5 (30.3)
Hong Kong, China
Total 196 100.0 171 100.0 127 100.0 (25.8) (35.0) (25.7) (35.1)
Government 189 96.7 163 95.4 119 93.8 (27.0) (37.0) (27.0) (37.0)
Central Bank 189 96.5 162 94.9 119 93.5 (26.8) (37.1) (26.8) (37.1)
Treasury and Other Govt. 0 0.2 1 0.5 0 0.3 (57.1) 0.0 (57.1) (0.0)
Corporate 6 3.3 8 4.6 8 6.2 0.0 23.1 0.0 23.0
Indonesia
Total 9 100.0 10 100.0 8 100.0 (7.6) 16.6 (13.4) (6.2)
Government 7 75.0 9 89.2 7 89.0 (7.8) 38.3 (13.6) 11.3
Central Bank 4 43.9 2 18.5 2 20.2 1.4 (46.2) (5.0) (56.7)
Treasury and Other Govt. 3 31.1 7 70.7 6 68.7 (10.2) 157.6 (15.8) 107.3
Corporate 2 25.0 1 10.8 1 11.0 (5.9) (48.6) (11.8) (58.6)
Korea, Rep. of
Total 160 100.0 145 100.0 173 100.0 16.1 6.6 18.9 8.1
Government 67 42.1 69 47.7 74 42.6 3.8 8.0 6.2 9.5
Central Bank 41 25.5 39 26.6 43 25.1 9.3 4.7 11.9 6.2
Treasury and Other Govt. 26 16.5 31 21.0 30 17.5 (3.3) 13.0 (1.0) 14.6
Corporate 93 57.9 76 52.3 99 57.4 27.4 5.7 30.4 7.1
Malaysia
Total 45 100.0 32 100.0 42 100.0 29.9 (0.9) 29.3 (7.5)
Government 35 76.6 26 80.1 28 66.1 7.3 (14.4) 6.8 (20.1)
Central Bank 27 60.0 17 51.2 19 45.8 16.2 (24.3) 15.7 (29.4)
Treasury and Other Govt. 8 16.6 9 28.9 9 20.3 (8.5) 21.4 (9.0) 13.3
Corporate 11 23.4 6 19.9 14 33.9 120.7 43.1 119.6 33.6
Philippines
Total 4 100.0 9 100.0 5 100.0 (44.8) 29.6 (45.9) 19.7
Government 3 88.9 8 91.4 3 62.3 (62.4) (9.2) (63.2) (16.1)
Central Bank 0 0.0 0 0.0 0 0.0 – – – –
Treasury and Other Govt. 3 88.9 8 91.4 3 62.3 (62.4) (9.2) (63.2) (16.1)
Corporate 0 11.1 1 8.6 2 37.7 141.9 341.5 136.9 307.8
Singapore
Total 73 100.0 80 100.0 87 100.0 8.8 22.5 8.2 18.5
Government 71 97.3 77 95.8 83 95.4 8.3 20.0 7.7 16.1
Central Bank 33 45.8 61 75.6 66 76.6 10.3 104.9 9.6 98.2
Treasury and Other Govt. 38 51.5 16 20.2 16 18.7 1.0 (55.4) 0.4 (56.9)
Corporate 2 2.7 3 4.2 4 4.6 21.0 110.2 20.3 103.3
Thailand
Total 72 100.0 66 100.0 63 100.0 (1.2) (7.2) (5.6) (13.2)
Government 61 84.4 56 84.8 51 81.1 (5.5) (10.7) (9.7) (16.5)
Central Bank 55 76.9 46 70.1 37 59.8 (15.8) (27.8) (19.6) (32.5)
Treasury and Other Govt. 5 7.5 10 14.6 13 21.4 44.1 164.8 37.6 147.7
Corporate 11 15.6 10 15.2 12 18.9 22.4 12.1 16.9 4.9
continued on next page
Bond Market Developments in the Fourth Quarter of 2013 15
On 4 December, Hong Kong Exchanges and Clearing Limited (HKEx) and Singapore Exchange (SGX) agreed to work together to develop cross-border trading and promote the internationalization of the renminbi. On 24 January 2014, MAS announced that all Singapore-incorporated financial institutions that have been approved to conduct fund management activities may apply for an RQFII l icense from the China Securities Regulatory Commission (CSRC) via approved custodian banks.
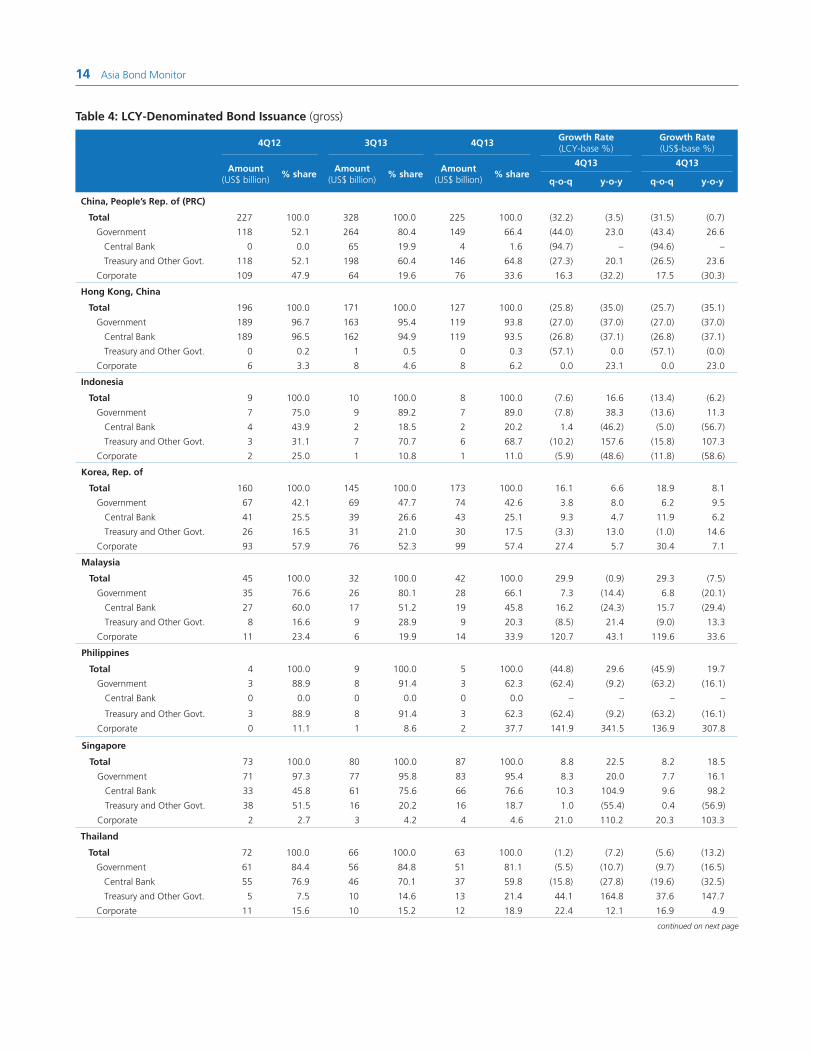
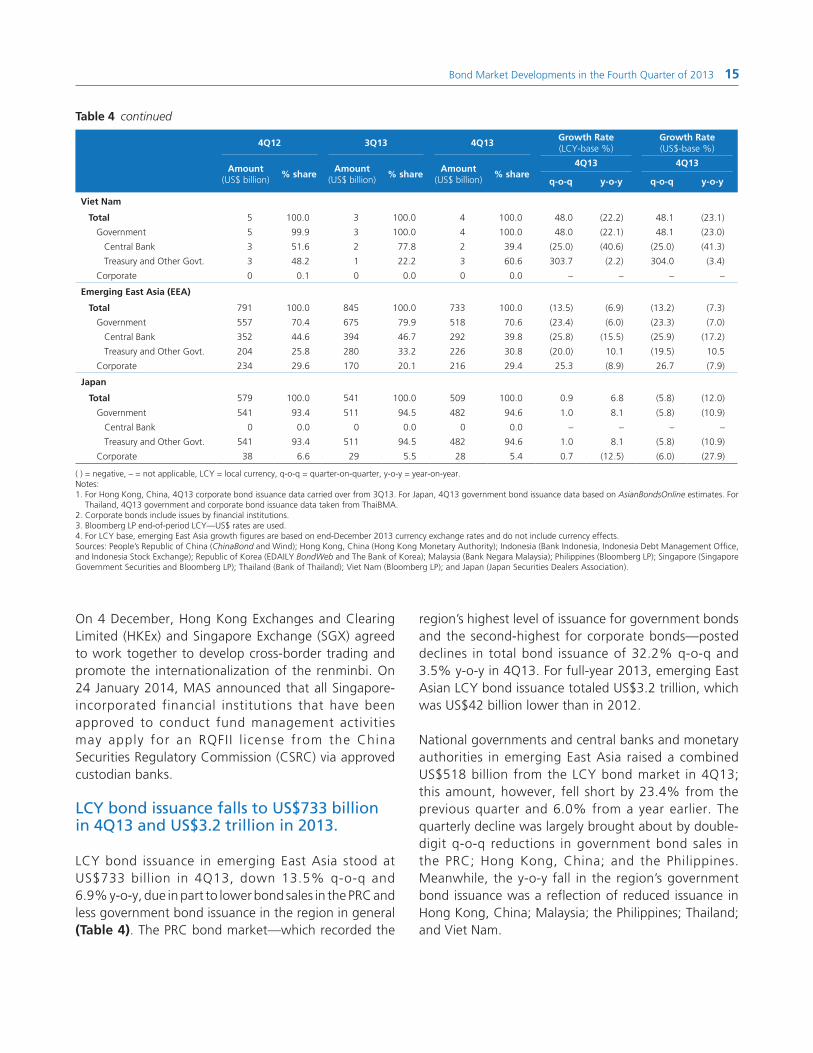
LCY bond issuance falls to US$733 billion in 4Q13 and US$3.2 trillion in 2013.
LCY bond issuance in emerging East Asia stood at US$733 billion in 4Q13, down 13.5% q-o-q and 6.9% y-o-y, due in part to lower bond sales in the PRC and less government bond issuance in the region in general (Table 4). The PRC bond market—which recorded the
region’s highest level of issuance for government bonds and the second-highest for corporate bonds—posted declines in total bond issuance of 32.2% q-o-q and 3.5% y-o-y in 4Q13. For full-year 2013, emerging East Asian LCY bond issuance totaled US$3.2 trillion, which was US$42 billion lower than in 2012.
National governments and central banks and monetary authorities in emerging East Asia raised a combined US$518 billion from the LCY bond market in 4Q13; this amount, however, fell short by 23.4% from the previous quarter and 6.0% from a year earlier. The quarterly decline was largely brought about by double-digit q-o-q reductions in government bond sales in the PRC; Hong Kong, China; and the Philippines. Meanwhile, the y-o-y fall in the region’s government bond issuance was a reflection of reduced issuance in Hong Kong, China; Malaysia; the Philippines; Thailand; and Viet Nam.
Table 4 continued
4Q12 3Q13 4Q13Growth Rate(LCY-base %)
Growth Rate(US$-base %)
Amount (US$ billion)
% shareAmount
(US$ billion)% share
Amount (US$ billion)
% share4Q13 4Q13
q-o-q y-o-y q-o-q y-o-y
Viet Nam
Total 5 100.0 3 100.0 4 100.0 48.0 (22.2) 48.1 (23.1)
Government 5 99.9 3 100.0 4 100.0 48.0 (22.1) 48.1 (23.0)
Central Bank 3 51.6 2 77.8 2 39.4 (25.0) (40.6) (25.0) (41.3)
Treasury and Other Govt. 3 48.2 1 22.2 3 60.6 303.7 (2.2) 304.0 (3.4)
Corporate 0 0.1 0 0.0 0 0.0 – – – –
Emerging East Asia (EEA)
Total 791 100.0 845 100.0 733 100.0 (13.5) (6.9) (13.2) (7.3)
Government 557 70.4 675 79.9 518 70.6 (23.4) (6.0) (23.3) (7.0)
Central Bank 352 44.6 394 46.7 292 39.8 (25.8) (15.5) (25.9) (17.2)
Treasury and Other Govt. 204 25.8 280 33.2 226 30.8 (20.0) 10.1 (19.5) 10.5
Corporate 234 29.6 170 20.1 216 29.4 25.3 (8.9) 26.7 (7.9)
Japan
Total 579 100.0 541 100.0 509 100.0 0.9 6.8 (5.8) (12.0)
Government 541 93.4 511 94.5 482 94.6 1.0 8.1 (5.8) (10.9)
Central Bank 0 0.0 0 0.0 0 0.0 – – – –
Treasury and Other Govt. 541 93.4 511 94.5 482 94.6 1.0 8.1 (5.8) (10.9)
Corporate 38 6.6 29 5.5 28 5.4 0.7 (12.5) (6.0) (27.9)
( ) = negative, – = not applicable, LCY = local currency, q-o-q = quarter-on-quarter, y-o-y = year-on-year.Notes:1. For Hong Kong, China, 4Q13 corporate bond issuance data carried over from 3Q13. For Japan, 4Q13 government bond issuance data based on AsianBondsOnline estimates. For
Thailand, 4Q13 government and corporate bond issuance data taken from ThaiBMA.2. Corporate bonds include issues by financial institutions.3. Bloomberg LP end-of-period LCY—US$ rates are used.4. For LCY base, emerging East Asia growth figures are based on end-December 2013 currency exchange rates and do not include currency effects. Sources: People’s Republic of China (ChinaBond and Wind); Hong Kong, China (Hong Kong Monetary Authority); Indonesia (Bank Indonesia, Indonesia Debt Management Office, and Indonesia Stock Exchange); Republic of Korea (EDAILY BondWeb and The Bank of Korea); Malaysia (Bank Negara Malaysia); Philippines (Bloomberg LP); Singapore (Singapore Government Securities and Bloomberg LP); Thailand (Bank of Thailand); Viet Nam (Bloomberg LP); and Japan (Japan Securities Dealers Association).
16 Asia Bond Monitor
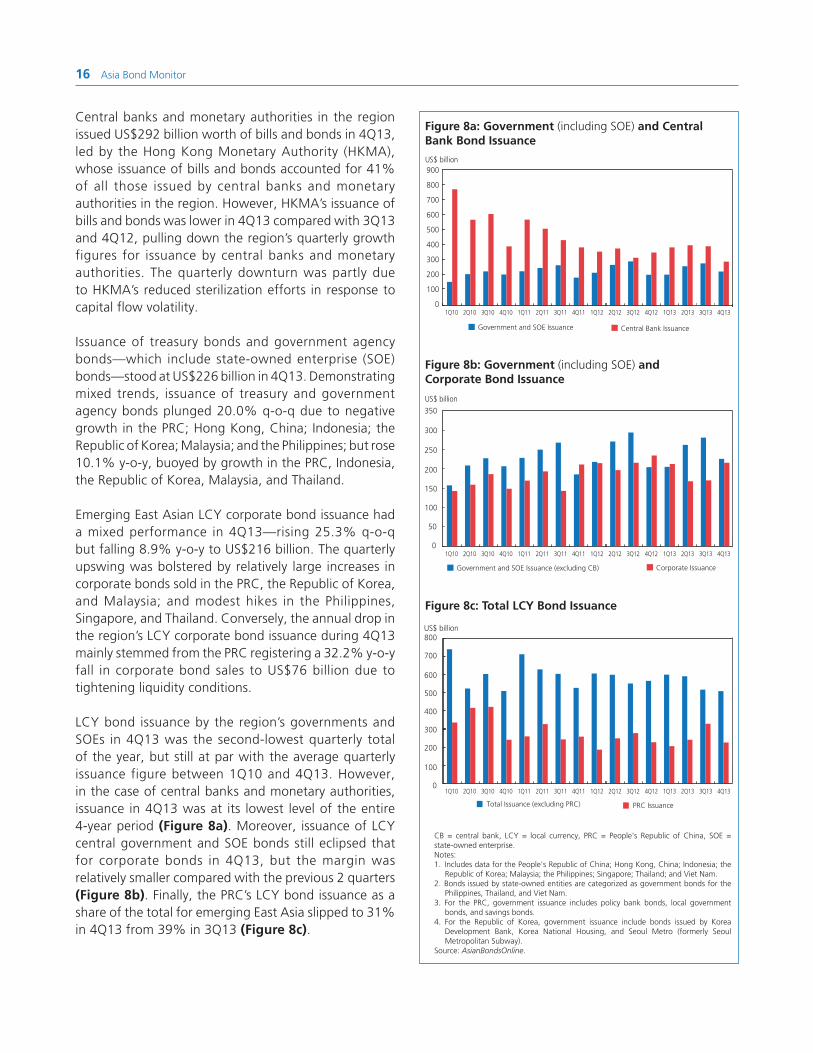
Central banks and monetary authorities in the region issued US$292 billion worth of bills and bonds in 4Q13, led by the Hong Kong Monetary Authority (HKMA), whose issuance of bills and bonds accounted for 41% of all those issued by central banks and monetary authorities in the region. However, HKMA’s issuance of bills and bonds was lower in 4Q13 compared with 3Q13 and 4Q12, pulling down the region’s quarterly growth figures for issuance by central banks and monetary authorities. The quarterly downturn was partly due to HKMA’s reduced sterilization efforts in response to capital flow volatility.
Issuance of treasury bonds and government agency bonds—which include state-owned enterprise (SOE) bonds—stood at US$226 billion in 4Q13. Demonstrating mixed trends, issuance of treasury and government agency bonds plunged 20.0% q-o-q due to negative growth in the PRC; Hong Kong, China; Indonesia; the Republic of Korea; Malaysia; and the Philippines; but rose 10.1% y-o-y, buoyed by growth in the PRC, Indonesia, the Republic of Korea, Malaysia, and Thailand.
Emerging East Asian LCY corporate bond issuance had a mixed performance in 4Q13—rising 25.3% q-o-q but falling 8.9% y-o-y to US$216 billion. The quarterly upswing was bolstered by relatively large increases in corporate bonds sold in the PRC, the Republic of Korea, and Malaysia; and modest hikes in the Philippines, Singapore, and Thailand. Conversely, the annual drop in the region’s LCY corporate bond issuance during 4Q13 mainly stemmed from the PRC registering a 32.2% y-o-y fall in corporate bond sales to US$76 billion due to tightening liquidity conditions.
LCY bond issuance by the region’s governments and SOEs in 4Q13 was the second-lowest quarterly total of the year, but still at par with the average quarterly issuance figure between 1Q10 and 4Q13. However, in the case of central banks and monetary authorities, issuance in 4Q13 was at its lowest level of the entire 4-year period (Figure 8a). Moreover, issuance of LCY central government and SOE bonds still eclipsed that for corporate bonds in 4Q13, but the margin was relatively smaller compared with the previous 2 quarters (Figure 8b). Finally, the PRC’s LCY bond issuance as a share of the total for emerging East Asia slipped to 31% in 4Q13 from 39% in 3Q13 (Figure 8c).
CB = central bank, LCY = local currency, PRC = People's Republic of China, SOE = state-owned enterprise.Notes:1. Includes data for the People's Republic of China; Hong Kong, China; Indonesia; the
Republic of Korea; Malaysia; the Philippines; Singapore; Thailand; and Viet Nam.2. Bonds issued by state-owned entities are categorized as government bonds for the
Philippines, Thailand, and Viet Nam.3. For the PRC, government issuance includes policy bank bonds, local government
bonds, and savings bonds.4. For the Republic of Korea, government issuance include bonds issued by Korea
Development Bank, Korea National Housing, and Seoul Metro (formerly Seoul Metropolitan Subway).
Source: AsianBondsOnline.
Figure 8a: Government (including SOE) and Central Bank Bond Issuance
900
800
700
600
500
400
300
200
100
0
US$ billion
Government and SOE Issuance Central Bank Issuance
Figure 8b: Government (including SOE) and Corporate Bond Issuance
0
50
100
150
200
250
300
350
US$ billion
Government and SOE Issuance (excluding CB)
Total Issuance (excluding PRC) PRC Issuance
Corporate Issuance
Figure 8c: Total LCY Bond Issuance
0
100
200
300
400
500
600
700
800US$ billion
1Q10 2Q10 3Q10 4Q10 1Q11 2Q11 3Q11 4Q11 1Q12 2Q12 3Q12 1Q13 2Q13 4Q133Q134Q12
1Q10 2Q10 3Q10 4Q10 1Q11 2Q11 3Q11 4Q11 1Q12 2Q12 3Q12 1Q13 2Q13 4Q133Q134Q12
1Q10 2Q10 3Q10 4Q10 1Q11 2Q11 3Q11 4Q11 1Q12 2Q12 3Q12 1Q13 2Q13 4Q133Q134Q12

Bond Market Developments in the Fourth Quarter of 2013 17
Emerging East Asian G3 currency bond issuance soars to a record-high US$141.5 billion in 2013.
Emerging East Asian G3 currency bond issuance soared to US$141.5 billion in 2013, which was another record year for the region’s G3 bond market, surpassing its 2012
amount of US$130.8 billion amid relatively low interest rates in G3 economies and the desire of emerging East Asian issuers of G3 debt to lock in these rates (Table 5). About 58% of the region’s G3 currency bond issuance was generated in the first 5 months of 2013 before the tapering announcement by the US Federal Reserve. Issuance in the second half of the year was considerably less.
Table 5: G3 Currency Bond Issuance, 2012 and 2013
2012
IssuerUS$
(million)Issue Date
China, People's Rep. of 31,115CNOOC Finance 3.875% 2022 1,500 2-May-12Sinopec 2.75% 2017 1,000 17-May-12Sinopec 3.9% 2022 1,000 17-May-12Sinopec 4.875% 2042 1,000 17-May-12COSL Finance 3.25% 2022 1,000 6-Sep-12Others 25,615
Hong Kong, China 27,942Hutchison Whampoa 2.5% 2017 1,649 6-Jun-12Hutchison Whampoa 4.625% 2022 1,500 13-Jan-12Others 24,793
Indonesia 12,136Indonesia (Sovereign) 3.75% 2022 2,000 25-Apr-12Indonesia (Sovereign) 5.25% 2042 1,750 17-Jan-12Pertamina 4.875% 2022 1,250 3-May-12Pertamina 6.0% 2042 1,250 3-May-12PLN 5.25% 2042 1,000 24-Oct-12Others 4,886
Korea, Rep. of 30,911Korea Eximbank 4.0% 2017 1,250 11-Jan-12Korea National Oil 3.125% 2017 1,000 3-Apr-12Samsung Electronics 1.75% 2017 1,000 10-Apr-12Others 27,661
Malaysia 6,7781MDB Energy 5.99% 2022 1,750 21-May-12Malayan Banking 3.25% 2022 800 20-Sep-12SSG Resources 4.25% 2022 800 4-Oct-12Others 3,428
Philippines 3,625Philippines (Sovereign) 5.0% 2037 1,500 13-Jan-12Philippines (Sovereign) 2.75% 2023 500 4-Dec-12SM Investments 4.25%2019 500 17-Oct-12Others 1,125
Singapore 12,755Temasek Financial 2.375% 2023 1,200 23-Jul-12DBS Bank 2.35% 2017 1,000 28-Feb-12OCBC Bank 1.625% 2015 1,000 13-Mar-12OCBC Bank 3.15% 2023 1,000 11-Sep-12Others 8,555
Thailand 5,000PTT Global Chemical 4.25% 2022 1,000 19-Mar-12Others 4,000
Viet Nam 550
Emerging East Asia Total 130,814
Memo Items:India 11,217Reliance Holdings 5.4% 2022 1,500 14-Feb-12State Bank of India 4.125% 2017 1,250 1-Aug-12Others 8,467Sri Lanka 2,434
Sources: Bloomberg LP, newspaper and wire reports.
2013
IssuerUS$
(million)Issue Date
China, People's Rep. of 56,709CNOOC Finance 3.0% 2023 2,000 9-May-13Evergrande Real Estate 8.75% 2018 1,500 30-Oct-13Sinopec Group 4.375% 2023 1,500 17-Oct-13CNOOC Curtis Funding 4.5% 2023 1,300 3-Oct-13Sinopec Capital 3.125% 2023 1,250 24-Apr-13Others 49,159
Hong Kong, China 24,011Hutchison Whampoa 3.75% Perpetual 2,367 10-May-13Shimao Property 6.625% 2020 800 14-Jan-13Others 20,844
Indonesia 12,270Pertamina 4.3% 2023 1,625 20-May-13Pertamina 5.625% 2043 1,625 20-May-13Indonesia (Sovereign) 3.375% 2023 1,500 15-Apr-13Indonesia (Sovereign) 4.625% 2043 1,500 15-Apr-13Perusahaan Penerbit SBSN 6.125% 2019 1,500 17-Sep-13Others 4,520
Korea, Rep. of 30,400Korea Eximbank 2.0% 2020 1,369 30-Apr-13The Republic of Korea (Sovereign) 3.875% 2023 1,000 11-Sep-13Korea Development Bank 3.0% 2019 750 17-Sep-13Others 27,281
Malaysia 4,0651MDB Global Investments 4.40% 2023 3,000 19-Mar-13Sime Darby 2.053% 2018 400 29-Jan-13Sime Darby 3.29% 2023 400 29-Jan-13Others 265
Philippines 3,858San Miguel 4.875% 2023 800 26-Apr-13JG Summit 4.375% 2023 750 23-Jan-13Petron 7.50% Perpetual 750 6-Feb-13Others 1,558
Singapore 5,925Olam International 6.75% 2018 750 29-Jan-13Global A&T Electronics 10.00% 2019 625 7-Feb-13Stats Chippac 4.5% 2018 611 20-Mar-13Flextronics International 5.0% 2023 500 20-Feb-13Others 3,439
Thailand 3,445PTT Exploration & Production 3.707% 2018 500 16-Sep-13Others 2,945
Viet Nam 827
Emerging East Asia Total 141,510
Memo Items:India 14,053Bharti Airtel International 5.125% 2023 1,500 11-Mar-13V danta Resources 6.0% 2019 1,200 3-Jun-13Others 11,353Sri Lanka 2,441
18 Asia Bond Monitor
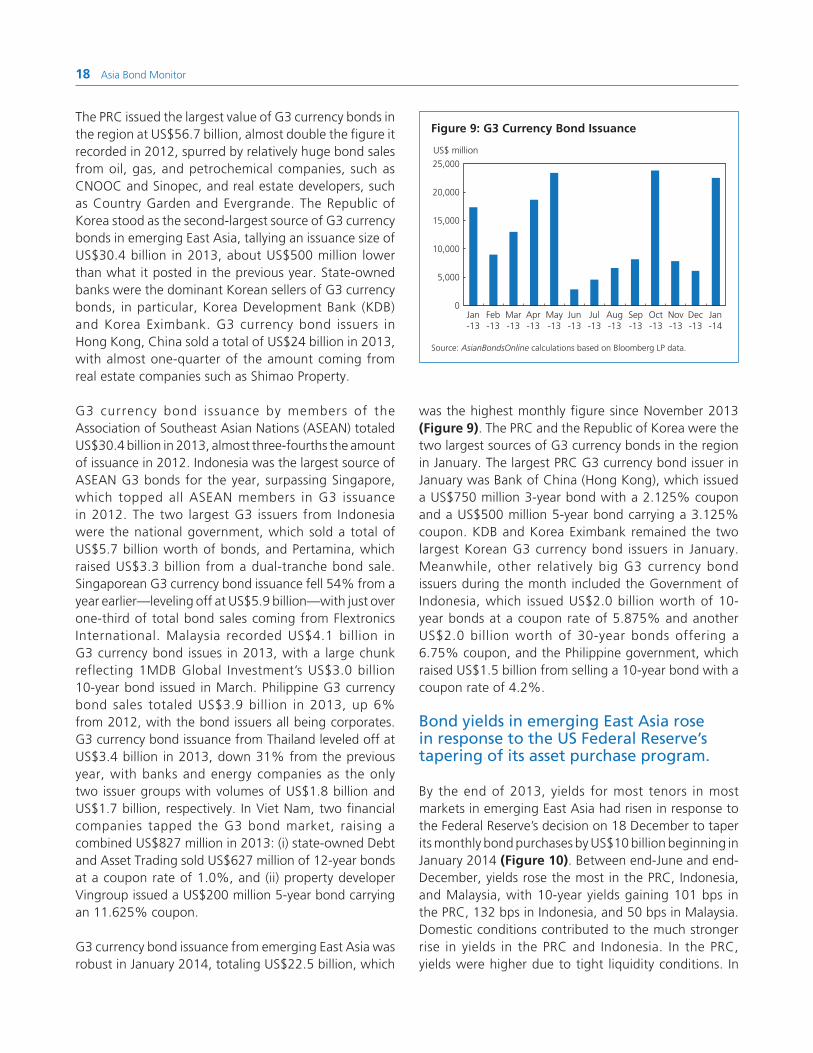
The PRC issued the largest value of G3 currency bonds in the region at US$56.7 billion, almost double the figure it recorded in 2012, spurred by relatively huge bond sales from oil, gas, and petrochemical companies, such as CNOOC and Sinopec, and real estate developers, such as Country Garden and Evergrande. The Republic of Korea stood as the second-largest source of G3 currency bonds in emerging East Asia, tallying an issuance size of US$30.4 billion in 2013, about US$500 million lower than what it posted in the previous year. State-owned banks were the dominant Korean sellers of G3 currency bonds, in particular, Korea Development Bank (KDB) and Korea Eximbank. G3 currency bond issuers in Hong Kong, China sold a total of US$24 billion in 2013, with almost one-quarter of the amount coming from real estate companies such as Shimao Property.
G3 currency bond issuance by members of the Association of Southeast Asian Nations (ASEAN) totaled US$30.4 billion in 2013, almost three-fourths the amount of issuance in 2012. Indonesia was the largest source of ASEAN G3 bonds for the year, surpassing Singapore, which topped all ASEAN members in G3 issuance in 2012. The two largest G3 issuers from Indonesia were the national government, which sold a total of US$5.7 billion worth of bonds, and Pertamina, which raised US$3.3 billion from a dual-tranche bond sale. Singaporean G3 currency bond issuance fell 54% from a year earlier—leveling off at US$5.9 billion—with just over one-third of total bond sales coming from Flextronics International. Malaysia recorded US$4.1 billion in G3 currency bond issues in 2013, with a large chunk reflecting 1MDB Global Investment’s US$3.0 billion 10-year bond issued in March. Philippine G3 currency bond sales totaled US$3.9 billion in 2013, up 6% from 2012, with the bond issuers all being corporates. G3 currency bond issuance from Thailand leveled off at US$3.4 billion in 2013, down 31% from the previous year, with banks and energy companies as the only two issuer groups with volumes of US$1.8 billion and US$1.7 billion, respectively. In Viet Nam, two financial companies tapped the G3 bond market, raising a combined US$827 million in 2013: (i) state-owned Debt and Asset Trading sold US$627 million of 12-year bonds at a coupon rate of 1.0%, and (ii) property developer Vingroup issued a US$200 million 5-year bond carrying an 11.625% coupon.
G3 currency bond issuance from emerging East Asia was robust in January 2014, totaling US$22.5 billion, which
Source: AsianBondsOnline calculations based on Bloomberg LP data.
Figure 9: G3 Currency Bond Issuance
25,000
20,000
15,000
10,000
5,000
0Jan-13
Feb-13
Mar-13
Apr-13
May-13
Jun-13
Jul-13
Aug-13
Sep-13
Oct-13
Nov-13
Dec-13
Jan-14
US$ million
was the highest monthly figure since November 2013 (Figure 9). The PRC and the Republic of Korea were the two largest sources of G3 currency bonds in the region in January. The largest PRC G3 currency bond issuer in January was Bank of China (Hong Kong), which issued a US$750 million 3-year bond with a 2.125% coupon and a US$500 million 5-year bond carrying a 3.125% coupon. KDB and Korea Eximbank remained the two largest Korean G3 currency bond issuers in January. Meanwhile, other relatively big G3 currency bond issuers during the month included the Government of Indonesia, which issued US$2.0 billion worth of 10-year bonds at a coupon rate of 5.875% and another US$2.0 billion worth of 30-year bonds offering a 6.75% coupon, and the Philippine government, which raised US$1.5 billion from selling a 10-year bond with a coupon rate of 4.2%.
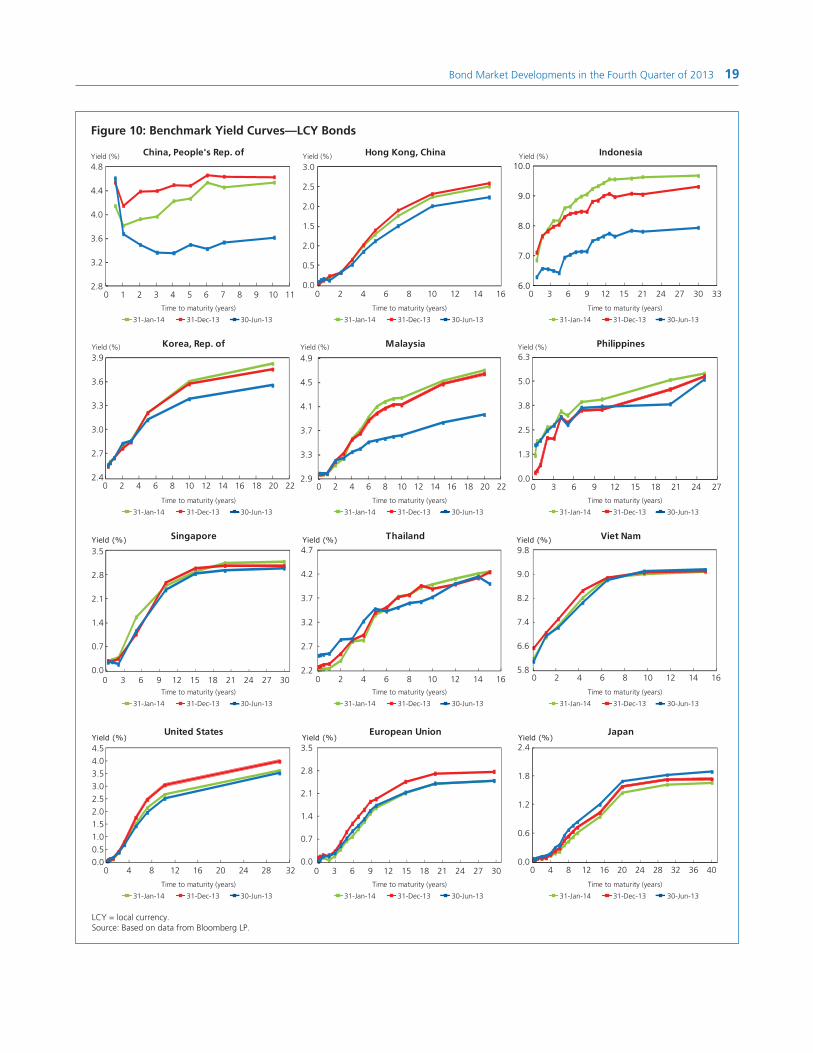
Bond yields in emerging East Asia rose in response to the US Federal Reserve’s tapering of its asset purchase program.
By the end of 2013, yields for most tenors in most markets in emerging East Asia had risen in response to the Federal Reserve’s decision on 18 December to taper its monthly bond purchases by US$10 billion beginning in January 2014 (Figure 10). Between end-June and end-December, yields rose the most in the PRC, Indonesia, and Malaysia, with 10-year yields gaining 101 bps in the PRC, 132 bps in Indonesia, and 50 bps in Malaysia. Domestic conditions contributed to the much stronger rise in yields in the PRC and Indonesia. In the PRC, yields were higher due to tight liquidity conditions. In
Bond Market Developments in the Fourth Quarter of 2013 19
Time to maturity (years)
31-Dec-13 30-Jun-1331-Jan-14
Time to maturity (years)
31-Dec-13 30-Jun-1331-Jan-14
Time to maturity (years)
31-Dec-13 30-Jun-1331-Jan-14
Time to maturity (years)
31-Dec-13 30-Jun-1331-Jan-14
Time to maturity (years)
31-Dec-13 30-Jun-1331-Jan-14
Time to maturity (years)
31-Dec-13 30-Jun-1331-Jan-14
Time to maturity (years)
31-Dec-13 30-Jun-1331-Jan-14
Time to maturity (years)
31-Dec-13 30-Jun-1331-Jan-14
Time to maturity (years)
31-Dec-13 30-Jun-1331-Jan-14
Time to maturity (years)
31-Dec-13 30-Jun-1331-Jan-14
Time to maturity (years)
31-Dec-13 30-Jun-1331-Jan-14
Time to maturity (years)
31-Dec-13 30-Jun-1331-Jan-14
LCY = local currency. Source: Based on data from Bloomberg LP.
United StatesYield (%) Yield (%) Yield (%)
European Union Japan
0 2 4 6 8 10 12 14 16 0 2 4 6 8 10 12 14 16
0 4 8 12 16 20 24 28 32 0 4 8 12 16 20 24 28 32 36 40
0 1 2 3 4 5 6 7 8 9 10 11 0 2 4 6 8 10 12 14 16
0 2 4 6 8 10 12 14 16 18 20 22
0 3 6 9 12 15 21 24 3027 33
0 2 4 6 8 10 12 14 16 18 20 22 0 3 6 9 12 15 18 21 24 27
Figure 10: Benchmark Yield Curves—LCY Bonds
China, People's Rep. ofYield (%) Hong Kong, ChinaYield (%) Yield (%) Indonesia
Yield (%) Yield (%) Yield (%)
3.0
2.5
2.0
1.5
2.0
0.5
0.0
0.0
0.7
1.4
2.1
2.8
3.5
3.5
2.8
2.1
1.4
0.7
0.0
2.4
1.8
1.2
0.6
0.0
4.5
4.0
3.5
3.0
2.5
2.0
1.5
1.0
0.5
0.0
Korea, Rep. of Malaysia Philippines
Singapore Thailand Viet Nam
3.9
3.6
3.3
3.0
2.7
2.4
4.9
4.5
4.1
3.7
3.3
2.9
9.8
9.0
8.2
7.4
6.6
5.8
6.3
5.0
3.8
2.5
1.3
0.0
4.8
4.4
4.0
3.6
3.2
2.8
10.0
9.0
8.0
7.0
6.0
Yield (%) Yield (%) Yield (%)
0 3 6 9 12 15 18 21 2724 30
4.7
4.2
3.7
3.2
2.7
2.20 3 6 9 12 15 18 21 2724 30
20 Asia Bond Monitor
2.25
Hong Kong, ChinaKorea, Rep. ofMalaysia
PhilippinesThailand
7
6
5
4
3
2
1
0
%
Jan-08 Oct-08 Jul-09 Apr-10 Jan-11 Oct-11 Jul-12 Apr-13 Jan-14
0.50
2.50
3.00
3.50
Figure 11a: Policy Rates
Note: Data as of 31 January 2014.Source: Bloomberg LP.
Figure 11b: Policy Rates
Notes:1. Data as of 31 January 2014.2. For Viet Nam, base interest rate was used.Source: Bloomberg LP.
China, People's Rep. ofIndonesiaViet Nam
3
6
9
12
15%
7.50
6.00
9.00
Jan-08 Oct-08 Jul-09 Apr-10 Jan-11 Oct-11 Jul-12 Apr-13 Jan-14
Figure 12a: Headline Inflation Rates
Hong Kong, China
SingaporeIndonesia
ThailandViet Nam
–5
0
5
10
15
20
25
30
%
Note: Data as of end-January 2014 except for Hong Kong, China and Singapore as of end-December 2013.Source: Bloomberg LP.
Jan-08
Jul-08
Feb-09
Aug-09
May-12
Dec-12
Jun-13
Jan-14
Mar-10
Sep-10
Apr-11
Nov-11
8.22
5.45
4.30
1.93
1.50
Figure 12b: Headline Inflation Rates
China, People's Rep. of
Korea, Rep. of
MalaysiaPhilippinesJapan
–3
0
3
6
9
12
%
Note: Data as of end-December 2013 except for the Republic of Korea as of end-January 2014.Source: Bloomberg LP.
4.10
1.10
3.20
2.50
1.60
Jan-08
Jul-08
Feb-09
Aug-09
May-12
Dec-12
Jun-13
Jan-14
Mar-10
Sep-10
Apr-11
Nov-11
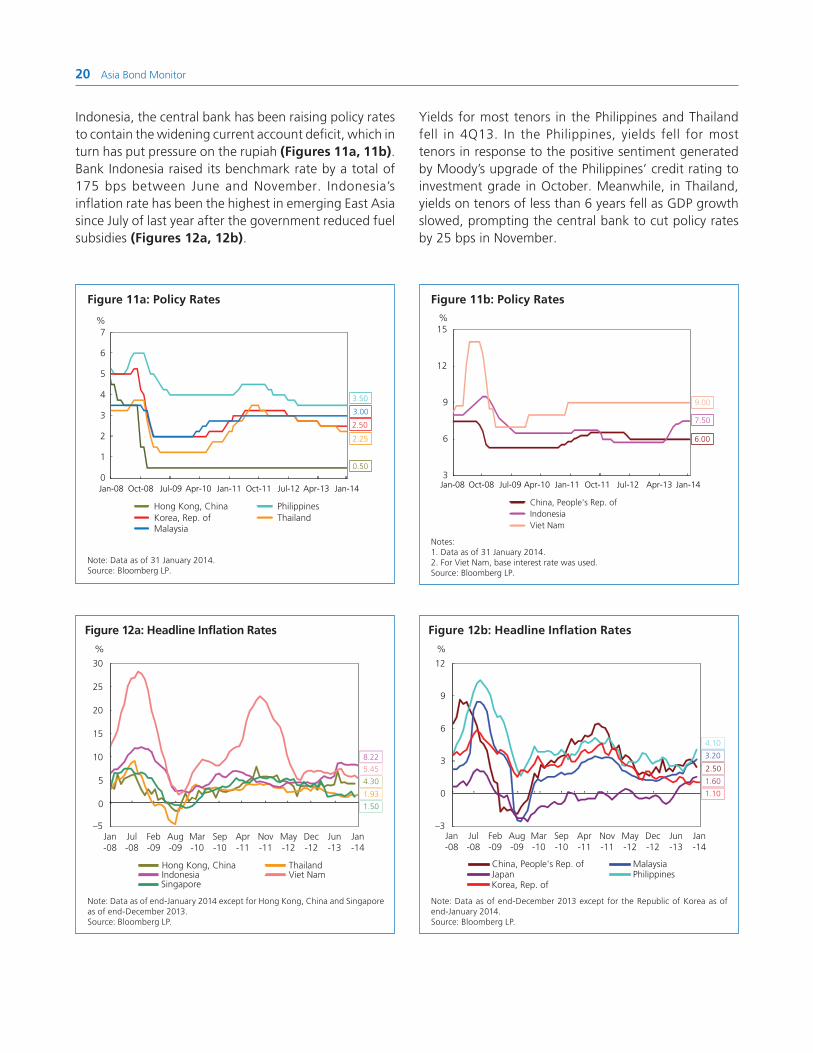
Indonesia, the central bank has been raising policy rates to contain the widening current account deficit, which in turn has put pressure on the rupiah (Figures 11a, 11b). Bank Indonesia raised its benchmark rate by a total of 175 bps between June and November. Indonesia’s inflation rate has been the highest in emerging East Asia since July of last year after the government reduced fuel subsidies (Figures 12a, 12b).
Yields for most tenors in the Philippines and Thailand fell in 4Q13. In the Philippines, yields fell for most tenors in response to the positive sentiment generated by Moody’s upgrade of the Philippines’ credit rating to investment grade in October. Meanwhile, in Thailand, yields on tenors of less than 6 years fell as GDP growth slowed, prompting the central bank to cut policy rates by 25 bps in November.

Bond Market Developments in the Fourth Quarter of 2013 21
By end-January 2014, the Federal Reserve had decided to cut its bond purchasing program by an additional US$10 billion per month. Yields rose strongly for most tenors in Indonesia and the Philippines as a result, with the 10-year yield rising 58 bps in Indonesia and 52 bps in the Philippines. In Indonesia, negative sentiment continued to prevail amid persistently high inflation. Bank Indonesia stated that inflation is expected to remain elevated given the recent supply shocks due to flooding.
In the Philippines, yields reacted on expectations of a power rate hike and concerns over the peso’s further depreciation. On the other hand, yields fell strongly in the PRC, particularly at the shorter-end of the curve, with 1-year interest rates falling 33 bps. Yield movements were driven by easing concerns over liquidity as the central bank injected liquidity through the use of reverse repos as the Chinese New Year holiday approached.
Yields for tenors of 1 year or more fell in Hong Kong, China in January in line with declines in US yields. Meanwhile, the 10-year yield in Singapore also fell 10 bps in January. (Yields in Hong Kong, China and Singapore are closely correlated with movements in the US due to the linking of their currencies with the US dollar.) Yields declined in the US due to risk aversion as investors concerned about an emerging market slowdown sought a safe haven in US assets.
The yield spread between 2- and 10-year government bonds in most markets in emerging East Asia widened between end-June 2013 and end-January 2014, with the exception of Singapore and Viet Nam, as yields on the longer-end of government bond curves rose more than on the shorter-end in response to US Federal Reserve tapering (Figure 13).
Corporate yields widened versus government yields.
Credit spreads between AAA-rated corporate bonds and government bonds in the PRC widened for most
tenors, particularly for tenors of 15 years or less, due to tighter monetary policy in the PRC between end-June 2013 and end-January 2014. At the start of June, the 1-week repo rate was at 3.5%, but by end-January the rate had risen to 4.95%. The People’s Bank of China (PBOC) has released statements saying it will maintain tight control over liquidity. In the Republic of Korea, credit premiums also widened on the back of higher net bond redemptions in December, reducing demand for corporate bonds. In Malaysia, credit spreads between AAA-rated corporate bonds and government bonds fell between end-June 2013 and end-January 2014 (Figure 14a).
Credit spreads between AAA-rated and lower-rated corporate bonds were roughly unchanged over the same period in all markets, with the exception of the PRC where liquidity concerns led to widening spreads (Figure 14b).
31-Dec-13 31-Jan-1430-Jun-13
Source: Based on data from Bloomberg LP.
Figure 13: Yield Spreads Between 2- and 10-Year Government Bonds
basis points
China, People’s Rep. of
Hong Kong, China
Indonesia
Korea, Rep. of
Malaysia
Philippines
Singapore
Thailand
Viet Nam
United States
European Union
Japan
0 40 80 120 160 200 280240

22 Asia Bond Monitor
Figure 14a: Credit Spreads—LCY Corporates Rated AAA vs. Government Bonds
LCY = local currency. Note: Credit spreads are obtained by subtracting government yields from corporate indicative yields.Sources: People's Republic of China (Wind), Republic of Korea (EDAILY BondWeb), and Malaysia (Bank Negara Malaysia).
Figure 14b: Credit Spreads—Lower-Rated LCY Corporates vs. LCY Corporates Rated AAA
LCY = local currency.Notes:1. For the People's Republic of China and the Republic of Korea, credit spreads are obtained by subtracting corporate indicative yields rated AAA from corporate indicative
yields rated BBB.2. For Malaysia, credit spreads are obtained by subtracting corporate indicative yields rated AAA from corporate indicative yields rated BBB.Sources: People's Republic of China (Wind), Republic of Korea (EDAILY BondWeb), and Malaysia (Bank Negara Malaysia).
China, People's Rep. of
0 5 10 15 20 25 30
11.0
9.8
8.5
7.3
6.02 4 6 8 10 12 14 16
% Malaysia%10.0
8.0
7.0
6.0
5.0
4.0
4.0
3.0
2.0
1.00.5 1.5 2.5 3.5 4.5 5.5
% Korea, Rep. of
0.5
0.4
0.3
0.2
0.1
0.00.5 1.5 2.5 3.5 4.5 5.5
% Korea, Rep. of
31-Jan-14 31-Dec-13 30-Jun-13
Time to maturity (years)
31-Jan-14 31-Dec-13 30-Jun-13
Time to maturity (years)
31-Jan-14 31-Dec-13 30-Jun-13
Time to maturity (years)
31-Jan-14 31-Dec-13 30-Jun-13
Time to maturity (years)
31-Jan-14 31-Dec-13 30-Jun-13
Time to maturity (years)
31-Jan-14 31-Dec-13 30-Jun-13
Time to maturity (years)
China, People's Rep. of
0 5 10 15 20 25 30
0.8
0.6
0.4
0.2
0.02 4 6 8 10 12 14 16
% Malaysia%
2.5
2.0
1.5
1.0
0.5
0.0

Policy and Regulatory Developments 23Policy and Regulatory DevelopmentsPeople’s Republic of China
Shanghai Free Trade Zone Processes Cross-Border Renminbi Payments
On 18 February, the People’s Bank of China (PBOC) announced it would allow five payment companies to process cross-border renminbi payments in the Shanghai Free Trade Zone: Allinpay, 99Bill, ChinaPay, Dongfang Electronics, and Shengpay. The five companies will open accounts with the Shanghai branches of ICBC, Bank of China (BoC), CBC, China Merchants Bank, and China Minsheng Bank to help facilitate the transfers.
PBOC Resumes Repo Auctions
On 18 February, the PBOC conducted its first repo auction in 8 months when it auctioned 14-day repurchase agreements at a rate of 3.8%. The total amount issued was CNY48 billion.
CIRC Relaxes Investment Limits for Insurance Companies
On 19 February, the China Insurance Regulatory Commission (CIRC) released new regulations regarding allowable investments for insurance companies. There will no longer be limits for fixed- income investments. Prior to this, fixed-income investing had some restrictions, such as investments only in corporate bonds with credit ratings of BBB and above, as well as a 40% limit in corporate bonds.
Limits on equity investments were also raised to 30%. Prior to this, the limits were 25% in listed equities, and 10% in unlisted equities and equity investment funds.
Banks Liquidity Coverage Ratio Requirement Increased
On 20 February, the China Banking Regulatory Commission (CBRC) announced new rules requiring banks to maintain a 100% Liquidity Coverage Ratio (LCR) by 2018 compared with the prior requirement of 60%. The LCR requirement will increase by 10% each year until reaching 100% in 2018.
Hong Kong, China
Hong Kong, China and Malaysia to Promote Offshore Renminbi Business
On 3 December, Hong Kong, China and Malaysia conducted the first meeting of the Hong Kong–Malaysia Private Sector Dialogue on Offshore Renminbi Business. The purpose of the dialogue is to jointly develop the offshore renminbi business. During the dialogue, both economies agreed to expand cooperation between banks in Hong Kong, China and Malaysia. They also agreed to promote awareness about the use of the renminbi in trade settlement and promote the development of the reminbi sukuk (Islamic bond) market.
Indonesia
Bank Indonesia Signs MRA with Domestic Banks
On 18 December, a mini Master Repo Agreement (MRA) was signed between Bank Indonesia and eight Indonesian banks. The mini MRA will serve as a standard contract for interbank repo transactions. The eight banks include Bank Mandiri, Bank Rakyat Indonesia, Bank Negara Indonesia, Bank Central Asia, Bank Panin, Bank Bukopin, Bank DKI, and Bank Jabar Banten. This move is expected to promote and deepen the repo market as most transactions were previously undertaken through bilateral agreements due to the absence of a standardized global MRA in Indonesia.
Bank Indonesia Issues New Regulations for Hedge Swap Transactions
As part of efforts to deepen Indonesia’s domestic foreign exchange market, Bank Indonesia announced new regulations to expand currency swap facilities for hedging transactions. The new regulations, which took effect on 3 February, aim to minimize exchange rate risks and increase investment activities in Indonesia. Under the new regulations, a hedging contract may be entered into by a bank within a period of up to 3 years through hedge swap transactions with Bank Indonesia at maturities of 3, 6, and 12 months. Other regulatory improvements were

24 Asia Bond Monitor
also announced, including the expansion of underlying transaction coverage, the extension of transaction tenors, and settlement by netting.
Republic of Korea
MOSF Introduces Policy Directions for KTB Market
The Ministry of Strategy and Finance (MOSF) announced in December policy measures for the management and development of the Korea Treasury Bonds (KTB) market. MOSF specifically noted the need for smooth fiscal fund-raising through the stable issuance of KTBs. To achieve this, MOSF cited maintaining the monthly KTB issuance volume at KRW8 trillion, optimizing the proportion of KTB issuance by tenor, and making slight adjustments to KTB issuance plans based on market conditions. In addition, MOSF also aims to promote KTBs as a benchmark in capital markets and cited the need for consolidation of data and information on KTBs managed by different institutions, amendments on KTB futures by tenor (e.g., introducing the issuance of longer-term KTB futures), and extensive revision of the relevant act on government bonds.
MOSF Revises Regulations on KTB Issuance and the Primary Dealer Management System
MOSF revised regulations on KTB issuance and the primary dealer management system, effective 1 January. Among the major revisions were the strengthening of the role of primary dealers in holding KTBs; adding the trading performance of primary dealers in “off-the-run” KTBs listed on the Korea Exchange as an evaluation item; reducing the interval in the differential pricing auction for 10-year KTBs from 3 basis points (bps) to 2 bps; and equal treatment in the evaluation of both conversions and buy-backs, with evaluations to be conducted on a monthly basis instead of a quarterly basis.
Malaysia
Hong Kong, China and Malaysia Hold Joint Forum on Islamic Finance
On 3 December, the Hong Kong Monetary Authority (HKMA) and Bank Negara Malaysia (BNM) facilitated a forum on Islamic finance, with participants from
eight commercial banks and three fund management companies. The Financial Services and the Treasury Bureau of Hong Kong, China; the Securities and Futures Commission of Malaysia; and the Hong Kong Exchanges and Clearing Limited also joined the meeting.
The forum reviewed the current developments of Islamic finance globally and in both jurisdictions, and discussed measures to further the development of Hong Kong, China’s Islamic financial market, particularly the sukuk market and the Islamic fund management industry.
The participants agreed to (i) identify potential sukuk issuers, particularly corporates, and encourage cross-border sukuk issuances between Hong Kong, China and Malaysia; and (ii) actively consider launching Islamic funds and making use of the established mutual recognition framework for Islamic funds between Hong Kong, China and Malaysia to facilitate cross-border Islamic financial activities.
Philippines
BSP Issues Circular on Amendments to Regulations on FX Transactions
On 7 November, the Bangko Sentral ng Pilipinas (BSP) released the implementing circular on the amendments to the manual regulations on foreign exchange (FX) transactions. This included (i) allowing prepayment of BSP-registered short-term loans subject to required documents, (ii) waiver of the submission of documents to support reports on importations under documents against acceptance and open account arrangements, and (iii) clarification of the prescriptive period for filing requests for BSP registration of foreign direct investment and rules on currency swaps.
BSP Liberalizes Rules on the Issuance of LTNCTDs
On 23 December, the Monetary Board of BSP issued new guidelines liberalizing the issuance of Long-Term Negotiable Certificates of Time Deposits (LTNCTDs). This included lifting the PHP5 billion issue size cap for LTNCTD offerings by banks. With this are also refinements of the rules to promote issuer accountability. These include raising the reserve requirement from 3% to 6% of outstanding LTNCTDs, and listing the instruments on an accredited exchange platform.

Policy and Regulatory Developments 25
Singapore
HKEx and SGX Cooperate on RMB Internationalization
On 4 December 2013, Hong Kong Exchanges and Clearing Limited (HKEx) and Singapore Exchange (SGX) signed a Memorandum of Understanding (MOU) that enables both exchanges to cooperate in promoting the internationalization of the renminbi. This cooperation can be in the form of product development, connectivity enhancement, technology development, and extraterritorial market infrastructure regulation.
RQFII License Applications Open for Eligible Singaporean Financial Institutions
On 24 January, the Monetary Authority of Singapore (MAS) announced that all Singapore-incorporated financial institutions that are approved by MAS to conduct fund management activities may submit applications for the Renminbi Qualified Foreign Institutional Investor (RQFII) license. This will allow them to offer renminbi investment products as well as invest offshore renminbi into the PRC’s securities market. This move followed the recent allocation of an aggregate quota of CNY50 billion to Singapore under the PRC’s RQFII program.
Thailand
SEC Sets Strategic Plans for Capital Market Development
The Securities and Exchange Commission (SEC) of Thailand announced in January its 2014–16 strategic plans for the development of Thailand’s capital market. The objective of the plan is to step up capital market development in Thailand—specifically in the areas of corporate governance, market capitalization, liquidity, and sustainable development—in order to widen the market’s visibility in the international community. The SEC also announced its key initiatives for 2014 that aim to improve the public’s awareness and understanding of savings and investments. Furthermore, the SEC stated that it plans to carry out measures to issue regulations
that will accommodate overseas offerings of equities, debt, and mutual funds, as well as conduct studies on the laws and regulations of overseas jurisdictions in order to facilitate the listing of foreign securities on the Stock Exchange of Thailand (SET).
SEC Revises Rules Governing Provident Fund Investments
The SEC announced in January revisions to the rules on provident fund investments, which are consistent with international standards, in order to provide greater investment opportunities and more clarity for provident funds. Effective 1 January, provident funds were allowed to invest in derivatives up to a permissible proportion for “efficient portfolio management” purposes.
Viet Nam
Government Issues New Decree on SBV
On 11 November, the government issued Decree No. 156/2013/ND-CP regulating functions, tasks, powers, and the organizational structure of the State Bank of Viet Nam (SBV). The decree states the tasks of SBV to include macroeconomic stability, inflation targeting and control, and ensuring credit institutions’ sound operations within the legal framework. SBV is also tasked to implement national monetary policy, including re-financing, interest rates, exchange rates, reserve requirements, open market operations, and other tools and measures. The decree took effect on 26 December 2013.
Viet Nam’s 2014 State Budget Approved
On 12 November, the National Assembly of Viet Nam approved the 2014 target economic indicators, including (i) 5.8% gross domestic product (GDP) growth, up from an estimated 5.4% in 2013; (ii) 7.0% inflation, slightly higher than 6.6% in 2013; (ii) VND782.7 trillion in state budget revenue and VND 1,006.7 trillion in budget expenditure; and (iii) a state budget deficit of VND224.0 trillion, or 5.3% of GDP. The largest portion of the state budget was allocated for development investments and debt payments.

Introduction
Sukuk, the plural form of the word sakk, refers to an investment certificate that is deemed to be compliant with Islamic financing principles. In the past, sukuk were used to facilitate trade transactions among merchants by serving as promissory notes. Historical records show that these notes were widely traded and exchanged.
Contemporary sukuk are used to raise funds for investments in a manner compatible with Islamic principles. Given that some sukuk are similar to conventional bonds, they have often been called “Islamic bonds.” However, there are key differences between sukuk and conventional bonds. Most importantly, the structure of sukuk has to conform to that of the religious principles of shari’ah. In practice, a shari’ah advisory board is usually set up and consulted to ensure that the sukuk being structured comply with Islamic principles. An overarching principle in Islamic finance is that transactions should be grounded in real productive economic activities. Transactions that are mostly monetary or speculative in nature are forbidden. Specifically, there are five forbidden activities that sukuk have to avoid:
Prohibition against unjust enrichment (• riba). This is more commonly known as the prohibition against the payment of interest. Under Islamic law, money is treated as a means of exchange rather than a store of value. Hence, there is no expectation of profiting from lending money. Instead profit should be the reward for entrepreneurs who are carrying out economically productive activities. Because of the prohibition against the payment of interest, Islamic financial contracts tend to be structured around real assets such as commodities and real estate. Prohibition against gambling or speculation •(masir). Shari’ah also does not allow transactions that are based on speculation or luck rather than productive activity. This is because Islam views gambling as immoral. Hence, most conventional futures, forwards, and options contracts are not permissible under shari’ah. Prohibition against unnecessary risk (• gharar). Under Islamic principles, there can be no uncertainty
Sukuk in Emerging East Asia: Trends and Future Challenges
in a contract. All of a contract’s terms have to be spelled out to avoid either party from taking on unnecessary risk. Prohibition against taking unfair advantage •(jahl). Islamic principles forbid one party in a contract to take unfair advantage of the other party. Hence, there should not be an attempt to exploit another party’s lack of knowledge or financial situation. Prohibition against corruption (• rishwah). In addition for the structure of the financial transaction to comply with Islamic principles, the transaction also must not have unethical or illegal purposes. As a result, contracts cannot be written covering activities that are forbidden by Islam such as casino operations and many conventional financial services.
In an attempt to standardize the definition of sukuk, the Accounting and Auditing Organization for Islamic Financial Institutions (AAOIFI) in May 2003 defined sukuk as “certificates of equal value representing undivided shares in ownership of tangible assets, usufruct and services or (in the ownership of) the assets of particular projects or special investment activity.” AAOIFI also distinguishes sukuk from conventional bonds by emphasizing that sukuk are not claims on cash flows and cannot be based on a pool of receivables. Instead, sukuk should be seen as investment certificates with claims on assets and the right to a share of the cash flow that accrues from the ownership of the assets.
AAOIFI has identified at least 14 types of permissible sukuk , ranging from instruments with equity-l ike characteristics to asset-backed securities. However, only several of the allowed sukuk structures are commonly used. They are murabahah, an arrangement where goods are sold at a mark-up and then payment is spread over a period of time; salam, an arrangement where the buyer prepays for an asset to be delivered in the future; ijarah, a lease arrangement where the use of an asset is leased out in return for regular payments; istisna, an arrangement used to finance the sale of an asset that is currently under construction or not yet built; mudarahbah, a partnership arrangement where one partner supplies capital and the other offers expertise; and musharakah, a joint venture arrangement where both parties provide capital.

Sukuk in Emerging East Asia: Trends and Future Challenges 27
The most important characteristic of sukuk is that they represent a claim on an existing or well-defined asset. Meanwhile, conventional bonds represent an obligation to make periodic interest payments and principal upon maturity. Hence, sukuk can be seen as more closely related to asset-based securities. The other important characteristic is that the underlying asset for the sukuk must be shari’ah-compliant. This means that the assets cannot be involved in activities that are not permissible under Islamic law such as gambling or the sale of alcohol.
Global Trends in Sukuk
Islamic finance continued to post robust growth rates in 2013 amid a challenging global environment. Based on estimates released by the Malaysia International Islamic Financial Centre (MIFC), the size of the Islamic global asset portfolio reached US$1.8 trillion at end-2013, with double-digit expansions noted across all segments.6 The Islamic banking sector continued to spur this growth, accounting for almost 80% of the total Islamic global asset portfolio. The sukuk segment followed with an asset contribution of 15% of the total, while funds and takaful (insurance) accounted for 4% and 1%, respectively. There is an opportunity for the sukuk segment to further expand its contribution to the Islamic asset portfolio. For example, there is huge unfulfilled demand for shari’ah investment products in the Middle East as well as in emerging East Asia.7
6 MIFC. 2014. Islamic Finance Industry Outperforms in 2013. Insights. 15 January.7 In this special section, emerging East Asia refers to Brunei Darussalam; the People’s Republic of China (PRC); Hong Kong, China; Indonesia; the Republic of Korea; Malaysia; the Philippines; Singapore; Thailand; and Viet Nam.
Since 2001, the global sukuk market has grown by leaps and bounds, posting compounded annual growth rates of 27.8%. From just US$14.8 billion in 2001, the amount of sukuk outstanding globally reached US$281.3 billion at end-2013 (Figure 15). Malaysia remained the largest sukuk market, accounting for 58.1% of total outstanding sukuk. Middle Eastern countries account for 30% of the total, while other emerging East Asian markets (excluding Malaysia) only account for 6%. Malaysia continues to dominate the local currency (LCY)-denominated sukuk market, while the Middle Eastern markets are the most active issuers of foreign currency (FCY)-denominated sukuk (Figure 16).8 At
8 LCY-denominated sukuk are defined as sukuk denominated in the issuer’s home currency (e.g., a Malaysian company issuing MYR-denominated sukuk). FCY-denominated sukuk are defined as sukuk denominated in a currency other than the issuer’s home currency (e.g., a Middle Eastern company issuing US$-denominated sukuk).
FCY = foreign currency, LCY = local currency.Sources: Autoriti Monetari Brunei Darussalam, Bank Negara Malaysia Fully Automated System for Issuing/Tendering (FAST), Bloomberg LP, Indonesia Debt Management Office, Indonesia Stock Exchange, and Otoritas Jasa Keuangan.
Figure 16: Global Sukuk Outstanding by Region (as of end-December 2013)
LCY-denominated
Other EmergingEast AsianMarkets
10%
Other EmergingEast AsianMarkets
4%
Middle East21%
Rest ofthe World
16%
Rest ofthe World
3%
Malaysia12%
Malaysia72%
Middle East62%
FCY-denominated
Sources: Autoriti Monetari Brunei Darussalam, Bank Negara Malaysia Fully Automated System for Issuing/Tendering (FAST), Bloomberg LP, Indonesia Debt Management Office, Indonesia Stock Exchange, and Otoritas Jasa Keuangan.
Figure 15: Size of Global Sukuk Market
300
250
200
150
100
50
02001 2002 2003 2004 2005 2006 2007 2008 2009 2010 2011 2012 2013
US$ billion
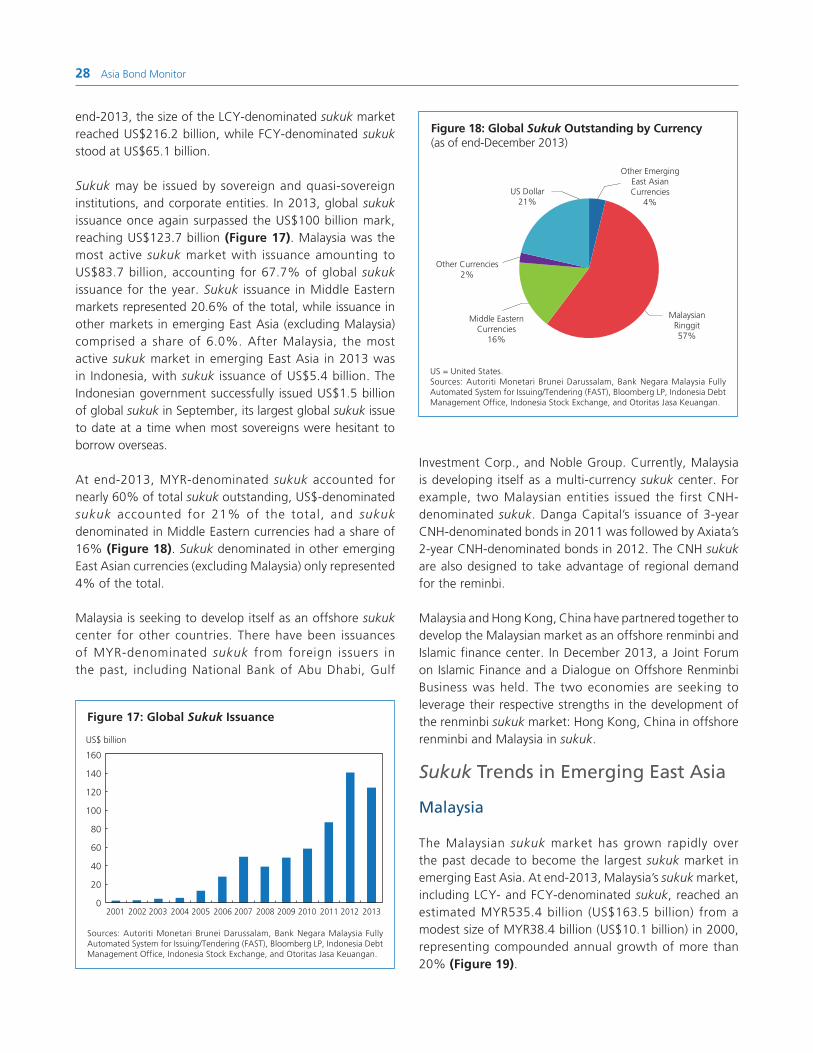
28 Asia Bond Monitor
end-2013, the size of the LCY-denominated sukuk market reached US$216.2 billion, while FCY-denominated sukuk stood at US$65.1 billion.
Sukuk may be issued by sovereign and quasi-sovereign institutions, and corporate entities. In 2013, global sukuk issuance once again surpassed the US$100 billion mark, reaching US$123.7 billion (Figure 17). Malaysia was the most active sukuk market with issuance amounting to US$83.7 billion, accounting for 67.7% of global sukuk issuance for the year. Sukuk issuance in Middle Eastern markets represented 20.6% of the total, while issuance in other markets in emerging East Asia (excluding Malaysia) comprised a share of 6.0%. After Malaysia, the most active sukuk market in emerging East Asia in 2013 was in Indonesia, with sukuk issuance of US$5.4 billion. The Indonesian government successfully issued US$1.5 billion of global sukuk in September, its largest global sukuk issue to date at a time when most sovereigns were hesitant to borrow overseas.
At end-2013, MYR-denominated sukuk accounted for nearly 60% of total sukuk outstanding, US$-denominated sukuk accounted for 21% of the total, and sukuk denominated in Middle Eastern currencies had a share of 16% (Figure 18). Sukuk denominated in other emerging East Asian currencies (excluding Malaysia) only represented 4% of the total.
Malaysia is seeking to develop itself as an offshore sukuk center for other countries. There have been issuances of MYR-denominated sukuk from foreign issuers in the past, including National Bank of Abu Dhabi, Gulf
Investment Corp., and Noble Group. Currently, Malaysia is developing itself as a multi-currency sukuk center. For example, two Malaysian entities issued the first CNH-denominated sukuk. Danga Capital’s issuance of 3-year CNH-denominated bonds in 2011 was followed by Axiata’s 2-year CNH-denominated bonds in 2012. The CNH sukuk are also designed to take advantage of regional demand for the reminbi.
Malaysia and Hong Kong, China have partnered together to develop the Malaysian market as an offshore renminbi and Islamic finance center. In December 2013, a Joint Forum on Islamic Finance and a Dialogue on Offshore Renminbi Business was held. The two economies are seeking to leverage their respective strengths in the development of the renminbi sukuk market: Hong Kong, China in offshore renminbi and Malaysia in sukuk.
Sukuk Trends in Emerging East Asia
Malaysia
The Malaysian sukuk market has grown rapidly over the past decade to become the largest sukuk market in emerging East Asia. At end-2013, Malaysia’s sukuk market, including LCY- and FCY-denominated sukuk, reached an estimated MYR535.4 billion (US$163.5 billion) from a modest size of MYR38.4 billion (US$10.1 billion) in 2000, representing compounded annual growth of more than 20% (Figure 19).
Sources: Autoriti Monetari Brunei Darussalam, Bank Negara Malaysia Fully Automated System for Issuing/Tendering (FAST), Bloomberg LP, Indonesia Debt Management Office, Indonesia Stock Exchange, and Otoritas Jasa Keuangan.
Figure 17: Global Sukuk Issuance
160
140
120
100
80
60
40
20
02001 2002 2003 2004 2005 2006 2007 2008 2009 2010 2011 2012 2013
US$ billion
Figure 18: Global Sukuk Outstanding by Currency (as of end-December 2013)
Other EmergingEast AsianCurrencies
4%
Middle EasternCurrencies
16%
Other Currencies2%
MalaysianRinggit57%
US Dollar21%
US = United States.Sources: Autoriti Monetari Brunei Darussalam, Bank Negara Malaysia Fully Automated System for Issuing/Tendering (FAST), Bloomberg LP, Indonesia Debt Management Office, Indonesia Stock Exchange, and Otoritas Jasa Keuangan.

Sukuk in Emerging East Asia: Trends and Future Challenges 29
The enactment of the Islamic Banking Act of 1983 and the establishment of the country’s first Islamic Bank, Bank Islam Malaysia, have been instrumental in the development of Malaysia’s sukuk market. When Bank Islam Malaysia commenced operations in 1983, it could not purchase or trade interest-bearing instruments like government securities or treasury bills. To address the bank’s operations and liquidity requirements, the Government Investment
Act of 1983 was passed, enabling the Government of Malaysia to issue its first Islamic government debt, known as Government Investment Certificates (GICs), under the concept of qard al-hassan (arrangement to extend goodwill for welfare purposes) in July 1983. GICs were replaced by Government Investment Issues (GIIs) in July 2001, an instrument that is based on the bay’ al-inah (arrangement that involves the sale and buyback of an asset) principle, to facilitate trading in the secondary market.
GIIs are an integral part of the Malaysian government sukuk market, representing 74% of total government sukuk (Table 6). GIIs are long-term, non-interest-bearing government securities issued to raise funds for developmental expenditure from the domestic capital market. Just like conventional Malaysian Government Securities (MGSs), GIIs are issued through competitive auction by Bank Negara Malaysia (BNM) on behalf of the government. The GII issuance program is pre-announced, with issuance sizes ranging from MYR2 billion to MYR5 billion, and original maturities of 3, 7, 5, 10, 15, and 20 years. Beginning 22 July 2013, new GIIs were issued based on the murabahah structure, setting another milestone in the development of Malaysia’s sovereign sukuk market.
Both the government and corporate sukuk markets have experienced tremendous growth momentum in
Notes:1. Data include local currency and foreign currency sukuk.2. Bloomberg LP end-of-period LCY–US$ rates are used.Sources: Bank Negara Malaysia Fully Automated System for Issuing/Tendering (FAST) and Bloomberg LP.
Figure 19: Sukuk Outstanding in Malaysia
180
160
140
120
100
80
60
40
20
02000 2001 2002 2003 2004 2005 2006 2007 2008 2009 2010 2011 2012 2013
US$ billion
Government Corporate
Table 6: Size and Composition of the Government Sukuk Market in Malaysia
Instrument
Outstanding Amount (billion) Structure
MYR US$
Total 233.8 71.4
LCY Government 223.2 68.1
Government Investment Issue 153.5 46.9 Bay' al-Inah
Government Investment Issue 19.0 5.8 Murabahah
Bank Negara Monetary Notes 38.8 11.8 Murabahah
Bank Negara Monetary Notes 1.0 0.3 Istithmar
Malaysian Treasury Bills 2.0 0.6 Bay' al-Inah
Sukuk Perumahan Kerajaan 8.9 2.7 Murabahah
FCY Government 10.6 3.3
1Malaysia Sukuk Global 4.1 1.3 Ijarah
Wakala Global Sukuk 6.6 2.0 Wakalah bi al-Istithmar
FCY = foreign currency, LCY = local currency.Notes: 1. Data as of end-December 2013.2. Bay’ al-Inah are Islamic bonds that involve the sale and buy-back of an asset.3. Murabahah are Islamic bonds backed by a commodity mark-up sale transaction.4. Istithmar are Islamic bonds based on a combined structure of ijarah and murabahah.5. Ijarah are Islamic bonds backed by a lease agreement.6. Wakalah bi al -Istithmar are Islamic bonds in which one person nominates another person to act on his behalf.Sources: Bank Negara Malaysia Fully Automated System for Issuing/Tendering (FAST) and Bloomberg LP.

30 Asia Bond Monitor
terms of size and sophistication. At end-2013, total government sukuk outstanding rose to MYR233.8 billion, led by central government bonds. The first corporate issuance—a MYR125 million bond based on bay’ bithamin ajil (arrangement that is based on the sale of assets on a deferred payment basis) issued by Shell MDS—was in 1990. Since 2000, the corporate sukuk sector has expanded from MYR23.9 billion to reach MYR301.6 billion at end-2013.
The growth of Malaysia’s sukuk market is a result of years of building up comprehensive infrastructure, including the origination, listing, reporting, trading, and settlement systems that have resulted in an active primary sukuk market. There is also a robust shari’ah governance framework, which comprises shari’ah committees under Securities Commission Malaysia (SC) and BNM, providing regulatory guidance on the development of the Islamic finance market, including its instruments and institutions.
Moreover, the pioneering innovation of sukuk structures has also driven demand for shari’ah-compliant products and added depth to Malaysia’s sukuk market. Over the years, sukuk structures have evolved from debt-based principles (murabahah) to lease-based ( i jarah), profit-sharing (musharakah), and manufacturing contract-based (istisna), as well as to hybrid structures based on combinations of shari’ah contracts. At end-2013, Malaysia’s sukuk were
characterized by a wide distribution of shari’ah principles, including bay' al-inah, murabahah, and musharakah.
Examples of innovative issuances include the first global sovereign sukuk ijarah in 2002 (US$600 million), the first rated Islamic residential mortgage-backed securities by Cagamas MBS in 2005 (MYR2.05 billion), and the first exchangeable sukuk musharakah by Khazanah Nasional in 2006 (US$750 million). Other global milestones include Projek Lebuhraya Usahasama (PLUS) launching of the world’s largest sukuk program in 2012 amounting to MYR30.6 billion. These bonds, with maturities ranging from 5 years to 25 years, were aimed at securing financing for the purchase of five toll road concessions (Table 7).
Efforts to deepen the sukuk market have accelerated the growth of the primary market since 2005 (Figure 20). Total new issuances rose almost eightfold from MYR35.5 billion in 2005 to MYR274.3 billion in 2013. New issuances reached a record MYR316.0 billion (US$103.3 billion) in 2012, the first time that the amount has surpassed the US$100 billion mark.
With Malaysia's vast experience in the sukuk market, robust governance framework, and diversified domestic sector, Islamic debt securities have become a fast-growing asset class attracting a wide range of institutional investors.
Table 7: Top 15 Issuers of LCY Corporate Sukuk in Malaysia
Issuers
Outstanding Amount LCY Bonds Type of Industry
(MYR billion) (US$ billion)
1. Project Lebuhraya Usahasama 30.60 9.34 Transportation and Logistics
2. Cagamas 12.64 3.86 Finance
3. Binariang GSM 12.57 3.84 Communications Equipment
4. Pengurusan Air 11.63 3.55 Utilities
5. Malakoff Power 10.28 3.14 Utilities
6. Prasarana 10.00 3.05 Railroad
7. Celcom Transmission 9.20 2.81 Communications Equipment
8. Malakoff Corp 8.40 2.56 Utilities
9. Projek Lebuhraya Utara Selatan 7.85 2.39 Transportation and Logistics
10. Tanjung Bin 7.64 2.33 Utilities
11. BGSM Management 6.87 2.10 Financial Services
12. Senai Desaru Expressway 6.77 2.07 Industrial
13. Danainfra Nasional 6.50 1.98 Construction Materials
14. Perbadanan Tabung Pendidikan Tinggi Nasional 6.00 1.83 Financial Services
15. Putrajaya Holdings 5.54 1.69 Industrial
LCY = local currency.Note: Data as of end-December 2013.Source: Bloomberg LP.

Sukuk in Emerging East Asia: Trends and Future Challenges 31
At end-September 2013, financial institutions such as banks, nominee and trustee companies, cooperative societies, and the National Savings Bank held the largest share of Malaysia’s government sukuk outstanding at 58% of the total. This group was followed by social security institutions, comprising the Employees Provident Fund (EPF) and the Social Security Organisation of Malaysia (SOCSO), with a 35% share (Figure 21).
Malaysia’s sukuk market features various maturities for long-term financing requirements. At end-2013, 51% of
government sukuk outstanding had tenors of less than 5 years, while 66% of corporate sukuk had maturities of more than 5 years. The longest corporate sukuk tenor issued is 50 years by a telecom operator Binariang GSM (MYR3.0 billion) and a power generation company Malakoff Corp. (MYR1.7 billion).
Corporate issuers with various backgrounds have tapped Malaysia’s LCY sukuk market, representing a diverse collection of 32 different industries. Utilities and transportation and logistics, the two largest industries, have a combined market share of 47% (Figure 22). There have been significant increases in issuances from these industries since 2010. For example, the average annual issuance of the utilities sector soared to MYR18.0 billion between 2011 and 2013 from just MYR4.6 billion in 2010, while issuance from transportation and logistics sector increased to as much as MYR32.0 billion in 2012 from MYR8.1 billion in 2010.
Indonesia
Indonesia’s Islamic bond market is the second largest in emerging East Asia in terms of size. However, the pace of growth of its sukuk market pales in comparison to the robust growth of its conventional bond market (Figure 23). The Indonesian sukuk market is still in a nascent stage of development and accounts for only 7.4% of the total bond market.
Figure 20: Sukuk Issuance in Malaysia
120
100
80
60
40
20
02005 2006 2007 2008 2009 2010 2011 2012 2013
US$ billion
Government Corporate
FCY = foreign currency, LCY = local currency.Notes:1. Includes both LCY-denominated and FCY-denominated bonds.2. Bloomberg LP end-of-period LCY–US$ rates are used.Sources: Bank Negara Malaysia Fully Automated System for Issuing/Tendering (FAST) and Bloomberg LP.
Figure 21: LCY Government Investment Issue Investor Profile (as of end-September 2013)
InsuranceCompanies
2%
Foreign Holders3%
Bank NegaraMalaysia
<1%
FinancialInstitutions
58%
Social SecurityInstitutions
35%
Public Sector3%
LCY = local currency.Source: Bank Negara Malaysia Fully Automated System for Issuing/Tendering (FAST).
LCY = local currency.Source: Bank Negara Malaysia Fully Automated System for Issuing/Tendering (FAST).
Figure 22: LCY Corporate Sukuk Issuer Profile in Malaysia
Utilities25%
Transportationand Logistics
22%Banking andFinancial Services
20%
CommunicationsEquipment
7%
Industrial7%
Railroad3%
ConstructionMaterials
3%
Aerospaceand Defense
2%
Real Estate2%
Wireline TelecomServices
1%Others
8%
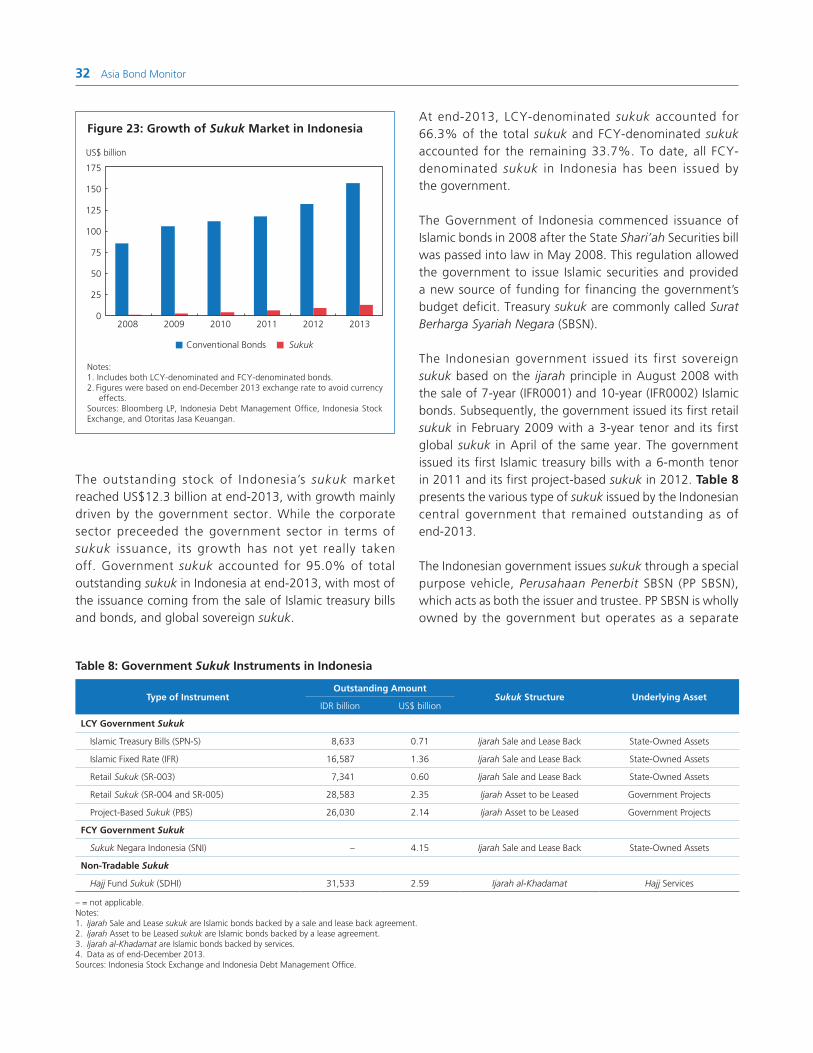
32 Asia Bond Monitor
The outstanding stock of Indonesia’s sukuk market reached US$12.3 billion at end-2013, with growth mainly driven by the government sector. While the corporate sector preceeded the government sector in terms of sukuk issuance, its growth has not yet really taken off. Government sukuk accounted for 95.0% of total outstanding sukuk in Indonesia at end-2013, with most of the issuance coming from the sale of Islamic treasury bills and bonds, and global sovereign sukuk.
At end-2013, LCY-denominated sukuk accounted for 66.3% of the total sukuk and FCY-denominated sukuk accounted for the remaining 33.7%. To date, all FCY-denominated sukuk in Indonesia has been issued by the government.
The Government of Indonesia commenced issuance of Islamic bonds in 2008 after the State Shari’ah Securities bill was passed into law in May 2008. This regulation allowed the government to issue Islamic securities and provided a new source of funding for financing the government’s budget deficit. Treasury sukuk are commonly called Surat Berharga Syariah Negara (SBSN).
The Indonesian government issued its first sovereign sukuk based on the ijarah principle in August 2008 with the sale of 7-year (IFR0001) and 10-year (IFR0002) Islamic bonds. Subsequently, the government issued its first retail sukuk in February 2009 with a 3-year tenor and its first global sukuk in April of the same year. The government issued its first Islamic treasury bills with a 6-month tenor in 2011 and its first project-based sukuk in 2012. Table 8 presents the various type of sukuk issued by the Indonesian central government that remained outstanding as of end-2013.
The Indonesian government issues sukuk through a special purpose vehicle, Perusahaan Penerbit SBSN (PP SBSN), which acts as both the issuer and trustee. PP SBSN is wholly owned by the government but operates as a separate
Figure 23: Growth of Sukuk Market in Indonesia
175
150
125
100
75
50
25
02008 2009 2010 2011 2012 2013
US$ billion
Conventional Bonds Sukuk
Notes:1. Includes both LCY-denominated and FCY-denominated bonds.2. Figures were based on end-December 2013 exchange rate to avoid currency
effects.Sources: Bloomberg LP, Indonesia Debt Management Office, Indonesia Stock Exchange, and Otoritas Jasa Keuangan.
Table 8: Government Sukuk Instruments in Indonesia
Type of InstrumentOutstanding Amount
Sukuk Structure Underlying AssetIDR billion US$ billion
LCY Government Sukuk
Islamic Treasury Bills (SPN-S) 8,633 0.71 Ijarah Sale and Lease Back State-Owned Assets
Islamic Fixed Rate (IFR) 16,587 1.36 Ijarah Sale and Lease Back State-Owned Assets
Retail Sukuk (SR-003) 7,341 0.60 Ijarah Sale and Lease Back State-Owned Assets
Retail Sukuk (SR-004 and SR-005) 28,583 2.35 Ijarah Asset to be Leased Government Projects
Project-Based Sukuk (PBS) 26,030 2.14 Ijarah Asset to be Leased Government Projects
FCY Government Sukuk
Sukuk Negara Indonesia (SNI) – 4.15 Ijarah Sale and Lease Back State-Owned Assets
Non-Tradable Sukuk
Hajj Fund Sukuk (SDHI) 31,533 2.59 Ijarah al-Khadamat Hajj Services
– = not applicable.Notes:1. Ijarah Sale and Lease sukuk are Islamic bonds backed by a sale and lease back agreement.2. Ijarah Asset to be Leased sukuk are Islamic bonds backed by a lease agreement.3. Ijarah al-Khadamat are Islamic bonds backed by services.4. Data as of end-December 2013.Sources: Indonesia Stock Exchange and Indonesia Debt Management Office.

Sukuk in Emerging East Asia: Trends and Future Challenges 33
entity. It acts as the issuer of sukuk on behalf of the government, while the government serves as the obligor to the issue and is responsible for the payment of the coupon and the principal of the sukuk at maturity.
Through PP SBSN, the government has issued sukuk structured on the ijarah principle, with the sukuk backed by state-owned assets such as land and buildings. Sukuk issued under this structure are treasury bills and bonds, retail bonds, and sovereign US$-denominated bonds. In 2011, two scheduled domestic sukuk auctions were cancelled as the government had to wait for the approval of the underlying assets to back the issuance of sukuk.
In addition, PP SBSN has also issued sukuk under the structure of ijarah, with government infrastructure projects as the underlying asset to be leased. Sukuk issued under this structure include project-based sukuk (PBS) and some series of retail bonds. The issuance of PBS has become part of the government’s sukuk auction since 2012. PP SBSN has also issued sukuk backed by funds for Hajj-related services under the structure of ijarah al khadamat. These sukuk, however, are issued through private placement and form part of the non-tradable stock of sukuk.
In 2012, the government began conducting regular auctions of Islamic treasury instruments. Sukuk auctions are currently conducted twice a month, alternately with the auction of conventional bonds. Unlike government auctions for conventional bonds where the government accepts bids in line with or even above its target, most sukuk auctions result with the government either rejecting all bids or accepting bids below its target amount. Demand for sukuk is quite strong as evidenced by the volume of bids during auctions. However, investors demand higher yields than the government is willing to accept. Furthermore, the trading of sukuk instruments are quite illiquid in Indonesia as most buyers tend to buy and hold.
At end-2013, conventional banks were the largest holders of shari’ah-compliant treasury instruments in Indonesia (Figure 24). Their share of sukuk holdings steadily rose from only 3.7% of the total at end-2009 to 35.4% at end-2013. Shari’ah banks, on the other hand, only accounted for an 8.2% share of the total at end-2013. Insurance companies were the second largest holder of sukuk at end-2013 with a 21.1% share, while foreign investors held a 12.6% share of the total. To further develop the sukuk market and reduce reliance on foreign investors, the
government is looking into using Hajj funds to buy more government sukuk.
Bank Indonesia also issues shari’ah-compliant central bank certificates, more commonly known as Sertifikat Bank Indonesia Shari’ah (SBIS). SBIS are shari’ah–compliant short-term instruments used by Bank Indonesia as one of its monetary tools to contain inflation and manage liquidity in the financial system. Prior to 2008, SBIS were structured under the wadi’ah (arrangement that is based on custodianship of an asset) principle. At present, SBIS are based on the ju’alah (arrangement that is based on service charges) principle. At end-2013, the outstanding stock of SBIS reached US$0.4 billion, representing a small 3.1% share of the total sukuk market in Indonesia. Auctions of SBIS are held once a month together with the auction of conventional SBI. SBIS carry a maturity of 9 months and require a holding period of 1 month.
The first sukuk issuance in Indonesia came from the corporate sector in 2002. Telecommunications firm Indosat issued IDR175 billion of 5-year sukuk based on a mudarabah contract. In 2004, the first sukuk ijarah were issued by an Indonesian retail company, Matahari Putra Prima, through an IDR150 billion 5-year Islamic bond.
Despite the headway made in issuing sukuk, the size of Indonesia’s corporate sukuk market is relatively small
Figure 24: Investor Profile for LCY Government Sukuk in Indonesia
100,000
90,000
80,000
70,000
60,000
50,000
40,000
30,000
20,000
10,000
02009 2010 2011 2012 2013
IDR billion
IndividualsMutual FundsForeignOthers
Conventional Banks
Bank IndonesiaInsurance CompaniesPension Funds
Shari’a Banks
LCY = local currency.Source: Indonesia Debt Management Office.
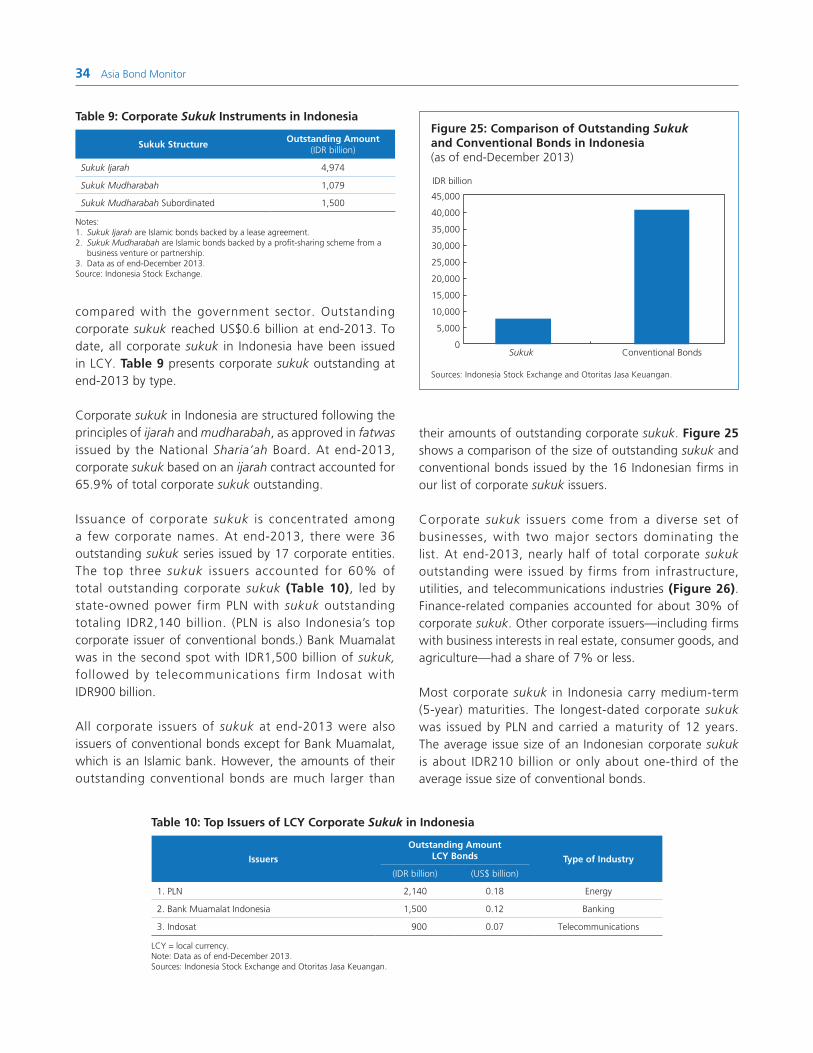
34 Asia Bond Monitor
compared with the government sector. Outstanding corporate sukuk reached US$0.6 billion at end-2013. To date, all corporate sukuk in Indonesia have been issued in LCY. Table 9 presents corporate sukuk outstanding at end-2013 by type.
Corporate sukuk in Indonesia are structured following the principles of ijarah and mudharabah, as approved in fatwas issued by the National Sharia’ah Board. At end-2013, corporate sukuk based on an ijarah contract accounted for 65.9% of total corporate sukuk outstanding.
Issuance of corporate sukuk is concentrated among a few corporate names. At end-2013, there were 36 outstanding sukuk series issued by 17 corporate entities. The top three sukuk issuers accounted for 60% of total outstanding corporate sukuk (Table 10), led by state-owned power firm PLN with sukuk outstanding totaling IDR2,140 billion. (PLN is also Indonesia’s top corporate issuer of conventional bonds.) Bank Muamalat was in the second spot with IDR1,500 billion of sukuk, followed by telecommunications firm Indosat with IDR900 billion.
All corporate issuers of sukuk at end-2013 were also issuers of conventional bonds except for Bank Muamalat, which is an Islamic bank. However, the amounts of their outstanding conventional bonds are much larger than
their amounts of outstanding corporate sukuk. Figure 25 shows a comparison of the size of outstanding sukuk and conventional bonds issued by the 16 Indonesian firms in our list of corporate sukuk issuers.
Corporate sukuk issuers come from a diverse set of businesses, with two major sectors dominating the list. At end-2013, nearly half of total corporate sukuk outstanding were issued by firms from infrastructure, utilities, and telecommunications industries (Figure 26). Finance-related companies accounted for about 30% of corporate sukuk. Other corporate issuers—including firms with business interests in real estate, consumer goods, and agriculture—had a share of 7% or less.
Most corporate sukuk in Indonesia carry medium-term (5-year) maturities. The longest-dated corporate sukuk was issued by PLN and carried a maturity of 12 years. The average issue size of an Indonesian corporate sukuk is about IDR210 billion or only about one-third of the average issue size of conventional bonds.
Table 9: Corporate Sukuk Instruments in Indonesia
Sukuk StructureOutstanding Amount
(IDR billion)
Sukuk Ijarah 4,974
Sukuk Mudharabah 1,079
Sukuk Mudharabah Subordinated 1,500
Notes:1. Sukuk Ijarah are Islamic bonds backed by a lease agreement.2. Sukuk Mudharabah are Islamic bonds backed by a profit-sharing scheme from a
business venture or partnership.3. Data as of end-December 2013.Source: Indonesia Stock Exchange.
Table 10: Top Issuers of LCY Corporate Sukuk in Indonesia
Issuers
Outstanding Amount LCY Bonds Type of Industry
(IDR billion) (US$ billion)
1. PLN 2,140 0.18 Energy
2. Bank Muamalat Indonesia 1,500 0.12 Banking
3. Indosat 900 0.07 Telecommunications
LCY = local currency.Note: Data as of end-December 2013.Sources: Indonesia Stock Exchange and Otoritas Jasa Keuangan.
Figure 25: Comparison of Outstanding Sukuk and Conventional Bonds in Indonesia (as of end-December 2013)
45,000
40,000
35,000
30,000
25,000
20,000
15,000
10,000
5,000
0Sukuk Conventional Bonds
IDR billion
Sources: Indonesia Stock Exchange and Otoritas Jasa Keuangan.
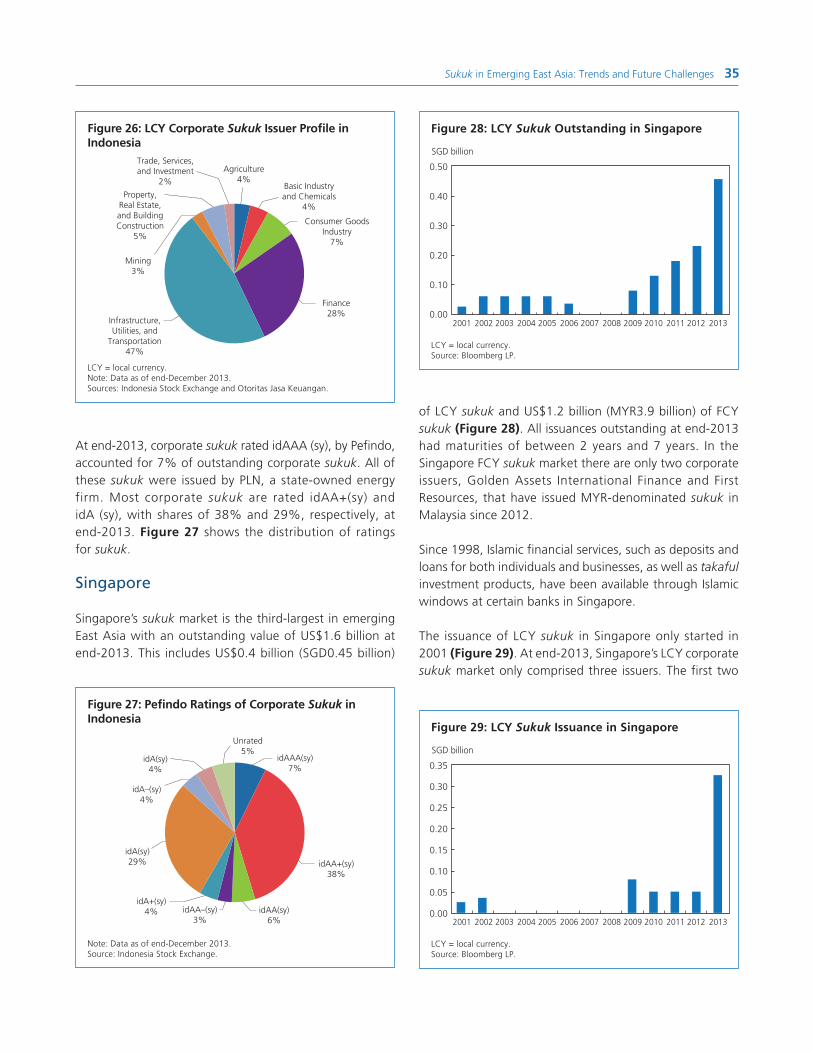
Sukuk in Emerging East Asia: Trends and Future Challenges 35
At end-2013, corporate sukuk rated idAAA (sy), by Pefindo, accounted for 7% of outstanding corporate sukuk. All of these sukuk were issued by PLN, a state-owned energy firm. Most corporate sukuk are rated idAA+(sy) and idA (sy), with shares of 38% and 29%, respectively, at end-2013. Figure 27 shows the distribution of ratings for sukuk.
Singapore
Singapore’s sukuk market is the third-largest in emerging East Asia with an outstanding value of US$1.6 billion at end-2013. This includes US$0.4 billion (SGD0.45 billion)
of LCY sukuk and US$1.2 billion (MYR3.9 billion) of FCY sukuk (Figure 28). All issuances outstanding at end-2013 had maturities of between 2 years and 7 years. In the Singapore FCY sukuk market there are only two corporate issuers, Golden Assets International Finance and First Resources, that have issued MYR-denominated sukuk in Malaysia since 2012.
Since 1998, Islamic financial services, such as deposits and loans for both individuals and businesses, as well as takaful investment products, have been available through Islamic windows at certain banks in Singapore.
The issuance of LCY sukuk in Singapore only started in 2001 (Figure 29). At end-2013, Singapore’s LCY corporate sukuk market only comprised three issuers. The first two
Figure 26: LCY Corporate Sukuk Issuer Profile in Indonesia
Agriculture4%
Mining3%
Property,Real Estate,and BuildingConstruction
5%
Trade, Services,and Investment
2% Basic Industryand Chemicals
4%
Consumer GoodsIndustry
7%
Finance28%
Infrastructure,Utilities, and
Transportation47%
LCY = local currency.Note: Data as of end-December 2013.Sources: Indonesia Stock Exchange and Otoritas Jasa Keuangan.
Figure 27: Pefindo Ratings of Corporate Sukuk in Indonesia
idAAA(sy)7%
idA+(sy)4%
idA(sy)29%
idA–(sy)4%
idA(sy)4%
Unrated5%
idAA+(sy)38%
idAA(sy)6%
idAA–(sy)3%
Note: Data as of end-December 2013.Source: Indonesia Stock Exchange.
LCY = local currency.Source: Bloomberg LP.
Figure 28: LCY Sukuk Outstanding in Singapore
0.50
0.40
0.30
0.20
0.10
0.002001 2002 2003 2004 2005 2006 2007 2008 2009 2010 2011 2012 2013
SGD billion
LCY = local currency.Source: Bloomberg LP.
Figure 29: LCY Sukuk Issuance in Singapore
0.35
0.30
0.25
0.20
0.15
0.10
0.05
0.002001 2002 2003 2004 2005 2006 2007 2008 2009 2010 2011 2012 2013
SGD billion

36 Asia Bond Monitor
SGD-denominated sukuk were issued in 2001 and 2002 by Majlis Ugama Islam Singapura (MUIC), or the Islamic Religious Council of Singapore, which is a Singapore government agency, at SGD25 million and SGD35 million, respectively. Both are 5-year tenors and were issued based on the musharakah structure (ownership arrangement in which a bank gradually sells its portion of the jointly-owned asset to the customer, allowing its share of the asset to diminish over time).
The LCY sukuk market in Singapore was dormant from 2003 to 2008 with no new issuance during this period. In 2005, the Monetary Authority of Singapore (MAS) allowed local banks to offer mudarabah (profit-sharing) financing. In the same year, Singapore was accepted as a full member of the Islamic Financial Services Board (IFSB) and since then MAS has shown its commitment to promote Islamic financing in Singapore by putting in place the necessary policy framework and infrastructure.
On 19 January 2009, MAS launched a SGD200 million sukuk facil ity on a reverse-enquiry basis that was structured following the sukuk ijarah principle and backed by rental income generated from the office units of MAS’ headquarters. The facility was treated as the shari’ah-compliant equivalent of Singapore Government Securities (SGSs), with returns tied to the risk-free yield of an SGS of equivalent tenor. Sukuk can be qualified as an asset in the computation of capital and liquidity requirements of banks licensed in Singapore, and as eligible collateral for banks seeking to tap MAS' liquidity. Particularly, the facility is open to all financial institutions that are planning to offer or are currently offering shari’ah-compliant financial services in Singapore based on their capital and liquidity requirements.
In May 2009, MAS issued guidelines on the application of its banking regulations to Islamic finance and new regulations permitting Singapore-based banks entering into diminishing musharakah financing and spot murabahah transactions (transactions involving the purchase of assets at a marked-up price that has to be paid immediately instead of on a deferred basis). In addition, MAS ensured equal tax, regulatory, and liquidity treatment of SGD-denominated sukuk and SGS.
In November 2009, the LCY sukuk market saw new issuances with MUIC offering its third 5-year sukuk totaling SGD29 million. In December of the same year, Citydev Nahdah—a wholly owned subsidiary of Singapore-based
private property developer City Developments—issued its debut sukuk. Citydev Nahdah is the largest issuer in the Singapore LCY sukuk market with total issuance of SGD375 million to date out of a planned SGD1 billion sukuk ijarah program.
In April 2010, MAS allowed banks to enter into istisna contracts for financing assets under construction. More recently, in 2013, Swiber Capital issued its debut 5-year sukuk amounting to SGD150 million. The issue marked the single largest LCY sukuk in Singapore and the company’s first drawdown from its US$500 million Multi-Currency Islamic Trust Certificate Issuance Program, which was established in 2013 and structured based on the Islamic principle of wakalah bi al-istithmar (arrangement based on agency contract for investment). The proceeds from this issue were used to refinance debt, support capital expenditure, generate working capital, and meet general corporate obligations that are shari’ah-compliant. Takaful funds, pension funds, and banks accounted for 96.5% of the deal. Fund managers purchased 0.7% and private banks bought 2.8% of the bond. About half of the bonds were allocated to Islamic institutions. In terms of investors’ geographical base, Singapore accounted for 43.7%, 46.3% were from Brunei Darussalam, and 10.0% were from Malaysia.
At present, Singapore has a number of commercial banks carrying out shari’ah-compliant financial services—Standard Chartered Bank, HSBC, OCBC, CIMB, and Maybank—and many fund managers have launched shari’ah-compliant sukuk funds, including Amanah Mutual and Franklin Templeton Investments. In 2007, Singapore also saw the establishment of its first fully Islamic bank, the Islamic Bank of Asia. Other Islamic financial institutions such as Arcapita, Al Salam Bank-Bahrain, and AEP Investment Management have also established offices in Singapore.
Brunei Darussalam
Brunei Darussalam’s Islamic bond market is the fourth largest sukuk market in emerging East Asia, with outstanding bonds at end-2013 amounting to US$0.4 billion (BND0.5 billion). The market is solely composed of Brunei government sukuk based on the ijarah structure (Figure 30). The Autoriti Monetari Brunei Darussalam (AMBD), Brunei Darussalam’s statutory body acting as the central bank, is responsible for managing and administering issuances of sukuk.
In Brunei Darussalam, the government’s three Islamic banks—Islamic Bank, Tabung Amanah Islam Brunei, and

Sukuk in Emerging East Asia: Trends and Future Challenges 37
Islamic Development Bank—are regulated under the Islamic Banking Act.
In 2006, the government planned to strengthen banking and insurance services by offering conventional and Islamic financial instruments. The first government sukuk was issued with a 91-day tenor on 6 April 2006 amounting to BND150 million. Since then, the issuance of sukuk has become a regular activity. Over the past few years, Brunei Darussalam’s government has issued 99 series of sukuk totaling BND6.7 billion and with tenors of 91, 182, 273, and 364 days.
People’s Republic of China
The People’s Republic of China (PRC) has not promulgated any specific laws regarding the development of Islamic finance or a sukuk market. However, there have been a number of shari’ah-compliant investment products that seek to invest in the PRC market.
For example, in 2006, a series of Islamic funds were launched to offer Islamic investors exposure to the PRC market. Shamil Bank launched a US$100 million Shamil China Realty Mudarabah, the first Islamic property fund targeting the PRC real estate market. Deutsche Bank also launched a series of shari’ah-compliant mutual funds, with the DWS Noor China Equity Fund targeting shari’ah-compliant PRC equity investments. The CIMB Group also launched a CIMB Islamic Greater China Equity Fund in 2009. Al-Rajhi Investments partnered with China Resources to launch the Shari’ah Asia Investment Fund
(SAIF). SAIF seeks to invest directly in certain types of real estate projects in the PRC.
While there is no specific law promoting Islamic finance, the PRC’s move to liberalize the banking sector in 2006 allowed foreign banks entry into the PRC banking sector. In 2012, Affin Holdings and the Bank of East Asia announced the submission of a proposal to the China Banking Regulatory Commission (CBRC) to establish the first Islamic bank in the country. The People’s Bank of China is also an associate member of the IFSB.
Hong Kong, China
Hong Kong, China began its development of a sukuk market in 2007 when Financial Secretary John Tsang announced that Hong Kong, China would seek to develop a local Islamic bond market that would fit within existing regulations. The goal was to provide an investment outlet for Middle Eastern investors seeking to invest in the PRC. Over time, the government has pursued a number of initiatives to promote the development of a sukuk market.
For example, in January 2008, the Hong Kong Monetary Authority (HKMA) applied to upgrade its membership status in the ISFB. HKMA was granted observer membership status in 2007 and was subsequently upgraded to associate member in March 2008. In May 2008, HKMA signed a Memorandum of Understanding with the Dubai Financial Services Authority to support capacity- and knowledge-building in the area of Islamic finance, and promote the development of Islamic finance in both markets.
Other efforts have included establishment of a cross-border trading platform between Hong Kong, China and Malaysia that was established in March 2012. Hong Kong, China also released revisions to its taxation laws to put sukuk on a similar footing with conventional bonds.
However, Hong Kong, China has yet to issue any sukuk. In 2008, the Airport Authority of Hong Kong announced that it would issue sukuk but did not push through with the issuance. Hang Seng Bank did launch an Islamic equity fund, the Hang Seng Islamic China Index Fund. Also, Noble Group has an Islamic medium-term note facility and has issued three sukuk since 2012. However, the bonds were issued in the Malaysian sukuk market and denominated in ringgit.
Figure 30: LCY Sukuk Outstanding in Brunei
0.60
0.50
0.40
0.30
0.20
0.10
0.002006 2007 2008 2009 2010 2011 2012 2013
BND billion
LCY = local currency.Source: Bloomberg LP.

38 Asia Bond Monitor
One reason for the lack of issuance in Hong Kong, China is that there has been difficulty aligning sukuk market operations with the existing regulatory framework. For example, Hong Kong, China’s banking laws allow for the establishment of an Islamic finance banking unit in existing banks. However, due to the prohibition regarding interest payments, Islamic bank deposits are closer to equity holdings and the “interest” earned may be classified as dividends under Hong Kong, China law. Islamic bank deposits are thus not subject to deposit insurance in Hong Kong, China.
Another example is that in Hong Kong, China, certain bonds may qualify for tax exemption or a reduced profit tax rate. However, sukuk may not qualify as a bond depending on the structure, and therefore payments may be subject to the full profit tax rate. This hurdle is what the 2013 amendment to Hong Kong, China’s tax and stamp duty laws seeks to address.
Currently, the government is looking at the possibility of issuing sukuk under its existing government bond program and a bill may be passed to enable it to do so in 1Q14.
Japan
In Japan, there is currently no full-range regulatory framework or financial structure to operate Islamic finance. However, several initiatives and developments have been introduced to allow Japanese firms to participate in Islamic capital market transactions.
In 2007, eight Japanese private and public institutions started to explore Islamic finance as a means to tap funds from Islamic investors through investments in Japan. These institutions participated in the IFSB as observer members.
In 2008, Japan’s Financial Services Agency amended the Ordinance for Enforcement of the Banking Law and the Insurance Business Law to allow the subsidiaries of Japanese banks to conduct certain Islamic finance transactions. This paved the way for Japanese banks and financial institutions to structure and place Islamic deals. Daiwa Asset Management arranged the listing of the first shari’ah-compliant exchange-traded fund for Japanese stocks in Singapore in 2008. In 2010, Daiwa Securities Capital Markets acted as co-lead arranger for Islamic real-estate investment trusts listed on the
Singapore Exchange. Moreover, some Japanese firm’s subsidiaries have also issued sukuk in the Malaysian market. For example, the Malaysian subsidiaries of AEON Credit Service and Toyota Financial Service issued MYR-denominated sukuk al musharakah in 2007 and 2008, respectively. In 2010, Nomura Holdings also issued its first US$-denominated sukuk ijarah worth US$100 million in Malaysia.
Meanwhile, there have been initiatives to establish a regulatory and legal framework for a sukuk market in Japan over the last few years. In 2011, the National Diet passed a bill to facilitate sukuk issuance. The bill included an amendment to the Asset Securitization Act containing provisions to accommodate a legal framework for the issuance of sukuk, particularly sukuk ijarah, to be established in the form of a special bond to be issued via a special purpose trust. Moreover, tax reforms were also introduced in which Japanese sukuk (J-sukuk) would be treated as conventional bonds for tax purposes. Following the enactment of the amendments, the Japan Securities Depository Center started to handle J-sukuk in its book-entry system in April 2012.
However, challenges are still prevalent in the Japan market. These include (i) a lack of domestic demand for sukuk, (ii) an established financial structure that will facilitate J-sukuk issuance and trading, and (iii) the expiration of the special tax measures that apply to J-sukuk.
Thailand
In Thailand, certain regulations related to sukuk have been introduced by the Securities and Exchange Commission (SEC). One was the SEC's notification of regulations for becoming a trustee in sukuk transactions, introduced in November 2010, and another was the SEC Capital Market Supervisory Board's notification on provisions for sukuk issuance, launched in January 2011. The regulatory framework on sukuk issuance is under the ambit of the Securities and Exchange Commission Act and the Trust for Transactions in Capital Markets Act.
The Islamic Bank of Thailand, established in 2003 as a state enterprise under the Ministry of Finance, has revived plans to issue THB5 billion worth of sukuk, according to an announcement made in June 2013. However, as of end-2013, no sukuk issuance had been made by the bank.
Sukuk in Emerging East Asia: Trends and Future Challenges 39
Financing Infrastructure Projects with Sukuk
The September 2013 edition of the Asia Bond Monitor highlighted the fact that the infrastructure financing requirements for Asia remain large. Given that emerging East Asian governments’ fiscal deficits have been rising and that liquidity is likely to tighten amid the tapering of the US Federal Reserve’s bond-buying program, there is a need to attract new sources of funds for infrastructure financing in the region. Sukuk have great potential for financing infrastructure projects as they have several characteristics that make them suitable for project financing. For one, infrastructure investments build tangible assets that generate revenues. Therefore, they are consistent with the Islamic finance stricture of creating economic value. Infrastructure financing also entails the sharing of risk between project sponsors and investors, which is another key principle of Islamic finance. Also, the structure of infrastructure financing can be easily adapted to accommodate Islamic finance instruments such as ijarah, istisna, mudarabah, murabahah, and musharakah. It can also be structured such that Islamic finance can be combined with conventional loans or bonds to finance a particular project.
Traditionally, banks have played an important role in financing infrastructure, but with new Basel I I I regulations coming into force, they are likely to scale back their participation in long-term infrastructure projects given higher capital charges. Hence, there is need for infrastructure projects to shift toward financing from bond markets and long-term institutional investors such as pension funds and insurance companies. Increasingly, economies in emerging East Asia with thriving bond markets have been able to mobilize funds through these markets to finance infrastructure.
While sukuk have been used for infrastructure projects in Malaysia, they have failed to take off as a source of infrastructure financing outside of Malaysia. Some of the reasons are that most Islamic countries have yet to develop a stable regulatory framework and economic environment that can encourage investors to invest in these markets. Their capital market is also relatively underdeveloped, which hinders the ability of infrastructure projects to raise funds. Another issue that needs to be addressed is the lack of consistency in shari’ah guidelines for structuring Islamic financing for infrastructure projects. There are
different guidelines for different markets and even for different Islamic financial institutions. Hence, there is lack of certainty that the financing structure that is acceptable to an Islamic institution will be acceptable to other Islamic institutions, particularly those from different jurisdictions. The development of a consistent Islamic financing framework that can be applied throughout the region would help in promoting greater acceptance of sukuk among investors. A standard template of Islamic infrastructure financing can serve as a model to jumpstart the Islamic bond market for infrastructure and broaden its appeal. Finally, there may be capacity constraints among Islamic financial institutions in undertaking the complex tasks of structuring infrastructure projects. However, as more deals are undertaken, the knowledge gained can help bridge this gap.
If these constraints are addressed, there is potential for Islamic finance to offer a viable alternative to conventional financing. Given the large pool of savings in the Islamic world, additional investors could help to lower the financing costs of infrastructure projects. Islamic finance could also help bring in new investors that conventional lenders are not willing to bear.
Financiers of infrastructure projects can choose from a variety of sukuk structures. The three main types of structures that have been used for financing infrastructure based on shari’ah principles are musharakah, ijarah, and murabahah. Musharakah sukuk embed the principle of risk-sharing in their structure by having both investors and issuer agree to share the profits and losses resulting from the performance of the underlying infrastructure project. Given that this implies greater risk to be borne by investors, sukuk based on the musharakah structure usually attract higher yields. They also tend to offer higher profit-sharing rates to bring in investors. Meanwhile, sukuk based on the ijarah and murabahah are much more similar to conventional bonds in the sense that they offer certainty of returns. In the case of ijarah the rental amount is fixed, while in the case of murabahah the profit rate is set. Hence, they tend to attract more risk-averse investors. If there are shortfalls in the revenues from the underlying infrastructure project, the issuer will have to cover the shortfall and ensure that the investors in the sukuk receive the agreed rental or profit.
The i jarah structure for sukuk is normally used to refinance an existing infrastructure project (brownfield). The popularity of this structure is due to its similarity to
40 Asia Bond Monitor
a conventional lease. In this arrangement, typically the proceeds raised from sukuk investors will be used to purchase an interest in the existing infrastructure project. After the purchase, the infrastructure project will be leased back to the project company in return for regular payment of rent. Normally, the project company will use the revenue from the infrastructure project to service the rental payment.
It is also possible to structure a sukuk to finance a new infrastructure project (greenfield). Both risk-sharing structures of sukuk, musharakah and mudarabah, can be used to finance a greenfield project. But given the unfamiliarity with the risk-sharing sukuk structure, the most suitable sukuk structure for greenfield financing would be istisna combined with ijarah. The istisna structure allows for an asset to be sold before it has been built. To prevent unnecessary risk during the transaction, the price and specifics of the infrastructure project will have to be agreed upon when signing the istisna agreement. The istisna structure allows for the purchase price of the project to be paid in installments during the construction phase. This means that the sukuk payment for the infrastructure project can be linked to completion milestones agreed upon by both parties. The istisna structure is normally combined with that of ijarah. This is to allow for payments to be made by the infrastructure project to the sukuk holders under a forward lease arrangement, thus allowing investors to receive a return during the construction period. It also allows for the lease arrangement to come into force once the project is completed and operational.
There have been several large infrastructure projects financed through sukuk in Malaysia. Investment in infrastructure in Malaysia received a boost from the Economic Transformation Plan, which envisaged heavy spending on infrastructure amounting to US$450 billion to help Malaysia become a developed economy. While that is a huge amount of investment, Malaysia’s deep and liquid capital market has allowed funds to be raised for infrastructure projects at long-term and relatively low cost. The stability of the Malaysian regulatory framework and long history of private participation in various infrastructure projects has also helped to underpin investor confidence.
A recent example of an infrastructure sukuk in Malaysia is the Project 3A sukuk launched by electricity utility Tenaga Nasional in January 2014. The issue is worth up to MYR4 billion and consists of a series of different maturities between 10 years and 20 years. The funds are being raised
to fund a 1,000MW ultra-supercritical coal-fired power plant. The funds raised through the sukuk bond issuance will cover 74% of the project cost, with Tenaga Nasional contributing equity for the remaining portion. The sukuk are structured following the ijarah principle, with the distribution payments of the sukuk coming from the lease payments made by the special financing vehicle once the plant is up and running. A 25-year power purchase agreement with Tenaga will help the special financing vehicle to fund the project. The sukuk have been given the highest rating by the Malaysian Rating Corporation (MARC) due to the project completion support and guarantee from the project sponsor. Tenaga is underwriting the residual risk from building and operating the power plant that is not assumed by the builders. This has helped to raise confidence among investors in investing in a greenfield project in which they are taking on construction risk. This comes on the back of a successful MYR2 billion sukuk in 2013, also issued by Tenaga, to finance the construction of a gas-fired 1,000 MW power plant using a similar type of structure.
Other examples of large power infrastructure project sukuk are the Tanjung Bin Energy MYR3.29 billion sukuk with a maximum tenor of 20 years and the TNB Northern Energy MYR1.625 billion sukuk with a maximum tenor of 23 years. There have also been several successful sukuk issued to finance toll roads. Konsortium Lebuhraya Utara-Timur (Kesturi) raised MYR2.3 billion of senior sukuk and MYR180 million of junior bonds in December 2013 to refinance existing bonds and partly finance the extension of a Kesturi toll road. Sukuk have also financed improvements in the public transport network. The Klang Valley Mass Rapid Transit is expected to require MYR50 billion of funding. Out of that total amount, about half is expected to be raised through sukuk.
The development of financial markets in Malaysia, combined with a stable legal and regulatory environment, has resulted in Malaysia having a successful track record of financing greenfield infrastructure projects even without the use of credit enhancement. In addition, Malaysia has successfully developed its sukuk market and allowed it to thrive. The sukuk market has benefited from a clear regulatory framework and the existence of two local rating agencies that have a strong track record of evaluating Malaysian infrastructure projects. The success of sukuk financing for infrastructure has also been due to significant liquidity in the LCY sukuk market. As seen in the examples above, infrastructure projects have been able to raise

Sukuk in Emerging East Asia: Trends and Future Challenges 41
funds through the issuance of sukuk with significantly longer tenors than bank loans. This shows that there is considerable appetite among local investors for holding long-term sukuk bonds.
Future Developments
In the aftermath of the 2008/09 global financial crisis, there is understandable concern over whether the Western model of finance is still relevant. Some see excessive financialization as preventing financial systems from serving their intended useful social purpose. While financial systems are supposed to serve the real economy, there is a general uneasiness over the growing disconnect between purpose and actual function in advanced economies.
Some have suggested that Islamic financial systems may offer a better alternative. For one, Islamic financial systems are closely based on real productive assets in the economy. This means they offer a closer connection between financiers and the real activities they finance. Another benefit is that the risk-sharing principle ensures there cannot be an excessive build-up of debt.
Developments in the sukuk market offer encouragement on this front. Sukuk structured in profit-and-loss sharing partnerships (musharakah) have increased their share of the sukuk market in Malaysia (Figure 31). The increased use of profit-sharing sukuk can lead to new forms of financing instruments that can facilitate long-term development. This is a potential improvement from the traditional sukuk structure of ijarah and murabahah, which focus more on replicating the structure of conventional bonds.
In moving toward a risk-based Islamic financial system, it is important not to lose sight of the need to maintain stability in the financial system. The underlying basis of Islamic finance is not that different from conventional financial markets. Both types of financial systems face the same credit, liquidity, market, and operational risks. Hence, most regulatory reforms designed to strengthen the international financial system after the 2008/09 global financial crisis should also apply to the global Islamic financial system. Islamic standard-setting bodies such as IFSB and AAOIFI have already started to introduce prudential standards for Islamic financial institutions.
For Islamic risk-sharing products to gain wider acceptance, there needs to be recognition by the regulatory authorities of the different nature of risk-sharing sukuk. Given that
risk-sharing sukuk are relatively new products, there may be uncertainty over how they are treated, especially in terms of risk weighting. Also, there is the need to further strengthen and develop the infrastructure that underpins the Islamic financial system. One key constraint of Islamic financial institutions is the lack of supply of high-quality, liquid LCY and FCY Islamic paper. This makes it more difficult for Islamic financial institutions to comply with international regulatory standards for liquidity. The establishment of the International Islamic Liquidity Management (IILM) is aimed at addressing the lack of suitable Islamic financial instruments. Specifically, it has begun issuing short-term US$-denominated sukuk in the global market to enable Islamic financial institutions to manage their cross-border liquidity requirements.
While there have been impressive gains in the development of sukuk markets, both globally and within emerging East Asia, more needs to be done if sukuk are to be seen as a viable alternative to conventional financial products. The country in the region that has achieved the most in this regard is Malaysia, where the sukuk market has benefited from plentiful liquidity and strong demand for Islamic
Figure 31: Composition of the Sukuk Market in Malaysia
Istithmar0.2%
Ijarah10%
Istisna2%
Mudarabah1%
Wakalah bial-Istithmar
1%
Bay’ al-Inah31%
Murabahah30%
Musharakah24%
Notes:1. Bay’ al-Inah are Islamic bonds that involve the sale and buy-back of an asset.2. Ijarah are Islamic bonds backed by a lease agreement.3. Istisna are Islamic bonds backed by a purchase order contract.4. Istithmar are Islamic bonds based on combined structure of ijarah and
murabahah.5. Mudarabah are Islamic bonds backed by a profit-sharing scheme from a
business venture or partnership.6. Murabahah are Islamic bonds backed by a commodity mark-up sale
transaction.7. Musharakah are Islamic bonds backed by a joint-venture arrangement
between two or more parties.8. Wakalah bi al -Istithmar are Islamic bonds where a person nominates another
person to act on his behalf.Sources: Bank Negara Malaysia Fully Automated System for Issuing/Tendering (FAST) and Bloomberg LP.
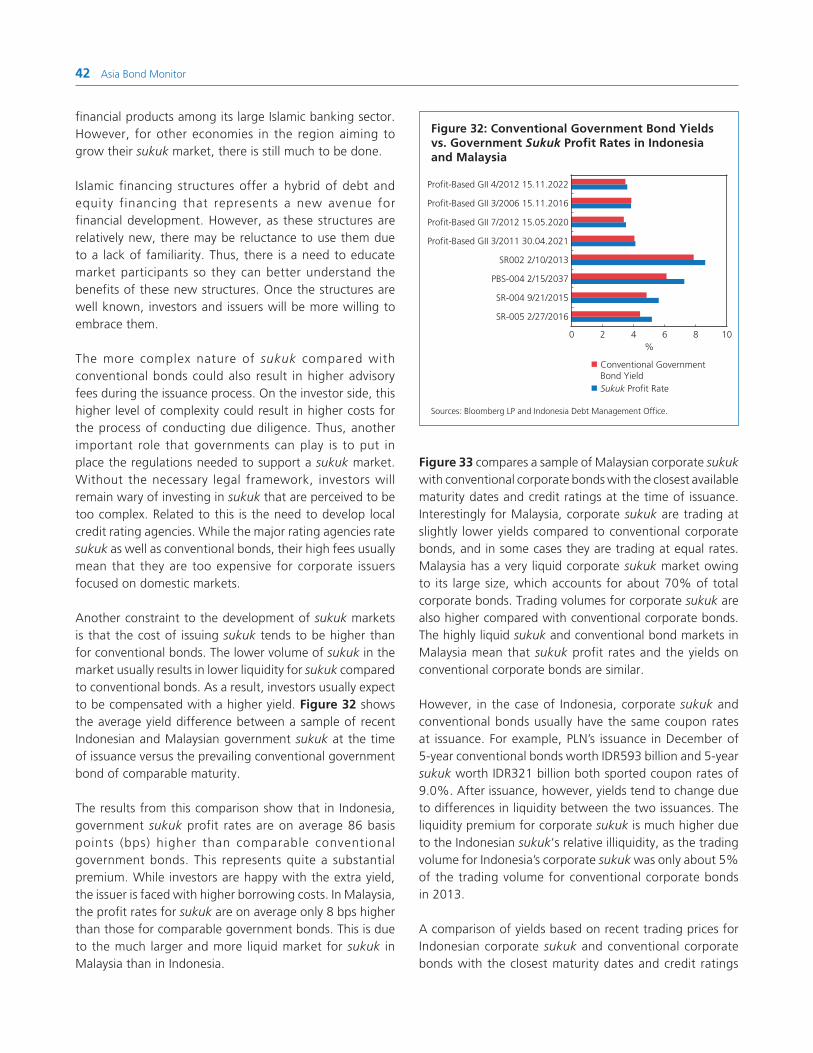
42 Asia Bond Monitor
Figure 32: Conventional Government Bond Yields vs. Government Sukuk Profit Rates in Indonesia and Malaysia
Sources: Bloomberg LP and Indonesia Debt Management Office.
Profit-Based GII 4/2012 15.11.2022
Profit-Based GII 3/2006 15.11.2016
Profit-Based GII 7/2012 15.05.2020
Profit-Based GII 3/2011 30.04.2021
SR002 2/10/2013
PBS-004 2/15/2037
SR-004 9/21/2015
SR-005 2/27/2016
%0 2 4 6 8 10
Conventional GovernmentBond YieldSukuk Profit Rate
financial products among its large Islamic banking sector. However, for other economies in the region aiming to grow their sukuk market, there is still much to be done.
Islamic financing structures offer a hybrid of debt and equity financing that represents a new avenue for financial development. However, as these structures are relatively new, there may be reluctance to use them due to a lack of familiarity. Thus, there is a need to educate market participants so they can better understand the benefits of these new structures. Once the structures are well known, investors and issuers will be more willing to embrace them.
The more complex nature of sukuk compared with conventional bonds could also result in higher advisory fees during the issuance process. On the investor side, this higher level of complexity could result in higher costs for the process of conducting due diligence. Thus, another important role that governments can play is to put in place the regulations needed to support a sukuk market. Without the necessary legal framework, investors will remain wary of investing in sukuk that are perceived to be too complex. Related to this is the need to develop local credit rating agencies. While the major rating agencies rate sukuk as well as conventional bonds, their high fees usually mean that they are too expensive for corporate issuers focused on domestic markets.
Another constraint to the development of sukuk markets is that the cost of issuing sukuk tends to be higher than for conventional bonds. The lower volume of sukuk in the market usually results in lower liquidity for sukuk compared to conventional bonds. As a result, investors usually expect to be compensated with a higher yield. Figure 32 shows the average yield difference between a sample of recent Indonesian and Malaysian government sukuk at the time of issuance versus the prevailing conventional government bond of comparable maturity.
The results from this comparison show that in Indonesia, government sukuk profit rates are on average 86 basis points (bps) higher than comparable conventional government bonds. This represents quite a substantial premium. While investors are happy with the extra yield, the issuer is faced with higher borrowing costs. In Malaysia, the profit rates for sukuk are on average only 8 bps higher than those for comparable government bonds. This is due to the much larger and more liquid market for sukuk in Malaysia than in Indonesia.
Figure 33 compares a sample of Malaysian corporate sukuk with conventional corporate bonds with the closest available maturity dates and credit ratings at the time of issuance. Interestingly for Malaysia, corporate sukuk are trading at slightly lower yields compared to conventional corporate bonds, and in some cases they are trading at equal rates. Malaysia has a very liquid corporate sukuk market owing to its large size, which accounts for about 70% of total corporate bonds. Trading volumes for corporate sukuk are also higher compared with conventional corporate bonds. The highly liquid sukuk and conventional bond markets in Malaysia mean that sukuk profit rates and the yields on conventional corporate bonds are similar.
However, in the case of Indonesia, corporate sukuk and conventional bonds usually have the same coupon rates at issuance. For example, PLN’s issuance in December of 5-year conventional bonds worth IDR593 billion and 5-year sukuk worth IDR321 billion both sported coupon rates of 9.0%. After issuance, however, yields tend to change due to differences in liquidity between the two issuances. The liquidity premium for corporate sukuk is much higher due to the Indonesian sukuk‘s relative illiquidity, as the trading volume for Indonesia’s corporate sukuk was only about 5% of the trading volume for conventional corporate bonds in 2013.
A comparison of yields based on recent trading prices for Indonesian corporate sukuk and conventional corporate bonds with the closest maturity dates and credit ratings
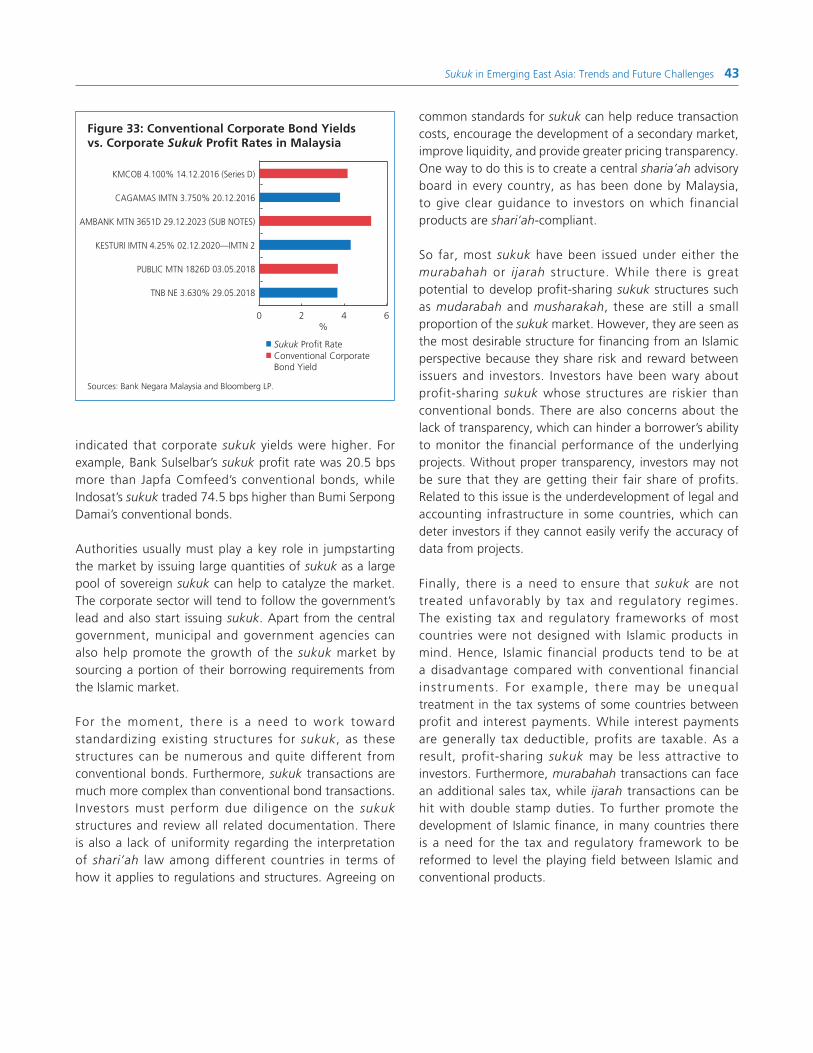
Sukuk in Emerging East Asia: Trends and Future Challenges 43
indicated that corporate sukuk yields were higher. For example, Bank Sulselbar’s sukuk profit rate was 20.5 bps more than Japfa Comfeed’s conventional bonds, while Indosat’s sukuk traded 74.5 bps higher than Bumi Serpong Damai’s conventional bonds.
Authorities usually must play a key role in jumpstarting the market by issuing large quantities of sukuk as a large pool of sovereign sukuk can help to catalyze the market. The corporate sector will tend to follow the government’s lead and also start issuing sukuk. Apart from the central government, municipal and government agencies can also help promote the growth of the sukuk market by sourcing a portion of their borrowing requirements from the Islamic market.
For the moment, there is a need to work toward standardizing existing structures for sukuk, as these structures can be numerous and quite different from conventional bonds. Furthermore, sukuk transactions are much more complex than conventional bond transactions. Investors must perform due diligence on the sukuk structures and review all related documentation. There is also a lack of uniformity regarding the interpretation of shari’ah law among different countries in terms of how it applies to regulations and structures. Agreeing on
common standards for sukuk can help reduce transaction costs, encourage the development of a secondary market, improve liquidity, and provide greater pricing transparency. One way to do this is to create a central sharia’ah advisory board in every country, as has been done by Malaysia, to give clear guidance to investors on which financial products are shari’ah-compliant.
So far, most sukuk have been issued under either the murabahah or ijarah structure. While there is great potential to develop profit-sharing sukuk structures such as mudarabah and musharakah, these are still a small proportion of the sukuk market. However, they are seen as the most desirable structure for financing from an Islamic perspective because they share risk and reward between issuers and investors. Investors have been wary about profit-sharing sukuk whose structures are riskier than conventional bonds. There are also concerns about the lack of transparency, which can hinder a borrower’s ability to monitor the financial performance of the underlying projects. Without proper transparency, investors may not be sure that they are getting their fair share of profits. Related to this issue is the underdevelopment of legal and accounting infrastructure in some countries, which can deter investors if they cannot easily verify the accuracy of data from projects.
Finally, there is a need to ensure that sukuk are not treated unfavorably by tax and regulatory regimes. The existing tax and regulatory frameworks of most countries were not designed with Islamic products in mind. Hence, Islamic financial products tend to be at a disadvantage compared with conventional financial instruments. For example, there may be unequal treatment in the tax systems of some countries between profit and interest payments. While interest payments are generally tax deductible, profits are taxable. As a result, profit-sharing sukuk may be less attractive to investors. Furthermore, murabahah transactions can face an additional sales tax, while ijarah transactions can be hit with double stamp duties. To further promote the development of Islamic finance, in many countries there is a need for the tax and regulatory framework to be reformed to level the playing field between Islamic and conventional products.
Figure 33: Conventional Corporate Bond Yields vs. Corporate Sukuk Profit Rates in Malaysia
Sources: Bank Negara Malaysia and Bloomberg LP.
KMCOB 4.100% 14.12.2016 (Series D)
CAGAMAS IMTN 3.750% 20.12.2016
AMBANK MTN 3651D 29.12.2023 (SUB NOTES)
KESTURI IMTN 4.25% 02.12.2020—IMTN 2
PUBLIC MTN 1826D 03.05.2018
TNB NE 3.630% 29.05.2018
%0 2 4 6
Conventional CorporateBond Yield
Sukuk Profit Rate
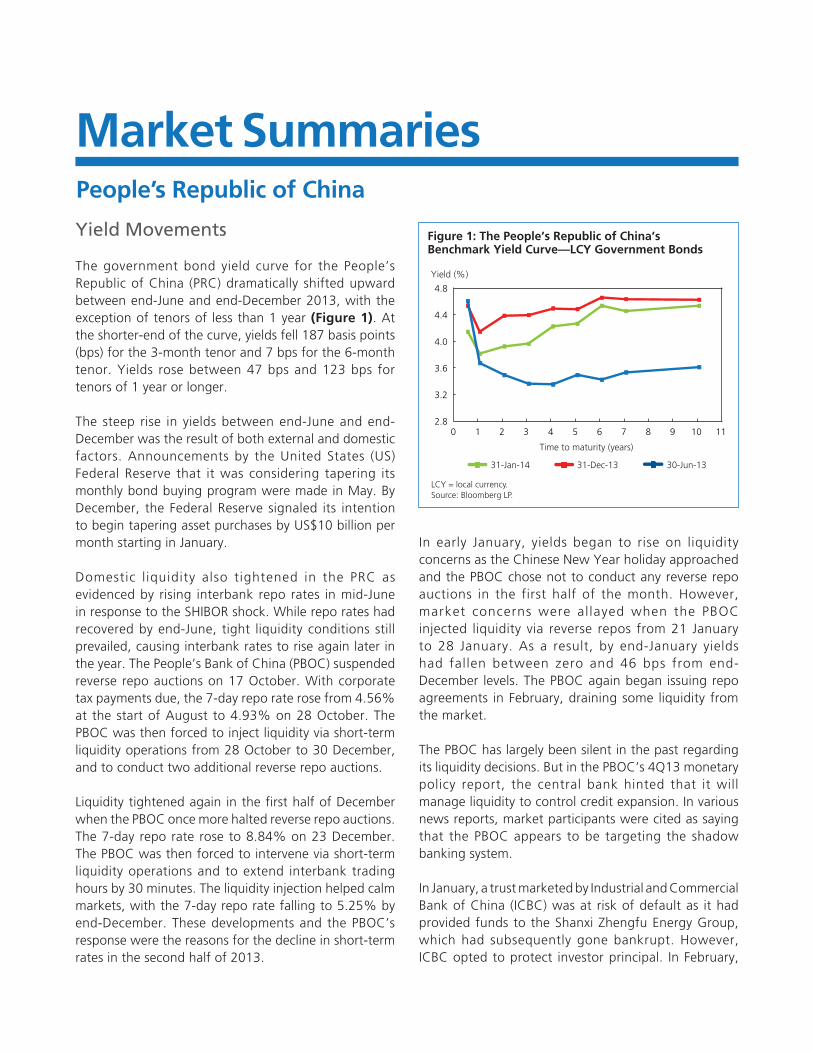
44 Asia Bond Monitor
People’s Republic of China
Market Summaries
Yield Movements
The government bond yield curve for the People’s Republic of China (PRC) dramatically shifted upward between end-June and end-December 2013, with the exception of tenors of less than 1 year (Figure 1). At the shorter-end of the curve, yields fell 187 basis points (bps) for the 3-month tenor and 7 bps for the 6-month tenor. Yields rose between 47 bps and 123 bps for tenors of 1 year or longer. The steep rise in yields between end-June and end-December was the result of both external and domestic factors. Announcements by the United States (US) Federal Reserve that it was considering tapering its monthly bond buying program were made in May. By December, the Federal Reserve signaled its intention to begin tapering asset purchases by US$10 billion per month starting in January.
Domestic l iquidity also tightened in the PRC as evidenced by rising interbank repo rates in mid-June in response to the SHIBOR shock. While repo rates had recovered by end-June, tight liquidity conditions still prevailed, causing interbank rates to rise again later in the year. The People’s Bank of China (PBOC) suspended reverse repo auctions on 17 October. With corporate tax payments due, the 7-day repo rate rose from 4.56% at the start of August to 4.93% on 28 October. The PBOC was then forced to inject liquidity via short-term liquidity operations from 28 October to 30 December, and to conduct two additional reverse repo auctions.
Liquidity tightened again in the first half of December when the PBOC once more halted reverse repo auctions. The 7-day repo rate rose to 8.84% on 23 December. The PBOC was then forced to intervene via short-term liquidity operations and to extend interbank trading hours by 30 minutes. The liquidity injection helped calm markets, with the 7-day repo rate falling to 5.25% by end-December. These developments and the PBOC’s response were the reasons for the decline in short-term rates in the second half of 2013.
In early January, yields began to rise on liquidity concerns as the Chinese New Year holiday approached and the PBOC chose not to conduct any reverse repo auctions in the first half of the month. However, market concerns were al layed when the PBOC injected liquidity via reverse repos from 21 January to 28 January. As a result, by end-January yields had fallen between zero and 46 bps from end-December levels. The PBOC again began issuing repo agreements in February, draining some liquidity from the market.
The PBOC has largely been silent in the past regarding its liquidity decisions. But in the PBOC’s 4Q13 monetary policy report, the central bank hinted that it will manage liquidity to control credit expansion. In various news reports, market participants were cited as saying that the PBOC appears to be targeting the shadow banking system.
In January, a trust marketed by Industrial and Commercial Bank of China (ICBC) was at risk of default as it had provided funds to the Shanxi Zhengfu Energy Group, which had subsequently gone bankrupt. However, ICBC opted to protect investor principal. In February,
Yield (%)
4.8
4.4
4.0
3.6
3.2
2.80 1 2 3 4 5 6 7 8 9 10 11
Figure 1: The People’s Republic of China’sBenchmark Yield Curve—LCY Government Bonds
LCY = local currency.Source: Bloomberg LP.
Time to maturity (years)
31-Dec-13 30-Jun-1331-Jan-14
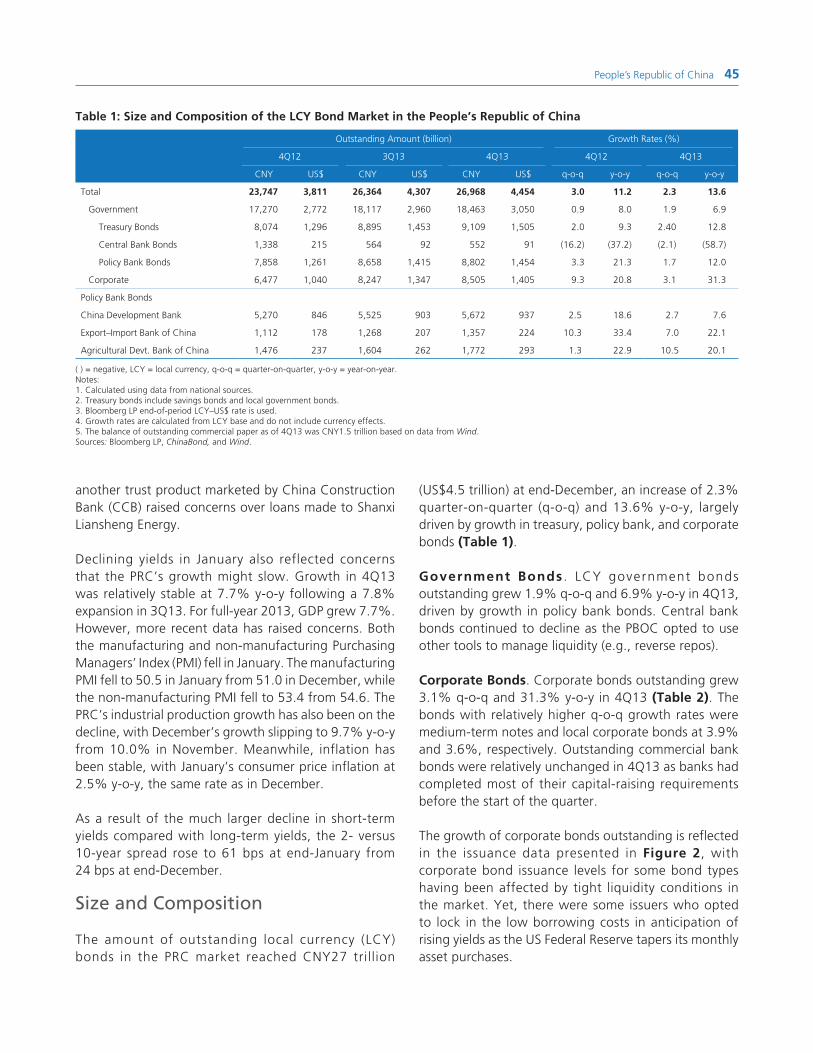
People’s Republic of China 45
(US$4.5 trillion) at end-December, an increase of 2.3% quarter-on-quarter (q-o-q) and 13.6% y-o-y, largely driven by growth in treasury, policy bank, and corporate bonds (Table 1).
Government Bonds . LCY government bonds outstanding grew 1.9% q-o-q and 6.9% y-o-y in 4Q13, driven by growth in policy bank bonds. Central bank bonds continued to decline as the PBOC opted to use other tools to manage liquidity (e.g., reverse repos).
Corporate Bonds. Corporate bonds outstanding grew 3.1% q-o-q and 31.3% y-o-y in 4Q13 (Table 2). The bonds with relatively higher q-o-q growth rates were medium-term notes and local corporate bonds at 3.9% and 3.6%, respectively. Outstanding commercial bank bonds were relatively unchanged in 4Q13 as banks had completed most of their capital-raising requirements before the start of the quarter.
The growth of corporate bonds outstanding is reflected in the issuance data presented in Figure 2, with corporate bond issuance levels for some bond types having been affected by tight liquidity conditions in the market. Yet, there were some issuers who opted to lock in the low borrowing costs in anticipation of rising yields as the US Federal Reserve tapers its monthly asset purchases.
another trust product marketed by China Construction Bank (CCB) raised concerns over loans made to Shanxi Liansheng Energy.
Declining yields in January also reflected concerns that the PRC’s growth might slow. Growth in 4Q13 was relatively stable at 7.7% y-o-y following a 7.8% expansion in 3Q13. For full-year 2013, GDP grew 7.7%. However, more recent data has raised concerns. Both the manufacturing and non-manufacturing Purchasing Managers’ Index (PMI) fell in January. The manufacturing PMI fell to 50.5 in January from 51.0 in December, while the non-manufacturing PMI fell to 53.4 from 54.6. The PRC’s industrial production growth has also been on the decline, with December’s growth slipping to 9.7% y-o-y from 10.0% in November. Meanwhile, inflation has been stable, with January’s consumer price inflation at 2.5% y-o-y, the same rate as in December.
As a result of the much larger decline in short-term yields compared with long-term yields, the 2- versus 10-year spread rose to 61 bps at end-January from 24 bps at end-December.
Size and Composition
The amount of outstanding local currency (LCY) bonds in the PRC market reached CNY27 trillion
Table 1: Size and Composition of the LCY Bond Market in the People’s Republic of China
Outstanding Amount (billion) Growth Rates (%)
4Q12 3Q13 4Q13 4Q12 4Q13
CNY US$ CNY US$ CNY US$ q-o-q y-o-y q-o-q y-o-y
Total 23,747 3,811 26,364 4,307 26,968 4,454 3.0 11.2 2.3 13.6
Government 17,270 2,772 18,117 2,960 18,463 3,050 0.9 8.0 1.9 6.9
Treasury Bonds 8,074 1,296 8,895 1,453 9,109 1,505 2.0 9.3 2.40 12.8
Central Bank Bonds 1,338 215 564 92 552 91 (16.2) (37.2) (2.1) (58.7)
Policy Bank Bonds 7,858 1,261 8,658 1,415 8,802 1,454 3.3 21.3 1.7 12.0
Corporate 6,477 1,040 8,247 1,347 8,505 1,405 9.3 20.8 3.1 31.3
Policy Bank Bonds
China Development Bank 5,270 846 5,525 903 5,672 937 2.5 18.6 2.7 7.6
Export–Import Bank of China 1,112 178 1,268 207 1,357 224 10.3 33.4 7.0 22.1
Agricultural Devt. Bank of China 1,476 237 1,604 262 1,772 293 1.3 22.9 10.5 20.1
( ) = negative, LCY = local currency, q-o-q = quarter-on-quarter, y-o-y = year-on-year.Notes: 1. Calculated using data from national sources.2. Treasury bonds include savings bonds and local government bonds.3. Bloomberg LP end-of-period LCY–US$ rate is used.4. Growth rates are calculated from LCY base and do not include currency effects.5. The balance of outstanding commercial paper as of 4Q13 was CNY1.5 trillion based on data from Wind.Sources: Bloomberg LP, ChinaBond, and Wind.

46 Asia Bond Monitor
A relatively small number of issuers dominate the PRC’s corporate bond market (Table 3). As of 4Q13, the top 30 corporate bond issuers accounted for CNY4.1 trillion worth of corporate bonds outstanding, or about 49% of the market. Among the top 30 corporate issuers, the 10 largest accounted for CNY2.8 trillion worth of bonds outstanding.
State-owned companies—defined as majority-owned by the government—continued to dominate the corporate bond market in 4Q13. Among the top 30 corporate issuers at end-December, 22 were state-owned.
Table 4 presents the most significant issuances of 4Q13.
Commercial Bank BondsState-Owned Corporate BondsLocal Corporate BondsMedium-Term Notes
300
250
200
150
100
50
0
CNY billion
2Q131Q13
Source: ChinaBond.
4Q12 3Q13 4Q13
Figure 2: Corporate Bond Issuance in Key Sectors Investor Profile
Treasury Bonds. Banks remained the largest category of investors in the PRC’s treasury bond market, which includes policy bank bonds, holding a slightly smaller share of these bonds at the end of 4Q13 (77.0%) than at the end of 4Q12 (77.2%) (Figure 3).
Corporate Bonds. Banks were also the largest holders of corporate bonds at the end of 4Q13, albeit with a comparatively smaller share than their holdings of treasury bonds and policy bank bonds. Banks’ share of corporate bonds fell to 29.5% at the end of 4Q13 from 36.7% a year earlier (Figure 4). The second largest holders of corporate bonds were insurance companies, with a 14.7% share at the end of 4Q13, down from a 21.0% share a year earlier.
Figure 5 presents investor profiles across corporate bond categories. Based on the latest data available, banks were the largest holders of medium-term notes at end-December with more than 50% of the total. Meanwhile, insurance companies were the largest holders of commercial bank bonds.
Liquidity
Figure 6 presents the turnover ratios for government bonds, which have seen a significant decline since June, reflecting both tight liqudity conditions as well as the crackdown on illegal bond trading in May.
Interest Rate Swaps
In 4Q13, the total not ional amount of s igned interest rate swap agreements in the PRC reached
Table 2: Corporate Bonds Outstanding in Key Sectors
Outstanding Amount (CNY billion)
Growth Rates (%)
q-o-q y-o-y
1Q13 2Q13 3Q13 4Q13 1Q13 2Q13 3Q13 4Q13 4Q13
Commercial Bank Bonds 1,304 1,329 1,299 1,311 3.1 1.9 (2.2) 0.9 3.6
State-Owned Corporate Bonds 1,024 653 647 646 3.2 (36.3) (0.9) (0.1) (34.9)
Local Corporate Bonds 1,484 1,580 1,626 1,684 13.7 6.4 2.9 3.6 29.0
Medium-Term Notes 3,194 3,509 3,705 3,848 10.2 9.9 5.6 3.9 32.8
( ) = negative, – = not available, q-o-q = quarter-on-quarter, y-o-y = year-on-year.Source: ChinaBond.

People’s Republic of China 47
Table 3: Top 30 Issuers of LCY Corporate Bonds in the People’s Republic of China
Issuers
Outstanding Amount
State-OwnedListed
CompanyType of IndustryLCY Bonds
(CNY billion) LCY Bonds(US$ billion)
1. China Railway 896.0 147.99 Yes No Transportation
2. State Grid Corporation of China 354.5 58.55 Yes No Public Utilities
3. China National Petroleum 340.0 56.16 Yes No Energy
4. Industrial and Commercial Bank of China 233.0 38.49 Yes Yes Banking
5. Bank of China 224.9 37.15 Yes Yes Banking
6. China Construction Bank 205.0 33.86 Yes Yes Banking
7. Agricultural Bank of China 153.0 25.27 Yes Yes Banking
8. China Petroleum & Chemical 134.7 22.25 Yes Yes Energy
9. China Guodian 112.3 18.55 Yes No Public Utilities
10. Central Huijin Investment 109.0 18.00 Yes No Diversified Financial
11. Petrochina 106.0 17.51 Yes Yes Energy
12. China Minsheng Bank 102.3 16.90 No Yes Banking
13. Shenhua Group 97.0 16.02 Yes No Energy
14. China Power Investment 89.6 14.80 Yes No Public Utilities
15. Bank of Communications 89.0 14.70 No Yes Banking
16. Shanghai Pudong Development Bank 82.2 13.58 No Yes Banking
17. China Three Gorges Project 77.5 12.80 Yes No Public Utilities
18. Industrial Bank 71.0 11.73 No Yes Banking
19. China Southern Power Grid 68.5 11.31 Yes No Public Utilities
20. China Life 68.0 11.23 Yes Yes Insurance
21. China Merchants Bank 64.7 10.69 No Yes Banking
22. China Citic Bank 60.5 9.99 No Yes Banking
23. China Huaneng Group 60.0 9.91 Yes No Public Utilities
24. State-Owned Capital Operation and Management Center of Beijing
55.0 9.08 Yes No Diversified Financial
25. China Everbright Bank 52.7 8.70 No Yes Banking
26. Citic Group 49.5 8.18 Yes No Diversified Financial
27. Tianjin Infrastructure Investment Group 47.8 7.90 Yes No Capital Goods
28. China Datang 44.7 7.38 Yes No Public Utilities
29. Bank of Beijing 43.5 7.18 No Yes Banking
30. Huaneng Power International 43.0 7.10 Yes Yes Public Utilities
Total Top 30 LCY Corporate Issuers 4,134.94 682.98
Total LCY Corporate Bonds 8,505.36 1,404.85
Top 30 as % of Total LCY Corporate Bonds 49% 49%
LCY = local currency.Notes:1. Data as of end-December 2013.2. State-owned firms are defined as those in which the government has more than a 50% ownership stake.Source: AsianBondsOnline calculations based on Wind data.
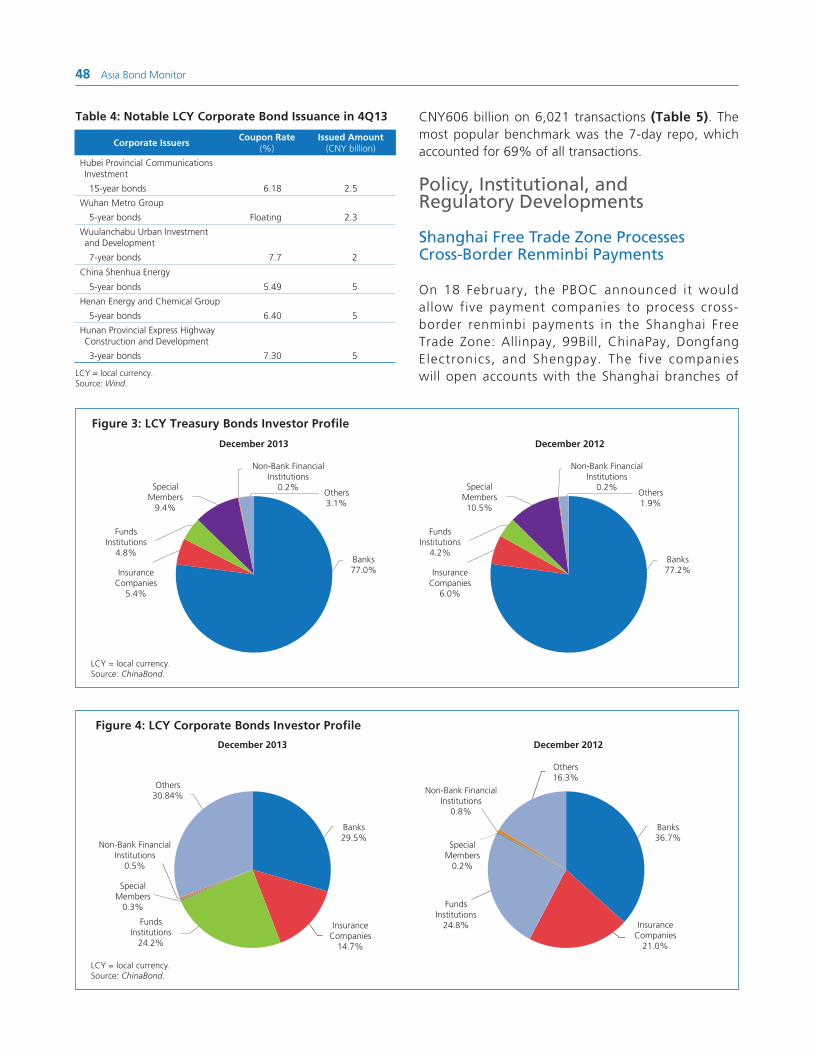
48 Asia Bond Monitor
CNY606 billion on 6,021 transactions (Table 5). The most popular benchmark was the 7-day repo, which accounted for 69% of all transactions.
Policy, Institutional, and Regulatory Developments
Shanghai Free Trade Zone Processes Cross-Border Renminbi Payments
On 18 February, the PBOC announced it would allow five payment companies to process cross-border renminbi payments in the Shanghai Free Trade Zone: Allinpay, 99Bill, ChinaPay, Dongfang Electronics, and Shengpay. The five companies will open accounts with the Shanghai branches of
Figure 4: LCY Corporate Bonds Investor Profile
LCY = local currency.Source: ChinaBond.
December 2013 December 2012
SpecialMembers
0.3%
Banks29.5%
InsuranceCompanies
14.7%
FundsInstitutions
24.2%
Others30.84%
Non-Bank FinancialInstitutions
0.5%
SpecialMembers
0.2%
Banks36.7%
InsuranceCompanies
21.0%
FundsInstitutions
24.8%
Others16.3%
Non-Bank FinancialInstitutions
0.8%
Figure 3: LCY Treasury Bonds Investor Profile
LCY = local currency.Source: ChinaBond.
December 2013 December 2012
SpecialMembers
9.4%
Banks77.0%Insurance
Companies5.4%
FundsInstitutions
4.8%
Others3.1%
Non-Bank FinancialInstitutions
0.2% SpecialMembers10.5%
Banks77.2%Insurance
Companies6.0%
FundsInstitutions
4.2%
Others1.9%
Non-Bank FinancialInstitutions
0.2%
Table 4: Notable LCY Corporate Bond Issuance in 4Q13
Corporate IssuersCoupon Rate
(%)Issued Amount
(CNY billion)
Hubei Provincial Communications Investment
15-year bonds 6.18 2.5
Wuhan Metro Group
5-year bonds Floating 2.3
Wuulanchabu Urban Investment and Development
7-year bonds 7.7 2
China Shenhua Energy
5-year bonds 5.49 5
Henan Energy and Chemical Group
5-year bonds 6.40 5
Hunan Provincial Express Highway Construction and Development
3-year bonds 7.30 5
LCY = local currency.Source: Wind.

People’s Republic of China 49
Table 5: Notional Values of the PRC’s Interest Rate Swap Market in 4Q13
Interest Rate Swap Benchmarks
Notional Amount
(CNY billion)
% of Total Notional Amount
Number of Transactions
Growth Rate (%)
4Q13 q-o-q y-o-y
7-Day Repo Rate 418.4 69.1 4,588 3.6 45.4
Overnight SHIBOR 87.1 14.4 203 10.2 (83.6)
3-Month SHIBOR 89.6 14.8 1,097 11.9 0.9
1-Year Term Deposit Rate 9.1 1.5 116 122.2 26.3
1-Year Lending Rate 1.2 0.2 11 (28.7) (87.6)
3-Year Lending Rate 0.6 0.1 6 (34.4) (83.0)
Total 606.0 100.0 6,021 6.4 (34.7)
( ) = negative, PRC = People’s Republic of China, q-o-q = quarter-on-quarter, Repo = repurchase, SHIBOR = Shanghai Interbank Offered Rate, y-o-y = year on year.Sources: AsianBondsOnline and ChinaMoney.
investments. Prior to this, fixed-income investing had some restrictions, such as investments only in corporate bonds with credit ratings of BBB and above, as well as a 40% limit in corporate bonds.
Limits on equity investments were also raised to 30%. Prior to this, the limits were 25% in listed equities, and 10% in unlisted equities and equity investment funds.
Banks Liquidity Coverage Ratio Requirement Increased
On 20 February, the China Banking Regulatory Commission (CBRC) announced new rules requiring banks to maintain a 100% Liquidity Coverage Ratio (LCR) by 2018 compared with the prior requirement of 60%. The LCR requirement will increase by 10% each year until reaching 100% in 2018.
ICBC, Bank of China (BoC), CBC, China Merchants Bank, and China Minsheng Bank to help facilitate the transfers.
PBOC Resumes Repo Auctions
On 18 February, the PBOC conducted its first repo auction in 8 months when it auctioned 14-day repurchase agreements at a rate of 3.8%. The total amount issued was CNY48 billion.
CIRC Relaxes Investment Limits for Insurance Companies
On 19 February, the China Insurance Regulatory Commission (CIRC) released new regulations regarding allowable investments for insurance companies. There wil l no longer be l imits for fixed-income
0
10
20
30
40
50
60
70
80
90
100
%
Funds Institutions Others
Banks Special Members
Insurance Companies Non-Bank Financial Institutions
CommercialBank Bonds
CorporateBonds
MTNs
Figure 5: Investor Profile across Bond Categories
MTNs = medium-term notes.Note: Data as of end-September 2013.Source: ChinaBond.
1.8
1.6
1.4
1.2
1.0
0.8
0.6
0.4
0.2
0.0
Policy Bank Bonds
Treasury BondsCentral Bank Bonds
Figure 6: Turnover Ratios for Government Bonds
Source: ChinaBond.
Jun-
05
Dec
-05
Jun-
06
Dec
-06
Jun-
07
Dec
-07
Jun-
08
Dec
-08
Jun-
09
Dec
-09
Jun-
10
Dec
-10
Jun-
11
Dec
-11
Jun-
12
Dec
-12
Jun-
13
Dec
-13

50 Asia Bond Monitor
Hong Kong, China
Yield Movements
Between end-June and end-December, yields for Hong Kong, China’s Exchange Fund Bills and Notes (EFBNs) fell at the shorter-end and rose at the longer-end of the curve, with the exception of the 2-year Exchange Fund Note (EFN), resulting in the steepening of the yield curve (Figure 1). The rise in yields partly reflects uncertainty over the United States (US) Federal Reserve’s tapering measures.
After the Federal Reserve meetings in December and January, which announced the winding down of its monthly asset purchase program to US$75 billion in January and US$65 billion in February, the EFBN yield curve flattened. Yields rose between 1 basis point (bp) and 3 bps from the 1-month Exchange Fund Bill (EFB) through the 6-month EFB, and fell between 1 bp and 14 bps for the 1-year maturity through the end of the curve. As a result, the yield spread between the 2- and 10-year tenors narrowed slightly to 191 bps at end-January from 197 bps at end-December.
Yield movements in Hong Kong, China and the US are highly correlated as Hong Kong, China’s currency is pegged to the US dollar. The drop in long-term yields partly reflects concerns over slower economic growth. In 3Q13, gross domestic product (GDP) growth in Hong Kong, China eased to 2.9% year-on-year (y-o-y) from 3.2% in the previous quarter. Domestic consumption and investment continued to drive growth, although at much slower pace than in 2Q13. Growth in private consumption moderated to 2.8% y-o-y in 3Q13, while investment growth slowed to 2.2%. For full-year 2013, the government estimates that GDP growth reached 3.0%.
Consumer price inflation was relatively tame in 2013, averaging 4.0% compared with 4.7% in 2012. The government expects inflationary pressures to remain contained in 2014, given the low level of imported inflation and slower increases in rental prices in certain areas.
Size and Composition
The size of Hong Kong, China’s local currency (LCY) bond market rose 0.5% quarter-on-quarter (q-o-q) and 9.2% y-o-y to reach HKD1,503 billion (US$194 billion) at end-December (Table 1).
At end-December, the stock of government bonds—comprising EFBs, EFNs, and HKSAR bonds—grew 0.4% q-o-q and 16.1% y-o-y to reach HKD841 billion. Growth in government bonds was largely driven by HKSAR bonds, which are issued under the HKMA’s Institutional Bond Issuance Program. In November, the government raised HKD3 billion from the sale of 3-year HKSAR bonds.
LCY corporate bonds outstanding grew marginally by 0.5% q-o-q and 1.6% y-o-y to reach HKD661 billion at end-December. In 4Q13, the three largest issuances came from the Airport Authority of Hong Kong (HKD0.5 billion), Hong Kong Mortgage Corporation (HKMC) (HKD0.4 b i l l ion) , and Wharf F inance (HKD0.3 billion) (Table 2).
Corporate bonds outstanding from the top 27 non-bank issuers in Hong Kong, China amounted to HKD106.6 billion at end-December, representing about
Figure 1: Hong Kong, China’s Benchmark Yield Curve—EFBNs
EFBN = Exchange Fund Bills and Notes.Source: Bloomberg LP.
3.0
2.5
2.0
1.5
1.0
0.5
0.00 2 4 6 8 10 12 1614
Yield (%)
Time to maturity (years)
31-Dec-13 30-Jun-1331-Jan-14

Hong Kong, China 51
outstanding. Among the list, there are five state-owned companies and eight Hong Kong Exchange-listed firms, only one state-owned company, the MTR Corporation, is listed.
Policy, Institutional, and Regulatory Developments
Hong Kong, China and Malaysia to Promote Offshore Renminbi Business
On 3 December, Hong Kong, China and Malaysia conducted the first meeting of the Hong Kong–Malaysia Private Sector Dialogue on Offshore Renminbi Business. The purpose of the dialogue is to jointly develop the offshore renminbi business. During the dialogue, both economies agreed to expand cooperation between banks in Hong Kong, China and Malaysia. They also agreed to promote awareness about the use of the renminbi in trade settlement and promote the development of the reminbi sukuk (Islamic bond) market.
16% of total outstanding corporate bonds at the end of 4Q13. The top 27 list of issuers was dominated by real estate firms (Table 3). As was the case in the previous quarter, HKMC remained the top issuer in Hong Kong, China with outstanding bonds of HKD13.4 billion. Next was CLP Power Hong Kong Financing with HKD10.0 billion of bonds outstanding, followed closely by Sun Hung Kai Properties’ HKD9.9 billion of bonds
Table 1: Size and Composition of the LCY Bond Market in Hong Kong, China
Outstanding Amount (billion) Growth Rate (%)
4Q12 3Q13 4Q13 4Q12 4Q13
HKD US$ HKD US$ HKD US$ q-o-q y-o-y q-o-q y-o-y
Total 1,376 177 1,496 193 1,503 194 0.9 5.1 0.5 9.2
Government 724 93 838 108 841 108 0.5 3.0 0.4 16.1
Exchange Fund Bills 589 76 682 88 683 88 0.1 0.4 0.1 16.0
Exchange Fund Notes 69 9 68 9 68 8.8 (0.4) (0.9) (0.4) (0.9)
HKSAR Bonds 67 9 87 11 90 12 4.7 39.6 3.4 34.3
Corporate 651 84 658 85 661 85 1.3 7.6 0.5 1.6
( ) = negative, HKSAR = Hong Kong Special Administrative Region, LCY = local currency, q-o-q = quarter-on-quarter, y-o-y = year-on-year.Notes:1. Calculated using data from national sources.2. Bloomberg LP end-of-period LCY–US$ rates are used.3. Growth rates are calculated from LCY base and do not include currency effects.Sources: Hong Kong Monetary Authority and Bloomberg LP.
Table 2: Notable LCY Corporate Bond Issuance in 4Q13
Corporate IssuersCoupon Rate
(%)Issued Amount
(HKD billion)
Airport Authority of Hong Kong
2-year bonds 0.90 0.50
The Hong Kong Mortgage Corporation
2-year bonds Floating 0.43
Wharf Finance
5-year bonds 3.00 0.30
LCY = local currency.Source: Central Moneymarkets Unit (CMU) HKMA.

52 Asia Bond Monitor
Table 3: Top 27 Non-Bank Corporate Issuers in Hong Kong, China
Issuers
Outstanding AmountState-
OwnedListed
CompanyType of IndustryLCY Bonds
(HKD billion)LCY Bonds(US$ billion)
1. The Hong Kong Mortgage Corporate 13.42 1.73 Yes No Finance
2. CLP Power Hong Kong Financing 10.01 1.29 No No Electric
3. Sun Hung Kai Properties (Capital Market) 9.93 1.28 No No Real Estate
4. MTR Corporation (C.I.) 6.73 0.87 Yes Yes Transportation
5. Wharf Finance 6.14 0.79 No No Diversified
6. The Link Finance (Cayman) 2009 5.75 0.74 No No Finance
7. HKCG (Finance) 5.60 0.72 No No Gas
8. Hongkong Electric Finance 5.51 0.71 No No Electric
9. Swire Pacific 4.83 0.62 No Yes Diversified
10. Kowloon-Canton Railway 4.80 0.62 Yes No Transportation
11. Cheung Kong Bond Finance 4.62 0.60 No Yes Real Estate
12. Urban Renewal Authority 3.90 0.50 Yes No Real Estate
13. Wheelock Finance 3.74 0.48 No No Diversified
14. NWD (MTN) 3.50 0.45 No Yes Real Estate
15. Airport Authority Hong Kong 3.50 0.45 Yes No Transportation
16. Yue Xiu Enterprises (Holdings) 3.00 0.39 No No Diversified
17. Hysan (MTN) 2.43 0.31 No No Finance
18. Henderson Land MTN 1.83 0.24 No Yes Finance
19. Cathay Pacific MTN Financing 1.70 0.22 No Yes Airlines
20. Nan Fung Treasury 1.31 0.17 No No Real Estate
21. Dragon Drays 1.00 0.13 No No Diversified
22. Swire Properties MTN Financing 0.80 0.10 No No Real Estate
23. R-Reit International Finance 0.78 0.10 No No Real Estate
24. Wing Tai Properties (Finance) 0.58 0.07 No No Real Estate
25. HLP Finance 0.56 0.07 No Yes Real Estate
26. CITIC Pacific 0.50 0.06 No Yes Diversified
27. The Hongkong Land Notes Company 0.20 0.03 No No Finance
Total Top 27 Non-Bank LCY Corporate Issuers 106.63 13.75
Total LCY Corporate Bonds 661.47 85.31
Top 27 as % of Total LCY Corporate Bonds 16.12% 16.12%
LCY = local currency.Notes:1. Data as of end-December 2013.2. State-owned firms are defined as those in which the government has more than a 50% ownership stake.Source: AsianBondsOnline calculations based on Hong Kong Monetary Authority data.

Indonesia 53
Indonesia
Yield Movements
Between end-June and end-December, local currency (LCY) government bond yields in Indonesia rose dramatically, with the entire curve shifting upward (Figure 1). The steep rise in yields reflected negative sentiments generated by external and domestic factors. Bond yields have been on the rise since May over uncertainty about United States (US) monetary policy. In December, the US Federal Reserve announced that it would begin tapering its asset purchase program by US$10 billion per month—from US$85 billion to US$75 billion—beginning in January 2014. On the domestic front, a slew of negative news weighed on the market, including a rising inflation rate, a widening current account deficit, and a weakening rupiah.
Government bond yields continued to rise between end-December and end-January from the 3-year maturity through the long-end of the curve, while yields at the short-end of the curve (1- and 2-year maturities) fell, resulting in a steepened yield curve. The spread between 2- and 10-year maturities widened to 143 basis points (bps) at end-January from 81 bps at end-December and 58 bps at end-June.
In January, the Federal Reserve announced another US$10 billion cut in its monthly asset purchase program to US$65 billion starting in February. As a result, increasing risk aversion in emerging market assets has pushed yields upward in Indonesia and elsewhere. In addition, inflation expectations remained high as the flooding that affected various areas in Indonesia in January disrupted food supplies and resulted in higher food prices. Consumer price inflation slowed in September but remained elevated in January at 8.2% year-on-year (y-o-y). Indonesia’s inflation rate has been the highest in emerging East Asia since July of last year after the government reduced fuel subsidies.
Bank Indonesia initiated macroprudential measures and tightened its monetary policy in the second half of 2013 on the back of a widening current account deficit. Bank Indonesia raised its benchmark rate by a cumulative 175 bps to 7.50% between June and November. In its Board of Governors meeting held on 9 January, Bank
Indonesia held steady its benchmark interest rate, and kept the lending facility rate at 7.50% and the deposit facility rate at 5.75%. The central bank noted that at current levels these rates were in line with ongoing efforts to bring down the inflation rate toward its full-year 2014 target range of 3.5%–5.5%, and reduce the current account deficit to a more sustainable level.
Gross domestic product (GDP) growth in Indonesia was below 6.0% y-o-y for the third consecutive quarter in 4Q13, coming in at 5.7%, which was up from 5.6% in 3Q13 but down from a growth rate of 6.2% recorded a year earlier. According to the Ministry of Finance, the government geared its policies toward addressing the current account deficit and sacrificed economic growth in the process. Exports recovered strongly, rising 7.4% y-o-y in 4Q13 due to higher demand from developed economies. Growth in domestic consumption, which slowed to 5.4% in 4Q13, also helped boost economic growth. Investment growth moderated to 4.4% in 4Q13 after rising 4.5% in the previous quarter. On a quarter-on-quarter (q-o-q) basis, the economy contracted 1.4% in 4Q13.
Size and Composition
The outstanding stock of LCY bonds in Indonesia reached IDR1,309.6 trillion (US$108 billion) at end-December, expanding 6.8% q-o-q and 20.1% y-o-y (Table 1).
Figure 1: Indonesia’s Benchmark Yield Curve— LCY Government Bonds
LCY = local currency.Source: Bloomberg LP.
Yield (%)
Time to maturity (years)
10
9
8
7
60 3 6 9 12 15 18 21 24 27 30 33
31-Dec-13 30-Jun-1331-Jan-14
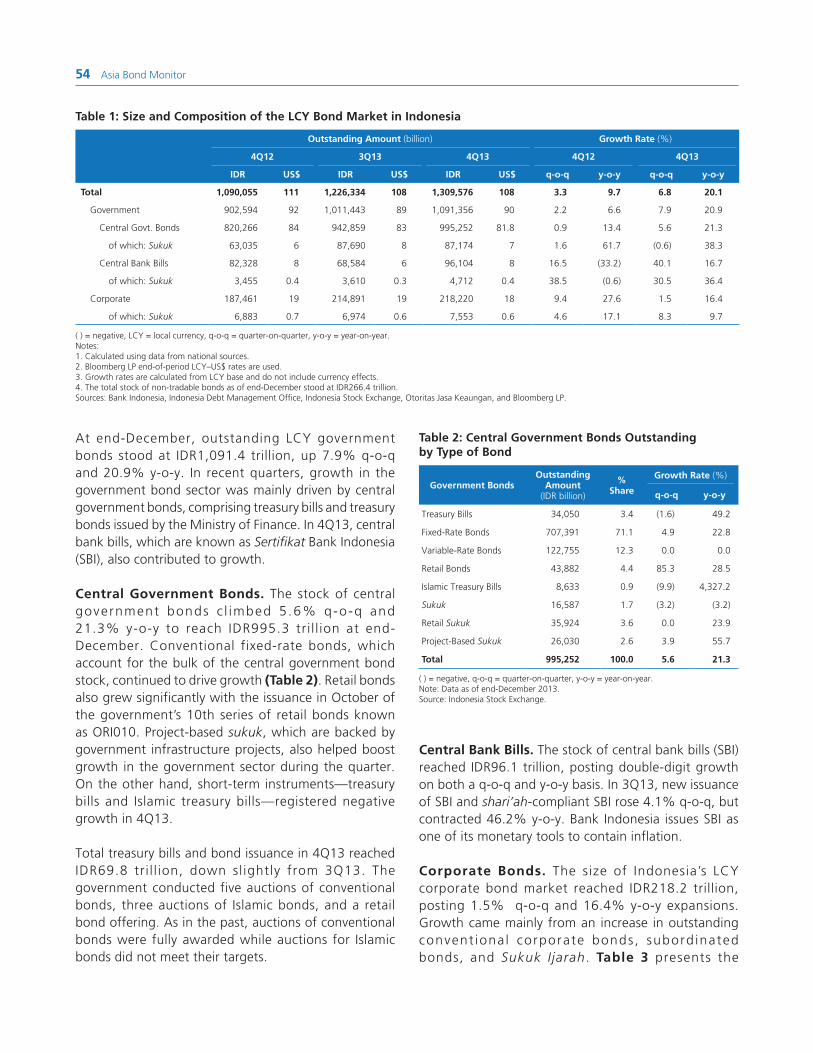
54 Asia Bond Monitor
Table 2: Central Government Bonds Outstanding by Type of Bond
Government BondsOutstanding
Amount (IDR billion)
% Share
Growth Rate (%)
q-o-q y-o-y
Treasury Bills 34,050 3.4 (1.6) 49.2
Fixed-Rate Bonds 707,391 71.1 4.9 22.8
Variable-Rate Bonds 122,755 12.3 0.0 0.0
Retail Bonds 43,882 4.4 85.3 28.5
Islamic Treasury Bills 8,633 0.9 (9.9) 4,327.2
Sukuk 16,587 1.7 (3.2) (3.2)
Retail Sukuk 35,924 3.6 0.0 23.9
Project-Based Sukuk 26,030 2.6 3.9 55.7
Total 995,252 100.0 5.6 21.3
( ) = negative, q-o-q = quarter-on-quarter, y-o-y = year-on-year.Note: Data as of end-December 2013.Source: Indonesia Stock Exchange.
Central Bank Bills. The stock of central bank bills (SBI) reached IDR96.1 trillion, posting double-digit growth on both a q-o-q and y-o-y basis. In 3Q13, new issuance of SBI and shari’ah-compliant SBI rose 4.1% q-o-q, but contracted 46.2% y-o-y. Bank Indonesia issues SBI as one of its monetary tools to contain inflation. Corporate Bonds. The size of Indonesia’s LCY corporate bond market reached IDR218.2 trillion, posting 1.5% q-o-q and 16.4% y-o-y expansions. Growth came mainly from an increase in outstanding convent iona l corporate bonds , subord inated bonds, and Sukuk I jarah. Table 3 presents the
Table 1: Size and Composition of the LCY Bond Market in Indonesia
Outstanding Amount (billion) Growth Rate (%)
4Q12 3Q13 4Q13 4Q12 4Q13
IDR US$ IDR US$ IDR US$ q-o-q y-o-y q-o-q y-o-y
Total 1,090,055 111 1,226,334 108 1,309,576 108 3.3 9.7 6.8 20.1
Government 902,594 92 1,011,443 89 1,091,356 90 2.2 6.6 7.9 20.9
Central Govt. Bonds 820,266 84 942,859 83 995,252 81.8 0.9 13.4 5.6 21.3
of which: Sukuk 63,035 6 87,690 8 87,174 7 1.6 61.7 (0.6) 38.3
Central Bank Bills 82,328 8 68,584 6 96,104 8 16.5 (33.2) 40.1 16.7
of which: Sukuk 3,455 0.4 3,610 0.3 4,712 0.4 38.5 (0.6) 30.5 36.4
Corporate 187,461 19 214,891 19 218,220 18 9.4 27.6 1.5 16.4
of which: Sukuk 6,883 0.7 6,974 0.6 7,553 0.6 4.6 17.1 8.3 9.7
( ) = negative, LCY = local currency, q-o-q = quarter-on-quarter, y-o-y = year-on-year.Notes:1. Calculated using data from national sources.2. Bloomberg LP end-of-period LCY–US$ rates are used.3. Growth rates are calculated from LCY base and do not include currency effects.4. The total stock of non-tradable bonds as of end-December stood at IDR266.4 trillion.Sources: Bank Indonesia, Indonesia Debt Management Office, Indonesia Stock Exchange, Otoritas Jasa Keaungan, and Bloomberg LP.
At end-December, outstanding LCY government bonds stood at IDR1,091.4 trillion, up 7.9% q-o-q and 20.9% y-o-y. In recent quarters, growth in the government bond sector was mainly driven by central government bonds, comprising treasury bills and treasury bonds issued by the Ministry of Finance. In 4Q13, central bank bills, which are known as Sertifikat Bank Indonesia (SBI), also contributed to growth.
Central Government Bonds. The stock of central government bonds c l imbed 5 .6% q-o-q and 21.3% y-o-y to reach IDR995.3 tri l l ion at end-December. Conventional fixed-rate bonds, which account for the bulk of the central government bond stock, continued to drive growth (Table 2). Retail bonds also grew significantly with the issuance in October of the government’s 10th series of retail bonds known as ORI010. Project-based sukuk, which are backed by government infrastructure projects, also helped boost growth in the government sector during the quarter. On the other hand, short-term instruments—treasury bills and Islamic treasury bills—registered negative growth in 4Q13.
Total treasury bills and bond issuance in 4Q13 reached IDR69.8 tr i l l ion, down sl ightly from 3Q13. The government conducted five auctions of conventional bonds, three auctions of Islamic bonds, and a retail bond offering. As in the past, auctions of conventional bonds were fully awarded while auctions for Islamic bonds did not meet their targets.

Indonesia 55
breakdown of outstanding corporate bonds by type at end-December. The stock of corporate bonds is dominated by conventional corporate bonds, which account for 84.7% of total corporate bonds. Sukuk (Islamic bonds) accounted for less than 4.0% of the total.
In 4Q13, the aggregate amount of bonds issued by the top 30 LCY corporate bond issuers in Indonesia reached IDR168.4 trillion (Table 4). This represented 77.2% of total corporate bonds outstanding at end-December. The top 30 issuers were largely dominated by financial and banking institutions, which accounted for two-thirds of the firms. The top 30 list was led by state-power firm PLN with outstanding LCY corporate bonds of IDR16.9 trillion, followed by financing firms Astra Sedaya Finance (IDR11.9 trillion) and Adira Dinamika Multi Finance (IDR11.4 trillion).
New i s suance o f co rpo ra t e bonds r ea ched IDR11.2 trillion in 4Q13. A total of 10 firms issued 26 series of corporate bonds during the quarter, led mostly by firms from the banking and non-bank financial sectors. All bonds were conventional except for three issues of Sukuk Ijarah and one subordinated bond issue. The maturity structure of these new issues was mostly concentrated between 3 and 5 years. In addition, there was one issue carrying a 7-year maturity and two issues of a 10-year tenor. Table 5 shows some notable corporate bonds issued in 4Q13.
Table 3: Corporate Bonds Outstanding by Type of Bond
Corporate Bonds
Outstanding Amount
(IDR billion)
% Share
Growth Rate (%)
q-o-q y-o-y
Bonds 184,771 84.7 1.1 20.3
Subordinated Bonds 25,746 11.8 3.5 (3.3)
Convertible Bonds 150 0.1 0.0 0.0
Sukuk Ijarah 4,974 2.3 21.5 6.0
Sukuk Mudharabah 1,079 0.5 0.0 39.2
Sukuk Mudharabah Subordinate
1,500 0.7 0.0 34.6
Total 218,220 100.0 1.5 16.4
– = not applicable, q-o-q = quarter-on-quarter, y-o-y = year-on-year.Notes:1. Data as of end-December 2013.2. Sukuk Ijarah refers to Islamic bonds backed by a lease agreement.3. Sukuk Mudharabah refers to Islamic bonds backed by a profit-sharing scheme from
a business venture or partnership. Source: Indonesia Stock Exchange.
Foreign Currency Bonds. In November, the government conducted its first sale of US$-denominated bonds targeted for the domestic market. The government raised US$190 million from the sale of 3.5-year bonds that carry a coupon of 3.5% and were priced to yield 3.51671%. The bond sale fell short of the government’s target of US$450 million as investors sought higher yields. A total of US$293.6 million in bids was received.
In January, the Indonesian government tapped the international market and raised US$4 billion from a two-tranche bond sale. The government sold US$2 billion of 10-year bonds to yield 5.95% with a coupon of 5.875%, and US$2 billion of 30-year bonds to yield 6.85% with a coupon of 6.75%. The bonds were oversubscribed with the order book reaching US$17.5 billion. The bulk of the 10-year tranche was sold to investors from the US (66%), while the remainder was sold to investors from Europe (17%), Indonesia (11%), and Asia (6%). The 30-year bonds were also mostly sold to investors from the US (70%), with the remainder was distributed among investors from Europe (16%), Asia (11%), and Indonesia (3%). The bonds were rated BBB– by Fitch Ratings and BB+ by Standard & Poor’s.
Investor Profile
Central Government Bonds. Banking institutions were the largest holder of LCY government bonds in Indonesia at end-December 2013, accounting for a 33.7% share of the total (Figure 2). However, this was down from a 36.5% share a year ago. Banking institutions comprise state recap banks, private recap banks, non-recap banks, regional banks, and shari’ah banks.
The second largest investor group was foreign investors, whose share slightly dropped to 32.5% in 4Q13 from 33.0% a year earlier. Their share, however, has gradually recovered after hitting a low of 30.6% at end-August, but is still lower compared with levels prior to May (Figure 3). In nominal terms, outstanding bonds held by foreign investors stood at IDR323.8 trillion at end-December.
At-end December, foreign investor holdings of government bonds were largely concentrated in longer-dated tenors. About 44% of government bonds
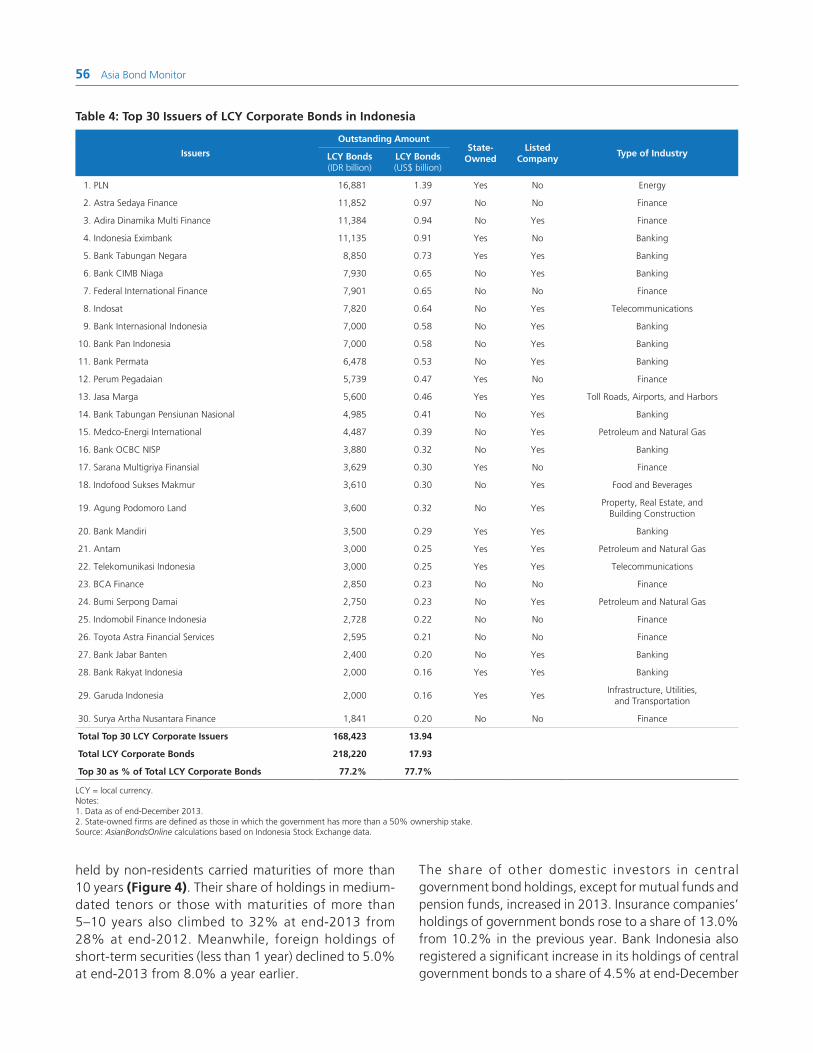
56 Asia Bond Monitor
Table 4: Top 30 Issuers of LCY Corporate Bonds in Indonesia
Issuers
Outstanding AmountState-
OwnedListed
CompanyType of IndustryLCY Bonds
(IDR billion)LCY Bonds(US$ billion)
1. PLN 16,881 1.39 Yes No Energy
2. Astra Sedaya Finance 11,852 0.97 No No Finance
3. Adira Dinamika Multi Finance 11,384 0.94 No Yes Finance
4. Indonesia Eximbank 11,135 0.91 Yes No Banking
5. Bank Tabungan Negara 8,850 0.73 Yes Yes Banking
6. Bank CIMB Niaga 7,930 0.65 No Yes Banking
7. Federal International Finance 7,901 0.65 No No Finance
8. Indosat 7,820 0.64 No Yes Telecommunications
9. Bank Internasional Indonesia 7,000 0.58 No Yes Banking
10. Bank Pan Indonesia 7,000 0.58 No Yes Banking
11. Bank Permata 6,478 0.53 No Yes Banking
12. Perum Pegadaian 5,739 0.47 Yes No Finance
13. Jasa Marga 5,600 0.46 Yes Yes Toll Roads, Airports, and Harbors
14. Bank Tabungan Pensiunan Nasional 4,985 0.41 No Yes Banking
15. Medco-Energi International 4,487 0.39 No Yes Petroleum and Natural Gas
16. Bank OCBC NISP 3,880 0.32 No Yes Banking
17. Sarana Multigriya Finansial 3,629 0.30 Yes No Finance
18. Indofood Sukses Makmur 3,610 0.30 No Yes Food and Beverages
19. Agung Podomoro Land 3,600 0.32 No YesProperty, Real Estate, and
Building Construction
20. Bank Mandiri 3,500 0.29 Yes Yes Banking
21. Antam 3,000 0.25 Yes Yes Petroleum and Natural Gas
22. Telekomunikasi Indonesia 3,000 0.25 Yes Yes Telecommunications
23. BCA Finance 2,850 0.23 No No Finance
24. Bumi Serpong Damai 2,750 0.23 No Yes Petroleum and Natural Gas
25. Indomobil Finance Indonesia 2,728 0.22 No No Finance
26. Toyota Astra Financial Services 2,595 0.21 No No Finance
27. Bank Jabar Banten 2,400 0.20 No Yes Banking
28. Bank Rakyat Indonesia 2,000 0.16 Yes Yes Banking
29. Garuda Indonesia 2,000 0.16 Yes YesInfrastructure, Utilities,
and Transportation
30. Surya Artha Nusantara Finance 1,841 0.20 No No Finance
Total Top 30 LCY Corporate Issuers 168,423 13.94
Total LCY Corporate Bonds 218,220 17.93
Top 30 as % of Total LCY Corporate Bonds 77.2% 77.7%
LCY = local currency.Notes:1. Data as of end-December 2013.2. State-owned firms are defined as those in which the government has more than a 50% ownership stake.Source: AsianBondsOnline calculations based on Indonesia Stock Exchange data.
held by non-residents carried maturities of more than 10 years (Figure 4). Their share of holdings in medium-dated tenors or those with maturities of more than 5–10 years also climbed to 32% at end-2013 from 28% at end-2012. Meanwhile, foreign holdings of short-term securities (less than 1 year) declined to 5.0% at end-2013 from 8.0% a year earlier.
The share of other domestic investors in central government bond holdings, except for mutual funds and pension funds, increased in 2013. Insurance companies’ holdings of government bonds rose to a share of 13.0% from 10.2% in the previous year. Bank Indonesia also registered a significant increase in its holdings of central government bonds to a share of 4.5% at end-December

Indonesia 57
from 0.4% a year earlier. Mutual fund and pension fund holdings of central government bonds both declined on a y-o-y basis.
Central Bank Bills. At end-December, banking institutions were the largest holders of central bank
Table 5: Notable LCY Corporate Bond Issuance in 4Q13
Corporate IssuersCoupon Rate
(%)Issued Amount
(IDR billion)
Bank Permata
370-day bond 10.00 696
3-year bond 10.50 672
7-year bond 12.00 860
Adira Dinamika Multi Finance
370-day bond 9.15 722
3-year bond 10.50 880
5-year bond 11.00 490
Astra Sedaya Finance
370-day bond 8.75 545
3-year bond 9.50 870
4-year bond 9.75 385
PLN
5-year bond 9.00 593
5-year Sukuk Ijarah 9.00 321
10-year bond 9.60 651
10-year Sukuk Ijarah 9.60 108
Bank CIMB Niaga
2-year bond 8.75 285
3-year bond 9.15 315
5-year bond 9.75 850
LCY = local currency.Note: Sukuk Ijarah refers to Islamic bonds backed by a lease agreement.Source: Indonesia Stock Exchange.
bills (SBI) with holdings equivalent to a share of 95.9% of the total (Figure 5). The nominal amount of SBI held by banks totaled IDR87.7 trillion at end-December, up sharply from IDR60.9 trillion in the previous quarter. Foreign non-bank investors held the remaining 4.1% of outstanding SBI. Foreign investor interest in SBI remained low despite Bank Indonesia’s decision in August to reduce the minimum holding period from 6 months to 1 month.
Rating Changes
On 15 November, Fitch Ratings (Fitch) affirmed Indonesia’s sovereign credit rating at BBB– with a stable outlook. In making its decision, Fitch took note of Indonesia’s policy measures in response to market pressures, its relatively high long-term growth prospects, its low public debt and prudent fiscal management, and its well-capitalized banking system.
Policy, Institutional, and Regulatory Developments
Bank Indonesia and Bank of Japan Sign Third BSA Establish Cross-Border Liquidity Arrangement
On 12 December, Bank of Japan, acting as the agent for the Ministry of Finance, and Bank Indonesia signed a third Bilateral Swap Arrangement (BSA). Under
Figure 2: LCY Central Government Bonds Investor Profile
LCY = local currency.Source: Indonesia Debt Management Office.
Banks36.5%
Mutual Funds5.3%
Pension Funds6.9%
Others7.8%
Bank Indonesia0.4%
Banks33.7%
Foreign Holders32.5%
Foreign Holders33.0%
InsuranceCompanies
13.0%
InsuranceCompanies
10.2%
Mutual Funds4.3%
Pension Funds4.0%
Others8.0%
Bank Indonesia4.5%
December 2013 December 2012

58 Asia Bond Monitor
Figure 5: LCY Central Bank Bills Investor Profile
LCY = local currency.Source: Bank Indonesia.
250
200
150
100
50
0
IDR trillion
Non-Bank Non-ResidentsOthersNon-Bank Residents
Banks
Mar-11
Jun-11
Sep-11
Sep-12
Dec-12
Mar-13
Dec-13
Sep-13
Jun-13
Dec-11
Mar-12
Jun-12
LCY = local currency.Source: Indonesia Debt Management Office.
350
300
250
200
150
100
50
0
IDR trillion
>10 years>5–10 years
>2–5 years>1–2 yearsless than 1 year
2008 2009 2010 2011 2012 2013
Figure 4: Foreign Holdings of LCY Central Government Bonds by Maturity
this new arrangement, the size of the facility was increased to US$22.76 billion from US$12.0 billion. The BSA introduced a new feature in the form of a crisis prevention scheme to support potential and actual liquidity requirements.
Also in December, a cross-border liquidity arrangement was established between Bank of Japan and Bank Indonesia to ensure stabi l i ty in the Indonesian financial market. With the arrangement, eligible banks with operations in Indonesia may obtain IDR liquidity from Bank Indonesia by providing Japanese government securities.
Figure 3: Foreign Investor Share of LCY Central Government Bonds
LCY = local currency.Source: Indonesia Debt Management Office.
35
34
33
32
31
30
29
28
%
Dec
-12
Jan-
13
Feb-
13
Mar
-13
Apr
-13
May
-13
Jun-
13
Jul-
13
Aug
-13
Sep
-13
Oct
-13
Nov
-13
Dec
-13
Jan-
14
Bank Indonesia Signs MRA with Domestic Banks
On 18 December, a mini Master Repo Agreement (MRA) was signed between Bank Indonesia and eight Indonesian banks. The mini MRA will serve as a standard contract for interbank repo transactions. The eight banks include Bank Mandiri, Bank Rakyat Indonesia, Bank Negara Indonesia, Bank Central Asia, Bank Panin, Bank Bukopin, Bank DKI, and Bank Jabar Banten. This move is expected to promote and deepen the repo market as most transactions were previously undertaken through bilateral agreements due to the absence of a standardized global MRA in Indonesia.
Bank Indonesia Issues New Regulations for Hedge Swap Transactions
As part of efforts to deepen Indonesia’s domestic foreign exchange market, Bank Indonesia announced new regulations to expand currency swap facilities for hedging transactions. The new regulations, which took effect on 3 February, aim to minimize exchange rate risks and increase investment activities in Indonesia. Under the new regulations, a hedging contract may be entered into by a bank within a period of up to 3 years through hedge swap transactions with Bank Indonesia at maturities of 3, 6, and 12 months. Other regulatory improvements were also announced, including the expansion of underlying transaction coverage, the extension of transaction tenors, and settlement by netting.

Republic of Korea 59
Republic of Korea
Yield Movements
The Republic of Korea’s local currency (LCY) government bond yield curve steepened between end-June 2013 and end-January 2014 as yields rose relatively more at the longer-end of the curve (Figure 1). The rise in longer-term yields was most pronounced in November, amid expectations of a tapering in the asset purchase program of the United States (US) Federal Reserve by the end of the year. Moreover, the further increase in yields for most tenors in January was induced by increased expectations of an inflation uptick and a better-than-expected economic recovery, both domestically and globally. Meanwhile, the yield spread between 2- and 10-year tenors widened 26 basis points (bps) between end-June 2013 and end-January 2014.
Real gross domestic product (GDP) of the Republic of Korea grew 0.9% quarter-on-quarter (q-o-q) and 3.9% year-on-year (y-o-y) in 4Q13, based on advance estimates released by The Bank of Korea in January. Compared with 3Q13, real GDP growth was lower on a q-o-q basis but higher on a y-o-y basis. For full-year 2013, real GDP growth stood at 2.8%, higher than 2012’s growth of 2.0%. On the demand side, the biggest annual improvement came from gross fixed capital formation, which rebounded with 3.8% growth in 2013 following a 1.7% contraction in 2012. On the production side, the agriculture, forestry, and fishery sector and the construction sector were the most improved sectors in 2013, posting annual growth rates of 5.6% and 3.7%, respectively, following negative growth in the previous year. Meanwhile, The Bank of Korea also released in January its latest economic outlook for the Republic of Korea, maintaining its GDP growth rate projections at 2.8% for 2013 and 3.8% for 2014.
Inflationary pressures remained relatively low in 4Q13, as the y-o-y inflation rate based on the consumer price index (CPI) hovered around 1.0% in each month of the quarter. For the full-year 2013, the headline CPI inflation rate stood at 1.1%, lower than the 2.2% rate recorded in 2012. For the month of January, consumer price inflation stood at 1.1% y-o-y and 0.5% month-on-month (m-o-m). The Bank of Korea in its economic outlook released in January forecasted headline
consumer price inflation to be at 1.3% in 2013 and 2.3% in 2014. Meanwhile, the policy interest rate was kept unchanged by the central bank throughout 4Q13. On 9 January, The Bank of Korea’s Monetary Policy Committee decided to maintain the policy interest rate at 2.50% in support of economic growth amid a low inflation environment.
Size and Composition
The Republic of Korea’s LCY bond market expanded in 4Q13, on both an annual and quarterly basis, as LCY corporate and government bonds outstanding both rose in nominal terms (Table 1). The increase in the outstanding amount of government bonds, which accounted for 38% of the overall bond market, was led by steady growth in central government bonds, particularly Korea Treasury Bonds (KTBs), which rose 2.6% q-o-q and 10.4% y-o-y, outweighing the anemic y-o-y growth and slight q-o-q decline in central bank bonds, which are also known as Monetary Stabilization Bonds (MSBs). The government issued more bonds in 4Q13 than in the previous quarter, with issuance r is ing 3.8% q-o-q and 8.0% y-o-y.
Corporate bonds outstanding expanded at a much faster pace than government securities in 4Q13. This was buoyed by growth in the outstanding bonds of
Figure 1: The Republic of Korea’s Benchmark Yield Curve—LCY Government Bonds
LCY = local currency.Source: Bloomberg LP.
3.9
3.6
3.3
3.0
2.7
2.40 2 4 6 8 10 12 14 16 18 20 22
Yield (%)
Time to maturity (years)
31-Dec-13 30-Jun-1331-Jan-14

60 Asia Bond Monitor
private sector corporates (3.4% q-o-q and 14.1% y-o-y) and of special public companies (2.7% q-o-q and 10.8% y-o-y). Meanwhile, outstanding financial debentures, excluding Korean Development Bank (KDB) bonds, also grew, albeit at a slower pace compared with the overall growth of corporate bonds. Meanwhile, LCY corporate bond issuance increased 27.4% q-o-q and 5.7% y-o-y in 4Q13, induced by solid growth in gross bond sales of financial companies and private sector corporates.
By the end of 2013, the value of outstanding bonds sold by the top 30 LCY corporate issuers as a share of total corporate bonds stood at 64%, which was 2 percentage points higher than what was recorded in the previous quarter (Table 2). Korea Housing Finance remained the largest issuer of LCY corporate bonds, followed by Korea Land and Housing.
Of the five relatively large LCY corporate bond issues during 4Q13, two were made by banks (Industrial Bank of Korea and Woori Bank), one by a utility company (Korea Gas), one by a steel company (POSCO), and one by a transport infrastructure company (Korea Rail Network Authority) (Table 3).
Liquidity
The LCY government bond market in the Republic of Korea appeared to be less liquid in 4Q13, as the turnover ratio for government bonds was lower compared with 3Q13 and 4Q12. Moreover, the latter half of 2013 saw relatively low turnover ratios for central government
Table 1: Size and Composition of the LCY Bond Market in the Republic of Korea
Outstanding Amount (billion) Growth Rate (%)
4Q12 3Q13 4Q13 4Q12 4Q13
KRW US$ KRW US$ KRW US$ q-o-q y-o-y q-o-q y-o-y
Total 1,565,704 1,471 1,680,687 1,564 1,722,720 1,641 2.8 10.5 2.5 10.0
Government 609,035 572 645,333 601 657,309 626 0.9 3.7 1.9 7.9
Central Bank Bonds 163,070 153 164,880 153 163,670 156 0.4 (1.0) (0.7) 0.4
Central Government Bonds 416,113 391 444,599 414 455,858 434 0.5 6.0 2.5 9.6
Industrial Finance Debentures 29,852 28 35,854 33 37,781 36 9.4 (0.1) 5.4 26.6
Corporate 956,669 899 1,035,354 963 1,065,411 1,015 4.1 15.4 2.9 11.4
( ) = negative, LCY = local currency, q-o-q = quarter-on-quarter, y-o-y = year-on-year.Notes: 1. Calculated using data from national sources.2. Bloomberg LP end-of-period LCY–US$ rates are used.3. Growth rates are calculated from LCY base and do not include currency effects.Sources: EDAILY BondWeb and The Bank of Korea.
and central bank bonds, as trading of KTBs and MSBs was down during this quarter (Figure 2).
Similarly, liquidity in the KTB futures market tightened in 4Q13, as the total number of 3- and 10-year KTB futures contracts traded fell to 7.5 million from 8.8 million in the previous quarter (Figure 3). Between 3Q13 and 4Q13, the volume of 3-year KTB futures contracts traded as a share of the total fell from 75% to 69%, while the share of the volume of 10-year KTB futures contracts traded climbed from 25% to 31%.
In the LCY corporate bond market, liquidity trends during the second half of 2013 appear to have been mixed; on one hand, the turnover ratios for the outstanding bonds of financial institutions and private sector corporates remained roughly unchanged between 3Q13 and 4Q13, while on the other hand, the turnover ratio for the debt securities of special public companies soared during the last quarter of the year (Figure 4).
Investor Profile
Insurance companies and pension funds—the largest investor group holder of LCY government bonds in the Republic of Korea—and financial institutions (other than banks, local insurers, and pension funds) each registered a 2 percentage point increase in their respective shares of government bond holdings between end-September 2012 and end-September 2013, showcasing their increasing demand for

Republic of Korea 61
Table 2: Top 30 Issuers of LCY Corporate Bonds in the Republic of Korea
Issuers
Outstanding AmountState-
Owned
Listed onType of IndustryLCY Bonds
(KRW billion)LCY Bonds (US$ billion) KOSPI KOSDAQ
1. Korea Housing Finance 61,956 59.0 Yes No No Financial
2. Korea Land & Housing 58,663 55.9 Yes No No Real Estate
3. Korea Finance 46,520 44.3 Yes No No Financial
4. Korea Deposit Insurance 45,850 43.7 Yes No No Insurance
5. KDB Daewoo Securities 34,889 33.2 Yes Yes No Securities
6. Industrial Bank of Korea 33,175 31.6 Yes Yes No Bank
7. Korea Investment and Securities 31,945 30.4 No No No Securities
8. Korea Electric Power 30,750 29.3 Yes Yes No Utillity
9. Woori Investment and Securities 30,437 29.0 Yes Yes No Securities
10. Mirae Asset Securities 25,783 24.6 No Yes No Securities
11. Hana Daetoo Securities 24,836 23.7 No No No Securities
12. Shinhan Investment 24,276 23.1 No No No Securities
13. Korea Expressway 20,760 19.8 Yes No No Infrastructure
14. Kookmin Bank 19,325 18.4 No No No Bank
15. Korea Rail Network Authority 17,250 16.4 Yes No No Infrastructure
16. Shinhan Bank 16,064 15.3 No No No Bank
17. Small & Medium Business Corp. 15,365 14.6 Yes No No Financial
18. Tong Yang Securities 14,925 14.2 No Yes No Securities
19. Korea Gas 14,855 14.2 Yes Yes No Utility
20. Woori Bank 14,492 13.8 Yes No No Bank
21. Hyundai Securities 12,963 12.3 No Yes No Securities
22. Hana Bank 12,285 11.7 No No No Bank
23. Standard Chartered First Bank Korea 10,860 10.3 No No No Bank
24. Samsung Securities 10,639 10.1 No Yes No Securities
25. Korea Water Resources 9,951 9.5 Yes Yes No Utility
26. Hyundai Capital Services 9,235 8.8 No No No Financial
27. Korea Railroad 9,200 8.8 Yes No No Infrastructure
28. Shinhan Card 8,861 8.4 No No No Financial
29. Korea Student Aid Foundation 8,820 8.4 Yes No No Financial
30. NongHyup Bank 8,600 8.2 Yes No No Bank
Total Top 30 LCY Corporate Issuers 683,532 651.1
Total LCY Corporate Bonds 1,065,411 1,014.9
Top 30 as % of Total LCY Corporate Bonds 64.2% 64.2%
KOSDAQ = Korean Securities Dealers Automated Quotations, KOSPI = Korea Composite Stock Price Index, LCY = local currency.Notes:1. Data as of end-December 2013.2. State-owned firms are defined as those in which the government has more than a 50% ownership stake.Sources: AsianBondsOnline calculations based on Bloomberg and EDAILY BondWeb data.

62 Asia Bond Monitor
Table 3: Notable LCY Corporate Bond Issuance in 4Q13
Corporate IssuersCoupon Rate
(%)Issued Amount
(KRW billion)
Industrial Bank of Korea
10-year bond 3.97 500.0
Korea Gas
3-year bond 3.14 300.0
Korea Rail Network Authority
5-year bond 3.54 370.0
POSCO
5-year bond 3.35 330.0
Woori Bank
10-year bond 3.89 500.0
LCY = local currency.Source: Bloomberg LP.
government debt securities (Figure 5). In contrast, the shares of government bond holding of households and nonprofit organizations, non-financial corporations, and the general government—comprising the central government, local governments, and social security funds—all posted annual declines, while government bond holding shares remaining the same for banks and foreign investors.
Insurance companies and pension funds remained the largest investor group in the Republic of Korea’s LCY corporate bond market at end-September, holding 35% of all corporate bonds, with their share of corporate bond holdings climbing 2 percentage points from September 2012 (Figure 6). Similarly, the share of corporate bond holdings of households and nonprofit organizations rose 2 percentage points on an annual basis at end-September. On the other hand, the share
of corporate bonds held by non-financial corporations remained steady, while the shares of corporate bonds held by banks, other financial institutions, and foreign investors all fell between end-September 2012 and end-September 2013.
Net foreign investment in the Republic of Korea’s LCY bond market turned positive in January after being negative for five consecutive months, according to Financial Supervisory Service (FSS) data (Figure 7). Relatively large bond purchases by foreign investors, compared with bond redemptions, contributed to the net foreign bond inflow position for the month. Meanwhile, foreign investor net investment in the Republic of Korea’s bond market in full-year 2013 totaled KRW3.5 trillion, substantially lower than the net bond inflow of KRW7.4 trillion in 2012; the lower 2013 figure stems from the massive net bond
Figure 2: Turnover Ratios for Central Government and Central Bank Bonds
Note: Central government bonds include Korea Treasury Bonds and National Housing Bonds.Sources: The Bank of Korea and EDAILY BondWeb.
1.4
1.3
1.2
1.1
1.0
0.9
0.81Q12 2Q12 4Q12 1Q13 2Q13 3Q13 4Q133Q12
Central Bank BondsCentral Government Bonds
Figure 3: Trading Volume of KTB Futures Contracts
KTB = Korea Treasury Bond.Source: Korea Exchange.
14
12
10
8
6
4
2
01Q12 2Q12 4Q12 1Q13 3Q13 4Q132Q133Q12
10-Year KTB Futures3-Year KTB Futures
millions of contracts
Figure 4: Turnover Ratios for Special Public Bonds, Financial Debentures, and Private Corporate Bonds
Source: EDAILY BondWeb.
0.4
0.3
0.2
0.1
0.01Q12 2Q12 4Q12 1Q13 3Q13 4Q132Q133Q12
Financial DebenturesSpecial Public Bonds Private Corporate Bonds

Republic of Korea 63
sales during 2H13 amid concerns over potential tapering by the US Federal Reserve of its asset purchase program.
Policy, Institutional, and Regulatory Developments
MOSF Introduces Policy Directions for KTB Market
The Ministry of Strategy and Finance (MOSF) announced in December policy measures for the management and development of the KTB market. MOSF specifically
LCY = local currency.Sources: AsianBondsOnline and The Bank of Korea.
Figure 5: LCY Government Bonds Investor Profile
September 2013
Banks18%
Other FinancialInstitutions
21%
GeneralGovernment
20%
Non-FinancialCorporations
<1%
Rest of the World10%
InsuranceCompanies
and Pension Funds27%
InsuranceCompanies
and Pension Funds25%
Householdsand NonprofitOrganizations
4%
September 2012
Banks18%
Other FinancialInstitutions
19%
GeneralGovernment
23%
Non-FinancialCorporations
<1%
Rest of the World10%
Householdsand NonprofitOrganizations
5%
noted the need for smooth fiscal fund-raising through the stable issuance of KTBs. To achieve this, MOSF cited maintaining the monthly KTB issuance volume at KRW8 trillion, optimizing the proportion of KTB issuance by tenor, and making slight adjustments to KTB issuance plans based on market conditions. In addition, MOSF also aims to promote KTBs as a benchmark in capital markets and cited the need for consolidation of data and information on KTBs managed by different institutions, amendments on KTB futures by tenor (e.g., introducing the issuance of longer-term KTB futures), and extensive revision of the relevant act on government bonds.
LCY = local currency.Sources: AsianBondsOnline and The Bank of Korea.
Figure 6: LCY Corporate Bonds Investor Profile
September 2013
Banks14%
Other FinancialInstitutions
29%
GeneralGovernment
12%
Non-FinancialCorporations
2%
Non-FinancialCorporations
2%
Rest of the World<1%
InsuranceCompanies
and Pension Funds35%
Households and Nonprofit Organizations
7%
Households and Nonprofit Organizations
5%
September 2012
Banks17%
Other FinancialInstitutions
30%
GeneralGovernment
12%
Rest of the World1%
InsuranceCompanies
and Pension Funds33%
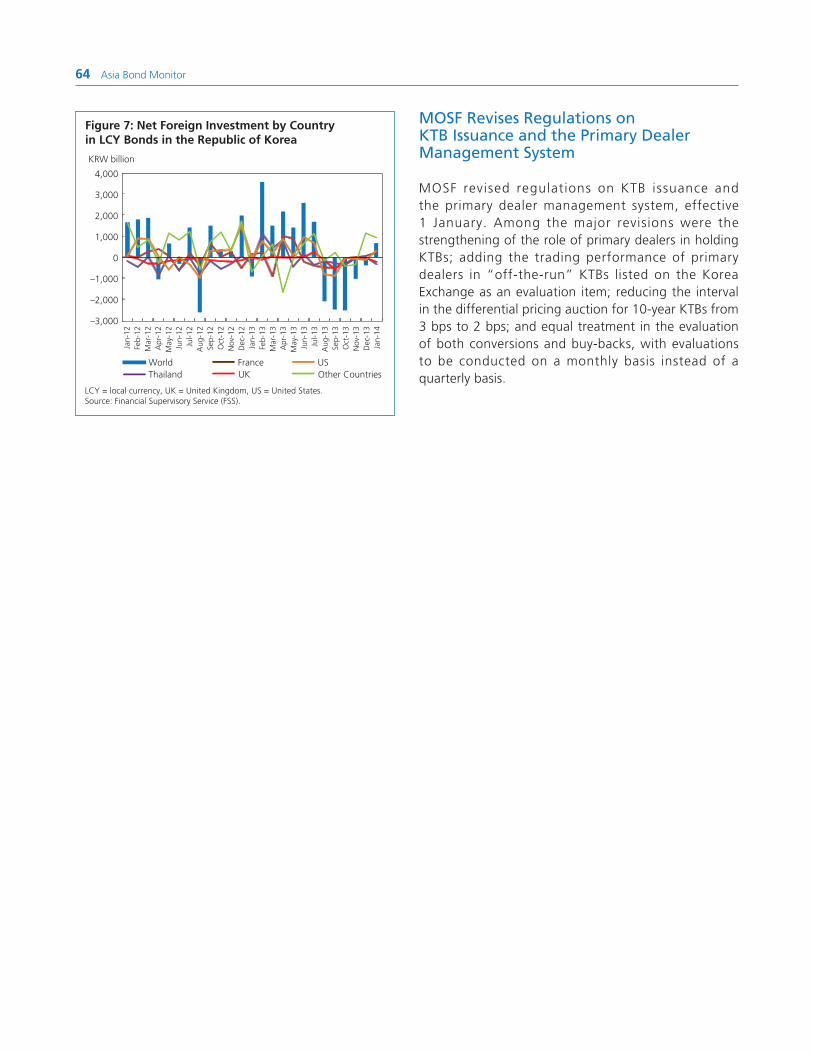
64 Asia Bond Monitor
MOSF Revises Regulations on KTB Issuance and the Primary Dealer Management System
MOSF revised regulations on KTB issuance and the primary dealer management system, effective 1 January. Among the major revisions were the strengthening of the role of primary dealers in holding KTBs; adding the trading performance of primary dealers in “off-the-run” KTBs listed on the Korea Exchange as an evaluation item; reducing the interval in the differential pricing auction for 10-year KTBs from 3 bps to 2 bps; and equal treatment in the evaluation of both conversions and buy-backs, with evaluations to be conducted on a monthly basis instead of a quarterly basis.
LCY = local currency, UK = United Kingdom, US = United States.Source: Financial Supervisory Service (FSS).
Figure 7: Net Foreign Investment by Country in LCY Bonds in the Republic of Korea
4,000
3,000
2,000
1,000
0
–1,000
–2,000
–3,000
KRW billion
WorldThailand
FranceUK
USOther Countries
Jan-
12Fe
b-12
Mar
-12
Apr
-12
May
-12
Jun-
12Ju
l-12
Aug
-12
Sep-
12O
ct-1
2
Mar
-13
Apr
-13
May
-13
Jun-
13Ju
l-13
Aug
-13
Sep-
13O
ct-1
3
Jan-
14D
ec-1
3N
ov-1
3
Nov
-12
Dec
-12
Jan-
13Fe
b-13

Malaysia 65
Malaysia
Figure 1: Malaysia’s Benchmark Yield Curve— LCY Government Bonds
LCY = local currency.Source: Bloomberg LP.
Yield (%)
4.9
4.5
4.1
3.7
3.3
2.90 2 4 6 8 10 12 14 16 18 20 22
Time to maturity (years)
31-Dec-13 30-Jun-1331-Jan-14
Yield Movements
Malaysia’s local currency (LCY) government bond yield curve shifted upward between end-June and end-December 2013, with the yields of 3-year maturities and longer rising—as much as 67 basis points (bps) to 4.64% in the case of the 20-year maturity (Figure 1). The higher yields for Malaysian Government Securities (MGS) benchmark paper tracked the sluggish performance of United States (US) Treasuries as market players were increasingly concerned that the US Federal Reserve would begin tapering its monthly bond purchases. Between end-December and end-January, yields were mixed, as tenors of 3 years and less declined, while yields from the 4-year maturity through the end of the curve showed an upward bias, with increases of between 2 bps and 12 bps. Meanwhile, the yield spread between 2- and 10-year maturities widened to 110 bps at end-January from a spread of 92 bps at end-December.
The Malaysian economy improved in recent months, aided by recovery in exports and resilient domestic demand. Real gross domestic product (GDP) growth inched up to 5.1% year-on-year (y-o-y) in 4Q13 from 5.0% in 3Q13. The fourth quarter y-o-y growth rate was the highest in 2013. On the demand side, all five types of expenditure registered positive y-o-y growth in 4Q13: private final consumption expenditure (7.3%), government final consumption expenditure (5.1%), gross fixed capital formation (5.8%), exports of goods and services (2.9%), and imports of goods and services (4.4%). On the production side, except for the mining and quarrying sector, which recorded a 1.5% y-o-y drop in output, all sectors posted positive y-o-y growth: agriculture (0.2%), construction (9.7%), manufacturing (5.1%), and services (6.4%). Also, import duties climbed 3.6% y-o-y. Annual real GDP growth, however, slipped to 4.7% in 2013 from 5.6% in 2012.
Foreign reserves rose by MYR14.5 billion in 2013 to MYR441.7 billion (US$134.9 billion), stemming from a continued surplus in the current account and inflows of foreign direct investment, non-resident portfolio funds, and banking funds. The current account surplus in 4Q13 amounted to MYR16.2 billion, larger than the 3Q13 surplus of MYR9.8 billion due to the merchandise trade surplus, which widened to MYR33.6 billion in 4Q13 from MYR25.8 billion in the previous quarter. In addition, between 3Q13 and 4Q13, the services account’s deficit
position narrowed from MYR4.3 billion to MYR3.7 billion, the deficit in the primary income account climbed from MYR8.1 billion to MYR9.9 billion, and the deficit in the secondary income account inched up from MYR3.5 billion to MYR3.7 billion. The current account surplus for the full-year 2013 stood at MYR37.3 billion, down from 2012’s surplus of MYR57.3 billion.
Consumer price inflation quickened to 3.2% y-o-y in December from 2.9% in the previous month and 1.2% a year earlier due to higher prices for food and transportation. The y-o-y increase in consumer prices exceeded the benchmark overnight policy rate for the first time since November 2011 and was the highest in 2 years. Annual inflation climbed to 2.1% in 2013. On a month-on-month (m-o-m) basis, the consumer price index increased 0.3%.
At its Monetary Policy Committee meeting on 29 January, Bank Negara Malaysia (BNM) decided to maintain its overnight policy rate at 3.0%, which is the same level it has been set at since May 2011. BNM expects inflation to increase largely due to domestic cost factors. The increase in inflation, however, is expected to be tempered by a stable external price environment and moderate domestic demand pressures.
Size and Composition
Tota l LCY bonds outs tand ing in Malays ia grew 2.9% quarter-on-quarter (q-o-q) and 2.2% y-o-y to

66 Asia Bond Monitor
reach MYR1,022 billion at the end of 4Q13. Growth in the corporate bond market outpaced growth in the government bond sector, climbing 3.7% q-o-q and 5.9% y-o-y (Table 1).
Government Bonds. LCY government bonds outstanding stood at MYR597.5 billion at end-December, up 2.4% q-o-q but down 0.2% y-o-y. Central government bonds—comprising MGSs, Government Investment Issues (GIIs) and treasury bills—climbed to a record-high level of MYR481.9 billion. The size of outstanding BNM monetary notes, on the other hand, has shrunk every quarter since December 2012. The shares of conventional government bonds and government sukuk (Islamic bonds) remained at 63% and 37%, respectively, of total government bonds outstanding.
Government bond i ssuance rose 7.3% q-o-q to MYR90.9 billion in 4Q13, reversing a downward trend in place since December 2012, owing to issuance of central bank bills. Of the total issuance, the shares of conventional bonds and sukuk were almost equal at 49.6% and 50.4%, respectively.
In 2014, the government’s borrowing requirements will be met primarily by re-opening bonds rather than issuing new debt. Malaysia’s bond auction calendar shows a total of 32 offerings planned in 2014 versus 29 a year earlier. Compared with 2013, the auction plan for 2014 lacks new issuances, with only seven planned auctions versus
Table 1: Size and Composition of the LCY Bond Market in Malaysia
Outstanding Amount (billion) Growth Rate (%)
4Q12 3Q13 4Q13 4Q12 4Q13
MYR US$ MYR US$ MYR US$ q-o-q y-o-y q-o-q y-o-y
Total 1,000 327 993 305 1,022 312 2.8 19.9 2.9 2.2
Government 599 196 584 179 597 182 2.2 20.0 2.4 (0.2)
Central Government Bonds 440 144 468 143 482 147 3.7 12.2 3.1 9.5
of which: sukuk 146 48 166 51 175 53 5.8 29.9 5.4 19.9
Central Bank Bills 154 50 107 33 107 33 (3.0) 44.6 (0.5) (30.8)
of which: sukuk 62 20 41 13 40 12 (1.6) 93.4 (2.5) (35.3)
Sukuk Perumahan Kerajaan 5 1 9 3 9 3 73.1 – 0.0 97.8
Corporate 401 131 410 126 425 130 3.9 19.8 3.7 5.9
of which: sukuk 264 86 274 84 286 87 5.0 28.1 4.2 8.2
( ) = negative, – = not applicable, q-o-q = quarter-on-quarter, y-o-y = year-on-year.Notes:1. Calculated using data from national sources. 2. Bloomberg LP end-of-period LCY–US$ rate is used.3. Growth rates are calculated from LCY base and do not include currency effects. Sources: Bank Negara Malaysia Fully Automated System for Issuing/Tendering (FAST) and Bloomberg LP.
16 in 2013. The seven new issues will be spread over 1H14, which includes four auctions for MGSs, two for Sukuk Perumahan Kerajaan (SPK), and one for GIIs. The borrowing program was also skewed toward the belly of the curve (5- to 10-year maturities).
Corporate Bonds. Malaysia’s LCY corporate bonds outstanding reached a record-high MYR424.7 billion at end-December, rising 3.7% q-o-q and 5.9% y-o-y. The increase is solely attributable to a spike in medium-term notes (MTNs), which amounted to MYR16.2 billion. The split between corporate sukuk and conventional corporate bonds remained constant, with corporate sukuk accounting for 67% of total corporate bonds and conventional corporate bonds comprising 33%.
Corporate bond issuance totaled MYR46.6 billion in 4Q13—the largest amount since June 2012 and double the level of issuance in 3Q13. A total of 100 corporate bond offerings, mostly sukuk, were issued by 66 corporate borrowers. Conventional bonds accounted for 32% of new corporate bond issues, down from 55% in the previous quarter; sukuk represented 68% of the total, up from 45%. Table 2 lists some notable corporate bonds issued during 4Q13.
The largest corporate LCY issuer in 4Q13 was state-owned Cagamas, with total issuance of MYR7.0 billion, up from MYR1.2 billion in 3Q13. The breakdown of issuance by instrument is as follows: Islamic commercial paper
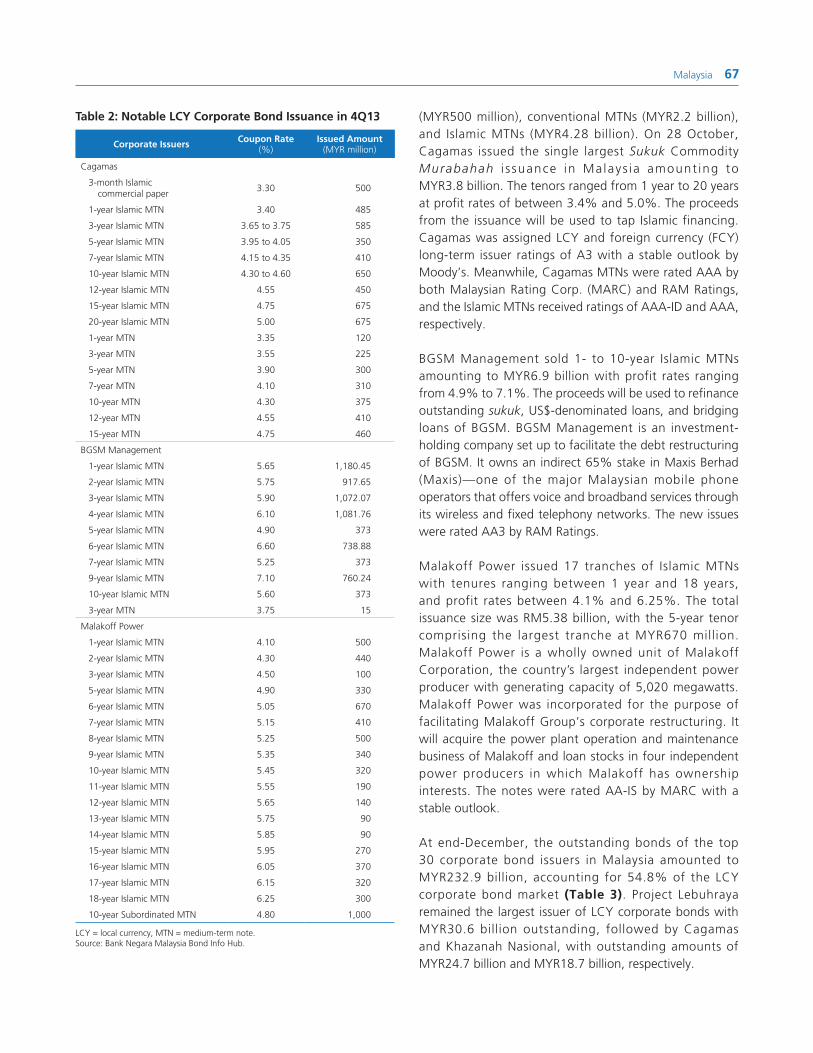
Malaysia 67
Table 2: Notable LCY Corporate Bond Issuance in 4Q13
Corporate Issuers Coupon Rate (%)
Issued Amount (MYR million)
Cagamas
3-month Islamic commercial paper
3.30 500
1-year Islamic MTN 3.40 485
3-year Islamic MTN 3.65 to 3.75 585
5-year Islamic MTN 3.95 to 4.05 350
7-year Islamic MTN 4.15 to 4.35 410
10-year Islamic MTN 4.30 to 4.60 650
12-year Islamic MTN 4.55 450
15-year Islamic MTN 4.75 675
20-year Islamic MTN 5.00 675
1-year MTN 3.35 120
3-year MTN 3.55 225
5-year MTN 3.90 300
7-year MTN 4.10 310
10-year MTN 4.30 375
12-year MTN 4.55 410
15-year MTN 4.75 460
BGSM Management
1-year Islamic MTN 5.65 1,180.45
2-year Islamic MTN 5.75 917.65
3-year Islamic MTN 5.90 1,072.07
4-year Islamic MTN 6.10 1,081.76
5-year Islamic MTN 4.90 373
6-year Islamic MTN 6.60 738.88
7-year Islamic MTN 5.25 373
9-year Islamic MTN 7.10 760.24
10-year Islamic MTN 5.60 373
3-year MTN 3.75 15
Malakoff Power
1-year Islamic MTN 4.10 500
2-year Islamic MTN 4.30 440
3-year Islamic MTN 4.50 100
5-year Islamic MTN 4.90 330
6-year Islamic MTN 5.05 670
7-year Islamic MTN 5.15 410
8-year Islamic MTN 5.25 500
9-year Islamic MTN 5.35 340
10-year Islamic MTN 5.45 320
11-year Islamic MTN 5.55 190
12-year Islamic MTN 5.65 140
13-year Islamic MTN 5.75 90
14-year Islamic MTN 5.85 90
15-year Islamic MTN 5.95 270
16-year Islamic MTN 6.05 370
17-year Islamic MTN 6.15 320
18-year Islamic MTN 6.25 300
10-year Subordinated MTN 4.80 1,000
LCY = local currency, MTN = medium-term note.Source: Bank Negara Malaysia Bond Info Hub.
(MYR500 million), conventional MTNs (MYR2.2 billion), and Islamic MTNs (MYR4.28 billion). On 28 October, Cagamas issued the single largest Sukuk Commodity Murabahah i s suance in Malays ia amount ing to MYR3.8 billion. The tenors ranged from 1 year to 20 years at profit rates of between 3.4% and 5.0%. The proceeds from the issuance will be used to tap Islamic financing. Cagamas was assigned LCY and foreign currency (FCY) long-term issuer ratings of A3 with a stable outlook by Moody’s. Meanwhile, Cagamas MTNs were rated AAA by both Malaysian Rating Corp. (MARC) and RAM Ratings, and the Islamic MTNs received ratings of AAA-ID and AAA, respectively.
BGSM Management sold 1- to 10-year Islamic MTNs amounting to MYR6.9 billion with profit rates ranging from 4.9% to 7.1%. The proceeds will be used to refinance outstanding sukuk, US$-denominated loans, and bridging loans of BGSM. BGSM Management is an investment-holding company set up to facilitate the debt restructuring of BGSM. It owns an indirect 65% stake in Maxis Berhad (Maxis)—one of the major Malaysian mobile phone operators that offers voice and broadband services through its wireless and fixed telephony networks. The new issues were rated AA3 by RAM Ratings.
Malakoff Power issued 17 tranches of Islamic MTNs with tenures ranging between 1 year and 18 years, and profit rates between 4.1% and 6.25%. The total issuance size was RM5.38 billion, with the 5-year tenor comprising the largest tranche at MYR670 million. Malakoff Power is a wholly owned unit of Malakoff Corporation, the country’s largest independent power producer with generating capacity of 5,020 megawatts. Malakoff Power was incorporated for the purpose of facilitating Malakoff Group’s corporate restructuring. It will acquire the power plant operation and maintenance business of Malakoff and loan stocks in four independent power producers in which Malakoff has ownership interests. The notes were rated AA-IS by MARC with a stable outlook.
At end-December, the outstanding bonds of the top 30 corporate bond issuers in Malaysia amounted to MYR232.9 billion, accounting for 54.8% of the LCY corporate bond market (Table 3). Project Lebuhraya remained the largest issuer of LCY corporate bonds with MYR30.6 billion outstanding, followed by Cagamas and Khazanah Nasional, with outstanding amounts of MYR24.7 billion and MYR18.7 billion, respectively.
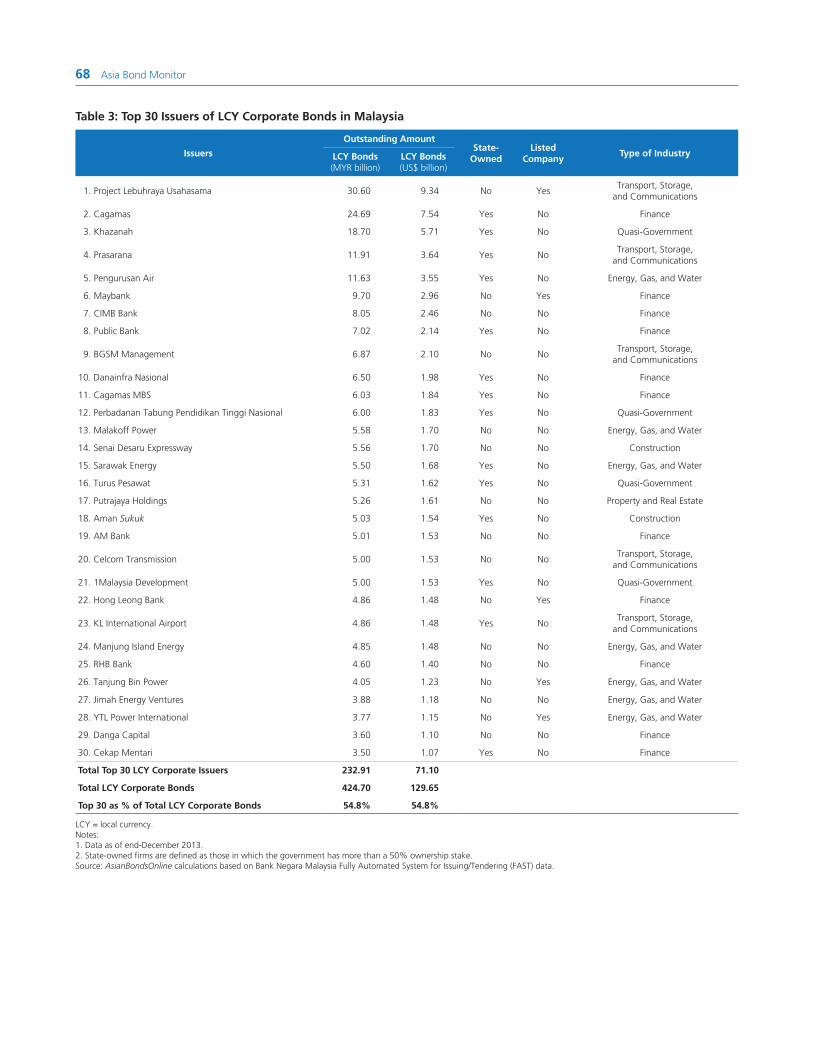
68 Asia Bond Monitor
Table 3: Top 30 Issuers of LCY Corporate Bonds in Malaysia
Issuers
Outstanding AmountState-
OwnedListed
CompanyType of IndustryLCY Bonds
(MYR billion)LCY Bonds(US$ billion)
1. Project Lebuhraya Usahasama 30.60 9.34 No YesTransport, Storage,
and Communications
2. Cagamas 24.69 7.54 Yes No Finance
3. Khazanah 18.70 5.71 Yes No Quasi-Government
4. Prasarana 11.91 3.64 Yes NoTransport, Storage,
and Communications
5. Pengurusan Air 11.63 3.55 Yes No Energy, Gas, and Water
6. Maybank 9.70 2.96 No Yes Finance
7. CIMB Bank 8.05 2.46 No No Finance
8. Public Bank 7.02 2.14 Yes No Finance
9. BGSM Management 6.87 2.10 No NoTransport, Storage,
and Communications
10. Danainfra Nasional 6.50 1.98 Yes No Finance
11. Cagamas MBS 6.03 1.84 Yes No Finance
12. Perbadanan Tabung Pendidikan Tinggi Nasional 6.00 1.83 Yes No Quasi-Government
13. Malakoff Power 5.58 1.70 No No Energy, Gas, and Water
14. Senai Desaru Expressway 5.56 1.70 No No Construction
15. Sarawak Energy 5.50 1.68 Yes No Energy, Gas, and Water
16. Turus Pesawat 5.31 1.62 Yes No Quasi-Government
17. Putrajaya Holdings 5.26 1.61 No No Property and Real Estate
18. Aman Sukuk 5.03 1.54 Yes No Construction
19. AM Bank 5.01 1.53 No No Finance
20. Celcom Transmission 5.00 1.53 No NoTransport, Storage,
and Communications
21. 1Malaysia Development 5.00 1.53 Yes No Quasi-Government
22. Hong Leong Bank 4.86 1.48 No Yes Finance
23. KL International Airport 4.86 1.48 Yes NoTransport, Storage,
and Communications
24. Manjung Island Energy 4.85 1.48 No No Energy, Gas, and Water
25. RHB Bank 4.60 1.40 No No Finance
26. Tanjung Bin Power 4.05 1.23 No Yes Energy, Gas, and Water
27. Jimah Energy Ventures 3.88 1.18 No No Energy, Gas, and Water
28. YTL Power International 3.77 1.15 No Yes Energy, Gas, and Water
29. Danga Capital 3.60 1.10 No No Finance
30. Cekap Mentari 3.50 1.07 Yes No Finance
Total Top 30 LCY Corporate Issuers 232.91 71.10
Total LCY Corporate Bonds 424.70 129.65
Top 30 as % of Total LCY Corporate Bonds 54.8% 54.8%
LCY = local currency.Notes:1. Data as of end-December 2013.2. State-owned firms are defined as those in which the government has more than a 50% ownership stake.Source: AsianBondsOnline calculations based on Bank Negara Malaysia Fully Automated System for Issuing/Tendering (FAST) data.

Malaysia 69
Investor Profile
Social security institutions remain the dominant holders of MGSs and GIIs. Their holdings climbed to 32.2% of total government bonds outstanding at end-September (Figure 2) from 31.8% on the back of increased investments in GIIs by the Employees Provident Fund.
Figure 2: LCY Government Bonds Investor Profile
LCY = local currency.Source: Bank Negara Malaysia.
Public Sector2.5%
Bank NegaraMalaysia
0.6%
Bank NegaraMalaysia
0.5%
FinancialInstitutions
31.9%
FinancialInstitutions
29.7%
InsuranceCompanies
5.8%
InsuranceCompanies
6.5%Social
SecurityInstitutions
32.2%
SocialSecurity
Institutions31.8%
ForeignHolders28.2%
ForeignHolders28.9%
Public Sector1.4%
September 2013 September 2012
Holdings of financial institutions rose to 31.9% from 29.7% last year, driven by increased bank holdings of GIIs, while the share of foreign investors remained largely unchanged at 28.2% versus 28.9% a year earlier. In contrast, holdings of insurance companies dropped to 5.8% from 6.5%, as these institutions reduced their holdings of MGSs.
Figure 3: LCY Corporate Bonds Investor Profile
LCY = local currency.Note: Employees Provident Fund as of end-2012.Source: Bank Negara Malaysia.
GeneralInsurance
2.0%
EmployeesProvident Fund
9.3%
Foreign Commercialand Islamic Banks
6.7%
InvestmentBanks5.2%
LifeInsurance28.7%
DomesticCommercialand Islamic
Banks43.1%
September 2013 September 2012
GeneralInsurance
2.1%
EmployeesProvident Fund
9.9%
Foreign Commercialand Islamic Banks
9.7%
InvestmentBanks6.6%
LifeInsurance28.5%
DomesticCommercialand Islamic
Banks48.4%

70 Asia Bond Monitor
Domestic and foreign banks (commercial and Islamic) were the largest investor group in LCY corporate bonds at end-September with shares of 43.1% and 6.7%, respectively (Figure 3). Compared with September 2012, the shares in corporate bonds dropped 5 percentage points for domestic banks and 3 percentage points for foreign banks. Investment banks also trimmed their position to 5.2% of total corporate bonds from 6.6% a year earlier, while insurance companies maintained their share of nearly 29% at end-September. In absolute terms, holdings of life insurance companies in corporate bonds rose MYR7.5 billion to MYR118.0 billion, which is more than double their MYR57 billion in holdings 6 years ago.
Rating Changes
Moody’s Revises Outlook to Positive from Stable, Affirms A3 rating
On 20 November, Moody’s revised Malaysia’s outlook to positive from stable and affirmed its government bond and issuer ratings at A3. The change in the outlook was based on (i) improved prospects for fiscal consolidation and reform and (ii) continued macroeconomic stability in the face of external headwinds. Moody’s noted that Malaysia’s sovereign rating is supported by the government’s favorable debt structure, depth of onshore capital markets, and high level of domestic savings. The rating agency further noted that Malaysia’s economic resilience has been accompanied by price stability, which is anchored by the credibility of its central bank, BNM.
Policy, Institutional, and Regulatory Developments
Hong Kong, China and Malaysia Hold Joint Forum on Islamic Finance
On 3 December, the Hong Kong Monetary Authority (HKMA) and BNM facilitated a forum on Islamic finance, with participants from eight commercial banks and three fund management companies. The Financial Services and the Treasury Bureau of Hong Kong, China; the Securities and Futures Commission of Malaysia; and the Hong Kong Exchanges and Clearing Limited also joined the meeting.
The forum reviewed the current developments of Islamic finance globally and in both jurisdictions, and discussed measures to further the development of Hong Kong, China’s Islamic financial market, particularly the sukuk market and the Islamic fund management industry.
The participants agreed to (i) identify potential sukuk issuers, particularly corporates, and encourage cross-border sukuk issuances between Hong Kong, China and Malaysia; and (ii) actively consider launching Islamic funds and making use of the established mutual recognition framework for Islamic funds between Hong Kong, China and Malaysia to facilitate cross-border Islamic financial activities.
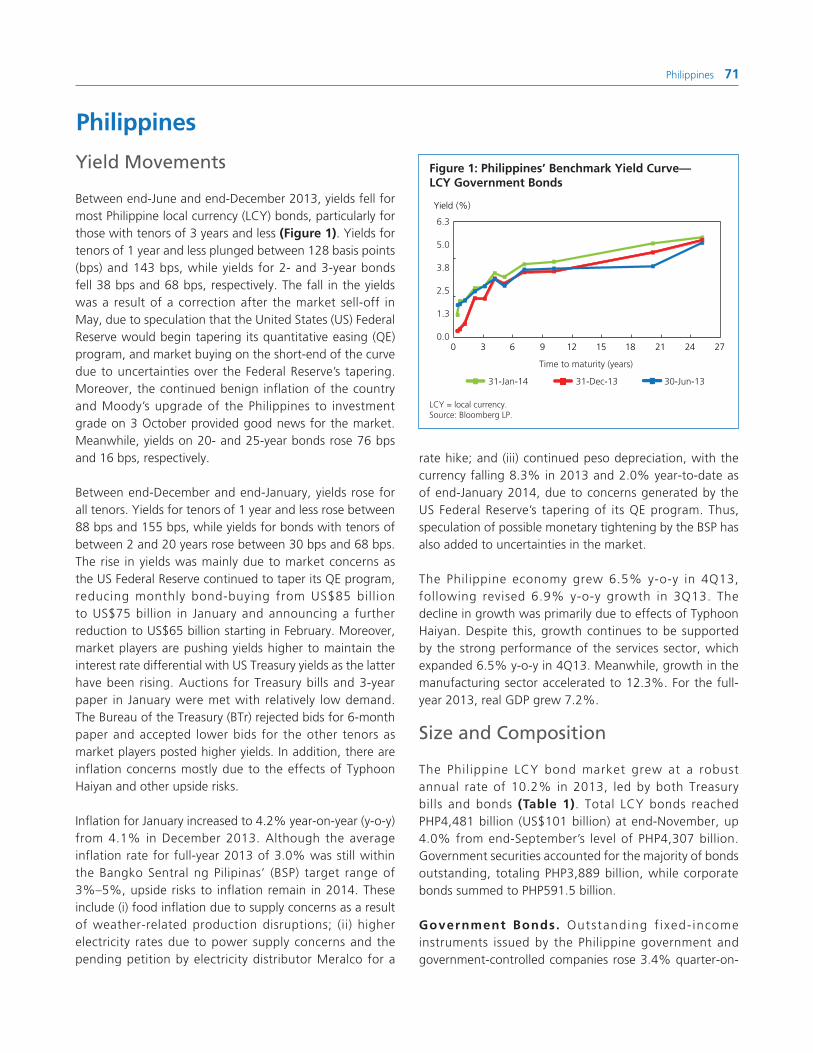
Philippines 71
Philippines
Yield Movements
Between end-June and end-December 2013, yields fell for most Philippine local currency (LCY) bonds, particularly for those with tenors of 3 years and less (Figure 1). Yields for tenors of 1 year and less plunged between 128 basis points (bps) and 143 bps, while yields for 2- and 3-year bonds fell 38 bps and 68 bps, respectively. The fall in the yields was a result of a correction after the market sell-off in May, due to speculation that the United States (US) Federal Reserve would begin tapering its quantitative easing (QE) program, and market buying on the short-end of the curve due to uncertainties over the Federal Reserve’s tapering. Moreover, the continued benign inflation of the country and Moody’s upgrade of the Philippines to investment grade on 3 October provided good news for the market. Meanwhile, yields on 20- and 25-year bonds rose 76 bps and 16 bps, respectively.
Between end-December and end-January, yields rose for all tenors. Yields for tenors of 1 year and less rose between 88 bps and 155 bps, while yields for bonds with tenors of between 2 and 20 years rose between 30 bps and 68 bps. The rise in yields was mainly due to market concerns as the US Federal Reserve continued to taper its QE program, reducing monthly bond-buying from US$85 bill ion to US$75 billion in January and announcing a further reduction to US$65 billion starting in February. Moreover, market players are pushing yields higher to maintain the interest rate differential with US Treasury yields as the latter have been rising. Auctions for Treasury bills and 3-year paper in January were met with relatively low demand. The Bureau of the Treasury (BTr) rejected bids for 6-month paper and accepted lower bids for the other tenors as market players posted higher yields. In addition, there are inflation concerns mostly due to the effects of Typhoon Haiyan and other upside risks.
Inflation for January increased to 4.2% year-on-year (y-o-y) from 4.1% in December 2013. Although the average inflation rate for full-year 2013 of 3.0% was still within the Bangko Sentral ng Pilipinas’ (BSP) target range of 3%–5%, upside risks to inflation remain in 2014. These include (i) food inflation due to supply concerns as a result of weather-related production disruptions; (ii) higher electricity rates due to power supply concerns and the pending petition by electricity distributor Meralco for a
rate hike; and (iii) continued peso depreciation, with the currency falling 8.3% in 2013 and 2.0% year-to-date as of end-January 2014, due to concerns generated by the US Federal Reserve’s tapering of its QE program. Thus, speculation of possible monetary tightening by the BSP has also added to uncertainties in the market.
The Philippine economy grew 6.5% y-o-y in 4Q13, following revised 6.9% y-o-y growth in 3Q13. The decline in growth was primarily due to effects of Typhoon Haiyan. Despite this, growth continues to be supported by the strong performance of the services sector, which expanded 6.5% y-o-y in 4Q13. Meanwhile, growth in the manufacturing sector accelerated to 12.3%. For the full-year 2013, real GDP grew 7.2%.
Size and Composition
The Philippine LCY bond market grew at a robust annual rate of 10.2% in 2013, led by both Treasury bills and bonds (Table 1). Total LCY bonds reached PHP4,481 billion (US$101 billion) at end-November, up 4.0% from end-September’s level of PHP4,307 billion. Government securities accounted for the majority of bonds outstanding, totaling PHP3,889 billion, while corporate bonds summed to PHP591.5 billion.
Government Bonds. Outstanding f ixed- income instruments issued by the Philippine government and government-controlled companies rose 3.4% quarter-on-
Time to maturity (years)
31-Dec-13 30-Jun-1331-Jan-14
0 3 6 9 12 15 18 21 24 27
Yield (%)
6.3
5.0
3.8
2.5
1.3
0.0
Figure 1: Philippines’ Benchmark Yield Curve— LCY Government Bonds
LCY = local currency.Source: Bloomberg LP.

72 Asia Bond Monitor
Table 1: Size and Composition of the LCY Bond Market in the Philippines
Outstanding Amount (billion) Growth Rate (%)
4Q12 3Q13 4Q13 4Q12 4Q13
PHP US$ PHP US$ PHP US$ q-o-q y-o-y q-o-q y-o-y
Total 4,064 99 4,307 99 4,481 101 6.9 19.9 4.0 10.2
Government 3,538 86 3,763 87 3,889 88 7.7 19.8 3.4 9.9
Treasury Bills 275 7 310 7 333 7 5.0 (6.8) 7.3 21.0
Treasury Bonds 3,150 77 3,339 77 3,440 77 8.6 23.7 3.0 9.2
Others 113 3 113 3 116 3 (8.8) 2.3 2.6 2.6
Corporate 526 13 544 13 592 13 2.3 20.7 8.7 12.4
( ) = negative, LCY = local currency, q-o-q = quarter-on-quarter, y-o-y = year-on-year.Notes:1. Calculated using data from national sources. 2. Bloomberg end-of-period LCY–US$ rates are used.3. Growth rates are calculated from LCY base and do not include currency effects.4. Data for government bonds as of end-November 2013. 5. “Others” comprise bonds issued by government agencies, entities, and corporations for which repayment is guaranteed by the Government of the Philippines. This includes bonds
issued by Power Sector Assets and Liabilities Management (PSALM) and the National Food Authority, among others. 6. Peso Global Bonds (PHP-denominated bonds payable in US dollars) and multi-currency Retail Treasury Bonds (RTBs) are not included. As of end-November 2013, the Government
of the Philippines and Petron had PHP129.7 billion and PHP20.0 billion of outstanding Peso Global Bonds, respectively. There was a total of PHP9.0 billion of outstanding multi-currency Treasury bonds at end-November 2013.
Sources: Bureau of the Treasury and Bloomberg LP.
quarter (q-o-q) and 9.9% y-o-y to close at PHP3,889 billion at end-November. Treasury bills expanded 7.3% q-o-q and 21.0% y-o-y to stand at PHP332.6 billion at end-November, as demand for shorter tenors was high due to uncertainties in the market. Treasury bonds increased 3.0% q-o-q and 9.2% y-o-y to PHP3,440 billion. Meanwhile, fixed-income instruments issued by government-controlled companies registered an increase of 2.6% y-o-y to PHP116.5 billion at the end of 4Q13.
In terms of issuance, 4Q13 saw less volume, PHP127.9 billion compared with PHP340.0 billion in 3Q13, due to the government’s comfortable cash position after the issuance of PHP150 billion worth of 10-year Retail Treasury Bonds (RTBs) in August.
The government has programmed LCY borrowing of PHP135 billion through its regular auction schedule in 1Q14: PHP60 billion of Treasury bills with 91-, 182-, and 364-day tenors; and PHP75 billion of Treasury bonds with 3-, 5-, and 7-years tenors.
Corporate Bonds. As of end-December, total outstanding LCY corporate bonds grew 8.7% q-o-q and 12.4% y-o-y to reach PHP591.5 billion. The market saw a lot of corporate bond issuances in 4Q13, a total of PHP77.4 billion compared to PHP19.5 billion, PHP14.0 billion, and PHP32.0 billion in the first 3 quarters of the year, respectively. Local firms took advantage of relatively low interest rates before the end of the year, in anticipation of higher rates in 2014 as a result
of the Federal Reserve tapering its QE program and rising inflation concerns.
Twelve companies issued bonds, long-term negotiable certificates of deposits (LTNCDs) , and Tier 2 notes in 4Q13. Meralco was the largest issuer in 4Q13 raising PHP18.5 billion worth of bonds (Table 2), Development Bank of the Philippines was second with PHP10.0 billion of Tier 2 notes, and Aboitiz Equitiz Ventures was third with PHP8.0 billion of corporate bonds.
Only 52 companies are actively tapping the bond market in the Philippines. The top 33 issuers accounted for 93.4% of the total amount of LCY corporate bonds outstanding at end-December (Table 3). Out of the top 33 bond issuers, only seven companies were privately held corporations and the rest were publicly listed with the Philippine Stock Exchange (PSE). Ayala Land was the largest corporate issuer in the country with PHP49.9 billion of outstanding debt at end-December. San Miguel Brewery was the next largest borrower with PHP45.2 billion outstanding. Ayala Corporation was in the third spot with PHP40 billion of outstanding bonds.
The diversity of LCY corporate bond issuers in 4Q13 was comparable with that in 3Q13 (Figure 2). Banks and financial services, including investment houses, remained the leading issuer of debt in 4Q13 with 25.5% of the total as BSP moved toward more stringent liquidity and capital requirements. The market share of most industries

Philippines 73
Table 2: Notable LCY Corporate Bond Issuance in 4Q13
Corporate IssuersCoupon Rate
(%)Issued Amount
(PHP billion)
Meralco
7-year bond 4.38 11.50
12-year bond 4.88 7.00
Development Bank of the Philippines
10-year Tier 2 Notes 4.88 10.00
Aboitiz Equity Ventures
7-year bond 4.41 6.20
10-year bond 4.62 1.80
Filinvest Land
7-year bond 4.86 4.30
10-year bond 5.43 2.70
Ayala Land
7-year bond 4.63 4.00
20-year bond 6.00 2.00
BDO Unibank
5.5-year LTNCD 3.13 5.00
Land Bank of the Philippines
5.5-year LTNCD 3.13 5.00
RCBC
5.5-year LTNCD 3.25 2.86
5.5-year LTNCD 0.00 2.14
Philippine National Bank
5.5-year LTNCD 3.25 4.00
Asia United Bank
5.25-year LTNCD 3.50 0.90
LCY = local currency, LTNCD = long-term negotiable certificate of deposit.Source: Bloomberg LP.
remained unchanged, except for real estate, which increased to 19.5% from 17.9%. Firms from industries as diverse as electricity generation and distribution, telecommunications, and thoroughfares and tollways continued to have shares of total corporate bonds outstanding in the single-digit levels.
As the sole fixed-income exchange in the country, PDEx captures the secondary trading of listed fixed-income issues. The volume of secondary trading of government securities surged between 2005 and 2013 (Figure 3). From an annual trading volume of PHP437.7 billion in 2005, trading volume increased to PHP5,692.0 billion in 2013.
Total trading volume in 2013 increased 12.9% y-o-y to PHP5,692 billion from PHP5,042 billion in 2012. Between 2005 and 2013, treasury bonds accounted for the highest share in the total trading volume. However, its share
also declined from 81.6% in 2005 to 59.8% in 2013. Meanwhile, the share of RTBs increased from 5.5% in 2005 to 37.2% in 2013. This reflects the market’s interest in longer-tenored government securities, particularly the 20- and 25-year maturities, which are mostly RTBs.
Foreign Currency Denominated Bonds. In January, the Philippines raised US$1.5 billion from the sale of 10-year US$-denominated global bonds. The bonds carry a coupon of 4.2%. The bond issuance occurred concurrently with a 1-day tender offer for 11 series of US$-denominated bonds maturing between 2015 and 2025. This was its first dollar bond issuance since January 2012, and is the first to achieve an international investment-grade rating—Baa3 from Moody’s, BBB– from Standard & Poor’s, and BBB– from Fitch Ratings.
Investor Profile
The largest grouping of investors in government securities in 4Q13 comprised banks and financial institutions with 31.6% of the total (Figure 4). This was up slightly from a share of 30.9% in 4Q12. Contractual savings institutions—including the Social Security System (SSS), Government Service Insurance System (GSIS), Pag-ibig, and life insurance companies—and tax-exempt institutions—such as trusts and other tax-exempt entities—accounted for 24.4% of the total in 4Q13, down from 25.4% in 4Q12. The share of funds being managed by BTr, which includes the Bond Sinking Fund, also fell to 18.9% in 4Q13 from 20.8% in 4Q12. The participation of custodians slightly decreased to 13.2% from 13.4% in the same period in 2012. The share of other government entities and other investors, which include individuals and private corporations, increased to 11.8% in 4Q13 from 9.5% in 4Q12.
Policy, Institutional, and Regulatory Developments BSP Issues Circular on Amendments to Regulations on FX Transactions
On 7 November, the BSP released the implementing circular on the amendments to the manual regulations on foreign exchange (FX) transactions. This included (i) allowing prepayment of BSP-registered short-term loans subject to required documents, (ii) waiver of the submission of documents to support reports on importations under documents against acceptance and open account arrangements, and (iii) clarification of the prescriptive
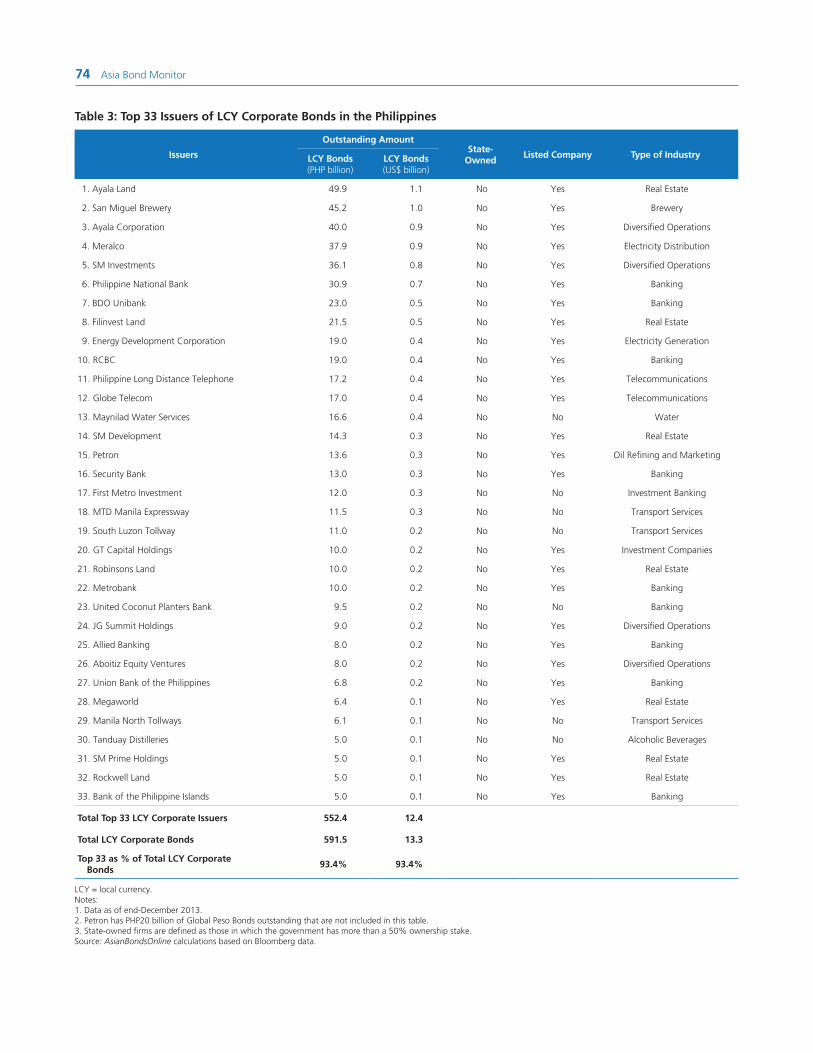
74 Asia Bond Monitor
Table 3: Top 33 Issuers of LCY Corporate Bonds in the Philippines
Issuers
Outstanding AmountState-
OwnedListed Company Type of IndustryLCY Bonds
(PHP billion)LCY Bonds(US$ billion)
1. Ayala Land 49.9 1.1 No Yes Real Estate
2. San Miguel Brewery 45.2 1.0 No Yes Brewery
3. Ayala Corporation 40.0 0.9 No Yes Diversified Operations
4. Meralco 37.9 0.9 No Yes Electricity Distribution
5. SM Investments 36.1 0.8 No Yes Diversified Operations
6. Philippine National Bank 30.9 0.7 No Yes Banking
7. BDO Unibank 23.0 0.5 No Yes Banking
8. Filinvest Land 21.5 0.5 No Yes Real Estate
9. Energy Development Corporation 19.0 0.4 No Yes Electricity Generation
10. RCBC 19.0 0.4 No Yes Banking
11. Philippine Long Distance Telephone 17.2 0.4 No Yes Telecommunications
12. Globe Telecom 17.0 0.4 No Yes Telecommunications
13. Maynilad Water Services 16.6 0.4 No No Water
14. SM Development 14.3 0.3 No Yes Real Estate
15. Petron 13.6 0.3 No Yes Oil Refining and Marketing
16. Security Bank 13.0 0.3 No Yes Banking
17. First Metro Investment 12.0 0.3 No No Investment Banking
18. MTD Manila Expressway 11.5 0.3 No No Transport Services
19. South Luzon Tollway 11.0 0.2 No No Transport Services
20. GT Capital Holdings 10.0 0.2 No Yes Investment Companies
21. Robinsons Land 10.0 0.2 No Yes Real Estate
22. Metrobank 10.0 0.2 No Yes Banking
23. United Coconut Planters Bank 9.5 0.2 No No Banking
24. JG Summit Holdings 9.0 0.2 No Yes Diversified Operations
25. Allied Banking 8.0 0.2 No Yes Banking
26. Aboitiz Equity Ventures 8.0 0.2 No Yes Diversified Operations
27. Union Bank of the Philippines 6.8 0.2 No Yes Banking
28. Megaworld 6.4 0.1 No Yes Real Estate
29. Manila North Tollways 6.1 0.1 No No Transport Services
30. Tanduay Distilleries 5.0 0.1 No No Alcoholic Beverages
31. SM Prime Holdings 5.0 0.1 No Yes Real Estate
32. Rockwell Land 5.0 0.1 No Yes Real Estate
33. Bank of the Philippine Islands 5.0 0.1 No Yes Banking
Total Top 33 LCY Corporate Issuers 552.4 12.4
Total LCY Corporate Bonds 591.5 13.3
Top 33 as % of Total LCY Corporate Bonds
93.4% 93.4%
LCY = local currency.Notes:1. Data as of end-December 2013.2. Petron has PHP20 billion of Global Peso Bonds outstanding that are not included in this table.3. State-owned firms are defined as those in which the government has more than a 50% ownership stake.Source: AsianBondsOnline calculations based on Bloomberg data.
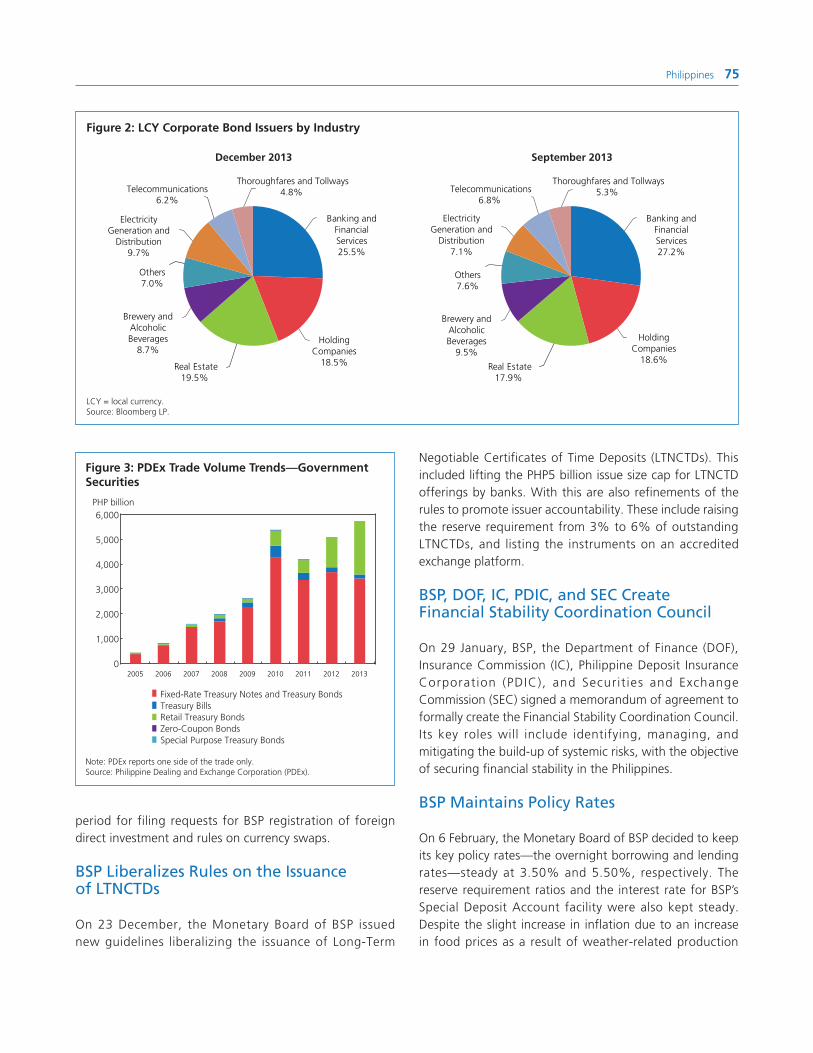
Philippines 75
Negotiable Certificates of Time Deposits (LTNCTDs). This included lifting the PHP5 billion issue size cap for LTNCTD offerings by banks. With this are also refinements of the rules to promote issuer accountability. These include raising the reserve requirement from 3% to 6% of outstanding LTNCTDs, and listing the instruments on an accredited exchange platform.
BSP, DOF, IC, PDIC, and SEC Create Financial Stability Coordination Council
On 29 January, BSP, the Department of Finance (DOF), Insurance Commission (IC), Philippine Deposit Insurance Corporation (PDIC), and Securit ies and Exchange Commission (SEC) signed a memorandum of agreement to formally create the Financial Stability Coordination Council. Its key roles will include identifying, managing, and mitigating the build-up of systemic risks, with the objective of securing financial stability in the Philippines.
BSP Maintains Policy Rates
On 6 February, the Monetary Board of BSP decided to keep its key policy rates—the overnight borrowing and lending rates—steady at 3.50% and 5.50%, respectively. The reserve requirement ratios and the interest rate for BSP’s Special Deposit Account facility were also kept steady. Despite the slight increase in inflation due to an increase in food prices as a result of weather-related production
2005 2006 2007 2008 2009 2010 2011 2012 2013
6,000
5,000
4,000
3,000
2,000
1,000
0
PHP billion
Fixed-Rate Treasury Notes and Treasury BondsTreasury BillsRetail Treasury BondsZero-Coupon BondsSpecial Purpose Treasury Bonds
Figure 3: PDEx Trade Volume Trends—Government Securities
Note: PDEx reports one side of the trade only.Source: Philippine Dealing and Exchange Corporation (PDEx).
Real Estate17.9%
Telecommunications6.8%
Thoroughfares and Tollways5.3%
HoldingCompanies
18.6%
Brewery andAlcoholicBeverages
9.5%
ElectricityGeneration and
Distribution7.1%
Banking andFinancialServices27.2%
Others7.6%
September 2013December 2013
Real Estate19.5%
Telecommunications6.2%
Thoroughfares and Tollways4.8%
Others7.0%
HoldingCompanies
18.5%
Brewery andAlcoholicBeverages
8.7%
ElectricityGeneration and
Distribution9.7%
Banking andFinancialServices25.5%
Figure 2: LCY Corporate Bond Issuers by Industry
LCY = local currency.Source: Bloomberg LP.
period for filing requests for BSP registration of foreign direct investment and rules on currency swaps.
BSP Liberalizes Rules on the Issuance of LTNCTDs
On 23 December, the Monetary Board of BSP issued new guidelines liberalizing the issuance of Long-Term

76 Asia Bond Monitor
December 2012December 2013
Others5.2%
OtherGovernment
Entities4.6%
OtherGovernment
Entities4.3%
Custodians13.2%
Custodians13.4%
CSIs andTax-ExemptInstitutions
24.4%
CSIs andTax-ExemptInstitutions
25.4%
BTr-ManagedFunds18.9%
BTr-ManagedFunds20.8%
Banks andFinancial
Institutions31.6%
Banks andFinancial
Institutions30.9%
Others7.2%
Figure 4: LCY Government Bonds Investor Profile
BTr = Bureau of the Treasury, CSIs = contractual savings institutions, LCY = local currency.Source: Bloomberg LP.
disruptions, BSP cited that the future inflation path continues to be broadly in line with BSP’s target ranges of 3.0%–5.0% for 2014 and 2.0%–4.0% for 2015. The Monetary Board noted certain upside risks to inflation, including the pending petitions for adjustments of utility
rates and a possible uptick in food prices. BSP also noted that while global economic conditions have become more challenging due to recent US monetary policy adjustments and concerns over growth sustainability in emerging markets, expectations for domestic activity remain firm.

Singapore 77
Singapore
Yield Movements
Between end-December and end-January, the yield curve for Singapore’s local currency (LCY) government bonds rose for all tenors except the 3-month, and 10- and 15-year, which fell between 1 and 10 basis points (bps) during this period (Figure 1). Yields rose the most for the 5-year Singapore Government Security (SGS), gaining 49 bps. The yield spread between 2- and 10-year tenors narrowed to 205 bps at end-January from 219 bps at end-December. In 2H13, Singapore’s government bond yield curve showed a rising trend at the longer-end of the curve. As Singaporean financial markets are highly correlated with United States (US) financial markets, and given the commencement in January of the tapering of the US Federal Reserve’s quantitative easing (QE) measures, there might be increasing upward pressure on SGS yields, especially for longer tenors.
According to the Ministry of Trade and Industry (MTI), Singapore’s real gross domestic product (GDP) expanded 5.5% year-on-year (y-o-y) in 4Q13, down from 3Q13’s revised growth of 5.8%. By sector, the manufacturing industry posted 7.0% y-o-y growth in 4Q13 compared with 5.3% in 3Q13, the construction sector’s growth slipped to 4.8% in 4Q13 from 6.6% in 3Q13, and the services producing industries recorded slower growth of 5.9% in 4Q13 compared with 6.3% in 3Q13. Meanwhile, on a quarter-on-quarter (q-o-q) and seasonally adjusted annualized basis, the Singaporean economy grew 6.1% in 4Q13, a substantial increase from the revised economic growth of 0.3% in the previous quarter. MTI announced in February that it was maintaining Singapore’s growth forecast for 2014 at 2.0%–4.0%.
Meanwhile, Singapore’s consumer price inflation eased to 1.5% y-o-y in December from 2.6% in November. The slower inflation was due mainly to lower private road transport costs, which declined 2.8% in December due to Certificate of Entitlement premiums. Accommodation costs increased 2.9%, compared with a 3.3% hike in the previous month, and food inflation rose to 2.7% from 2.6% amid slightly faster increases in the prices of non-cooked food items. Consumer price inflation averaged 2.4% in 2013, down significantly from 4.6% in 2012. On a m-o-m basis, consumer price inflation slowed to 0.3% in December from 0.7% in November.
Size and Composition
The total outstanding size of Singapore’s LCY bond market rose 1.4% q-o-q and 8.3% y-o-y to SGD305 billion (US$242 billion) at end-December, led by growth in both the government and corporate bond markets (Table 1). Growth in the government bond sector was mainly due to the substantial increase in the stock of Monetary Authority of Singapore (MAS) bills, which were first issued in April 2011 as part of MAS money market operations.
Government Bonds. LCY government bonds outstanding reached SGD189 billion at end-December, representing a 1.1% q-o-q and 9.3% y-o-y increase, led by 8.8% q-o-q and 111.9% y-o-y growth in MAS bills outstanding, which reached SGD64 billion at end-December. MAS bills are negotiable instruments used to help Singaporean banks better manage their liquidity and to increase the availability of high-quality liquid assets. To withdraw liquidity from the financial market, MAS conducts net issuance of MAS bills; to inject liquidity, MAS pursues the net redemption of MAS bills. Banks in need of liquidity can sell or pledge MAS bills as collateral in the interbank repurchase (repo) market.
The large increase in MAS bills outstanding is not only a result of MAS open market operations to withdraw liquidity, but also because MAS ceased to issue the 3-month SGS bill effective 12 June 2013, instead replacing it with
Figure 1: Singapore’s Benchmark Yield Curve–LCY Government Bonds
Yield (%)
Time to maturity (years)
0.0
0.7
1.4
2.1
2.8
3.5
31-Dec-13 30-Jun-1331-Jan-14
0 3 6 9 12 15 18 21 2724 30
LCY = local currency.Source: Bloomberg LP.

78 Asia Bond Monitor
the 12-week MAS bill. MAS also introduced the 6-month MAS bill in January to replace the 6-month SGS bill after its last issuance on 27 December 2013. The 6-month MAS bill will be issued fortnightly.
The 4Q13 stock of SGS bills and bonds has contracted for the past 3 quarters, falling to SGD125 billion at end-December, due to the net redemption of SGS bills partly driven by the replacement of 3-month SGS bills with 12-week MAS bills.
Corporate Bonds. LCY corporate bonds outstanding continued to expand steadily in 4Q13, reaching SGD116 billion at end-December based on AsianBondsOnline estimates, representing a 1.9% q-o-q and 6.7% y-o-y increase. Singapore Statutory Boards—comprising government agencies such as the Housing and Development Board (HDB) and Land Transport Authority—and the financial sector continue to dominate the corporate bond market in terms of bonds outstanding.
The amount of LCY bonds outstanding of the top 30 corporate bond issuers in Singapore at end-2013 reached SGD63.8 billion, or about half of the total corporate bond market (Table 2). Singapore’s HDB retained its ranking as the top corporate issuer with bonds outstanding of SGD17.6 billion at end-December, up from SGD16.1 billion at end-September. United Overseas Bank climbed from the fourth- to second-ranked corporate issuer between end-September and end-December with bonds outstanding of SGD4.6 billion due to the bank’s November issue of subordinated bonds worth SGD500 million in anticipation of the new Basel III regulatory capital requirements.
Table 1: Size and Composition of the LCY Bond Market in Singapore
Outstanding Amount (billion) Growth Rate (%)
4Q12 3Q13 4Q13 4Q12 4Q13
SGD US$ SGD US$ SGD US$ q-o-q y-o-y q-o-q y-o-y
Total 282 231 301 240 305 242 2.2 14.1 1.4 8.3
Government 173 142 187 149 189 150 1.2 12.6 1.1 9.3
SGS Bills and Bonds 143 117 128 102 125 99 (0.9) 3.0 (2.4) (12.5)
MAS Bills 30 25 59 47 64 51 12.6 102.0 8.8 111.9
Corporate 109 89 114 91 116 92 3.9 16.4 1.9 6.7
( ) = negative, LCY = local currency, MAS = Monetary Authority of Singapore, q-o-q = quarter-on-quarter, SGS = Singapore Government Securities, y-o-y = year-on-year.Notes:1. Government bonds are calculated using data from national sources. Corporate bonds are based on AsianBondsOnline estimates. 2. SGS bills and bonds do not include the special issue of SGS held by the Singapore Central Provident Fund (CPF). 3. Bloomberg LP end-of-period LCY–US$ rates are used. 4. Growth rates are calculated from LCY base and do not include currency effects.Sources: Monetary Authority of Singapore, Singapore Government Securities, and Bloomberg LP.
CapitaLand was ranked the third-largest corporate issuer with bonds outstanding of SGD4.5 billion. The rest of the top 30 issuers more or less sustained their previous rankings from 3Q13.
A total of 19 bonds were issued by 18 corporates amounting to SGD5.1 billion in 4Q13, up from SGD4.2 billion in 3Q13. Table 3 lists some notable corporate bond issuances in 4Q13. Similar to the previous quarter, perpetual bonds were issued by DBS Group and United Overseas Bank carrying coupon rates of 4.70% and 4.75%, respectively. These two issues reflected the banks’ anticipation of a transition to the new Basel III regulatory capital rules under which the existing preferred shares will no longer fully qualify as Tier 1 capital. The rest of the issuances were dominated by real estate companies, with maturities between 1 year and 10.5 years, and coupon rates between 1.5% and 8.5%.
Policy, Institutional, and Regulatory Developments
HKEx and SGX Cooperate on RMB Internationalization
On 4 December 2013, Hong Kong Exchanges and Clearing Limited (HKEx) and SGX signed a Memorandum of Understanding (MOU) that enables both exchanges to cooperate in promoting the internationalization of the renminbi. This cooperation can be in the form of product development, connectivity enhancement, technology development, and extraterritorial market infrastructure regulation.

Singapore 79
Table 2: Top 30 Issuers of LCY Corporate Bonds in Singapore
Issuers
Outstanding Amount
State-OwnedListed
CompanyType of IndustryLCY Bonds
(SGD billion)LCY Bonds(US$ billion)
1. Housing and Development Board 17.6 13.9 Yes No Financial
2. United Overseas Bank 4.6 3.6 No Yes Financial
3. CapitaLand 4.5 3.5 No Yes Financial
4. DBS Bank 4.2 3.3 No Yes Financial
5. Temasek Financial I 3.6 2.9 No No Financial
6. SP PowerAssets 2.4 1.9 No No Utilities
7. Public Utilities Board 2.1 1.7 Yes No Utilities
8. GLL IHT 2.0 1.6 No No Real Estate
9. Land Transport Authority 1.8 1.4 Yes No Industrial
10. Oversea-Chinese Banking Corp. 1.7 1.4 No Yes Financial
11. Keppel 1.5 1.2 No Yes Industrial
12. Olam International 1.4 1.1 No Yes Consumer
13. City Developments 1.4 1.1 No Yes Consumer
14. Neptune Orient Lines 1.3 1.0 No Yes Industrial
15. CapitaMalls Asia Treasury 1.1 0.9 No No Financial
16. Keppel Land 1.1 0.9 No Yes Real Estate
17. PSA 1.0 0.8 No No Consumer
18. Overseas Union Enterprise 1.0 0.8 No Yes Consumer
19. Mapletree Treasury Services 1.0 0.8 No No Financial
20. Hyflux 1.0 0.8 No Yes Industrial
21. Sembcorp Financial Services 0.9 0.7 No No Industrial
22. Singtel Group Treasury 0.9 0.7 No No Telecommunications
23. DBS Group Holdings 0.8 0.6 No Yes Financial
24. Singapore Airlines 0.8 0.6 No No Transportation
25. Temasek Financial III 0.8 0.6 No No Financial
26. Global Logistic Properties 0.8 0.6 No Yes Industrial
27. CMT MTN 0.8 0.6 No No Financial
28. CapitaLand Treasury 0.7 0.6 No No Financial
29. Joynote 0.7 0.6 No No Financial
30. F&N Treasury 0.7 0.5 No No Financial
Total Top 30 LCY Corporate Issuers 63.8 50.5
Total LCY Corporate Bonds 116.4 92.1
Top 30 as % of Total LCY Corporate Bonds 54.8% 54.8%
LCY = local currency.Notes: 1. Data as of end-December 2013.2. State-owned firms are defined as those in which the government has more than a 50% ownership stake. Source: AsianBondsOnline calculations based on Bloomberg data.

80 Asia Bond Monitor
Table 3: Notable LCY Corporate Bond Issuance in 4Q13
Corporate IssuersCoupon Rate
(%)Issued Amount
(SGD million)
Housing and Development Board
4-year bond 1.88 1,500
DBS Group
perpetual bond 4.70 805
Capitaland
10-year bond 1.95 800
United Overseas Bank
perpetual bond 4.75 500
Sembcorp Financial Services
10.5-year bond 3.64 200
LMIRT Capital
3-year bond 4.25 150
GLL IHT
1-year bond 2.00 150
3-year bond 3.55 125
LCY = local currency.Source: Bloomberg LP.
SGX and Thomson Reuters Launch SGD Bond Indices
On 10 December 2013, Singapore Exchange (SGX) and Thomson Reuters launched the Thomson Reuters–SGX Singapore Fixed Income Indices, which cover corporate, government, and statutory board bonds. The indices were made for market participants to serve as a benchmark for investment performance.
RQFII License Applications Open for Eligible Singaporean Financial Institutions
On 24 January, MAS announced that all Singapore-incorporated financial institutions that it approved to conduct fund management activities may submit applications for the Renminbi Qualified Foreign Institutional Investor (RQFII) license. This will allow them to offer renminbi investment products as well as invest offshore renminbi into the PRC’s securities market. This move followed the recent allocation of an aggregate quota of CNY50 billion to Singapore under the PRC’s RQFII program.

Thailand 81
Thailand
4.7
4.2
3.7
3.2
2.7
2.20 2 4 6 8 10 12 14 16
Time to maturity (years)
Yield
31-Dec-13 30-Jun-1331-Jan-14
Figure 1: Thailand’s Benchmark Yield Curve— LCY Government Bonds
LCY = local currency.Source: Bloomberg LP.
Yield Movements
Thailand’s local currency (LCY) government bond yield curve steepened between 30 June 2013 and 31 January 2014, as yields fell for shorter-term bonds and rose for longer-term bonds (Figure 1). Specifically, yields decreased for tenors of less than 6 years, with the decrease ranging from 6 basis points (bps) for the 3-year bond to 43 bps for the 2-year bond. Meanwhile, yields increased for tenors of 6 years and longer, with the hikes ranging from 4 bps for the 6-year bond to 29 bps for the 9-year bond. The yield spread between the 2- and 10-year tenors widened 69 bps during this period.
The second half of 2013 saw yields falling for most tenors, especially for short-term paper, with the declines more acute during the month of November as foreign investors sold relatively large amounts of short-term debt amid increased concerns over a tapering in the United States (US) Federal Reserve’s asset purchase program before the end of the year. In January, yields fell further for most tenors amid expectations of additional tapering of the Federal Reserve’s asset purchase program as well as concerns over the domestic political environment.
The Bank of Thai land’s (BOT) Monetary Pol icy Committee decided on 22 January to maintain the policy rate at 2.25%, viewing its accommodative monetary policy stance as appropriate in support of economic recovery. In its previous meeting held on 27 November, the committee decided to reduce the policy rate 25 bps from 2.50% to 2.25% due to slower-than-expected domestic economic growth and increased downside risks. Thailand’s real gross domestic product (GDP) growth decelerated to 0.6% y-o-y in 4Q13 from 2.7% in 3Q13, largely due to contractions in household consumption and domestic investment.
Consumer price inflation climbed to 1.9% year-on-year (y-o-y) in January from 1.7% in December amid increasing hikes in retail food prices. The price index for food and non-alcoholic beverages rose at a faster pace in January, increasing 3.6% y-o-y after rising 3.0% in the previous month. Meanwhile, the y-o-y increase in the price index for non-food items and
beverages inched up to 1.1% in January from 1.0% in December. On a month-on-month (m-o-m) basis, consumer price inflation rose to 0.4% in January from 0.1% in December. Meanwhile, for the full-year 2013, consumer price inflation in Thailand stood at 2.2%.
Size and Composition
The LCY bond market in Thailand continued to grow in 4Q13, recording growth rates of 0.9% quarter-on-quarter (q-o-q) and 5.7% y-o-y, which were both significantly lower than growth rates in the fourth quarter of the previous year (Table 1). The outstanding size of government bonds grew modestly by 3.5% on a y-o-y basis, but recorded a marginal 0.1% decrease from the previous quarter; the relatively slow growth of the government bond market was largely due to a contraction in the outstanding size of central bank bonds. In contrast, positive growth was evident in the outstanding size of bills and bonds sold by the central government, and the bonds of state-owned enterprises (SOEs).
Issuance of LCY government bonds was down in 4Q13, leveling off at THB1.7 trillion, which was down 5.5% q-o-q and 10.7% y-o-y. Central bank bond issues, which accounted for 60% of total LCY bond issuance in 4Q13, amounted to THB1.2 trillion in 4Q13, reflecting declines of 15.8% q-o-q and 27.8% y-o-y. In contrast, LCY central government bonds and treasury

82 Asia Bond Monitor
bonds declined from 3Q13 and 4Q12 (Figure 2). Trading volumes of bonds issued by the central bank, the central government, and SOEs contracted on a q-o-q basis, while trading volumes of central government and SOE bonds fell on a y-o-y basis, contributing to liquidity tightening in the government bond market during the last quarter of 2013. Moreover, the trading volume of corporate bonds fell on both a quarterly and annual basis, thereby resulting in a less liquid corporate bond market in 4Q13.
Investor Profile
Contractual savings funds and insurance companies remained the two largest investor groups in Thailand’s LCY government bond market in 3Q13, the most recent quarter for which data are available, as their share of total government bond holdings leveled off at 27% and 23%, respectively, at end-September (Figure 3). Compared with September 2012, the biggest increase in the share in government bond holdings was that of non-resident investors, which recorded a 2 percentage point hike, followed by those of the central bank and insurance companies with increases of 1 percentage point apiece. Conversely, commercial banks’ government bond holdings share posted the biggest annual decline at 3 percentage points, while a 1 percentage point decrease was incurred by both resident investors and other financial corporations.
Individual retail investors stood as the largest investor group in the LCY corporate bond market, as they held 51% of total LCY corporate bonds in Thailand at end-September (Figure 4). Compared with September
bills together amounted to THB389 billion, which reflected increases of 86.8% q-o-q and 163.8% y-o-y. For SOE bonds, total issuance in 4Q13 stood at THB47.7 billion, which was down 49.7% q-o-q, but up 172.7% y-o-y.
Thailand’s LCY corporate bond market again recorded positive growth in 4Q13, rising 4.8% q-o-q and 14.0% y-o-y, stemming from higher bond issuance by corporates, which reached THB386.1 billion on growth of 22.4% q-o-q and 12.1% y-o-y. At the end of 2013, PTT and Siam Cement stood as the two largest issuers in the LCY corporate bond market. Meanwhile, the combined bonds outstanding of the top 30 corporate issuers accounted for 61% of total corporate bonds outstanding (Table 2).
The two largest LCY corporate bond issues in Thailand during 4Q13 were a THB22 billion 7-year bond sold by PTT in November at a coupon rate of 4.75%, and a THB20 billion 4-year bond issued by Siam Cement in October at a 4.25% coupon (Table 3). CP All, a local store operator, raised THB50 billion from a multi-tranche bond sale in October, which included, among others, a THB11.0 billion 10-year bond at a 5.35% coupon, a THB6.8 billion 3-year bond at a 4.10% coupon, and a THB6.6 billion 5-year debenture at a 4.25% coupon.
Liquidity
Liquidity conditions in Thailand’s LCY bond market appear to have tightened further in 4Q13, as the turnover ratios for both government and corporate
Table 1: Size and Composition of the LCY Bond Market in Thailand
Outstanding Amount (billion) Growth Rate (%)
4Q12 3Q13 4Q13 4Q12 4Q13
THB US$ THB US$ THB US$ q-o-q y-o-y q-o-q y-o-y
Total 8,520 279 8,919 286 9,002 275 4.1 19.8 0.9 5.7
Government 6,760 221 7,004 224 6,996 214 3.6 17.7 (0.1) 3.5
Government Bonds and Treasury Bills 3,024 99 3,371 108 3,414 104 1.2 15.1 1.3 12.9
Central Bank Bonds 3,120 102 2,920 93 2,843 87 6.4 18.1 (2.6) (8.9)
State-Owned Enterprise and Other Bonds 616 20 712 23 738 23 1.5 29.8 3.6 19.9
Corporate 1,760 58 1,915 61 2,006 61 6.3 28.8 4.8 14.0
( ) = negative, LCY = local currency, q-o-q = quarter-on-quarter, y-o-y = year-on-year.Notes:1. Calculated using data from national sources. 2. Bloomberg end-of-period LCY–US$ rates are used.3. Growth rates are calculated from an LCY base and do not include currency effects.Sources: Bank of Thailand (BOT) and Bloomberg LP.

Thailand 83
Table 2: Top 30 Issuers of LCY Corporate Bonds in Thailand
Issuers
Outstanding Amount
State-Owned Listed Company Type of Industry LCY Bonds
(THB billion) LCY Bonds(US$ billion)
1. PTT 193.4 5.9 Yes Yes Energy
2. Siam Cement 141.5 4.3 Yes Yes Diversified
3. Charoen Pokphand Foods 69.3 2.1 No Yes Consumer
4. Krung Thai Bank 68.2 2.1 Yes Yes Financial
5. Bank of Ayudhya 59.7 1.8 No Yes Financial
6. CP All 50.0 1.5 No Yes Consumer
7. Thanachart Bank 41.9 1.3 No No Financial
8. Thai Airways International 41.1 1.3 Yes Yes Consumer
9. Siam Commercial Bank 40.0 1.2 No Yes Financial
10. Ayudhya Capital Auto Lease 38.8 1.2 No No Financial
11. True Corporation 32.8 1.0 No Yes Communications
12. Mitr Phol Sugar 30.2 0.9 No No Consumer
13. Kasikorn Bank 30.1 0.9 No Yes Financial
14. Banpu 29.6 0.9 No Yes Energy
15. TMB Bank 27.7 0.8 No Yes Financial
16. Toyota Leasing Thailand 26.7 0.8 No No Consumer
17. PTT Global Chemical 25.3 0.8 Yes Yes Basic Materials
18. Thai Oil 25.0 0.8 Yes Yes Energy
19. PTT Exploration and Production Company 24.2 0.7 Yes Yes Energy
20. Indorama Ventures 23.9 0.7 No Yes Basic Materials
21. Krung Thai Card 23.0 0.7 Yes Yes Financial
22. DAD SPV 22.5 0.7 Yes No Financial
23. Tisco Bank 20.6 0.6 No No Financial
24. Bangkok Bank 20.0 0.6 No Yes Financial
25. Quality Houses 20.0 0.6 No Yes Real Estate
26. IRPC 19.6 0.6 Yes Yes Energy
27. Thanachart Capital 19.3 0.6 No Yes Financial
28. Kiatnakin Bank 19.2 0.6 No Yes Financial
29. Glow Energy 19.1 0.6 No Yes Utilities
30. Bangkok Expressway 18.1 0.6 No Yes Consumer
Total Top 30 LCY Corporate Issuers 1,220.7 37.3
Total LCY Corporate Bonds 2,006.2 61.3
Top 30 as % of Total LCY Corporate Bonds 60.8% 60.8%
LCY = local currency.Notes:1. Data as of end-December 2013.2. State-owned firms are defined as those in which the government has more than a 50% ownership stake.Source: AsianBondsOnline calculations based on Bloomberg data.
2012, the share of corporate bonds held by mutual funds posted the biggest gain at 2 percentage points, followed by contractual savings funds and non-financial corporations at 1 percentage point each. In contrast, a single percentage point drop was evident in the respective shares of commercial banks, insurance companies, and other investors.
Foreign investors’ net trading of LCY bonds was not consistently positive on a monthly basis throughout 2013, unlike in 2012 (Figure 5). Foreign investors were net buyers of Thai LCY bonds from January to April, before becoming net sellers in May and June amid expectations of a tapering in the US Federal Reserve’s asset purchase program. The second half of
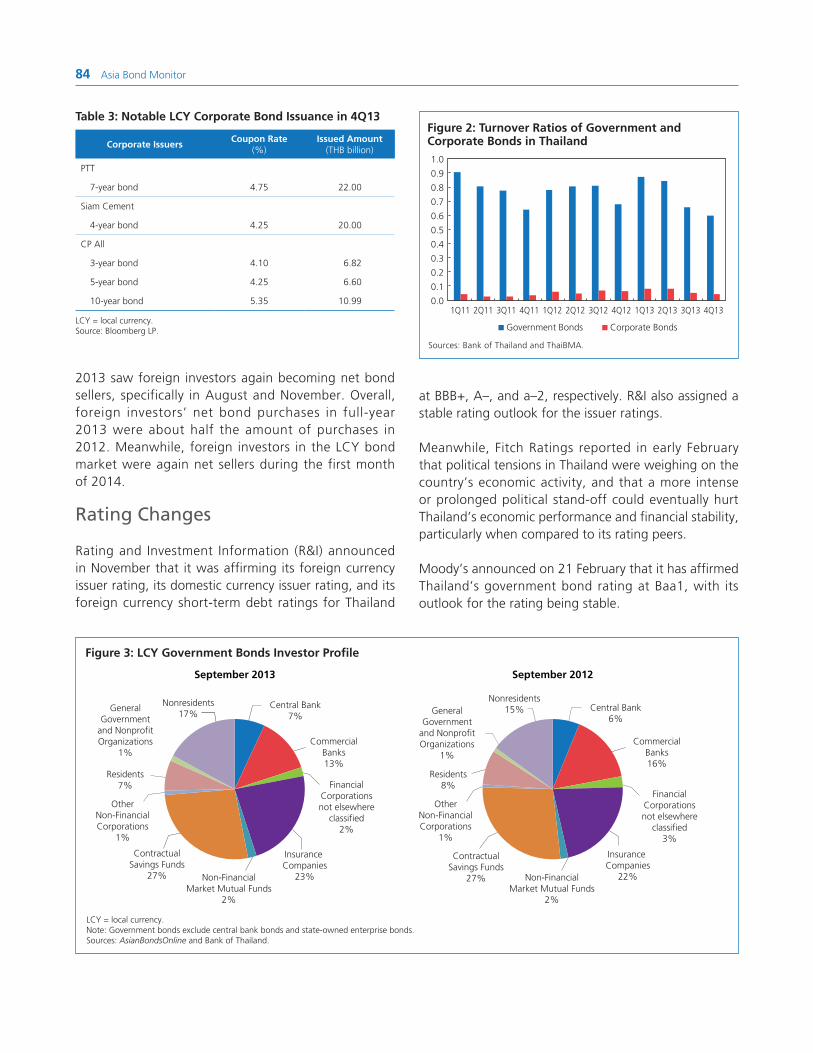
84 Asia Bond Monitor
Insurance Companies
22%
FinancialCorporationsnot elsewhere
classified3%
CommercialBanks16%
Central Bank6%
Nonresidents15%General
Governmentand NonprofitOrganizations
1%
OtherNon-FinancialCorporations
1%
Residents8%
ContractualSavings Funds
27% Non-FinancialMarket Mutual Funds
2%
September 2013 September 2012
Insurance Companies
23%
FinancialCorporationsnot elsewhere
classified2%
CommercialBanks13%
Central Bank7%
Nonresidents17%
GeneralGovernment
and NonprofitOrganizations
1%
OtherNon-FinancialCorporations
1%
Residents7%
ContractualSavings Funds
27% Non-FinancialMarket Mutual Funds
2%
Figure 3: LCY Government Bonds Investor Profile
LCY = local currency.Note: Government bonds exclude central bank bonds and state-owned enterprise bonds.Sources: AsianBondsOnline and Bank of Thailand.
Table 3: Notable LCY Corporate Bond Issuance in 4Q13
Corporate IssuersCoupon Rate
(%)Issued Amount
(THB billion)
PTT
7-year bond 4.75 22.00
Siam Cement
4-year bond 4.25 20.00
CP All
3-year bond 4.10 6.82
5-year bond 4.25 6.60
10-year bond 5.35 10.99
LCY = local currency.Source: Bloomberg LP.
Figure 2: Turnover Ratios of Government and Corporate Bonds in Thailand
Sources: Bank of Thailand and ThaiBMA.
1.0
0.9
0.8
0.7
0.6
0.5
0.4
0.3
0.2
0.1
0.01Q11 2Q11 3Q11 4Q11 1Q12 2Q12 3Q12 4Q12 1Q13 2Q13 4Q133Q13
Corporate BondsGovernment Bonds
2013 saw foreign investors again becoming net bond sellers, specifically in August and November. Overall, foreign investors’ net bond purchases in full-year 2013 were about half the amount of purchases in 2012. Meanwhile, foreign investors in the LCY bond market were again net sellers during the first month of 2014.
Rating Changes
Rating and Investment Information (R&I) announced in November that it was affirming its foreign currency issuer rating, its domestic currency issuer rating, and its foreign currency short-term debt ratings for Thailand
at BBB+, A–, and a–2, respectively. R&I also assigned a stable rating outlook for the issuer ratings.
Meanwhile, Fitch Ratings reported in early February that political tensions in Thailand were weighing on the country’s economic activity, and that a more intense or prolonged political stand-off could eventually hurt Thailand’s economic performance and financial stability, particularly when compared to its rating peers.
Moody’s announced on 21 February that it has affirmed Thailand’s government bond rating at Baa1, with its outlook for the rating being stable.
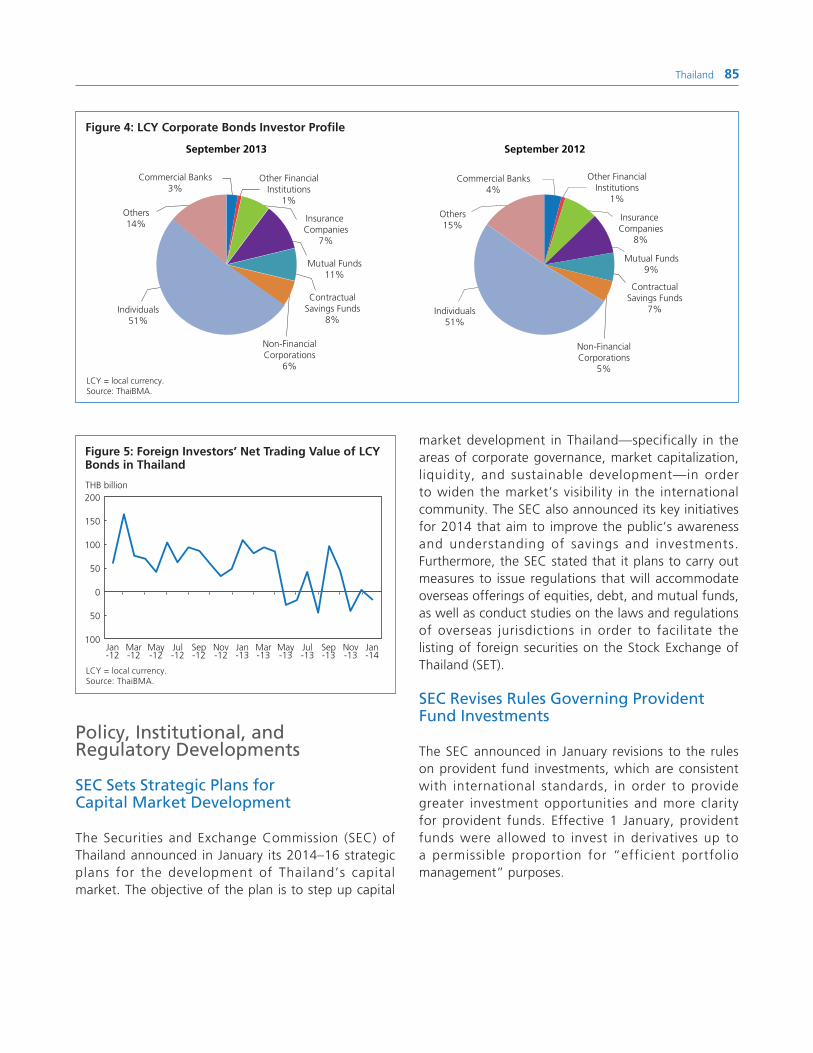
Thailand 85
market development in Thailand—specifically in the areas of corporate governance, market capitalization, liquidity, and sustainable development—in order to widen the market’s visibility in the international community. The SEC also announced its key initiatives for 2014 that aim to improve the public’s awareness and understanding of savings and investments. Furthermore, the SEC stated that it plans to carry out measures to issue regulations that will accommodate overseas offerings of equities, debt, and mutual funds, as well as conduct studies on the laws and regulations of overseas jurisdictions in order to facilitate the listing of foreign securities on the Stock Exchange of Thailand (SET).
SEC Revises Rules Governing Provident Fund Investments
The SEC announced in January revisions to the rules on provident fund investments, which are consistent with international standards, in order to provide greater investment opportunities and more clarity for provident funds. Effective 1 January, provident funds were allowed to invest in derivatives up to a permissible proportion for “efficient portfolio management” purposes.
Policy, Institutional, and Regulatory Developments
SEC Sets Strategic Plans for Capital Market Development
The Securities and Exchange Commission (SEC) of Thailand announced in January its 2014–16 strategic plans for the development of Thailand’s capital market. The objective of the plan is to step up capital
September 2013 September 2012
Insurance Companies
7%
Mutual Funds11%
Other FinancialInstitutions
1%
Commercial Banks3%
Others14%
Individuals51%
Non-FinancialCorporations
6%
ContractualSavings Funds
8%
Insurance Companies
8%
Mutual Funds9%
Other FinancialInstitutions
1%
Commercial Banks4%
Others15%
Individuals51%
Non-FinancialCorporations
5%
ContractualSavings Funds
7%
Figure 4: LCY Corporate Bonds Investor Profile
LCY = local currency.Source: ThaiBMA.
Figure 5: Foreign Investors’ Net Trading Value of LCY Bonds in Thailand
LCY = local currency.Source: ThaiBMA.
200
150
100
50
0
50
100Jan-12
Mar-12
May-12
Sep-12
Jul-12
Jan-13
Nov-12
Mar-13
Jul-13
May-13
Sep-13
Nov-13
Jan-14
THB billion

86 Asia Bond Monitor
Viet Nam
Yield Movements
Between end-June and end-December, Viet Nam’s local currency (LCY) government bond yields rose for short- to medium-term bonds and fell for longer-dated maturities (Figure 1). The higher yields were evident in tenors of 7 years and less, which rose between 7.5 basis points (bps) for 7-year government bonds and 45 bps for 1-year government bonds.
Between end-December and end-January, short- to medium-term bond yields reversed course, shifting downward to near 6-month lows. Yields for 1- to 5-year maturities dropped between 15 bps and 35 bps, with yields on 1-year government bonds falling to 6.2%. Abundant liquidity and low capital costs for banks, coupled with easing inflation, likely kept demand for bonds strong. Meanwhile, the yield spread between 2- and 10-year maturities slightly widened to 210 bps at end-January from 200 bps at end-December.
Economic data in Viet Nam suggests early signs of a gradual and broad-based recovery in 2013, supported by slowing inflation and stronger exports. Annual average consumer price inflation in 2013 moderated to 6.6% from 9.2% in 2012, reaching its lowest level in a decade. In the last 3 months of the year, consumer price inflation eased to 6.0% year-on-year (y-o-y) in December, 5.8% in November, and 5.9% in October. Inflation eased further to 5.5% y-o-y in January 2014. The government has set an annual inflation target range of 6.5%–7.0% for 2014. Meanwhile, exports grew 15.4% y-o-y in 2013, largely due to the exports of foreign-invested enterprises, which rose 22.4%, while exports of domestic companies grew a modest 3.5%.
Real gross domest ic product (GDP) expanded 6.0% y-o-y in 4Q13 following a 5.5% expansion in the previous quarter, bringing 2013 GDP growth to 5.4% y-o-y, up from 5.3% in 2012, but slightly short of the government’s target of 5.5%. The services sector, which accounted for 43% of GDP, grew 6.6% in 2013 from a year earlier, while manufacturing and construction, which comprised 38% of GDP, expanded 5.4%.
Since mid-2013, the State Bank of Vietnam (SBV) has undertaken several measures aimed at pumping more capital into the economy. Effective 28 June, SBV lowered
the ceiling deposit interest rate for VND deposits with tenors of 6 months and less to 7.0% from 7.5% to reduce banks’ funding costs and allow them to lend at lower rates. It also reduced the ceiling lending rate for five priority sectors—agriculture, exports, supporting industries, high-tech businesses, and small and medium-sized enterprises (SMEs)—to 9.0% from 10.0%. Finally, the central bank also supported the debt restructuring of the banking system through creation of the Viet Nam Asset Management Company (VAMC), which started operations in July. In 2014, the central bank expects the total money supply to expand between 16% and 18%, and for credit growth to increase by 12% to 14%.
Size and Composition
As of end-December, total LCY bonds outstanding in Viet Nam reached VND605.2 trillion (US$28.7 billion), marking the first time that the amount has topped the VND600 tr i l l ion mark (Table 1) . LCY bond growth surged 14.8% quarter-on-quarter (q-o-q) and 15.6% y-o-y owing to robust government bond issuance.
Government Bonds. LCY government bonds reached VND590.9 tri l l ion at end-December, expanding 15.4% q-o-q and 17.9% y-o-y. The central government remained the largest issuer of LCY debt securities, dominating the market with a more than 55% share. Government-guaranteed bonds issued
Figure 1: Viet Nam’s Benchmark Yield Curve— LCY Government Bonds
LCY = local currency.Source: Bloomberg LP.
Yield (%)9.8
9.0
8.2
7.4
6.6
5.80 2 4 6 8 10 12 14 16
Time to maturity (years)
31-Dec-13 30-Jun-1331-Jan-14

Viet Nam 87
by the Viet Nam Development Bank (VDB), Vietnam Bank for Social Policies (VBSP), and other state-owned enterprises followed with 33% of bonds outstanding. Municipal bonds issued by Ho Chi Minh City, Da Nang, Ha Noi, and Quang Ninh comprised 3%.
Government bond issuance has never been as strong as in 2013. In the primary market, a total of VND391.4 trillion was issued by the state treasury, the central bank, VDB, VBSP, Viet Nam National Coal, and local governments, far surpassing the 5-year annual average of VND125.5 trillion. In 4Q13, government issuance amounted to VND88.3 trillion, up from VND59.7 trillion issued in 3Q13 and VND53.9 trillion in 2Q13. New issuance of Treasury bills and bonds, and central bank bills amounted to VND67.9 trillion, while new issuance of local government and state-owned enterprise (SOE) bonds, mostly by VDB, amounted to VND20.4 trillion.
For 1Q14, the State Treasury plans to offer a total of VND70 trillion of government bonds distributed as follows: VND31 trillion for tenors of 2 years and less (VND14 trillion for maturities of less than 1 year and VND17 trillion for 2-year bonds), VND36 trillion for 3- to 5-year tenors (VND21 trillion for 3-year bonds and VND15 trillion for 5-year bonds), and VND3 trillion for 10- to 15-year maturities.
Corporate Bonds. Viet Nam’s corporate bond market continued its sharp decline in 4Q13, sliding 6.8% q-o-q to VND14.3 trillion and falling to its lowest level since 3Q09. The actual size of the corporate bond market, however, may be far greater than this figure, as some
Table 1: Size and Composition of the LCY Bond Market in Viet Nam
Outstanding Amount (billion) Growth Rate (%)
4Q12 3Q13 4Q13 4Q12 4Q13
VND US$ VND US$ VND US$ q-o-q y-o-y q-o-q y-o-y
Total 523,423 25 527,304 25 605,204 29 18.0 43.1 14.8 15.6
Government 501,060 24 511,945 24 590,884 28 22.1 55.1 15.4 17.9
Treasury Bonds 255,011 12 267,800 13 336,920 16 16.6 71.5 25.8 32.1
Central Bank Bonds 58,560 3 46,405 2 38,499 2 165.3 – (17.0) (34.3)
State-Owned Enterprise Bonds 187,489 9 197,741 9 215,466 10 10.7 7.5 9.0 14.9
Corporate 22,362 1 15,359 0.7 14,320 0.7 (33.2) (47.6) (6.8) (36.0)
( ) = negative, – = not applicable, LCY = local currency, q-o-q = quarter-on-quarter, y-o-y = year-on-year.Notes:1. Bloomberg LP end-of-period LCY–US$ rates are used. 2. Growth rates are calculated from LCY base and do not include currency effects.Source: Bloomberg LP.
bond issuance campaigns were not made public and were issued through private placements between businesses and banks.
A total of 15 corporate entities comprised the corporate bond market in Viet Nam at end-December, with bonds outstanding amounting to VND14.3 trillion (Table 2).
Policy, Institutional, and Regulatory Developments
Government Issues New Decree on SBV
On 11 November, the government issued Decree No. 156/2013/ND-CP regulating functions, tasks, powers, and the organizational structure of SBV. The decree states the tasks of SBV to include macroeconomic stability, inflation targeting and control, and ensuring credit institutions’ sound operations within the legal framework. SBV is also tasked to implement national monetary policy, including re-financing, interest rates, exchange rates, reserve requirements, open market operations, and other tools and measures. The decree took effect on 26 December 2013.
Viet Nam’s 2014 State Budget Approved
On 12 November, the National Assembly of Viet Nam approved the 2014 target economic indicators, including (i) 5.8% GDP growth, up from an estimated 5.4% in 2013; (ii) 7.0% inflation, slightly higher than 6.6% in 2013; (ii) VND782.7 trillion in state budget revenue and VND 1,006.7 trillion in budget expenditure; and (iii) a state budget deficit of VND224.0 trillion, or

88 Asia Bond Monitor
5.3% of GDP. The largest portion of the state budget was allocated for development investments and debt payments.
Government Issues Decree on Foreign Investors Purchasing Shares of Vietnamese Credit Institutions
On 7 January, the government issued Decree No. 01/2014/ND-CP on purchases of shares of Vietnamese credit institutions by foreign investors, stating that a foreign individual’s ownership share of a Vietnamese credit institution should not exceed 5% of the charter capital. The decree also allows foreign institutions to own a stake in Vietnamese credit institutions up to a maximum of 20% for a single strategic foreign investor, within a total of a 30% foreign stake in the institution. The decree will take effect on 20 February and replace Decree No. 69/2007/ND-CP dated 20 April 2007.
Table 2: Corporate Issuers of LCY Corporate Bonds in Viet Nam
Issuers
Outstanding Amount
State-OwnedListed
CompanyType of IndustryLCY Bonds
(VND billion)LCY Bonds (US$ billion)
1. Techcom Bank 3,000 0.14 No No Finance
2. Asia Commercial Joint Stock 3,000 0.14 No Yes Finance
3. HAGL JSC 2,480 0.12 No Yes Real Estate
4. Vinpearl 2,000 0.09 No Yes Resorts and Theme Parks
5. Vincom 1,000 0.05 No Yes Real Estate
6. Kinh Bac City Development 500 0.02 No Yes Real Estate
7. Minh Phu Seafood 500 0.02 No Yes Fisheries
8. Development Investment 350 0.02 No No Building and Construction
9. Phu Hoang Anh 350 0.02 No No Real Estate
10. Binh Chanh Construction 300 0.01 No Yes Building and Construction
11. Saigon Telecommunication 300 0.01 No No Computer Services
12. Lam Son Sugar 150 0.01 No No Diversified
13. Quoc Cuong Gia 150 0.01 No Yes Building and Construction
14. Tan Tao Investment 130 0.01 No No Real Estate
15. Ho Chi Minh City Securities 110 0.01 No No Finance
Total LCY Corporate Issuers 14,320 0.68
Total LCY Corporate Bonds 14,320 0.68
% of Total LCY Corporate Bonds 100.0% 100.0%
LCY = local currency.Notes:1. Data as of end-December 2013.2. State-owned firms are defined as those in which the government has more than a 50% ownership stake.Source: AsianBondsOnline calculations based on Bloomberg data.

Asia Bond MonitorMarch 2014
This publication reviews recent developments in East Asian local currency bond markets along withthe outlook, risks, and policy options. It covers the 10 members of the Association of SoutheastAsian Nations plus the People’s Republic of China; Hong Kong, China; and the Republic of Korea.
About the Asian Development Bank
ADB’s vision is an Asia and Pacific region free of poverty. Its mission is to help its developingmember countries reduce poverty and improve the quality of life of their people. Despitethe region’s many successes, it remains home to two-thirds of the world’s poor: 1.7 billionpeople who live on less than $2 a day, with 828 million struggling on less than $1.25 a day.ADB is committed to reducing poverty through inclusive economic growth, environmentallysustainable growth, and regional integration.
Based in Manila, ADB is owned by 67 members, including 48 from the region. Its maininstruments for helping its developing member countries are policy dialogue, loans, equityinvestments, guarantees, grants, and technical assistance.
Asian Development Bank6 ADB Avenue, Mandaluyong City1550 Metro Manila, Philippineswww.adb.org Printed in the Philippines