ashrae prediction is better than cure – cfd simulation for data center operation
TRANSCRIPT
Future Facilities Ltd.
Prediction Is Better Than Cure
– CFD Simulation For Data
Center Operation. This paper was written to support/reflect a seminar presented at
ASHRAE Winter meeting 2014, January 21st, by Mark Seymour, Future
Facilities.
Mark Seymour
1/21/2014

Table of Contents
Introduction ........................................................................................................................................... 1
Why Do Data Centers Fail to Achieve The Design Goals? ............................................................. 3
Figure 1. Room Filled with Notional Equipment to Reflect Design Assumptions ........................... 3
Figure 2. Uniform Load: All Cabinets 4.25kW / Cabinet (408kW total) .......................................... 4
Figure 3. Uniform Airflow Requirement 240l/s/cabinet (23m3/s total) ......................................... 4
Figure 4. All IT Equipment Operates In the ASHRAE Temperature Compliance Recommended
Range .............................................................................................................................................. 4
Figure 5. Typical Enterprise Varied Equipment Configuration........................................................ 5
Figure 6. Cabinet Loads Vary from 0kW to 13.2kW ........................................................................ 5
Figure 7. ASHRAE Temperature Compliance Is Not Achieved For Varied Equipment .................... 6
Do Core DCIM Tools Address This Loss In Performance? ............................................................ 7
Prediction Is Better Than Cure ........................................................................................................... 8
Simplifications In The Modeling Toolset ...................................................................................... 8
Figure 8. Small Datacom Hall with 8x No. 5kW Cabinets ................................................................ 8
Figure 9. Comparison of Elevation of Temperature In Cold Aisle ........................................... 9
Figure 10. Flow in the Raised Floor Predicted by RANS CFD (Left) and PFM CFD (Right)9
Figure 11. Flow from In-Row Coolers Predicted by RANS CFD (Left) and PFM CFD
(Right) .......................................................................................................................................... 10
Simplifications/Assumptions When Creating the Model......................................................... 10
Figure 12. Temperatures When 1U Server Are Above Blade Center ..................................... 12
Figure 13. Temperatures When 1U Server Are Below Blade Center ..................................... 12
Modeling for Operation ..................................................................................................................... 13
In Conclusion ...................................................................................................................................... 14
Mark Seymour Future Facilities Ltd.
Page 1
Introduction
Advancing technology has brought us more powerful computer hardware for our data
centers. In addition, it brings the opportunity to instrument and monitor the Datacom halls
to better understand where the IT load is and the resulting environment, at least in terms of
air temperature at an array of selected locations.
Instrumentation and monitoring is, without doubt, a step forward that helps the operator in
their quest to understand and control energy use of their undoubtedly complicated asset.
But is measurement enough?
Data center operators typically populate their white space slowly over time. They do so
assuming that the design intent (characterised by very high level parameters such as Total
IT kW and IT kW/cabinet or IT kW/sqft) is always valid.
The problem with this assumption is that it does not reflect the reality of the operational
configurations that will exist in the future. In essence, a data center designer has a
challenging task – to design:
The infrastructure for a room of unknown and varying electronics
With unknown and varying load
To be placed in an ill-defined climate – the local climate varying throughout the
year.
So, the designer can only consider:
A range of design scenarios for simplified configurations e.g. Day 1 50%, 100%,
using generic assumed loads and selected ambient conditions
A range of failure scenarios to check the design is resilient in the event of the
unexpected
One thing we know is this: the configurations considered by the designer are unlikely ever
to occur in practice!
This is not to say that CFD used in design to assess the design in relation based on these
assumptions is futile. On the contrary, such an assessment is the key to checking, selecting
and optimising the underlying concepts and strategies.
Further, it allows sensitivity studies for variations in IT load density, IT equipment type and
configuration… in order to avoid design flaws that are subsequently exposed by small
deviations from the design assumptions during operation. However, such design
Mark Seymour Future Facilities Ltd.
Page 2
assessment can never be considered a true prediction, because the configurations that will
occur over time will be unique to that facility and probably to a particular day.
Given that these conceptual design simulations do not cannot guarantee performance in
normal operation, are the advances in measurement and monitoring the saving grace?

Mark Seymour Future Facilities Ltd.
Page 3
Why Do Data Centers Fail to Achieve The Design Goals?
First, we must answer the question: what factors cause the data a center to fail?
We have discussed that configurations may vary. Consider a room cooled by perimeter
down-flow units supplying air via a raised floor to contained cold aisles. In a design
scenario, the room with uniformly loaded racks/cabinets might look something like that
shown in Figure 1.
Figure 1. Room Filled with Notional Equipment to Reflect Design Assumptions
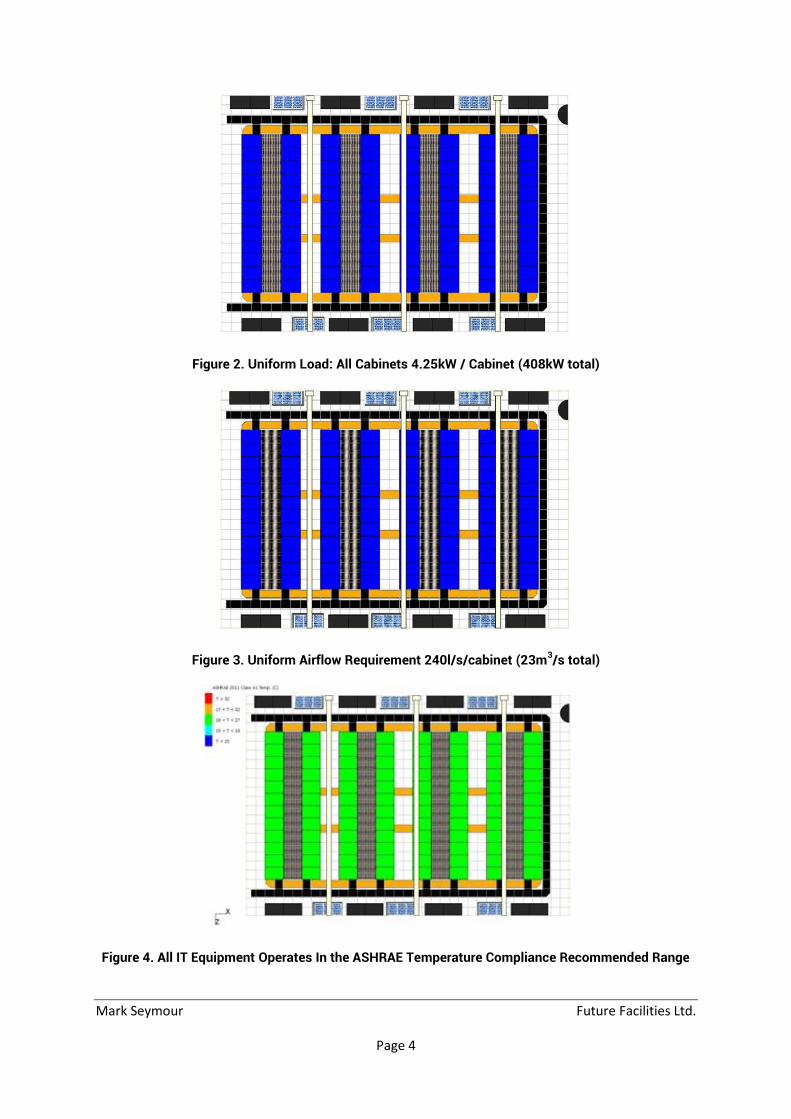
The design assumption is that the power distribution and heat production in the room is
uniform, Figure 2 (p.4). Similarly, the assumption is that the airflow requirement of the IT
equipment is uniform, Figure 3 (p.4).
A design scenario CFD simulation is run to determine whether sufficient cooling is delivered
to each item of IT equipment, given a specified cooling capacity and control scenario. One
way of measuring whether there sufficient cooling for the IT equipment is to look at the
ASHRAE Temperature Compliance to see if the conditions fall within the recommended
range during normal operation. For the above scenario, the design cooling strategy
achieves conditions for all equipment that satisfy ASHRAE temperature compliance for
normal operation, as indicated by the cabinets being colored green, Figure 4 (p.4).
Mark Seymour Future Facilities Ltd.
Page 4
Figure 2. Uniform Load: All Cabinets 4.25kW / Cabinet (408kW total)
Figure 3. Uniform Airflow Requirement 240l/s/cabinet (23m3/s total)
Figure 4. All IT Equipment Operates In the ASHRAE Temperature Compliance Recommended Range
Mark Seymour Future Facilities Ltd.
Page 5
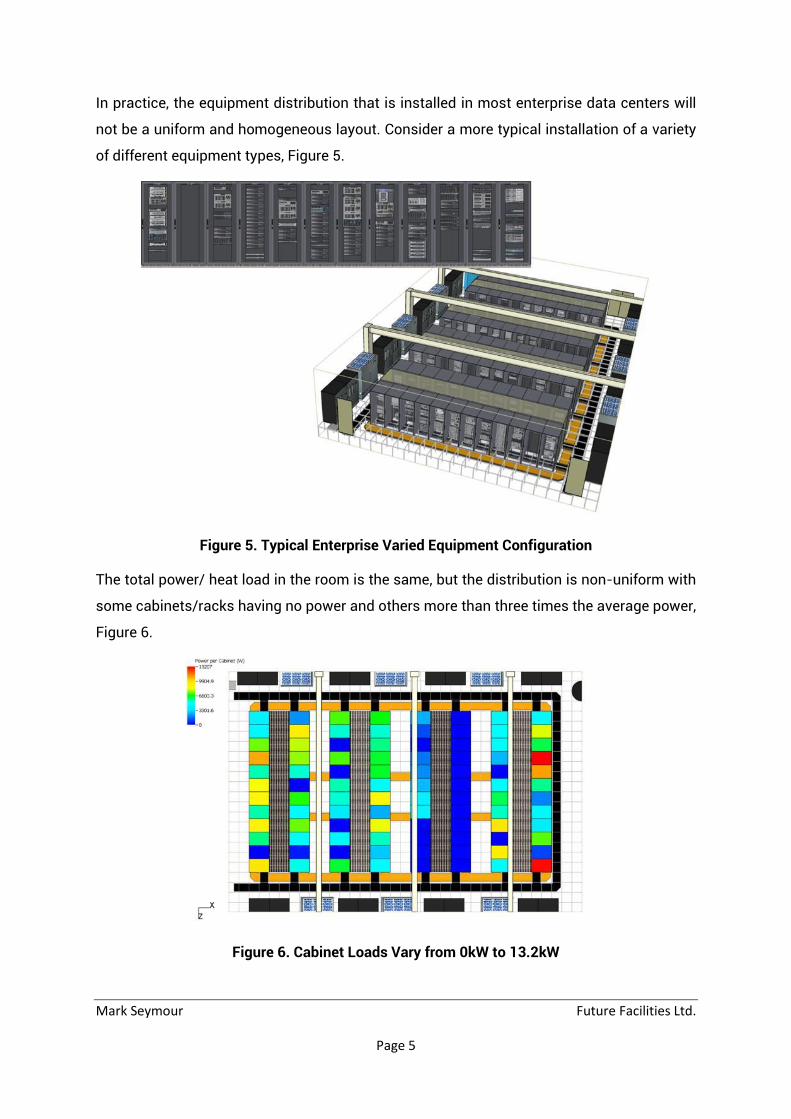
In practice, the equipment distribution that is installed in most enterprise data centers will
not be a uniform and homogeneous layout. Consider a more typical installation of a variety
of different equipment types, Figure 5.
Figure 5. Typical Enterprise Varied Equipment Configuration
The total power/ heat load in the room is the same, but the distribution is non-uniform with
some cabinets/racks having no power and others more than three times the average power,
Figure 6.
Figure 6. Cabinet Loads Vary from 0kW to 13.2kW
Mark Seymour Future Facilities Ltd.
Page 6
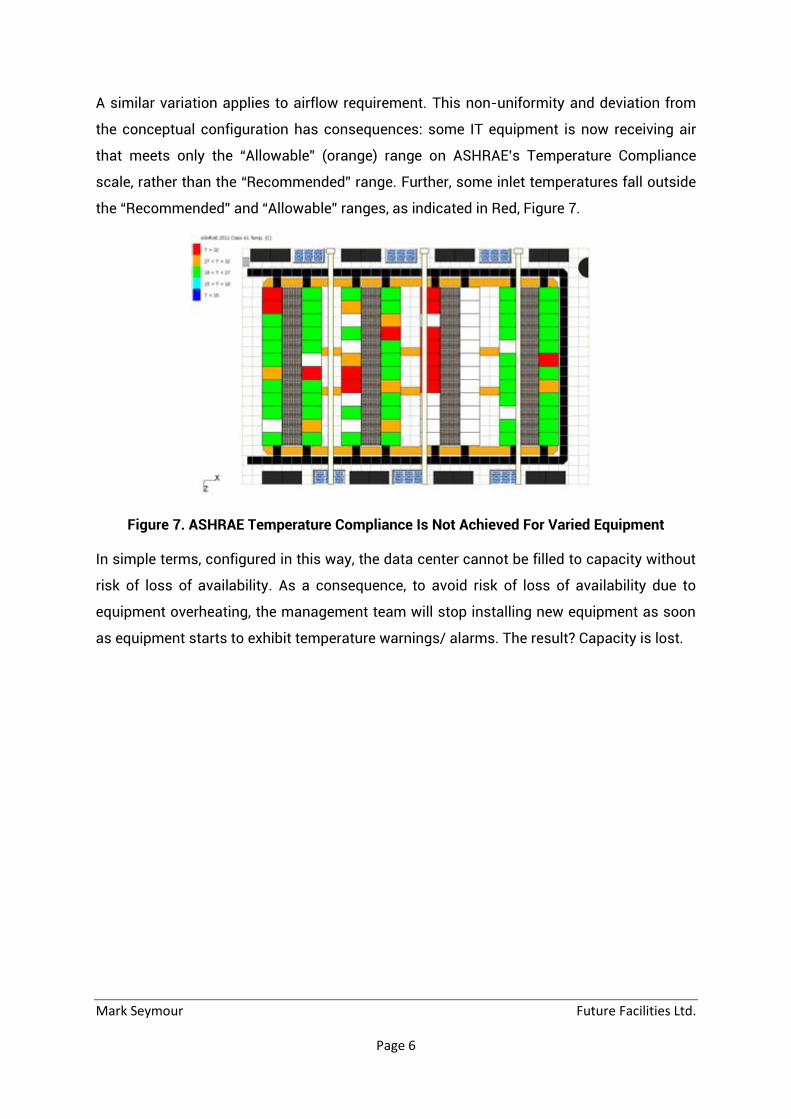
A similar variation applies to airflow requirement. This non-uniformity and deviation from
the conceptual configuration has consequences: some IT equipment is now receiving air
that meets only the “Allowable” (orange) range on ASHRAE’s Temperature Compliance
scale, rather than the “Recommended” range. Further, some inlet temperatures fall outside
the “Recommended” and “Allowable” ranges, as indicated in Red, Figure 7.
Figure 7. ASHRAE Temperature Compliance Is Not Achieved For Varied Equipment
In simple terms, configured in this way, the data center cannot be filled to capacity without
risk of loss of availability. As a consequence, to avoid risk of loss of availability due to
equipment overheating, the management team will stop installing new equipment as soon
as equipment starts to exhibit temperature warnings/ alarms. The result? Capacity is lost.
Mark Seymour Future Facilities Ltd.
Page 7
Do Core DCIM Tools Address This Loss In Performance?
In reality, many enterprise-scale data centers undergo changes on a daily basis and the
impact of change can result in equipment being put at risk in the way described. To
manage these frequent changes to complex modern datacom environments the industry
has turned to Data Center Infrastructure Management, or DCIM for short.
A key aspect of DCIM is to include monitoring. The monitoring systems are becoming more
prolific largely because of improvements in price, availability and better access to the data
they provide. The data is used to provide specific alarms, but also it provides views of
power and temperature throughout the IT hall.
While some temperature data is given for the IT inlets (IT is what you really care about),
many systems have sensors at locations other than the inlets to the IT equipment. In such
a configuration, the sensors will not necessarily indicate there is a problem at all. For
example, when recirculation is the source of overheating and the limited number of sensors
means that sensors are not included in the recirculation path, no alarm may ever be issued.
Perhaps much more importantly (even if every inlet were monitored), is the fact that the
data provided by sensors can only tell you what is happening now or what has happened in
the past. But, critically, it does not tell you what will happen in the future when you make
your next installation. In practice, the fact that equipment already installed is cool is no
guarantee that there is sufficient air to cool new equipment. In simple terms, core DCIM
tools such as monitoring simply look at the past or the present and NOT the future.
Perhaps worse still, it is also quite often the case that when a new installation is made the
adverse effect may be on items of IT equipment in another location entirely. As a result,
previously installed IT equipment that has been operating satisfactorily may suddenly be
adversely affected.
Without any foresight, the first signs of this are seen in the form of equipment alarms
indicating that the environment they are experiencing is close to limits for hardware use. In
fact, many data centers start to see thermal alarms from the IT equipment as early in their
life as 60-70% of the design capacity. In order to avoid this lost capacity deployment
decisions need to be assessed in terms of their future impact.

Mark Seymour Future Facilities Ltd.
Page 8
Prediction Is Better Than Cure
Given that strategic measurements indicate the symptoms, that is they look backwards not
forwards, the obvious way is to use the same simulation tools used in design – CFD
simulation – for the operational configuration.an extension to the design.
The difference now is that, unlike the design scenario where CFD is used to model
conceptual configurations, the model must now consider the actual configurations allowing
for the as-built facility, infrastructure, the IT systems, and the deployment practices
actually in use.
The use of simulation represents the only practical way to predict the likely performance,
short of building a mock-up or installing the equipment in test mode in the real facility.
However, it is important to realise that the model must not only use the real equipment in
the chosen locations, but must also reflect the actual installation and practices.
When using CFD as a prediction tool in operation, there are many details that if ignored may
lead you to the wrong deployment decision. These fall into two categories:
1. Simplifications in the modeling toolset
2. Simplifications/assumptions when creating the model
Simplifications In The Modeling Toolset
Given the computational expense of traditional CFD tools, it is tempting to identify elements
of the physics that can be ignored and thus simplify and speed up the simulation process.
Consider a small equipment room, Figure 8.
Figure 8. Small Datacom Hall with 8x No. 5kW Cabinets
The room is cooled by a perimeter down flow unit distributing cool air via a raised floor
plenum to two short rows of 5kW cabinets. The simulation was performed with and without
Mark Seymour Future Facilities Ltd.
Page 9
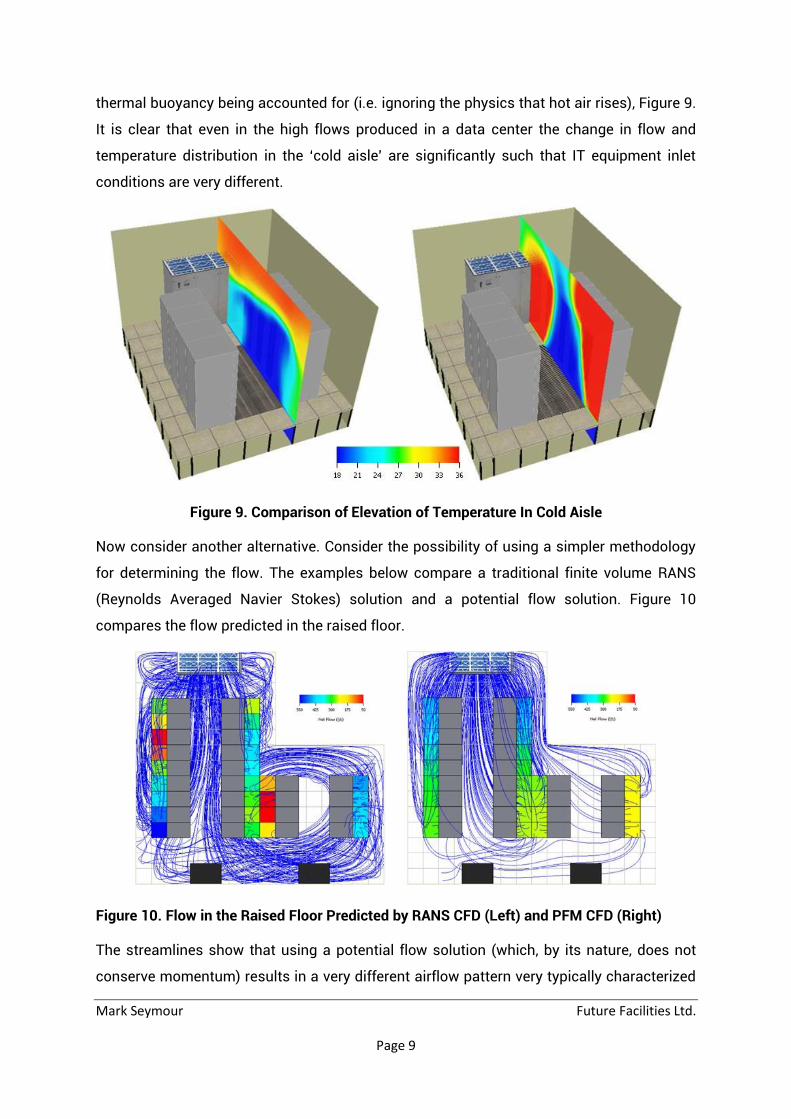
thermal buoyancy being accounted for (i.e. ignoring the physics that hot air rises), Figure 9.
It is clear that even in the high flows produced in a data center the change in flow and
temperature distribution in the ‘cold aisle’ are significantly such that IT equipment inlet
conditions are very different.
Figure 9. Comparison of Elevation of Temperature In Cold Aisle
Now consider another alternative. Consider the possibility of using a simpler methodology
for determining the flow. The examples below compare a traditional finite volume RANS
(Reynolds Averaged Navier Stokes) solution and a potential flow solution. Figure 10
compares the flow predicted in the raised floor.
Figure 10. Flow in the Raised Floor Predicted by RANS CFD (Left) and PFM CFD (Right)
The streamlines show that using a potential flow solution (which, by its nature, does not
conserve momentum) results in a very different airflow pattern very typically characterized
Mark Seymour Future Facilities Ltd.
Page 10
by a lack of recirculation or separation in the flow. This results in a very different airflow
distribution through the perforated tiles.
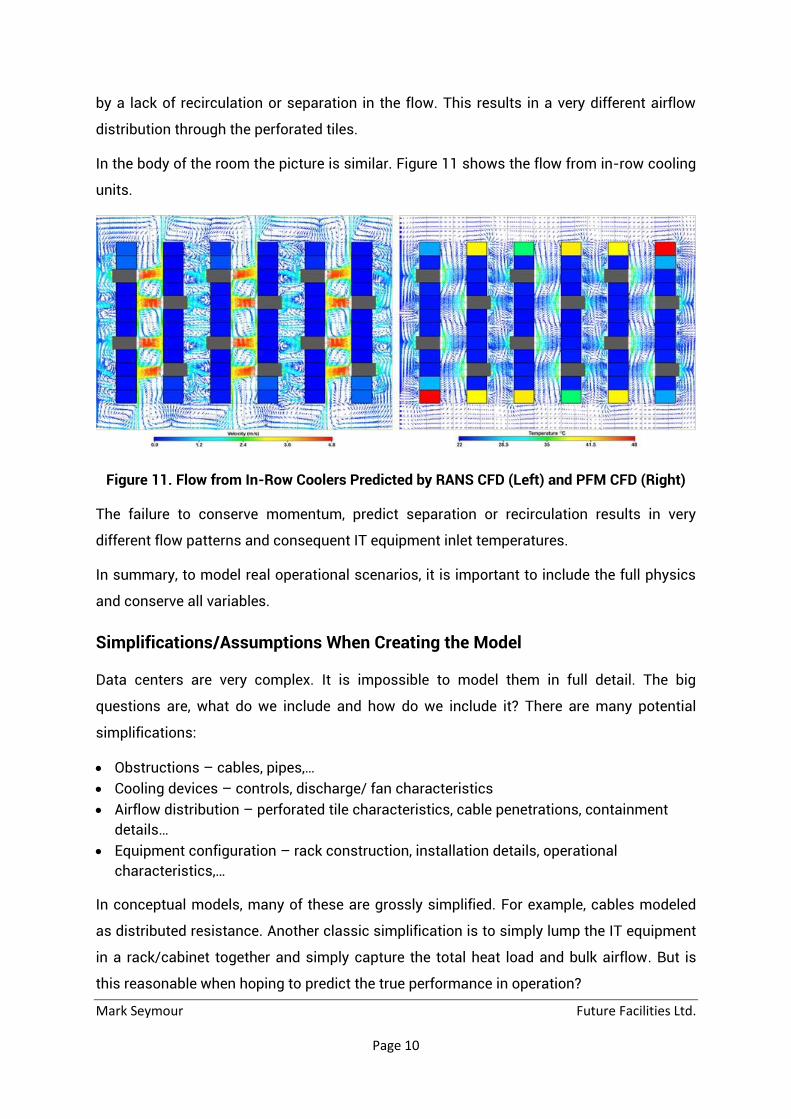
In the body of the room the picture is similar. Figure 11 shows the flow from in-row cooling
units.
Figure 11. Flow from In-Row Coolers Predicted by RANS CFD (Left) and PFM CFD (Right)
The failure to conserve momentum, predict separation or recirculation results in very
different flow patterns and consequent IT equipment inlet temperatures.
In summary, to model real operational scenarios, it is important to include the full physics
and conserve all variables.
Simplifications/Assumptions When Creating the Model
Data centers are very complex. It is impossible to model them in full detail. The big
questions are, what do we include and how do we include it? There are many potential
simplifications:
Obstructions – cables, pipes,…
Cooling devices – controls, discharge/ fan characteristics
Airflow distribution – perforated tile characteristics, cable penetrations, containment
details…
Equipment configuration – rack construction, installation details, operational
characteristics,…
In conceptual models, many of these are grossly simplified. For example, cables modeled
as distributed resistance. Another classic simplification is to simply lump the IT equipment
in a rack/cabinet together and simply capture the total heat load and bulk airflow. But is
this reasonable when hoping to predict the true performance in operation?

Mark Seymour Future Facilities Ltd.
Page 11
Consider a rack/cabinet which is to have a blade center and three 1U servers installed.
Does it matter how the two equipment types are installed in this cabinet?
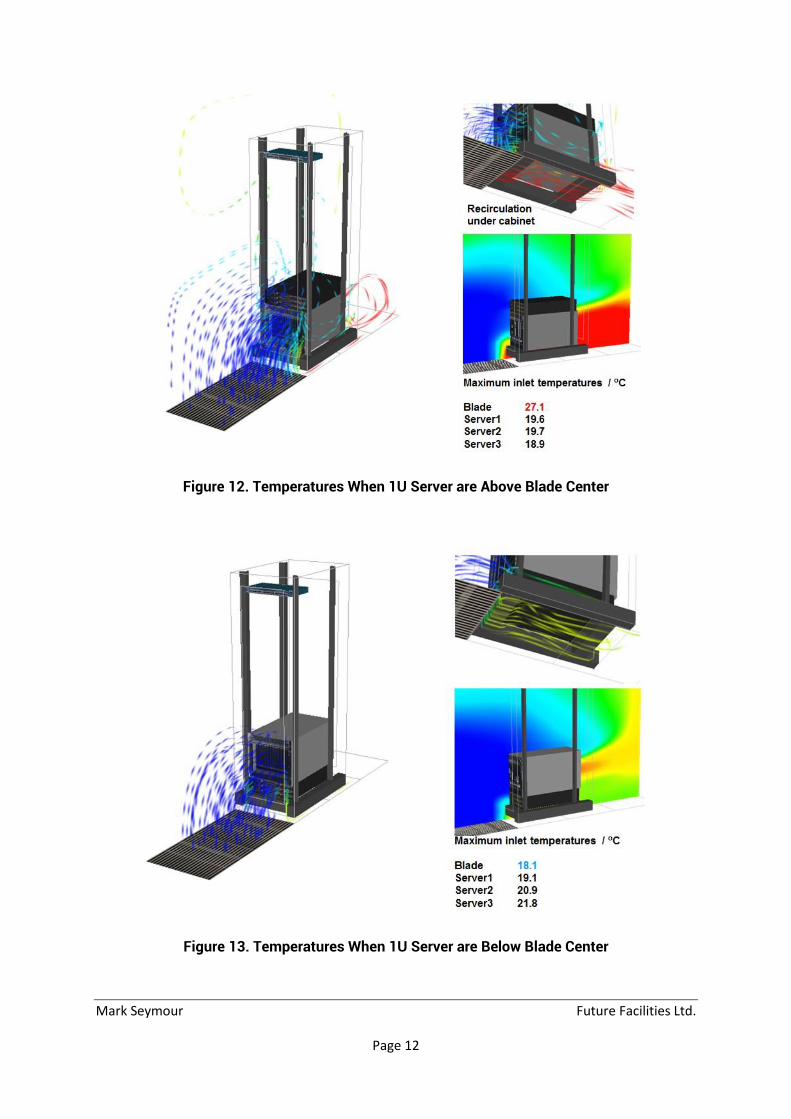
Option 1 – Three 1U servers placed on top of a blade center, Figure 12 (p.12). The
configuration is poorly blanked and hot air recirculates under the blade center. This results
in recirculated air that is over 27°C entering the IT equipment inlets.
Option 2 - The alternative is to install the 1U servers at the bottom with the blade center
above, Figure 13 (p.12). In this configuration, while the there is still recirculation, the
temperature of the recirculated air is less than 22°C. Clearly, using a simplified model
cannot capture both conditions – the detail is essential.
Mark Seymour Future Facilities Ltd.
Page 12
Figure 12. Temperatures When 1U Server are Above Blade Center
Figure 13. Temperatures When 1U Server are Below Blade Center

Mark Seymour Future Facilities Ltd.
Page 13
Modeling for Operation
So, when we use CFD for operational deployment decisions, it is critical that we must:
Ensure the model includes the key details
Survey/monitor the facility to check the model (modern monitoring lends itself to more
frequent checking) i.e. perform a calibration
Check if the model reflects reality sufficiently for engineering decisions. If it does not, we
MUST review and update the model to complete the calibration
Calibration is the process of measuring/monitoring in the data center to ensure that the
modelling simplifications adopted still allow the model to predict reality.
The calibration process warrants a separate document to fully describe it and so is not fully
documented here. However, for the purpose of this paper it is sufficient to recognise that
the calibration process is not a matter of actions like fixing grille flows to measured data
settings rather than predicting them, or any similar artificial adjustments of the model.
To make such adjustments fundamentally flaws the predictive methodology, since by fixing
the flows, the consequences of any change to the configuration can no longer be predicted
for any other scenario where the flow may vary.
Calibration is instead the use of the measured/monitored data to establish whether, or not,
the model of the current configuration predicts reality sufficiently accurately to be
confident it is an adequate reference model to use as a basis to consider future changes to
the installation. If it does not, the measured/monitored data can be used as indicator of
where to look refine the model representation to capture the necessary physics.
Once calibrated, the model can be used to test impact of new deployments in order to
check the impact on Availability, Capacity and Efficiency.
Mark Seymour Future Facilities Ltd.
Page 14
In Conclusion
Data centers are prone to losing capacity compared with design because no design can
allow for the infinite number of potential installations;
Sufficient detail for successful calibration must be added for effective operational
predictive modeling;
Predictive modeling can and should be used to avoid availability, capacity and efficiency
losses alongside traditional DCIM.