asfandyar qureshi (mit) rick weber (akamai) hari balakrishnan (mit) john guttag (mit) bruce maggs...
Post on 21-Dec-2015
216 views
TRANSCRIPT

Asfandyar Qureshi (MIT)Rick Weber (Akamai)Hari Balakrishnan (MIT)John Guttag (MIT)Bruce Maggs (Duke/Akamai)
cutting the electric bill for internet-scale systems
Éole @ flickr

2
context: massive systems
Qureshi • SIGCOMM • August 2009 • Barcelona • Spain
Google:estimated map
tens of locations in the US
>0.5M servers
major data center
othersthousands of servers / multiple locationsAmazon, Yahoo!, Microsoft, AkamaiBank of America (≈50 locations), Reuters
3
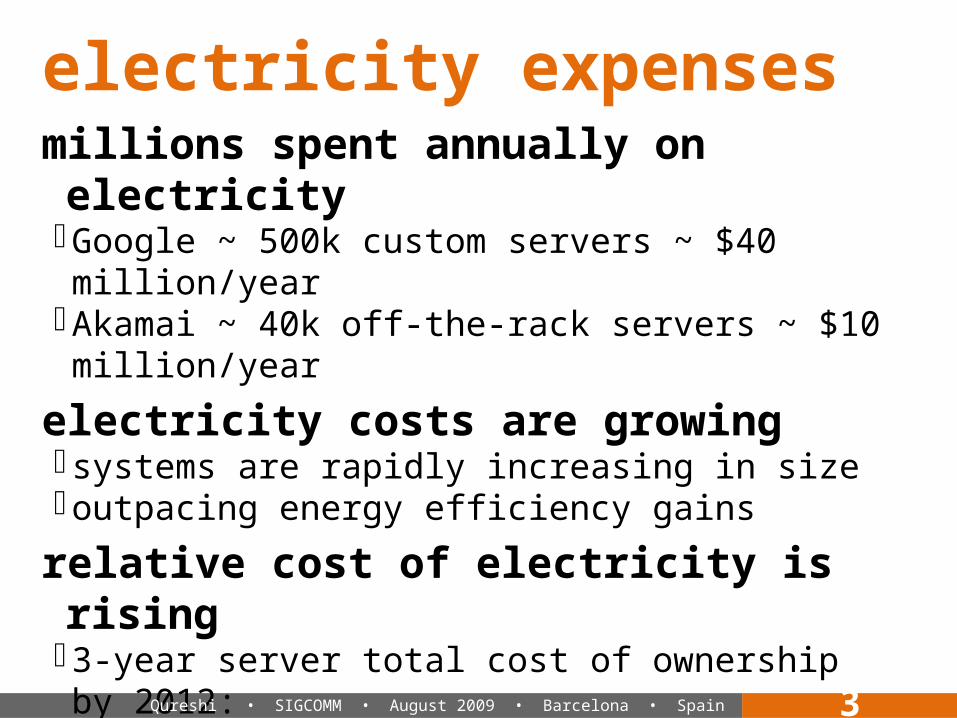
electricity expensesmillions spent annually on electricityGoogle ~ 500k custom servers ~ $40 million/year
Akamai ~ 40k off-the-rack servers ~ $10 million/year
electricity costs are growingsystems are rapidly increasing in sizeoutpacing energy efficiency gains
relative cost of electricity is rising3-year server total cost of ownership by 2012: › electricity ≈ 2 × hardware
bandwidth prices are fallingQureshi • SIGCOMM • August 2009 • Barcelona • Spain
4
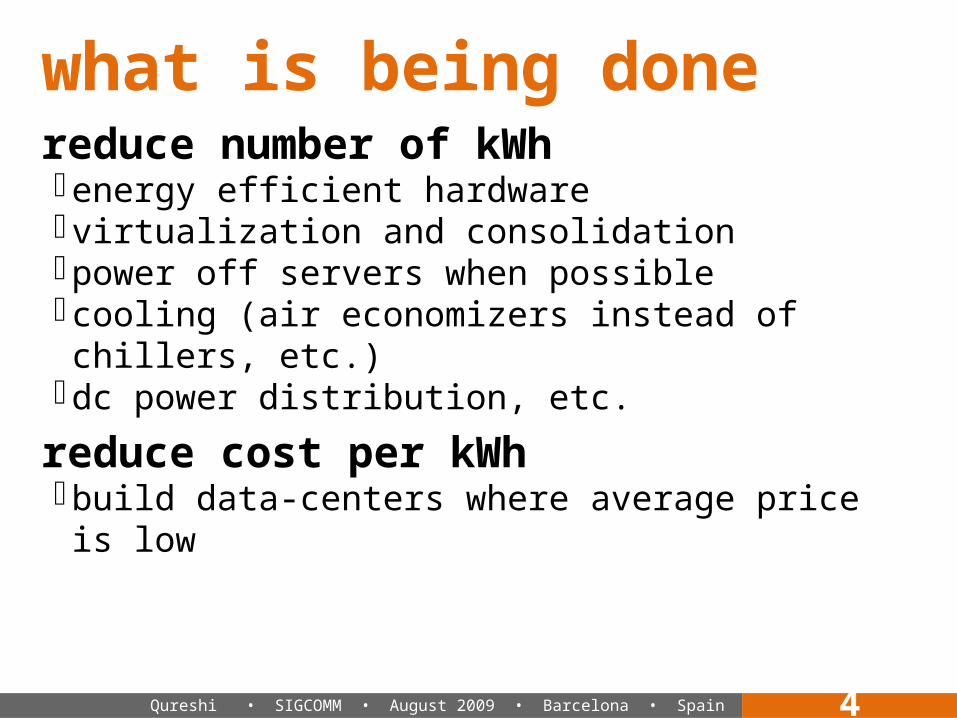
what is being donereduce number of kWhenergy efficient hardwarevirtualization and consolidationpower off servers when possiblecooling (air economizers instead of chillers, etc.)
dc power distribution, etc.
reduce cost per kWhbuild data-centers where average price is low
Qureshi • SIGCOMM • August 2009 • Barcelona • Spain

5
our proposalexploit electricity market dynamicsgeographically uncorrelated price volatilitymonitor real-time market prices and adapt request routing
skew load across clusters based on prices leverage service replication and spare capacity
adapting to real-time prices is a new idea…complementary to energy efficiency work
Qureshi • SIGCOMM • August 2009 • Barcelona • Spain

6
exploiting price volatility
Qureshi • SIGCOMM • August 2009 • Barcelona • Spain
0
25
50
75
100Virgini
aCalifornia
Illinois
RT m
ark
et
pri
ce $
/MW
h
time (hours)
day one day two day three
locational pricing not well correlated CA-VA correlation
≈ 0.2
hourly variation peaks ~
$350/MWh negative prices
3 of the largest data center markets

7
exploiting price volatility
Qureshi • SIGCOMM • August 2009 • Barcelona • Spain
0
25
50
75
100Californi
a
RT m
ark
et
pri
ce $
/MW
h
time (hours)
day one day two day three
Virginia
California has min.
priceVirginia has min. price
8
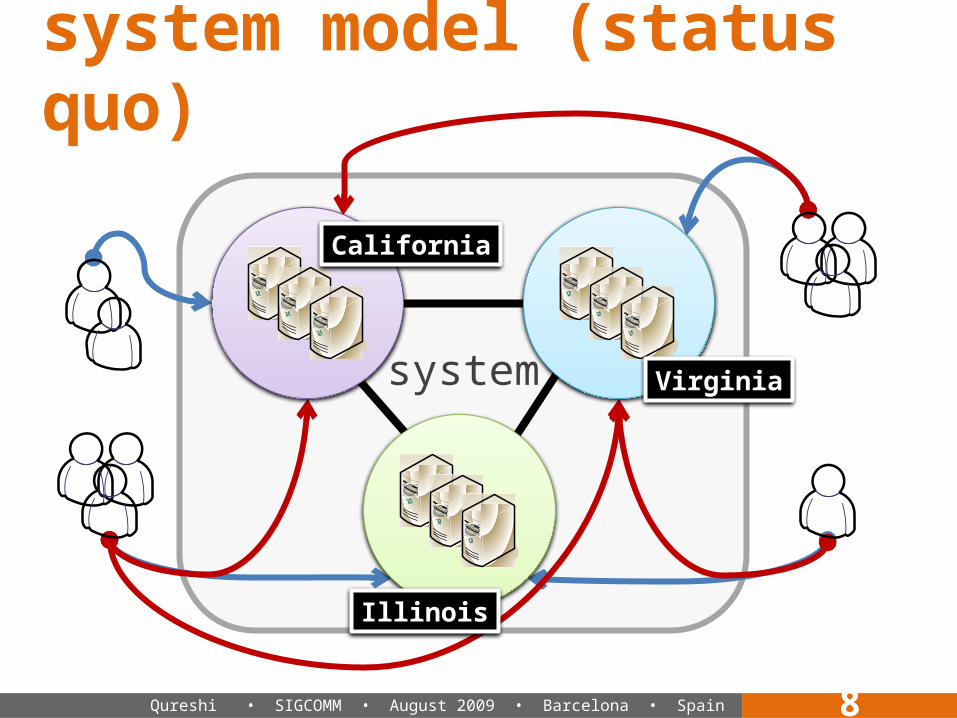
system model (status quo)
Qureshi • SIGCOMM • August 2009 • Barcelona • Spain
California
Virginia
Illinois
system

9
electricity prices
(hourly)
request routing framework
Qureshi • SIGCOMM • August 2009 • Barcelona • Spain
performance
aware routingrequests
bandwidth price model
network topology
latency goals
capacity constraint
s
best-price performanc
e aware routing
map:requests
to locations

will our proposal work?
will our proposal work?does electricity usage depend on server load?how much can we reduce a location’s electricity consumption by routing clients away from it?
will our proposal work?does electricity usage depend on server load?
latency concernshow far away from a client is the cheap energy?
will our proposal work?does electricity usage depend on server load?
latency concernsbandwidth costs could risecheaper electricity ~ more expensive bandwidth?

will our proposal work?does electricity usage depend on server load?
latency concernsbandwidth costs could riseis there enough spare capacity?

how much can we save by exploiting price volatility? today: large companies more than $1M/year with better technology: more than $10M/year better than placing all servers in cheapest market

16
generality of resultsAkamai-specific inputsclient workloadgeographic server distribution (25 cities / non-uniform)
capacity & bandwidth constraints
results should apply to other systems realistic client workload› 2000 content providers› hundreds of billions of requests per day
realistic server distribution› better than speculating…
Qureshi • SIGCOMM • August 2009 • Barcelona • Spain
17
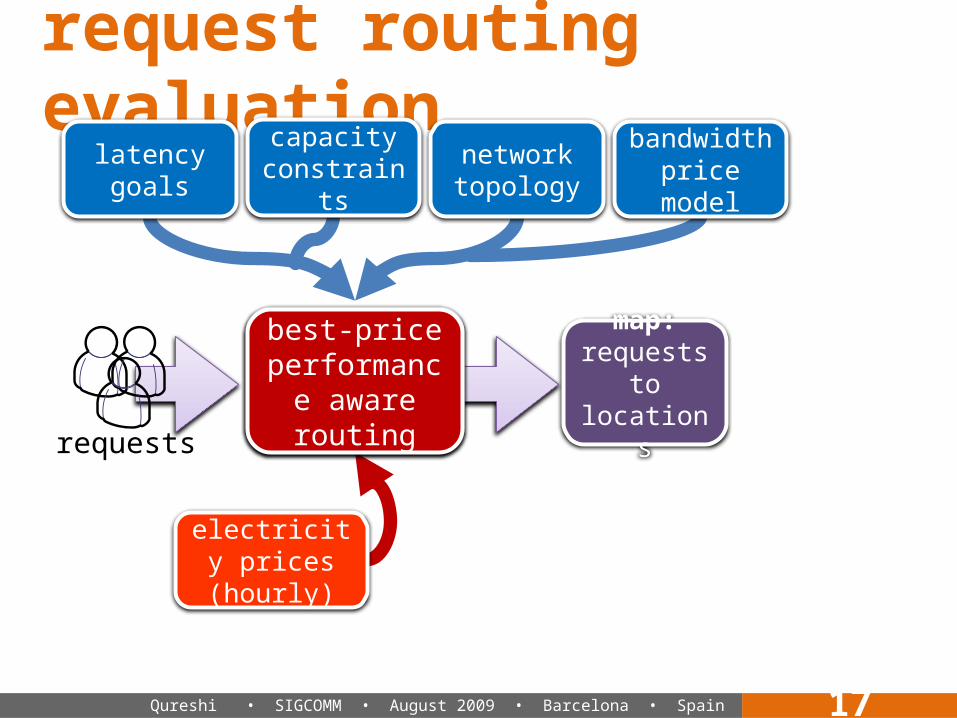
electricity prices
(hourly)
request routing evaluation
Qureshi • SIGCOMM • August 2009 • Barcelona • Spain
performance
aware routingrequests
bandwidth price model
network topology
latency goals
capacity constraint
s
best-price performanc
e aware routing
map:requests
to locations
18
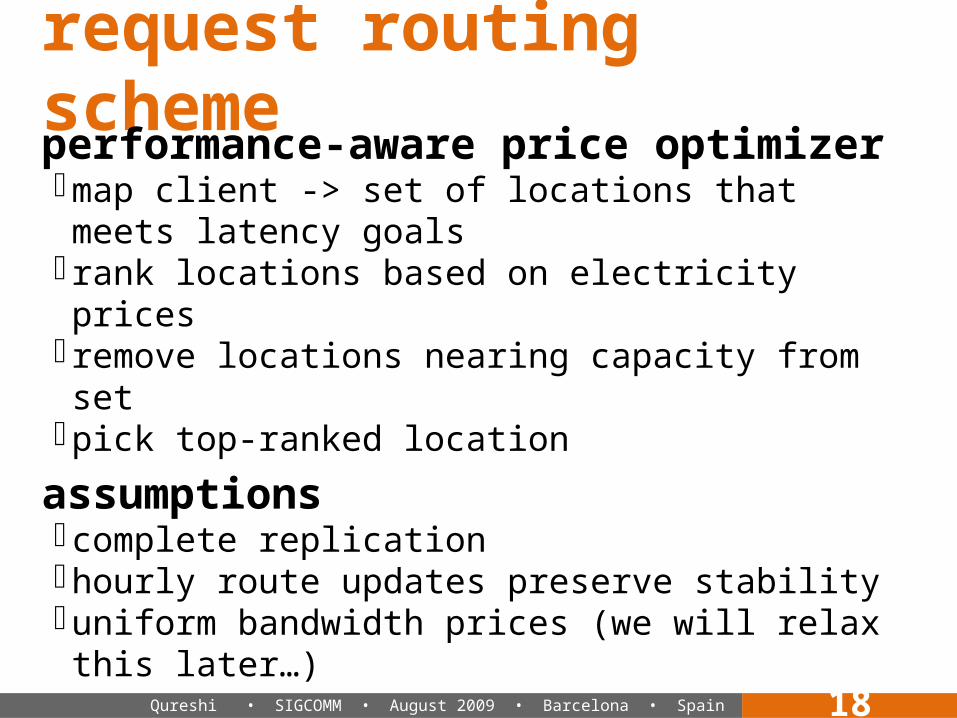
request routing schemeperformance-aware price optimizermap client -> set of locations that meets latency goals
rank locations based on electricity prices remove locations nearing capacity from setpick top-ranked location
assumptionscomplete replicationhourly route updates preserve stabilityuniform bandwidth prices (we will relax this later…)
Qureshi • SIGCOMM • August 2009 • Barcelona • Spain
19
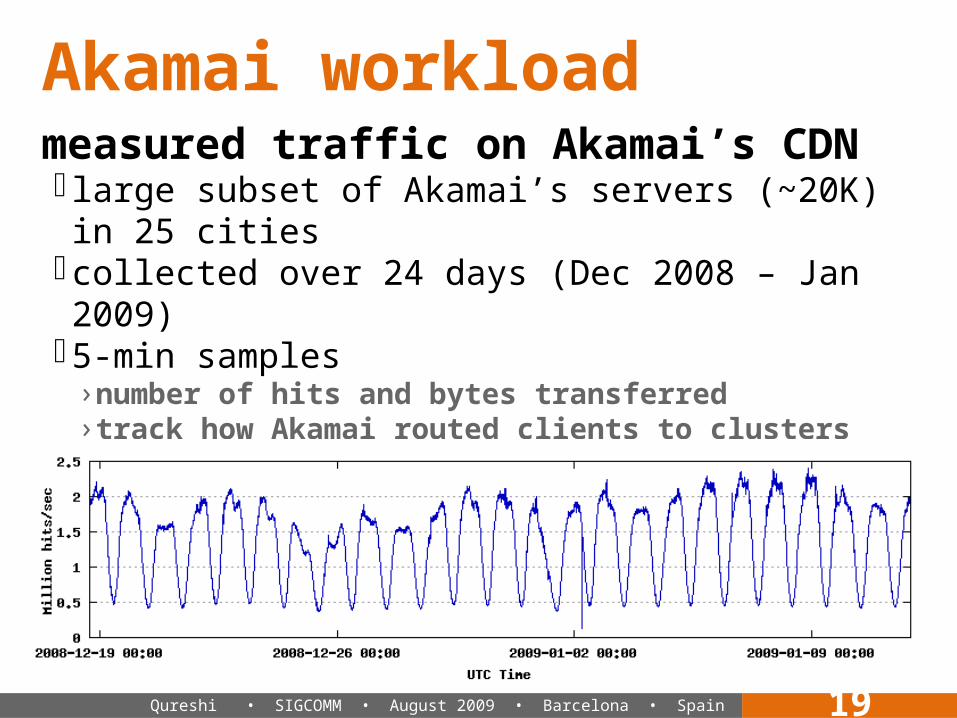
Akamai workloadmeasured traffic on Akamai’s CDN large subset of Akamai’s servers (~20K) in 25 cities
collected over 24 days (Dec 2008 – Jan 2009)5-min samples› number of hits and bytes transferred› track how Akamai routed clients to clusters› group clients by origin state
also derived a synthetic workload
Qureshi • SIGCOMM • August 2009 • Barcelona • Spain

20
electricity pricesextensive survey of US electricity markets regional wholesale markets (both futures and spot)
nature and causes of price volatility (see paper…)
data collection39 months worth of historical hourly prices› January 2006 through March 2009
6 different regional wholesale markets30 locations
Qureshi • SIGCOMM • August 2009 • Barcelona • Spain

21
energy model
electricity prices
(hourly)
request routing evaluation
Qureshi • SIGCOMM • August 2009 • Barcelona • Spain
performance
aware routingrequests
bandwidth price model
network topology
latency goals
capacity constraint
s
best-price performanc
e aware routing
map:requests
to locations
electricity cost
estimator
22
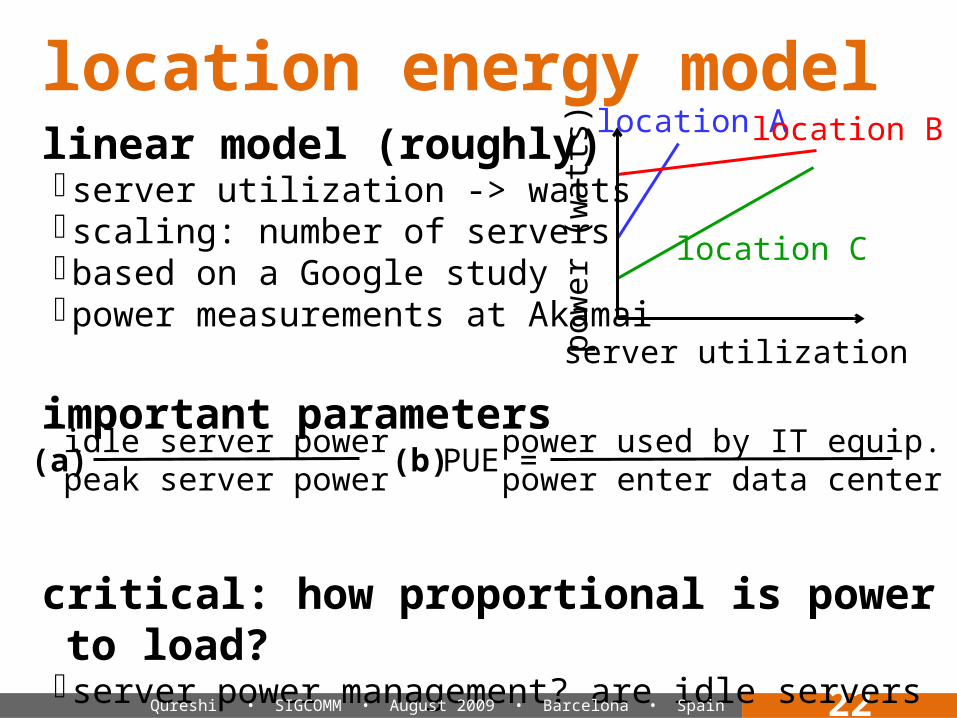
location energy modellinear model (roughly)server utilization -> wattsscaling: number of serversbased on a Google studypower measurements at Akamai
important parameters
critical: how proportional is power to load?server power management? are idle servers turned off?
the ‘energy elasticity’ of the systemQureshi • SIGCOMM • August 2009 • Barcelona • Spain
(a) (b)idle server power
peak server powerpower used by IT equip.power enter data center
PUE =
server utilization
pow
er
(watt
s) location A
location C
location B

23
importance of elasticity
Qureshi • SIGCOMM • August 2009 • Barcelona • Spain
increasing energy proportionality
savin
gs (
%)
energy model parameters
0
10
20
30
40
idle: PUE:
off the rackserve
rs
$1M+
3%
circa 2008
$2M5%
2011 PUE &
active
server
scaling
$3M+
8%
65% 65% 33% 33% 25% 0% 0%2.0 1.3 1.7 1.3 1.3 1.1 1.0
for each energy model: simulate price-aware routing simulate Akamai routing calculate 24-day savings

24
bandwidth costsare we increasing bandwidth costs?problematic: bandwidth prices are proprietary
uniform bandwidth price modelfixed cost per bit regardless of time and place
95/5 bandwidth pricing modelprices set per network portnetwork traffic is divided into 5-minute windows95th percentile of traffic is used for billing
approach: 95th percentiles from Akamai dataconstrain routing so that 95th percentiles are unchanged
Akamai’s routing factors in bandwidth prices…Qureshi • SIGCOMM • August 2009 • Barcelona • Spain

25
bandwidth constraints
Qureshi • SIGCOMM • August 2009 • Barcelona • Spain
increasing energy proportionality
savin
gs (
%)
energy model parameters
idle: PUE:
65% 65% 33% 33% 25% 0% 0%2.0 1.3 1.7 1.3 1.3 1.1 1.0
0
10
20
30
40
Uniform BW pricing
joint bandwidth/price opt?
26
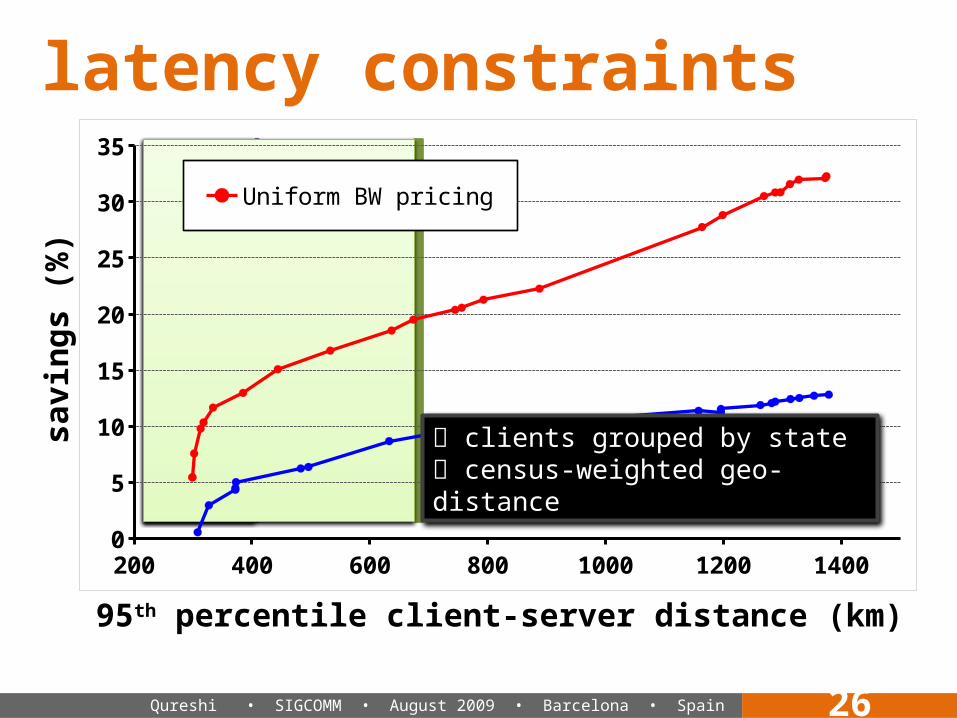
latency constraints
Qureshi • SIGCOMM • August 2009 • Barcelona • Spain
savin
gs (
%)
95th percentile client-server distance (km)
200 400 600 800 1000 1200 14000
5
10
15
20
25
30
35
Uniform BW pricing
clients grouped by state census-weighted geo-distance
27
practical implicationswho can use this approach?servers in multiple locationssome energy proportionality
complicationselectric billing based on peak powerwe need prices w/ time-varying uncorrelated volatility› e.g., wholesale market prices in the US
current energy sector trends are favorable
Qureshi • SIGCOMM • August 2009 • Barcelona • Spain
28
conclusionsignificant value in price volatility large systems today: save more $1M/year increased energy elasticity: more than $10M/year
required mechanism already mostly in placeminimal incremental changes required integrate real-time market information
extensionsother cost functions (carbon, NOx)other inputs (weather)active market participation (demand response, etc.) Qureshi • SIGCOMM • August 2009 • Barcelona • Spain


30
market diversity
Qureshi • SIGCOMM • August 2009 • Barcelona • Spain
1 2 3 4 5 6 720
25
30
35
40
45
50
Number of Regional Markets
Dyn
am
ic M
in.
Pri
ce