aset-lv4 user guide · science wares, inc. 87 hamlin ave · falmouth, ma 02540 508-457-4556 · fax...
TRANSCRIPT

SCIENCE WARES, INC.87 Hamlin Ave · Falmouth, MA 02540
508-457-4556 · Fax 508-445-0472www.sciencewares.com
ASET-LV4 User GuideSoftware Setup
ASET-LV4 is a LabView application that is typically supplied with an installer that installs the following components and drivers needed to run the program:
– LabView 2012 Run Time engine [12.0.3, or f3]– Measurement and Automation Explorer (NI-MAX) [5.3.1 / 4.6.2 ]– NI-DAQmx [9.5.5 / 9.1.1 ]– NI-IMAQ [4.7 / 4.4 ]– NI-IMAQdx [ 4.7 / 3.6 ]– NI-Motion [8.4 / 8.1 ]– NI-VISA [5.2 / 4.6.2 ]
The exact version of the National Instruments hardware drivers can vary. The first version shown in the brackets above is the version typically deployed by the supplied installer, the second version is the oldest version for which operation has been confirmed. This is different from the protocol for operating ASET for Windows, where it was important to make sure a specific version of hardware drivers was installed.
The NI-IMAQdx functions used for interfacing with DirectShow compatible USB, FireWire, and GigE cameras, as well as certain vision functions used for difference image analysis, require a NI-Vision Run Time License (NI part 778044-35) to be installed. A license for one computer is provided with ASET-LV4. Licenses for additional installations must be acquired separately.
The ASET-LV4 program reads many settings from the file ASET-LV4.ini, which is stored in the same folder as the ASET-LV4.exe file. The folder containing the ASET-LV4.ini file must have read and write permissions for the User accounts that will be using the program. Otherwise the ASET-LV4 program will not be able to save new values to the ASET-LV4.ini file for the configuration and operation parameters that control how the program operates.
Hardware Setup
The following hardware is needed for typical operation of the program:
NI-DAQmx compatible A/D card (eg PCI-6221, PCI-6229, PCIe-6323)NI-Motion compatible motion control card (eg PCI-7334, PCI-7344)IMAQ compatible imaging device, for example either of the following :
frame grabber (eg PCI-1411, PCI-1405, PCI-1424) IMAQdx license (NI part 778044-35) for USB, Firewire, or GigE camera
A typical device configuration tree in NI-MAX is as follows:
Page 1 of 43

SCIENCE WARES, INC.87 Hamlin Ave · Falmouth, MA 02540
508-457-4556 · Fax 508-445-0472www.sciencewares.com
ASET-LV4 User Guide
There are two DAQ boards in the above device configuration. Only one board is needed, but more than one board can be accessed by ASET-LV4 to perform various functions. The details of the DAQ card channel selection and wiring configuration are handled by settings in ASET-LV4.
The NI Motion Device provides step and direction signals to the motor driver, typically a CMC-4 from Applicable Electronics, LLC. For the most demanding applications the NI Motion Device can be set up to use encoder feedback to ensure that the motor position tracks the programmed position. In many cases the NI Motion Device can be used effectively in Open Loop Stepper mode, which is specified by selecting the device in the NI-MAX Devices and Interfaces tree and selecting the Open Loop Stepper mode on the Current Settings page.
Page 2 of 43

SCIENCE WARES, INC.87 Hamlin Ave · Falmouth, MA 02540
508-457-4556 · Fax 508-445-0472www.sciencewares.com
ASET-LV4 User Guide
If a USB, FireWire, or GigE imaging device will be used then it is important to install the device manufacturer's DirectShow drivers before looking for the device in NI-MAX. For uEye cameras from IDS Imaging, the latest drivers can be downloaded from http://www.ueyesetup.com. The NI-IMAQdx device list will include any imaging device with a DirectShow driver. It is important to note the name of the device that will be used, which is cam0 in the example below:
For some uEye cameras it is necessary to set the Vertical Mirror attribute. This is done as follows:
1. Open the NI-IMAQdx section of the Devices and Interfaces list2. Selecting the imaging device (ie cam0)3. Select 'All Attributes' in the View Options menu located just under the image window4. Scroll down in the list of attributes until the 'Vertical Mirror' option is visible, and set it
Page 3 of 43

SCIENCE WARES, INC.87 Hamlin Ave · Falmouth, MA 02540
508-457-4556 · Fax 508-445-0472www.sciencewares.com
ASET-LV4 User Guide
The camera setup should be verified in NI-MAX at this point by clicking on the button at the top of the middle pane of NI-MAX. An image should appear in the window, if it does not then the problem needs to be resolved before proceeding. Some older computers have trouble initializing the camera when the computer is first powered on. Updating the chipset drivers may solve the problem. In other cases, USB cameras with non-compliant drivers can corrupt the registry so the uEye camera will no longer be recognized.
A workaround that seems to provide consistent relief is to unplug the USB camera after starting the computer, wait 5 seconds, then reconnect the camera. This workaround should be done with NI-MAX and ASET-LV4 both closed. If that does not work, the following procedure should be tried:
1. Close NI-MAX and ASET-LV42. Unplug the uEye camera3. Open Windows Explorer and search for *.icd on the C: drive, normally the uEye camera
file will be found in the folder 'C:\Users\Public\Documents\National Instruments\NI-IMAQdx\Data'
Page 4 of 43

SCIENCE WARES, INC.87 Hamlin Ave · Falmouth, MA 02540
508-457-4556 · Fax 508-445-0472www.sciencewares.com
ASET-LV4 User Guide
4. Right click on the 'UI164xLE???.icd' file and select 'Open File Location'. Then select the 'UI164xLE???.icd' and 'cam0.iid' files and delete them.
5. Plug the uEye camera back in6. Start NI-MAX and confirm that a live video image can be displayed
Once the hardware has been installed and recognized in NI-MAX, it may be necessary to change some hardware settings in ASET-LV4. This is accomplished by starting the program, navigating to the Hardware page, making the necessary adjustments to the settings, and closing ASET-LV4
using the button. This will save the settings to the ASET-LV4.ini file so the hardware will be initialized properly next time the program is started. The basic settings on the Hardware page are described below.
The DAQ Setup page contains several pages that determine how the program acquires data from the sensors. There are three types of sensors presently supported:
1. Ion Selective Probe (ISP/PVP)2. Scanning Vibrating Electrode Technique (SVET)3. Optrode
There is a DAQ setup for each sensor type that provides a foundation for the Sensor setup (described in a separate secion) that is selected when an experiment is performed. The parameters specified in the Hardware setup include the sampling rate, input terminal configuration, and channels sampled.
Page 5 of 43

SCIENCE WARES, INC.87 Hamlin Ave · Falmouth, MA 02540
508-457-4556 · Fax 508-445-0472www.sciencewares.com
ASET-LV4 User Guide
Page 6 of 43

SCIENCE WARES, INC.87 Hamlin Ave · Falmouth, MA 02540
508-457-4556 · Fax 508-445-0472www.sciencewares.com
ASET-LV4 User Guide
Page 7 of 43

SCIENCE WARES, INC.87 Hamlin Ave · Falmouth, MA 02540
508-457-4556 · Fax 508-445-0472www.sciencewares.com
ASET-LV4 User Guide
Page 8 of 43
SCIENCE WARES, INC.87 Hamlin Ave · Falmouth, MA 02540
508-457-4556 · Fax 508-445-0472www.sciencewares.com
ASET-LV4 User Guide
Page 9 of 43

SCIENCE WARES, INC.87 Hamlin Ave · Falmouth, MA 02540
508-457-4556 · Fax 508-445-0472www.sciencewares.com
ASET-LV4 User Guide
Page 10 of 43

SCIENCE WARES, INC.87 Hamlin Ave · Falmouth, MA 02540
508-457-4556 · Fax 508-445-0472www.sciencewares.com
ASET-LV4 User Guide
After reviewing all the above settings, click and the settings will be written to the ASET-LV4.ini file.
Then restart ASER-LV4 and begin the final step of the hardware setup, which is to define the Optical Scales that will be used. Scales can be added or edited at any point during an experiment, but it is critical to have the correct scale defined and selected when running the program. Otherwise any program operations that show measurements superimposed on the image will be incorrect, and any operations that involve using a cursor to show a position on the image will be incorrect.
Defining Optical Scales
The Optical Scale defines the relationship between screen coordinates and position coordinates. The makes it possible to display sensor data as an overlay on top of images. It also enables use of the cursor to show the program position in an image, for example where a calibration source is located, where to make a reference measurement, where to start and end a scan, etc.
Before defining an optical scale, it is strongly recommended that the camera and motion system axes be aligned to a reasonable level of agreement. The simplest method for doing this is to move the sensor to an edge of the image, watching the distance from the edge of the sensor to the edge of the image. This can be done by manually rotating the knobs on the motors to position the sensor, or by using the cursor control keys to move the sensor. The probe can be moved around using the cursor keys:
<left> / <right> X axis<up> / <down> Y axis<home> / <end> Z axis<pg up> / <pg dn> W axis (focus)
Unless the option is selected (Hardware>>Motion page) it is necessary to hold the Ctrl key when pressing the cursor keys. This is a safety measure to prevent unexpected moves of the probe. Note that the main ASET-LV4 program window must be the top level focus of the operating system in order to have the key presses processed.
If the distance from the edge of the sensor to the edge of the image remains the same across the full length of the image, then the systems are aligned. If the distance grows or shrinks steadily, then the camera should be rotated to correct the alignment. The example below shows a system that is not quite aligner properly, the camera should be rotated counter-clockwise to correct the alignment. Always repeat the alignment test after making a correction.
Page 11 of 43

SCIENCE WARES, INC.87 Hamlin Ave · Falmouth, MA 02540
508-457-4556 · Fax 508-445-0472www.sciencewares.com
ASET-LV4 User Guide
If the distance grows and then shrinks, there is usually geometric aberration in the imaging system. Geometric aberration is not desirable, but can be acceptable. If geometric aberration is present, the distance from the sensor to the edge of the image should be symmetric about the center of the image, and the optical scale definition procedure should be accomplished over a region that is centered about the center of the image.
Navigate to the Image>>Overlay page:
Page 12 of 43

SCIENCE WARES, INC.87 Hamlin Ave · Falmouth, MA 02540
508-457-4556 · Fax 508-445-0472www.sciencewares.com
ASET-LV4 User Guide
Enter the name of the scale to create or edit in the field. To edit an existing scale, make sure the case and spelling match the scale that is being edited. If the existing scale name is not visible, the Optical Scales spin control can be used to make it visible.
Click on the button. This will start the optical scale definition process. It is important to complete the entire process before using other features of the program, otherwise the optical scale will not be correctly defined. Focus will shift to the Image>>Image page, a cursor crosshair will be displayed, and the message 'Show probe in TOP LEFT' will be displayed.
Page 13 of 43

SCIENCE WARES, INC.87 Hamlin Ave · Falmouth, MA 02540
508-457-4556 · Fax 508-445-0472www.sciencewares.com
ASET-LV4 User Guide
Complete the following procedure:
1. Use the cursor control keys to move the probe close to the top left corner of the image2. Position the cursor over the probe, and left-click once. 3. The message 'Show probe in TOP RIGHT' will be displayed. Use the cursor control keys
to move the probe along the X axis only until it is close to the top right corner of the image.
4. Position the cursor over the probe, and left-click once. 5. The message 'Show probe in BOTTOM RIGHT' will be displayed. Use the cursor
control keys to move the probe along the Y axis only until it is close to the bottom right corner of the image
6. Position the cursor over the probe, and left-click once.
After this the message 'OSD Complete!' will be displayed. The new values will be updated in the display and saved to the ASET-LV4.ini file.
Click the button, position the cursor over the probe, and left-click once. The
position coordinates displayed in the main program window will be updated with the
Page 14 of 43

SCIENCE WARES, INC.87 Hamlin Ave · Falmouth, MA 02540
508-457-4556 · Fax 508-445-0472www.sciencewares.com
ASET-LV4 User Guide
new position of the probe. This is a good time to click the and buttons to zero the
position coordinates displayed in the main program window.
Page 15 of 43

SCIENCE WARES, INC.87 Hamlin Ave · Falmouth, MA 02540
508-457-4556 · Fax 508-445-0472www.sciencewares.com
ASET-LV4 User GuideProgram Operation
When the program starts, three video windows and the DAQ Display window should open. These windows may need to be positioned in different places on the desktop to allow viewing the main program window.
The 'ASET-LV4 Image' window is updated regularly with an image acquired from the camera specified in the Hardware setup. The 'ASET-LV4 Reference Image' window is updated when the 'Get Ref Image' button on the Image>>Difference page. During acquisition, the 'ASET-LV4 Difference Image' window is updated every time the 'ASET-LV4 Image' is updated. More details about the acquisition, display, and storage of difference images can be found in the Difference Imaging section.
The DAQ Display window shows analog input data from the data acquisition boards when acquisition is in progress. The display is intended to provide a direct view of the analog input data before it is processed into values relating to the sensors being used.
The Context Help window contains many notes explaining features of the program. The window updates when the cursor is moved over a new control for which there is documentation available.
Page 16 of 43
SCIENCE WARES, INC.87 Hamlin Ave · Falmouth, MA 02540
508-457-4556 · Fax 508-445-0472www.sciencewares.com
ASET-LV4 User Guide
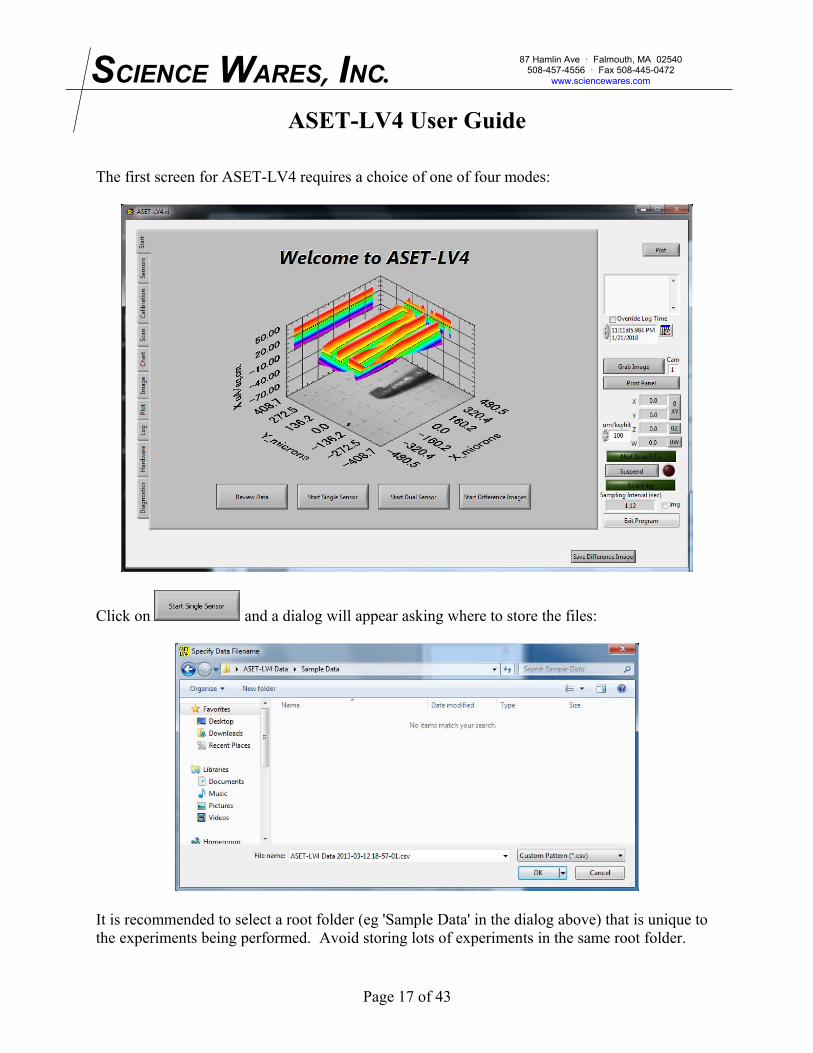
The first screen for ASET-LV4 requires a choice of one of four modes:
Click on and a dialog will appear asking where to store the files:
It is recommended to select a root folder (eg 'Sample Data' in the dialog above) that is unique to the experiments being performed. Avoid storing lots of experiments in the same root folder.
Page 17 of 43

SCIENCE WARES, INC.87 Hamlin Ave · Falmouth, MA 02540
508-457-4556 · Fax 508-445-0472www.sciencewares.com
ASET-LV4 User Guide
It is also recommended to keep the date and time in the filename as this can help find data files during the review process. Sometimes the File name field does not display the full name.
Setting the cursor down in the File name field will cause the full name to be displayed.
For each session, the program creates two comma-delimited text files and three subfolders. One comma-delimited text file stores data and the other stores manual and automatic log entries (calibrations, references, image times). One folder stores images, one stores scans, and the third stores analysis data (primarily for difference viewer operations).
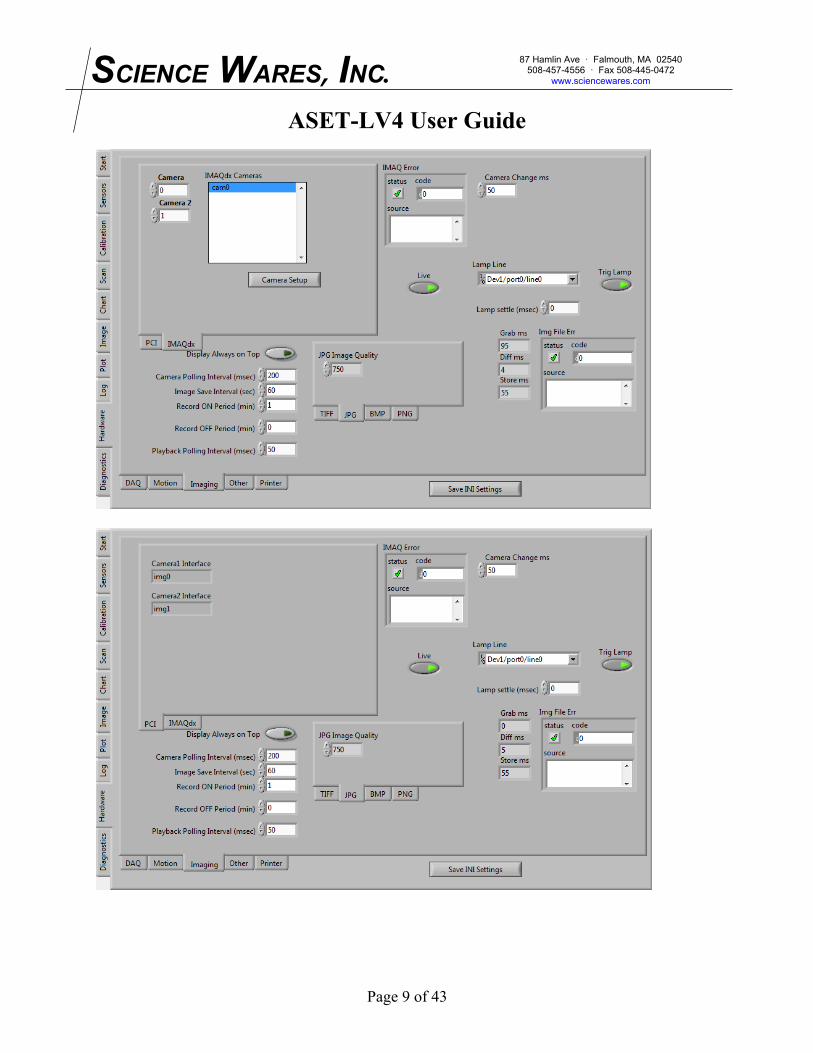
The default mode of the program is to store moderate quality video images every few seconds
(see on the Hardware>>Imaging page). These images can be played back in the review mode and used to navigate through the probe signal dataset. The images must be stored in a subfolder with the same name as the filename root, changing the folder name or the name of any of the image files will interfere with the operation of the review environment. Likewise changing the data stored in the .csv or _log.csv files may also interfere with the operation of the review environment.
When modifying any images or files for data analysis and presentation, it is best to make a copy of the original files and modify only the copies, not the originals.
Once the root folder is selected and the filename is specified, the following screen should appear:
Page 18 of 43

SCIENCE WARES, INC.87 Hamlin Ave · Falmouth, MA 02540
508-457-4556 · Fax 508-445-0472www.sciencewares.com
ASET-LV4 User Guide
This screen is for choosing the sensor type and specifying the sampling rules that will be used.
The sensor is selected with the control at the top of the page. The D/A and A/D settings are read-only at this point in the program. The type of the sensor is automatically determined by an entry in the ASET-LV4.ini file. To edit these values,
use the button to leave the ASET-LV4 program, edit the corresponding values in the ASET-LV4.ini file (see Appendix A/D Channel Setup), and then restart the ASET-LV4 program.
The sampling timing is defined by the following controls:
is the amount of time that the program pauses, after moving the probe to a sampling position, before it starts using A/D data.
Page 19 of 43

SCIENCE WARES, INC.87 Hamlin Ave · Falmouth, MA 02540
508-457-4556 · Fax 508-445-0472www.sciencewares.com
ASET-LV4 User Guide
is the period of time during which that the program acquires data from the probe after the wait cycle.
is the period of time during which that the program acquires data to establish the baseline for the ion selective probe post-amplifier. This sampling occurs prior to the wait cycle, only when enabled and only when the sensor has an Ion Selective Probe type.
The sampling path is set by the following control:
The first point in the sampling path is the origin, with index 0. The next point, with index 1, is the first point in the 'Tip pts (um)' list. In the above example, there is one point at the position X=10 microns, which will be 10 microns to the right of the probe position at the start of the sampling cycle.
Note that this sampling path can be rotated by specifying a non-zero value in the control at the lower right of the main program window. This control specifies a rotation in degrees counter-clockwise. For example a Rotation of 90 will result in the second point (at index 1) that is 10 microns along the positive Y axis from the probe position at the start of the sampling cycle.
There are two calculations available for real-time viewing of the data that is being acquired by the program. The data at each sampling point is stored regardless of how many points are in the 'Tip pts (um)' list, but only two gradient calculations are made and stored during acquisition.
A wide variety of display combinations are possible.
Page 20 of 43

SCIENCE WARES, INC.87 Hamlin Ave · Falmouth, MA 02540
508-457-4556 · Fax 508-445-0472www.sciencewares.com
ASET-LV4 User Guide
determines which sensor's data is selected (only one option is valid for single sensor experiments)
For the following fields, index 0 is at the 'Origin' (the probe position at the start of the sampling cycle), index 1 is at the first point in the 'Tip pts (um)' list, etc.
indicate the indexes of the samples that are used to calculate the concentrations that are displayed for the selected sensors.
indicate the indexes of the samples that are used as minuends to calculate the gradients that are displayed.
indicate the indexes of the samples that are used as subtrahends to calculate the gradients that are displayed.
After adjusting the above settings, click .
Page 21 of 43

SCIENCE WARES, INC.87 Hamlin Ave · Falmouth, MA 02540
508-457-4556 · Fax 508-445-0472www.sciencewares.com
ASET-LV4 User GuideThe Calibration page will appear:
The program will start reading calibration data from the A/D card and displaying the samples in the DAQ Display window. The data from the channels associated with the probe being calibrated will be displayed as voltages in the mini-display at the bottom of the calibration window. The average of the DAQ samples shown in the mini-display will be used to calculate
the and readings shown at the top of the display (or and
for oxygen probes).
To calibrate the probe, enter the calibration solution concentrations in the C1, C2, and C3 fields (in mM for ion selective probes, or in % for oxygen probes):
Page 22 of 43
SCIENCE WARES, INC.87 Hamlin Ave · Falmouth, MA 02540
508-457-4556 · Fax 508-445-0472www.sciencewares.com
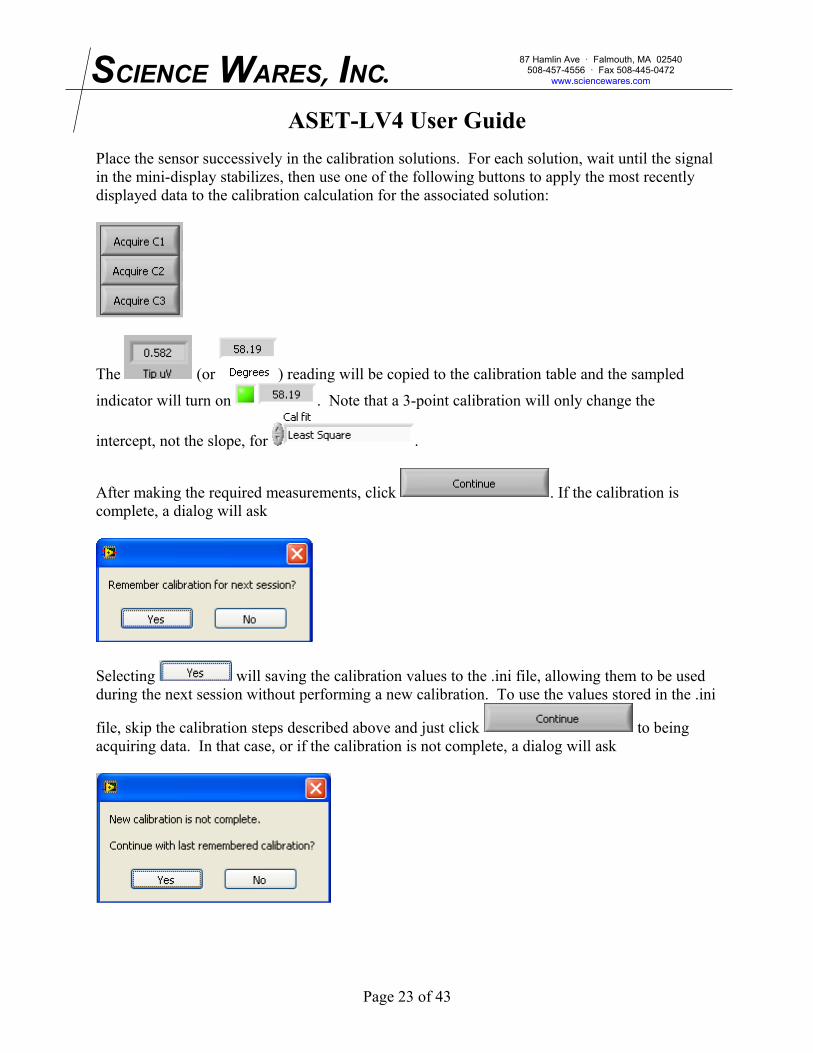
ASET-LV4 User GuidePlace the sensor successively in the calibration solutions. For each solution, wait until the signal in the mini-display stabilizes, then use one of the following buttons to apply the most recently displayed data to the calibration calculation for the associated solution:
The (or ) reading will be copied to the calibration table and the sampled
indicator will turn on . Note that a 3-point calibration will only change the
intercept, not the slope, for .
After making the required measurements, click . If the calibration is complete, a dialog will ask
Selecting will saving the calibration values to the .ini file, allowing them to be used during the next session without performing a new calibration. To use the values stored in the .ini
file, skip the calibration steps described above and just click to being acquiring data. In that case, or if the calibration is not complete, a dialog will ask
Page 23 of 43

SCIENCE WARES, INC.87 Hamlin Ave · Falmouth, MA 02540
508-457-4556 · Fax 508-445-0472www.sciencewares.com
ASET-LV4 User GuideIn either case the calibration values used with the experiment will be stored in the _log file. Then the Chart display will appear:
The time axis displays the time relative to T0, which is determined as the time when the calibration is completed and sampling begins. Every sample is continuously recorded in the .csv data file, both the concentration (in mM or %) at each point (calculated by applying the calibration to the measured voltage) as well as the two gradients defined on the Sensors tab.
There are cursors to aid with inspecting values on the chart, and to establish a ‘Reference’ or
‘Background’ value. Clicking on the buttons will bring the associated cursor to the middle of the current chart display. The cursor can then be adjusted by selecting the Cursor tool
The control determines how much time is displayed on the chart. Unchecking this control makes it possible to use the horizontal scrollbar or the chart controls
Page 24 of 43

SCIENCE WARES, INC.87 Hamlin Ave · Falmouth, MA 02540
508-457-4556 · Fax 508-445-0472www.sciencewares.com
ASET-LV4 User Guide
or to modify the chart display. Many aspects of the chart can be controlled by right clicking on various parts of the chart. New values for the scales can also be typed in directly, although it is necessary to turn off the autoscale feature for the settings to be preserved.
The probe can be moved around using the cursor keys:
<left> / <right> X axis<up> / <down> Y axis<home> / <end> Z axis<pg up> / <pg dn> W axis (focus)
Unless the option is selected (Hardware>>Motion page) it is necessary to hold the Ctrl key when pressing the cursor keys. This is a safety measure to prevent unexpected moves of the probe. Note that the main ASET-LV4 program window must be the top level focus of the operating system in order to have the key presses processed.
The move increment for each key press is set by the field on the right side of the program window. The move increment can be doubled by pressing the '+' key on the numeric keypad or halved by pressing the '-' key on the numeric keypad. If the Shift key is held while pressing a cursor control key, a move that is 10 times the current move increment will be made.
It is important to avoid excessively large moves that may cause the sensor to crash, and it is also important to avoid loading up the keyboard buffer with many keystrokes in order to get the
sensor to move a long distance. First set the to a suitable value, then use only a few slow keystrokes to move the sensor to the desired position.
Note that data will be acquired and displayed in the program window, but it will only be
recorded to the disk when the red Record button is enabled.
Page 25 of 43

SCIENCE WARES, INC.87 Hamlin Ave · Falmouth, MA 02540
508-457-4556 · Fax 508-445-0472www.sciencewares.com
ASET-LV4 User GuideThe Image display can also be used to view the absolute concentration as well as the gradient graphs superimposed on the current image.
The position of the top left corner of the overlaid charts can be adjusted using the
and controls. Specifying a position beyond the right edge of the display window will effectively remove the chart from the overlay. The color of the plots is
set by the colorboxes and .
Optical System
The selection determines the relationship between positions shown on the
image window (for example using the button) and physical positions of the sensors. It is important to have the Optical System properly defined and selected when defining grid scan positions. Showing the position of the sensor in the image also sets the position stored
Page 26 of 43

SCIENCE WARES, INC.87 Hamlin Ave · Falmouth, MA 02540
508-457-4556 · Fax 508-445-0472www.sciencewares.com
ASET-LV4 User Guide
with each entry in the data file. Overlay vectors from the past samples are displayed on the image at a location determined by the probe position and the selected Optical System.
Page 27 of 43

SCIENCE WARES, INC.87 Hamlin Ave · Falmouth, MA 02540
508-457-4556 · Fax 508-445-0472www.sciencewares.com
ASET-LV4 User GuideScans
Before starting a scan, it is best to make sure the program knows the location of the sensor(s) and the optical scale that is being used. If the optical scale has not yet been defined, please define it before trying to scan. Instructions are provided in the Optical Scales section.
When it is certain that the optical scale is properly defined, complete the following proceudre:
1. Navigate to the Image>>Image page. This can be accomplished using the tab controls on
the left side of the program window, or by clicking the button at the top right of the program window.
2. Select the correct optical scale using the control in the middle of the page.
3. Click the and buttons to zero the position coordinates displayed in the main program window.
4. Click on the button5. Position the cursor over the probe, and left-click once.
The position coordinates displayed in the main program window will now show the
current position of the probe. Click on the button or go to the Scan page to set up a scan.
Page 28 of 43
SCIENCE WARES, INC.87 Hamlin Ave · Falmouth, MA 02540
508-457-4556 · Fax 508-445-0472www.sciencewares.com
ASET-LV4 User Guide
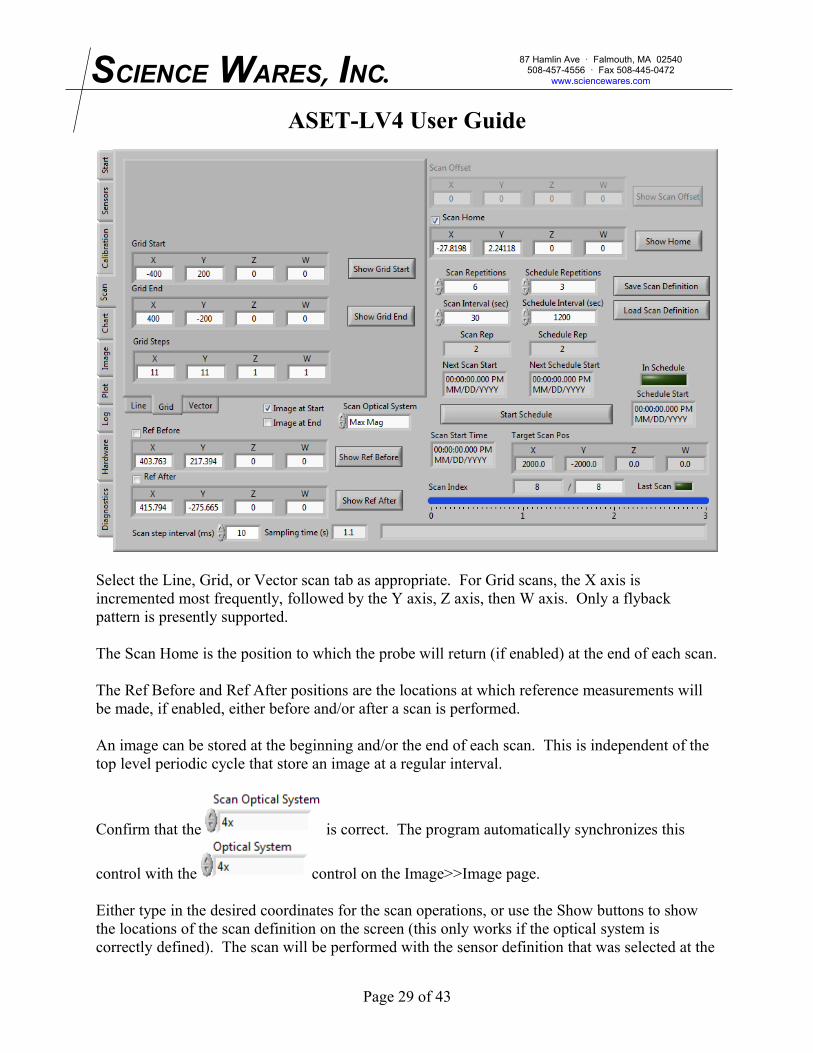
Select the Line, Grid, or Vector scan tab as appropriate. For Grid scans, the X axis is incremented most frequently, followed by the Y axis, Z axis, then W axis. Only a flyback pattern is presently supported.
The Scan Home is the position to which the probe will return (if enabled) at the end of each scan.
The Ref Before and Ref After positions are the locations at which reference measurements will be made, if enabled, either before and/or after a scan is performed.
An image can be stored at the beginning and/or the end of each scan. This is independent of the top level periodic cycle that store an image at a regular interval.
Confirm that the is correct. The program automatically synchronizes this
control with the control on the Image>>Image page.
Either type in the desired coordinates for the scan operations, or use the Show buttons to show the locations of the scan definition on the screen (this only works if the optical system is correctly defined). The scan will be performed with the sensor definition that was selected at the
Page 29 of 43

SCIENCE WARES, INC.87 Hamlin Ave · Falmouth, MA 02540
508-457-4556 · Fax 508-445-0472www.sciencewares.com
ASET-LV4 User Guideprogram startup, using the sampling rules on the Sensors tab. The estimated scan time will be displayed in the bottom right of the Scan page. It is important to make sure there is enough time for each scan repetition and scan interval to complete. Note that the intervals are from start to start, so 30 seconds means there will be 30 seconds between the first observation of the first scan and the first observation of the second scan. A 'Schedule' indicates how many times to perform each set of 'Repetitions'. With the values above, there would be 3 sets of 6 scans. Each of the 6 scans would be started 30 seconds apart, and each set of 6 scans would start 20 minutes apart.
After defining the scan parameters, use the button to store the parameters
for future use. Then click the button to begin scanning.
A scan can be interrupted by clicking on the button located just under the status
indicator at the lower right corner of the main program window. Be patient with the program while it responds, the scan will not be able to cancel properly until the most recent sensor sampling operation completes, which can take many seconds.
Page 30 of 43

SCIENCE WARES, INC.87 Hamlin Ave · Falmouth, MA 02540
508-457-4556 · Fax 508-445-0472www.sciencewares.com
ASET-LV4 User GuidePlotting
During a scan, the data will be displayed on a 2D and 3D plot. These plots can be viewed on the
Plot tab, or by clicking on the button and then selecting the 2D or 3D page.
After a scan is complete, the data can be reloaded by going to the Plot Data tab. Select an image by clicking on the folder icon at the right of the Image File control at the top of the page:
Select the scan folder by clicking on the folder icon at the right of the Scan Data Folder control at the top of the page:
Page 31 of 43

SCIENCE WARES, INC.87 Hamlin Ave · Falmouth, MA 02540
508-457-4556 · Fax 508-445-0472www.sciencewares.com
ASET-LV4 User Guide
All the scan files will be loaded into the list. Note the values determine what value is plotted, normally these values should indicate the same quantity from the data file.Double click on a scan file in the list to load it into the plot. Hold shift and double click on a file to change whether it will be included in the plot sequence. Click on to generate all the plots, then go to the Plot Sequence page to browse the results.
Page 32 of 43

SCIENCE WARES, INC.87 Hamlin Ave · Falmouth, MA 02540
508-457-4556 · Fax 508-445-0472www.sciencewares.com
ASET-LV4 User GuideDifference Viewer Technique
Basic functions of the former DVIT software are incorporated in ASET-LV4. To begin a DVIT
mode only experiment, click on the button on the opening page of the program window. If sensor data is to be acquired along with difference image mode, then proceed with the sensor acquisition instructions above. The DVIT functionality will be available at the same time that the sensor measurements are being made. Note that when sensor measurements are being made, there system may not be able to rapidly acquire and display the image data.
The ASET-LV4 program maintains a near-real time display window. The default update rate for
this window is set using the field on the Hardware>>Imaging tab. The default interval is set to 1000 milliseconds, which may seem a bit slow for focusing operations. It is recommended to keep this interval as long as possible to minimize the amount of time needed by the system to process image data. The difference displays are updated for every 'camera polling' image that is acquired, but the images are only stored at the interval
specified by the control. Note that images will only be saved to
disk if the red Record button is on. The camera polling interval should allow for at least one image update for every image save interval, which is the amount of time between stored images.
When sensor data is being acquired, it is not recommended to set the camera polling interval below 250 milliseconds. When sensor data is being collected, it is possible to save an image corresponding to the beginning of each sampling cycle. This occurs when the control is
turned on (located next to the control at the lower right of the main program window). These images are used to update the difference image displays.
There are three image windows displayed for the DVIT technique: Image, Reference, Difference. The presence and size of these windows is controlled by the following controls on the Image>>Difference tab:
A positive zoom magnifies while a negative zoom demagnifies the image (ie -2 means half size, -3 means a third the size, etc.). The zooms -1, 0, 1 are all 'full size'.
Page 33 of 43

SCIENCE WARES, INC.87 Hamlin Ave · Falmouth, MA 02540
508-457-4556 · Fax 508-445-0472www.sciencewares.com
ASET-LV4 User GuideThe normal operation of the program is to display a difference image and difference data at the
and record images at the image save interval
. In analysis mode it is only possible to generate difference images using stored images.
The program allows an ROI to be defined in the Image window using the button on the Image>>Difference tab. Using this button shifts the focus of the program to the Image window, and it is necessary to click OK or Cancel in that window to continue.
Page 34 of 43

SCIENCE WARES, INC.87 Hamlin Ave · Falmouth, MA 02540
508-457-4556 · Fax 508-445-0472www.sciencewares.com
ASET-LV4 User GuideThe data from the selected ROI is used to generate histogram, chart, and graph displays associated with the difference image data. The chart and graph display a 'histogram shift' value,
which is calculated as the weighted difference of the histogram value from the value, normalized by the number of pixels in the ROI. For example, if Diff Offset is 128 and the histogram has 20 pixels at 126, 70 pixels at 127, 100 pixels at 128, 25 pixels at 129, and 11 pixels at 130, the histogram shift would be ( 20*|126-128| + 70*|127-128| + 25*|129-128|+11*|130-128| ) / ( 20+70+100+25+11 ) = (40+70+25+22) / 226 = 0.69.
The Chart displays the R,G,B histogram shift values for each image acquired at the Camera Polling Interval. The chart will hold up to 1024 data points, which can be displayed by changing the X axis values (place the cursor on top of the label, type in the new value and press Enter).
Page 35 of 43

SCIENCE WARES, INC.87 Hamlin Ave · Falmouth, MA 02540
508-457-4556 · Fax 508-445-0472www.sciencewares.com
ASET-LV4 User GuideThe Graph displays the R,G,B histogram shift values for each image stored at the Image Save
Interval. The button can be used to export the data in the graph to a text file for external analysis.
The button can be used at any time to store the difference image visible at the time the button is pressed. The difference image is stored in the Analysis subfolder to avoid interfering with the structure of the Images subfolder, which holds only the images acquired during the experiment.
Page 36 of 43

SCIENCE WARES, INC.87 Hamlin Ave · Falmouth, MA 02540
508-457-4556 · Fax 508-445-0472www.sciencewares.com
ASET-LV4 User GuideAnalysis
It is possible to print a copy of the view on the screen at any time using the
button. The printer is selected on the Hardware>>Printer tab.
The data is stored in comma delimited text files with the .csv extension.
<filename>.csv – contains the measurement times, positions, and data values<filename>_log.csv – contains any user comments as well as calibration data
These files can be opened in Excel, but it is important to save any changes in a new file and not overwrite the original file. This is because the ASET-LV4 program depends on the original format of the file being retained for analysis operations.
To reload a file for analysis, start the program and click on the button on the opening page. Select the <filename>.csv file and the program will load the data and also inspect the Images subfolder for any images that were acquired.
The Chart and Image tabs can be used to view the data.
Page 37 of 43

SCIENCE WARES, INC.87 Hamlin Ave · Falmouth, MA 02540
508-457-4556 · Fax 508-445-0472www.sciencewares.com
ASET-LV4 User Guide
The slider at the bottom of the main program window can be used to browse the data or images.
Dragging and releasing the slider at any given time will pan the center time on the concentration and gradient graphs on both the Chart and Image tabs.
The button will automatically advance the image time slider from its current position
to the next recorded image at approximately times real time. The button
Page 38 of 43

SCIENCE WARES, INC.87 Hamlin Ave · Falmouth, MA 02540
508-457-4556 · Fax 508-445-0472www.sciencewares.com
ASET-LV4 User Guidewill move the slider to the beginning of the recorded images. This will clear the histogram shift data from the chart and graph.
The button can be used to set the presently displayed Image to the Reference Image. Subsequent updates of the Difference Image and histogram shift data will make use of the new Reference Image. Previous histogram shift data will always refer only to the data as defined by the Reference Image selected at the time the calculations were made.
As during acquisition, the button can be used at any time to store the difference image visible at the time the button is pressed. The difference image is stored in the Analysis subfolder to avoid interfering with the structure of the Images subfolder, which holds only the images acquired during the experiment.
Page 39 of 43

SCIENCE WARES, INC.87 Hamlin Ave · Falmouth, MA 02540
508-457-4556 · Fax 508-445-0472www.sciencewares.com
ASET-LV4 User GuideAppendix - uEye Camera Setup
For the y inversion issue, there is an option to invert the image in the DirectShow interface. Open NI-MAX, open the NI-IMAQdx tree and select cam1, then go to the Camera Attributes tab (bottom, center of the window below) and select All Attributes.
Then look for the 'Vertical Mirror' item in the 'Acquisition Attributes' entry and turn on the checkbox and then click 'Save' at the top center of the window.
Page 40 of 43

SCIENCE WARES, INC.87 Hamlin Ave · Falmouth, MA 02540
508-457-4556 · Fax 508-445-0472www.sciencewares.com
ASET-LV4 User GuideAppendix - A/D Channel Setup
The A/D channels in the sensor sampling rules are offsets from the physical channels specified in the hardware setup. If you want to use different A/D channels then
1. Close ASET-LV42. Open ASET-LV4.ini (must be in the same folder as the ASET-LV4.exe file)3. Change the channel settings in the sections described below4. Save and close ASET-LV4.ini 5. Start ASET-LV4
ISP/PVP sensor types
Sensor 1 is controlled by the settings in the [Ion1 Setup] section, while Sensor 2 is controlled by the settings in the [Ion2 Setup] section. The section entries are as follows:
[Ion? Setup]D/A chan=0A/D lo chan=1A/D lo gain=10A/D hi chan=0A/D hi gain=100
The physical channels are used as follows:
Low gain from headstage ISP AI Chan + A/D lo chanHigh gain from difference amp ISP AI Chan + A/D lo chanBaseline signal ISP AO Chan + D/A chan
Page 41 of 43

SCIENCE WARES, INC.87 Hamlin Ave · Falmouth, MA 02540
508-457-4556 · Fax 508-445-0472www.sciencewares.com
ASET-LV4 User GuideSVET sensor type
The SVET sensor type is only supported as Sensor 1 and cannot be combined with other sensor types at this time. Normally the section settings are as follows:
[SVET1 Setup]A/D start ch = 0Cal sec = 3Preamp Gain = 100Main Amp Gain = 500
The physical channels are as follows:
X In Phase SVET AI Chan + A/D start chX Quadrature SVET AI Chan + A/D start ch + 1Y In Phase SVET AI Chan + A/D start ch + 2Y Quadrature SVET AI Chan + A/D start ch + 3X Oscillator SVET AI Chan + A/D start ch + 4Y Oscillator SVET AI Chan + A/D start ch + 5Tip signal SVET AI Chan + A/D tip ch
Page 42 of 43

SCIENCE WARES, INC.87 Hamlin Ave · Falmouth, MA 02540
508-457-4556 · Fax 508-445-0472www.sciencewares.com
ASET-LV4 User GuideOptrode sensor type
Only one OptrodeExt sensor type can be used at a time, it cab be Sensor 1 or Sensor 2.
[DAQ]Optrode1 Sig Chan = 0 Optrode1 Ref Chan = 1
The physical channels are as follows:
Reference signal Optrode AI Channels + Optrode1 Ref ChanMeasurement signal Optrode AI Channels + Optrode1 Sig ChanDrive signal Optrode AO Channel
Page 43 of 43