asc605 to asc606 transition - workday · 4 notable impacts on workday’s income statement...
TRANSCRIPT

ASC605 to ASC606 Transition
Summary

3
Workday Adoption Background
• Workday has elected early adoption of ASC606 (as of 2/1/2017)
• Full retrospective adoption method (FY16 & FY17 restated)
• FY17 has also been restated quarterly
• Early adoption driven by our technology (Workday Financial
Management)

4
Notable Impacts on Workday’s Income Statement
• Revenue recognition is no longer limited by invoicing
Revenue Impact
Margin Impact
• Some revenue will be reclassified between professional
services & subscription in either direction, depending on the
facts & circumstances of each particular situation
• Increased capitalization of contract acquisition costs with a
longer amortization period
5
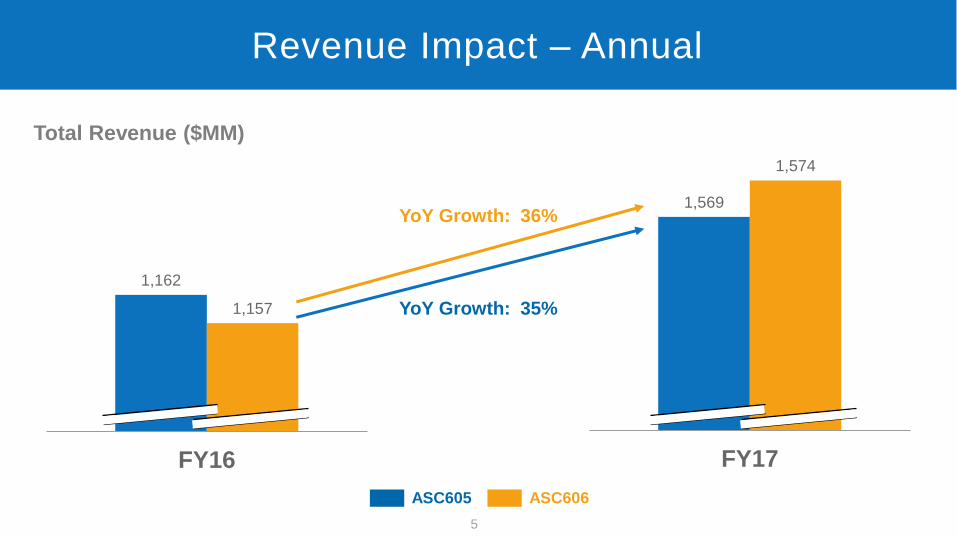
Revenue Impact – Annual
1,569
1,574
FY17
1,162
1,157
FY16
Total Revenue ($MM)
YoY Growth: 35%
YoY Growth: 36%
ASC605 ASC606

6
Detail Revenue Impact – Annual
929
920
FY16
1,287
1,290
FY17
Subscription Revenue ($MM)
282 284
FY17
233 237
FY16
Professional Services Revenue ($MM)
YoY Growth: 39%
YoY Growth: 40%
YoY Growth: 21%
YoY Growth: 20%
ASC605 ASC606

7
$MM FY16 Q117 Q217 Q317 Q417 FY17
605 Reported:
Subscription 929 280 306 336 365 1,287
Professional Services 233 65 71 74 72 282
Total Revenue 1,162 345 377 410 437 1,569
606 Restated:
Subscription 920 280 306 338 366 1,290
Professional Services 237 68 67 76 73 284
Total Revenue 1,157 348 373 414 439 1,574
Impact:
Subscription (9) 0 0 2 1 3
Professional Services 4 3 (4) 2 1 2
Total Revenue (5) 3 (4) 4 2 5
Revenue Impact – Quarterly Detail
ASC605 Reported
ASC606 Restated
Impact

8
1,427
1,406
FY16
1,946
1,928
FY17
GAAP Operating Expenses ($MM)
(24.0%) (22.4%)
FY17
(22.8%) (21.6%)
FY16
GAAP Operating Margin (%)
GAAP Margin Impact - Annual
ASC605 ASC606

9
$MM FY16 Q117 Q217 Q317 Q417 FY17
605 Reported:
GAAP Operating Expense 1,427 419 465 519 543 1,946
GAAP Operating Margin $ (265) (74) (87) (110) (106) (377)
GAAP Operating Margin % -22.8% -21.3% -23.0% -26.8% -24.3% -24.0%
606 Restated:
GAAP Operating Expense 1,406 419 460 520 529 1,928
GAAP Operating Margin $ (250) (71) (87) (106) (89) (353)
GAAP Operating Margin % -21.6% -20.6% -23.2% -25.6% -20.2% -22.4%
Impact:
GAAP Operating Expense (21) 0 (5) 1 (14) (18)
GAAP Operating Margin $ 15 3 0 4 17 24
GAAP Operating Margin % 1.2 pt 0.7 pt (0.2)pt 1.2 pt 4.1 pt 1.6 pt
GAAP Margin Impact – Quarterly Detail
ASC605 Reported
ASC606 Restated
Impact

10
1,165
1,145
FY16
1,540
1,522
FY17
Non-GAAP Operating Expenses ($MM)
1.9%
3.3%
FY17(0.2%)
1.0%
FY16
Non-GAAP Operating Margin (%)
Non-GAAP Margin Impact - Annual
ASC605 ASC606

11
$MM FY16 Q117 Q217 Q317 Q417 FY17
605 Reported:
Non-GAAP Operating Expense 1,165 334 372 405 429 1,540
Non-GAAP Operating Margin $ (3) 11 6 4 8 29
Non-GAAP Operating Margin % -0.2% 3.2% 1.6% 1.0% 1.8% 1.9%
606 Restated:
Non-GAAP Operating Expense 1,145 334 368 406 414 1,522
Non-GAAP Operating Margin $ 12 14 6 8 25 53
Non-GAAP Operating Margin % 1.0% 3.8% 1.6% 1.9% 5.8% 3.3%
Impact:
Non-GAAP Operating Expense (20) 0 (4) 1 (15) (18)
Non-GAAP Operating Margin $ 15 3 0 4 17 24
Non-GAAP Operating Margin % 1.2 pt 0.6 pt 0.0 pt 0.9 pt 4.0 pt 1.4 pt
Non-GAAP Margin Impact – Quarterly Detail
ASC605 Reported
ASC606 Restated
Impact

12
Selected Balance Sheet Impacts
$MM ASC 605 ASC 606 ΔPre-
FY 16FY 16 ASC 605 ASC 606 Δ
Assets
Trade and other receivables, net 293 316 23 1 22 384 410 26
Prepaid expenses and other current assets 78 58 (20) 0 (20) 88 67 (21)
Deferred costs 22 40 18 12 6 28 51 23
Deferred costs, noncurrent 30 91 61 47 14 43 117 74
Liabilities
Unearned Revenue 900 892 (8) (16) 8 1,233 1,222 (11)
FY17FY16 FY16 Δ

13
No Cash Flow Impact
259 259
FY16
349 349
FY17
Operating Cash Flow ($MM)
Free Cash Flow (ex owned real estate projects) ($MM)
125 125
FY16
228 228
FY17ASC605 ASC606

Non-GAAP Reconciliation Tables
15
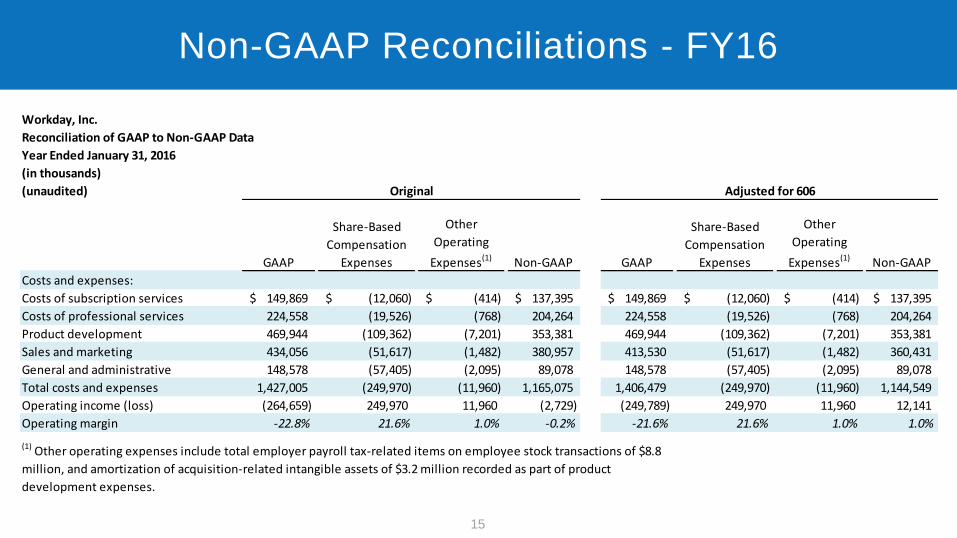
Non-GAAP Reconciliations - FY16
Workday, Inc.
Reconciliation of GAAP to Non-GAAP Data
Year Ended January 31, 2016
(in thousands)
(unaudited)
GAAP
Share-Based
Compensation
Expenses
Other
Operating
Expenses(1) Non-GAAP GAAP
Share-Based
Compensation
Expenses
Other
Operating
Expenses(1) Non-GAAP
Costs and expenses:
Costs of subscription services 149,869$ (12,060)$ (414)$ 137,395$ 149,869$ (12,060)$ (414)$ 137,395$
Costs of professional services 224,558 (19,526) (768) 204,264 224,558 (19,526) (768) 204,264
Product development 469,944 (109,362) (7,201) 353,381 469,944 (109,362) (7,201) 353,381
Sales and marketing 434,056 (51,617) (1,482) 380,957 413,530 (51,617) (1,482) 360,431
General and administrative 148,578 (57,405) (2,095) 89,078 148,578 (57,405) (2,095) 89,078
Total costs and expenses 1,427,005 (249,970) (11,960) 1,165,075 1,406,479 (249,970) (11,960) 1,144,549
Operating income (loss) (264,659) 249,970 11,960 (2,729) (249,789) 249,970 11,960 12,141
Operating margin -22.8% 21.6% 1.0% -0.2% -21.6% 21.6% 1.0% 1.0%
Original Adjusted for 606
(1) Other operating expenses include total employer payroll tax-related items on employee stock transactions of $8.8
million, and amortization of acquisition-related intangible assets of $3.2 million recorded as part of product
development expenses.

16
Non-GAAP Reconciliations - FY17
Workday, Inc.
Reconciliation of GAAP to Non-GAAP Data
Year Ended January 31, 2017
(in thousands)
(unaudited)
GAAP
Share-Based
Compensation
Expenses
Other
Operating
Expenses(1) Non-GAAP GAAP
Share-Based
Compensation
Expenses
Other
Operating
Expenses(1) Non-GAAP
Costs and expenses:
Costs of subscription services 213,389$ (20,773)$ (730)$ 191,886$ 213,389$ (20,773)$ (730)$ 191,886$
Costs of professional services 270,156 (26,833) (1,199) 242,124 270,156 (26,833) (1,199) 242,124
Product development 680,531 (166,529) (18,533) 495,469 680,531 (166,529) (18,533) 495,469
Sales and marketing 583,874 (86,229) (3,316) 494,329 565,328 (86,229) (3,316) 475,783
General and administrative 198,122 (78,265) (3,302) 116,555 198,122 (78,265) (3,302) 116,555
Total costs and expenses 1,946,072 (378,629) (27,080) 1,540,363 1,927,526 (378,629) (27,080) 1,521,817
Operating income (loss) (376,665) 378,629 27,080 29,044 (353,086) 378,629 27,080 52,623
Operating margin -24.0% 24.1% 1.8% 1.9% -22.4% 24.0% 1.7% 3.3%
(1) Other operating expenses include total employer payroll tax-related items on employee stock transactions of $14.3
million, and amortization of acquisition-related intangible assets of $12.7 million recorded as part of product
development and sales and marketing expenses.
Original Adjusted for 606

17
Non-GAAP Reconciliations – Q1 FY17
Workday, Inc.
Reconciliation of GAAP to Non-GAAP Data
Three Months Ended April 30, 2016
(in thousands)
(unaudited)
GAAP
Share-Based
Compensation
Expenses
Other
Operating
Expenses(1) Non-GAAP GAAP
Share-Based
Compensation
Expenses
Other
Operating
Expenses(1) Non-GAAP
Costs and expenses:
Costs of subscription services 49,200$ (4,397)$ (319)$ 44,484$ 49,200$ (4,397)$ (319)$ 44,484$
Costs of professional services 59,427 (5,293) (490) 53,644 59,427 (5,293) (490) 53,644
Product development 141,778 (32,968) (3,794) 105,016 141,778 (32,968) (3,794) 105,016
Sales and marketing 127,491 (19,002) (1,090) 107,399 127,619 (19,002) (1,090) 107,527
General and administrative 41,183 (16,575) (812) 23,796 41,183 (16,575) (812) 23,796
Total costs and expenses 419,079 (78,235) (6,505) 334,339 419,207 (78,235) (6,505) 334,467
Operating income (loss) (73,649) 78,235 6,505 11,091 (71,530) 78,235 6,505 13,210
Operating margin -21.3% 22.6% 1.9% 3.2% -20.6% 22.5% 1.9% 3.8%
(1) Other operating expenses include total employer payroll tax-related items on employee stock transactions of $5.2
million, and amortization of acquisition-related intangible assets of $1.3 million recorded as part of product
development expenses.
Original Adjusted for 606

18
Non-GAAP Reconciliations - Q2 FY17
Workday, Inc.
Reconciliation of GAAP to Non-GAAP Data
Three Months Ended July 31, 2016
(in thousands)
(unaudited)
GAAP
Share-Based
Compensation
Expenses
Other
Operating
Expenses(1) Non-GAAP GAAP
Share-Based
Compensation
Expenses
Other
Operating
Expenses(1) Non-GAAP
Costs and expenses:
Costs of subscription services 51,379$ (4,968)$ (133)$ 46,278$ 51,379$ (4,968)$ (133)$ 46,278$
Costs of professional services 66,473 (5,969) (226) 60,278 66,473 (5,969) (226) 60,278
Product development 161,886 (38,314) (2,566) 121,006 161,886 (38,314) (2,566) 121,006
Sales and marketing 139,177 (20,844) (707) 117,626 134,899 (20,844) (707) 113,348
General and administrative 45,705 (18,127) (924) 26,654 45,705 (18,127) (924) 26,654
Total costs and expenses 464,620 (88,222) (4,556) 371,842 460,342 (88,222) (4,556) 367,564
Operating income (loss) (86,897) 88,222 4,556 5,881 (86,685) 88,222 4,556 6,093
Operating margin -23.0% 23.4% 1.2% 1.6% -23.2% 23.6% 1.2% 1.6%
Original Adjusted for 606
(1) Other operating expenses include total employer payroll tax-related items on employee stock transactions of $3.2
million, and amortization of acquisition-related intangible assets of $1.4 million recorded as part of product
development expenses.

19
Non-GAAP Reconciliations - Q3 FY17
Workday, Inc.
Reconciliation of GAAP to Non-GAAP Data
Three Months Ended October 31, 2016
(in thousands)
(unaudited)
GAAP
Share-Based
Compensation
Expenses
Other
Operating
Expenses(1) Non-GAAP GAAP
Share-Based
Compensation
Expenses
Other
Operating
Expenses(1) Non-GAAP
Costs and expenses:
Costs of subscription services 54,645$ (5,472)$ (118)$ 49,055$ 54,645$ (5,472)$ (118)$ 49,055$
Costs of professional services 72,240 (7,436) (171) 64,633 72,240 (7,436) (171) 64,633
Product development 185,311 (45,968) (5,792) 133,551 185,311 (45,968) (5,792) 133,551
Sales and marketing 149,549 (22,597) (661) 126,291 149,537 (22,597) (661) 126,279
General and administrative 57,721 (24,982) (713) 32,026 57,721 (24,982) (713) 32,026
Total costs and expenses 519,466 (106,455) (7,455) 405,556 519,454 (106,455) (7,455) 405,544
Operating income (loss) (109,884) 106,455 7,455 4,026 (105,932) 106,455 7,455 7,978
Operating margin -26.8% 26.0% 1.8% 1.0% -25.6% 25.7% 1.8% 1.9%
Original Adjusted for 606
(1) Other operating expenses include total employer payroll tax-related items on employee stock transactions of $2.6
million, and amortization of acquisition-related intangible assets of $4.9 million recorded as part of product
development expenses.

20
Non-GAAP Reconciliations – Q4 FY17
Workday, Inc.
Reconciliation of GAAP to Non-GAAP Data
Three Months Ended January 31, 2017
(in thousands)
(unaudited)
GAAP
Share-Based
Compensation
Expenses
Other
Operating
Expenses(1) Non-GAAP GAAP
Share-Based
Compensation
Expenses
Other
Operating
Expenses(1) Non-GAAP
Costs and expenses:
Costs of subscription services 58,165$ (5,936)$ (160)$ 52,069$ 58,165$ (5,936)$ (160)$ 52,069$
Costs of professional services 72,016 (8,135) (312) 63,569 72,016 (8,135) (312) 63,569
Product development 191,556 (49,279) (6,381) 135,896 191,556 (49,279) (6,381) 135,896
Sales and marketing 167,657 (23,786) (858) 143,013 153,273 (23,786) (858) 128,629
General and administrative 53,513 (18,581) (853) 34,079 53,513 (18,581) (853) 34,079
Total costs and expenses 542,907 (105,717) (8,564) 428,626 528,523 (105,717) (8,564) 414,242
Operating income (loss) (106,235) 105,717 8,564 8,046 (88,939) 105,717 8,564 25,342
Operating margin -24.3% 24.2% 1.9% 1.8% -20.2% 24.1% 1.9% 5.8%
Original Adjusted for 606
(1) Other operating expenses include total employer payroll tax-related items on employee stock transactions of $3.5
million, and amortization of acquisition-related intangible assets of $5.1 million recorded as part of product
development and sales and marketing expenses.
Financial Statements with 606 Adjustments

22
Consolidated Balance Sheets – FY17 Quarterly
2017 (Original) 2017 (Adjusted for 606) 2016 (Original) 2016 (Adjusted for 606) 2016 (Original) 2016 (Adjusted for 606) 2016 (Original) 2016 (Adjusted for 606) 2016 (Original) 2016 (Adjusted for 606)
Assets
Current assets:
Cash and cash equivalents 539,923$ 539,923$ 386,557$ 386,557$ 405,529$ 405,529$ 404,604$ 404,604$ 300,087$ 300,087$
Marketable securities 1,456,822 1,456,822 1,527,238 1,527,238 1,662,381 1,662,381 1,675,486 1,675,486 1,669,372 1,669,372
Trade and other receivables, net 383,908 409,780 268,945 291,108 248,658 270,484 193,100 218,583 293,407 316,161
Deferred costs 27,537 51,330 23,067 44,760 22,664 43,587 21,534 40,848 21,817 39,976
Prepaid expenses and other current
assets 88,336 66,590 88,788 68,101 90,858 67,815 77,407 55,931 77,625 57,961
Total current assets 2,496,526 2,524,445 2,294,595 2,317,764 2,430,090 2,449,796 2,372,131 2,395,452 2,362,308 2,383,557
Property and equipment, net 365,877 365,877 334,265 334,265 255,118 255,118 254,697 254,697 214,158 214,158
Deferred costs, noncurrent 43,310 117,249 33,551 95,205 32,488 94,900 29,272 89,015 30,074 91,101
Acquisition-related intangible assets, net 48,787 48,787 — — — — — — 15,491 15,491
Goodwill 158,354 158,354 212,087 212,087 68,623 68,623 64,887 64,887 50,325 50,325
Other assets 53,570 53,570 48,071 48,071 43,485 43,485 55,166 55,166 57,738 57,738
Total assets 3,166,424$ 3,268,282$ 2,922,569$ 3,007,392$ 2,829,804$ 2,911,922$ 2,776,153$ 2,859,217$ 2,730,094$ 2,812,370$
Liabilities and stockholders’ equity
Current liabilities:
Accounts payable 26,824$ 26,824$ 28,374$ 28,374$ 17,135$ 17,135$ 18,975$ 18,975$ 19,605$ 19,605$
Accrued expenses and other current
liabilities61,582 61,582 66,075 66,075 58,880 58,880 66,372 66,372 43,122 43,122
Accrued compensation 110,625 110,625 103,206 103,206 76,693 76,693 86,819 86,819 91,211 91,211
Unearned revenue 1,097,417 1,086,212 900,441 890,569 854,845 846,846 798,086 789,081 768,741 761,552
Total current liabilities 1,296,448 1,285,243 1,098,096 1,088,224 1,007,553 999,554 970,252 961,247 922,679 915,490
Convertible senior notes, net 534,423 534,423 527,547 527,547 520,765 520,765 514,075 514,075 507,476 507,476
Unearned revenue, noncurrent 135,970 135,331 123,179 121,468 124,269 121,932 127,970 127,797 130,988 130,330
Other liabilities 36,677 36,677 36,288 36,288 36,371 36,371 35,700 35,700 32,794 32,794
Total liabilities 2,003,518 1,991,674 1,785,110 1,773,527 1,688,958 1,678,622 1,647,997 1,638,819 1,593,937 1,586,090
Stockholders’ equity:
Common stock 202 202 200 200 198 198 195 195 193 193
Additional paid-in capital 2,681,200 2,681,200 2,549,639 2,549,639 2,444,172 2,444,172 2,329,904 2,329,904 2,247,454 2,247,454
Accumulated other comprehensive
income (loss) 2,071 2,071 2,622 2,622 (2,588) (2,588) (9,032) (9,032) 799 799
Accumulated deficit (1,520,567) (1,406,865) (1,415,002) (1,318,596) (1,300,936) (1,208,482) (1,192,911) (1,100,669) (1,112,289) (1,022,166)
Total stockholders’ equity 1,162,906 1,276,608 1,137,459 1,233,865 1,140,846 1,233,300 1,128,156 1,220,398 1,136,157 1,226,280
Total liabilities and stockholders’ equity 3,166,424$ 3,268,282$ 2,922,569$ 3,007,392$ 2,829,804$ 2,911,922$ 2,776,153$ 2,859,217$ 2,730,094$ 2,812,370$
January 31,
Workday, Inc.
Condensed Consolidated Balance Sheets
(in thousands)
(unaudited)
April 30,July 31,January 31, October 31,

23
Consolidated Statements of Operations – FY17 & FY16
2017 (Original) 2017 (Adjusted for 606) 2016 (Original) 2016 (Adjusted for 606)
Revenues:
Subscription services 1,287,104$ 1,290,733$ 929,234$ 920,196$
Professional services 282,303 283,707 233,112 236,494
Total revenues 1,569,407 1,574,440 1,162,346 1,156,690
Costs and expenses:
Costs of subscription services 213,389 213,389 149,869 149,869
Costs of professional services 270,156 270,156 224,558 224,558
Product development 680,531 680,531 469,944 469,944
Sales and marketing 583,874 565,328 434,056 413,530
General and administrative 198,122 198,122 148,578 148,578
Total costs and expenses 1,946,072 1,927,526 1,427,005 1,406,479
Operating loss (376,665) (353,086) (264,659) (249,789)
Other expense, net (32,427) (32,427) (24,242) (24,242)
Loss before provision for (benefit from) income taxes (409,092) (385,513) (288,901) (274,031)
Provision for (benefit from) income taxes (814) (814) 1,017 1,017
Net loss (408,278) (384,699) (289,918) (275,048)
Net loss per share attributable to Class A and Class B common
stockholders, basic and diluted (2.06)$ (1.94)$ (1.53)$ (1.45)$
Weighted-average shares used to compute net loss per share
attributable to Class A and Class B common stockholders 198,214 198,214 190,016 190,016
Year Ended January 31, Year Ended January 31,
Workday, Inc.
Condensed Consolidated Statements of Operations
(in thousands, except per share data)
(unaudited)
24
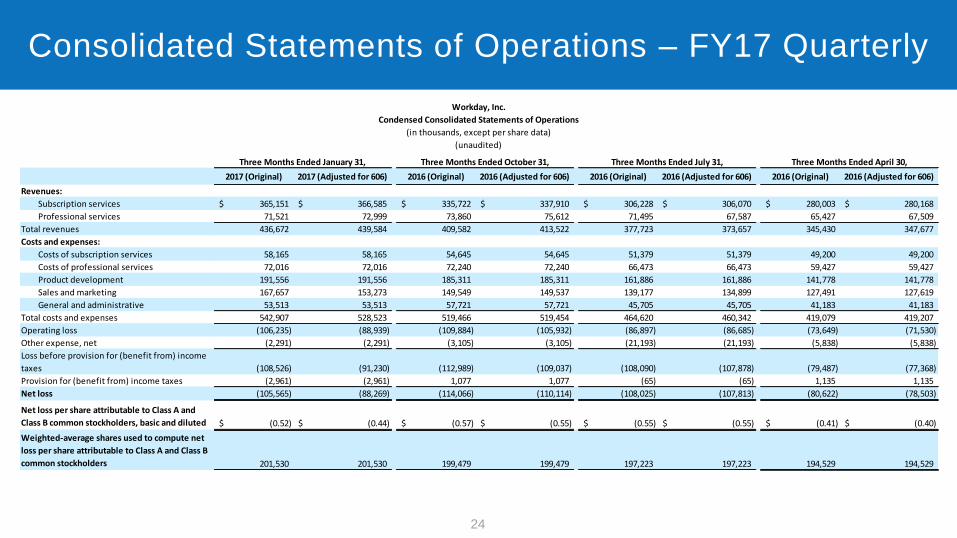
Consolidated Statements of Operations – FY17 Quarterly
2017 (Original) 2017 (Adjusted for 606) 2016 (Original) 2016 (Adjusted for 606) 2016 (Original) 2016 (Adjusted for 606) 2016 (Original) 2016 (Adjusted for 606)
Revenues:
Subscription services 365,151$ 366,585$ 335,722$ 337,910$ 306,228$ 306,070$ 280,003$ 280,168$
Professional services 71,521 72,999 73,860 75,612 71,495 67,587 65,427 67,509
Total revenues 436,672 439,584 409,582 413,522 377,723 373,657 345,430 347,677
Costs and expenses:
Costs of subscription services 58,165 58,165 54,645 54,645 51,379 51,379 49,200 49,200
Costs of professional services 72,016 72,016 72,240 72,240 66,473 66,473 59,427 59,427
Product development 191,556 191,556 185,311 185,311 161,886 161,886 141,778 141,778
Sales and marketing 167,657 153,273 149,549 149,537 139,177 134,899 127,491 127,619
General and administrative 53,513 53,513 57,721 57,721 45,705 45,705 41,183 41,183
Total costs and expenses 542,907 528,523 519,466 519,454 464,620 460,342 419,079 419,207
Operating loss (106,235) (88,939) (109,884) (105,932) (86,897) (86,685) (73,649) (71,530)
Other expense, net (2,291) (2,291) (3,105) (3,105) (21,193) (21,193) (5,838) (5,838)
Loss before provision for (benefit from) income
taxes (108,526) (91,230) (112,989) (109,037) (108,090) (107,878) (79,487) (77,368)
Provision for (benefit from) income taxes (2,961) (2,961) 1,077 1,077 (65) (65) 1,135 1,135
Net loss (105,565) (88,269) (114,066) (110,114) (108,025) (107,813) (80,622) (78,503)
Net loss per share attributable to Class A and
Class B common stockholders, basic and diluted (0.52)$ (0.44)$ (0.57)$ (0.55)$ (0.55)$ (0.55)$ (0.41)$ (0.40)$
Weighted-average shares used to compute net
loss per share attributable to Class A and Class B
common stockholders 201,530 201,530 199,479 199,479 197,223 197,223 194,529 194,529
Three Months Ended October 31,Three Months Ended January 31, Three Months Ended July 31, Three Months Ended April 30,
Workday, Inc.
Condensed Consolidated Statements of Operations
(in thousands, except per share data)
(unaudited)

25
Consolidated Statements of Cash Flows – FY17 & FY16
2017 (Original) 2017 (Adjusted for 606) 2016 (Original) 2016 (Adjusted for 606)
Cash flows from operating activities
Net loss (408,278)$ (384,699)$ (289,918)$ (275,048)$
Adjustments to reconcile net loss to net cash provided by (used in) operating activities:
Depreciation and amortization 115,885 115,885 85,939 85,939
Share-based compensation expenses 372,272 372,272 249,970 249,970
Amortization of deferred costs 25,577 45,345 23,477 36,016
Amortization of debt discount and issuance costs 26,947 26,947 25,518 25,518
Gain on sale of cost method investment (65) (65) (3,220) (3,220)
Impairment of cost method investment 15,000 15,000 — —
Other (1,982) (1,982) 1,047 1,047
Changes in operating assets and liabilities, net of business combinations:
Accounts receivable (88,639) (91,755) (105,264) (115,776)
Deferred costs (44,533) (82,848) (33,899) (66,964)
Prepaid expenses and other assets (20,847) (18,765) (28,366) (20,121)
Accounts payable 6,336 6,336 6,824 6,824
Accrued expense and other liabilities 23,367 23,367 59,724 59,724
Unearned revenue 327,615 323,617 266,805 274,728
Net cash provided by (used in) operating activities 348,655 348,655 258,637 258,637
Cash flows from investing activities
Purchases of marketable securities (1,917,238) (1,917,238) (2,125,841) (2,125,841)
Maturities of marketable securities 1,986,031 1,986,031 1,901,858 1,901,858
Sales of available-for-sale securities 133,292 133,292 102,711 102,711
Business combinations, net of cash acquired (147,879) (147,879) (31,436) (31,436)
Owned real estate projects (106,997) (106,997) — —
Capital expenditures, excluding owned real estate projects (120,813) (120,813) (133,667) (133,667)
Purchases of cost method investments (300) (300) (16,550) (16,550)
Sale of cost method investment 5,315 5,315 3,538 3,538
Other (296) (296) (760) (760)
Net cash provided by (used in) investing activities (168,885) (168,885) (300,147) (300,147)
Cash flows from financing activities
Proceeds from issuance of common stock from employee equity plans 58,079 58,079 45,656 45,656
Principal payments on capital lease obligations — — (3,193) (3,193)
Other 1,602 1,602 1,646 1,646
Net cash provided by (used in) financing activities 59,681 59,681 44,109 44,109
Effect of exchange rate changes 385 385 (704) (704)
Net increase (decrease) in cash and cash equivalents 239,836 239,836 1,895 1,895
Cash and cash equivalents at the beginning of period 300,087 300,087 298,192 298,192
Cash and cash equivalents at the end of period 539,923$ 539,923$ 300,087$ 300,087$
Year Ended January 31, Year Ended January 31,
Workday, Inc.
Condensed Consolidated Statements of Cash Flows
(in thousands)
(unaudited)

26
Consolidated Statements of Cash Flows – FY17 Quarterly
2017 (Original) 2017 (Adjusted for 606) 2016 (Original) 2016 (Adjusted for 606) 2016 (Original) 2016 (Adjusted for 606) 2016 (Original) 2016 (Adjusted for 606)
Cash flows from operating activities
Net loss (105,565)$ (88,269)$ (114,066)$ (110,114)$ (108,025)$ (107,813)$ (80,622)$ (78,503)$
Adjustments to reconcile net loss to net cash provided by (used in)
operating activities:
Depreciation and amortization 32,646 32,646 30,453 30,453 26,662 26,662 26,124 26,124
Share-based compensation expenses 105,717 105,717 100,098 100,098 88,222 88,222 78,235 78,235
Amortization of deferred costs 7,057 12,428 6,507 11,561 6,140 10,917 5,873 10,439
Amortization of debt discount and issuance costs 6,876 6,876 6,782 6,782 6,690 6,690 6,599 6,599
Gain on sale of cost method investment — — — — (65) (65) — —
Impairment of cost method investment — — — — 15,000 15,000 — —
Other (3,660) (3,660) 78 78 1,918 1,918 (318) (318)
Changes in operating assets and liabilities, net of business
combinations:
Accounts receivable (113,334) (117,044) (20,360) (20,693) (55,992) (52,337) 101,047 98,319
Deferred costs (21,286) (41,041) (7,973) (13,040) (10,486) (19,541) (4,788) (9,226)
Prepaid expenses and other assets (6,744) (5,685) (1,425) (3,783) (11,902) (10,334) (776) 1,037
Accounts payable 4,256 4,256 2,260 2,260 1,542 1,542 (1,722) (1,722)
Accrued expense and other liabilities (6,252) (6,252) 30,591 30,591 (6,517) (6,517) 5,545 5,545
Unearned revenue 209,761 209,500 38,514 37,266 53,071 51,914 26,269 24,937
Net cash provided by (used in) operating activities 109,472 109,472 71,459 71,459 6,258 6,258 161,466 161,466
Cash flows from investing activities
Purchases of marketable securities (345,482) (345,482) (380,620) (380,620) (557,180) (557,180) (633,956) (633,956)
Maturities of marketable securities 371,536 371,536 449,592 449,592 539,315 539,315 625,588 625,588
Sales of available-for-sale securities 41,100 41,100 63,340 63,340 28,652 28,652 200 200
Business combinations, net of cash acquired — — (144,209) (144,209) (3,670) (3,670) — —
Owned real estate projects (21,518) (21,518) (59,705) (59,705) (6,788) (6,788) (18,986) (18,986)
Capital expenditures, excluding owned real estate projects (32,278) (32,278) (27,518) (27,518) (26,539) (26,539) (34,478) (34,478)
Purchases of cost method investments — — — — (200) (200) (100) (100)
Sale of cost method investment 5,000 5,000 — — 315 315 — —
Change in restricted cash 100 100 3,900 3,900 (4,000) (4,000) — —
Other — — — — (684) (684) 388 388
Net cash provided by (used in) investing activities 18,458 18,458 (95,220) (95,220) (30,779) (30,779) (61,344) (61,344)
Cash flows from financing activities
Proceeds from issuance of common stock from employee equity plans 24,812 24,812 4,491 4,491 25,395 25,395 3,381 3,381
Other 596 596 435 435 195 195 376 376
Net cash provided by (used in) financing activities 25,408 25,408 4,926 4,926 25,590 25,590 3,757 3,757
Effect of exchange rate changes 28 28 (137) (137) (144) (144) 638 638
Net increase (decrease) in cash and cash equivalents 153,366 153,366 (18,972) (18,972) 925 925 104,517 104,517
Cash and cash equivalents at the beginning of period 386,557 386,557 405,529 405,529 404,604 404,604 300,087 300,087
Cash and cash equivalents at the end of period 539,923$ 539,923$ 386,557$ 386,557$ 405,529$ 405,529$ 404,604$ 404,604$
Three Months Ended April 30,Three Months Ended January 31, Three Months Ended October 31, Three Months Ended July 31,
Workday, Inc.
Condensed Consolidated Statements of Cash Flows
(in thousands)
(unaudited)