arvind ltd. - think invert cmp target rating rs.277...
TRANSCRIPT

Arvind ltd. - Think InvertCMP
Rs.277
Target
Rs.323
Rating
BUY
Stock performance (%)
1m 3m 12m
ARVND 2% -6% -3%
Sensex 8% -1% -13%
BSE CONSDIS 6% -4% -2%
Financial summary
Year Revenues (Rs. mn) EBITDA (Rs. mn) PAT (Rs. mn) EPS (Rs.) P/E(x) ROE (%)
FY16E 83,030 10,560 3,546 13.7 20.2 12.4%
FY17E 96,640 12,825 4,701 18.2 15.2 14.8%
FY18E 1,13,654 15,682 6,824 26.4 10.5 18.9%
Date 15th March 2016
Market Data
Bloomberg ARVND IN
Shares o/s 258mn
Market Cap Rs. 72bn
52-wk High-Low Rs. 366-216
3m Avg. Daily Vol Rs. 627mn
Index member BSEMDCAP
Latest shareholding (%)
Promoters 43.8
Institutions 39.7
Public 16.5
Follow-up noteInvert, always invert: Turn a situation or problem upside down. Look at it backward. What happens if all our plans go wrong?
Where don’t we want to go, and how do you get there? Instead of looking for success, make a list of how to fail instead …..
Tell me where I’m going to die, that is, so I don’t go there. – Charlie Munger
Invert thinking is perhaps the most powerful thinking tool available to neutralise the bias(es) that one may have in their approach to
any investment idea(s). This becomes more imperative where the runway for growth appears extremely long and lucrative. We have
been bullish on Arvind Ltd (ARVND) since our initiation (Click here to read our initiation report) and continue to retain our positive bias
solely for the Brands business, the opportunity of which is humungous. Given the robust brands ARVND has in its portfolio, if their set
‘vision’ is executed properly, it would be one of the best stories ever witnessed in the history of Indian apparel sector.
However, we also believe ARVND in its current avatar, is a complex business with too many moving parts. Hence, this note
broadly focuses on the possible ‘blind spots’ to watch out for and ‘positive triggers’ ahead…
Despite realizing the susceptibility of the textile business and diversifying up the value chain into related ‘brands and retail’ (B&R)
business, the B&R segment still accounts for only ~30% of total revenues and ~12% of EBITDA clearly indicating that the story is still
‘work in progress’ and currently in the transition stage.
The success of any brand story playing out depends on three factors viz. Brand, Resource and Execution. Though the management
has a decent execution history, the pace at which the ‘desired’ vision is fulfilled depends a lot on many other factors as well which are
both within and ‘without’ the control of the management. With already 30+ brands in the portfolio and still counting, capital allocation
and execution needs of the long tail of brands need to be balanced with the already established ones.
Hence, in a bumpy ride it is best to ensure that each one’s ‘Achilles heel’ doesn't further the damage, which in ARVND’s case is its
debt. Though debt currently on ARVND’s books is manageable (debt-equity ratio as on date is ~1.2 times), any deterioration of the
same can significantly dent the financial standing of the company.
….ARVND’s portfolio of brands are rightly placed to make the most out of the evolving trends in lifestyle consumption space
Affinity towards the western brands coupled with increased spending by the new age Indian consumer has also enabled several
western brands, across categories, growing at rapid pace off-late. We believe ARVND’s portfolio comprising of several exciting
western brands and ‘western imitable private brands’ should be a key beneficiary of this trend and ARVND would be the best proxy to
play the trend. Massive success of these brands in other ‘emerging economies’ further reaffirms our stance..
We continue to retain our positive stance on ARVND based on the size of the opportunity and ARVND’s portfolio of brands to
capitalise the same. However, appreciating the complexity of the drivers and execution challenges involved, we believe
monitoring financial leverage level will be extremely crucial during the ‘vision’ fulfilling journey as controlled debt can give
the luxury to accommodate the volatility in the macro cycle, gestation in the evolving consumption habits and any
unaccounted disruptions. We retain BUY with a TP of Rs.323 valuing ARVND on SOTP basis (implied PE of ~18x F17E EPS).
Page 1
Tejash Shah
+91 22 4228 8155
Gnanasundaram S
+91 44 4344 0062
Madhav PVR
+91 44 4344 0060
Executive Summary

Arvind ltd. - Think InvertCMP
Rs.277
Target
Rs.323
Rating
BUY
Page 2
Blind Spots Vs Positive Triggers
Blind Spots Positive Triggers
#1 Too much is too
thin?
#2 Two decade old
Megamart business
remains a ‘rebellious
child’
#3A Continues to be in a capex mode
across verticals …
#3B – …funded by currently steady
state (but vulnerable) cash flows from
Textiles…
#3C…hence leverage remains
to be crucially monitored #4 Increasing proportion of B2C
segment revenues can lead to
valuation re-rating
#3
Investments into new-gen
businesses…. lottery
tickets
#2 Steady state
textile business to
play a supporting
role
#1 Huge non-linearity in
brands business keeps us
exhilarated
***Achilles’ heel***
Arvind ltd. - Think InvertCMP
Rs.277
Target
Rs.323
Rating
BUY
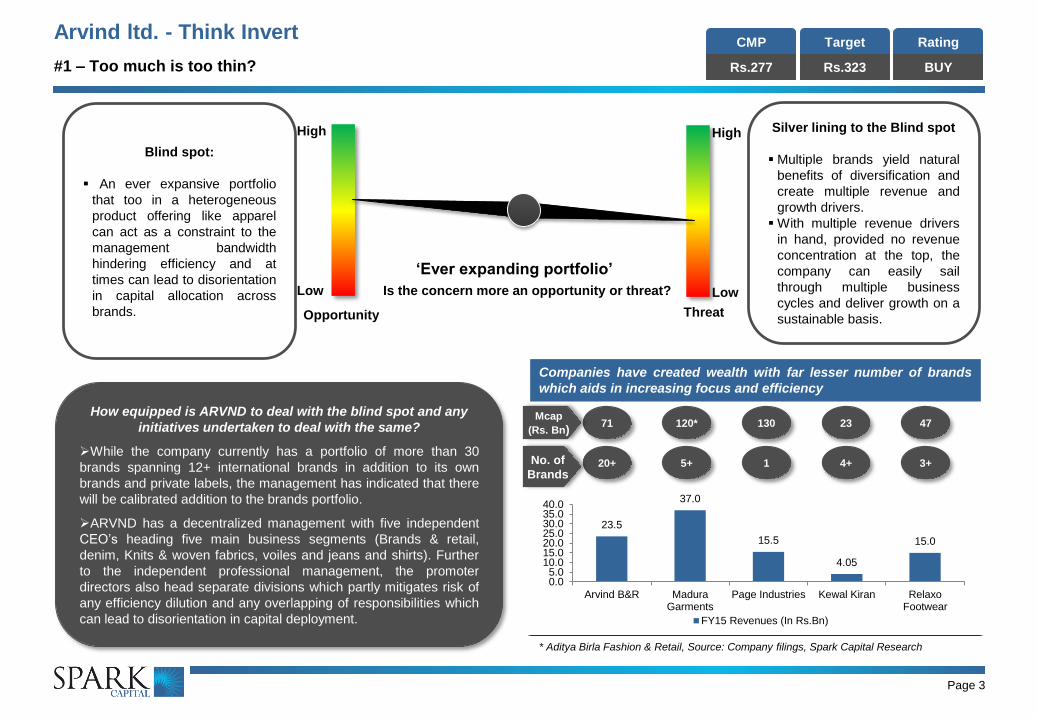
23.5
37.0
15.5
4.05
15.0
0.05.0
10.015.020.025.030.035.040.0
Arvind B&R MaduraGarments
Page Industries Kewal Kiran RelaxoFootwear
FY15 Revenues (In Rs.Bn)
#1 – Too much is too thin?
Page 3
How equipped is ARVND to deal with the blind spot and any
initiatives undertaken to deal with the same?
While the company currently has a portfolio of more than 30
brands spanning 12+ international brands in addition to its own
brands and private labels, the management has indicated that there
will be calibrated addition to the brands portfolio.
ARVND has a decentralized management with five independent
CEO’s heading five main business segments (Brands & retail,
denim, Knits & woven fabrics, voiles and jeans and shirts). Further
to the independent professional management, the promoter
directors also head separate divisions which partly mitigates risk of
any efficiency dilution and any overlapping of responsibilities which
can lead to disorientation in capital deployment.
Silver lining to the Blind spot
Multiple brands yield natural
benefits of diversification and
create multiple revenue and
growth drivers.
With multiple revenue drivers
in hand, provided no revenue
concentration at the top, the
company can easily sail
through multiple business
cycles and deliver growth on a
sustainable basis.Opportunity Threat
Is the concern more an opportunity or threat?
Blind spot:
An ever expansive portfolio
that too in a heterogeneous
product offering like apparel
can act as a constraint to the
management bandwidth
hindering efficiency and at
times can lead to disorientation
in capital allocation across
brands.
Companies have created wealth with far lesser number of brands
which aids in increasing focus and efficiency
* Aditya Birla Fashion & Retail, Source: Company filings, Spark Capital Research
20+ 5+ 1 4+ 3+No. of
Brands
71 120* 130 23 47Mcap
(Rs. Bn)
Low
High
Low
High
‘Ever expanding portfolio’

Arvind ltd. - Think InvertCMP
Rs.277
Target
Rs.323
Rating
BUY#1 – Too much is too thin?
Page 4
1980………………………..1995…………………....2000….....................2005….2008.……………...2010…2013…………..……2016
Own brand
‘True
Blue’
Source: Company filings, Media snippets & Spark Capital Research
Exit brands

Arvind ltd. - Think InvertCMP
Rs.277
Target
Rs.323
Rating
BUY#2 – Two decade old Megamart business remains a ‘rebellious child’
Page 5
How equipped is ARVND to deal with the blind spot and any
initiatives undertaken to deal with the same?
ARVND recently undertook another attempt to turnaround its long
ailing retail chain viz. Megamart. In a short span of ~15 days in the
months of August and September, the company converted around ~35
Megamart stores into their newly branded ‘Unlimited’ stores. We
understand that out of the 176 stores which existed till last year, 55
stores were closed in the current year, 35 stores have been converted
into ‘Unlimited’ stores which are expected to generate ~70% of Sales
and the remaining 50 profitable stores operate in the old format.
We understand that the latest revamp in Megamart might be the last
of the changes. While the management believes the business might
take a year before consolidation happens and healthy growth is
witnessed, we believe further delay in revival might lead to
management seriously considering continuation of the retail chain.
Silver lining to the Blind spot
Understanding that its discount-
apparel format Megamart is not
capital efficient, ARVND has
moved to value fashion retail by
revamping Megamart to
‘Unlimited’.
While majority of ARVND’s
brands are targeted at the upper
middle class and the rich,
Megamart/Unlimited ensures the
company benefits from the
evolving Indian middle class by
playing the conversion game of
‘unorganised to organised’.
Blind spot:
Sustainable business model still
not in place for Megamart even
post two decades of operation.
Further, there has been no ‘proof
of concept’ of a successful
discounted retail model in India.
‘Megamart business’
Opportunity Threat
Is the concern more an opportunity or threat?
Tepid growth in Megamart revenues over the last four years with
profitability nowhere close to desired
Source: Company filings, Spark Capital Research
1.89 2.92 3.97 4.99 5.07 5.49 5.600
1
2
3
4
5
6
FY 09 FY 10 FY 11 FY 12 FY 13 FY 14 FY 15
In R
s.B
n
Megamart Revenues (In Bn)
Further to the fact that a
successful discounted retail chain
is yet to emerge in the country, we
believe Megamart is possibly an
unwanted diversion which drains
both management and financial
bandwidth given its history.
Low
High
Low
High

Arvind ltd. - Think InvertCMP
Rs.277
Target
Rs.323
Rating
BUY#3A – Continues to be in a capex mode across verticals …
Page 6
Though a blind spot is it the right way forward?
“Organisation don’t really have a choice; they must adapt or die,” –
Anonymous.
Though we note the fallacies of ARVND in still trying to build a
sustainable business model, we believe, ARVND is ‘effective’ if not
‘efficient’ since it is moving in the right direction of moulding its business
model into that which fits into the future and doesn't fade away in the
past especially in a fast changing sector like fashion. We believe in the
immense opportunity that exists both in ARVND’s B2C businesses and
the apparel sector.
Silver lining to the Blind spot
New and unproved business can
create disproportionate return at a
non-linear pace. In addition to
creating possible future drivers of
the organisation, new initiatives
(Creyate, Technical Textiles,
Arvind Internet) can create a
perception of a ‘young’ firm and
may strike a healthy chord with the
youth.
Blind spot:
Despite its vintage in the
industry ARVND’s business
model continues to be work in
progress. Though we understand
that the company is ‘firing on all
cylinders’ realizing the
susceptibility of its textile
business by diversifying up the
value chain; the vicious cycle of
established segments
compensating for ‘formative’
segments continues.
‘Lack of steady state growth path’
Opportunity Threat
Is the concern more an opportunity or threat?
Incremental capital employed tending clearly towards new and
others business segments
Capital Employed; Source: Company filings, Spark Capital Research
69% 62% 62% 60% 54% 49%
10%13% 14% 16%
19%20%
0%0% 0% 2%
3% 5%3% 3% 6% 2% 5% 6%
18% 21% 19% 20% 20% 20%
0%
10%
20%
30%
40%
50%
60%
70%
80%
90%
100%
FY 10 FY 11 FY 12 FY 13 FY 14 FY 15
Textiles Brands and Retail Real Estate Others Unallocable
Low
High
Low
High

Arvind ltd. - Think InvertCMP
Rs.277
Target
Rs.323
Rating
BUY#3B – …funded by currently steady state (but vulnerable) cash flows from Textiles…
Page 7
Want to play ARVND for its
brands business…f
…however since still in ‘WIP’
dependant on Textile segment for
cash flows..
…Textile business though steady state
is cyclical in nature…
f
“……But the promised benefits from these textile investments were
illusory. Many of our competitors, both domestic and foreign, were
stepping up to the same kind of expenditures and, once enough
companies did so, their reduced costs became the baseline for reduced
prices industry wide. Viewed individually, each company’s capital
investment decision appeared cost- effective and rational; viewed
collectively, the decisions neutralized each other and were irrational (just
as happens when each person watching a parade decides he can see a
little better if he stands on tiptoes). After each round of investment, all the
players had more money in the game and returns remained anemic” —
Warren Buffet (Letter to Shareholders – 1985 Annual Report)
Textile Segment
‘ Inability to scale
up from fabric to
garmenting’
‘ Excess capacity
absorbing higher
fund flow’
‘Currency
Fluctuations’
‘ New competitive
markets for
sourcing emerge’
‘Exclusion of India
from various FTA’s’
‘Demand tapering in
end user countries’
‘ Product
substitutes/
disruption’
‘Availability of
continued high
quality raw material’
…and is dependant on umpteen factors which
are both within & ‘without’ control of
ARVND’s management
f
‘Factors beyond control of ARVND’
‘Factors within
control of ARVND’

Arvind ltd. - Think InvertCMP
Rs.277
Target
Rs.323
Rating
BUY#3C – …hence leverage remains to be crucially monitored
Page 8
Rescheduling of Debt in 2009
On account of the weak business environment that
prevailed in the textile sector, ARVND had to
reschedule its debt in December 2008-January
2009. We understand that the company had
received approval to reschedule its term loan
obligations from its bankers that included State Bank
of India (SBI), Bank of Baroda, UCO Bank and ICICI
Bank for rescheduling term loan payment worth
Rs.150 million each for January and February 2009.
We also understand that CRISIL had downgraded
the ratings of the bank loan facilities of ARVND in
February 2009 to ‘D/P5’ from ‘BBB-/Negative/P3’ on
account of timeliness of payments stating that ‘it
believed ARVND’s internal accruals were unlikely to
be sufficient to meet its debt obligations and was in
discussion to reschedule its debt’.
Silver lining to the Blind spot
Majority of Textile companies
(refer slide 9) are highly
leveraged given the capital
intensive nature of business and
Arvind’s debt metrics are in-line
with the industry standards.
Natural benefits of having a
leveraged balance sheet
includes cheaper cost of capital,
and tax benefits among others
Blind spot:
ARVND already has reasonable
amount of debt on books which we
believe exerts pressure to
continuously deliver operating profits
to service debt.
Brief of Arvind’s Debt restructuring in 2001
In the mid 1990s, ARVND undertook a massive expansion of its denim capacity
despite the fact that alternate cotton fabrics were gradually replacing the demand
for denim. The expansion plan was funded by loans from both Indian and overseas
financial institutions. With the demand for denim slowing down, ARVND found it
difficult to service its debt obligations, and thus the interest burden on the loans shot
up. Consequently, in the late 1990s, ARVND ran into deep financial problems on
account of its huge debt burden and incurred huge losses. The company’s credit
rating had also been downgraded by CRISIL to “default” rating in October 2000
from “highest safety” in 1997.
Subsequently in 2001, the company announced a Rs.27bn plus debt restructuring
plan which the Gujarat High Court approved. This decision of the HC made the debt
restructuring plan legally binding on the company as well as on all lenders, including
the dissenting ones. The banks agreed to the buyback at a 55% discount on the
principal amount, while some agreed to a five year rollover for which they were
entitled to interest plus the principal. Some banks also agreed to a ten year rollover
for which they would be paid a higher rate of interest plus principal. The debtrevamp was estimated to reduce Arvind interest burden by 50%.
‘Leveraged Balance sheet’
Opportunity Threat
Is the concern more an opportunity or threat?
Though debt currently on
ARVND’s books is manageable, any
deterioration in the cash flow can
dent the financial standing of the
company. We believe an unlevered
balance sheet can give the luxury of
experimentation and ‘search’ for next
set of growth drivers.
Low
High
Low
High
Source: Media snippets and articles, Spark Capital Research

Arvind ltd. - Think InvertCMP
Rs.277
Target
Rs.323
Rating
BUY#3C – …hence leverage remains to be crucially monitored
Page 9
ARVND’s capital outlay has been majorly funded by external
sources over the last many years...
Source: Company filings, Spark Capital Research
ARVND’s capital structure though leveraged in line with many peers
in the textile and apparel segment
Source: Company filings, Spark Capital Research
2.26
4.493.68 3.88
5.975.30
1.652.20 2.48
3.68 3.82 3.70
0
1
2
3
4
5
6
7
FY 11 FY 12 FY 13 FY 14 FY 15 FY 16E
In R
s.B
n
Capex PAT
ARVND’s financial metrics though above average are not as robust
to have nil impact during tail ends as reflected in the past
Source: Company filings, Spark Capital Research
1.26
0.80
1.81
1.10
2.23
1.02
0.00
0.50
1.00
1.50
2.00
2.50
Arvind KPR TextileMills
WelspunIndia
Indo CountIndustry
BombayRayon
Fashion
Raymonds
FY15 Debt-equity ratio
6.085.34
-2.15
5.49
2.34 2.24 2.271.78 1.79
0.10 0.09
0.03
0.10 0.17 0.19 0.20 0.21 0.19
-4.00
-2.00
0.00
2.00
4.00
6.00
8.00
FY 07 FY 08 FY 09 FY 10 FY 11 FY 12 FY 13 FY 14 FY 15
Interest Coverge Ratio Net Cash Accruals to Total debt
...company to remain on capex mode given the nature of business
and formative stage of the new businesses
Source: Company filings, Spark Capital Research
71%
41% 36%
115%
134%
75%
100%107%
0%
20%
40%
60%
80%
100%
120%
140%
160%
FY 08 FY 09 FY 10 FY 11 FY 12 FY 13 FY 14 FY 15
Capex as a % of Cash from operating activities

Arvind ltd. - Think InvertCMP
Rs.277
Target
Rs.323
Rating
BUY
Page 10
Mitra Adiperkasa: A Case study worthwhile to LOOK with relevance to ARVND
About Mitra Adiperkasa (MAPI): Mitra Adiperkasa is an Indonesian retail company with a diversified portfolio that includes department stores, fashion,
sports equipment, food & beverages, supermarkets as well as lifestyle products. Mitra Adiperkasa has 1792 retail outlets, that contain over 150 brands, in
58 cities across Indonesia. The company is franchise holder of various and numerous well-known global brands such as Starbucks, Zara and Nine West.
What happened to MAPI?
MAPI’s EBITDA in a matter of eighteen months fell 13% in FY15 (for 12 months ending September 2015) Vs FY13 while its net profit dropped drastically to
IDR -4.6 from IDR 327.8 in FY13. The company’s share price correspondingly fell from peak of IDR 9,550 in May 2013 to low of IDR 2,800 in September
2015. The probable reason for the company’s drastic fall was on account of concurrence of multiple unrelated events simultaneously which are explained
below and we have over the next two pages attempted to ‘discuss and understand’ what the impact of the same factors if occurred on ARVND.
Possible Reasons for
MAPI’s crisis?
#4
Sudden unfavorable
government
regulation
#5
Significant
depreciation of
home currency
#6
Aggressive debt-
funded expansion
#1
Rising inflation leading
to declining
purchasing power
#2
Consequences of
economic slowdown
and domestic
recession
#3
Long merchandise
procurement lead time
with majority of goods
sold being imported

Arvind ltd. - Think InvertCMP
Rs.277
Target
Rs.323
Rating
BUY
Page 11
Possible reasons for MAPI’s crisis & its relevance for ARVND?
Source: Industry sources, Spark Capital Research
Factor Affect of external/internal factors on MAPI Probable affect of similar factors on ARVND
#1
Statutory wage increase
as imposed by the
government
The Jakarta government raised the minimum wage by ~44% in 2013
and thereafter risen at a slower pace of around 10% while wages in
other parts of Indonesia rose around ~20 to ~30% levels. Hence with
biggest cost increases being witnessed in payroll not only did the
minimum wages of existing employees increase, the company was also
impacted since it added a lot of new employees as part of its expansion
who were to be paid as per the revised wage levels account of declining
purchasing power.
Though we believe the possibilities of the
central/state governments increasing wages drastically
like in the case of Indonesia is remote; we note that
any significant increase in labour cost can hinder
ARVND’s profitability with employee costs accounting
for ~9% to ~11% of revenues. Further, ARVND derives
more than ~60% of its revenues from the Textile
business which is labour intensive and the USP for
manufacturing in India being ‘cheap labour’.
#2
Consequences of
economic slowdown and
domestic recession
On the back of weak growth, four year low consumption and eight
year low consumer lending (in September 2014), MAPI was affected by
the economic slowdown on back of widespread job losses coupled with
bad festive season leading to weak purchasing power.
Though ARVND has a fair mix of revenues from
exports and domestic sales, any economic slowdown
(both globally or domestically) can affect the company
negatively with majority of the company’s portfolio of
brands (both retail and contract manufacturing)
dependant on disposable income for sales and growth.
#3
Long merchandise
procurement lead time
with majority of goods
sold being imported
MAPI inherently suffers from a long product procurement with a lead
time of 6-9 months, thus the company lacks flexibility to adjust inventory
levels quickly enough to adjust to changes in the external demand
environment. Further, analysis of MAPI’s inventory trends shows that its
inventory intensity rose sharply during periods of economic slowdown.
The procurement cycle is inherent to MAPI’s operating model that
entails imports of merchandize from multiple global brands.
ARVND unlike MAPI manufactures majority of its
goods domestically hence has greater control to adjust
inventory with on the back of lower product
procurement and lead time.

Arvind ltd. - Think InvertCMP
Rs.277
Target
Rs.323
Rating
BUY
Page 12
Possible reasons for MAPI’s crisis & its relevance for ARVND?
Source: Industry sources, Spark Capital Research
Factor Affect of external/internal factors on MAPI Probable affect of similar factors on ARVND
#4
Sudden unfavorable
government regulation
In 2015, to address the concern of slowing growth in the country the
Indonesian government hiked import tariffs (by 5% to 10%) on import of
clothing from countries [alongside hiking tariff on a array of consumer
goods in a bid to revive domestic manufacturing] with whom Indonesia
did not have a free trade agreement (FTA). With majority of MAPI’s
goods fully imported, the move severely impacted MAPI which was
already facing demand issues.
With majority of ARVND’s foreign label merchandise
being manufactured in India with minimal imports, any
such move by the Indian government to hike tariff on
imported goods is not expected to majorly impact
ARVND.
#5
Significant depreciation of
domestic currency
In between June 2013 and August 2015 Indonesian rupiah declined
~38% against the US dollar to decade low [from the time indications of
tapering of quantitative easing came to light] and lately has been
touching 17-year lows. With MAPI heavily dependant on imports, rupiah
depreciation severely impacted the company’s margin profile and
revenue growth
With majority of ARVND’s foreign label merchandise
being manufactured in India with minimal imports,
depreciation of Indian rupee may not adversely affect
pricing however possibly could impact the royalty paid
though.
#6
Aggressive debt-funded
expansion
During the said period, MAPI aggressively expanded every year, which
led to increase in rents in turn leading to higher costs and losses in FY14.
After its establishment in the 1990s with a handful of stores, MAPI
expanded rapidly through franchise agreements with foreign companies
keen to tap Indonesia's growing consumer base. MAPI currently has
nearly 1,900 stores in 65 cities selling some 150 brands. Further, in
addition to capex with the economy facing an economic slowdown,
increasing prices were not an option and inventories had to be cleared
with heavy discounts leading to negative PAT in FY14.
Though ARVND has not been aggressive on its
capex front in its recent past, a long tail of business in
growth phase entails huge and incessant capex which
does pose a similar kind of threat though not to the
degree of impact on MAPI.

Arvind ltd. - Think InvertCMP
Rs.277
Target
Rs.323
Rating
BUYPositive Triggers
Page 13
Positive Triggers
In addition to the positive triggers which can catapult ARVND
significantly, following are the structural pillars on which the
positive triggers are expected to take off:
• Portfolio of strong brands straddled across price points:
ARVND brands encompassing several exciting global brands and
private label offerings are positioned across pricing pyramid which
we believe should enable ARVND to take advantage of consumer
migration at every price point. As the four power brands (Arrow, US
Polo, Flying Machine and Tommy Hilfiger - FY15 turnover Rs.
~13bn) continues to grow at a robust pace, we foresee huge non-
linearity in profitability of the non-power brands portfolio (FY15
turnover Rs. ~4bn) as it comes out of the investment phase from
FY16 onwards. We see an exciting opportunity for ARVND to create
an unparalleled portfolio of apparel brands (30+ brands currently)
which can command an EV of Rs. ~60bn alone by FY18e.
• ‘Preferred’ partner: ARVND being present across the textile value
chain is certainly beginning to emerge as a preferred partner for
several international brands. We also note that entrenched
distribution network of ARVND possessing ~989 key account POS in
India augurs well for them in attracting international brands. Further,
ARVND’s history suggests that seldom have their joint ventures or
licenced agreements ended in sour note, establishing their strong
execution capabilities. ARVND’s focussed initiatives to continuously
innovate across the apparel value chain from ‘fibre to fashion’ in
emerging technologies as technical textiles and e-commerce
underscores the company’s ability to understand emerging consumer
trend in fashion industry.
#4 Increasing proportion of B2C
segment revenues can lead to
valuation re-rating
#3
Investments into new-gen
businesses…. lottery
tickets
#2 Steady state
textile business to
play a supporting
role
#1 Huge non-linearity in
brands business keeps us
exhilarated

Arvind ltd. - Think InvertCMP
Rs.277
Target
Rs.323
Rating
BUY#1 Huge non-linearity in brands business keeps us exhilarated
Page 14
Tommy Hilfiger
Revenues –
CY14
Total Stores
Presence
Casual sportswear
brand for men, women
and kids targeted
primarily at the age
group between 25 years
to 40 years
Others
Description
Retailed in over 90
countries globally
Global Retail Sales:
$6.7bn
Revenues: $3.6bn
~1500+ stores with ~520
stores in Asia
EBIT Margin:14.2%
Derives ~10% of total
retail sales from Asia
Calvin Klein
Calvin Klein has four
brands viz. CK
Collection, CK
(platinum label), CK
(white label), CK Jeans
and CK Underwear; it is
also a licensor for a
range of products,
including fragrance,
women's apparel,
footwear, eyewear,
watches and jewellery
Retailed in over 100
countries globally
Global Retail Sales:
$8.1bn
Revenues: $2.9bn
~2730 stores with ~1600
stores in Asia
EBIT Margin:14.0%
GAP
Leading global
specialty retailer
offering clothing,
accessories and
personal care products
for men, women,
children and
babies.with a portfolio
of five brands viz. GAP,
Banana Republic, Old
Navy, Athleta &
Intermix
Retailed in over ~50
countries and sold online
in ~90+ countries
Net Sales: $16.4bn
~3700+ stores worldwide
with
Operating Margin:
~12.7%
Net Sales/Sq.ft: $361
US Polo
U.S. Polo Assn. brand
is the official brand of
the United States Polo
Association (USPA). It’s
wholly owned
subsidiary partners
with licensees to
provide consumers
with branded apparel,
accessories, luggage,
watches, shoes, small
leather goods, eyewear
and home furnishings.
The company’s brand is
licensed in over 135
countries.
NA
NA
Among Top 50 global
licensors
Aeropostale
Aéropostale, Inc. is a
mall-based, specialty
retailer of casual
apparel and
accessories, principally
targeting 14 to 17 year-
old young women and
men through its
Aéropostale® stores
and 4 to 12 year-old
kids through its P.S.
from Aéropostale™
stores
Outside US & Canada its
licensees operate ~239
stores 13 countries
Net Sales: ~$1.84bn
~1050+ stores across the
world
Net Sales/Sq.ft: $403
Source: Company filings, Spark Capital Research
ARVND’s portfolio includes some of the top brands in the world which clock billions of dollars in revenues worldwide annually

Arvind ltd. - Think InvertCMP
Rs.277
Target
Rs.323
Rating
BUY#1 Huge non-linearity in brands business keeps us exhilarated
Page 15
Source: Spark Capital Research
Luxury
Bridge To
Luxury
Mass Market
Entry Level
Premium
ARVND Brands
Luxury Apparel
brands
synonymous with
Multinational
brands
Premium Apparel
brands space has
a mix of Indian
and Multinational
brands
Brands can be
Indian but to be
positioned and
advertised as a
‘multinational’
brand.
ARVND’s robust portfolio straddled across segments stand out in their respecting categories

Arvind ltd. - Think InvertCMP
Rs.277
Target
Rs.323
Rating
BUY#1 Huge non-linearity in brands business keeps us exhilarated
Page 16
Snapshot of GAP’s journey and success in China; Though India is far away from where China is, GAP’s potential in emerging markets is
displayed
Snapshot of GAP in China:
Year Entered: 2010
Revenues: $300mn in 2013 and expected
to triple by 2016-17
Type of Entry in China: Direct
GAP Journey in China
CY2011
Opened 10 stores during the year and
closed the year with 14 stores totally in
five cities
CY2012Opened 30 stores during the year by
bringing in outlet business
CY2013
Opened over 30 stores including in 5
new additional cities. Ended the year
with presence in 21 cities
CY2014
Company ended the year with119
Stores including Old Navy
Company clocked $500 million of
revenues in just over four years of
entry
GAP entered China in November 2010 Fall with opening of
4 stores
CY2015
116 GAP stores and 10 old navy
stores as of October 2015 – Total
132 stores
Importance of GAP China in the words of Mr. Art Peck (CEO
of GAP Inc.)
“ In China, we opened our 100th store for Gap brand. I think that's
exciting. That's great progress. …Old Navy continues to do very
well inside of China. So with that combination, we feel very good
about as we look at China becoming the second most important
country to Gap, Inc. as we go forward”
“But, yeah, for us if the productivity per foot is better than average,
then in most cases you can assume we can get a better operating
margin for a total country than we have in North America so let's
hope that the sales per foot in China continues at the rates they
are right now.”
“And we think that's going to be by far our second biggest market
sooner rather than later. And I feel good about the performance all
around. And profitability is going to be there because we think that
the economic model as we project forward and look at the
productivity in each one of our stores, we look at the gross margin
rate we think we can achieve based on three years of operating,
how the SG&A is going to flow, what the ROD is going to look like,
we believe the economic model for China is going to be very
attractive to the business.”
E-commerce
opened from
Day 1
Within 2
years of
entry outlet
centres
channel also
commenced
Source: Company filings, Spark Capital Research

Arvind ltd. - Think InvertCMP
Rs.277
Target
Rs.323
Rating
BUY#1 Huge non-linearity in brands business keeps us exhilarated
Page 17
Possible factors which we believe that worked in China & can play out in India as well
What worked in China?Snippets on GAP China in the words of the management
“We want to lead the way in bringing Omni-channel to life
in China. “It’s early days yet, but with the addition of virtual
experiences both in our Gap stores and in other non-
traditional locations, we hope to offer more points of
access to our Chinese customer so she can shop our
brands wherever, whenever and however she wants.”
“I think by the amount of capital we're spending there, the
amount of energy you're getting at the most senior level of
the company, China reports directly to me, I think it's a
real strong indicator to our shareholders and the analysts
that we believe we've got a tiger by the tail. And we think
that's going to be by far our second biggest market sooner
rather than later. And I feel good about the performance
all around. And profitability is going to be there because
we think that the economic model as we project forward
and look at the productivity in each one of our stores, we
look at the gross margin rate we think we can achieve
based on three years of operating, how the SG&A is going
to flow, what the ROD is going to look like, we believe the
economic model for China is going to be very attractive to
the business.”
“Everything in China we've uncovered so far is,
customers love fashion, it is a big family play, which
obviously fits for Old Navy and for Gap, value proposition,
but not discounting, just being money – not overpaying for
quality, which is a good definition of value, which is
important to the Chinese.”
- GAP Inc concalls – 2009-2015
Mix of Distribution Channel
f
Able Managementf
Creating a strong brand with
solid perception management f
Robust assortment mix
f
Tier 2 Cities penetration &
Chinese perception of valuef
The company operated with a different strategy in
China by commencing its online operations from Day
one. Further, within a short span of time GAP started
opening outlet stores in China in addition to specialty
stores having a healthy mix of all forms of retail. With
online channel and outlet format operating profitability
commanding higher profitability, the company’s
operating margins were close US GAP profitability
despite being in early stages of operations in China.
Glocal management : The company struck a balance
between the global marketing that operated out of New
York helping the Chinese team, in addition to having a
separate agency in China to speak and augment its
branding and communication.
The management believed in long term investment in
marketing and branding awareness. In the words of Mr.
Art Peck ‘the company did not sacrifice the near to mid-
term investments for a real great long-term business’.
In China, the kids and baby business index was much
higher into the overall business than the adult business.
Hence, with assortment of products better in China than
in North America with a favourable mix to kids and
baby, the same acted to be more of a relative strength.
Quoting GAP’s management from their concalls “Gap
right now is in some, let's call them for argument sake
Tier 4, Tier 5 cities, doing well. Everything in China
we've uncovered so far is, customers love fashion, it is
a big family play,, value proposition, but not
discounting, just being money – not overpaying for
quality, which is a good definition of value, which is
important to the Chinese”
Source: Company filings, Spark Capital Research

Arvind ltd. - Think InvertCMP
Rs.277
Target
Rs.323
Rating
BUY
PVH despite its vintage still trades in ~14 to ~20 band
Source: Bloomberg, Spark Capital Research
#1 Huge non-linearity in brands business keeps us exhilarated
Page 18
GAP one-year forward PE peaked at ~21 times in 2007
Source: Bloomberg, Spark Capital Research
H&M: With growth rate peaking, 1 year forward PE back to peak
valuations
Source: Bloomberg, Spark Capital Research
…Abercrombie & Fitch too at peak levels of ~26x one year forward
Source: Bloomberg, Spark Capital Research
Globally, apparel companies have traded at rich valuations even in matured markets
9
11
13
15
17
19
21
Dec-0
5
Ma
y-0
6
Oct-
06
Ma
r-07
Au
g-0
7
Jan
-08
Jun
-08
Nov-0
8
Ap
r-09
Se
p-0
9
Fe
b-1
0
Jul-1
0
Dec-1
0
Ma
y-1
1
Oct-
11
Ma
r-12
Au
g-1
2
Jan
-13
Jun
-13
Nov-1
3
Ap
r-14
Se
p-1
4
Fe
b-1
5
Jul-1
5
6
8
10
12
14
16
18
20
Dec-0
5
Ma
y-0
6
Oct-
06
Ma
r-07
Au
g-0
7
Jan
-08
Jun
-08
Nov-0
8
Ap
r-09
Se
p-0
9
Fe
b-1
0
Jul-1
0
Dec-1
0
Ma
y-1
1
Oct-
11
Ma
r-12
Au
g-1
2
Jan
-13
Jun
-13
Nov-1
3
Ap
r-14
Se
p-1
4
Fe
b-1
5
Jul-1
5
13
15
17
19
21
23
25
27
Dec-0
5
Ma
y-0
6
Oct-
06
Ma
r-07
Au
g-0
7
Jan
-08
Jun
-08
Nov-0
8
Ap
r-09
Se
p-0
9
Fe
b-1
0
Jul-1
0
Dec-1
0
Ma
y-1
1
Oct-
11
Ma
r-12
Au
g-1
2
Jan
-13
Jun
-13
Nov-1
3
Ap
r-14
Se
p-1
4
Fe
b-1
5
Jul-1
5
7
9
11
13
15
17
19
21
23
25
27
Dec-0
5
May-…
Oct-
06
Ma
r-07
Au
g-0
7
Jan
-08
Jun
-08
Nov-0
8
Ap
r-09
Se
p-0
9
Fe
b-1
0
Jul-1
0
Dec-1
0
May-…
Oct-
11
Ma
r-12
Au
g-1
2
Jan
-13
Jun
-13
Nov-1
3
Ap
r-14
Se
p-1
4
Fe
b-1
5
Jul-1
5

Arvind ltd. - Think InvertCMP
Rs.277
Target
Rs.323
Rating
BUY#1 Huge non-linearity in brands business keeps us exhilarated
Page 19
6.2 6.9 8.3 9.1 12.5 18.1 22.4 25.2 32.3 37.4
9.4%11.7%
8.1%
0.2% -0.3% 7.6%
8.8% 9.7%12.0% 12.4%11%
20%
29%
64%
72%
-10.0%
0.0%
10.0%
20.0%
30.0%
40.0%
50.0%
60.0%
70.0%
80.0%
0
5
10
15
20
25
30
35
40
FY06 FY07 FY08 FY09 FY10 FY11 FY12 FY13 FY14 FY15
Rs.b
n
Madura Garments Revenue Madura Garments EBITDA Margin Madura Garments ROACE
As exhibited in Madura garments, we
believe margins and capital
efficiency significantly increase as
brands achieve a certain milestone
revenue mark.
Other Brands expected to start generating profits by FY17…
Source: Company, Spark Capital Research
…leading to massive improvement in overall brands profitability
Source: Company, Spark Capital Research
1,1853,724 5,251 7,904 12,455
-43.5%
-12.4%
-2.0%
6.0% 7.0%
-50.0%
-40.0%
-30.0%
-20.0%
-10.0%
0.0%
10.0%
0
2000
4000
6000
8000
10000
12000
14000
FY 14 FY 15 FY 16E FY 17E FY 18E
Rs.m
n
Other Brands Revenue Other brands EBITDA%
847 1,058 1,957 3,126 4,239
6.5%
6.2%
9.3%
11.3%11.6%
0.0%
2.0%
4.0%
6.0%
8.0%
10.0%
12.0%
14.0%
0
500
1000
1500
2000
2500
3000
3500
4000
4500
FY 14 FY 15 FY 16E FY 17E FY 18E
Rs.m
n
Brands EBITDA Brands EBITDA%

Arvind ltd. - Think InvertCMP
Rs.277
Target
Rs.323
Rating
BUY#2 Steady state textile business to play a supporting role
Page 20
…without compromising on margins leading…
Source: Company, Spark Capital Research
Arvind’s textiles business has managed to deliver healthy revenue growth across macro-economic cycles…
Source: Company, Spark Capital Research
…to strong cash flow generation over years to fund other businesses
Source: Company, Spark Capital Research
1393 1623
3191
1889 1701
23892879
38504.7%
6.1% 6.3%
9.6%
12.7%13.3% 13.4%
12.6%
0.0%
2.0%
4.0%
6.0%
8.0%
10.0%
12.0%
14.0%
16.0%
0
500
1000
1500
2000
2500
3000
3500
4000
4500
FY08 FY09 FY10 FY11 FY12 FY13 FY14 FY15
RO
CE
Rs.m
n
Standalone Free Cash flows (Rs.mn) Standalone ROCE
10.6%
-2.6%
23.7% 24.5%
13.0%
8.1%
25.6%
9.0%
1.8%
9.9% 9.8%
1.5%
-2.0%4.1% 3.0% 2.4% 2.5% 2.6% 2.9% 3.2% 3.2% 3.2%
3.9%
8.5%10.3%
6.6%5.1%
6.9%
7.2%
7.5%7.5% 7.6% 7.7%
-5.0%
0.0%
5.0%
10.0%
15.0%
20.0%
25.0%
30.0%
FY08 FY09 FY10 FY11 FY12 FY13 FY14 FY15 FY16E FY17E FY18E
Textiles segment Revenue growth (%) Global GDP growth (%) India GDP growth (%)
3.38 2.90 3.654.94
6.48 6.43
8.56 8.98 8.979.76
10.93
16.7%
14.7% 15.0%16.3%
18.9%17.4%
18.4%17.7% 17.4% 17.2% 17.5%
0.0%
2.0%
4.0%
6.0%
8.0%
10.0%
12.0%
14.0%
16.0%
18.0%
20.0%
0.00
2.00
4.00
6.00
8.00
10.00
12.00
FY08 FY09 FY10 FY11 FY12 FY13 FY14 FY15 FY16EFY17EFY18E
Textile Segment EBITDA (Rs.bn) Textile segment EBITDA margins (%)
Arvind ltd. - Think InvertCMP
Rs.277
Target
Rs.323
Rating
BUY#3 Investments into new-gen business…. a lottery ticket
Page 21
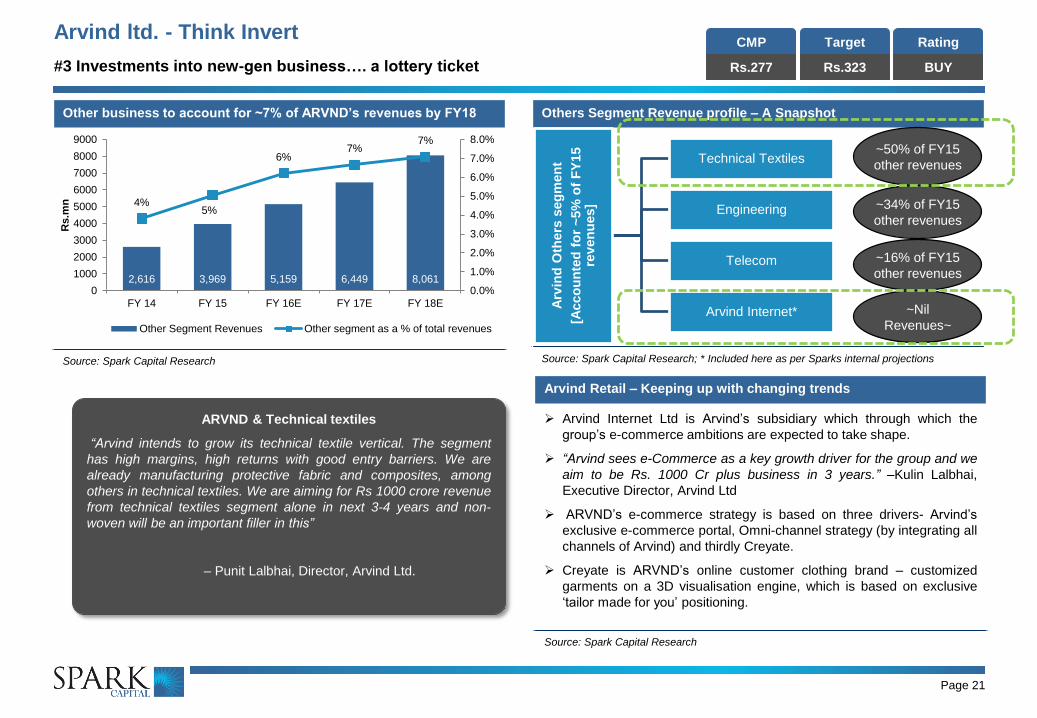
Other business to account for ~7% of ARVND’s revenues by FY18
Source: Spark Capital Research
Others Segment Revenue profile – A Snapshot
Source: Spark Capital Research; * Included here as per Sparks internal projections
Arvind Retail – Keeping up with changing trends
Arvind Internet Ltd is Arvind’s subsidiary which through which the
group’s e-commerce ambitions are expected to take shape.
“Arvind sees e-Commerce as a key growth driver for the group and we
aim to be Rs. 1000 Cr plus business in 3 years.” –Kulin Lalbhai,
Executive Director, Arvind Ltd
ARVND’s e-commerce strategy is based on three drivers- Arvind’s
exclusive e-commerce portal, Omni-channel strategy (by integrating all
channels of Arvind) and thirdly Creyate.
Creyate is ARVND’s online customer clothing brand – customized
garments on a 3D visualisation engine, which is based on exclusive
‘tailor made for you’ positioning.
Source: Spark Capital Research
ARVND & Technical textiles
“Arvind intends to grow its technical textile vertical. The segment
has high margins, high returns with good entry barriers. We are
already manufacturing protective fabric and composites, among
others in technical textiles. We are aiming for Rs 1000 crore revenue
from technical textiles segment alone in next 3-4 years and non-
woven will be an important filler in this”
– Punit Lalbhai, Director, Arvind Ltd.A
rvin
d O
thers
seg
men
t
[Acco
un
ted
fo
r ~
5%
of
FY
15
rev
en
ues]
Technical Textiles
Engineering
Telecom
Arvind Internet*
~50% of FY15
other revenues
~34% of FY15
other revenues
~16% of FY15
other revenues
~Nil
Revenues~
2,616 3,969 5,159 6,449 8,061
4%5%
6%7%
7%
0.0%
1.0%
2.0%
3.0%
4.0%
5.0%
6.0%
7.0%
8.0%
0
1000
2000
3000
4000
5000
6000
7000
8000
9000
FY 14 FY 15 FY 16E FY 17E FY 18E
Rs.m
n
Other Segment Revenues Other segment as a % of total revenues

Arvind ltd. - Think InvertCMP
Rs.277
Target
Rs.323
Rating
BUY#4 Increasing proportion of B2C segment revenues can lead to valuation re-rating
Page 22
B&R segment growth driving the company’s growth trajectory…
Source: Spark Capital Research
…to further increase with increasing proportion of B&R revenues
Source: Spark Capital Research
10%3%
23%
3%
19%25%
21%
7%
30%
14%
39%
28%
68%
14%
5%
40%
33%
6%
36%
23%
0%
10%
20%
30%
40%
50%
60%
70%
80%
FY06 FY07 FY08 FY09 FY10 FY11 FY12 FY13 FY14 FY15
Revenue growth B&R growth
0%
10%
20%
30%
40%
50%
60%
70%
80%
90%
100%
FY06 FY07 FY08 FY09 FY10 FY11 FY12 FY13 FY14 FY15
Textiles Brands & Retail Real Estate Others
Brands & Retail business to grow at ~24% CAGR over next 3 years
Source: Company, Spark Capital Research
Brands & Retail business is expected to grow at ~24% CAGR in 3
years led by
(1) Steady growth of power brands
(2) Non-linear growth of non-power and other new brands,
with some of them expected to ‘graduate’ to power brand
‘status’
(3) Incremental growth of power brands once some of them
reach inflection point of ‘Rs.8bn to Rs.10bn’ in company
revenues.
14.0419.15
23.5027.07
34.40
44.38
5.3% 5.2% 5.2%
6.8%
8.9%
10.2%
0.0%
2.0%
4.0%
6.0%
8.0%
10.0%
12.0%
0
5
10
15
20
25
30
35
40
45
50
FY 13 FY 14 FY 15 FY 16E FY 17E FY 18E
In R
s.B
n
Brands & Retail Revenues Brands & Retail EBITDA %

Arvind ltd. - Think InvertCMP
Rs.277
Target
Rs.323
Rating
BUY
Page 23
Valuations – B2B to B2C shift can trigger re-rating
Valuing it on SOTP, we arrive at a TP of Rs.323 (17% upside from CMP)
Source: Spark Capital Research
Segments Parameter FY18E
Multiple (x) EV (Rs. mn) % Share Particulars Rs. mn
Textiles EV EBITDA 10,929 4.0 43,715 37%
Power Brands EV EBITDA 3,367 18.0 60,603 52%
Growth Brands EV Sales 12,455 1.0 12,455 11%
Retail / Mega Mart EV EBITDA 273 1.0 273 0%
Others EV Sales 8,061 0.0 0 0%
Land Value*
Summarised EV (Rs.mn) 1,17,045
Net Debt (Rs.mn) 33,680
MCAP (Rs.mn) 83,365
Nos of shares 258
TP 323
UPSIDE 17%
CMP 277
Implied P/E 18
Implied EV/EBIDTA 9
We continue to retain our positive stance on ARVND
based on the size of the opportunity and ARVND’s
portfolio of brands to capitalise the same. However,
appreciating the complexity of the drivers and
execution challenges involved, we believe
monitoring financial leverage level will be extremely
crucial during the ‘vision’ fulfilling journey as
controlled debt can give the luxury to accommodate
the volatility in the macro cycle, gestation in the
evolving consumption habits and any unaccounted
disruptions. We retain BUY with a TP of Rs.323
(implied PE of 15x F17E EPS).
* Arvind posses a land bank of ~250 acres near Ahmedabad and ~25 acres in Ahmedabad
which are estimated by market participants at Rs.~5bn, we have not ascribed any value to the
same. Any realisation in this aspect could impact financials positively

Arvind ltd. - Think InvertCMP
Rs.277
Target
Rs.323
Rating
BUY
Page 24
Financial Summary
Abridged Financial Statements Key Metrics
Rs.mn FY15 FY16E FY17E FY18E FY15 FY16E FY17E FY18E
Profit & Loss Growth Ratios (%)
Revenue 78,514 83,030 96,640 1,13,654 Revenues 14% 6% 16% 18%
EBIDTA 10,129 10,560 12,825 15,682 EBIDTA 11% 4% 21% 22%
Other Income 932 900 1,000 1,150 PAT 4% -7% 33% 45%
Depreciation 2,124 2,438 2,901 3,220 Margins (%)
EBIT 8,937 9,022 10,924 13,612 EBIDTA 12.9% 12.7% 13.3% 13.8%
Interest 3,946 4,073 4,270 4,221 EBIT 11.4% 10.9% 11.3% 12.0%
PBT 4,991 4,949 6,654 9,391 PAT 4.9% 4.3% 4.9% 6.0%
Tax 1,072 1,435 1,996 2,629 Return Ratios (%)
Normalised PAT 3,823 3,546 4,701 6,824 RoCE 11.9% 10.2% 11.3% 13.9%
EPS (Rs.) 14.8 13.7 18.2 26.4 RoE 14.4% 12.4% 14.8% 18.9%
Balance Sheet Total Asset Turnover (x) 1.3 1.2 1.4 1.6
Net Worth 27,239 29,945 33,557 38,826 Leverage Ratios (x)
Loan Funds 31,275 35,500 34,500 32,500 Debt to Equity 1.15 1.19 1.03 0.84
Other Long Term Liabilities 1,026 994 951 889 Current Ratio 1.97 2.05 2.02 2.02
Sources of Funds 59,539 66,438 69,008 72,214 Working Capital Ratios
Net Block 30,964 33,826 34,725 35,505 Debtor Days 54 54 52 52
Intangible Assets 2,118 2,118 2,118 2,118 Inventory days 86 86 90 90
Investments 6,775 8,775 7,275 5,275 Creditor Days 63 62 64 64
Total Current Assets 39,900 42,365 49,272 58,112 Per Share
Total Current Liabilities 20,217 20,645 24,382 28,795 Face Value 10.0 10.0 10.0 10.0
Net Current Assets 19,682 21,719 24,890 29,316 Dividend 2.5 2.7 3.5 5.0
Application of Funds 59,539 66,438 69,008 72,214 Valuation Metrics
Cash Flow Shares Outstanding (mn) 258 258 258 258
Cash Flow from Pre-Working Cap 8,726 9,125 10,829 13,052 Market Cap. (Rs. mn) 71,533 71,533 71,533 71,533
Working Capital -3,142 -1,627 -3,594 -4,117 Enterprise Value (Rs. mn) 95,126 96,997 97,921 97,611
Cash Flow from Operations 5,584 7,497 7,235 8,936 EV /Sales (x) 1.2 1.2 1.0 0.9
Capex -5,967 -5,300 -3,800 -4,000 Price/Earnings (x) 18.7 20.2 15.2 10.5
Cash Flow from Investments -5,874 -6,400 -1,300 -850 Price/Book (x) 2.6 2.4 2.1 1.8
Free Cash Flow 198 2,197 3,435 4,936 EV/EBIDTA (x) 9.4 9.2 7.6 6.2
Cash Flow from Financing -485 -688 -6,359 -7,776 FCF Yield (%) 0.2% 2.3% 3.5% 5.1%
Closing Cash Balance 889 1,243 819 1,129 Dividend Yield 0.9% 1.0% 1.3% 1.8%

Arvind ltd. - Think InvertCMP
Rs.277
Target
Rs.323
Rating
BUYDisclaimer
Page 25
Spark Disclaimer
Spark Capital Advisors (India) Private Limited (Spark Capital) and its affiliates are engaged in investment banking, investment advisory and institutional equities and
infrastructure advisory services. Spark Capital is registered with SEBI as a Stock Broker and Category 1 Merchant Banker.
We hereby declare that our activities were neither suspended nor we have defaulted with any stock exchange authority with whom we are registered in the last five years. We
have not been debarred from doing business by any Stock Exchange/SEBI or any other authorities, nor has our certificate of registration been cancelled by SEBI at any point of
time.
Spark Capital has a subsidiary Spark Investment Advisors (India) Private Limited which is engaged in the services of providing investment advisory services and is registered
with SEBI as Investment Advisor. Spark Capital has also an associate company Spark Infra Advisors (India) Private Limited which is engaged in providing infrastructure
advisory services.
This document does not constitute or form part of any offer or solicitation for the purchase or sale of any financial instrument or as an official confirmation of any transaction.
This document is provided for assistance only and is not intended to be and must not alone be taken as the basis for an investment decision. Nothing in this document should
be construed as investment or financial advice, and nothing in this document should be construed as an advice to buy or sell or solicitation to buy or sell the securities of
companies referred to in this document.
Each recipient of this document should make such investigations as it deems necessary to arrive at an independent evaluation of an investment in the securities of companies
referred to in this document (including the merits and risks involved), and should consult its own advisors to determine the merits and risks of such an investment. This
document is being supplied to you solely for your information and may not be reproduced, redistributed or passed on, directly or indirectly, to any other person or published,
copied, in whole or in part, for any purpose. This report is not directed or intended for distribution to or use by any person or entity who is a citizen or resident of or located in
any locality, state, country or other jurisdiction, where such distribution, publication, availability or use would be contrary to law, regulation or which would subject Spark Capital
and/or its affiliates to any registration or licensing requirement within such jurisdiction. The securities described herein may or may not be eligible for sale in all jurisdictions or to
a certain category of investors. Persons in whose possession this document may come are required to inform themselves of and to observe such applicable restrictions. This
material should not be construed as an offer to sell or the solicitation of an offer to buy any security in any jurisdiction where such an offer or solicitation would be illegal.
Spark Capital makes no representation or warranty, express or implied, as to the accuracy, completeness or fairness of the information and opinions contained in this
document. Spark Capital , its affiliates, and the employees of Spark Capital and its affiliates may, from time to time, effect or have effected an own account transaction in, or
deal as principal or agent in or for the securities mentioned in this document. They may perform or seek to perform investment banking or other services for, or solicit
investment banking or other business from, any company referred to in this report.
This report has been prepared on the basis of information, which is already available in publicly accessible media or developed through an independent analysis by Spark
Capital. While we would endeavour to update the information herein on a reasonable basis, Spark Capital and its affiliates are under no obligation to update the information.
Also, there may be regulatory, compliance or other reasons that prevent Spark Capital and its affiliates from doing so. Neither Spark Capital nor its affiliates or their respective
directors, employees, agents or representatives shall be responsible or liable in any manner, directly or indirectly, for views or opinions expressed in this report or the contents
or any errors or discrepancies herein or for any decisions or actions taken in reliance on the report or the inability to use or access our service in this report or for any loss or
damages whether direct or indirect, incidental, special or consequential including without limitation loss of revenue or profits that may arise from or in connection with the use of
or reliance on this report.
Absolute
Rating
Interpretation
BUY Stock expected to provide positive returns of >15% over a 1-year horizon REDUCEStock expected to provide returns of <5% – -10% over a 1-year
horizon
ADDStock expected to provide positive returns of >5% – <15% over a 1-year
horizonSELL Stock expected to fall >10% over a 1-year horizon
Arvind ltd. - Think InvertCMP
Rs.277
Target
Rs.323
Rating
BUYDisclaimer (Cont’d)
Page 26
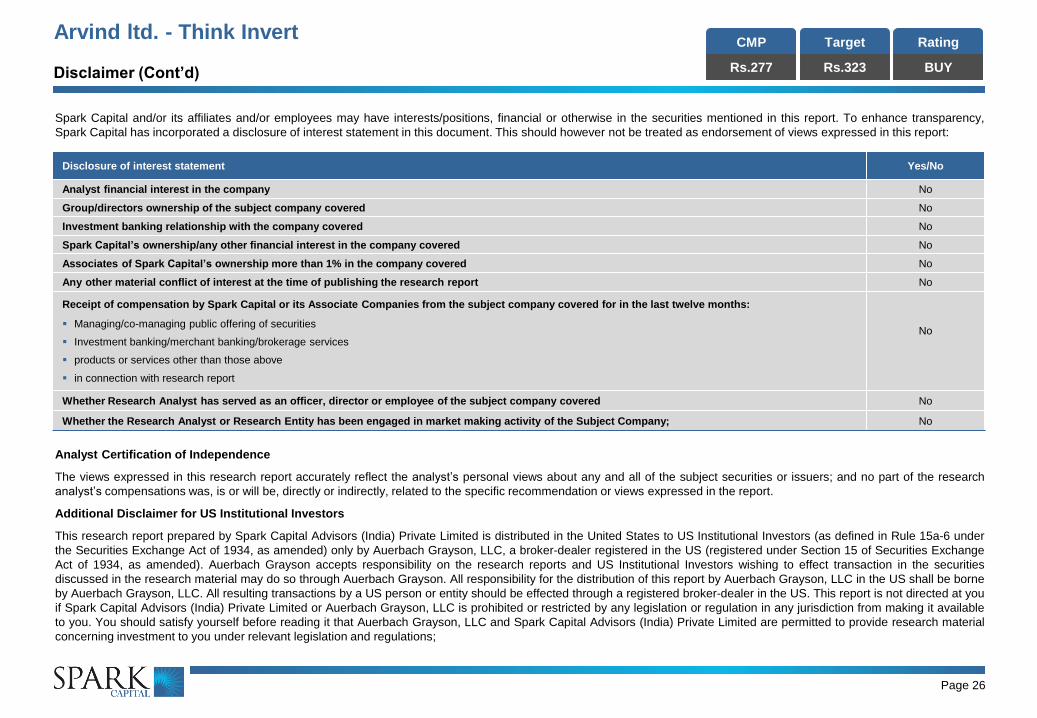
Spark Capital and/or its affiliates and/or employees may have interests/positions, financial or otherwise in the securities mentioned in this report. To enhance transparency,
Spark Capital has incorporated a disclosure of interest statement in this document. This should however not be treated as endorsement of views expressed in this report:
Disclosure of interest statement Yes/No
Analyst financial interest in the company No
Group/directors ownership of the subject company covered No
Investment banking relationship with the company covered No
Spark Capital’s ownership/any other financial interest in the company covered No
Associates of Spark Capital’s ownership more than 1% in the company covered No
Any other material conflict of interest at the time of publishing the research report No
Receipt of compensation by Spark Capital or its Associate Companies from the subject company covered for in the last twelve months:
Managing/co-managing public offering of securities
Investment banking/merchant banking/brokerage services
products or services other than those above
in connection with research report
No
Whether Research Analyst has served as an officer, director or employee of the subject company covered No
Whether the Research Analyst or Research Entity has been engaged in market making activity of the Subject Company; No
Analyst Certification of Independence
The views expressed in this research report accurately reflect the analyst’s personal views about any and all of the subject securities or issuers; and no part of the research
analyst’s compensations was, is or will be, directly or indirectly, related to the specific recommendation or views expressed in the report.
Additional Disclaimer for US Institutional Investors
This research report prepared by Spark Capital Advisors (India) Private Limited is distributed in the United States to US Institutional Investors (as defined in Rule 15a-6 under
the Securities Exchange Act of 1934, as amended) only by Auerbach Grayson, LLC, a broker-dealer registered in the US (registered under Section 15 of Securities Exchange
Act of 1934, as amended). Auerbach Grayson accepts responsibility on the research reports and US Institutional Investors wishing to effect transaction in the securities
discussed in the research material may do so through Auerbach Grayson. All responsibility for the distribution of this report by Auerbach Grayson, LLC in the US shall be borne
by Auerbach Grayson, LLC. All resulting transactions by a US person or entity should be effected through a registered broker-dealer in the US. This report is not directed at you
if Spark Capital Advisors (India) Private Limited or Auerbach Grayson, LLC is prohibited or restricted by any legislation or regulation in any jurisdiction from making it available
to you. You should satisfy yourself before reading it that Auerbach Grayson, LLC and Spark Capital Advisors (India) Private Limited are permitted to provide research material
concerning investment to you under relevant legislation and regulations;