arupconsulting engineers report12 amec civils drainage ... · for the overall area of the...
TRANSCRIPT

. . *
: .
. , .
.’
ArupConsulting Engineers
Report12 AMEC Civils Drainage Philosophy and Calculations
For
insp
ectio
n pur
pose
s only
.
Conse
nt of
copy
right
owne
r req
uired
for a
ny ot
her u
se.
EPA Export 25-07-2013:16:15:39

Comtib - natural gas
Corrib Project L3882 Shell E+P Contract No. 101.24.15 CORRIB FIELD DEVELOPMENT: BELLANABOY BRIDGE GAS TERMINAL
DOCUMENT TITLE:
DOCUMENT NUMBER:
SHEET NO.:
CIVILS DRAINAGE PHILOSOPHY DOCUMENT
L3882-030-I 1 O-0390
I of10
I I I I I
PI REV
NOV ‘03 DATE
FOR PLANNING APPLICATION DESCRIPTION
DSR 1 MC BY 1 CHK
SC APP
REVISIONS APPROVALS This document is confidential and is the exclusive property of AMEC. No unauthorized use, copy or disclosure of the document is to be made. It is to be returned whenever required. Manufacture and construction are to be carried out strictly in accordance with the requirements of this document. No changes are to be made without the prior agreement of the Project Manager.
.,:o
For
insp
ectio
n pur
pose
s only
.
Conse
nt of
copy
right
owne
r req
uired
for a
ny ot
her u
se.
EPA Export 25-07-2013:16:15:40

CORRIB FIELD DEVELOPMENT : BELLANABOY BRIDGE GAS TERMINAL
a TITLE CIVILS DRAINAGE PHILOSOPHY REV DATE PAGE NO. DOCUMENT No. L3882-030-I 1 O-0390 PI NOV’03 2oflO
CONTENTS
0
1 .INTRODUCTION .................. .1.. ................................................................ .3 2.PREAMBLE ............................................................................................... 3 3.TERMINAL DRAINAGE SYSTEMS - SUMMARY.. .................................. .3 4.DESIGN PARAMETERS .......................................................................... .4 5.0PEN DITCH SYSTEM.. .......................................................................... .4
5.1 INTRODUCTION ............................................................................... .4 520UTFLOWS FROM ON-PLOT DITCHES. ......................................... .5
G.SURFACE WATER SYSTEM. .................................................................. ,5 6.1 INTRODUCTION ............................................................................... .5 6.2.. .......... OUTFLOWS FROM ON-PLOT SURFACE WATER SYSTEM - INTERFACE WITH EXTERNAL DRAINAGE SYSTEM.. ......................... .6 6.3.. .......... OUTFLOWS FROM ON-PLOT SURFACE WATER SYSTEM - DRAINING TO EXISTING DITCH IN FIRE BREAK BETWEEN TREES . ..6
7.OlLY WATER SYSTEM.. .......................................................................... .6 7.1 INTRODUCTION ............................................................................... .6 7.2FIREWATER FLOW RATES.. ............................................................ .7 7.3RAINWATER RUN-OFF.. ................................................................... .7 7.4OlLY WATER SYSTEM DESIGN SUMMARY.. .................................. .8
8.ACCESS ROAD AND CAR PARK ............................................................. 8 9.FOUL WATER SYSTEM .......................................................................... .9 lO.APPENDIX A TERMINAL DRAINAGE CALCULATIONS.. ..................... IO
APPENDIX A SECTION 1 INTROUCTION TO CALCULATIONS .............. APPENDIX A SECTION 2 RUN-OFF CO-EFFICIENTS.. ........................... APPENDIX A SECTION 3 RAINWATER INTENSITY.. .............................. APPENDIX A SECTION 4 ON PLOT RAINWATER DITCHES.. ................. APPENDIX A SECTION 5 OILY WATER DRAINAGE SYSTEM.. .............. APPENDIX A SECTION 6 SURFACE WATER DRAINAGE SYSTEM.. ..... APPENDIX A SECTION 7 ACCESS ROAD AND CAR PARK SYSTEM.. .. APPENDIX A SECTION 8 TERMINAL DRAINAGE PLANS.. ..................... APPENDIX A SECTION 9 CATCHMENT AREAS ...................................... APPENDIX A SECTION 10 DRAINAGE SYSTEM RUN NUMBERS ..........
For
insp
ectio
n pur
pose
s only
.
Conse
nt of
copy
right
owne
r req
uired
for a
ny ot
her u
se.
EPA Export 25-07-2013:16:15:40

CORRIB FIELD DEVELOPMENT : BELLANABOY BRIDGE GAS TERMINAL
0 TITLE CIVILS DRAINAGE PHILOSOPHY REV DATE PAGE NO. DOCUMENT No. L3882-030-I 1 O-0390 PI NOV03 3oflO
I. INTRODUCTION
Shell E+P Ireland Limited (SEPIL) are submitting a new Planning Application for the Corrib Natural Gas Terminal at Bellanaboy Bridge.
This report describes the terminal site drainage system, the drainage system is critically important for the following reasons:
To control run-off and prevent pollution and damage to land, water bodies and watercourses in the local area around the site. For foundation, earthwork integrity and global stability. For operational reasons during the life of the facilities.
2. PREAMBLE
AMEC (Oil and Gas) has assessed the drainage design within the terminal security fence area. The purpose of this document is to set out the drainage design philosophy.
Arup Consulting Engineers have carried out the engineering of the drainage for the overall area of the development, AMEC have prepared the drainage design for the terminal site, which interfaces with the Arup designed drainage system.
This report assesses the ‘final’ terminal site drainage condition. Arup has also assessed the existing drainage arrangement and the drainage during the construction phase.
3. TERMINAL DRAINAGE SYSTEMS -SUMMARY
The terminal drainage is controlled using four separate drainage systems, summarised below, which are covered in more detail within this report. Refer to drawing number COR-AM-TD-001 for the terminal drainage schematic.
Open ditch system (surface water) Surface water system (roof drainage). Oily water system, including access road and car park. Foul Sewer.
The terminal open ditch system captures uncontaminated rainfall and discharges into the external drainage system, at six locations. Refer to Appendix A for a schematic indicating the interface locations. Refer to drawing Number COR-AR-SD-001 for the external drainage drawing.
The surface water system collects rainfall from building roofs and discharges into the external drainage system, at two locations. There is an additional discharge from the administration building surface water system, which is routed to an existing ditch, which is also shown on the external drainage drawing.
For
insp
ectio
n pur
pose
s only
.
Conse
nt of
copy
right
owne
r req
uired
for a
ny ot
her u
se.
EPA Export 25-07-2013:16:15:40

CORRIB FIELD DEVELOPMENT : BELLANABOY BRIDGE GAS TERMINAL
a TITLE 1 CIVILS DRAINAGE PHILOSOPHY 1 REV 1 DATE ) PAGE NO. DOCUMENT No. 1 L3882-030-I lo-0390 1 PI 1 NOV’03 1 4 of 10
The oily water system is a piped, self-contained system, routed to the open drains sump for treatment and discharging offshore via an out-fall. This system captures any water run-off that might be contaminated with oil or other chemicals.
The foul water sewer is routed to a “Puraflo” system for treatment and discharge.
4. DESIGN PARAMETERS
The design calculations were based on the following parameters.
- The loo-year return event rainfall is assumed to be 31 mm in one hour. However, the drainage systems were also reviewed for the extreme design rainfall event of 45mm in one hour.
- A run-off co-efficient of 0.6 was applied for unpaved (gravel areas) - A run-off co-efficient of 1 .O was applied for paved areas and roads. - Catchment areas were assessed from the drainage drawing. - Drainage run lengths were assessed from the drainage drawing. - Localised flooding of ditch systems is not permissible.
The capacity analyses have been determined from the Micro-drainage program. Refer to appendix A for the drainage system calculations.
5. OPEN DITCH SYSTEM
5.1 INTRODUCTION
The ditch arrangement, and sizes are indicated on the terminal drainage plan drawing, drawing number COR-AM-TD-001. The on plot ditches will be constructed along the edges of the roads, and will be concrete lined. The ditch design is based on trapezoidal and rectangular cross section.
The purpose of the concrete lining is to avoid ground contamination from surface water run-off from the terminal site.
Although the loo-year return rainfall event is 31mm in one hour the drainage system was checked for the extreme design rainfall of 45mm in one hour.
The rate of rainfall was assessed using the relationships given in ‘The Wallingford Prccedure’, based on the reference design rate rainfall of 45mm in one hour.
The design was carried out on the basis that localised flooding of the ditch system is not permissible. This analysis was performed using the Micro- Drainage ‘simulation’ program, this considers the backwater curve through the system and therefore provides a realistic and robust result.
For
insp
ectio
n pur
pose
s only
.
Conse
nt of
copy
right
owne
r req
uired
for a
ny ot
her u
se.
EPA Export 25-07-2013:16:15:40

CORRIB FIELD DEVELOPMENT : BELLANABOY BRIDGE GAS TERMINAL
0 TITLE CIVILS DRAINAGE PHILOSOPHY REV DATE PAGE NO. DOCUMENT No. L3882-030-I I O-0390 PI NOV’03 5oflO
5.2 OUTFLOWS FROM ON-PLOT DITCHES.
The on-plot ditch drainage system interfaces with the Arup external ditch system at six locations, as shown in appendix A.
The summary of ditch outflows is as below:
6. SURFACE WATER SYSTEM.
6.1 INTRODUCTION
The surface water system collects the water run-off from the building roofs as well as water at ground level where required for de-watering. The surface water is split into three systems to reflect the location’ of the various buildings, and as such there are three discharge locations.
- Generator building, firewater pump house, wastewater treatment building and firewater building discharge into the external drainage system.
- The control building discharge into the external drainage system. - The Maintenance building and administration building complex drains into
the existing ditch in the tree firebreak.
Although the loo-year return rainfall event is 31mm in one hour the drainage system was checked for the extreme design rainfall of 45mm in one hour.
The rate of rainfall was assessed using the relationships given in ‘The Wallingford Procedure’, based on the reference design rate rainfall of 45mm in one hour.
The design of the system was carried out using the Micro-drainage ‘storm’ program without consideration of storage within the system. The system is capable of accommodating short term peaks in rainfall under even more extreme conditions than the 45mm in one hour, if the effect of storage is considered.
For
insp
ectio
n pur
pose
s only
.
Conse
nt of
copy
right
owne
r req
uired
for a
ny ot
her u
se.
EPA Export 25-07-2013:16:15:40

CORRIB FIELD DEVELOPMENT : BELLANABOY BRIDGE GAS TERMINAL
a- TITLE CIVILS DRAINAGE PHILOSOPHY REV DATE PAGE NO. DOCUMENT No. L3882-030-I 1 O-0390 PI NOV’03 6oflO
6.2 OUTFLOWS FROM ON-PLOT SURFACE WATER SYSTEM - INTERFACE WITH EXTERNAL DRAINAGE SYSTEM
0
Surface water System Control Building LER, Drains
Sump, Generator Building, Firewater Pump House
Tie in point number
7
8
Outflow Invert Level (m)
31.425m (At N 32820m) 29.900m (At N 32820m)
Time of Max Flow Concentration (I/s) (min) 5.1 38
10.0 147
6.3 OUTFLOWS FROM ON-PLOT SURFACE WATER SYSTEM - DRAINING TO EXISTING DITCH IN FIRE BREAK BETWEEN TREES
Surface Tie in point Outflow Invert Time of Max Flow water number Level (m) Concentration (I/s) System (min)
Admin Area 9 31 .OOOm 5.6 74 Buildings (At N 32816m) (roofs only)
7. OILY WATER SYSTEM
7.1 INTRODUCTION
In the paved areas the paving is laid to falls, draining to catch basins at the low point of the paving. The discharge from the oily water system is collected in the open drain sump (T-8301) for treatment.
The oily water system design was assessed for the following paved areas.
Slug catcher area and Storage tanks bunds (Raw methanol, product methanol and condensate) system. Process area. Waste storage area. Flare Facilities Area (where paved).
The oily water system was checked for two design conditions, firewater event and heavy rain event.
For
insp
ectio
n pur
pose
s only
.
Conse
nt of
copy
right
owne
r req
uired
for a
ny ot
her u
se.
EPA Export 25-07-2013:16:15:40

CORRIB FIELD DEVELOPMENT : BELLANABOY BRIDGE GAS TERMINAL
0. TITLE CIVILS DRAINAGE PHILOSOPHY REV DATE PAGE NO. DOCUMENT No. L3882-030-I 1 O-0390 PI NOV’03 7oflO
7.2 FIREWATER FLOW RATES
The firewater flow rate for the tanks is based on the maximum deluge flow rate on the condensate tank. The firewater in the bund discharges through an overflow at the top of the bund into the oily water system, where it drains into the oily water sump.
The firewater rate for the process area is based on 4 monitors and 4 hydrants working simultaneously. The flow rate from the waste storage area is based on 2 hydrants working.
The fire water rate for the flare facilities area is based on 1 monitor working, the fire water flow enters the drainage system at the HP / LP knock out vessels paved area.
7.3 RAINWATER RUN-OFF
Although the loo-year return rainfall event is 31 mm in one hour the drainage system was checked for the extreme design rainfall of 45mm in one hour.
The rate of rainfall was assessed using the relationships given in ‘The Wallingford Procedure’, based on the reference design rate rainfall of 45mm in one hour.
The design of the system was carried out using the Micro-drainage program without consideration of storage within the system. The system is capable of accommodating short term peaks in rainfall under even more extreme conditions than the 45mm in one hour, if the effect of storage is considered.
The paved catchment areas were calculated for each part of the oily water system, and are detailed in Appendix A.
The discharge from the paved areas, for the average hourly rainfall, is given in the table below. The total paved area represents all of the paving on the terminal site.
Event
20 Year Return, Daily Maximum Rainfall 1 hour, 100 Year Return Rainfall 1 hour, Extreme Rainfall
Rainwater Run-off Rate TOTAL PAVED AREA M’ 2.825 mm / hr
13,000 36.7 m’lh
31mm / hr 402 m3/h
45mm / hr 584 m’/h
For
insp
ectio
n pur
pose
s only
.
Conse
nt of
copy
right
owne
r req
uired
for a
ny ot
her u
se.
EPA Export 25-07-2013:16:15:40

CORRIB FIELD DEVELOPMENT : BELLANABOY BRIDGE GAS TERMINAL
0 TITLE CIVILS DRAINAGE PHILOSOPHY REV DATE PAGE NO. DOCUMENT No. L3882-030-I 1 O-0390 PI NOV’03 8oflO
7.4 OILY WATER SYSTEM DESIGN SUMMARY.
The table below provides details of the drainage flow rates for each of the drainage systems. The governing case for drainage design purposes is highlighted.
Note the rain water flow rates in the table above are the instantaneous maximums and are not the average rain water rates.
8. ACCESS ROAD AND CAR PARK
The terminal access road includes a separate, piped drain system to contain possible tanker spillage and rainwater run-off. This system extends from the entrance gate to the waste storage area, and up to the tanker loading / unloading area.
The car park drainage is also connected to this piped drain system, to contain rainwater run-off.
The piped drain system is gravity drained into a sump, located alongside the entrance road inside the main entrance gate, from where it is pumped back to the terminal oily-water system (ref section 7.0 above).
The rate of rainfall was assessed using the relationships given in ‘The Wallingford Procedure’, based on the reference design rate rainfall of 45mm in one hour.
The system design was checked for a 45mm per hour extreme rainfall event, on the basis that no localised flooding of the ditch system would be permitted. This analysis was performed using the Micro-Drainage ‘simulation’ program, this considers the backwater curve through the system and therefore provides a realistic and robust result.
For
insp
ectio
n pur
pose
s only
.
Conse
nt of
copy
right
owne
r req
uired
for a
ny ot
her u
se.
EPA Export 25-07-2013:16:15:40

CORRIB FIELD DEVELOPMENT : BELLANABOY BRIDGE GAS TERMINAL
a’ TITLE CIVILS DRAINAGE PHILOSOPHY REV DATE PAGE NO. DOCUMENT No. L3882-030-1 I O-0390 PI NOV’03 9oflO
9. FOUL WATER SYSTEM
The foul water system from the administration building and control building drains to a septic tank, where it is pumped via a pumping chamber through a “Puraflo” system for treatment and discharge. The “Puraflo” system size is based on an occupany of 30 personnel at the terminal. The discharge is through a percolation area of 300m2, which is provided outside the security fence south of the car park.
The discharge units were calculated in accordance with BS 8301
Number Of Units Discharge Tie In Point Flow Rate (Us) Number (Ref. Appendix 8)
259 10 5
For
insp
ectio
n pur
pose
s only
.
Conse
nt of
copy
right
owne
r req
uired
for a
ny ot
her u
se.
EPA Export 25-07-2013:16:15:40

CORRIB FIELD DEVELOPMENT : BELLANABOY BRIDGE GAS TERMINAL
TITLE CIVILS DRAINAGE PHILOSOPHY REV DATE PAGE NO. DOCUMENT No. 13882-030-l 1 O-0390 PI NOV’03 IOof 10
APPENDIX A CONTENTS
10. APPENDIX ATERMINAL DRAINAGE CALCULATIONS
1 I. APPENDIX A SECTION 1 INTROUCTION TO CALCUALTIONS
12. APPENDIX A SECTION 2 RUN-OFF CO-EFFICIENTS
13. APPENDIX A SECTION 3 RAINWATER INTENSITY
14. APPENDIX A SECTION 4 ON PLOT RAlNWATER DITCHES
15. APPENDIX A SECTION 5 OILY WATER DRAINAGE SYSTEM
16. APPENDIX A SECTION 6 OILY WATER DRAlNAGE SYSTEM
17. APPENDIX A SECTION 7 SURFACE WATER DRAINAGE SYSTEM
18. APPENDIX A SECTION 8 ACCESS ROAD AND CAR PARK SYSTEM
19. APPENDIX A SECTION 9 TERMINAL DRAlNAGE PLANS
20. APPENDIX A SECTION 10 CATCHMENT AREAS
21. APPENDIX A SECTION 11 DRAlNAGE SYSTEM RUN NUMBERS
:./,
. .
For
insp
ectio
n pur
pose
s only
.
Conse
nt of
copy
right
owne
r req
uired
for a
ny ot
her u
se.
EPA Export 25-07-2013:16:15:40

I Client: Shell E 8 P Ireland Ltd. Plant: Gas Reception Terminal
. ame Location: Corrib On-Plot Storm Drainage
Calc. by Date ChcKd by
IM Nov ‘03 Dale
Sheet no./rev.
At@ by Date
( !
!
!
(
1
(
I
1
1
I
I
I
APPENDIX A - CALCULATIONS
SECTION Al INTRODUCTION
Shell E & P require the drainage systems on the Terminal Site to be designed for rainfall of 31 mm in one hour (100 /ear return period). Shell have also indicated that the effect of an alternative, more extreme, rainfall of 45mm in 3ne hour (100 year return period) should be considered. The calculations which follow have been based on the 45mm in one hour rainfall case for simplicity. The designed system will, therefore, be robust for the 31 mm rainfall condition.
For the purpose of these calculations, the extreme design rainfall of 45mm in one hour is used and is described as the reference design condition.
The rainfall profiles in storms of different durations and return period to the base design condition have been assessed using the relationships given in the Wallingford Procedure. An example of these calculations is included in Section A2 - Design Storm Intensity and Return Period. In practice, these calculations have been carried out using the Micro Drainage Win Des software.
It is common practice to design drainage systems for a storm of 5 or IO year return period using the ‘Modified Rational Method’, as described in the Wallingford Procedure. This designs drainage on a simple basis, which does not take account of the beneficial effects of storage within the system and surcharge. Where required, the drainage system can be re-checked for its resistance to flooding in a longer return period storm, allowing for the effects of storage and surcharge.
BS EN 752-2 - ‘Drain and Sewer Systems Outside Buildings - Performance Rquirements’ suggests that sewer systems in industrial areas should be designed for a 1 in 5 year return period storm. Where it is required to check the resistance to flooding in a longer period storm, the Standard recommends that a 1 in 30 year return period storm is considered.
The piped drainage systems have been designed for a 1 in 10 year storm, without any consideration of the effects of storage within the system or surcharge. This is a more severe design condition than the 1 in 5 year storm suggested in BS EN 752-2. As the reference design condition of 45mm rainfall in one hour is also conservative, it can be seen that a highly robust system results.
Sizing of the open rainwater ditches has been carried out initially based on the 1 in 10 year storm, as for the piped drain systems. In view of the fact that surcharge of these drains would immediately result in flooding, these ditches have been individually checked for a 1 in 100 year storm, taking account of storage within the system. The rainfall profile during this design storm event varies according to the time taken for water to travel down each system. For each system, the actual rainfall profile has been derived from the reference design condition, as described above. As the reference design condition of 45mm rainfall in one hour is conservative, it can be seen that a highly robust system results.
For
insp
ectio
n pur
pose
s only
.
Conse
nt of
copy
right
owne
r req
uired
for a
ny ot
her u
se.
EPA Export 25-07-2013:16:15:40

Client: Plant: Location:
Calc. by
IM
Shell E & P Ireland Ltd. Gas Reception Terminal Corrib On-Plot Storm Drainage
Date Chck’d by
Nov ‘03 Date
Job Ref. L3882
Sheet nolrev.
Aw’d by Date
io summarise: 1 Piped drain systems are designed for a 1 in 10 year storm, taking no account of the beneficial effects of
storage and surcharge. 1 Open drain systems are designed for a 1 in 100 year storm, with the beneficial effects of storage within the
system taken into account. 1 The rainfall profile for each system is derived from the reference design condition, according to the design
storm return period and the time taken for water to travel down the system.
The calculations have been carried out initially using the Micro Drainage Win Des ‘Storm’ program, which ignores he effects of storage and surcharge. Design of open ditches is checked using the more complex Win Des Simulation’ programme, which allows for the beneficial effects of storage within the ditches.
The interface between the on-plot Terminal drainage system and the external drainage system designed by Arup is shown on Drawing COR-AP-SD-001. The Terminal drainage layout is shown on Drawing COBAM-TD-001/002 - Terminal Drainage Plan.
The results of initial calculations were made available to Arup for design of the external drainage system. The final zalculations included here show some variation to these figures, but the latest figures are generally less severe. =or simplicity, the figures given in the summary report have been left unchanged. Full consistency checks will be nade during the detailed design of the drainage systems.
The on-plot drainage generally takes runoff within the boundary road. A small amount of runoff from the area 3utsicie the boundary road is also allowed for. Other runoff, including runoff from the flare area and the ground drainage from the admin buildings and car park areas is taken by the external drainage system, designed by Arup.
Calculations have been carried out on the basis of a common plant level of 1 OOm (equal to 33.400m OD).
For in
spec
tion p
urpo
ses o
nly.
Conse
nt of
copy
right
owne
r req
uired
for a
ny ot
her u
se.
EPA Export 25-07-2013:16:15:40

I Client: Shell E & P Ireland Ltd. 1 Job Ref. Plant: Gas Reception Terminal L3882
ame Location: Corrib Sheet no./rev.
On-Plot Storm Drainage Calc. by Date Chck’d by Date Aw’d by Date
IM Nov ‘03
SECTION A2 Desiqn Storm lntensitv and Return Period
The rate of rainfall has been assessed using the relationships given in ‘The Wallingford Procedure’, based on the ,eference design condition of 45mm in one hour (loo-year return period). The Appendix in ‘Volume 4 - The ulodified Rational Method’ is used.
zalculations are carried out using the WinDes software and manual estimations are included here as a cross-check In the values computed by the software. These manual calculations also enable us to find a value of M5-60 which :orrelates with the design case of “Ml 00-60 = 45mm”.
The calculations below start with the value of M5-60 = 20mm. Rainfall intensities are assessed and the resulting Jalue of Ml 00-60 is found. The value of M5-60 is then adjusted pro-rata to a value appropriate for Ml 00-60 = 45mm. The detailed figures below are provided to show the derivation only and are not representative of the 15mm rainfall case. They are, however close and provide confidence in the output from the Win Des software. It s not considered necessary to re-run the figures for the correct M5-60 value.
[Seed value); “M!f&Omin = 20 mm” -_ From Fig A.2, the figure of R in the previous calculations appears to cover all circumstances. Therefore accept the sarlier figure; r=Dj
From Fig A.3b, obtain values of Zl and insert in the spreadsheet below:
Storm Duration Storm Duration 21 M5-60 5-Year Depth (Mins) (Hours) for Duration D
(M5-D) (mm) -- , ._ -_. j... 5 ‘: .~~ ,...-,- :I’-o~~~~:- ~‘;.‘-~~~~..~~
,f’ 0{!66 356’~; _‘520j 8.00 .’
,o’.~ 20; 11.20 13.00 15.60
., 20.00 .,. ‘. :‘. 26.00
31.80
For
insp
ectio
n pur
pose
s only
.
Conse
nt of
copy
right
owne
r req
uired
for a
ny ot
her u
se.
EPA Export 25-07-2013:16:15:40

l , ame
e
Client: Plant: Location:
Calc. by
IM
Shell E & P Ireland Ltd. Gas Reception Terminal Corrib On-Plot Storm Drainage
Date Chck’d by
Nov ‘03 Date
Job Ref. L3882
Sheet no/rev.
Aw’d by Date
Use values in Table A-l (of the Wallingford Procedure Vol4) to give values of MT-D and intensity, for comparison with Micro Drainage output.
50-Year Ml 00-D loo-Year for Duration D (mm) Intensity (mm) Intensity
(mm!hr) (mmkir) -r- ------- - 156.14 :: 14.96’ 180.24
0:‘166’. :, -’ : 1,1;20 13:59 112.00: 21‘62: 130.22 :-: ‘: :0;25: .13.00’,: ’ 87.36: ,25;48’ 101.92
,:. .-: d;5-’ j’ +34.i
.-> ‘, 15.69 ,.‘: ,&.52! 53.04’ zfi .201 62.40 : 1 .-.$Q.Oi) 1.:. :. 34:&; 34.60 i ;; :40.60: 40.60
22.23 52.00; 26.00 12.64: : i$;Ol.; .:’ 15.50
9.96 “ 69.0% 11.52 7.12::.,:81,77! 8.18 3.64 99.k 4.15 2.17’ 116.90’ 2.44
-ram the above, it can be seen that the loo-year l-hour rainfall corresponding with the M5-60 value of 20mm used n the original calculations is 40.6mm. This is fairly close to the required value of 45mm.
it can be seen from the above table that the M5-60 figure used in the Micro Drainage computer runs should be ncreased by a factor of 45/40.6 to suit the loo-year 1 -hour rainfall design value of 45mm. Therefore, the Micro Drainage analyses have been carried out using the M5-60 value of 22.2mm.
For
insp
ectio
n pur
pose
s only
.
Conse
nt of
copy
right
owne
r req
uired
for a
ny ot
her u
se.
EPA Export 25-07-2013:16:15:40
I I Client: I Plant:
Shell E & P Ireland Ltd. Gas Receotion Terminal
1 Job Ref. I I L3882 I
e ame ’ (Location: Corrib On-Plot Storm Drainage
I Sheet no./rev. I
! ’
---I-- l
Calc. by Date Chck’d by Date W’d by Date
IM Nov‘03 I SECTION A3 RUNOFF COEFFICIENTS
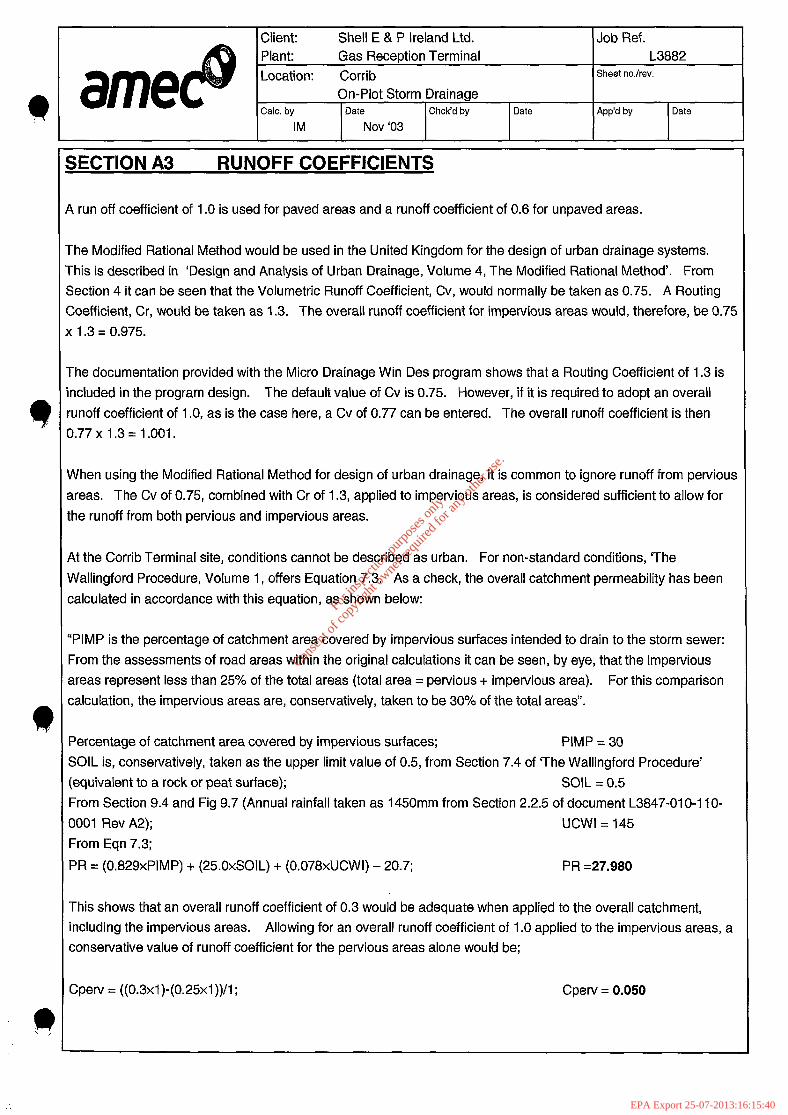
1 run off coefficient of 1 .O is used for paved areas and a runoff coefficient of 0.6 for unpaved areas.
The Modified Rational Method would be used in the United Kingdom for the design of urban drainage systems. rhis is described in ‘Design and Analysis of Urban Drainage, Volume 4, The Modified Rational Method’. From section 4 it can be seen that the Volumetric Runoff Coefficient, Cv, would normally be taken as 0.75. A Routing Coefficient, Cr, would be taken as 1.3. The overall runoff coefficient for impervious areas would, therefore, be 0.75 ( 1.3 = 0.975.
The documentation provided with the Micro Drainage Win Des program shows that a Routing Coefficient of 1.3 is ncluded in the program design. The default value of Cv is 0.75. However, if it is required to adopt an overall unoff coefficient of 1 .O, as is the case here, a Cv of 0.77 can be entered. The overall runoff coefficient is then 1.77 x 1.3 = 1 .OOl .
Nhen using the Modified Rational Method for design of urban drainage, it is common to ignore runoff from pervious areas. The Cv of 0.75, combined with Cr of 1.3, applied to impervious areas, is considered sufficient to allow for ihe runoff from both pervious and impervious areas.
4t the Corrib Terminal site, conditions cannot be described as urban. For non-standard conditions, ‘The uVallingford Procedure, Volume 1, offers Equation 7.3. As a check, the overall catchment permeability has been calculated in accordance with this equation, as shown below:
“PIMP is the percentage of catchment area covered by impervious surfaces intended to drain to the storm sewer: From the assessments of road areas within the original calculations it can be seen, by eye, that the impervious areas represent less than 25% of the total areas (total area = pervious + impervious area). For this comparison calculation, the impervious areas are, conservatively, taken to be 30% of the total areas”.
Percentage of catchment area covered by impervious surfaces; PIMP = 30 SOIL is, conservatively, taken as the upper limit value of 0.5, from Section 7.4 of ‘The Wallingford Procedure’ (equivalent to a rock or peat surface); SOIL = 0.5 From Section 9.4 and Fig 9.7 (Annual rainfall taken as 1450mm from Section 2.2.5 of document L3847-01 O-l 1 O- 0001 Rev A2); UCWI = 145 From Eqn 7.3;
PR = (0.829xPIMP) + (25.OxSOlL) + (0.078xUCWI) - 20.7; PR =27.980
This shows that an overall runoff coefficient of 0.3 would be adequate when applied to the overall catchment, including the impervious areas. Allowing for an overall runoff coefficient of 1 .O applied to the impervious areas, a conservative value of runoff coefficient for the pervious areas alone would be;
Cperv = ((0.3x1)-(0.25xl))/l; Cperv = 0.050
For
insp
ectio
n pur
pose
s only
.
Conse
nt of
copy
right
owne
r req
uired
for a
ny ot
her u
se.
EPA Export 25-07-2013:16:15:40

Client: Shell E & P Ireland Ltd. Job Ref. Plant: Gas Reception Terminal L3882
ame Location: Corrib Sheet no./rev.
On-Plot Storm Drainage Calc. by Date Chck’d by Date Aw’d by Date
IM Nov ‘03
s indicated above an overall runoff coefficient of 0.6 has been applied to the pervious areas. It is considered
rat a highly conservative design results, in line with the design requirement to avoid pollution caused by flooding.
s noted above for the impervious areas, a Cv value 0.77 has been used in the program input In combination with re Cr value of 1.3, a total runoff coefficient of 1 .O is applied to 0.6 x Pervious Area. This is equivalent to applying
total runoff coefficient of 0.6 to all of the pervious area.
can be seen that the calculations are conservative. Ditches on the Terminal Site should be well able to cope 4th storm flows and minor local variations in rainfall, ditch profile, etc.
For
insp
ectio
n pur
pose
s only
.
Conse
nt of
copy
right
owne
r req
uired
for a
ny ot
her u
se.
EPA Export 25-07-2013:16:15:40

I Client: Shell E & P Ireland Ltd. 1 Job Ref. Plant: Gas Reception Terminal L3882 Location: Corrib Sheet no./rev.
On-Plot Storm Drainaae I I
I Calc. by
I
Date
I
Chck’d by
I
Date
I
Aw’d by
I
Date
IM Nov ‘03 I
SECTION A4 DESIGN OF ON-PLOT OPEN DITCHES (RAINWATER)
>pen ditches are laid flat where possible. This does not generate enough flow velocity to be self cleansing. It is a
equirement that the on-plot ditches will be regularly maintained and that this should not present undue difficulty. t should be noted that it may be necessary to provide handrail or grating to some ditches.
Ipen ditches are to be provided with a concrete lining, to minimise the possibility of ground pollution in the event of r spill. In order to contain any spillage, the open ditches are designed to work without overtopping.
c 2
C r’ Ii
c i
( u C
1 C
1
1
I
4
4
I
4
4
Ipen ditches have been sized initially using the ‘Storm’ program. In order to confirm that the on-plot ditch system vill operate without flooding, calculations were transferred to the Micro-Drainage ‘Simulation’ program. This
:onsiders the backwater curve through the system and is expected to provide a more realistic result. The on-plot open ditches have a sprayed concrete lining. The purpose of the lining is to avoid ground :ontamination by oil spillage.
The areas draining to each ditch have been marked on the Catchment Areas drawing included at Appendix AIO.
rhere are six ditch systems making up the total on-plot rainwater ditch system. These are:
1 North-West outfall ditches. 1 North-East outfall ditches. ) East outfall ditches.
1 South-East outfall ditches. 1 Firewater pond area ditches. ) West outfall ditches.
Drawings showing the run numbers used in computer calculations for each ditch length are included at Appendix 411.
=ollowing the summary of calculated outflows, below, are: I Detailed summation of areas draining to each ditch. D Win Des calculations output.
A4.1 Summarv of Outflows from On-Plot Ditches:
Liven below are the summaries of the outflows from the Terminal Site ditches. These outflows are given for a 1 ir loo-year storm, based the reference design condition, using the ‘Simulation’ design software. As indicated in the Introduction, above, these are values resulting from initial runs and it is not considered necessary to revise the figures to reflect changes of small effect in the final calculation runs which follow.
For
insp
ectio
n pur
pose
s only
.
Conse
nt of
copy
right
owne
r req
uired
for a
ny ot
her u
se.
EPA Export 25-07-2013:16:15:40

Client: Shell E & P Ireland Ltd. Job Ref.
I Plant: Gas Reception Terminal L3882 Location: Corrib Sheet no./rev.
On-Plot Storm Drainage ---Iv- I
Calc. by Date Chck’d by Date Aw’d by Date
IM Nov ‘03 I
Ditch System
NW Ditch outfall
NE Ditch outfall
Outflow Invert Level Time of Concentration Max Flow
ON (min) w 98.400 13-21 120
98.816 8-14 190 E Ditch outfall 98.735 9-16 151
SE Ditch outfall 97.900 15-25 261 Firewater pond ditches 98.250 13-23 329 W Ditch outfall 99.000 9-15 205
The range of times of concentration is given as it was noted that the times of concentration calculated in Simulation’ were much longer than output from the original ‘Storm’ calculations. It has been recommended to 4rup that the effect on the perimeter drain system of the range of times of concentration should be considered.
44.2 ‘Simulation’ Runs for On-Plot Ditches
4s noted in the Introduction, above, it was decided to analyse the ditch systems using the Micro Drainage Simulation’ package. The package analyses the backwater curve in individual pipe lengths and links the water ‘evels of adjacent pipe lengths to calculate the overall flow in the system.
The network data have been brought in to the ‘Simulation’ package, on the following basis: b Trapezoidal ditch invert levels include a nominal fall of up to lOmm, to allow the program to function, the
program expects channels laid falls. (Rectangular channels will be constructed to falls).
D A standard head loss coefficient of 1 .O has been applied at all the manholes called up in the network data. This is intended to make some allowance for the losses at bends which are not included in the current network model.
For
insp
ectio
n pur
pose
s only
.
Conse
nt of
copy
right
owne
r req
uired
for a
ny ot
her u
se.
EPA Export 25-07-2013:16:15:40

Client: Shell E & P Ireland Ltd. Job Ref. Plant: Gas Reception Terminal L3882 Location: Corrib Sheet no./rev. m ame On-Plot Storm Drainage -I-- l
Calc. by
I
Date
IM Nov ‘03 I
ChcKd by Date Aw’d 4’ Date
I
44.3 DRAINED AREA SUMMATIONS FOR INDIVIDUAL DRAIN RUNS (TIE IN POINT 1)
44.3.1 NORTH WEST OUTFALL DITCH SYSTEM -AREAS DRAINING TO DITCHES
hcription Conbibuting Bain Area Area cl!,Runoff Area SumofcMment to Pipe Length Length Breadth Coefficient (m2) Areas
m (m) (4 (ml (If Partially W) Ft?rvious)
NWmtfall Ditches Road Road Road Road PervioLlska Pen/ioLls Area Pervious Area Red
Road Road Road Road Road
Road Road Road Perviws Area
Road Road Pervious Area Road Road pen/iolJsArea
Total
.-- _.--..- -- .__._.-_-__ -- ..,_ __..” .-. _. ,..... ,.
,.-. ,.’ .,I
3.001 :’ ‘,lO ,j y-,(j .‘ ,‘i
3.003’.
6.00@ .;” ‘J$ :: : jio -3, 1 ,,g .: I 3 “06 --__ --.._ .._...-. - .---_ .:...
225 165 60 24
450 225 351 210
0 105 75
19% 60 45
135 0
60 180 54
263 0
84 54
180 75 45 50 0
285 171 135 81
330 207
1710 rw Carrier
376nl-z
240n-P carrier
667n-Q carrier
318 n-Q
1701T-Q Carrier
468n-Q
216 r-Q
537n-Q
For
insp
ectio
n pur
pose
s only
.
Conse
nt of
copy
right
owne
r req
uired
for a
ny ot
her u
se.
EPA Export 25-07-2013:16:15:40

ai- a 0
Client: Shell E & P Ireland Ltd. Job Ref. - Plant: Gas Reception Terminal L3882 Location: Corrib Sheet no/rev.
On-Plot Storm Drainage Calc. by Date Chck’d by Date Aw’d by Date
IM Nov ‘03
94.3.2 NORTH EAST OUTFALL DITCH SYSTEM - AREAS DRAINING TO DITCHES (TIE IN POINT 2)
Description Contributing Drain Area Area cv,Runoff Atea Sumof Conrwnt to Pipe Length Length Breadth Coefficient (rrQ) Areas
Length (ml (ml (m) (If Partially O-1 Pf3tViouS)
NE Wall Ditches Pervious Area Pervious Area
Pervious Area
Pervious Area
Pervious Area Pervious Area
PetviousRAng
Pewious Area
Petvious Area Pervious Area
-------? .__. *-li--__ .-.-. -- -..--. --- _-_.- .-._ - i.Om . . .,.40, -.;w-‘, : 10 ,’ 0.6
: : -: 30 -f’- .5- : 0.6
: i ‘3. I., :‘K -..
...3 ‘- ,;-, ,
~ ,’ :..j5 -: ; : .3 -. ,: 1.
‘..’ ,: ..,‘./ ., :. ,,
.:--, ,ji,, -;‘(.::. 3’.-), : ,
i j
.j3 :.“.‘I .“l:is. ., :,-‘$: 1 “’ ,
‘o ‘_( ,;o. ..,’ : o
5. !‘. ..3 ..-< 1
‘. * ._: ,-I5 .:3:, 1 , ,il: .,: :. ,;‘.;8 :, ,~. 1
_. y&Y. -5,. '.0.6
1.001~ .” Y.6 .‘.- 2333 .,.J!j’.
;25 .:3. ‘1 ‘. ., ‘. 22 ” -_. 6.’ .,’ ; 0.6
.' 1 0.6 .I, 1
0.6 0.6
0 0
204 90
105 45 45 45 0
150 45 88
105 75 79 54 0
54 225 180
El!32 96
180 1638 426 256 120 270 72
171 0 0
534n-Q Carrier
388nQ
154t-@ 54m2
Carrier 54n-Q
1797n-Q
1914 75%future paving allowd
682n-Q
633nQ Carrier Carrier
For
insp
ectio
n pur
pose
s only
.
Conse
nt of
copy
right
owne
r req
uired
for a
ny ot
her u
se.
EPA Export 25-07-2013:16:15:41

1 Client: Shell E & P Ireland Ltd. Plant: Gas Reception Terminal
I Location: Corrib Sheet no./rev.
On-Plot Storm Drainage Calc. by Date Chck’d by Date Aw’d by Date
7 I IM Nov ‘03
?
r)
I) I
44.3.3 EAST OUTFALL DITCH SYSTEM -AREAS DRAINING TO DITCHES (TIE IN POINT 31
Description Contributing Drain Area Atea Cv, Runoff Ama Sumof Connwd to Pipe Length Length Breadth Coefficient (II%?) Areas
Length (m) (ml (ml (If Partially (rr9) PWiOUS)
E Outfall Ditches Road Road Pervious Area Pervious Area
Rcrad Pervious Asea Road Pervious Area Rmd Road Pervious Area
Road Pervious Area Pervious Area Pervious Area
.) ,,:- 3E’ : ‘15 0.6
L.3 “_ .!I
640 64
240 306 1470 r-n2
0 Carrier 90
225 315 ns! 90
364 474 ti 64 69 96 249nQ 0 Carrier
75 572 268 216 1151 rn2
0 Carrier 0 Carrier
For in
spec
tion p
urpo
ses o
nly.
Conse
nt of
copy
right
owne
r req
uired
for a
ny ot
her u
se.
EPA Export 25-07-2013:16:15:41

amec* ICalc. by 1 Date
Client: Shell E & P Ireland Ltd. Job Ref. Plant: Gas Reception Terminal L3882 Location: Corrib Sheet no./rev.
On-Plot Storm Drainage 1 Chck’d by 1 Date
I IM I Nov ‘03 1 Aw’d by I Date I
44.3.4 SOUTH - EAST OUTFALL DITCH SYSTEM - AREAS DRAINING TO DITCHES (TIE IN POINT 41
Description Conbdbuting Drab Area Area Cv,FhmfF Area SumofCotmxnt to Pipe Length Length Breadth Coefficient (II@ Areas
Lm$h W ON (ml (If partially WI PerviOUS)
sEOUtklllDitdWS Road Pervious Area Road PenkILls Area
78 403 481 r?Q 72 58 13Ot-Q
carrier 99
554 653n-Q 39 31 70 n-Q
carrier 30
120 15OKQ carrier
3&a 540 102 942n-Q
Mer 150 72 222n-Q
210 396 144 75om2 93
240 33ort-e carrier
144 60 30 90
166 2xl 739rt-Q
carrier 150 386 !536ne
carrier 345
3795 4140 m2 30
396 126 552rlQ
carrier carrier
I@
‘Al’/.. ., 31.‘. ,:; 3 . . ; ; ‘1’ . O’ ,‘, .’ ,_ _, ,,,. I ., 1: ., ,:. ;, -., .’
:: j’ 28 ;, “. : .‘& ( ; o.$, Road PervioLJs Area Road PervioLIskea
3.~ .’ -‘: 13 -‘. “:‘,3:‘,.. -,.--j3-.
3.001:. 1
.‘, 4;: ” :I?”
~ld’-,;‘:;.o(- ‘- c 1.002: ” ,‘11:- ‘.f ; I..~(
1 (Jpg .’ ‘_ ::. ‘0 I,,;‘!. .“. .2q .,
. .- ,‘; l.m,. ._,. .. j& ‘: ..: ,,3:,,<” ” :,
Road PelvioLls Area
Road Pervious Area PeNicYJs Area
F&d Perviw Area Road Pervious Area PetviolJs Area Road Pervious Area
Road Road Pcad Pelvious Area Peivious Area Pervious Area
Road PeIvioLlskvea
1 0.6’
0’ ‘1
0.6’ 1’
0.6; 0.6/
‘. 01 0’
Road PenkusAK?a Road Perviolls Area Pervious Area
For
insp
ectio
n pur
pose
s only
.
Conse
nt of
copy
right
owne
r req
uired
for a
ny ot
her u
se.
EPA Export 25-07-2013:16:15:41
I Client: Shell E & P Ireland Ltd. Plant: Gas Reception Terminal Location: Corrib Sheet no./rev.
UMHMV On-Plot Storm Drainage
Calc. by Date Chck’d by Date Aw’d by Date ‘7 IM Nov ‘03
c
F F
F F F F
F
F F F F F
F f F f f f I I f I f I I
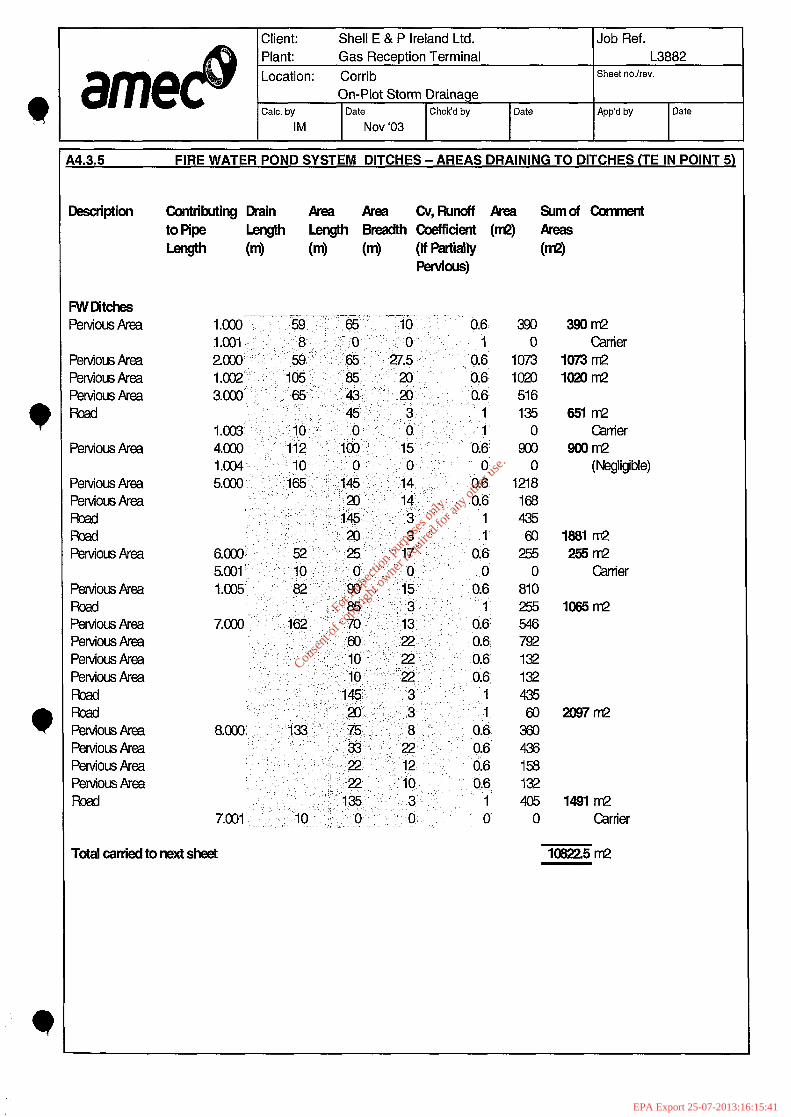
,4.3.5 FIRE WATER POND SYSTEM DITCHES-AREAS DRAINING TO DITCHES (TE IN POINT 5)
kscription Contributing kin Area Area Cv,RunuFf Area SumdConwwnt to Pipe Length Length Breadth Q&ficient (IT@ Areas
Length (ml (ml (ml (If Partially ma PHVIOUS)
w lxchl?s )ervious Area
)ervious Area bvious Area lervlous Area
BrvloLls Area
Btvlous Area Btvious Area
Brvlous Area
3ervious Area
wvious Area 3etvious Area 3ervious Area 3ervious Area
3etvious Area Brvious Area 3etvious Area 3ervious Area
__- ._. _^__r.l.-_-__-_ . . .._.___. -- .-.- ._ l.ooo ,J&;’ 65. .I0 0.6 390 39OrrQ l.ool.~,: (‘,.. 8 ;. ‘y.0. ,..O.” I 0 Carrier 2.W’ FJJ “. &- ‘, ,; q.5 0.6 1073 1073m2 ,.(xp j@j ,“& -20 .” 0.6 lox) 1ozorrl2 3.aIO ‘.; -651 j. .,fl3‘.: .- ” 20 : 06. . 516
.~-. 45~‘~’ ‘3 1
.:jo- .,: .’ 0 .-; Y’o 1’ 135 651 n-Q
1.003’ 0 Carrier 4.000’ .,..‘,,2 j(&‘:’ ,g ‘._ ‘, 0.6, 900 900 m2 1.004~- 10 :I‘(j ‘: “. 0 0’ 0 (Negligible) 5.ooo :
.“:‘l& 1. ,‘. i& ‘0.6 1218 -, /’ _, ;,
ia- ‘. : 14 ^‘Y :
‘:~, +i -1 0.6 168 :y: 1.4c:‘. ‘. ‘3 .‘- .I 435
,_:. ,;.~m. .,[ 3 :, : .I’ 60 1881 In2 fjJ-~@j:. ‘. 52., ;‘,:p5. . . ‘. ‘17 : 0.6: 255 255 n-Q
Carrier
1065rn2
.-‘:z ‘.- (j6, ,3,rJ : :.: _’
1’ 435 ‘<. .’ ’ 60 2097rn2
f3.fJ3-J ;i& _: ,,75. -. ‘-8 I. : ” O.$> Fjfj(j ‘. I,.;@ :;‘z.’ 0.6: 436
._. : ,i@ ‘1“ .:I& 0.6 158 : : 6.6, 132 ‘, 405
1491 m-2 7.001’ _/ _:_ .~ . .- 0 0 Carrier
rotsl caniecl to neld sheet 108225 n-f2
For
insp
ectio
n pur
pose
s only
.
Conse
nt of
copy
right
owne
r req
uired
for a
ny ot
her u
se.
EPA Export 25-07-2013:16:15:41
Client: Shell E & P Ireland Ltd. Job Ref. - Plant: Gas Reception Terminal L3882 Location: Corrib Sheet no./rev.
On-Plot Storm Drainage Calc. by Date Chck’d by Date Aw’d by Date
IM Nov ‘03
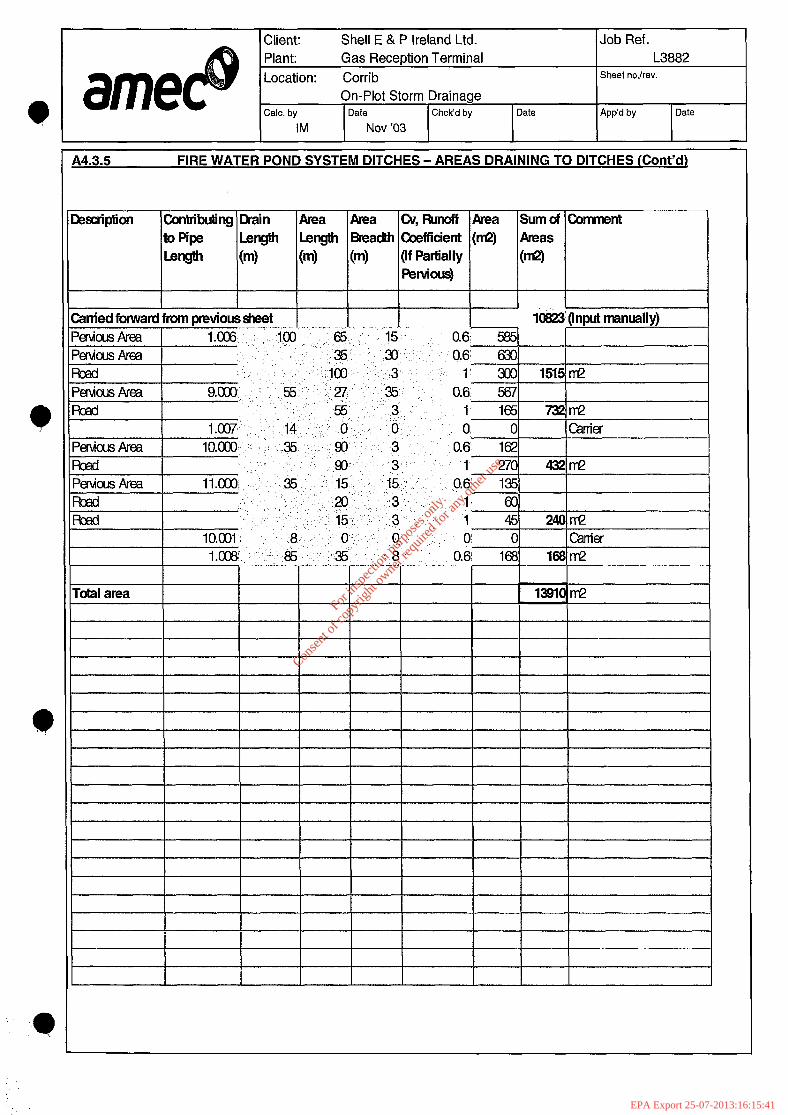
A4.3.5 FIRE WATER POND SYSTEM DITCHES - AREAS DRAINING TO DITCHES (Cont’d)
-.: -.: 1 1
__--- __---
For
insp
ectio
n pur
pose
s only
.
Conse
nt of
copy
right
owne
r req
uired
for a
ny ot
her u
se.
EPA Export 25-07-2013:16:15:41

I Client: I Plant:
Shell E & P Ireland Ltd. Gas Receotion Terminal
1 Job Ref. I L3882 I
d ame 1 Location: Corrib On-Plot Storm Drainage
I -m--v- Calc. by Date Chck’d by
-I I I IM I Nov ‘03 I
( Date ki
i4.3.6 WEST OUTFALL DITCH SYSTEM - AREAS DRAINING TO DITCHES (TIE IN POINT 61
kscription Conttibuti~ Drain Am Area Cv,Fh~noff Am SumofConwent to Pipe Length Length Breadth Cwfficient (nQ) Areas Lensth h-0 (ml (ml (If Partially @a
FlxvlolJs) ivchtfall Ditches
45 44
270 45
1984 630 360 41 3419 m2
carrier 54 18 54
135 261 m2 285 240 21
938 360 90 1934lYl2
carrier 246
18 144 18 426m2
420 45
252 22 739m2
carrier 45 60 27 27 159 m2
canier
For
insp
ectio
n pur
pose
s only
.
Conse
nt of
copy
right
owne
r req
uired
for a
ny ot
her u
se.
EPA Export 25-07-2013:16:15:41

Crawley West Sussex RHIO 1 UX Date II November 2003
Shell E & P Ireland Ltd Corrib Project
Amec Capital Projects Ltd 1 I The Boulevard
1 N W Outf& Ditches ) Designed By IM
Storm W.7.6 (c)l 982-2001 Micro Drainage
STORM SEWER DESIGN bv the Modified Rational Method
Global Variables
Location - Scotland & rreland
Return Period (years) 100 Volumetric RUnOff COeff. 0.77 MS-60 (mm) Infiltration % Ratio R Maximum Rainfall (mm/hr)
Minimum Backdrop Height (m) 0.00: 0
Foul sewage (l/s/ha) De th from soffit to G.L. (m) OiOCb:
0.00 Min Ve . 7 O’flOW Setting (“Foul Only)
(m/s - Auto Design Only) 0 Min slope (1:X - Optimisation) 1000
Designed with Level Soffits
PN
1.000 1.001 1.002
2.000
1.003
3.000
2% .
4.000
3.003
5.000
Network Design Table
1.000 140.00 0.010 14000.0 0.171 2.00 0 15.000 \/ 1.001 10.00 0.002 5000.0 0.000 0.00 :: 1EE \$
1; 1.002 30.00 0.002 15000.0 0.038 0.00 -3
2.000 15.00 0.120 125.0 0.024 2.00 0 0.600 o 150
1.003 10.00 0.020 500.0 0.000 0.00 0 6.000 \/ -3
3.000 57.00 0.002 28500.0 -0.066 2.00 3.001 10.00 0.002 5000.0 0.003 :-it
; 1g;;; 6:000
\( I f 3.002 30.00 0.050 600.0 0.032 . 0 l-1 -102
4.000 18.00 0.100 180.0 0.017 2.00 0 0.600 0 150
3.003 10.00 0.020 500.0 0.000 0.00 0 6.000 l-l -102
5..000 95.qO 0.006 1583i.3 0.046 2.06 0 15.000 \/ -2
Network Results Table
Rai n T.C. US/IL E.Area E.DWF Foul Infil. (mm/hr> (mins) Cm) (ha) Cl/s> Cl/s> Cl/s)
0:o E 16.5 99.474 0.171 17.0 20.2 99.462 99.464 0.209 0.171 0 : 0 i 0 :
0.0 2.3 99.400 0.024 0 0 0
0.0 .20.4 98.980 0.233 0 0 0
2: 0:o
12.5 13.2 99.624 99.622 EE 0: 101
i i ii 13.8 99.620 0 0 0
0.0 2.4 99.400 0.017 0 0 0
0.0 14.0 99.300 0.118 0 0 0
0.0 15.0 99.624 0.046 0 0 0
vel (m/s) (?S') $T$
0.16 0.32 16': E 0.16 53 0
0.90 16 0
1.00 338 0
0.09 0.26 41: t 0.81 219 0
0.75 13 0
0.89 240 0
0.12 22 0
For
insp
ectio
n pur
pose
s only
.
Conse
nt of
copy
right
owne
r req
uired
for a
ny ot
her u
se.
EPA Export 25-07-2013:16:15:41

Network Design Table
PN Le;mTth 7;; gygy $$ &,‘;, (yy$ k HYD DIA
(mm) SECT (mm)
3.004 45.00 0.050 900.0 0.022 0.00 0 6.000 I-1 -102
6.000 120.00 0.010 12000.0 0.054 2.00 0 15.000 \/ -2
1.004 13.00 0.250 52.0 0.000 0.00 0 0.600 0 750
PN Rai n T.C. US/IL E-Area E.DWF Foul Infil. vel (mm/hr) (mins) (m) (ha> (l/s) (l/s) Cl/s) (m/s1 6% C!$$
Network Results Table
3.004 0.0 16.2 99.280 0.186 0 0 0 0.66 179 0
6.000 0.0 16.3 99.624 0.054 0 0 0 0.14 25 0
1.004 0.0 20.5 98.660 0.473 0 0 0 3.89 1717 0
For
insp
ectio
n pur
pose
s only
.
Conse
nt of
copy
right
owne
r req
uired
for a
ny ot
her u
se.
EPA Export 25-07-2013:16:15:41

.- . 1 Amec Caoital Proiects Ltd
,. I Paae 3
d 1-l The Boulevard 1 Shell E & P Ireland Ltd -1 Crawley 1 Corrib Project
West Sussex RHIO 1 UX N W Outfall Ditches Date II November 2003 Designed By IM File N W Outfall Ditches.SWS Checked By Micro Drainage ,, Storm W.7.6 (c)l 982-Z ZOO1 Micro Drainage
The following hydraulic sections have been used in this network
NOTE: 'Diameters less than 66 i-efer to section numbers of hydraulic conduits. These conduits are marked by the symbols:- [] box
culvert, \/ open channel, oo dual pipe, ooo triple pipe, o egg.
Section numbers < 0 are taken from the file DITCH.SEC
Cm> Cm21
z; 300 300 450 300 t: -102 I-1 900 300
For
insp
ectio
n pur
pose
s only
.
Conse
nt of
copy
right
owne
r req
uired
for a
ny ot
her u
se.
EPA Export 25-07-2013:16:15:41

Micro Drainage Simulation W.7.6 (c)1982-2001 Micro Drainage
summarv of Results
Return Period (years) 1;; Analysis Time Step (seconds) 5 Storm Duration (mix) DVD Status OFF Margin for Flood Risk warning (mm) 300 Inertia status OFF
PN Water Lev. surchar ed Flooded Flow/ Overflow Pipe Flow Cm> Depth m) 9 vol (m3) capacity (l/s) (l/s)
Status
1.000 99.925 0.001 0.000 0.49 94 FLD RISK 1.001 Ei; -0.099 0.000 0.15
i OK
1.002 99:517 -0.110 2.000 -0.033 Ed 0.18 :
s; OK
0.96 OK
1.003 99.112 -0.318 0: 000 0.17
E OK
3.000 0.000
2%
0.46 00 OK
3.001 -0.078 0: 000 0.29 E 3.002 - 0.20 : :I:
4.000 I; 6;; -0:149 0.000 0.80 3i 3.003 0.000 0.29 F: 40 :1: 5.000 0.000 0.000 3.004
-E%o6 0.000 E9'
0:36 El 2
,O K OK
6.000 -0: 391
0.000 1.004 0.000 .0.16 : 12320
OK OK
For
insp
ectio
n pur
pose
s only
.
Conse
nt of
copy
right
owne
r req
uired
for a
ny ot
her u
se.
EPA Export 25-07-2013:16:15:41

Global Variables
%!I~~ P&-iod (yrs) M5-60 (mm) Ratio R Volumetric RUnOff COef Profile Type PIMP (%) Area1 Reduction Factor Storm Duration _(mi ns)
FSR
Hot Start (mins) Manhole Headloss Coefficient MADD Factor Foul
* lOm3/ha storage Sewa e/Hectare (l/s)
Additiona 4 Flow - % of Total Flow Number of Input Hydrographs Number of Time/Area Diagrams Number of Bifurcations Number of Overflows Number of Off-Line Controls Number of Tank sewers
Scotland & Ireland 100
22.200 0.400 0.770
Summer 100
1.000 15
;.;c$
0.00
i
: 0
1;
Freely Discharqinq Outfalls
outfall Pipe Number
Outfall C.LeVel I.LeVel D,L MH/No Cm> Cm> Cm0 0%
1.004 13 100.000 98.410 1200 0
For
insp
ectio
n pur
pose
s only
.
Conse
nt of
copy
right
owne
r req
uired
for a
ny ot
her u
se.
EPA Export 25-07-2013:16:15:41

Amec Capital Projects Ltd ? 1 The Boulevard
* Crawley 1 West Sussex RHIO I UX
Shell E & P Ireland Ltd Corrib Project N W Outfall Ditches
Iii 1 Date I 1 November 2003 Designed By IM
N W Outfall Ditches.SIM Checked By r* n-:..em,. lP:-..l,+:,, \nr -7 I2 f,\AnOr) r)nnA L”:--- n-e:.
File Mic 1 u UI clll kilyt; ~IIIIUI~LIUII VV.I .W ttij IYOL-LUU I IVIILIU vl4nage
Network Details
PN Fall Cm)
0.010 0.002 0.002
0.120
0.020
E% 0:oso
0.100
0.020
0.006
0.050
0.010
0.250
Slope (1:x)
14000 5000
1sooo
125
500
2E: 600
180
500
15833
900
12000
52
Area T.E. Rai n k (ha) (mins)
W'd Dia Pro (mm) Sect (mm)
0.171 0.000 0.038
0.024
0.000
FE062 0:032
0.017
0.000
0.046
0.022
0.054
0.000
2.bo 0.00 4 0.00 1
2.00 1
0.00 1
2.00 0.00 P 0.00 1
2.00 1
0.00 1
2.00 1
0.00 1
2.00 1
0.00 1
lEz 15:ooo
0.600
6.000
%Ei 6:000
0.600
6.000
15.000
6.000
15.000
0.600
$j -3 1;
0 150
\/ -3
v If -I -102
0 150
_I -102
\/ -2
1-l -102
\/
0
ctrl No.
-2
750
140.00 10.00 30.00
15.00
10.00
3.000 57.00 3.001 10.00 3.002 30.00
a
4.000
3.003
5.000
3.004
6.000
1.004
18.00
10.00
95.00
45.00
120.00
US/MH Cmm)
1200 1200 1200
1200 .
1200
1200 1200 1200
1200
1200
1200
1200
1200
1200
13.00
PN
1.000 1.001 1.002
2.000
1.003
3.000 3.001 3.002
4.000
3.003
5.000
3.004
6.000
1.004
USMH US/CL US/IL No. Cm) Cd
99.474 99.464 99.462
US:mD,eP DS/IL Cm>
DS/Dep Cm>
1.086 1.088 0.015
0.495
0.515
1.078 1.080 0.055
0.475
0.345
0.007
0.395
0.011
0.840
; 3
4
5
76 8
9
10
11
11
12
12
99.925 101.000 101.000
99.925
99.925
99.925 101.000 101.000
99.925
99.925
99.925
99.925
99.925
99.925
0.001 101.000 1.086 101.000 1.088 99.925
0.375 99.925
0.495 99.925
0.001 101.000
4%: . %% .
0.375 99.925
0.325 99.925
0.001 99.925
0.345 99.925
0.001 99.925
0.515 100.000
s! 99:460
99.280
98.960
99.622
iE;: .
99.300
99.280
99.618
99.230
99.614
98.410
99.400
98.980
99.624 99.622 99.620
99.400
99.300
99.624
99.280
99.624
98.660
For
insp
ectio
n pur
pose
s only
.
Conse
nt of
copy
right
owne
r req
uired
for a
ny ot
her u
se.
EPA Export 25-07-2013:16:15:41

:_ 1:
For
insp
ectio
n pur
pose
s only
.
Conse
nt of
copy
right
owne
r req
uired
for a
ny ot
her u
se.
EPA Export 25-07-2013:16:15:41

STORM SEWER DESIGN by the Modified Rational Method
Global Variables
Location - Scotland & Ireland
Return Period (years) ’ 100 Volumetric RUnOff COeff. 0.77 MS-60 (mm)
0% Infiltration %
Ratio R Minimum Backdrop Height Cm) 0.00: Maxi mum Rainfall (mm/hr> FOUR sewage (l/s/ha) O’flOW Setting (*Foul Only)
0.0: Min vel . (m/s - AUtO Design only) Depth from Soffit to G.L. Cm) lo2C);
Min Slope (1:X - OptimiSatiOn) 1000
Designed with Level soffi ts
PN
Network Design Table
Slope Area T.E. DWF HYD DIA (1:x) (ha) (mins) (l/s) (,km> SECT (mm)
1.000 40.00 0.005 8000.0 0.053 2.00 1.001 6.00 0.002 3000.0 0.000 0.00 r:
2.000 13.00 0.002 6500.0 0.039 2.00
1.002 29.00 0.004 7250.'0 0.016 0.00
3.000 13.00 0.001 13000.0 0.005 2.00
1.003 10.00 0.075 133.3 0.000 0.00
4.000 13.00 0.001 13000.0 0.005 2.00
1.004 75.00 0.170 441.2 0.180 0.00
5.000 78.00 0.010 7800.0 0.191 2.00
1.005 10.00 0.100 100.0 0.000 0.00
PN
1.000 1.001
2.000
1.002
3.000
1.003
4.000
1.004
5.000
1.005
Rai n (mm/hr>
;:i
0.0
0.0
0.0
0.0
0.0
0.0
0.0
0.0
T.C. (mi ns)
2:; 3.1
8.4
4.0
8.4
4.0
9.7
8.0
9.7
Netiork Results Table
US/IL Cm>
99.624 99.619
99.624
99.467
99.724
99.463
99.724
99.388
99.474
99.218
E .Area (ha>
0.053 0.053
0.039
0.108 :.
0.005
0.113
0.005
0.298
0.191
0.489
E.DWF Foul Cl/s) (l/s)
: :
0 0
0 0
0 0
0 0
0 0
0 0
0 0
0 0
15.000 \/ -2
15.000 - \7 -3
15.000 \/ -1
6.000 \/ -3
15.000 v -1
15.000 I-1 -103
15.000 \/ -3
6.000 \/ -3
Infil. Cl/s)
vel CAP Flow Cm/s) (l/s) (l/s)
0.17 31 0.33 59 i
0.19 34 0
0.22 76 0
0.11 11 0
1.94 655 0.
0.11 11 0
1.03 555 0
0.22 !3 0
2.24 756 0
For
insp
ectio
n pur
pose
s only
.
Conse
nt of
copy
right
owne
r req
uired
for a
ny ot
her u
se.
EPA Export 25-07-2013:16:15:41

Amec Capital Projects Ltd II The Boulevard 1 Shell E & P Ireland Ltd. Crawley Corrib Project West Sussex RHIO I UX N E Outfall Ditches Date 14 November 2003 Designed By IM File N E Outfall Ditches.SWS 1 Checked By Micro Drainaae Storm W.7.6 fc\l982-200 1 Micro Drainage
Network Desiqn Table
PN HYD DIA (mm) SECT (mm)
6.000 150.00 0.010 15000.0 0.068 2.00 0 15.000 \/ -3
7.000 140.00 0.010 14000.0 0.063 2.00 0 15.000 \/ -3
1.006 14.00 0.150 93.3 0.006 0.00 0 15.000 0 450
Network Results Table
PN Rai n T.C. US/IL E-Area E.DWF (mm/hr> (mins) Cm> (ha)
6.000 0.0 18.1 99.474 0.068 0 0 0 0.16 53 0
7.000 0.0 16.5 99.474 0.063 0 0 0 0.16 54 0
1.006 0.0 18.3 99.118 0.620 0 0 0 1.26 200 0
For
insp
ectio
n pur
pose
s only
.
Conse
nt of
copy
right
owne
r req
uired
for a
ny ot
her u
se.
EPA Export 25-07-2013:16:15:41

Amec Capital Projects Ltd 11 The Boulevard Crawley West Sussex RHI 0 1 UX Date 14 November 2003 File N E Outfall Ditches.SWS Micro Drainage
Shell E & P Ireland Ltd Corrib Project N E Outfail Ditches Designed By IM Checked By Storm W.7.6 (c)l 982-2
Page 3
- 1001 Micro Drainaae
The following hydraulic sections have been used in this network
NOTE: 'Diameters less than 66 refer to section numbers of hydraulic .conduits. These conduits are marked by the symbols:- [] box
ctilvert, \/ open channel, oo dual pipe, ooo triple pipe, 0 egg.
Section numbers < 0 are taken from the file Ditch.sec
1; 300 200 300 12 -3 % 450 45
-103 I-I 1200 450
0.462 0.100 0.627 0.180 0.860 0.338 1.029 0.540
For
insp
ectio
n pur
pose
s only
.
Conse
nt of
copy
right
owne
r req
uired
for a
ny ot
her u
se.
EPA Export 25-07-2013:16:15:41

[ Amec Capital Projects Ltd 1 II The Boulevard
) Page I 1 Shell E & P Ireland Ltd
Corrib Project N E Outfall Ditches Designed By IM
-1 Crawley West Sussex RHI 0 1 UX
1 Date 14 November 2003
: -a
Ditch es L SIM 1 -
Checked B; I Simulation W ‘.7.6 (c)1982-2001 Micro Drainage
Summary of Results
Return Period (years) 1:: Analysis Time Step (seconds) 5 Storm Duration (mi ns) DVD StatuS OFF Margin for Flood Risk warning (mm) 300 Inertia StatUS OFF
PN Water Lev. surchar ed 9
Flooded OVerfl ow Cm)
Fl ow,’ Depth m) Vol (m3) Capacity Cl/s)
Pi pe Flow (l/s)
Status
EiI 2:ooo
99.840 99.915 -0.009 -0.079 0.000 0.000
99.860 -0.064 0.000 1.002 99.819 -0.098 3.000
0.000
Em E -0.105 1.003 -0.294 E% 4.000 99:Slrj -0.105 0: 000 1.004 99.612 -0.226 0.000 5.000 99.924 0.000 0.000
99.586 -0.082 0.000
;;: E -0.029 0.000 70.057 0.000
1.006 99.577 0.009 0.000
0.38 0.27 0.27 0.28 0.07 0.14 0.07 0.26 0.57 0.39 0.19 0.18 1.09
OK OK
:: OK OK OK OK
:I: SURCH’ED
For
insp
ectio
n pur
pose
s only
.
Conse
nt of
copy
right
owne
r req
uired
for a
ny ot
her u
se.
EPA Export 25-07-2013:16:15:41

Amec Capital Projects Ltd II The Boulevard Crawley West Sussex RHI 0 1 UX
Shell E & P Ireland Ltd Corrib Project N E Outfall Ditches
Page 2
Date 14 November 2003 Designed By m/r File N E OutFall Ditches.SIM Checked By Micro Drainage Simulation W.7.6 (( :)I 982-2001 Micro Drainage
Global Variables
!%!:~~ Period (yrs) FSR - Scotland & Ireland
100 MS-60 (mm) 22.200 Ratio R VOlUnEtriC Runoff COef E% Profi 1 e Type Summer PIMP (%) 100 Area1 Reduction Factor 1.000 Storm Duration (minS) 15 Hot start (mins) Manhol e Head1 oss Coeffi ci ent 1.00: MADD Factor * lOm3/ha Storage Foul Sewa e/Hectare (l/s)
7 ‘tE0”
Addi ti ona ~1 ow - 96 of Total Flow Number of Input Hydrographs i Number of Time/Area Diagrams Number of Bifurcations i Number of Overflows Number of Off-Line Controls i Number of Tank Sewers 9
Freelv Discharqinq Outfalls
outfall outfall C.Level I.Level D,L B Pipe Number MH/No Cm) Cm) (mm) (mm)
1.006 14 99.925 98.968 1200 0
For
insp
ectio
n pur
pose
s only
.
Conse
nt of
copy
right
owne
r req
uired
for a
ny ot
her u
se.
EPA Export 25-07-2013:16:15:41

Amec Capital Projects Ltd 11 The Boulevard
’ Crawley l West Sussex RHIO I UX
Shell E & P Ireland Ltd Corrib Project N E Outfall Ditches
Date 14 November 2003 Designed By IM File N E Outfall Ditches.SIM Checked Bv Micro Drainage -- Simulation W.7.6 (c)l 982-2001 Micro Drainage
I) ‘.
Network Details
2.000 13.00 0.002 6500 0.039 2.00 1 15.000 \/ -2
1.002 29.00 0.004 7250 0.016 0.00 1 15.000 \/ -3
3.000 13.00 0.001 13000 0.005 2.00 1 15.000 \/ -1
1.003 10.00 0.075 133 0.000 0.06 1 6.000 \/ -3
4.000 13.00 0.001 13000 0.00s 2.00 1 15.000 \/ -1
1.004 75.00 0.170 441 0.180 O-00 1 15.000 I-1 -103
5.000 78.00 0.010 7800 0.191 2.00 1 15.000 \/ -3
1.005 10.00 0.100 100 0.000 0.00 1 6.000 \/ -3
6.000 150.00 0.010 15000 0.068 - 2.00 1 15.000 \/ -3
7.000 140.00. 0.010 14000 0.063 2.00 1 15.000 \/ -3
1.006 14.00 0.150 93 0.000 0.00 1 15.000 0 450
USMH PN No US/CL US/IL US/Dep DS/CL DS/IL DS/Dep Ctr1 US/MH
. Cm> (ml Cm> (ml Cm> Cm3 NO. (mm)
1.000 1.001
2.000
1.002
3.000
1.003
4.000
1.004
5.000
1.005
6.000
7.000
1.006
99.925 99.925
99.925
99.925
99.925
100.000
99.925
99.925
99.925
99.925
99.925
99.925
99.925
g. pi .
99.624
99.467
99.724
99.463
99.724
99.388
99.474
99.218
99.474
99.474
99.118
0.001 99.925 99.619 0.006 99.925 99.617
0.001 99.925 99.622
0.008 100.000 99.463
0.001 100.000 99.723
.0.087 99.925 99.388
0.001 99.925 99.723
0.087 99.925 99.218
0.001 99.925 99.464
0.257 99.925 99.118
0.001 99.925 99.464
0.001 99.925 99.464
0.357 99.925 98.968
0.006 1200 0.008 ? 1200
0.003 1200
0.087 4 1200
0.077 1200
0.087 4 1200
0.002 1200
0.257 4 1200
0.011 1200
0.357 4 1200
0.011 1200
0.011 1200
0.507 4 1200
For
insp
ectio
n pur
pose
s only
.
Conse
nt of
copy
right
owne
r req
uired
for a
ny ot
her u
se.
EPA Export 25-07-2013:16:15:41

For
insp
ectio
n pur
pose
s only
.
Conse
nt of
copy
right
owne
r req
uired
for a
ny ot
her u
se.
EPA Export 25-07-2013:16:15:42

Amec Capital Projects Ltd II The Boulevard Crawley
* West Sussex RHIO IUX Date 14-November-2003 File East Ditch OutfalLSW S Micro Drainage
) Page 1 Shell E & P Ireland Ltd. Corrib Project East Ditch Outfall Designed By IM Checked By Storm W.7.6 (c)1982-2001 Mi - cro Drainage
STORM SEWER DESIGN bv the Modified Rational Method
Global Variables
Location - Scotland & Ireland
Return Period (years) 100 Volumetric RUnOff Coeff. 0.77 M5-60 (mm) Infiltration % Ratio R Maximum Rainfall (mm/hr>
Minimum Backdrop Height Cm) 0.00:
Foul Sewage (l/s/ha) De th from soffit to G.L. (m) lo2C$
0.00 Min Ve . 7 O'flOw Setting ("Foul Only) 0
(m/s - AUtO Design Only) Min Slope (1:X - OptimlSatiOn) 1000
Designed with Level Soffits
Network Desiqn Table
PN HYD DIA (mm) SECT (mm)
1.000 12o.go 0.008 15000.0 0.150 2.00 1.001 9.00 0.003 3000.0 0.000 0.00 1.002 24.00 p.050 480.0 0.032 0.00
2.000 32.00 0..002 .16000.0 '0:048 .2.00
3.000 22.00 0.002 11000.0 0.025 2.00
2.001 10.00 0.002 5000.0 0.000 0.00
1.003 53.00 0.100 530.0 0.115 0.00
PN
1.000 1.001 1.002
2.000
3.000
2.001
1.003
Nekrvork Results Table
Rain US/IL (mm/hr) &E;) (m)
E.Area E.DWF Foul (ha) (l/s) (l/s)
0.0 14.9 99.474 0.150 0 0
to" 15.2 15.6 99.463 99.466 0.182 0.150 i 00
0.0 6.4 99.624 0.048 0 0
0.0 4.5 99.624 0.025 0 0
0.0 7.1 99.622 0.073 0 0
0.0 16.4 99.263 0.370 0 0
; 1;.;g \$ 0 15:ooo
1; I-i -103
0 15.000 \/ -2,
0 15.000 \/ -2
0 6.000 \/ -2
0 15.000 I-1 -104
Infil. vel (l/s) (m/s) (?$Z) 67;
0 0.16 0
00 0.41 0.99 00
0 0.12 22 0
0 0.15 26 0
0 0.26 46 0
0 1.12 1006 0
For
insp
ectio
n pur
pose
s only
.
Conse
nt of
copy
right
owne
r req
uired
for a
ny ot
her u
se.
EPA Export 25-07-2013:16:15:42

II
Amec Capital Projects Ltd ( Page2 1 I The Boulevard 1 Shell E & P 11 Crawley West Sussex RHI 0 I UX
reland Ltd. Corrib Project East Ditch Outfall
Date 14-November-2003 File East Ditch Outfall.SWS Micro Drainage
‘Designed By IM Checked By Storm W.7.6 (c)l 982-2001 Micro Drainage
The followinq hydraulic sections have been used in this network
NOTE: 'Diameters 'less than 66 refer to section numbers of hydraulic conduits. These conduits are marked by the symbols:- [] box
culvert, \/ open channel, oo dual pipe, ooo triple pipe, o egg.
section numbers < 0 are taken from the file Ditch.sec
1; 300 300 45 0.627 0.180 300 450 45 0.860 0.338
1;;; 1200 450 1.029 0.540 1500 600 1.333 0.900
-9 I I :
For
insp
ectio
n pur
pose
s only
.
Conse
nt of
copy
right
owne
r req
uired
for a
ny ot
her u
se.
EPA Export 25-07-2013:16:15:42

,
Amec Capital Projects Ltd II The Boulevard Shell E & P Ireland Ltd
Page I
Checked By I Simulation W.7.6 (c)1982-2001 Micro Drainage
Summary of Results
Return Period (years) 1;; Analysis Time Step (seconds) 5 Storm Duration (mi ns) DVD Status OFF Margin for Flood Risk warning (mm) 300 Inertia StatUS OFF
PN Water Lev. surchar ed F1 ooded Flow/ Cm> Depth m) 9 Vol (m3) Capacity
overflow Pipe Flow Status (J/S) (1 /S)
1.000 99.924 0.000 0.000 0.43 1.001 99.763 -0.153 0.000 0.33
00 ifi OK OK
1.002 99.693 -0.220 0.000 0.17 2.000 99.924 0.000 5% 0.35 0” ::
OK OK
3.000
kc?Ez 99: 685
-0.032
f : % -0.049 -0.178 0:ooo 0.000 f?:: 0:14 : 0 107 it
OK
OK 0 K
For
insp
ectio
n pur
pose
s only
.
Conse
nt of
copy
right
owne
r req
uired
for a
ny ot
her u
se.
EPA Export 25-07-2013:16:15:42

Region Return Per ~5-60 (mm) Ratio R .
iod (yrs)
VOlumetri c RUnOff coef Profile Type PIMP (%) Area1 Reduction Factor storm Duration (mins) Hot Start (mins) Manhole Headloss Coefficient MADD Factor * lOm3/ha storage Foul ‘Sewa e/Hectare (l/s) Additiona 9 glow - 36 of Total Flow Number of Input Hydrographs Number of Time/Area Diagrams Number of Bifurcations Number of overflows Number of Off-Line Controls Number of Tank Sewers
Global Variables
FSR - Scotland & 1rel;a.t
2Ei 0:770
summer
Freely Discharqinq Outfall&
outfall Outfall C.Level I.Level D,L B Pipe Number MH/No (ml 00 (mm) Cmml
1.003 8 99.925 99.163 1200 0
For
insp
ectio
n pur
pose
s only
.
Conse
nt of
copy
right
owne
r req
uired
for a
ny ot
her u
se.
EPA Export 25-07-2013:16:15:42

&nec Capital Projects Ltd 1 I The Boulevard Crawley West Sussex RHIO 1 UX Date 14-November-2003
1 Shell E & P 11 -eland Ltd Corrib Project East Ditch Outfall Designed By IM
1 Page 3
File East Ditch OutfaIlSIM ) Checked By Micro Drainage Simulation W ‘.7.6 (c)?982-2OO’I Micro Drainage
Network details
1:002 peg 1209.;; 24:00 0:OSO p33;
15000 0.150 2.00 1 15.000
3000 480 0.032 0.000 0.00 0.00 :: lE%
2.000 32.00 0.002 16000 0.048 2.00 1 15.000 \/ -2
3.000 22.00 0.002 11000 0.025 2.00 1 15.000 \/ -2
2.001 10.00 0.002 soob 0.000 0.00 1 6.000 \/ -2
1.003 53.00 0.100 530 0.115 0.00 1 15.000 1-I -104
USMH PN No US/CL US/IL US/Dep DS/CL DS/IL DS/Dep Ctrl US/MH
* (ml On) Cm) Cm) Cm> Cm> No. (mm)
1.000 1 99.925 99.474 0.001 100.000 99.466 0.084 1200 1.001
; 100.000 99.466 0.084 99.925 99.463 0.012 1200
-1.002 99.925 99.463 0.012 99.925 99.413 0.062 4" 1200
2.000 4 99.925 99.624 0.001 100.000 99.622 0.078 . 1200
3.000 5 99.425 99.624 0.001 100.000 99.622 0.078 1200
2.001 6 100.000 99.622 0.078 99.925 99.620 0.005 4 1200
1.003 7 99.925 99.263 0.062 99.925 99.163 0.162 4 1200
.
For
insp
ectio
n pur
pose
s only
.
Conse
nt of
copy
right
owne
r req
uired
for a
ny ot
her u
se.
EPA Export 25-07-2013:16:15:42
For
insp
ectio
n pur
pose
s only
.
Conse
nt of
copy
right
owne
r req
uired
for a
ny ot
her u
se.
EPA Export 25-07-2013:16:15:42

Micro Drainage Storm W.7.6 (c)1982-2001 Micro Drainage
STORM SEWER DESIGN by the Modified Rational Method
Global Variables
Location - Scot1 and & Ireland
Return Period (years) lt!
Volumetric Runoff COeff. 0.77 MS-60 (mm) Infiltration % Ratio R 0.40 Maximum Rai nfall (mm/hr>
Minimum Backdrop Height (m) 0.00:
~0~1 sewage (1 /s/ha) O’flow Setting (*Foul Only)
O.Og Min Vel . (m/s - AUtO Design Only) Depth from soffit to G.L. (m) lo2;;
Min Slope (1:X - Optimisation) 1000
Designed with Level soffits
Network Desiqn Table
PN slope Area (1:x) (ha) f$~;> $1
k HYD DIA (mm) SECT (mm)
1.000 24.00 ,0.009 2666.7 0.048 2.00 0 lS.000 \/ -2
El:: . 24.00 10.00 0.002 0.006 4000.0 5000.0 0.000 0.013 0.00 2.00 z;
1.001 31.00 0.003 10333.3 0.065 0.00 0 15.000 \/ -3
3.000 13.00 0.001 13000.0 0.007 2.00 3.001 10.00 0.001 10000.0 0.000 0.00 ; 1;.yg . \$ r f
1.002 11.00 0.001 11000.0 0.015 0.00 1.003 10.00 0.001 10000.0 0.000 0.00
; lyg \$ 1;
;.;g . 100.00 10.00 0.100 0.030 1000.0 333.3 0.095 0.000 0.00 0.00 0 0 15:000 6.000 I:[ 1;;;
4.000 44.00 0.001 44000.0 0.023 2.00 0 15.000 \/ -2
1.006 69.00 0.075 920.0 0.075 0.00 0 15.000 I-I -104
Network Results Table
PN Rain T.C. (mm/hr> (m-ins)
US/IL Cm)
1.000 0.0 3.3 99.624 0.048 0 0 0 0.30 53 0
2.000 0.0 3.7 99.624 0.013 0 2.001 0.0 4.3 99.618 0.013 0 i i Es: . 1: i
1.001 0.0 7.1 99.465 0.126 0 0 0 0.19 63 0
3.000 E 3.6 99.624 0.13 24 3.001 4.5 99.623 .;.;fX; . : ; t 0.18 32 00
1.002 0":: 8.1 99.462 0.148 1.003 8.8 99.461 0.148 El i 1.004 11.3 99.460 0.243 1.005 0":: 11.4 99.360 0.243 00 a0
i 0.22 0.18 7; D
00 E . 744 369 0 ii
4.000 0.0 12.1 99i624 0.023 0 0 0 0.07 13 0
1.006 0.0 $3.4 99.180 0.341 0 0 0 0.85 763 0
J
For
insp
ectio
n pur
pose
s only
.
Conse
nt of
copy
right
owne
r req
uired
for a
ny ot
her u
se.
EPA Export 25-07-2013:16:15:42

Micro Drainage Storm W.7.6 (c)1982-2001 Micro Drainage
Network Desiqn Table
PN LeFmTth ‘g; “c:p!$ 2;;;7 (;;;;) (y:) k HYD DIA
(mm) SECT (mm]
5.000 37.00 0.001 37000.0 0.033 2.00 O 15.000 v 5.001 12.00 0.001 12000.0 0.000 0.00 r f
5.002 86.00 0.001 86000.0 0.075 0.00 ; lE% \/ -3
1.007 10.00 0.030 333.3 0.000 0.00 0 6.000 l-1 -104
6.000 38.00 0.001 38000.0 0.054 2.00 0 15.000 \/ -2 6.001 10.00 0.030 333.3 0.000 0.00 6.002 115.00 0.120 958.3 0.414 0.00 t lE% 111 1;;;
1.008 70.00 0.050 1400.0 0.055 0.00 O "Z% I-1 1;;;
1": E;: 18.00 0.030 600.0 0.000 0.00 80.00 0.030 2666.7 0.000 0.00 i 0:600 I:1 -13
Network Results Table
PN Rai n US/IL E.Area E.DWF Cmm/hr> &kJ Cm>
Foul Infil. (l/51 Cl/s> Cl/s> b/5) 6% c%?
vel (ha>
5.000 9.8 99.624 EZ
0.08 14 5.001 E-i 11.0 99.623 : i fl 0.16 E 5.002 0:o 33.2 99.472 0:lOS 0 0 0 0.06 3; 0
1.007 0.0 33.3 99.105 0.449 0 0 0 1.63 1468 0
6.000 10.1 99.624 0.054 !?E
66: ES E 10.2 99.623 0.054 : z z 2;: z 0:o 13.0 99.443 0.468 0 0 0 0:70 377 0
1.008 34.9 99.075 E;z x
837 0 1.009 i-i 35.0 99.025 E!l i z
%f: 1.010 0:o 36.8 98.595 0: 972 0 0 0 0:76 i
For
insp
ectio
n pur
pose
s only
.
Conse
nt of
copy
right
owne
r req
uired
for a
ny ot
her u
se.
EPA Export 25-07-2013:16:15:42

1 Amec Caoital Proiects Ltd I Paae3 I 11 The Boulevard
-1 Cravvley West Sussex RHIO IUX Date 14-November-2003
Shell E & P Ireland Ltd Corrib Project S E Ditch Outfa!l Designed By IM
Micro Drainage Storm W.7.6 (c)1982-2001 Micro Drainage
The followinq hydraulic sections have been used in this network
NOTE: 'Diameters less than 66 refer to section numbers of hydraulic conduits. These conduits are marked by the symbols:- [J box
culvert, \/ open channel, oo dual pipe, ooo triple pipe, o egg.
Section numbers -C 0 are taken from the file Ditch.sec
~;;ibie()m conduit E$ir ",iiir side yyli 4*HYd ~~~~ TYPe (mm>' ' (mm>
Slope Radius (Deg) P mm> (ml Cm21
1; is Ei 450 300 45 0.860 0.627 0.180 0.338 -13 1000 2; 1.333 1.000
-102 IZI 900 % 0.720 0.270 -103 1200 450 1.029 0.540 -104 1500 600 1.333 0.900 -105 1900 600 1.471 1.140
II,
For
insp
ectio
n pur
pose
s only
.
Conse
nt of
copy
right
owne
r req
uired
for a
ny ot
her u
se.
EPA Export 25-07-2013:16:15:42
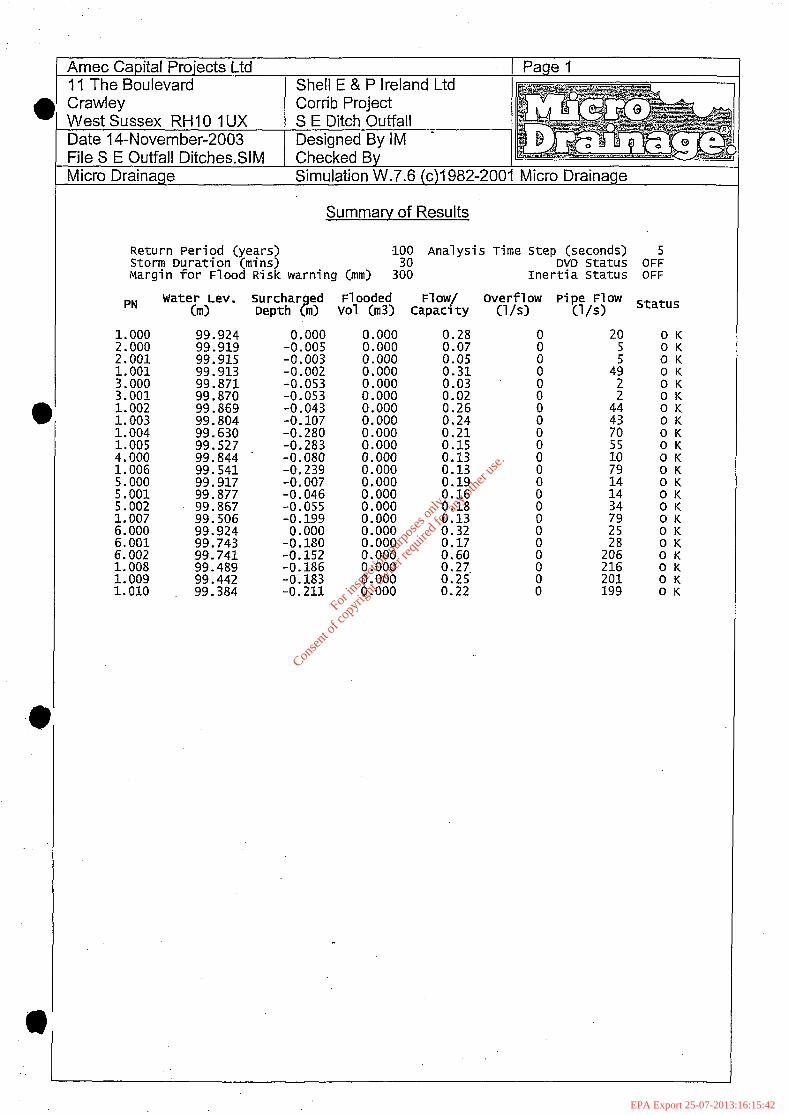
Micro Drainage Simulation W.7.6 (c)l 982-2001 Micro Drainage
Summary of Results
Return Period (years) Storm Duration (mins)
UC& Analysis Time step (seconds) 5 DVD Status OFF
Margin for Flood Risk warning (mm) 300 Inertia StatUS OFF
PN
1.000 2.000 2.001
%% . 3.001 1.002 1.003 1.004 1.005 4.000 1.006 5.000 5.001 5.002
k% . 6.001 6.002 1.008 1.009 1.010
Water Lev. Cm>
99.924 99.919 99.915 99.913 99.871 99.870
99.844 99.541 99.917 99.877 99.867 99.506 99.924 99.743 99.741 99.489 99.442 99.384
surchar ed Depth m) 9
0.000 -0.005
I;*;;; -0:053 -0.053 -0.043 -0.107
-0.046 -0.055
-0": E ;g . p;
-0:186 -0.183 -0.211
~1 ooded Vol (m3)
0.000 0.000 0.000 0.000 0.000 0.000
EE 0:ooo 0.000 0.000 0.000 0.000
KE 0: 000 0.000 0.000 0.000 0.000 0.000 0.000
Flow/ capacity
0.28 0.07 0.05
E: . 0.02 0.26 0.24 0.21 0.15 0.13 0.13 0.19
E 0:13 0.32 0.17 0.60 0.27 0.25 0.22
Overflow Cl /cl
Pipe Flow Cl/S>
20 5
4; 2
14
;:: 25
2;: 216 201 199
Status
OK OK OK
:I: OK OK OK OK
0": OK OK
2 OK OK
001: OK OK OK
For
insp
ectio
n pur
pose
s only
.
Conse
nt of
copy
right
owne
r req
uired
for a
ny ot
her u
se.
EPA Export 25-07-2013:16:15:42
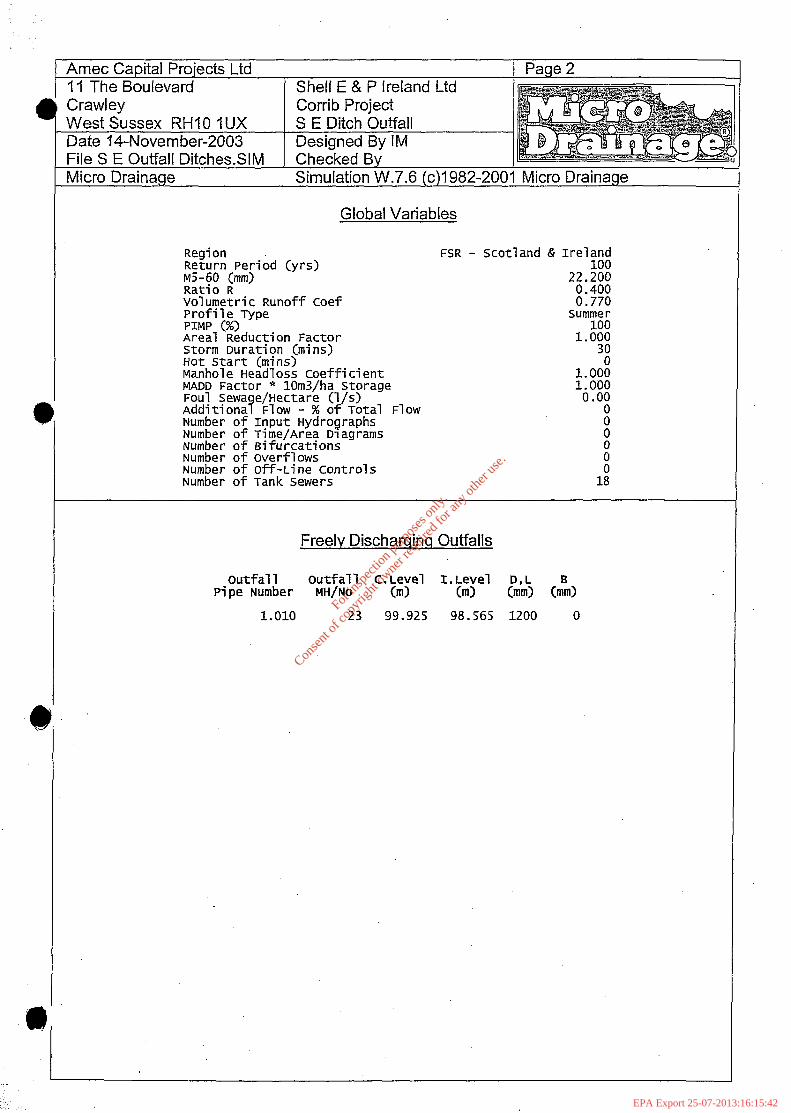
1 Arnec Capital Projects Ltd ) Page2 ?I The Boulevard
I Crawley West Sussex RHO 1 UX Date 14-November-2003 File S E Outfall DitchesSIM Micro Drainage
Shell E & P Ireland Ltd Corrib Project S E Ditch Outfall Designed By IM Checked By Simulation W.7.6 (c)l 982-2001 Micro Drainage
Global Variables
~~!!:~~ Period (yrs) MS-60 fmm)
FSR - Scotland & Ireland 100
22.200 Ratio R - Volumetric RUnOff COef Profile Type PIMP (%) Area1 Reduction Factor Storm Duration (mins) Hot start (mins) Manhole Headloss coefficient MADD Factor * lOm3/ha Storage Foul Sewa e/Hectare (l/s) Additiona Flow ? - % Of Total Flow Number of Input Hydrographs Number of Time/Area Diagrams Number of Bifurcations Number of overflows Number of off-Line Controls Number of Tank Sewers
Freely Discharqinq Outfalls
outfall outfall C.Level I.Level D,L I3 Pipe Number MH/No Cm) (ml (mm) (mm)
1.010 23 99.925 98.565 1200 0
. .._
For
insp
ectio
n pur
pose
s only
.
Conse
nt of
copy
right
owne
r req
uired
for a
ny ot
her u
se.
EPA Export 25-07-2013:16:15:42

Amec Capital Projeci 11 The Boulevard Crawley Proiect
Micro Drainage Simulation W.7.6 (c)l 982-2001 Micro Drainage
Date 14-November-2003 Designed By IM
Network Details
1.000 24.00 0.009 2667 0.048
2.000 24.00 0.006 4000 0.013 2.001 10.00 0.002 5000 0.000
1.001 31.00
1.002 1.003 1.004 1.005
4.000
E% .
11.00 10.00
% - 2 .
44.00
1.006 69.00
5.000 5.001 5.002
1.007 10.00
0.003
0.001 0.001
0.001
E% 0:030
0.001
0.075
0.001 0.001 0.003
0.030
10333 0.065
13000 0.007 10000 0.000
11000 0.015 10000 0.000
1000 0.095 333 0.000
32000 0.023
920
32000 12000 32000
333
0.075
0.033 0.000 0.075
0.000
ki% 38.00 0.001 32;;; ;.;;; 10.00 0.030
6:002 115.00 0.120 958 0:414
PN
1.000
2.000 2.001
1.001
3.000 3.001
1.002 1.003 1.004 1.005
4.000
1.006
1.007
6.000
:: Et
IJiMH US/CL US/IL No. Cd Cm)
1 99.925 99.624
2 99.925 99.624 3 100.000 99.618
4 99.925 99.465
: 1OO:OOO 99 925 99 99:623 624
99 925 99 462 3 100'000 99'461
99'925 99'460 1: 1OO:OOO 99:360
11 99.925 99.624
12 99.925 99.180
13 99.925 99.624 14 100.000 99.623 15 99.925 99.472
16 100.000 9CY.105
$ 100.000 99.925 99.925 99.443 99.624 99.623
Us/Dep Cm)
0.001
T.E. (m-ins)
2.00
2.00 0.00
0.00
2.00 0.00
0.00 0.00 0.00 0.00
2.00
0.00
2.00 0.00 0.00
0.00
2.00 0.00 0.00
lx/CL Cm1
99.925
pm; 1gg.w;
.
0.010 -99.925
O.Odl 100.000 0.077 99.925
0.013 lcgtg 0.089 . 0.015 10~.000 0.190 99.925
0.001 99.925
0.145 100.000
0.001 100.000 0.077 99.925 0.003 100.000
0.295 99.925
0.001 1;g.g;;
KG: . 99:925
Rain k Pro (mm>
1 15.000
1 15.000 1 6.000
1 15.000
1 15.000 1 6.000
1 15.000
i 1
1;:ig .
1 15.000
1 15.000
1 15.000
t lK%
1 6.000
1 15.000
: l?%
DS/IL Cm)
DS/Dep (ml
99.615 0.010
0.082 0.009
99.462 0.013
99.623 0.077 99.622 0.003
99.461 99.460
g: ;g
0.089 0.015 0.190 0.145
99.623 0.002
99.105
;z- E 99: 471
99.075
E-E: 99: 323
0.295
0.077 0.003 0.079
0.250
0.077 0.032 0.152
ttrl No.
US/MH (mm>
1200
1200 1200
1200
EG
1200
EL?: 1200
1200
1200
1200
EE
1200
EE 1200
For
insp
ectio
n pur
pose
s only
.
Conse
nt of
copy
right
owne
r req
uired
for a
ny ot
her u
se.
EPA Export 25-07-2013:16:15:42

Amec Capital Projects Ltd 11 The Boulevard Crawley West Sussex RHIO ?UX Date 14-November-2003 File S E Outfall Ditches.SIM Micro Drainage
Page 4 Shell E & P Ireland Ltd Corri b Project S E Ditch O&fall Designed By IM Checked By Simulation W.7.6 (c)l 982-2001 Micro Drainage
Network Details
PN Wd Dia Sect (mm)
1.008 70.00 0.050 1400 0.055 0.00 l 1.009 18.00 0.030 600 0.000 0.00 1x:: 1-1 1;;; 1.010 80.00 0.030 2667 0.000 0.00 i 0:600 111 -13
USMH PN No
US/CL US/IL DS/CL DS/IL DS/DeP Ctrl US/MH . Cm> Cm> Cm> Cm) (m) No. (mm1
1.008 E 99 925 100'000
99 075 99'025
;.;;; 100.000 99.025 0.375 4 1200 1.009
99:925 98: 595 01330 99.925 98.995 0.330 1200
1.010 22 99.925 98.565 0.360 44 1200
For
insp
ectio
n pur
pose
s only
.
Conse
nt of
copy
right
owne
r req
uired
for a
ny ot
her u
se.
EPA Export 25-07-2013:16:15:42
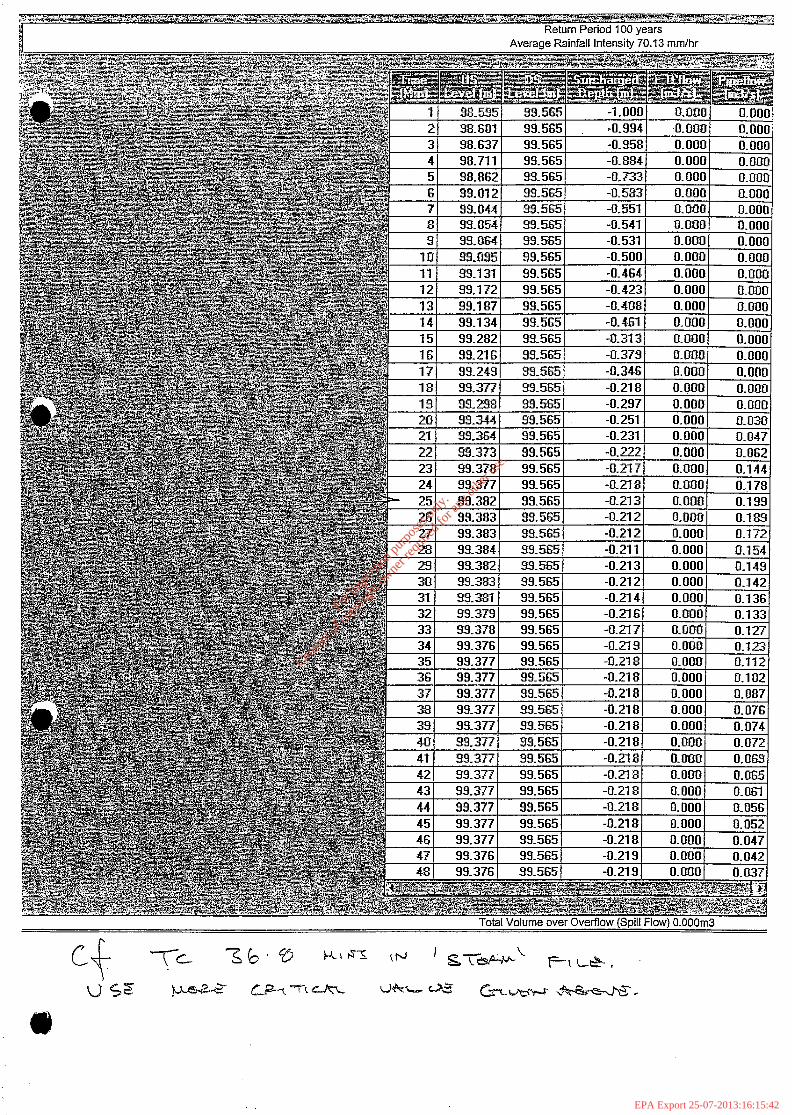
For
insp
ectio
n pur
pose
s only
.
Conse
nt of
copy
right
owne
r req
uired
for a
ny ot
her u
se.
EPA Export 25-07-2013:16:15:42

I Amec Capital Projects Ltd 1 Page 1 1 II The Boulevard 1 Shelf E & P Ireland Ltd.
t Crawley Corri b Project West Sussex RHIO 1 UX Firewater pond Ditches Date 14 November 2003 Designed By IM File FW POND DITCHES 02... Checked By Micro Drainage . Storm W.7.6 (c)l 982-2001 Micro Drainage
STORM SEWER DESIGN by the Modified Rational Method
Global Variables
Location - Scotland & Ireland
Return Period (years) 100 Volumetric Runoff Coeff. 0.77 ~5-60 (mm) Infiltration % Ratio R 0.:; Maximum Rainfall (mm/hr)
Minimum Backdrop Height (m) 0.00:
~0~1 Sewage (l/s/ha) Depth from Soffit to G.L. (m) 1.02;:
O'flow Setting (*Foul only) O.Oi Min Vel. (m/s - Auto Design Only)
Min slope (1:X - optimlsation) 1000
Designed with Level Soffits
Network Desiqn Table
PN Leg)th 7;; ‘rpg,e $$ (& (yy5’, dh HYD DIA
SECT (II&
1.000 5z.g . pm; .
14750.0 0.039 2.00 1.001 533.3 0.000 0.00 ; 1yg \( 1:
2.000 59.00 0.003 19666.7 d.108 2.00 0 15.000 \/ -3
1.002 105.00 0.030 3500.0 0.102 0.00 0 15.000 I-I -103
3.000 6.5.00 0.002 32500.0 0.066 2.00 0 15.000 \/ -2
1.003 10.00 0.015 666.7 0.000 0.00 0 6.000 l-l -103
4.000 112.00 0.005 22400.0 0.090 2.00 0 15.000 \/ -3
1.004 10.00 0.015 666.7 0.000 0.00 0 15.000 l-l -103
5.000 165.00 0.050 3300.0 0.188 2.00 0 15.000 l-l -102
6.000 52.00 0.001 52000.0 0.026 2.00 0 15.000 \/ -2
Network Results Table
PN Rai n T.C. E.Area E.DWF (mm/hr) (mi ns) (ha1
1.000 t:: 9.8 99.624 0.039 1.001 10.0 99.620 0.039 ! 00 i 0.13 0.78 32 00
2.000 0.0 9.2 99.475 0.108 0 0 0 0.14 46 0
1.002 0.0 14.8 99.455 0.249 0 0 0 0.36 197 0
3.000 0.0 14.8 99.624 0.066 0 .o 0 0.08 15 0
1.003 0.0 15.0 99.425 0.315 0 0 0 0.97 526 0
4.000 0.0 16.7 '99.475 0.090 0 0 0 0.13 43 0
1.004 0.0 16.9 99.410 0.405 0 0 0 0.84 452 0
5.000 0.0 11.4 99.624 0.188 0 0 0 0.29 79 0
6.000 0.0 1510 99.624 0.026 0 0 0 0.07 12 0
For
insp
ectio
n pur
pose
s only
.
Conse
nt of
copy
right
owne
r req
uired
for a
ny ot
her u
se.
EPA Export 25-07-2013:16:15:42

Amec Capital Projects Ltd . . .
Page 2 I 1 The Boulevard Shell E & P Ireland Ltd. Crawley Corri b Project West Sussex RHIO IUX Firewater pond Ditches Date 14 November 2003 Designed By IM File FW POND DITCHES 02... Checked By Micro Drainage Storm W.7.6 (c)l 982-2001 Micro Drainage
Network Design Table
5.001 10.00 0.020 500.0 0.000 0.00 0 6.000
1.005 82.00 0.020 4100.0 0.107 0.00 0 15.000
7.000 162.00 0.150 1080.0 0.210 2.00 0 15.000
8.000 133.00 0.195 682.1 0.149 2.00 0 15.000
7.001 10.00 .0.030 333.3 0.000 0.00 0 6.000
1.006 100.00 0.075 1333.3 0.151 0.00 0 15.000
9.000 55.00 0.005 11000.0 0.073 2.00 0 15.000
1.007 14.00 0.020 700.0 0.000 0.00 0 6.000
lb, 000 90 .'oo 0.008 11250.0 0.043 2.00 0 15.000
11.000 35.00 0.002 17500.0 0.024 2.00 0 15.000
1.008 85.00 0.200 425.0 0.017 0.00 0 15.000
PN Rai n T.C. US/IL E.Area E.DWF Foul Infi 1. vel (mm/h t-1 Cmins) Cm) (ha) Cl/s) Cl/s) Cl/s> (m/s)
5.001 0.0 15.2 99.574 0.214 0 0 0 0.89 240 0
1.005 0.0 20.3 99.245 0.726 0 0 0 0.40 361 0
7.000 0.0 7.3 99.624 0.210 0 0 0 0.51 139 0
8.000 0.0 6.4 99.624 0.149 0 0 0 0.51 71 0
7.001 0.0 7.4 99.329 0.359 0 0 0 1.09 294 0
1.006 0.0 22.5 98.999 1.236 0 0 0 0.75 858 0
9.000 0.0 8.3 99.624 0.073 0 0 0 0.15 26 0
1.007 0.0 22.7 98.924 1.309 0 0 0 1.20 1368 0
10.000 0.0 12.4 99.624 0.043 0 0 0 0.14 26 0
11.000 0.0 7.0 '99.624 0.024 0 0 0 0.12 21 0
1.008 0.0 23.8 98.504 1.393 0 0 0 1.25 1248 0
r6i k)
Network Results Table
DWF k HYD DIA ii/S) Cmm) SECT Cm)
I-l I-I I-1 1-l I-I 1-l
.\/ I-I \/ \/ l-l
-102
-104
-102
-101
-102
-105
-2
-105
-2
-2
-13
-:
For
insp
ectio
n pur
pose
s only
.
Conse
nt of
copy
right
owne
r req
uired
for a
ny ot
her u
se.
EPA Export 25-07-2013:16:15:42

I Amec Caoital Proiects Ltd I Paae 3
i
I
The following hydraulic sections have been used in this network
NOTE: 'Diameters less than 66 refer to section numbers of hydraulic conduits. These conduits are marked by the symbols:- [I box
culvert, \/ open channel, oo dual pipe, ooo triple pipe, o egg.
Section numbers < 0 are taken from the file Ditch.sec
-2 \/ 300 300 45 0.627 0.180 -3
i;;: -102 -103 -104 -105
v 300 450
III 1000 700 l!E: jI/ 1200 1500 900 450 600 300
1-l 1900 600
0.860 0.338 1.333 1.000 0.509 0.140 0.720 0.270 1.029 0.540 1.333 0.900 1.471 1.140
For
insp
ectio
n pur
pose
s only
.
Conse
nt of
copy
right
owne
r req
uired
for a
ny ot
her u
se.
EPA Export 25-07-2013:16:15:42

1 Amec Caoital Proiects Ltd I Paae 1 1 I The Boulevard Shell E & P Ireland Ltd. Crawley Corrib Project West Sussex RHI 0 1 UX .’ Firewater pond Ditches Date 14 November 2003 Designed By IM File FW POND DITCHES 02... Checked By Micro Drainage Simulation W.7.6 (c)l 982-2001 Micro Drainage
Summaw of Results
Return Period (years) Storm Duration (mi ns)
l@$ Analysis Time Step (seconds) 5 DVD Status OFF
Margin for Flood Risk warning (mm) 300 Inerti a status OFF
PN
1.000
t:Ei
?E 1:003
;2-::: 5:ooo 6.000 s.ooi 1.005 7.000 8.000
Ek . 9.000 1.007
::-oo~~ 1:OOS
water Lev. surchar ed F1 ooded Cm) Depth m) 9 vol (m3)
99.891 -0.033 0.000 99.769
-L%i 0.000
99.925 -oh41
0.000 99.764 0.000 99.924 99.637 99.910
99.842
99.628 99.924
99.163
99.858 99.707 99.611 99.903
EE g; : ;;g
99: 195 99.885
-0.232 0.000
-0.066 -0.167
I;-;;; 0:ooo
I;-:;;
-0.082
0:ooo -0.329 -0.039
-0.341
0.000 0.000 0.000 0.000 0.000 0.000 0.000 0.000 0.000 0.000 0.000 0.000 0.000 KEl 0:ooo 0.000
Flow/ Capacity
0.22 0.17' 0.28 0.25
00% 0:21 0.35 0.62 0.15 0.52 0.29 0.69 1.00
E4 0:42 0.50 0.24
E
Overflow Pipe Flow Cl/s> (l/S)
Fl 0
status
OK OK
:I:
:KK OK OK
0”: OK OK
001: OK OK OK OK OK OK OK
For
insp
ectio
n pur
pose
s only
.
Conse
nt of
copy
right
owne
r req
uired
for a
ny ot
her u
se.
EPA Export 25-07-2013:16:15:43

e I
Amec Capital Projects Ltd 1 I The Boulevard Crawley West Sussex RHI 0 1 UX Date 14 November 2003 File FW POND DITCHES 02. Micro Drainage
Shell E & P Ireland Ltd. Corri b Project Firewater pond Ditcties Designed By IM Checked By Simulation W.7.6 (c)l 982
Global Variables
I
1 Micro Drainage
:%I:: Period (yrs) MS-60 (mm)
FSR - Scotland & Ireland 100
22.200 Ratio ri - Volumetric RUnOff COef Profile Type PIMP (%> Area1 Reduction FaCtOr storm Duration (mins) Hot Start (mins) Manhole Headloss Coefficient MADD Factor * lOm3/ha storage Foul Sewa e/Hectare
7 Cl/s>
Additiona glow - % of Total Flow .Number of Input Hydrographs Number of Time/Area Diagrams Number of Bifurcations Number of overflows Number of off-Line Controls Number of Tank Sewers
0.'400 0.770
Summer 100
1.000 30
1.00: 1.000
0.00
Freely Discharqinq Outfalls
outfall Outfall C.Level I.Level D,L B Pipe Number MH/NO Cm> Cm> (mm> (mm>
1.008 20 99.925 98.304 1200 0.
For
insp
ectio
n pur
pose
s only
.
Conse
nt of
copy
right
owne
r req
uired
for a
ny ot
her u
se.
EPA Export 25-07-2013:16:15:43

Amec Capital Projects Ltd 1 I The Boulevard
_ Crawley Shell E & P Ireland Ltd. Cdrrib Project
Page 3
-1’ West Sussex RHI 0 1 UX Firewater pond Ditches Date 14 November 2003 Designed By IM File FW POND DITCHES 02... Checked Bv Micro Drainage Simulation W.7.6 (c)l 982-2001 Micro Drainage
Network Details
PN Le(nmqth F$; T;pr$ 4;;;~
1.000 59.00 0.004 1.001 8.00 0.015 14;;; px; .
2.000 59.00 0.003 19667 0.108
1.002 105.00 0.030 3500 0.102
3.000 65.00 0.002 32000 0.066
1.003 10.00 0.015 667 0.000
4.000 112.00 0.005 22400 0.09d
1.004 10.00 0.015 667 0.000
5.000 165.00 0.050 3300 0.188
6.000 52.00 0.002 32000 0.026
5.001 10.00 0.020 500 0.000
1.005 82.00 0.020 4100 0.107
7.000 162.00 0.150 1080 0.210
8.000 133.00 0.195 682 0.149
7.001 10.00 0.030 333 0.000
PN
1.000 1.001
2.000
1.002
3.000
1.003
4.000
1.004
5.000
6.000
5.001
1.005
7.000
8.000
7.001
USMH
3
4
5
6
7
8
9
10
11
12
13
14
15
US/CL US/IL US/Dep (ml Cm) Cm)
99.925 99.624 0.001 100.000 99.620 0.080
99.925 99.475 0.000
99.925 99.455 0.020
99.925 99.624 0.001
100.000 99.425 0.125
99.925 99.475 0.000
99.925 99.410 0.065
99.925 99.624 0.001
99.925 99.624 0.001
100.000 99.574 0.126
99.925 99.245 0.080
99.925 99.624 0.001
99.925 99.624 0.101
100.000 99.329 0.371
T.E. Rai n k Wd Dia (mi ns) Pro (mm) Sect (mm)
2.00 1 15.000 0.00 1 6.000 v If
2.00 1 15.000
0.00 1 15.000
2.00 1 15.000
0.00 1 6.000
2.00 1 15.000
0.00 1 15.000
2.00 1 15.000
2.00 1 15.000
0.00 1 6.000
0.00 1 15.000
2.00 1 15.000
2.00 1 15.000
0.00 1 6.000
DS/CL DS/IL (m) Cm>
100.000 99.620 99.925 99.605
99.925 99.472
100.000 99.425
100.000 99.622
99.925 99.410
99.925 99.470
99.925 99.395
100.000 99.574
100.000 99.623
99.925 99.554
99.925 99.225
100 rn 000 99.474
100.000 99.429
99.925 99.299
DS/Dep (ml
E:: .
0.003
0.125
0.078
0.065
0.005
0.080
0.126
0.077
0;071
0.100
0.226
0.371
0.326
\/ -3
I-I -103
\/ -2
I-I -103
\/ -3
I-1 -103
I-I -102
\/ -2
I-I -102
I-I -104
I-I -102
l-l -101 l-l -102
Ctrl US/MH No. (mm)
1200 4 '1200
1200
4 1200
1200
4 1200
1200
4 1200
1200
1200
4 1200
4 1200
1200
1200
4 1200
For
insp
ectio
n pur
pose
s only
.
Conse
nt of
copy
right
owne
r req
uired
for a
ny ot
her u
se.
EPA Export 25-07-2013:16:15:43

Amec Capital Projects Ltd 11 The Boulevard Shell E & P Ireland Ltd.
a Crawley Corrib Project West Sussex RHI 0 I UX Firewater pond Ditches Date 14 November 2003 Designed By IM File FW POND DITCHES 02... Checked Bv Micro Drainage Simulation W.7.6 (c)l 982-2001 Micro Drainage
Network Details
PN Lymyh Fpm:1 ;;pxp~ $--y c;i;il "p"r'o" k Wd Dia (mm> Sect (mm>
1.006 100.00 0.075 1333 0.151 0.00 1 15.000 l-l -105
9.000 55.00 0.005 11000 0.073 2.00. 1 15.000 \/ -2
1.007 14.00 0.020 700 0.000 0.00 1 6.000 I-I -105
10.000 90.00 0.008 11250 0.043 2.00 1 15.000 \/ -2
11.000 35.00 0.002 17500 0.024 2.00 1 15.000 \/ -2
1.008 85.00 o.ioo 425 0.017 0.00 1 15.000 I-1 -i3
USMH PN No US/CL US/IL lJS/Dep
. Cm> (ml Cm) "T/F' DS/IL
m (ml
1.006 16 99.925 98.999 0.326 100.000 98.924
9.000 17 99.925 99.624 0.001 100.000 99.619
1.007 18 100.000 98.924 0.476 99.925 98.904
10.000 19 99.925 99.624 0.001 99.925 99.616
11.000 19 99.925 99.624 0.001 99.925 99.622
1.008 19 99.925 98.504 0.421 99.925 98.304
DS/Dep Cm>
Ctr1 US/MH No. (mm>
0.476 4 1200
0.081 1200
0.421 4 1200
0.009 1200
0.003 1200
0.621 4 1200
For
insp
ectio
n pur
pose
s only
.
Conse
nt of
copy
right
owne
r req
uired
for a
ny ot
her u
se.
EPA Export 25-07-2013:16:15:43

- Return Period 100 years Averaae Rainfall lntensitv 70.13mmlhr
For
insp
ectio
n pur
pose
s only
.
Conse
nt of
copy
right
owne
r req
uired
for a
ny ot
her u
se.
EPA Export 25-07-2013:16:15:43

STORM SEWER DESIGN by the Modified Rational Method
Global Variables.
Location - Scotland &I Ireland
Return Period (years) 100 Volumetric Runoff coeff. 0.77 MS-60 (mm) Infiltration % Ratio R Maximum Rainfall (mm/hr>
Minimum Backdrop Height (m) 0.00:
Foul Sewage (l/s/ha) Depth from Soffit to G.L. (m) OhOIL!
O'flOW Setting ("Foul Only) 0.0: Min Vel. (m/s - AUtO Design only)
Min slope (1:X - Optimisation) 1000
Designed with Level Soffits
c Network Desiqn Table
PN Le(nmqth Fpm:l 'cp!T gg7 &&) (ys') k HYD DIA
(mm) SECT (mm)
1.000 125.00 0.020 6250.0 0.342 2.00 0 15.000 -103 1.001 10.00 0.020 500.0 0.000 0.00
iI/ -103
1.002 17.00 0.020 850.0 0.026 0.00 : 2%~ I-I -103
2.000 143.00 0.005 28600.0 0.194 2.00 0 15.000 \/ -4
1.003 10.00 0.020 500.0 0.000 0.00 0 6.000 I-I -104
3.000 95.00 0.003 31666.7 0.043 2.00 0 15.000 \/ -2
4.000 140.00 0.020 7000.0 0.074 2.00 0 15.000 4.001 13.00 0.010 1300.0 0.000 0.00 0 15.000 4.002 18.00 0.010 1800.0 0.016 0.00 0 15.000
1.004 13.00 0.100 130.0 0.000 0.00 0 6.000 o 525
Network Results Table
PN Rain T.C. US/IL E.Area E.DWF (mm/hr) (mins) Cm1
1.000 1.001 E 9.6 99.324 0.342 0:o
9.8 99.304 0.342 i i : 0.27 147 1.12 607 i 1.002 10.2 99.284 0.368 0 0 0 0.74 400 0
2.000 0.0 20.1 99.324 0.194 0 0 0 0.13 71 0
l.Od3 0.0 20.2 99.114 0.562 0 0 0 1.33 1199 0
3.000 0.0 20.5 99.624 0.043 0 '0 0 0.09 15 0
4.000 4.001 E
13.6 99.624 0.074
0:o 14.0 99.604 0.074 ; a0 ii
0.20 0.47 1:; 00
4.002 14.8 99.594 0.090 0 0 0 0.40 107 0
1.004 0.0 20.6 99.094 0.695 0 0 0 1.41 306 0
For
insp
ectio
n pur
pose
s only
.
Conse
nt of
copy
right
owne
r req
uired
for a
ny ot
her u
se.
EPA Export 25-07-2013:16:15:43

Amec Capital Projects Ltd ---.,- .-.. Page 2 11 The Boulevard Shell E s P Ireland Ltd
_ Crawley Corri b Project West Sussex RH10 I UX West Outfall Ditch. Date 14-November-2003 Designed By IM File West Outfall DitchesS... 1 Checked By Micro Drainage Storm W .7.6 (c)l 982-2001 Micro Drainage
The following hvdraulic sections have been used in this network
NOTE: 'Diameters less than 66 refer to section numbers of hydraulic conduits. These conduits .are marked by the symbols:- [] box
culvert, \/ open channel, oo dual pipe, ooo triple pipe, o egg.
section numbers < 0 are taken from the file Ditch.sec
-2 \/ 300 300 45 0.627 0.180
-10; \/ 300 600 300 45 0.720 1.082 0.540 0.270 -103 450 1.029 0.540 -104 600 1.333 0.900
For
insp
ectio
n pur
pose
s only
.
Conse
nt of
copy
right
owne
r req
uired
for a
ny ot
her u
se.
EPA Export 25-07-2013:16:15:43

’ Crawley 7 West Sussex RHI 0 I UX w I
Corrib Project West Outfall Ditch.
Date 14-November-2003 Designed By IM File West Outfall DitchesSIM Checked Bv
/cpJg$J > x.,:d I. - B-h,;-$ n.,ui.L->d ..,_ ~.,sLi;; ~~~~ + Micro Drainage Simulation W.7.6 (c)l 982-2001 Micro Drainage
Summarv of Results
Return Period (years) ltl; Anal ySiS Time Step (seconds) 5 Storm Duration (mi ns) DVD StatUS OFF Margin for Flood Risk warning (mm) 300 Inertia StatUS OFF
PN Water Lev. surchar ed Fl ooded Fl ow/ (ml Depth m) vol (m3) Capacity ?
Overflow Pipe Flow Status Cl /Sl (l/S)
1.000 0.000 0.000 0.55 188 OK 1.001 -0.193
E% 0.40 119 OK
1.002 -0.176 0 116 2.000 0.000 0: 000 106 :I: 1.003
-:-;&i 0.000 pm: 179 OK
3.000 0:ooo :;t
OK 4.000 OK 4.001
99.696 -0.195 19
4.002 -0.198 0: 000 OK 0.000 0.18 OK
1.004 99.510 -0.109 0.000 0.96 i 2%
0 K
(I) . .
For
insp
ectio
n pur
pose
s only
.
Conse
nt of
copy
right
owne
r req
uired
for a
ny ot
her u
se.
EPA Export 25-07-2013:16:15:43

Amec Capital Projects Ltd 11 The Boulevard Shell E & P Ireland Ltd
cnrrib Pmiect
Page 2
I Date 14-November-2003 I Designed By IM
Global Variables
:E?:F’F: Period (yrs) ~5-60 (mm)
FSR
Ratio R VOl umetri c RUnOff COef
Area1 ‘Reduction Factor Storm Duration (mi ns) Hot Start (mins) Manhole Head1 oss Coeffi ci ent - MADD Factor * lOm3/ha storage Foul Sewa e/Hectare (l/s) Additiona 7 Flow - % of Total Flow Number of Input Hydrographs Number of Time/Area Diagrams Number of Bifurcations Number of Overflows Number of Off-Line Controls Number of Tank sewers
Scotland & Irel;;:
2: %a” . 0.770
Summer 100
1.000 15
1.00: 1.000
0.00
: 0
Freely Discharqirk Ouffalls
outf al 1 outfall C.Level I.Level D,L Pipe Number MH/No Cm) Cm> (mm> (mBm>
1.004 11 99.925 981994 1200 0
For
insp
ectio
n pur
pose
s only
.
Conse
nt of
copy
right
owne
r req
uired
for a
ny ot
her u
se.
EPA Export 25-07-2013:16:15:43

I
c1 Crawley Corrib Project West Sussex RHI 0 1 UX West Outfall Ditch. Date 14-November-2003 Designed By IM File West Outfall DitchesSlM Checked Bv
Network Details
1.000 125.00 0.020 6250 0.342 2.00
t : % 17.00 10.00 0.020 0.020 850 500 0.000 0.026 0.00 0.00
2.000 143.00 0.005 28600 0.194 2.00
1.003 10.00 0.020 500 0.000 0.00
3.000 95.00 0.003 31667 0.043 2.00
j.cg
4:002
i40.00 13.00 0.010 0.020 7000/ 1300 0.074 0.000 0.00 2.00
18.00 0.010 1800 0.016 0.00
1;004 13.00 0.100 130 0.000 0.00 1 6.000 o 525
USMH PN No DS/CL
. “7’;” us’Dep m Cm> Cm)
1.000 1.001 1.002 ;
99.925 99.324 100.000 99.304
99.925 99.284
2.000 4 99.92s 99.324 0.001 100.000
1.003 5 100.000 99.114 0.286 99.925
3.000 6 99.925 99.624 0.001 99.925
4.000 &7 99.925 99.624 0.001 99.925 4.001 99.925 99.604 0.021 99.925. 4.002 9 99.925 99.594 0.031 99.925
1.004 10 99.925 99.094 0.306 99.925
Rain k Wd Dia PI-0 (mm) Sect (mm>
1 15.000 1-I -103 :: 1~::~: I-I -103
I-I -103
1 15.000 \/ -4
1 6.000 I-I -104
1 15.000 \/ -2
DS/IL DS/Dep Ctr1 US/MH Cm) (m) No. (mm1
2 %t
99:264
0.246 0.191 1200 1200
0.286 44 1200
99.319 0.081 1200
99.094 0.231 4 1200
99.621 0.004 1200
98.994 0.406 4 1200
For
insp
ectio
n pur
pose
s only
.
Conse
nt of
copy
right
owne
r req
uired
for a
ny ot
her u
se.
EPA Export 25-07-2013:16:15:43

For
insp
ectio
n pur
pose
s only
.
Conse
nt of
copy
right
owne
r req
uired
for a
ny ot
her u
se.
EPA Export 25-07-2013:16:15:43

Client: Shell E & P Ireland Ltd. Job Ref. Plant: Gas Reception Terminal L3882
l ame Location: Corrib Sheet no./rev.
On-Plot Storm Drainage Calc. by Date Chck’d by Date Aw’d by Date
IM Nov ‘03
a
a
SECTION A5 OILY WATER DRAIN SYSTEM
95.1 INTRODUCTION
The oily water drain system is a piped self-contained system, routed to the open drains sump for treatment and discharging offshore via an out-fall. This system captures any water run-off that might be contaminated with oil or Ither chemicals.
The oily water system was divided into four systems for the purpose of design, as follows:-
1) Slug catcher area; including the storage tank bunds (Methanol storage tank, Raw methanol storage tank and condensate storage tank). This system includes the main header draining into the open drains sump. Flows from the adjacent oily water systems are added to this system to check the capacity of the header.
2) Process area; this system includes the rainwater run-off from the compressor building roof and the process area paving.
3) Flare area; this system includes the condensate run-off from the flare as part of the closed drain system.
4) Waste storage area; this system includes the run-off from the bunded waste storage area, local paved areas and the pumped return from the access road drain system. The discharge from the oily surface water interceptor is a controlled discharge into the terminal oily drain system via a pump, and is not taken as coincident with peak fire water or rainwater run-off.
The system was checked for two design cases, the firewater discharge scenario and rainwater runoff.
A5.2 RAINWATER SCENARIO
The drainage system was designed using the Micro Drainage WinDes storm software for a 1 in 10 year return period
storm. The storm intensity is derived from the reference design condition of design 45mm rainfall in one hour (100 year return period), as noted in section Al. It is considered that this will provide a robust system for the 1 in 100 year storm when storage and surcharging effects are considered.
A5.3 FIREWATER SCENARIO
The four oily water systems were checked for the maximum fire water discharge for each of the areas, based on the fire hydrant and fire monitor maximum flows. The bunded areas for the storage tanks are designed to over flow into the oily water drainage system during firewater deluge. The drainage system between the storage tanks and the open drain sump was checked for the maximum tank firewater deluge. Individual overflow branches were checked for the applicable tank firewater deluge.
For
insp
ectio
n pur
pose
s only
.
Conse
nt of
copy
right
owne
r req
uired
for a
ny ot
her u
se.
EPA Export 25-07-2013:16:15:43

Client: Shell E & P Ireland Ltd. Job Ref. -
I Plant: Gas Reception Terminal L3882
Location: Corrib Sheet no./rev. m ame On-Plot Storm Drainage w ------
Calc. by Date Chck’d by Date Aw’d by Date
IM Nov ‘03
i5.4 OILY WATER SYSTEM DESIGN SUMMARY
-he governing design case for each system is as follows:
SYSTEM DESCRIPTION RAIN WATER
W) SLUG CATCHER AND 73
STORAGE TANKS
I/IAIN HEADER TO OPEN 362
IRAiNS SUMP
‘ROCESS AREA 261
NASTE STORAGE AREA 130
-LARE AREA 17
FIREWATER DESIGN CASE
04 320 FIRE WATER
320 RAIN WATER
160 RAIN WATER
218 FIRE WATER
50 FIRE WATER
For
insp
ectio
n pur
pose
s only
.
Conse
nt of
copy
right
owne
r req
uired
for a
ny ot
her u
se.
EPA Export 25-07-2013:16:15:43
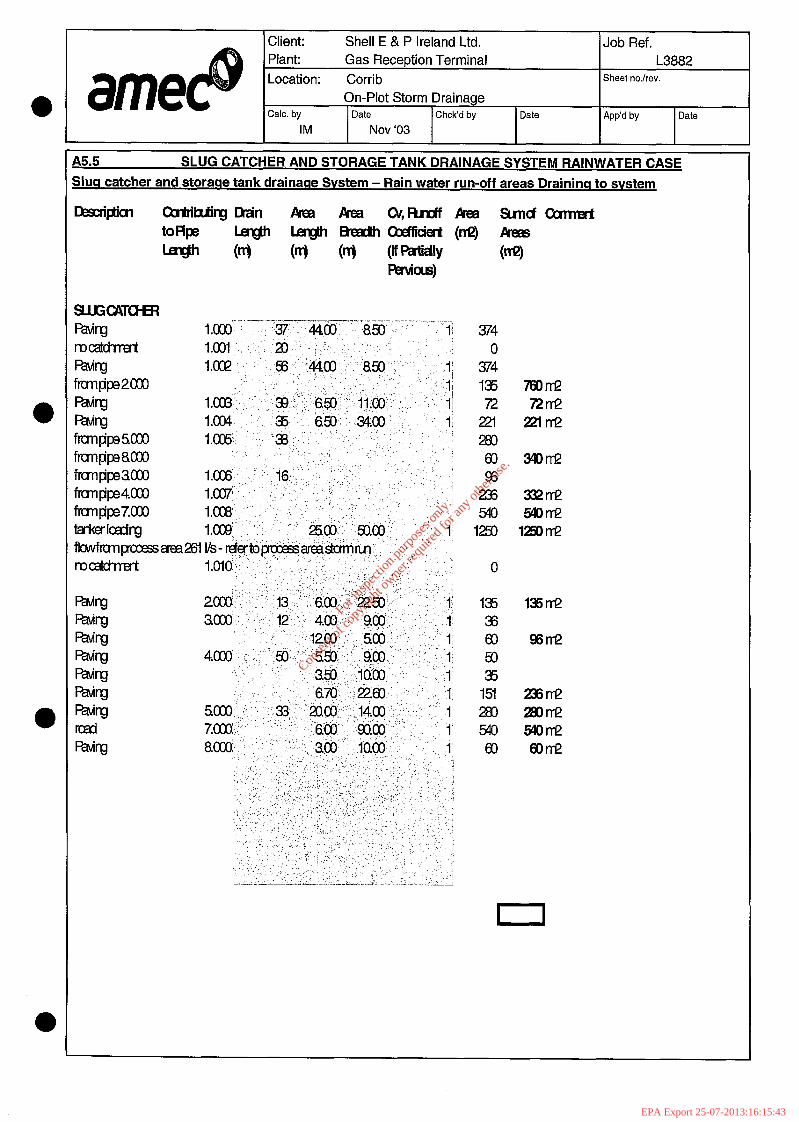
I Client: Shell E & P Ireland Ltd. - 1 Job Ref. Plant: Gas Reception Terminal L3882
I
r5.5 SLUG CATCHER AND STORAGE TANK DRAINAGE SYSTEM RAINWATER CASE
iluq catcher and storaqe tank drainaqe Svstem - Rain water run-off areas Draininq to svstem
For
insp
ectio
n pur
pose
s only
.
Conse
nt of
copy
right
owne
r req
uired
for a
ny ot
her u
se.
EPA Export 25-07-2013:16:15:43

1 Client: Shell E & P Ireland Ltd.
A5.6 PROCESS AREA DRAINAGE SYSTEM RAINWATER CASE
Process area drainaqe Svstem - Rain water run-off areas draininq to svstem
1.005: “-& ,,, .1.: .::;,i
’ ._ II I : ,. Ii
1: ;.. .,
383 371 550 760 763 275 132 275 54% 37, 37, zxl 351
280 2-l 233
1467 533
432 328 233 432 323 293 52l 371 zcl 33 280 288 388 112 21
333
1309tY2 76on-Q
I?2 1Qsrr-2
lZ7lYQ
942n-P
3l24rT-e
76Qn-P 288n-e
76on-e 38on-e
1467fl-Q
568t-r-e
mn-e
I I
For
insp
ectio
n pur
pose
s only
.
Conse
nt of
copy
right
owne
r req
uired
for a
ny ot
her u
se.
EPA Export 25-07-2013:16:15:43

Client: Shell E & P Ireland Ltd. Job Ref. - Plant: Gas Reception Terminal L3882 Location: Corrib Sheet nolrev.
l ame On-Plot Storm Drainage Calc. by Date Chck’d by Date Aw’d by Date
IM Nov ‘03
h5.7 WASTE STORAGE AREA DRAINAGE SYSTEM RAINWATER CASE Yaste storaae area drainaqe Svstem - Rain water run-off Areas Draininq to svstem
910 225 293 540 53-l 150 240
4c6 240 117 403
8-i 500 150
lW4 rrQ
97ln-e
645n-Q 117 rre #f-f-Q
58ln-2 15on-Q
For
insp
ectio
n pur
pose
s only
.
Conse
nt of
copy
right
owne
r req
uired
for a
ny ot
her u
se.
EPA Export 25-07-2013:16:15:43

I Client: Shell E & P Ireland Ltd. 1 Job Ref. Plant: Gas Reception Terminal L3882
l ame Location: Corrib Sheet no./rev.
On-Plot Storm Drainage Calc. by Date Chck’d by Data Aw’d by Date
IM Nov ‘03
~5.8 FLARE AREA DRAINAGE SYSTEM RAINWATER CASE ‘lare area drainaqe Svstem - Rain water areas Drainina to svstem
kscti@ion Cbntrikuting bin Area Area cv,RlmdfArea s4mlofcomnent to Ape Lenglh Length Breadth Coefficient (I@) Areas mm m m (n-0 (If Partidly WI
FtZlViOUS)
For
insp
ectio
n pur
pose
s only
.
Conse
nt of
copy
right
owne
r req
uired
for a
ny ot
her u
se.
EPA Export 25-07-2013:16:15:43

a
a
a
a
I Client: Shell E & P Ireland Ltd. 1 Job Ref. Plant: Gas Reception Terminal L3882 Location:
Calc. by
IM
Corrib On-Plot Storm Drainage
Date Chck’d by
Nov ‘03 Date
i5.9 SLUG CATCHER AND STORAGE TANK DRAINAGE SYSTEM FIREWATER CASE ilua catcher and storaae tank drainaae System - Firewater deluse scenario
-he firewater discharge will be 4 monitors and 4 hydrants discharging at once to the head of the oily water system. Monitors =32 I/s * 4 = 127 I/s iydrants=7.5 l/s * 4= 30 I/s Jlax fire water flow = 157 l/s. -ire water will enter system through 4 number gullies at 40 I/s per gully -he three storage tank bunded areas will have a bund overflow pipe, allowing the excess firewater deluge to drain nto the oily water system, this overflow will not incorporate a valve. Drainage sytem designed for the following jeluge rates. ?aw methanol tank bund - 319 l/s (note this is applied as 160 ifs, in combination with the 1601/s applied at the lead of the sytem) ‘roduct methanol tank bund 120 I/s Condensate tank bund 228 l/s \lote that each component of the system is designed for the maximum firewater flow for that component. These are lot combined as this would result in the firewater flow in the whole system exceeding 320 l/s (Raw methanol
For
insp
ectio
n pur
pose
s only
.
Conse
nt of
copy
right
owne
r req
uired
for a
ny ot
her u
se.
EPA Export 25-07-2013:16:15:43

Client: Shell E & P Ireland Ltd. Job Ref. Plant: Gas Reception Terminal L3882
ame Location: Corrib Sheet no./rev.
On-Plot Storm Drainage Calc. by Date Chck’d by Date Aw’d by Date
IM Nov ‘03
i5.10 PROCESS AREA DRAINAGE SYSTEM FIRE WATER CASE Vocess area drainaue Svstem - Firewater deluae scenario
The firewater discharge will be 4 monitors and 4 hydrants discharging at once to the head of the oily water system. lnonitors =32 l/s * 4 = 127 l/s iydrants=7.5’V.s * 4= 30 I/s inax fire water flow = 157 Vs. -ire water will enter system through 4 number gullies at 40 l/s per gully
\lote that each component of the system is designed for the maximum firewater flow for that component. These are lot combined as this would result in the firewater flow in the whole system exceeding 157 I/s
2gAliei 3gAlies XUY 2gAies 2glliei mfw rofw
For
insp
ectio
n pur
pose
s only
.
Conse
nt of
copy
right
owne
r req
uired
for a
ny ot
her u
se.
EPA Export 25-07-2013:16:15:43

I Client: Shell E & P Ireland Ltd. 1 Job Ref. I Plant: Gas Reception Terminal L3882
. ame Location: Corrib Sheet nolrev.
On-Plot Storm Drainage Calc. by Date Chck’d by Date Aw’d by Date
IM Nov ‘03
e
e
45.11 WASTE STORAGE AREA DRAINAGE SYSTEM FIRE WATER CASE Naste storage area drainaqe Svstem - Firewater Draininq to svstem
The firewater discharge will be 2 hydrants discharging at once to the head of the oily water system. iydrants=7.5 l/s * 2= 15 l/s
‘irewater will enter system from 2 hydrants adjacent to power generator building. Note this has been modelled as )ne 40 I/s.
\lote that each component of the system is designed for the maximum firewater flow for that component. These are lot combined as this would result in the firewater flow in the whole system exceeding 30 I/s
Description Contributing tkain nwrberaf rnni3fxofdeluge tutd Cumxnt to Ape kngth hycbnts monitors sy&rn(Us)
N-0 (32 Us) (7.5 Us)
40.00 7.50 WKlEsTQ9F#;EAREA _-__ ,._-- ~ ___) -_.. -. - -- ̂ --.-.-
1 .ooo,~~ 33.0 :. ‘O.cg ‘y-J -0 0 I.001 go, : : ‘q.00’ ‘. 0.00 .’ 0 0 i.aY2 .. ‘- _ G&o;‘ .()W’ _’ ,o.o(j’ 0 0
Me pipe lergths 1 .ooO, 1 .COl ard 1 .CO2 resetvd for pipe from externA oily surface tier interceptor oontrdled cisd-arge - no ircluded v&h fire Mater calc&tiion 2 l-Jd3lt.s
,.~,i:l-.~ il,. “.~~~.~~~-.~~~.2.03::- ,:..., ,. o ,5 . ,‘.,
frcnlpipe2000 :
I.004 .-:’ 37 -. ;:,:; .’ ,_ -- 40 fromp’pe2001
. 27 .. .,,’
.- ~,‘,‘,.. mng
,.oo5 .: ,., .; Ljf-:
:,:..bo$,;:..-::.: ;o’oo,; -. .. -_ 1, .
o
tmcatm I.006 . . ,: 0.00,: 0 0 tisrkrload~ I.0077 :- e&, y, 0.of-J :I,, :z- ‘.. 0 0
‘. -. ,. _i ,,I,.. .,” .,.i_, . ,. .-, .’ .,:,I .., ./,: ,’ ,‘i .,..
2*3x)“. .‘; ,,.. . . .~ .:
1 mtor 36. T.-j i;& ,,; ‘lo.@ -- 0 40 2304 ‘&j,; > : :,.. “,- 27
alsoallowfor27I/sfW-r@ftWl&zcess~sS;stem :.. ‘.. fromflare 3.aJO 13 ,’ 50 .- ._- :.-.._ ,i_..--..--_ .- . . _. .,.
For
insp
ectio
n pur
pose
s only
.
Conse
nt of
copy
right
owne
r req
uired
for a
ny ot
her u
se.
EPA Export 25-07-2013:16:15:44

I 1 Client: Shell E & P Ireland Ltd. 1 Job Ref. Plant: Gas Reception Terminal L3882
45.12 FLARE AREA DRAINAGE SYSTEM
Lbsaiption contributing Drain nlmilerdnlmilerofdellge total cfmlmt toPipe Length h@mts moritots system(l/s)
w cm) w w (7.5 l/s)
40.00 7.50 FlAREAREA i-_--II_ ,-.-,_ ..- .-.-...-.--^ -.-..-.. -._-^- --_ -. -- ,
1.oa-J .. -,. ~35 .’ Alcnfvfor5lkflarecon&n&ionffbmflare ‘-- -(’ notim 1.00~ 80
2ooo- pJ.. ‘. :.- .. -, .. Alcwfor5l/sftcmLEFimnj3er1 ttitisurpb(tirblled~*) 1 Gully 2c!Oi ‘. j5 .! “, 0.00: 0.00 40 mcatm lo@ 68
.,
For
insp
ectio
n pur
pose
s only
.
Conse
nt of
copy
right
owne
r req
uired
for a
ny ot
her u
se.
EPA Export 25-07-2013:16:15:44

STORM SEWER DESIGN bv the Modified Rational Method
Global Variables
I Location - Scotland & Ireland
Return period (years) ' 2':
Volumetric Runoff Coeff. 0.77 MS-60 (mm) Infiltration % Ratio R Maxi mum Rai nf al 1 (mm/h r) “5::
Minimum Backdrop Height (m) 0.01:
Foul Sewage (1 /s/ha) Depth from soffit to.6i.L. (m> OoSC$
O’flow Setting (*Foul only) 0.0; Min vel. (m/s - AUtO Deslqn 01~1~1
Mln Slope (1:X - OptlmiSatlOn) is0
Designed with Level Soffi ts
.
Network Desiqn Table
PN HYD DIA SECT (mm)
1.000 EC 1:003 1.004 1.005
E? ;: ;I;
Lo10
2.000
3.000
4.000
37.00 0.074 20.00 .0.040 55.50 0.080 39.00 0.053 34.50 0.043 37.50 0.048 16.00 0.020 50.00 0.063 30.00 0.038. 5;s); pm;
. .
12.50 0.083
12.00 0.040
50.00 0.550
500.0 0.037 500.0 0.000 693.8 0.076 735.8 0.007 802.3 0.022 781.3 0.034 800.0 0.010 793.7 0.033 789.5 0.054 797.1 0.12s 307.7 0.000
150.6 0.014
300.0 0.010
90.9 0.024
2.00 0.00 0" 0.00 0 0.00 0.00 : o”% 0:oo 00
0 0.00 0.00 0.00
26;
2.00 0
2.00 0
2.00 0
Ez 0:600 0.600 0.600
0.600
0.600
0.600
0 0 z;: 0 525 0 525 0 675 0 675 0 0 E 0 675 0 750 0 675
0 1so
0 150
0 300
Network Results Table
PN Rain T.C. US/IL E.Area E.DWF Foul Infi 1. vel (mm/hr) (mins) Cm> (ha1 Cl/s> Cl/s> Cl/s> Cm/s> 6% 6’1%
1.000 143.8 2.8 99.160 1.001 137.7 3.2 98.910 iE5 0 0.80
1.002 124.1 4.3 98.815 0:113 a0
i i 0.80 E ::
182 1.003 116.1 5.1 98.660 5.7 98.460
ti : ; is:; 0:92
177 zz 328 44
6.4 98.331 6.7 98.197 :
: : 333
7.6 98.091 :
00 : E
0:92
329 :i
330 8.1 97.942 E ii
0.92 331 :: 1.009 9.0 97.818 261 0.98 434 359 1.010 9.1 97.674 261 0 0 1.49 533 359
2.000 152.3 2.3 99.125 0.014 0 0 0 0.82 14 6
3.000 150.6 2.3 98.875 0.010 0 0 0 0.58 10 4
4.000 148.0 2.5 99.200 0.024 0 0 0 1.65 117 10
For
insp
ectio
n pur
pose
s only
.
Conse
nt of
copy
right
owne
r req
uired
for a
ny ot
her u
se.
EPA Export 25-07-2013:16:15:44

Amec Capital Projects Ltd 11 The Boulevard T SHELL E&P LTD Crawley CORRIB PROJECT West Sussex RHlO 1 UX SLUG CATCHER-STORM Date Dee-03 Designed By DR File SiugCatcherStorm2.SWS Checked By Micro Drainage Storm W.7.6 (c)1982-2001
PN
5.000
6.000
7.000
8.000 8.001
Network Desiqn Table
Page 2
Micro Drainage
PN
5.000 33.00 0.200 165.0 0.024 2.00 0 0.600 0 250
6.000 20.00 0.036 555.6 0.028 2.00 0 0.600 o 450
7.000 25.00 0.033 757.6 0.054 2.00 0 0.600 o 600
8.000 29.00 0.193 150.3 0.010 2.00 O 200 8.001 15.00 0.100 150.0 0.000 0.00
i KE 0 200
Network Results Table
Rai n US/IL Cmm/hr> &k> Cm)
E-Area E.DWF Foul InfiJ. vel (ha> Cl/s) (l/s) (J/s) Cm/s1 C?~> &?$
148.0 2.5 98.700 0.024 0 0 0 1.09 53 10
149.9 2.4 98;500 0.028 0 0 0 0.86 3.36 12
148.5 2.5 98.500 0.054 0 0 0 0.88 248 22
148.2 2.5 99.260 0.010 144.2 2.7 98.990 0.010 i 00 00
0.99 0.99 ;11 44
For
insp
ectio
n pur
pose
s only
.
Conse
nt of
copy
right
owne
r req
uired
for a
ny ot
her u
se.
EPA Export 25-07-2013:16:15:44

STORM SEWER DESIGN bv the Modified Rational Method
Global Variables
Location - Scotland & Ireland
Return Period (years) Vol UIIIetri c Runoff COeff. 0.77 M5-60 (mm) ti Infiltration % Ratio R 0.40 Maximum Rainfall (mm/hr)
Minimum Backdrop Height (m) 0.01: 200
Foul Sewage (l/s/ha) Depth from Soffit to G.L. (m) OO5;:
0.00 Min vel. O'flow Setting (*Foul only) 0
(m/s - AUtO Design Only) Min Slope (1:X - OptiIIIlSatiOn) is0
Designed with Level Soffits
Network Desiqn Table
PN Le(nmqth Fpm:1 g;g>” $57 (;i-w) (yy) (,k,) HYD D*A SECT (mm)
1.000 30.00 0.100 300.0 0.131 2.00 O 375 1.001 19.00. 0.026 730.8 0.076 0.00
00 i%z
0:600 0 525
1.002 17.00 0.023 739.1 0.104 0.00 0 o 525 1.003 50.00 0.069 724.6 0.133 0.00 0 0.600 o 525 1.004 41.00 0.057 719.3 0.095 0.00 0 0.600 0 525 1.005 59.00 0.081 728.4 0.312 0.00 0 0.600 o 675
2.000 49.00 0.098 500.0 0.076 2.00 0 0.600 o 450
3.000 35.00 0.078 448.7 0.029 2.00 0 0.600 o 225
4.000 53.00 0.106 500.0 0.076 2.00 0 0.600 o 450
5.000 12.00 0.046 260.9 0.028 2.00 0 0.600 0 200
6.000 33.00 0.066 500.0 a.147 2.00 6.001 32.00 0.043 744.2 0.057 0.00
Network Results Table
PN Rain T.C. US/IL E.Area E.DWF Foul Infil. vel Cmm/hr> (m-ins) Cd (ha) (l/s) (l/s) (l/s) (m/s) (5;) $7;
1.000 x 2.5 98.775 0.131 00 00 00 1.04 115 KS 1:003
137:3 2.9 3.2 98.499 98.525 0.207 Z?
124.7 ;.: y; :-it41 0.82 0.82 178 177 119
1.004 0: 539 i : i 0.82 178 154
0.83 174 1.005 :iF . z 6:l 98:200 0.851 00 : t 0.96 ;E 254
2.000 141.7 2.9 98.948 0.076 0 0 0 0.90 144 30
3.000 141.0 3.0 98.912 0.029 0 0 0 0.61 24 11
4.000 140.6 3.0 98.991 0.076 0 0 0 0.90 144 30
5.000 152.1 2.3 99.105 0.028 0 0 0 0.75 23 12
6.000 6.001 2::: 2.7 98.900 3.3 98.684 E;: 0 . 0 i : 0.80 0.81 1;: ;;
For
insp
ectio
n pur
pose
s only
.
Conse
nt of
copy
right
owne
r req
uired
for a
ny ot
her u
se.
EPA Export 25-07-2013:16:15:44

Network Desiqn Table
PN
7.000 26.00 0.217 -119.8 0.039 2.00 0 0.600 o 300
8.000 46.00 0.053 867.9 0.052 2.00 0 0.600 0 300
Network Results Table
PN Rai n T.C. US/IL E.Area E.DWF (mm/hr) (mins) 00 (ha>
7.000 151.5 2.3 99.525 0.039 0 0 0 1.44 101
8.000 134.0 3.5 99.442 0.052 0 0 0 0.53 37
16
19
:
For
insp
ectio
n pur
pose
s only
.
Conse
nt of
copy
right
owne
r req
uired
for a
ny ot
her u
se.
EPA Export 25-07-2013:16:15:44

STORM SEWER DESIGN bv the Modified Rational Method
Global Variables
Location - Scotland & Ireland
Return Period (years) t:
volumetric RUnOff coeff. 0.77 MS-60 (mm) Infiltration % Ratio R 0.40 Maximum Rainfall (mm/hr) 200
Minimum Backdrop Height (m) 0.01:
Foul Sewage (l/s/ha) De th from Soffit to G.L. (m) O;15CIN$
0.00 Min ve . 7 O'flow Setting (*Foul only) 0
(m/S - AUtO Design Only) Min Slope (1:X - optimlsation) 550
Designed with Level Soffits
Network Desiqn Table
PN
1.000 35.00 0.200 175.0 0.000 2.00 5 0.600 o 150 1.001 80.00 0.457 175.1 0.000 0.00 0 0.600 0 150
2.000 27.00 0.154 175.3 0.000 2.00 5 0.600 0 150 2.001 15.00- 0.146 102.7 0.024 0.00 0 0.600 o 300
1.002 68.00 0.168 404.8 0.000 0.00 0 0.600 0 300
Network Results Table
PN Rain 'T.C. E.Area E.DWF (mm/hr) (mins)
US/IL Cm> (ha)
1.000 143.7 2.8 99.200 0.76 1.001 121.4 4.5 99.000 iE:i . z 00 i 0.76 ti :
2.000 146.5 2.6 99.150 0.000 0 0.76 2.001 144.0 2.8 98.846 0.024 z : 0 1.55 1:; 1;
1.002 108.1 6.0 0.000 0.024 10 0 0 0.78 55 17
For
insp
ectio
n pur
pose
s only
.
Conse
nt of
copy
right
owne
r req
uired
for a
ny ot
her u
se.
EPA Export 25-07-2013:16:15:44

STORM SEWER DESIGN bv the Modified Rational Method
Global Variables
Location - Scotland 81 Ireland
Return Period (years) Volumetric Runoff COeff. 0.77 M5-60 (mm) 2120 Infiltration 96 Ratio R 0.40 Maximum Rainfall (mm/hr> 200
Minimum Backdrop Height Cm> 0.01:
Foul Sewage (l/s/ha) Depth from Soffit to G.L. (m) ObSCl~
0.00 Min Vel. O'flOW Setting (*Foul Only) 0
(m/S - AUtO Design Only) Min slope (1:X - Optimisation) is0
Designed with Level soffits
PN
1.000 1.001 1.002 1.003 1.004 1.005 1.006 1.007
2.000
3.000
Network Desiqn Table
PN Lei%5th Fal ' (m) 7:?5 4/Z? (2:;) (?yE) (,k,)
HYD DIA SECT (mm)
1.000 33.00 0.078 423.1 0.000 2.00 0 0.600 o 150
1.001 54.00' 0.127 425.2' 0.000 0.00 0 0.600 o 1.002 58.00 0.136 426.5 0.000 0.00 0 0.600 o 5;: 1.003 46.00 0.108 425.9 0.197 0.00 .O 0.600 o 300 1.004 37.00 0.051 725.5 0.097 0.00 27 0.600 o 525 1.005 48.00 0.060 800.0 0.065 0.00 0 0.600 o 525
i: EE 32.00 35.00 0.040 0.101 800.0 346.5 0.000 0.018 kxi . 17 0 0.600 0.600 o o 525 525
2.000 36.00 0.103 349.5 0.058 2.00 0 0.600 o 225
3.000 13.00 0.168 77.4 0.015 2.00 50 0.600 o 300
Network Results Table
Rain T.C. (mm/h r>
US/IL (mins) Cm)
138.3 116.7 100.7
94.3 90.1 85.1
Ei::
142.3
154.9
98.975 ‘98.897
Ez: 98:151
E%E 98:000
98.875
98.368
E-Area E.DWF Foul (ha) Cl/s) Cl/s)
0.058 0 0
0.015 50 0
Infil. (l/s)
vel cw Flow (m/s) Cl/s) (l/s)
0.48 0.48 z i 0.48 8 0 0.76
.0.82 1:: 0.78
;;; 112
0.78 170 112 1.20 259 128
0.69 28 23
1.79 126 56
For
insp
ectio
n pur
pose
s only
.
Conse
nt of
copy
right
owne
r req
uired
for a
ny ot
her u
se.
EPA Export 25-07-2013:16:15:44

Amec Capital Projects Ltd II The Boulevard
I Crawley West Sussex RH j 0 1 UX
Page 1 SHELL E&P LT6 CORRIB PROJE SLUG CATCHER-FIREWAT...t ~
i i 4
. . . Y
STORM SEWER DESIGN bv the Modified Rational Method
Global Variables
Location - Scotland & Ireland
Return Period (years) 100 Volumetric RUnOff COeff . 0.77 M5-60 (mm) Infiltration % Ratio R 0.:: Maxi mum Rai nfal 1 (mm/hr>
Minimum Backdrop Height (ml 0.01: 200
Foul Sewage (l/s/ha) 0 .O; Depth from soffit t0.G.L. (m) Oo5CK&
O’flow Setting (*Foul only) Mi n ye1 . (m/s - AUtO Des1 gn Only)
Mln Slope (1:X - Optimisation) is0
Designed with Level Soffits
Network Desisn*Table
PN Le&5th Fal ’ (m) ~:Z$ ?hr$ (Z;,‘;, (‘i”;:) (&)
HYD DIA SECT (mm)
4%!
1:002
20.00 37.00 0.040 0.074 500.0 500.0 0.000 0.000 0.00 2.00 80 0 0.600 0.600 0 0 375
55.50 0.080 693.8 0.000 0.00 O z 1.003 39.00 0.053 735.8 0.000 0.00 ai Ei 0 525 1.004 34.50 0.043 802.3 0.000 0.00 160 0:600 0 675 1.005 37.50 0.048 781.3 0.000 0.00 0 0.600 0 675
16.00 0.020 800.0 0.000 Ei 0 0.600 o 675
50.00 0.063 793.7 0.000 0 0.600 0 30.00 0.038 789.5 0.000 0:oo 0 0.600 0 F% 55.00 0.069 797.1 0.000 0.00 0 0.600 0 675 4.00 0.013 307.7 0.000 0.00 0 0.600 0 675
2.000 12.50 0.083 150.6 0.000 2.00 2 0.600 a 150
3.000 12.00 0.040 300.0 0.000 2.00 40 0.600 0 300
4.000 50.00 0.550 90.9 0.000 2.00 35 0.690 o 300
Network Results Table
PN Rai n T.C. US/IL E.Area E.DWF Foul Cmm/hr> Cmins) Cm) (ha1 Cl/s> Cl/s)
1.000 200.0 1.001
g.; pm& 200.0' . . KE . 8 00
1.002 200.0 4.3 98.815 0.000 160 1.003 189.6 5.1 98.660 0.000 160 El 1.004 181.3 5.7 98.460 0.000 320 0 1.005 173.4 320 1.006 170.2 i.;
1.007 160.7 7:6
!333;
98:091
E%
0:ooo
320 i
320 1.008 EE
8.1 97.942 0.000 320 :
1.009 145:9 9.1 97.818 0.000 320 1.010 9.1 97.674 0.000 320 z
?I 0.80 80 0.80 i; 80
i 0.84 0.82 182 160 160
: 0.92 z8' 333 320 320 a0 0:92 E 329 320 320
ii 0.92 0.92 z:: 329 320
0 1.49 533 z::
2.000 200.0 2.3 99.125 0.000 2 0 0 0.82 14 2
3.000 200.0 2.2 98.875 0.000 40 0 0 0.90 64 40
4.000 200.0 2.5 99.200 0.000 35 0 0 1.65 117 35
For
insp
ectio
n pur
pose
s only
.
Conse
nt of
copy
right
owne
r req
uired
for a
ny ot
her u
se.
EPA Export 25-07-2013:16:15:44

nir1f3.i bdp~ar rrojecrs LIa 1 I The Boulevard Crawley West Sussex RHI 0 I UX Date Dee-03 File SlugCatcher.SWS
rageL SHELL E&P LTD CORRIB PROJECT SLUG CATCHER-FIREWAT... Designed By DR Checked By
Micro Drainage Storm W.7.6 (c)l 982-2001 Micro Drainage
Network Design Table
PN Fall Slope Area (m) (1:X) (ha) &k] (YE] (,k,>
HYD DIA SECT (mm) *
5.000 33.00 0.200 165.0 0.000 2.00 80 0.600 0 300
6.000 20.00 0.036 555.6 0.000 2.00 120 0.600 0 450
7.000 25.00 0.033 757.6 0.000 2.00 228' 0.600 0 600
8.000 29.00 0.193 150.3 0.000 2.00 15 0.600 0 200 8.001 15.00 0.100 150.0 0.000 0.00 0 0.600 0 200
Network Results Table
PN
5.000
6.000
7.000
8.000 8.001
Rai n T.C. US/IL E.Area E.DWF (mm/hr) (mins) 00 (ha)
* 200.0 2.5 98.700 0.000 80 0 0 1.22 86 80
200.0 2.4 98.500 0.000 120 0 0 0.86 136 120
200.0 2.5 98.500 0.000 228 0 0 0.88 248 228
200.0 200.0 ;.; . ;p; 0.000 0.99 . 0.000 E E i 0.99 2:: 2
: -1 -.
For
insp
ectio
n pur
pose
s only
.
Conse
nt of
copy
right
owne
r req
uired
for a
ny ot
her u
se.
EPA Export 25-07-2013:16:15:44

Micro Drainage Storm W.7.6 (c)1982-2001 Micro Drainage
STORM SEWER DESIGN bv the Modified Rational Method ~
Global Variables
Location - Scotland & Ireland
Return Period (years) l!i
Volumetric Runoff COeff. 0.77 MS-60 (mm) Infiltration 36 Ratio R 0.40 Minimum Backdrop Height (m) 0.01: Maximum Rainfall (mm/hr) 200 Depth from soffit t0.G.L. Cm> OoS~~ Foul Sewage (l/s/ha) 0.0; Min vel. (m/s - ALE0 Design O?ly) O'flow Setting (“Foul only) Mln Slope (1:X - OptlmlSatlOn) is0
Designed with Level Soffits
Network Desiqn Table
PN Le(nmqth F&\l slope Area (1:x) (ha) (ii,';] $:1sF) (mk,] &??r cDmImA>
1.000 30.00 0.100 300.0 0.000 2.00 80 0.600 o 375 1.001 19.00 0.026 730.8 0.000 0.00 80 0.600 o 525 1.002 17.00 0.023 739.1 0.000 0.00 0 0.600 o 525 1.003 5.0.00 0.069 724.6 0.000 0.00 0 0.600 o 525
2 % 41.00 0.057 719.3 0.000 0.00 0 0.600 o 525 59.00 0.081 728.4 0.000 0.00 0 0.600 o 525
2.000 49100 0.098 500.0 0.000 2.00 118 0.600 0 450
3.000 35.00 0.078 448.7 0.000 2.00 80 0.600 0 375
4.000 53.00 0.106 300.0 0.000 2.00 118 0.600 0 450
5.000 12.00 0.046 260.9 0.000 2.00 40 0.600 0 250
6.000 33.00 O-.066 500.0 0.000 2.00 80 0.600 0 375 6.001 32.00 0.043 744.2 0.000 0.00 80 0.600 0 525
Network Results Table
PN Rain T,C. US/IL E.Area E.DWF Foul (ha) Cl/s) Cl/s) Cl/s> (m/s) ($1 (::"5",
Infil. Vel (mm/hr) (ml ns) Cm)
E? 200.0 ;.; g.;;;
KE 1.04 115
200.0 200 00 00 0.82 178 1:: 1:002 3:2 98:511 0: 000 160 0.82
z;: 160
. 1.003 4.2 98.402 0.000 160 : : 0.82 160
;: 00:: ;.; ;;.'1;; 0.000
% 0.83 179
% , 0.000 00 00 0.82 178
2.000 200.0 2.9 98.948 0.000 118 0 0 0.90 144 118
3.000 200.0 2.7 98.912 0.000 80 0 0 0.85 94 80
4.000 200.0 3.0 98.991 0.000 118 0 0 0.90 144 118
5.000 200.0 2.2 99.105 0.000 40 0 0 0.86 42 40
6.000 200.0 2.7 98.900 Es
0.80 6.001 200.0 3.3 98.784 . 1:: E Fl 0.81 1% 1::
For
insp
ectio
n pur
pose
s only
.
Conse
nt of
copy
right
owne
r req
uired
for a
ny ot
her u
se.
EPA Export 25-07-2013:16:15:44

:
[ Amec Capital P rejects Ltd 11 The Boulevard Crawley West S&sex RHlO 1 UX Date Dee-03 File PROCESSFW.sws Micro Drainage Storm W.7.6 (c)l 982-2001 Micro Drainage
Network Design Table
PN Le&ith F($ g?i: $:)a (X, $z, (ii> HYD SECT &if)
7.000 26.00 0.217 119.8 0.000 2.00 0 0.600 o 150
8.000 46.00 0.383 120.1 0.000 2.00 0 0.600 o 100
Network Restilts Table
PN Rai n T.C. US/IL E.Area E.DWF Cmm/hr> (mins) Cm> (ha)
7.000 200.0 2.5 99.525 0.000 0 0 0 0.92 16 0
8.000 200.0 3.1 99.442 0.000 0 0 0 0.70 6 0
For
insp
ectio
n pur
pose
s only
.
Conse
nt of
copy
right
owne
r req
uired
for a
ny ot
her u
se.
EPA Export 25-07-2013:16:15:44

Micro Drainage Storm W.7.6 (c)l 982-2001 Micro Drainage
STORM SEWER DESIGN bv the Modified Rational Method
Global Variables
Location - Scotland & Ireland
Return Period .(years) 100 Volumetric RUnOff coeff. 0.77 MS-60 (mm) Infiltration 96 Ratio R 0.:; Minimum Backdrop Height Cm> 0.01: Maximum Rainfall (mm/hr) 200 Depth from Soffit to G.L. (m) 0.05Cl;
.Foul Sewage (l/s/ha) 0.00 Min Vel. (m/s - Auto Design Only) O'flow Setting (*Foul only) 0 Min slope (1:X - optimisation) is0
Designed with Level soffits
Network Desiqn Table
PN Le(nmqth F&y pJ$ gg (f;& (ys') (,km, HYD D1* SECT (mm)
1.000 33.00 0.078 423.1 0.000 2.00 8 0.600 o 300 1.001 54.00. 0.127 425.2 0.000 0.00 8 0.600 0 300
ES 58.00 0.136 426.5 0.000 0.00 0 0.600 0 300 46.00 0.108 425.9 0.000 0.00 16 0.600 o 300
1:004 37.00 0.051 ,725.S 0.000 0.00 67 0.600 o 525 1.005 48.00 0.060 800.0 0.000 0.00 0 0.600 0 525 1.006 32.00 0.040 800.0 0.000 0.00 0 0.600 o 525 1.007 35.90 0:lOl 346.5 0.000 0.00 0 0.600 0 525
2.000 36.00 0.103 349.5 0.000 2.00 42 0.600 0 300
3.000 13.00 0.168 77.4 0.000 2.00 SO 0.600 0 300
2.001 65.00 0.372 174.7 0.000 0.00 27 0.600 o 375
1.008 1.00 0.010 100.0 0.000 0.00 0 0.600 o 525
Network Results Table
PN Rain T.C. US/IL E.Area E.DWF Foul Infil. (l/s) Cl/s> Cl/s> (m/s) 6% Z25
vel (mm/hr) (mins) (m) (ha>
1.000 ZE
2.7 98.975 0.000 8 0.76 8 1.001 ;.; g.;;; 0.000 00 ii 0.76 zi 1.002 191:6 0.000 E 0.76 1.003
E 178.7 6:2 98:634 0.000 32 i : 0.76 :i 32
1.004 170.4 7.0 98.376 0.000 0.82 178 1.005 159.4 8.0 98.250 0.000 z; i : 0.78 170 z; 1.006 152.9 8.7 98.165 0.000 0.78 170 1.007 148.6 9.1 98.000 0.000 zz : i 1.20 259 2:
2.000 200.0 2.7 98.875 0.000 42 0 0 0.84 59 42
3.000 200.0 2.1 98.368 0.000 50 0 0 1.79 126 50
2.001 200.0 3.5 98.125 0.000 119 0 0 1.37 151 119
1.008 148.6 9.2 97.603 0.000 218 0 0 2.24 485 218
For
insp
ectio
n pur
pose
s only
.
Conse
nt of
copy
right
owne
r req
uired
for a
ny ot
her u
se.
EPA Export 25-07-2013:16:15:44

CORRIB PROJECT
STORM SEWER DESIGN bv the Modified Rational Method
Global Variables
Location - Scotland & Ireland
Return Period (years) 100 Volumetric RUnOff COeff. 0.77 M5-60 (mm) . Infiltration % Ratio R 0.:; Maximum Rainfall (mm/hr> 200
Minimum Backdrop Height (m) 0.01:
Foul Sewage (l/s/ha> De th from soffit to G.L. (m) Oo5C);
0.00 Min Ve . 7 O'flow Setting (*Foul only) 0
(m/s - Auto Design Only) Min Slope {1:X - Optimlsation) iS0
Designed with Level Soffits
Network Design Table
PN
1.000 35.00 0.200 175.0 0.000 2.00 5 0.600 0 150 .l.OOl 80.00. 0.457 175.1 0.000 0.00 0 0.600 0 150
2.000 27.00 0.154 175.3 0.000 2.00 5 0.600 0 150 2.001 15.00 0.146 102.7 0.000 0.00 40 0.600 0 300
1.002 68.00 0.168 404.8 0.000 0.00 0 0.600 o 300
Network Results Table
PN Rain T.C. US/IL E.Area E.DWF Foul Infil. vel Cmm/hr> (mins) 00 CM Cl/s> Cl/s) (l/s) Cm/s> 6% &?s"
1 1.000 200.0 2.8 99.200 '0.000 0.76. 1.001 195.5 4.5 99.000 0.000 2 : i 0.76 11: 5
2.000 200.0 2.6 99.150 0.000 0.76 2.001 200.0 2.8 98.846 0.000 4: z i 1.55 1;: 455
1.002 176.0 6.0 0.000 0.000 50 0 0 0.78 55 50
For
insp
ectio
n pur
pose
s only
.
Conse
nt of
copy
right
owne
r req
uired
for a
ny ot
her u
se.
EPA Export 25-07-2013:16:15:44

0
Client: Plant:
Shell E & P Ireland Ltd. Gas Reception Terminal . ameg, Job Ref.
L3882 I 1 Location: Corrib
On-Plot Storm Drainage
Sheet m/rev.
II-- Calc. by Date Chck’d by Date Aiw’d by Date
IM Nov ‘03 I
iECTlON A6 SURFACE WATER SYSTEM
16.1 Introduction
‘he surface water system collects the water run-offs from the building roofs as well as water at ground level where
squired for de-watering. The surface water is split into three systems to reflect the location of the various buildings,
nd as such there are three discharge locations.
The roof and dewatering drainage to the:
Open and Closed Drains Sump
Generator Building
Firewater Pump House
Switchroom LER 1 The control building discharge into the external drainage system.
The Maintenance building and administration building complex drains into the existing ditch in the tree
firebreak.
-he design of the system was carried out using the Micro-drainage ‘storm’ program for a 1 in 10 year return period
;torm, derived using reference design condition of 45mm rainfall in one hour (100 year return period). This will
jrovide a system suitable for a loo-year return period storm, when the effects of storage and surcharging are
:onsidered.
46.1 LER I Drain Sumps / Generator Building I FW Pump House
Ireas based on building roof areas and de-watering requirements local to the building. Design criteria as per
tppendix A section 1, viz:
,Return period = 10 years”
M5-60 = 22.2 mm”
,Volumetric runoff coefficient, Cv = 0.77”
The results are attached.
For
insp
ectio
n pur
pose
s only
.
Conse
nt of
copy
right
owne
r req
uired
for a
ny ot
her u
se.
EPA Export 25-07-2013:16:15:44

Client: Shell E & P Ireland Ltd. Job Ref. $ Plant: Gas Reception Terminal L3882
Location: Corrib Sheet no./rev.
MU On-Plot Storm Drainage
Calc. by Date Chck’d by Date App’d by Date
I IM 1 Nov ‘03 1
.2 ON-PLOT ROOF DRAINS SYSTEM -TIE IN POINT 8
kitfall Ditch System - Areas Drainins to Ditches
8-l 32 17 1 23 32 16 1
2 10 '0.6 33 0 0 0 18 19 19 1 54 15 37 1 22 15 12 1 50 19 19 1 15 0 0 0 48 27 12 1 37 27 12 1 22 0 0 0 35 ,36 22 1 41 03 13 1 31 zl 15 1
lco 0 0 0
For
insp
ectio
n pur
pose
s only
.
Conse
nt of
copy
right
owne
r req
uired
for a
ny ot
her u
se.
EPA Export 25-07-2013:16:15:44

Client: Shell E & P Ireland Ltd.
. am& Eon: ~~~~~~~~~ael oate
IM Nov ‘03
Job Ref.
Sheet nolrev.
,. 4
4
A6.3 Control building
jrea drained from Block C building :
Roof:
Roads (3m road width to north and south of building. Outer half
of perimeter road is taken to drain out to perimeter ditches
without specific drain provision).
General area drainage:
Total:
46.4 Admin Buildings
These calculations are based on the roof areas for the administration and maintenance buildings
?unoff areas to be allowed for:
‘Run 1 .OOO:
‘Block G (Warehouse)
‘Run 2.000:
‘Block E (Admin)
‘(Area between Blocks G and B, in contradiction of above statement)
40x12=480m2
50x6= 300m*
50x9x0.6 = 270m*
= 1050 m* .’
39x20=780m2
54x10=540m2
19x20x0.6 = 228m* Run 2.000 Total = 768 m*
‘Run 1.001:
‘Block A
‘Run 1.002:
‘Block B
‘Run 3.000:
‘Block F
‘Block D
‘Allow some of Block B drainage here
Results are shown in the attached Micro Drainage files.
14x9 = 126m*
38 x 9 = 342 m*
11x9 = 99m2
15x9 = 135m*
9x10 = 90m2
Run 3.000 Total = 324 m* .‘I
For
insp
ectio
n pur
pose
s only
.
Conse
nt of
copy
right
owne
r req
uired
for a
ny ot
her u
se.
EPA Export 25-07-2013:16:15:44

Client: Shell E & P Ireland Ltd. 1 Job Ref. Plant: Location:
Calc. by
IM
Gas Reception Terminal Corrib On-Plot Storm Drainage
Date Chck’d by
Nov ‘03 Date
L3882 Sheet no./rev.
Aw’d by Date
16.5 DESIGN SUMMARY
‘he summary of surface water system outfalls from the main process plot roofs is as below:
Drainage System
LER, Drains Sump, Generator
Building, Firewater Pump House
Control Building
Admin Area Buildings (roofs only)
Tie in point Outflow Time of Max Flow
number Invert Level Concentrat (Us)
W-0 ion (min)
8 96.500 10.0 147 *(SEE
(At N NOTE)
32820m)
7 98.025 5.1 38
(At N
32820m)
9 97.600 5.6 74
(At N
32816m)
rhese calculations have been run only using the Micro Drainage ‘Storm’ program, based on a IO-year return period
storm, without consideration of storage within the system. The tie-in point numbers refer to the interface with the
external drainage system on drawing COR-AP-SD-001. The results of initial calculations were made available to
he designers of the external drainage system. The final calculations included here show some variation to these
igures, but the latest figures are generally less critical. For simplicity, it has been decided that the figures given in
he summary report should be left unchanged. Minor variations in the results of the detailed calculations are
:onsidered to be of no consequence.
For
insp
ectio
n pur
pose
s only
.
Conse
nt of
copy
right
owne
r req
uired
for a
ny ot
her u
se.
EPA Export 25-07-2013:16:15:44

STORM SEWER DESIGN bv the Modified Rational Method
Designed with Level Soffits
Global Variables
Location - Scotland & Ireland
Return Period (years) Volumetric RUnOff coeff. 0.77 M5-60 (mm) Infiltration % Ratio R 0.40 Minimum Backdrop Height (m) 0.00: Maximum Rainfall (mm/hr> 200 soul Sewage (l/s/ha)
Depth from Soffit t0.G.L. (m) Oo3tIi
O'flOW Setting ("Foul Only) 0.0; Min Vel. (m/s - AUtO Design Only)
Mln Slope (1:X - Optlmisation) is0
Network Desiqn Table
PN Len th (m5 Fpm:l ~:P!$ ?I$ (SE;] (FI';s'> (&>
HYD DIA SECT (mm)
1.000 81.00 0.310 261.3 0.056 3.00 0 0.060 0 225
2.000 28.00 0.200 140.0 0.070 3.00 0 0.600 0 225
- 1.001 37.50 0.350 107.1 0.000 0.00 0 0.600 0 225
3.000 18.00 0.067 268.7 0.037 3.00 0 0.600 0 225
1.002 54.00 0.500 108.0 0.112 0.00 0 0.600 0 300 1.003 22.00 0.375 58.7 0.037 0.00 0 0.600 0 300
4.000 50.00 0.200 250.0 0.052 3.00 0 0.600 0 225
P:oDaOii 48.00 15.00 0.130 0.150 115.4 320.0 0.033 0.000 p; . 0 0 0.600 0.600 0 0 450 375
5.000 37.00. 0.250. l.48.0 0.033 3.00 0 0.600 0 150
Network Results Table
PN Rain T.C. US/IL E.Area E.DWF Foul Infil. vel (mm/hr) (mins) (m) CM' Cl/s) (1 /s> Cl/s) Cm/s) 6% (::“s”>
1.000 123.2 4.4 99.175 0.056 0 0 0 0.99 39 19
2.000 134.4 3.4 99.175 0.070 0 0 0 1.10' 44 26
1.001 118.1 4.9 98.800 0.126 0 0 0 1.26 50 41
3.000 135.0 3.4 98.800 0.037 0 0 0 0.79 32 14
1.002 112.6 0.275 1.003 111.1 ;.; . $3: . 0.312 E 00 00 ?05i 107 . 145 iz:
4.000 127.1 4.0 98.500 0.052 0 0 0 0.82 33 18
Z: 00~~ EL: 6.5 5.8 97.425 97.220 is . ;96; : '0 0 a" ?:z . %06 :c:
5.000 130.3 3.7 99.175 0.033 0 0 0 0.82 15 12
For
insp
ectio
n pur
pose
s only
.
Conse
nt of
copy
right
owne
r req
uired
for a
ny ot
her u
se.
EPA Export 25-07-2013:16:15:44

I Projects Ltd 1 Enterprise Oil
1 Page2
Crawley Corrid Project West Sussex RHIO IUX Dewatering & SWS Date 17-November-2003 Designed By IM File DW-Sumps to FWPH.S... 1 Checked By Micro Drainage Storm W.7.6 (c)19 82-2001 Micro Drainage
Network Desiqn Table
PN Le(nmgth F&J’ pi! $--y (y;) (yy5’) (,km) HYD D1A SECT (mm)
1.006 22.00 0.090 244.4 0.000 0.00 0 0.600 0 450 1.007 35.00 0.060 583.3 0.058 0.00 0 0.600 0 450 1.008 41.00 0.070 585.7 0.078 0.00 0 0.600 0 525
6.000 31.00 0.100 310.0 0.030 3.00 0 0.600 0 225
1.009 100.00 0.180 555.6 0.000 0.00 0 0.600 0 525
Network Results Table
PN Rain T.C. US/IL E.Area E.DWF Cmm/hr) (mins) (ml (ha>
1.006 102.4 6.8 97.070 Ed . 93.2 97.7 8.2 7.5 96.845 96.980 0:566 Ei 0 i 0 i 0 i
1.30 206 122 0.92 0.83 133 199 147 133
6.000 130.9 3.7 97.800 0.030 0 0 0 0.74 29 11
1.009 84.3 10.0 96.775 0.596 0 0 0 0.94 204 147
J
For
insp
ectio
n pur
pose
s only
.
Conse
nt of
copy
right
owne
r req
uired
for a
ny ot
her u
se.
EPA Export 25-07-2013:16:15:44

Micro Drainage Storm W.7.6 (c)l 982-2001 Micro Drainage
STORM SEWER DESIGN bv the Modified Rational Method
Global Variables
Location - Scotland & Ireland
Return Period (years) i!
Volumetric Runoff Coeff. 0.77 MS-60 (mm) Infiltration % Ratio R 0.40 Maximum Rainfall (mm/hr>
Minimum Backdrop Height (m) 0.00: 200
Foul Sewage (l/s/ha) Depth from soffit t0.G.L. (m) Oo3v;
O'flOW Setting (“Foul only) 0.0; Min Vel. (m/s - AUtO lIesIgn only)
Mln Slope (1:X - Optimlsatlon) is0
Designed with Level soffits
Network Desiqn Table
PN
1.000 50.00 0.400 125.0 0.105 3.00 i E:: 0 225 1.001 80.06 0.300 266.7 0.000 0.00 . 0 300
Network Results Table
PN Rain (mm/h rl
E.Area E.DWF Foul (ha) (l/s) Cl/s>
Infil. Cl/s)
vel (m/s) 6% Flow
Cl /Sl
1.000 130.7 3.7 98.800 ' 0.105 1.17 46 1.001 115.8 5.1 98.325 0.105 : : i 0.96 68 ;:
For in
spec
tion p
urpo
ses o
nly.
Conse
nt of
copy
right
owne
r req
uired
for a
ny ot
her u
se.
EPA Export 25-07-2013:16:15:44

Amec Capital Projects Ltd II The Boulevard-
i - Crawlev 7 West Sussex RHIO 1 UX
Date I 7 November-2003 File Admin Blocks.SWS Micro Drainage
Enterprise Oil Corrib Proiect Dewaterinb & SWS Designed By IM Checked By Storm W.7.6 (c)
Page 1
1982-2001 Micro Drainage
STORM SEWER DESIGN bv the Modified Rational Method
Global Variables
Location - Scotland & Ireland
Return Period (years) M5-60 (mm) t:
Volumetric Runoff Coeff. 0.77 Infiltration %
Ratio R 0.40 Maximum Rainfall (mm/hr)
Minimum Backdrop Height Cm) 0.00: 200
Foul Sewage (l/s/ha) De th from soffit t0.G.L. (m) Oo3C)f
7 O'flow Setting ("Foul only)
0.0; Min ye . (m/s - AUtO Design 0~1~) Min Slope (1:X - Optlmisatlon) is0
Designed with Level soffits
Network Design Table
PN
1.000 45.00 0.350 128.6 0.078 3.00
2.000 70.00 0.350 200.0 0.078 3.00
1.001 34.00 0.250 136.0 0.016 0.00 1.002 61.00 0.350 174.3 0.032 0.00
3.000 67.00 0.250 268.0 0.034 3.00
1.003 6.00 0.040 150.0 0.000 0.00
DWF Cl/s> CA>
0 0.600
0 0.600
0 0.600 0 0.600
0 0.600
0 0.600
HYD SECT
0
0
0 0
0
0
DIA (mm)
225
225
300 300
225
300
Network Results Table
PN Rain T.C. US/IL E.Area E.DWF (mm/hr) (mins) (m) Cha)
1.000 131.5 3.7 98.700 0.078 0 0 0 1.15 46 29
2.000 124.3 4.3 98.900 0.078 0 0 0 0.92 37 27
1.001 119.8 ;.; ;;.;z; 0.172 1.002 111.9 . . 0.204 : OD i 1.35 1.19 zz 2:
3.000 122.7 4.4 98.800 0.034 0 0 0 0.79 32 12
1.003 111.2 5.6 97.675 0.238 0 0 0 1.28 91 74
For
insp
ectio
n pur
pose
s only
.
Conse
nt of
copy
right
owne
r req
uired
for a
ny ot
her u
se.
EPA Export 25-07-2013:16:15:44

I I Client: Shell E & P Ireland Ltd. 1 Job Ref. I Plant: Gas Reception Terminal L3882
c ame Location: Corrib Sheet no./rev.
On-Plot Storm Drainage Calc. by Date ChcKd by Date NW by Date
IM Nov ‘03
SECTION A7 ACCESS ROAD AND CAR PARK DRAINAGE SYSTEM
47.1 Introduction
-he access road and main car park drain to a sump located near the site entrance. The access road is kerbed [long its length to ensure that any accidental spillage from a tanker is contained. All runoff is pumped to the oily vater system on the terminal site (refer to the waste storage area system).
‘or this part of the oily water system there are two design conditions: 1 Storm rainfall or 1 Oil arising from an accidental tanker spill.
Vry accidental spillage will be contained with the kerbed area. These calculations check the system’s ability to :ope with rainfall.
The design of the system is run on the Micro Drainage Storm’ program, using a 1 in 1 O-year storm profile, derived orm the reference design condition of 45mm rainfall in one hour (100 year return period). Pipes are laid to normal alls and the pipes are sized for the maximum flow only.
47.2 Access Road Impermeable Areas
The ground around the Administration Area buildings and car park is drained by Arup. The roads in this area are lrovided with a kerb. The kerb is required to contain any accidental oil spillage. Runoff into the road drainage system IS, therefore, limited to runoff from the net road areas.
qoad areas are calculated below. Area numbers are marked on the sketch plan of the drainage system.
For
insp
ectio
n pur
pose
s only
.
Conse
nt of
copy
right
owne
r req
uired
for a
ny ot
her u
se.
EPA Export 25-07-2013:16:15:44

Client: Shell E & P Ireland Ltd. Job Ref. Plant: Gas Reception Terminal L3882
Location: Corrib Sheet no./rev.
On-Plot Storm Drainage Calc. by
IM Date
Nov ‘03 Chck’d by Date Aw’d by Date
Desaiption
1 2 5
6B
7 8
12
9 10 11
12 13
14 radius
Contributing l&tin Aree Area cv,Flutloff Area Sumof comnent to Pipe Length Length Breadth Coefficient (I&) Ateas
Length (ml (ml ON (If Partially (ns) PerviOUS)
Carrier
562
612
A7.3 Outflows from Access Road and Car Park Drains:
The detailed Micro Drainage ‘Storm’ calculations follow.
The outflow from the Access Road and Car Park drain system is shown below. These figures are based on the
results of the 1 in IO year ‘Storm’ program output.
It should be noted that the flow from the Access Road and Car Park system does not drain directly to the perimetet
ditch system. It drains to a local sump and is then pumped to the terminal oily water system.
For
insp
ectio
n pur
pose
s only
.
Conse
nt of
copy
right
owne
r req
uired
for a
ny ot
her u
se.
EPA Export 25-07-2013:16:15:44

1 Client: Shell E & P Ireland Ltd. - 1 Job Ref.
1 Location: Corrib Plant: Gas Reception Terminal
On-Plot Storm Drainage
Sheet no./rev.
L3882
----VI Calc. by Date
I
Chck’d by Date
IM Nov ‘03 I Aw’d by Date
I
The summary of the Access Road and Car Park drain system outflow is as below:
Ditch System Outflow Invert Level Time of Concentration Max Flow
ON (min) WI Access Road and Car Park Drains 97.755 11.2 110
8
For
insp
ectio
n pur
pose
s only
.
Conse
nt of
copy
right
owne
r req
uired
for a
ny ot
her u
se.
EPA Export 25-07-2013:16:15:45

Shell E&P Ireland Ltd
STORM SEWER DESIGN bv the Modified Rational Method
Global Variables
Micro Drainage Storm W.7.6 (c)l 982-2001 Micro Drainage
Location - Scotland & Ireland
Return Period (years) Volumetric Runoff coeff. 0.77 M5-60 (mm) 21: Infiltration % Ratio R 0.40 Maximum Rai nfal 1 (mm/hr>
Minimum Backdrop Height (m) 0.00: 200
Foul Sewage (1 /s/ha) Depth from soffit to G.L. (m) lb2C$
0.00 Min Vel. O’flow Setting (*Foul only) 0
(m/s - AUtO Design only) Min slope (1:X - Optimisation) 1000
Designed with Level Soffits
Network Desiqn Table
PN
1.000 32.00 0.120 266.7 0.038 2.00 0 0.600 o 1.001 53.00. 0.140 378.6 0.048 0.00 E 1.002 20.00 0.050 400.0 0.030 0.00 300 1.003 68.00 0.180 377.8 0.050 0.00 300 1.004 40.00 0.080 500.0 0.000 0.00 375 1.005 45.00 0.100 450.0 0.050 0.00 375
2.000 40.00 0.100 400.0 0.090 2.00 0 0.600 o 300 2.001 52.00 0.150 346.7 0.000 0.00 0 0.600 o 300
1.006 82.00 0.140 585.7 0.067 0.00 0 0.600 o 450 1.007 32.00 0.050 640.0 0.019 0.00 0 0.600 0 450 1.008 72.00 0.130 553.8 0.043 0.00 0 0.600 0 450
3.000 63.00 0.230 273.9 0.061 2.00 0 0.600 0 225
1.009 10.00 0.030 333.3 0.000 0.00 0 0.600 o 450
Network Results Table
PN Rai n T.C. US/IL E.Area E.DWF Foul Infil. vel (mm/hr) (mins) (ml Cl-n> (l/s) Cl/s) (l/s) (m/s) C??$ (::“s”>
1.000 145.3 0.038 0 1.001 130.0 0.086
i : 0.80 15 0.80
E
E:s 2
1:004
:::-i
104:7
2%
0:166
: 0 i : 0.78 0.80 ;:
0.80 :i 1.005 98.7 7.3 98.280 0.216 I: i El 0.85 8 59
?::! s 128.6 142.5 :.; . !33m; . 0.090 0.090 0 0 00 i 0.84 0.78 :z 2
?%
1:OOS
89.2 85.9 9.6 9.0 98.105 97.965 0.373 0.392 i z : 0.83 132
79.8 11.0 97.915 0.435 0 0 0 Kz . zi
3.000 135.6 3.3. 98.700 0.061 0 0 0 0.79 31 23
1.009 79.2 11.2 97.785 0.496 0 0 0 ,l.ll 176 109
J
For
insp
ectio
n pur
pose
s only
.
Conse
nt of
copy
right
owne
r req
uired
for a
ny ot
her u
se.
EPA Export 25-07-2013:16:15:45