artificial sweeteners
DESCRIPTION
Artificial Sweeteners. Marketing 4443, Caitlin Murad. Slide A A.C. Nielsen Product Snapshot. Slide B Demographics of the Brands. - PowerPoint PPT PresentationTRANSCRIPT

ARTIFICIAL SWEETENERSMarketing 4443, Caitlin Murad
Slide A A.C. Nielsen Product Snapshot
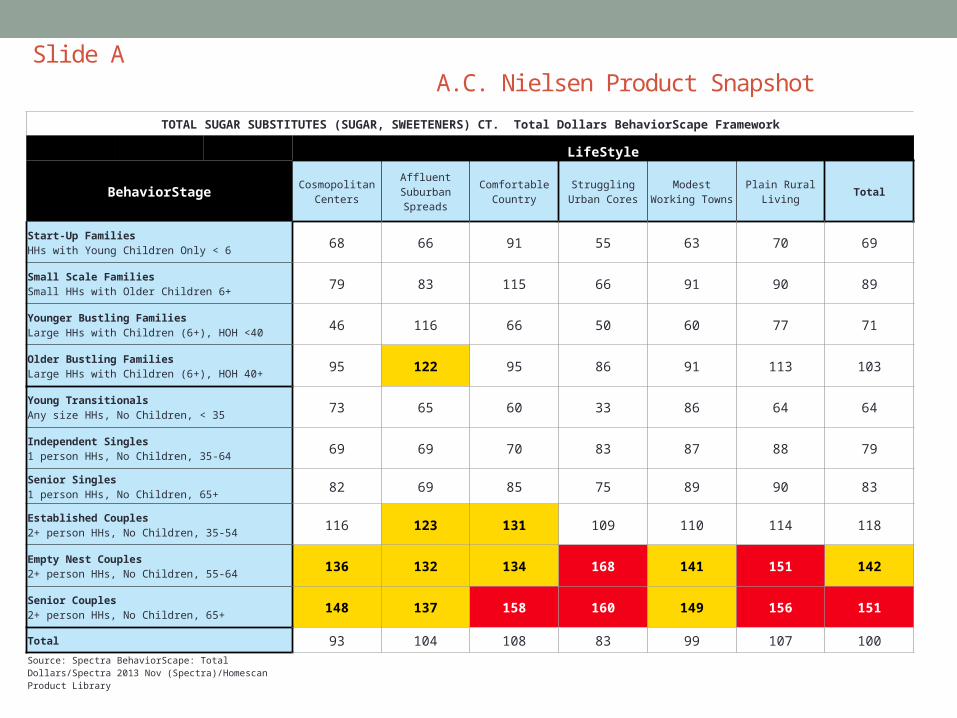
TOTAL SUGAR SUBSTITUTES (SUGAR, SWEETENERS) CT. Total Dollars BehaviorScape Framework
LifeStyle
BehaviorStage Cosmopolitan Centers
Affluent Suburban Spreads
Comfortable Country
Struggling Urban Cores
Modest Working Towns Plain Rural Living Total
Start-Up FamiliesHHs with Young Children Only < 6 68 66 91 55 63 70 69
Small Scale FamiliesSmall HHs with Older Children 6+ 79 83 115 66 91 90 89
Younger Bustling FamiliesLarge HHs with Children (6+), HOH <40 46 116 66 50 60 77 71
Older Bustling FamiliesLarge HHs with Children (6+), HOH 40+ 95 122 95 86 91 113 103
Young TransitionalsAny size HHs, No Children, < 35 73 65 60 33 86 64 64
Independent Singles1 person HHs, No Children, 35-64 69 69 70 83 87 88 79
Senior Singles1 person HHs, No Children, 65+ 82 69 85 75 89 90 83
Established Couples2+ person HHs, No Children, 35-54 116 123 131 109 110 114 118
Empty Nest Couples2+ person HHs, No Children, 55-64 136 132 134 168 141 151 142
Senior Couples2+ person HHs, No Children, 65+ 148 137 158 160 149 156 151
Total 93 104 108 83 99 107 100
Source: Spectra BehaviorScape: Total Dollars/Spectra 2013 Nov (Spectra)/Homescan Product Library

Slide B Demographics of the Brands
Equal Splenda SweetNLow Private LabelDemographic Variables % Total $ Index % Total $ Index % Total $ Index % Total $ Index
Race of Head of Household
White 60.8% 88 68.5% 99 79.0% 114 78.4% 113
Black 17.8% 148 12.7% 106 7.2% 60 9.0% 75
Hispanic 17.1% 138 14.7% 119 10.3% 84 9.5% 77
Asian 1.9% 43 2.0% 46 1.6% 37 1.1% 26
Other 2.5% 115 2.2% 100 1.9% 87 1.9% 87
Household Income
Under $10,000 5.3% 67 6.0% 76 8.6% 108 9.6% 121
$10,000 - $19,999 12.0% 103 9.7% 84 13.0% 112 14.2% 122
$20,000 - $29,999 9.4% 83 9.8% 86 13.0% 114 13.1% 116
$30,000 - $39,999 11.7% 111 10.5% 100 10.8% 103 10.5% 99
$40,000 - $49,999 7.5% 81 9.5% 102 10.6% 114 10.0% 108
$50,000 - $74,999 17.7% 98 17.9% 99 17.9% 99 16.8% 93
$75,000 - $99,999 11.6% 99 12.8% 109 11.5% 98 10.6% 90
$100,000 - $149,999 16.3% 143 15.3% 134 9.1% 80 8.9% 78
$150,000 or More 8.5% 105 8.5% 106 5.7% 70 6.4% 79

Slide C Assigning a Role to the Category

Slide D Category Assessment: Store Audited
Store Location SKUs Unique SKUs*
Supercenter MLK Blvd (6th) 72 25
Walgreens Township 12 9
Harp’s Wedington 51 33
Target Fayetteville 10 8
ALDI MLK Blvd (6th) 9 4
Complete Audit 154 79

Slide E Category Scorecard: SPSS Share of Display
ManufacturerWMTMLK
FacingWGTWN Facing
HARP Facing
TARGET Facing
ALDI Facing
Cumberland Packaging Corp.
% of Total Sum 4.2% 8.3% 15.7% 10.0% N 2 1 5 1
McNeil Nutritionals
% of Total Sum 45.8% 33.3% 27.5% 20.0% N 9 2 8 2
Parve % of Total Sum 8.3% 16.7% 19.6% 40.0% N 3 2 7 3
Private Label % of Total Sum 9.7% 13.7% 100.0%N 3 5 4
Total % of Total Sum 100.0% 100.0% 100.0% 100.0% 100.0%N 25 9 33 8 4

In Store Example: Harps Share of Display

Slide F Category Scorecard: SPSS % Gross Margin Dollars
ManufacturerWMT-GM$
WGTWN-GM$
HARP-GM$
TARGET-GM$ ALDI-GM$
Cargill, Inc. % of Total Sum 14.3% 10.7% 28.6% 6.8% Mean 1.6 0.2 0.6 0.4 N 4 2 2 3
Cumberland Packaging Corp.
% of Total Sum 4.6% 3.5% 3.0% 12.4% Mean 2.12 0.12 0.12 0.43 N 1 1 1 5
McNeil Nutritionals
% of Total Sum 52.7% 40.1% 3.8% 25.9% Mean 2.67 0.70 0.08 0.56 N 9 2 2 8
Parve % of Total Sum 8.5% 13.0% 64.7% 25.9% Mean 1.30 0.23 0.86 0.64 N 3 2 3 7
Private Label % of Total Sum 3.9% 16.2% 100.0%Mean .59 .56 .88N 3 5 4
Total % of Total Sum 100.0% 100.0% 100.0% 100.0% 100.0%Mean 1.82 0.39 0.50 0.52 0.88N 25 9 8 33 4

Slide G Category Scorecard: Mean % Gross Margins
Manufacturer WMT-GM%WGTWN- GM
% HARP- GM%TARGET-
GM% ALDI-GM%Cargill, Inc. N 4 2 2 3
Mean 53.20% 18.50% 31.40% 21.90% % of Total Sum 17.00% 16.00% 22.20% 6.70%
Cumberland packaging corp.
N 2 5 Mean 11% 24.10% % of Total Sum 1.80% 12.20%
Cumberland Packaging Corp.
N 1 1 1 Mean 70.67% 12.00% 12.00% % of Total Sum 5.70% 5.20% 4.20%
McNeil Nutritionals N 9 2 2 8 Mean 57.10% 35.10% 7.40% 31.40% % of Total Sum 41.10% 30.40% 5.20% 25.50%
Parve N 3 2 3 7 Mean 57.20% 22.50% 64.30% 32.20% % of Total Sum 13.70% 19.50% 68.30% 22.90%
Private label N 2 Mean 76.64% % of Total Sum 12.30%
Total N 25 9 8 33 4Mean 50.00% 25.60% 35.30% 29.90% 38.50%% of Total Sum 100.00% 100.00% 100.00% 100.00% 100.00%
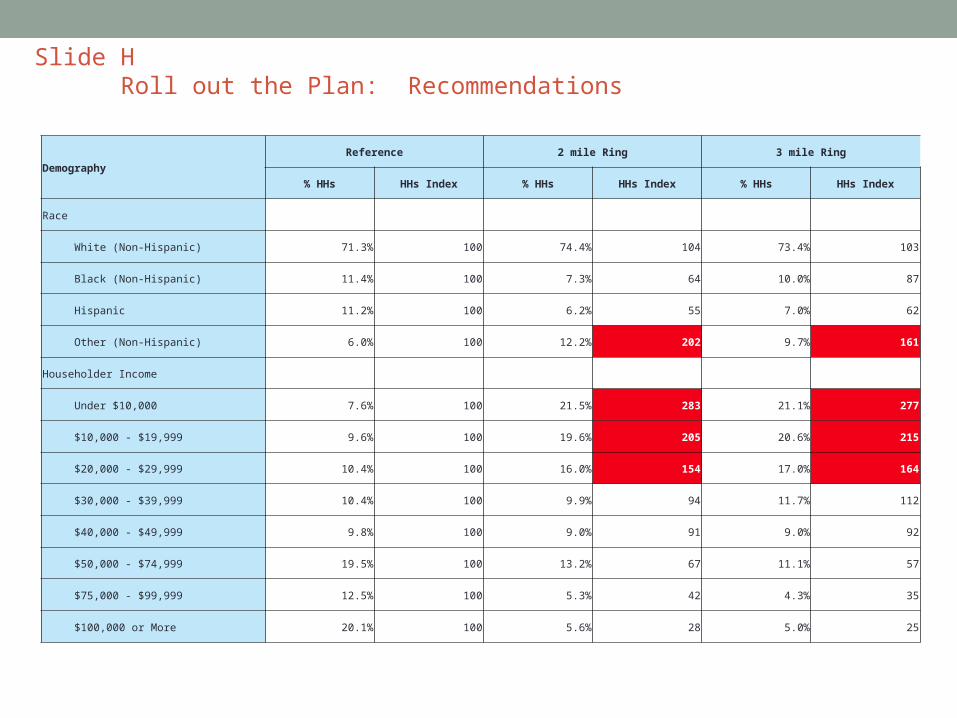
Slide H Roll out the Plan: Recommendations
DemographyReference 2 mile Ring 3 mile Ring
% HHs HHs Index % HHs HHs Index % HHs HHs Index
Race
White (Non-Hispanic) 71.3% 100 74.4% 104 73.4% 103
Black (Non-Hispanic) 11.4% 100 7.3% 64 10.0% 87
Hispanic 11.2% 100 6.2% 55 7.0% 62
Other (Non-Hispanic) 6.0% 100 12.2% 202 9.7% 161
Householder Income
Under $10,000 7.6% 100 21.5% 283 21.1% 277
$10,000 - $19,999 9.6% 100 19.6% 205 20.6% 215
$20,000 - $29,999 10.4% 100 16.0% 154 17.0% 164
$30,000 - $39,999 10.4% 100 9.9% 94 11.7% 112
$40,000 - $49,999 9.8% 100 9.0% 91 9.0% 92
$50,000 - $74,999 19.5% 100 13.2% 67 11.1% 57
$75,000 - $99,999 12.5% 100 5.3% 42 4.3% 35
$100,000 or More 20.1% 100 5.6% 28 5.0% 25

Slide I Category Review: Changes in Category, Prior Audits
Fall 2013 Spring 2013
ManufacturerWMTMLK Facing
WGTWN Facing
HARP Facing
TARGET Facing
ALDI Facing
Harps Facings
WGT Coll Facing
WG Sch Facing
WMLK facings
Tgt Facings
Cumberland Packaging Corp.
% of Total Sum
4.20% 8.30% 15.70% 10.00% 12.3% 10.0% 11.1% 6.2% 16.7%
N 2 1 5 1 6 1 1 3 1McNeil Nutritionals
% of Total Sum
45.80% 33.30% 27.50% 20.00% 24.6% 40.0% 33.3% 40.7% 16.7%
N 9 2 8 2 11 4 3 12 1Parve % of
Total Sum
8.30% 16.70% 19.60% 40.00% 22.8% 20.0% 22.2% 13.3% 33.3%
N 3 2 7 3 10 2 2 8 1Private Label
% of Total Sum
9.70% 13.70% 100.00% 15.8% 10.0% 11.1% 18.6%
N 3 5 4 5 1 1 5 Total % of
Total Sum
100.00% 100.00% 100.00% 100.00% 100.00% 100.0% 100.0% 100.0% 100.0% 100.0%
N 25 9 33 8 4 41 10 9 37 5