artículos interesantes
DESCRIPTION
Artículos interesantesTRANSCRIPT
ELSEVIER
RIOCHEMISTRY and
EDUCATION MOLECULAR BIOLOGY
Biochemistry and Molecular Biology Education 29 (2001) 3-9 www.elsevier.codocate/bambed
Article
Computer-assisted simulations of phosphofructokinase-1 kinetics using simplified velocity equations
Harry Roy”, Joyce Diwana, Leigh D. Segelb, Irwin H. Segelb3* “Department of Biology, MRC302, Rensselaer Polytechnic Institute, Troy, NY 12180-3590, USA
bSection of Molecular and Cellular Biology, University of California, One Shields Avenue, Davis, CA 9561 6, USA
Abstract
Equations useful for simulating the kinetic behavior of phosphofructokinase are presented. The equations, which are based on the concerted transition (symmetry) model for allosteric enzymes, account for substrate inhibition by MgATP, cooperative binding by F-6-P, activation by F-2,6-P2, and deinhibition by AMP. Velocity calculations can be performed using either a spreadsheet program (e.g., MS Excel) or a web-based program (e.g., Authorware). Both approaches are illustrated. 0 2001 IUBMB. Published by Elsevier Science Ltd. All rights reserved.
Ke.vw,ords; Phosphofructokinase; Simulations; Allosteric; Computer; Cooperativity; Kinetics
1. Introduction
The glycolysis enzyme, phosphofructokinase- 1 (PFK- 1, hereafter called PFK), catalyzes the MgATP-depen- dent phosphorylation of fructose-6-phosphate (F-6-P) forming fructose-l,6-bisphosphate (F- l,6,-P2):
ATP + Fd-P+F-1,6-P2 + ADP.
PFK from most eukaryotic sources displays a number of regulatory features, including (a) inhibition by “high” levels of its nucleotide substrate, ATP, (b) positive cooperativity with respect to F-6-P binding, and (c) po- tent activation by fructose-2,6 -Pz (F-2,6-P2). The level of the last is under hormonal control in mammals. Physio- logical levels of AMP and inorganic phosphate also acti- vate PFK; citrate is an inhibitor. Additionally, the kinetic behavior of the enzyme is markedly affected by small pH changes over the range of pH 7-pH 8. Superimposed on the allosteric regulation, the enzyme from many sources undergoes phosphorylation and dephosphorylation. These covalent modifications modulate the sensitivity of the enzyme to the small molecule effectors. Clearly, the
*Corresponding author. Tel: 530-752-3193; fax: 530-752-3085. E-mail addresses: [email protected] (H. Roy), [email protected]
(I.H. Segel).
kinetics of PFK is rather complex and the complete velocity equation for this allosteric bireactant enzyme will contain many terms [1,2]. However, if certain sim- plifying assumptions are made, it is possible to derive less-complicated equations that still illustrate the major regulatory features of the enzyme and allow students to examine the kinetic bases of these features. The approach described below was designed to yield an equation that reproduced many of the kinetic properties of liver PFK. With minor modifications the basic equation should also work for PFKs from other sources (see Section 7).
* 2. A simplified velocity equation for phosphofructokinase
The following assumptions lead to a relatively simple velocity equation for PFK: (a) The kinetic properties of the enzyme can be described by the concerted transition (symmetry) model for allosteric enzymes [3-61. (b) The enzyme is a tetramer with each protomer bearing a cata- lytic site, an allosteric activator site, and an allosteric inhibitor site. (c) Substrates A (ATP) and B (F-6-P) bind in a rapid equilibrium ordered fashion to the R state catalytic site (A before B). (d) ATP also binds to the catalytic site in the T state, but F-6-P does not. (Thus the T state does not contribute to product formation.) (e) In addition, ATP binds to a T state allosteric inhibitor site
1470-81 75/01/$20.00 0 2001 IUBMB. Published by Elsevier Science Ltd. All rights reserved. PII: S l 4 7 0 - 8 1 7 5 ( 0 0 ) 0 0 0 5 9 - ~ X
4 H. Roy et al. 1 Biochemistry and Molecular Biology Education 29 (2001) 3-9
(but not to that site in the R state). (f) The activator, X, (F-2,6-P2) binds exclusively to an R state allosteric ac- tivator site. Applying the rules for deriving velocity equa- tions under rapid equilibrium conditions [7,8] we obtain
3. Spreadsheet approach
Students can examine the interaction of the three ligands by running activity simulations on a desktop
1 +- U =
where 1 1 is the initial velocity of the reaction and L is the base level allosteric constant, i.e., the [Tlo/[Rl0 ratio in the absence of ligands. Kia is the dissociation constant of the R state active site EA complex. Kmb is the B dissocia- tion constant of the R state EAB complex at the active site. (This dissociation constant would be equivalent to the Michaelis constant for B ~ the concentration of B that yields half-maximal velocity at saturating A - in a noncooperative rapid equilibrium random mechanism.) K i < , T is the dissociation constant of the T state catalytic site EA complex. K X R is the dissociation constant of the R statc EX complex at the allosteric activator site. K A T is the dissociation constant of the T state EA complex at the allosteric inhibitor site. I/,,, is the theoretical maxi- mal velocity of the R state, that is, the I/,,, that would be observed at saturating [A] and [B] if all the enzyme could be driven to the R state EAB complex and there were no substrate inhibition by A. In the above form, the numerator of the velocity equation accounts for product formation by all of the R state complexes containing both A and B at the catalytic site. The terms to the left of the central “plus” sign in the denominator represent the concentrations of all T state species relative to [Rl0. The terms to the right of the central “plus” sign in the denom- inator represent the concentrations of all R state species relative to [R],. Essentially, u/Vmax is equated to the fraction of the total enzyme molecules containing A plus B at the R state catalytic site. Although the simplified equation omits the terms corresponding to F-6-P bind- ing to the catalytic site in the T state, ATP binding to the allosteric inhibitor site in the R state, F-2,6-P2 binding to the allosteric activator site in the T state, and catalysis by the T state, the model accounts quite well for the reported kinetic behavior of PFK. For convenience when using a spreadsheet program, Eq. (1) can be written as U =
+ L-
computer. Use of a spreadsheet program such as Micro- soft Excel is one way to perform the calculations. A major advantage of the spreadsheet approach is that it allows the student to observe the effects of changing the allos- teric constant, L, or the relative affinities of different sites for their ligands. The effects of changing the concentra- tions of a substrate or an effector over any desired range can also be explored. If smoother plots are desired, addi- tional intermediary concentrations can be inserted easily in the regions of inflection points, maxima, etc. Also, the spreadsheet that is used for varied A (or a copy thereof) can be used for varied B or varied X. All one need do is copy the varied ligand range, paste it into the column for the new varied ligand, and then replace the original varied concentrations with a desired fixed value. Finally, data from Excel spreadsheets can be imported into vari- ous plotting programs (e.g., DeltaGraph Pro) for curve fitting and a more elaborate presentation. A drawback to the spreadsheet approach is that the equations for Excel- based simulations must be entered on a single line with diagonal slashes used for fraction lines. Often this results in equations that contain multiple nested parentheses. A missing set of parentheses can yield an incorrect result. At UCD, spreadsheet-based simulations are introduced in an undergraduate course on Enzyme Kinetics popu- lated mainly by 4th-year Biochemistry majors.
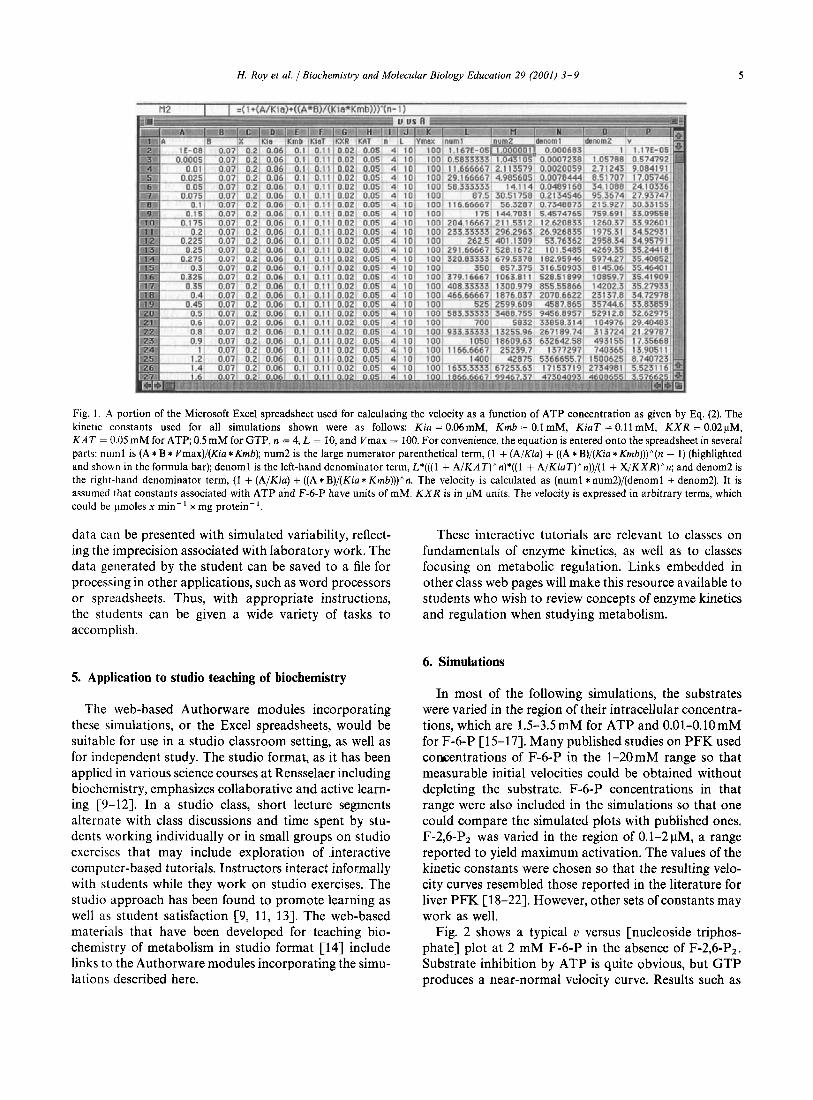
Fig. 1 shows a portion of the Excel spreadsheet in which Eq. (2) was used to calculate the u versus [ATP] plot at 0.07 mM F-6-P and 0.2 pM F-2,6-P2. The entire spreadsheet covers a broad range of ATP concentrations wirh many small increments within each decade.
4. Authorware approach
The Authorware software provides another way to examine the kinetics of PFK. This software runs either from a hard drive or via a web browser. The module we have constructed for PFK is part of a suite of several modules that illustrate different aspects of enzyme kinet- ics. The advantage of using modules like this is that the code for the kinetics is protected from the introduction of errors by the student, and it is possible to present the data in a form closer to that which the student might anticipate finding in the laboratory. For example, the
H. Roy et al. /Biochemistry and Molecular Biology Education 29 (2001) 3 -9 5
Fig. I . A portion of the Microsoft Excel spreadsheet used for calculating the velocity as a function of ATP concentration as given by Eq. (2). The kinetic constants used for all simulations shown were as follows: Kin = 0.06mM, Krnb = 0.1 mM, KiaT = 0.1 1 mM, K X R = 0 .02~M. K A T = 0.05 m M for A T P 0.5 mM for GTP, n = 4, L = 10, and Vmax = 100. For convenience, the equation is entered onto the spreadsheet in several parts: nuinl is ( A * B * Vmax)/(Kia * Kmb); num2 is the large numerator parenthetical term, (1 + (A/Kia) + ( ( A * B)/(Kia *Kmb)))^(n - 1 ) (highlighted and shown in the formula bar); denoml is the left-hand denominator term, L*(((l + A/KAT)^n)*((l + A/KiaT)^n)) / ( l + X/KXR)"n; and denom2 is the right-hand denominator term, (1 + (A/Kia) + ( ( A * B)/(Kia * Krnb)))"n. The velocity is calculated as (numl * num2)/(denoml + denom2). It is assumed that constants associated with ATP and F-6-P have units of mM. K X R is in pM units. The velocity is expressed in arbitrary terms, which could be pmoles x min-' x mg protein-'.
data can be presented with simulated variability, reflect- ing the imprecision associated with laboratory work. The data generated by the student can be saved to a file for processing in other applications, such as word processors or spreadsheets. Thus, with appropriate instructions, the students can be given a wide variety of tasks to accomplish.
These interactive tutorials are relevant to classes on fundamentals of enzyme kinetics, as well as to classes focusing on metabolic regulation. Links embedded in other class web pages will make this resource available to students who wish to review concepts of enzyme kinetics and regulation when studying metabolism.
6. Simulations 5. Application to studio teaching of biochemistry
The web-based Authorware modules incorporating these simulations, or the Excel spreadsheets, would be suitable for use in a studio classroom setting, as well as for independent study. The studio format, as it has been applied in various science courses at Rensselaer including biochemistry, emphasizes collaborative and active learn- ing [9-121. In a studio class, short lecture segments alternate with class discussions and time spent by stu- dents working individually or in small groups on studio exercises that may include exploration of interactive compu ter-based tutorials. Instructors interact informally with students while they work on studio exercises. The studio approach has been found to promote learning as well as student satisfaction [9, 11, 131. The web-based materials that have been developed for teaching bio- chemistry of metabolism in studio format [14] include links to the Authorware modules incorporating the simu- lations described here.
In most of the following simulations, the substrates were varied in the region of their intracellular concentra- tions, which are 1.5-3.5 mM for ATP and 0.01-0.10 mM for F-6-P [15-171. Many published studies on PFK used comentrations of F-6-P in the 1-20mM range so that measurable initial velocities could be obtained without depleting the substrate. F-6-P concentrations in that range were also included in the simulations so that one could compare the simulated plots with published ones. F-2,6-P2 was varied in the region of 0.1-2pM, a range reported to yield maximum activation. The values of the kinetic constants were chosen so that the resulting velo- city curves resembled those reported in the literature for liver PFK [18-221. However, other sets of constants may work as well.
Fig. 2 shows a typical u versus [nucleoside triphos- phate] plot at 2 mM F-6-P in the absence of F-2,6-P2. Substrate inhibition by ATP is quite obvious, but GTP produces a near-normal velocity curve. Results such as

6 H. Roy et al. 1 Biochemistry and Molecular Biology Education 29 (2001) 3-9
100
80
60
V
40
20
0
GTP \ [Fa-P] = 2 mM [F-2,6-P2] = 0
Y P
Fig. 3. Cnlculated velocity curves for varied [ATP] and varied [GTP] at a typical experimental level of F-6-P (2rnM) in the absence of F-2.6-P2. Both nucleotides serve as a substrate for PFK, but GTP does not bind well to the regulatory site. (This is of little consequence in vivo because the level of GTP is much lower than that of ATP.) The GTP curve was calculated using the same constants as those used for ATP except that K , , was set to 0.5.
these provided the first clue that PFK possesses two types of NTP sites, namely the catalytic site, which ac- cepts a variety of phosphoryl donors including ATP and GTP. and a regulatory site, which is highly specific for ATP.
The 1 1 versus [ATP] plots at a typical intracellular level of F-6-P (0.07 mM) are shown in Fig. 3a. Note that at the normal level of ATP found in liver (ca. 2.5 mM), there is almost no enzyme activity in the absence of the allosteric activator, F-2,6-P2. But as the concentration of F-2,6-P2 is increased, the peak velocity moves to higher values and to higher MgATP concentrations, eventually disappear- ing. At a saturating level of F-2,6-P2, the u versus [ATP] plots will be hyperbolic. Thus the activator overcomes the substrate inhibition exerted by ATP. Essentially, F- 2,6-P2 acts by driving the enzyme to the R state whose allosteric inhibitor site has no affinity for ATP. The family of curves shown in Fig. 3a illustrates how changes in the intracellular levels of ATP and F-2,6-P2 can influ- ence the F-6-PeF-1,6-P2 cycle in liver. For example, consider a cell optimally poised at 2.5mM ATP and 0.5pM F-2,6-P2. We see that if the cellular ATP level should fall at constant F-2,6-P2, the activity of PFK would increase, thereby increasing the glycolysis rate so that the optimal level of ATP can be restored. On the other hand, if the cellular level of ATP were to increase, PFK activity would decrease thereby decreasing the net glycolysis rate until cellular ATP returned to its optimum (lower) level. A decrease in the cellular level of F-2,6-P2 from 0.5 to 0.2 pM, for example, at constant [ATP] (such as might occur under the influence of glucagon), results in
a marked decrease in the activity of PFK. This is exactly the desired response under physiological conditions that are conducive to gluconeogenesis, rather than glycolysis (e.g., low blood glucose). (F-2,6-P2 is a potent inhibitor of FBPase. Consequently, a decrease in the level of this effector not only reduces the activity of PFK, but also results in an increase in the activity of FBPase.)
In Fig. 3b is shown a screen from the Authorware module for PFK, with input concentrations similar to those used in Fig. 3a and the same kinetic mode1,for the enzyme. The student can save the data to a file and copy it into a word processor or spreadsheet.
In the absence of an allosteric activator, the u versus [F-6-P] plots are sigmoidal (Fig. 4). Again, we can see that at a physiological level of F-6-P there is almost no enzyme activity at 2.5 mM ATP. But F-2,6-P2 activates the enzyme markedly. As the concentration of F-2,6-P2 is increased, the plots become less sigmoidal (i.e., the en- zyme becomes less cooperative) and the [F-6-P]o.s (the concentration of F-6-P required for half-maximal activ- ity) decreases. For example, at zero F-2, 6-P2 , the Hill coefficient, n H , is 3.9 and [F-6-P]o.5 is about 5mM. At 1 pM F-2,6-P2, nH is 1.1 and [F-6-P]o.5 is decreased to about 0.1 mM, a physiological concentration. At a sat- urating level of F-2,6-P2, the plot will be hyperbolic
The family of versus [F-6-P] plots at different fixed concentrations of ATP and zero F-l,6-P2 is shown in Fig. 5. The pattern resembles that reported for the enzyme from liver [18] and yeast [23] in the region of pH 7. That is, over the range 0.5-5mM ATP, Vmax,app shows little variation while [F-6-P]o.s ranges from about 1mM at 0.5mM ATP to about lOmM at 5 mM ATP. The family of u versus [F-2,6-P2] plots will look similar (because the velocity equation was derived assuming that F-2,6-P2, like F-6-P, binds exclusively to the R state).
The simplified model can also be used to explore the interaction of two or more allosteric effectors (e.g., F-2,6- P2 and AMP). The modifications made to the velocity equation (and the spreadsheet) depend on the assump- tioris made about the binding preferences of the multiple effectors. For example, if AMP (Y) is assumed to behave as a typical allosteric activator that binds exclusively to a specific R state effector site, an additional factor of (1 + [Y]/KYR))l is included in denoml Eq. (2):
(nH = 1.0).
denoml
(1 +g)ll +e) 4
= L (1 +E)~(~ +34’ (3)
On the other hand, if it is assumed that AMP binds to the allosteric ATP inhibitor site on both the R and T states (competing with ATP in the T state), denom, will be

H. Roy et al. 1 Biochemistry and Molecular Biology Education 29 (2001) 3-9
50 [F+P]= 0.07 mM
F6P.07 F Z 6 B P - . 5 K i a P . 0 6 ml.1 KxR= .02 KRT- .05 t=10 vmax-lou
- m * m R.2
Glossmy I I I 1 I I I 3 1 ATP,mM ' 3
l Help , -- Trybiemnt ~raluwforthsfo~owing:
OJI pEmq-w--pla p = m q ~ m I ~ ~ ~ - 0
@ C n Ic ul s! o r
Save (b)
Fig 3. (a) Calculated velocity curves for varied [ATP] at a physiological level of F - 6 9 and different fixed concentrations of F-2,6-P2. (b) Screenshot of Authorwxe module showing the plot at 0.5pM F-2,6-P2.
given by physiological states, but a range of 0.15-0.65 mM has been reported for rat liver [15-171.) Because of the as- sumption that AMP binds equally well to both the R and
K A T K Y T KllZT T states, the nucleotide is not a very potent activator. But its "deinhibitor" action clearly augments the activation at subsaturating F-2, 6-P2 levels.
+M +N)4(1 +"'>' (I +E)"(I +g)
The competitive-with-ATP scenario is depicted in Fig. 6 where the results are plotted as the effect of increasing [AMP] on the reaction velocity at physiological concen- trations of substrates and different fixed concentrations of F-2,6-P2. (The intracellular concentration of AMP varies widely among different tissues and in different
14) denom, = L 4 .
7. Variations on the theme
In contrast to liver PFK, the muscle enzyme is believed to bind the two substrates in a random fashion [l]. If it is assumed that the R and T states display the same binding

8 H. Roy et al. 1 Biochernisriy and Molecular Biology Education 29 (2001) 3-9
prefercnces as described for the ordered mechanism, the equation for the rapid equilibrium random mechanism will contain an additional [B]/Kib term corresponding to the R state EB (E. F-6-P) complex [8]. In the form of Eq. (2), the velocity will be given by
Kma does not appear in the equation, but it must be equal to K m b K i a / K : b . If it is assumed that the binding of one of the substrates at a catalytic site has no effect on the binding of the other at that site [1,24], then K m b will equal K i b (and Kma = K i a ) and the equation can be
U =
100
80
60 v
40
2c
0
I/,,, ""'( 1 + K,, CAI + K i a Kmb
4
+ ( l
(1 +g)ll +e) L
2 4 6 8 10 [F-6-P] (mM)
Fig. 4. Calculated velocity curves for varied [F-6-P] at a physiological level of ATP and different fixed concentrations of F-2,6-P2. The Hill coefficicnt, nH, reflects the degree of sigmoidicity of the curve [5]. nH was determined by fitting the curve to the Hill equation using DeltaGrxph 4.05~. The apparent V,,, at saturating [F-6-P] is the same (98 Units) for all concentrations of F-2,6-P2.
r
v
[ATP] = 2.5 mM [F-6-P1= 0.07 mM
0.00 0.05 0.10 0.15 0.20 0.25 [AMPI (mM)
Fig. 6. Calculated velocity curve for varied [AMP] at different fixed concentrations of.F-2,6-P2 and physiological levels of ATP (2.5 mM) and F-6-P (0.07 mM). AMP is assumed to compete with ATP for the T state allosteric inhibitor site and also to bind to the R state allosteric inhibitor site with the same affinity ( K Y R = K Y T = 0.05 mM). The cal- culations require that additional columns for Y, K Y R , and K y T be included in the spreadsheet.
100
v
[F-2,&P2] = 0
0 2 4 6 8 10 12 14 16 [F-6-P] (mM)
Fig. 5. Calculated velocity curves for varied [F-6-P] at different fixed concentrations of ATP in the absence of F-2,6-P2.
H. R0.v et a/ . 1 Biochemistry and Molecular Biology Education 29 (2001) 3-9 9
factored to
u =
other allosteric enzymes. In general, simulation is a useful teaching tool because it allows students to observe kin- etic responses beyond those chosen by authors to illus- trate their articles and texts. Simulation could become a standard component of courses in biochemistry or enzymolgy at institutions where all students have access to a desktop computer.
Acknowledgements
(6) The following constants provide a good starting point for simulations of the random mechanism: Kid = 0.06mM,
K A T = 0.15mM, n = 4, L = 1000, and Vmax = 100. Simulations where Kmb is about 5 times greater than Kib (as reported for the muscle enzyme) should also be tried [l]. The same spreadsheets can be used for the ordered and the random mechanisms. All that need be done is to include a column for K & and modify the numz and denom, terms accordingly. When simulating the ordered mechanism, a very large value for K i b , (e.g., 1E5) can be entered thereby making the [B]/Kib term negligible.
If ATP does not bind to the T .state catalytic site, denom, will be somewhat simpler for both the ordered and random mechanisms:
Kib = 0.09 mM, Kmb = 0.09 mM, K X R = 0.02 PM,
(1 +g)4 (1 +2)4. denom, = L (7)
Students can compare plots generated using the simpler equation with those obtained using Eqs. (2), (5 ) , or (61, or reported in the literature. Can the simpler model describe all of the observed kinetic features?
Eq. (1) was derived assuming that ATP must bind before F-6-P. This is consistent with the observation that the u versus [F-6-P] plots for rat liver PFK approach a common I/,,, at all [ATP] [18]. However, a different report indicated that the binding order is F-6-P before ATP, at least at pH 8 [25]. What effect would the opposite order have on the properties of the velocity curves? Would it still be possible to obtain a family of u versus [F-6-P] curves in which the apparent V,,, is essentially constant over a wide range of fixed [ATP]? The reverse order can be simulated by switching the identities of A and B and modifying the velocity equation and spreadsheet accordingly.
8. Concluding remark
Although this article has focused on PFK, the same approach can be used to explore the kinetic properties of
Preparation of the material described in this article was supported in part by Grants MCB-9904003 and DUE-9752343 from the National Science Foundation. The Authorware modules can be found at the Web Site http://www.rpi.edu/dept/bio/info/BiochemModules/ Launcher.htm1
References
D.W. Pettigrew, C. Frieden, J. Biol. Chem. 254 (6) (1979)
I.J. MacRae, E. Hanna, J.D. Ho, A.J. Fisher, I.H. Segel. J. Biol. Chem. 275 (46) (2000) 36303-36310. J. Monod, J. Wyman, J.-P. Changeux, J. Mol. Biol. 12 (1965)
M.M. Rubin, J.-P. Changeux, J. Mol. Biol. 21 (1966) 265-274. D. Voet, J.G. Voet, Biochemistry, 2nd Edition, Wiley, New York,
R.H. Garrett, C. M. Grisham, Biochemistry, 2nd Edition, Saun- ders/Harcourt Brace College Publishers, New York, 1999, pp.
I.H. Segel, Biochemical Calculations, 2nd Edition, Wiley, New York, 1976, pp. 215-216, 312-315. I.H. Segel, Enzyme Kipetics: Behavior and Analysis of Rapid Equilibrium and Steady -State Enzyme Systems, Wiley Classics Library, Wiley-Interscience, New York, 1993, pp. 421-427. J.M. Wilson, Phys. Teacher 32 (1994) 518-523. R.B. Pipes, J.M. Wilson, Technol. SOC. 18 (1996) 387-401. www.rpi.edu/dept/bio/Biosimlab/genetics.html. J.J. Diwan, J.T. Warden, FASEB J. 12 (1998) A1335 www.pkal.org/curricuI/biochem/macalester/sessvia.html www.rpi.edu/dept/bcbp/molbiochem/MBWeb/mbl/MBlindex. html
1896- 190 1.
88-118.
1995, pp. 242-245.
469-473.
[ l S l D.A. Hems, J.T. Brosnman, Biochem. J. 120 (1970) 105-111. [16] A.L. Greenbaum, K.A. Gumaa, P. McLean. Arch. Biochem. Bi-
[I71 R.L. Veech, J.W.R. Lawson, N.W. Cornell, H.A. Krebs, J. Biol.
[IS] G.D. Reinhart, H.A. Lardy, Biochemistry 19 (7) (1980) 1477-1484. [19] K. Uyeda, E. Furuya, L.J. Luby, J. Biol. Chem. 256 (16) (1981)
[20] E. Van Schaftingen, M.-F. Jett, L. Hue, H.-G. Hers, Proc. Natl.
1211 T.H. Claus, J.R. Schlumpf, M.R. El-Maghrabi, S.J. Pilkis, J. Biol.
[22] S. Kitajima, K. Uyeda, J. Biol. Chem. 258 (12) (1983) 7352-7357. [23] R. Reuter, K. Eschrich, W. Schellenberger, E. Hofmann, Acta
[24] A.R. Goldhammer, G.G. Hammes, Biochemistry 17 (10) (1978)
[25] I.A. Brand, H.D. Soling, J. Biol. Chem. 249 (24) (1974) 7824-7831.
ophys. 143 (1971) 617-663.
Chem. 254 (14) (1979) 6538-6547.
8394-8399.
Acad. Sci. USA 78 (6) (1981) 3483-3486.
Chem. 257 (13) (1982) 7541-7548.
Biol. Med. Germanica 38 (8) (1979) 1067-1079.
1818-1822.