articles in press. j neurophysiol (june 10, 2015)....
TRANSCRIPT

LINKING EXPRESS SACCADE OCCURANCE TO STIMULUS PROPERTIES 1 AND SENSORIMOTOR INTEGRATION IN THE SUPERIOR COLLICULUS 2
3 Robert A. Marino1,5, Ron Levy1,4,5, Douglas P. Munoz1,2,3,4 4
5 6
1Centre for Neuroscience Studies, Queen’s University, Kingston, Ontario, 7 Canada, K7L 3N6. 8 2Department of Biomedical and Molecular Science, 3Psychology, 4Medicine, 9 Queen’s University, Kingston, Ontario, Canada, K7L 3N6. 10 5Department of Surgery, Kingston General Hospital, Kingston, Ontario, Canada, 11 K7L 2V7. 12 13 14 Running Head: Target Luminance Modulates Express Saccades 15 16 Key Words: eye movement, reaction time, automatic saccades, sensorimotor integration, 17
stimulus intensity, express saccade model, visual response, buildup neuron 18 19 Manuscript: 20 Figures: 8 21 Abstract: 379 words 22 Introduction: 994 words 23 Methods: 2137 words 24 Results: 1973 words 25 Discussion: 2245 words 26 27 Address Correspondence: 28 Robert A. Marino, 29 Centre for Neuroscience Studies, 30 Queen’s University, 31 Kingston, Ontario, Canada 32 K7L 3N6 33 34 Corresponding Author: 35 Phone: (613) 533-6000 x78850, Fax: (613) 533-6840 36 Email: [email protected] 37 38 39 Acknowledgements 40 We thank Ann Lablans, Mike Lewis, and Sean Hickman for outstanding technical 41 assistance. We also thank members of the Munoz lab for their comments on earlier 42 versions of the manuscript. This work was funded by a research grant from the Canadian 43 Institutes of Health Research (# MOP-77734). RAM was supported by graduate 44 fellowships from Queen’s University and DPM was supported by the Canada Research 45 Chair Program. 46
47
Articles in PresS. J Neurophysiol (June 10, 2015). doi:10.1152/jn.00047.2015
Copyright © 2015 by the American Physiological Society.

Marino et al. - 2
ABSTRACT 48 49
Express saccades represent the fastest possible eye movements to visual targets 50
with reaction times that approach minimum sensory-motor conduction delays. Previous 51
work in monkeys has identified two specific neural signals in the superior colliculus (SC: 52
a midbrain sensorimotor integration structure involved in gaze control) that are required 53
to execute express saccades: 1) pre-visual activity consisting of a low frequency increase 54
in action potentials in sensory-motor neurons immediately prior to the arrival of a visual 55
response; and 2) a transient visual-sensory response consisting of a high frequency burst 56
of action potentials in visually responsive neurons resulting from the appearance of a 57
visual target stimulus. In order to better understand how these two neural signals interact 58
to produce express saccades, we manipulated the arrival time and magnitude of visual 59
responses in the SC by altering target luminance and we examined the corresponding 60
influences on SC activity and express saccade generation. We recorded from saccade 61
neurons with visual, motor and pre-visual related activity in the SC of monkeys 62
performing the gap saccade task while target luminance was systematically varied 63
between 0.001 cd/m2 and 42.5 cd/m2 against a black background (~0.0001 cd/m2). Our 64
results demonstrated that: 1) express saccade latencies were linked directly to the arrival 65
time in the SC of visual responses produced by abruptly appearing visual stimuli; 2) 66
express saccades were generated toward both dim and bright targets whenever sufficient 67
pre-visual activity was present; and 3) target luminance altered the likelihood of 68
producing an express saccade. When an express saccade was generated, visuomotor 69
neurons increased their activity immediately prior to the arrival of the visual response in 70
the SC and saccade initiation. Furthermore, the visual and motor responses of visuomotor 71

Marino et al. - 3
neurons merged into a single burst of action potentials, while the visual response of 72
visual only neurons was unaffected. A linear combination model was used to test which 73
SC signals best predicted the likelihood of producing an express saccade. In addition to 74
visual response magnitude and pre-visual activity of saccade neurons, the model 75
identified pre-saccadic activity (activity occurring during the 30ms epoch immediately 76
prior to saccade initiation) as a third important signal for predicting express saccades. We 77
conclude that express saccades can be predicted by visual, pre-visual and pre-saccadic 78
signals recorded from visuomotor neurons in the intermediate layers of the SC. 79
80
81
Marino et al. - 4
INTRODUCTION 82
Express saccades reflect the fastest visually triggered saccadic eye movements in 83
primates with latencies that approach the minimum efferent and afferent conduction 84
delays between the retina and the extra-ocular muscles (Fischer and Boch 1983; Fischer 85
and Weber 1993; Paré and Munoz 1996; Dorris et al. 1997). Here, the neural processing 86
times that would otherwise be necessary to make higher order decisions about the 87
meaning of stimuli or how to respond to them are bypassed. Thus, express saccades 88
represent a "visual grasp reflex" (Hess et al. 1946) whereby abruptly appearing visual 89
stimuli are directly transformed into saccadic motor commands to move the eyes toward 90
them (Edelman and Keller 1996; Dorris et al. 1997; Sparks et al. 2000). 91
The superior colliculus (SC) is an oculomotor control structure in the midbrain 92
that integrates sensory, motor, and cognitive signals related to visual orienting (Hall and 93
Moschovakis 2003; Gandhi and Katnani 2011; White and Munoz 2011; Krauzlis et al. 94
2013). The SC is an ideal candidate for directly translating visual to motor activity during 95
express saccades because it receives early visual input via the retino-tectal and retino-96
geniculo-cortico-tectal pathways (Fries 1984; Cusick 1988; Robinson and McClurkin 97
1989; Lock et al. 2003) and visuomotor neurons in the intermediate layers (SCi) project 98
directly to the saccadic brainstem burst generator to drive saccades (Rodgers et al. 2006). 99
Furthermore, the SC is critical in the generation of express saccades because when it is 100
lesioned, express saccades are abolished (Schiller et al. 1987). 101
Visual neurons that lack saccade responses are believed to reside in the superficial 102
SC (SCs) and reflect visual signals at an earlier stage of sensorimotor processing relative 103
to visuomotor neurons in the SCi (Boehnke and Munoz 2008). Because these visual only 104

Marino et al. - 5
neurons do not exhibit motor activity, a change in their visual response between regular 105
and express saccades would indicate that express saccades are influenced at an early 106
stage of visual processing. Because neural correlates with express saccades have only 107
been reported in neurons with motor related activity in the SCi (Dorris and Munoz 1995; 108
Edelman and Keller 1996; Dorris et al. 1997; Sparks et al. 2000), we hypothesize that 109
express saccades are triggered at a later stage of sensorimotor integration that is closer to 110
the motor output. Consequently, the visual response in visual only SC neurons should be 111
unaffected across regular and express saccades. 112
Historically, express saccades have been defined using behavioral criteria; 113
specifically, the presence of multiple modes within a distribution of saccade latencies 114
(Fischer and Boch 1983; Fischer and Ramsperger 1984). However, more recently it was 115
suggested that this definition is incomplete and that an expanded definition links express 116
saccades to the temporal occurrence of visual responses in the SCi (Edelman and Keller 117
1996; Dorris and Munoz 1998; Sparks et al. 2000). Regular latency saccades have longer 118
latencies than express saccades. During a visually-triggered regular latency saccade, high 119
frequency bursts of action potentials related to visual target appearance and saccade onset 120
can be observed as temporally separate events on SCi visuomotor neurons (Fig. 1; blue 121
traces). However, during an express saccade, these visual and motor responses temporally 122
merge (Edelman and Keller 1996; Dorris et al. 1997; Dorris and Munoz 1998; Sparks et 123
al. 2000), to produce a single burst of action potentials. This merged response is often of 124
higher frequency than the distinct and temporally separate visual and motor responses 125
that are observed during regular latency saccades (Fig. 1; red traces). Because the motor 126
response that drives an express saccade is time locked to the visual response (Edelman 127

Marino et al. - 6
and Keller 1996; Dorris and Munoz 1998; Sparks et al. 2000), which correspondingly 128
changes with stimulus luminance (Bell et al. 2006; Li and Basso 2008; Marino et al. 129
2012a; Tanaka et al. 2013), we hypothesize that express saccade latencies are not fixed to 130
a specific temporal range, but are instead dependent on stimulus specific visual response 131
onset latencies in the SCi. 132
Increases in low frequency (<100 Hz) SCi activity prior to the appearance of a 133
visual target also influences express saccade generation (Dorris et al. 1997; Dorris and 134
Munoz 1998). This pre-visual activity (Fig. 1; red traces) increases relative to the amount 135
of predictive foreknowledge of where or when a visual target will appear (Dorris and 136
Munoz 1998; Basso and Wurtz 1998) and has been shown to correlate with increased 137
express saccade likelihood (Dorris et al. 1997). These observations have led to the 138
development of a threshold based model for express saccade generation in the SCi (Fig. 139
1B). In this model, an express saccade is generated when a visual response is 140
significantly large enough to cross a neural trigger threshold and initiate a visually guided 141
saccade (Edelman and Keller 1996; Dorris and Munoz 1998). When added to pre-visual 142
activity, the peak of the visual response is increased, thereby making it even more likely 143
to cross threshold and trigger an express saccade. Without sufficient pre-visual activity, 144
it is less likely that a visual response in isolation would be strong enough to cross this 145
saccade threshold (Dorris et al. 1997; Dorris and Munoz 1998). Based on this hypothesis, 146
both the magnitude of the visual response and the amount of accumulated pre-visual 147
activity should combine to determine whether an express saccade is triggered. 148
Here, we examine this hypothesis by testing how changes to the magnitude and 149
timing of the visual response and the amount of accumulated buildup activity interact to 150

Marino et al. - 7
influence express saccade production. This was accomplished by systematically 151
manipulating target luminance in a gap task that facilitates express saccade generation. 152
Because altered target luminance modulates the onset latency of visual responses (Gawne 153
2000; Bell et al. 2006; Lee et al. 2007; Li and Basso 2008; Marino et al. 2012a; Tanaka et 154
al. 2013), the amount of time available for pre-visual activity to accumulate also changes. 155
We hypothesize that express saccades can still be performed toward dim targets because 156
weaker visual responses can be compensated for by increased pre-visual activity that 157
continues to accumulate in the gap task when the visual response is delayed. 158
159
METHODS 160
Animal preparation 161
All animal care and experimental procedures were in accordance with the 162
Canadian Council on Animal Care policies on use of laboratory animals and approved by 163
Queen’s University Animal Care Committee. Three adult male monkeys (Macaca 164
mulatta 5-7 yrs, 8-12 Kg) were trained to perform several oculomotor tasks. Data from 2 165
out of 3 of the monkeys has been published previously (Marino et al. 2012a).The surgical 166
techniques required to prepare animals for neuronal and eye movement recordings in our 167
laboratory have been described previously (Marino et al. 2008). In brief, all animals 168
underwent surgery under aseptic conditions for the insertion of eye coils, a stainless steel 169
head holder, and a recording chamber that was mounted on the skull using stainless steel 170
bone screws and dental acrylic. The recording chamber was oriented towards the SC at an 171
angle of 38° posterior of vertical in the mid-sagittal plane. Monkeys were given at least 4 172
weeks to recover prior to resuming of behavioral training. 173

Marino et al. - 8
174
Experimental tasks and behavioral stimuli 175
All behavioral tasks, data collection and recording techniques have been 176
described previously (Marino et al. 2012a). Monkeys were seated in a primate chair with 177
their heads restrained for the duration of an experiment (1-3 hours). They faced a display 178
cathode ray tube monitor that provided an unobstructed view of the central visual area 179
50° x 60°. Extracellular recording was performed with tungsten microelectrodes (0.5-5 180
MΩ impedance, Frederick Haer) inserted through guide tubes (23 gauge) that were 181
anchored in delrin grids (Crist et al., 1988). Electrodes were advanced with a hydraulic 182
microdrive (Narishege M095) into the SC where we proceeded to isolate single neurons. 183
The monkeys were required to perform two blocked visually-guided saccade tasks 184
(Fig. 2A,B). Each trial required the monkeys to generate a single saccade from the 185
central fixation point (FP) to a peripheral visual target (T). At the start of each trial, the 186
screen turned black and after a period of 250 ms a circular grayscale FP of constant 187
luminance (0.25° diameter spot, 3.5cd/m2) appeared at the center of the screen against a 188
black background (~0.0001 cd/m2). Fixation of the FP was required for a variable period 189
(500 - 800 ms) until either a small circular 0.25º grayscale T appeared (delay task), or the 190
FP was extinguished (gap task). During the inter-trial interval (800-1500 ms duration), 191
the display screen was diffusely illuminated(0.5 cd/m2) . 192
The delay task (Fig. 2A) was used to isolate and classify the visual and motor 193
response of each neuron. The delay period in this task temporally separated neural 194
activity that was related to the appearance of a visual target and the saccadic motor 195
response. In this task, the monkeys were required to continue fixating the FP for an 196
Marino et al. - 9
additional 500-800 ms after T appearance. Only after FP disappearance was the monkey 197
allowed to initiate a saccade to the T. 198
The gap task (Fig. 2B) was used to elicit pre-visual activity in the SC, reduce 199
SRT, and facilitate the production of express saccades. (Edelman and Keller 1996; Dorris 200
et al. 1997; Dorris and Munoz 1998; Sparks et al. 2000). In this task, monkeys were 201
required to make a saccade to the visual target immediately after its appearance. A 200 202
ms period of darkness (gap) was inserted into each trial between FP disappearance and T 203
appearance (Saslow 1967), which reduced SRT and facilitated generation of express 204
saccades (Fischer and Boch 1983; Fischer 1986; Fischer and Weber 1993). The 200ms 205
gap period imposes temporal predictability that may serve to shape the pre-saccadic 206
activity. During this gap period, the monkey was required to continue fixating the 207
location of the extinguished FP until the T appeared either in or opposite to the location 208
of each neuron's peak visual response field (RF). Response fields were mapped online 209
and targets were placed at the target location that yielded the greatest visual and/or motor 210
response (Marino et al. 2008). The monkeys were required to initiate a saccade to the T 211
within 1000ms of its appearance. 212
FP luminance was held constant at 3.5 cd/m2 and seven distinct target luminance 213
levels (0.001 cd/m2, 0.005 cd/m2, 0.044 cd/m2, 0.4 cd/m2, 3.5 cd/m2, 17.5 cd/m2, and 42.5 214
cd/m2) were randomly interleaved within each block of trials. Luminance was measured 215
with an optometer (UDT instruments, model S471) that was positioned directly against 216
the screen of the monitor and centered on the stimulus. After each correct trial the 217
monkey was rewarded with fruit juice or water. 10 to 20 correct trials per luminance 218

Marino et al. - 10
condition were recorded in the gap task and 6 to 10 trials per luminance condition were 219
recorded in the delay task. 220
221
Neuron Analysis and Classification 222
Trains of action potentials (averaged across all correct saccade trials to the same 223
target location) were convolved into spike density functions for each neuron using either 224
a Poisson kernal (growth constant = 1ms, decay constant = 20ms) (Thompson et al. 225
1996) or a Gaussian kernel (σ = 5ms) for each spike. A Poisson kernel was used to 226
calculate response onset times and pre-visual activity because it only implemented 227
temporal smoothing after each spike while the Gaussian kernel was used to calculate 228
peak responses because it calculated a balanced average of neural activity. Spike density 229
functions were aligned on target appearance in order to analyze visual responses and pre-230
visual activity, and aligned on saccade onset when analyzing motor responses. 231
Neurons were classified based on their visual- or saccade-related responses in the 232
delay task when the T was placed at the peak location within their RF. Visual and 233
saccade related activity was classified relative to two specific baseline epoch periods 234
(Fig. 2A). Visual baseline activity was calculated as the average discharge from all 235
correct trials during the last 100 ms of active fixation of the FP prior to T appearance. 236
Saccade baseline activity was calculated from the average discharge from all correct trials 237
100-50ms prior to the onset of the saccade (Fig. 2A). A visual response was classified 238
based on an increase of target aligned activity (Gaussian kernel) greater than 50 spikes/s 239
above the visual baseline and significant by a non-parametric Rank Sum test (p <0.05) 240

Marino et al. - 11
during the visual epoch (50-150ms after target appearance but prior to the saccade 241
epoch). A motor response (Gaussian kernel) was classified based on an increase activity 242
in the saccade epoch (+/- 10 ms around the onset of the saccade) that was greater than 50 243
spikes/s above both the visual and saccade baselines and significant by a non-parametric 244
Rank Sum test (p <0.05). Saccade activity was required to exceed the saccade baseline (in 245
addition to the visual baseline) in order to ensure that any sustained tonic visual activity 246
related to the continued presence of the target in the delay task would not be misclassified 247
as motor related saccade activity. Based on these criteria we analyzed 46 visual only 248
(VONLY), 94 visual-motor (VM), and 6 motor only (MONLY) neurons across 3 monkeys. 249
A subset of the saccade-related neurons (VM and M) were further sub-classified 250
as buildup neurons based on whether or not they exhibited significant pre-visual activity 251
in the gap task after the disappearance of the FP but prior to the arrival of the visual 252
response in the SC (Munoz and Wurtz 1995). Neurons with buildup activity were 253
classified based on a significant increase in activity during the pre-visual epoch (10 to 40 254
ms after T appearance) relative to the visual baseline epoch (last 100ms of active fixation 255
prior to FP disappearance) (Fig. 2B). This ensured that buildup activity was measured 256
prior to the arrival of the target-related visual response in the SC (Marino et al. 2012a). 257
Significant buildup activity required that the activity in the pre-visual epoch be at least 258
15 spikes/s greater than the activity in the visual baseline epoch and significant by a non-259
parametric Rank Sum test (p <0.05). Based on these criteria, 31 of 94 VM neurons 260
exhibited buildup activity, all of the MONLY neurons (6 of 6) exhibited buildup activity, 261
and none of the VONLY neurons (0 of 46) exhibited significant buildup activity. Mean 262
population activity was calculated from the unnormalized spike density functions from all 263

Marino et al. - 12
neurons within the same classification group. Each neuron contributed a single trial-264
averaged spike density function per condition and was weighted equally within the 265
calculated mean population activity. 266
267
Behavioral Analyses 268
Data were analyzed offline with custom Matlab (Matlab 7.4, Mathworks Inc) 269
software. The start and end of saccades were determined automatically from velocity and 270
acceleration criteria and then verified offline by the experimenter. To determine the 271
shortest SRT for visually-driven saccades, we compared the binned (5ms) SRT 272
distributions for correct (towards target) and direction error (opposite target) saccades in 273
the two target gap task. The shortest visually driven SRT latency was determined at each 274
target luminance as the earliest latency when correct saccades significantly outnumbered 275
direction errors (for details see Marino and Munoz 2009; Marino et al. 2012a). 276
Behavioral saccade data from monkey 3 was excluded from analysis due to the small 277
number of express saccades performed (mean 4.9% +/- 0.8% collapsed across luminance 278
conditions). All mean values reported also include the standard error of the mean unless 279
stated otherwise. 280
281
Neuron Analyses 282
The timing (visual response onset latency: VROL) and peak magnitude of the 283
initial phasic burst of the visual response were calculated at each target luminance level 284
in relation to express saccades for all neurons that had a significant visual response. 285
VROL was determined (relative to the time the target appeared) from target aligned spike 286

Marino et al. - 13
density functions (Poisson kernel) at each target luminance for each neuron. VROL was 287
defined as the onset of stable (at least 20ms) statistical significance (p<0.05) between the 288
mean activity during the visual baseline and a moving temporal window (1 ms resolution, 289
1ms increment) within the visual epoch (non-parametric Rank Sum test) (Fig. 2A). 290
Because VROL changed with target luminance, anticipatory saccade (saccades with 291
SRTs less than the luminance specific afferent visual delays) cut-off times were 292
calculated separately at each luminance specific VROL (for details see Marino et al. 293
2012). 294
The effect of luminance on the accumulated amount of buildup activity was 295
determined from the combined population of VM and MONLY neurons that exhibited 296
significant build-up activity. This parameter was calculated from the summated area 297
under the curve of the target-aligned spike density function from target appearance until 298
10 ms prior to the mean luminance specific VROL (VROL occurred earlier with 299
increasing luminance) in the gap task. Both the VROL and accumulated buildup were 300
calculated using the Poisson function instead of a Gaussian function to ensure that each 301
luminance specific VROL was not artificially shifted earlier in time. The amounts of 302
accumulated buildup that was calculated at each luminance level were compared to each 303
other using a z test for proportions. All statistical comparisons were calculated with 304
repeated measures ANOVA with post hoc Bonferroni corrected pairwise comparisons 305
unless stated otherwise. All mean values reported also include the standard error of the 306
mean unless stated otherwise. 307
Express saccade ranges were defined independently at each target luminance 308
value from the timing of the corresponding VROL and shortest visually triggered SRTs. 309
Marino et al. - 14
We defined express saccades as visually triggered saccades where the visual response 310
was temporally merged with the motor response within VM neurons in the SCi. Because 311
there was no clear separation between the regular and express saccade latencies at several 312
target luminance levels, we estimated the express saccade range based upon the 313
neurophysiological responses. The mean time difference between the VROL and the 314
shortest SRT bin (Fig. 3B) was 16.02 ms +/- 2.6 ms. Therefore we defined the express 315
saccade range as a 30 ms epoch beginning 15 ms after each luminance specific VROL in 316
the gap task. We chose this conservative 30ms epoch in order to help ensure that only 317
express saccades were included. This estimation of the express saccade range could be 318
subject to error if the regular and express saccade distributions significantly overlap 319
within the first 45ms of each luminance specific VROL. 320
321
Expanded Express Saccade Model 322
It was hypothesized that express saccades are generated when the visual response 323
and buildup activity in the SC sum together to cross a neural threshold and trigger a 324
saccade (Dorris et al. 1997; Dorris and Munoz 1998). In order to test this model, we 325
examined how changes to the combined peak visual response and accumulated buildup 326
activity at each luminance level affected the proportion of express saccades that were 327
produced. Since it is unclear how much of the pre-visual activity is temporally integrated 328
to influence the merged visual and motor response during express saccades, we 329
calculated pre-visual activity from both a long (cumulative buildup calculated from the 330
time of T appearance) and a short (instantaneous buildup calculated from an averaged 331
10ms window ending 10ms before the luminance specific VROL) temporal window. The 332
Marino et al. - 15
individual contributions of the peak visual response and cumulative buildup activity were 333
normalized and the proportion of express saccades produced was modelled as a linear 334
combination of each signal: 335
w1(Vpeak) + w2(BU) = % Express Saccades Produced 336
where w1 and w2 are the strengths of the proportional weights of the normalized visual 337
peak response (Vpeak) and buildup activity (BU). Values of w1 and w2 were calculated 338
that most closely matched the measured proportions of express saccades that were 339
produced at each luminance level. This enabled the model to predict the relative 340
importance of changes to the peak magnitude of the visual response relative to the 341
accumulated buildup activity in influencing the likelihood of producing an express 342
saccade. 343
344
RESULTS 345
Target Luminance Modulated Express Saccade Latency 346
We assessed the links between express saccade latency and neural response 347
latency by examining how the timing of neural visual responses and the shortest visually 348
triggered SRTs co-varied with target luminance. Figure 3A illustrates the effects of a 349
changing target luminance on the underlying SRT distribution and the corresponding 350
visual response in VM neurons. When target luminance was decreased toward detection 351
threshold (top traces), the VROL and peak of the visual response in VM neurons 352
occurred significantly later in time (Fig. 3A, Colored lines), and the earliest time for a 353
visually-triggered saccade (non-anticipatory) also occurred significantly later in time 354
(Fig. 3A, histogram: dotted black lines denote first bin in SRT distribution where 355
Marino et al. - 16
performance exceeds anticipatory chance, Binary sign test p<0.05). Figure 3B 356
summarizes the temporal changes to the visual and earliest SRT response as a function of 357
target luminance calculated from the mean of each recording session. As target 358
luminance increased, VROL and the time of peak visual response decreased. In addition, 359
the onset time of the express epoch also decreased. The mean time between each 360
luminance specific VROL and the earliest visually triggered SRT bin was 16ms +/- 361
2.7ms, whereas the mean time between each luminance specific peak visual response 362
time and earliest triggered SRT bin was -7.5ms +/- 2.8ms (SE). The time difference 363
between the means of the earliest visually-triggered SRT bin and the VROL were 364
significantly different (Bonferroni corrected pair-wise comparisons p > 0.05), except for 365
the 2 dimmest luminance levels (Bonferroni corrected pair-wise comparisons p < 0.05). 366
The time differences between the earliest visually-triggered SRT bin and the peak of the 367
visual response were not significantly different (Bonferroni corrected pair-wise 368
comparisons p > 0.05) at all but the 2 dimmest luminance levels (Bonferroni corrected 369
pair-wise comparisons p < 0.05). This suggests that at all but the dimmest target 370
luminance levels, a visually triggered saccade was not launched until the visual response 371
approached its peak level. The timing of both the neural visual response and fastest 372
visually triggered SRT co-varied with target luminance, suggesting that the 373
corresponding express saccade ranges were not fixed but instead varied systematically 374
with target luminance. The maximum difference between the fastest and slowest mean 375
VROL, time of peak visual response, and earliest visually triggered SRT was VROL: 376
90.6ms +/- 2.6 (SE); Peak Time: 92.4ms +/- 2.8ms (SE); SRT: 80 ms (Fig. 3A, difference 377
of bins), indicating that express saccade ranges were altered by more than 80ms across 378
Marino et al. - 17
the luminance ranges employed here. Furthermore, VROL was linearly related to and 379
highly correlated with both the peak time of the visual response (Fig. 3C; gray line: slope 380
= 1.05, r = 0.996, p<0.05) and the earliest SRT response time (Fig. 3C; black line: slope 381
= 0.93, r = 0.995, p<0.05). 382
383
Target Luminance Modulated the Likelihood of Producing an Express Saccade 384
In order to determine how target luminance modulated the likelihood of 385
producing an express saccade, we calculated the proportion of express saccades produced 386
within the 30 ms express saccade epoch (as determined by the timing of the VROL and 387
time of the earliest visually triggered SRT bin; See Methods). Figure 3D (gray line) 388
illustrates the percent of express saccades produced at each luminance level from the 2 389
monkeys that performed a significant number of express saccades. The curve formed an 390
inverted U-shaped function whereby the percent of express saccades increased from 391
0.001 cd/m2 to 3.5 cd/m2 (z test for proportions z=4.85, p<0.01), and then decreased from 392
3.5 cd/m2 to 42.5cd/m2 (z test for proportions z=6.88, p<0.01). Because our estimate of 393
the express saccade epoch did not account for possible overlap between regular and 394
express saccade distributions, the calculated proportion of express saccades may be 395
overestimated at target luminance levels below 3.5 cd/m2 where the regular and express 396
saccade latency distribution modes are indistinctly separated (Fig. 3A). 397
398
The Visual Responses of VONLY Neurons were Unchanged during Express Saccades 399
Visual neurons that lacked saccade responses are believed to reside in the SCs and 400
reflect earlier stages of visual processing relative to the SCi (Boehnke and Munoz 2008). 401

Marino et al. - 18
The model (Fig. 1) asserts that express saccades are triggered at the sensorimotor 402
integration level of the SCi; however, if express saccades are triggered earlier in the 403
sensory-to-motor transformation, then we would expect the earliest visual only responses 404
to be increased or altered during express saccades. In order to determine whether VONLY 405
signals were altered during the production of express saccades, we compared the VONLY 406
neuron population during express and regular latency saccades with a running t-test (Fig. 407
4). Neural population activity comparing regular and express saccades was calculated 408
separately at each target luminance condition. Neurons were only included within the 409
express saccade comparison population at a given luminance condition if both regular 410
and express saccade trials were elicited. There was no difference in the target aligned 411
population activity from the time of the visual response until more than 100ms after 412
response onset, indicating that the peak and duration of the initial visual response was 413
unchanged (5ms windows, t-test, p>0.05). (Fig. 4A). Furthermore there were no 414
consistent differences between express and regular saccades across the 7 different target 415
luminance conditions. When aligned on saccade onset (Fig. 4B), there was an increase in 416
activity immediately prior to the saccade (due to the visual response) at all luminances 417
above 0.4 cd/m2 (5ms windows, t-test, p<0.05), except the brightest luminance where the 418
statistical significance of this difference dropped (p=0.13). At target luminances of 419
0.044cd/m2 and below, the reduced visual response to the dim stimuli did not contribute 420
enough to separate the activity significantly between regular and express saccades (Fig. 421
4B). Therefore, VONLY neurons in the SCs do not contribute directly to express saccade 422
generation. 423
424

Marino et al. - 19
Merging of Sensory and Motor Responses in VM Neurons During Express Saccades 425
During an express saccade, the visual and motor responses of VM neurons in the 426
SCi merge (Edelman and Keller 1996; Dorris et al. 1997; Sparks et al. 2000). In order to 427
examine how merged visuomotor responses differed from temporally separated visual 428
responses during regular-latency saccades, we compared the visual and motor responses 429
of VM neurons during express and regular-latency saccades using a running t-test (Fig. 5, 430
overlapping black asterisks). When aligned to target appearance (Fig. 5A), express 431
saccades were accompanied by increased pre-visual activity as well increased activity 432
immediately after the peak of the visual response. When aligned on saccade onset (Fig. 433
5B), express saccades had increased activity immediately prior to saccade initiation at all 434
luminances above 0.044 cd/m2. 435
436
Target Luminance Impacts Peak Visual Response and Accumulated Buildup 437
Activity 438
Increases in both buildup activity (Dorris et al. 1997; Dorris and Munoz 1998) 439
and visual response magnitude (Marino et al. 2012a) in SCi neurons correlate with SRT 440
and express saccade production. However, a reciprocal relationship may exist whereby 441
the delayed onset of visual responses to dimmer stimuli may allow additional time for 442
pre-visual activity to accumulate. Such a reciprocal relationship could influence the 443
likelihood of crossing the saccade threshold and generating an express saccade. In order 444
to examine this relationship in detail, we calculated the luminance dependant changes to 445
buildup activity and visual response magnitude in the SCi during the gap task. 446

Marino et al. - 20
Figure 6A,C illustrates the effect of target luminance on the magnitude of the 447
visual response. Only VM neurons with no significant buildup activity (N = 63 neurons; 448
See Methods) were used for this calculation to avoid contamination by buildup activity. 449
There was a main effect of luminance on the peak of the visual response (Peak 450
Magnitude: (gap) F(6,654) = 102.9, P < 0.01). As luminance was increased from 0.001 451
cd/m2 to 42.5 cd/m2, the VROL occurred earlier and had a higher peak (Fig. 6A). Figure 452
6C illustrates the mean of the peak visual response at each luminance level for the 63 VM 453
neurons without buildup activity. As luminance increased from 0.001 to 0.4 cd/m2, the 454
mean peak visual response increased (Bonferroni corrected pair-wise comparisons p < 455
0.05). Above 0.4 cd/m2 the trend of the peak visual response increased, however these 456
increases were not significant (p>0.05). 457
Figure 6B,D illustrates the effect of target luminance on buildup activity from the 458
combined population of all VM and MONLY neurons with buildup activity (See Methods). 459
When the onset of the visual response was delayed for dimmer target stimuli, the amount 460
of pre-visual activity increased (Fig. 6B). Figure 6D illustrates the effect of target 461
luminance on pre-visual activity among neurons with buildup activity. Pre-visual activity 462
started to increase during the gap period and continued to increase until the onset of the 463
visual response (Fig. 6B). It is unclear how much of the pre-visual activity is temporally 464
integrated to influence the merged visual and motor response during express saccades. 465
Because of this uncertainty, we calculated pre-visual activity from both a long 466
(cumulative buildup calculated from the time of T appearance) and a short (instantaneous 467
buildup calculated from an averaged 10ms window ending 10ms before the luminance 468
specific VROL) temporal window. As target luminance increased, both the cumulative 469

Marino et al. - 21
and the instantaneous pre-visual activity measures decreased with increasing target 470
luminance (Fig. 6D). 471
472
Predicting Express Saccades From Neural Parameters 473
Previous studies (Dorris et al. 1997; Dorris and Munoz 1998) have suggested that 474
both the visual response and buildup activity combine to influence express saccade 475
generation (Fig. 1). However, it is unclear what the relative influence of these neural 476
parameters is, or whether they alone are sufficient to predict express saccades. In order 477
to address this question, we fit a linear model to the data that calculated a weighted 478
combination of each neural parameter (peak visual response and buildup activity) that 479
best fit the calculated likelihood of producing an express saccade at each of the 7 target 480
luminance levels tested (See Methods). The resulting weightings of the visual peak and 481
accumulated buildup parameters provided evidence as to which signal most strongly 482
influenced express saccade production. 483
Figure 7A illustrates the sum of squares error (SSE) of the best model fits of 484
physiologically derived parameters to the calculated express saccade likelihood at each 485
experimental target luminance level. Both the cumulative (white bars) and instantaneous 486
buildup activity were independently calculated and modelled separately (see methods). 487
We used a bootstrapping method to inform the statistical significance of SSE 488
comparisons. Bootstrapping of the best fits of the express saccade proportions to neural 489
parameters were calculated from a random sampling (with replacement) of the 7 490
experimental luminance levels with 10000 repetitions. The resulting bootstrapped SSEs 491
were normally distributed (Kolmogorov-Smirnov test p < 0.01) and non-overlapping 95% 492

Marino et al. - 22
confidence intervals (CI) were used to determine statistically significant differences. 493
Using this statistical method, when two parameters (peak and build-up) were assessed 494
(Fig. 7A left side), there was a significantly reduced SSE (non-overlapping CI in 495
bootstrapped comparisons) when instantaneous build-up was used compared to 496
cumulative build-up. Overall, the linear combination of the peak visual response and 497
buildup alone could not account well for express saccade likelihood and yielded a high 498
SSE (Fig. 7A left side). This remaining error suggested that additional parameters are 499
required. 500
When express saccades occurred, we observed an increase in activity in all VM 501
and V only neurons immediately prior to (~30ms) saccade onset (Fig. 4B, 5B overlapping 502
black asterisks denote significant differences). This significant increase in activity 503
immediately prior to the saccade was not present when target luminance levels were 504
below 0.4cd/m2, and it decreased in duration at the brightest target luminance level (42.5 505
cd/m2). Because this pattern was consistent with the observed decrease in express 506
saccades at the brightest luminances (Fig. 3D), we added cumulative pre-saccadic 507
activity from VM and V-only neurons (Fig. 4B, 5B) as additional parameters to the 508
model. Cumulative pre-saccadic activity was calculated from the cumulative difference 509
between the saccade aligned activity of V and VM neurons during regular and express 510
saccades. These cumulative differences were only calculated when the activity between 511
regular and express saccades were significantly different (Fig 4B, 5B overlapping black 512
asterisks) over the 30ms temporal window immediately prior to saccade onset. We also 513
examined VROL as an additional physiological parameter in the model to determine 514
whether it improved the model’s ability to predict of express saccade likelihood. 515

Marino et al. - 23
When three parameters were tested (Fig. 7A right side), the addition of pre-516
saccadic activity from VM neurons yielded the lowest SSE and yielded a model fit that 517
was significantly better than VROL or pre-saccadic activity from V-only neurons at 518
predicting express saccades regardless of whether the cumulative (Fig. 7A white bars) or 519
instantaneous build-up (Fig. 7A grey bars) was used (non-overlapping CI in bootstrapped 520
comparisons). The difference in SSE between instantaneous and cumulative build-up was 521
significant in all the two and three parameter model fits with the exception of the lowest 522
error condition where pre-saccadic activity from VM neurons was included (non-523
overlapping CI in bootstrapped comparisons). 524
The modelled best fits resulted in calculated weights for each combination of 525
neural parameters (Fig. 7B). In both the two and three parameter case, instantaneous 526
build-up was weighted higher than cumulative build up. This indicates that build-up 527
activity is most predictive of express saccades then when it is sampled immediately prior 528
to the visual response. When three parameters were modelled (Fig. 7B right panel), the 529
peak visual response and build-up were weighted more strongly than pre-saccadic 530
activity from VM neurons. This suggests that these two parameters still have the 531
strongest influence on whether an express saccade is generated. Figure 7C illustrates the 532
best model fits (grey solid and dashed lines) to the measured express saccade behavior 533
(Fig. 7C black solid line). Only the three parameter model that combines the peak visual 534
response, instantaneous build-up, and pre-saccadic activity is best able to reflect the 535
decreasing trend in express saccades at the highest target luminance levels. 536
537
DISCUSSION 538
Marino et al. - 24
Here, we have shown that the latency and likelihood of producing express 539
saccades was dependent on the properties of the visual stimulus. Specifically, target 540
luminance altered the timing and magnitude of visual responses in the SC. In addition, 541
changes to the timing of the visual response also altered the amount of accumulated 542
buildup activity in the SCi. These modulations to the visual response and buildup activity 543
combined to influence express saccade latency and likelihood. Altered stimulus 544
luminance and contrast has been shown previously to affect retinal transduction times 545
(Lennie 1981; Barbur et al. 1998), as well as the timing and magnitude of visual 546
responses in the SC (Bell et al. 2006; Marino et al. 2012a), lateral intraparietal area 547
(Tanaka et al. 2013), primary visual cortex (Gawne 2000), and V4 (Lee et al. 2007). As a 548
consequence, at dimmer luminance levels (< 0.044 cd/m2) a smaller proportion of express 549
saccades were generated at significantly slower latencies (130-160 ms) and with less 550
bimodality in the underlying distribution than traditionally reported. 551
Based on our observations, we propose an expanded definition for express 552
saccades that does not require bimodality in the underlying SRT distribution and does not 553
involve an absolute latency range. As target luminance decreased, the separation between 554
the regular and express saccade modes within SRT distributions correspondingly 555
decreased until they merged together (below 0.4cd/m2). Because we defined express 556
saccades as being temporally linked to the timing of the visual response in the SCi, and 557
the visual responses were delayed at dimmer luminance levels, we observed express 558
saccades at longer latencies even when no bimodality was evident in the SRT distribution 559
(i.e., at luminance levels below 0.044 cd/m2, Fig. 3A). This result suggests that the 560
neural mechanisms underlying express saccade generation are highly sensitive to external 561

Marino et al. - 25
stimulus properties like luminance. Furthermore, express saccades can only be accurately 562
dissociated from regular saccades when the timing of the visual response in the SCi is 563
known. This issue is especially relevant for clinical behavioral studies of saccades where 564
the specific temporal parameters of the visual response are not usually measured or taken 565
into account when analyzing express or shorter latency saccades (Fischer 1986; Carpenter 566
2001; Munoz et al. 2003; Chan et al. 2005; Dickov and Morrison 2006). 567
568
Influences of Pre-visual Activity on Express Saccades 569
It has been previously shown that the amount of buildup activity in the SCi 570
correlated with saccade latency and that this enhanced discharge strongly predicted when 571
an express saccade will be generated (Dorris et al. 1997). The amount of buildup activity 572
can be modulated by internally-driven factors such as target predictability (Basso and 573
Wurtz 1997; Dorris and Munoz 1998; Basso and Wurtz 1998) and the expected value of 574
saccadic goals (Milstein and Dorris 2007). In our study, pre-visual activity was 575
manipulated by purely sensory mechanisms that delayed when the visual response arrived 576
in the SCi, thus impacting the time available for pre-visual activity to accumulate. We 577
observed a reciprocal relationship between the timing of the visual response and the 578
accumulated amount of buildup activity present in the SCi prior to saccades. Specifically, 579
delayed visual responses to dimmer stimuli resulted in additional time for buildup activity 580
to accumulate. This increased buildup at lower luminance levels likely helped to 581
facilitate the reduced proportion of express saccades that we observed. Without this 582
increased buildup, it is unlikely that the reduced visual response at lower luminance 583
levels would enable any express saccades to be triggered at all. Evidence from a human 584

Marino et al. - 26
express saccade study (Rolfs and Vitu 2007) suggests that saccade metrics are computed 585
before the target is displayed, which further highlights the importance of advanced motor 586
preparation for express saccade production. 587
588
Influences of the Visual Response on Express Saccades 589
Several stimulus-driven factors influence express saccades. For example, when 590
multiple distant visual targets abruptly appear during visual search tasks where an oddball 591
target is presented amongst distractors, express saccades are almost never made (McPeek 592
and Schiller 1994; Weber and Fischer 1994). However, express saccades can be elicited 593
during scanning tasks when multiple stable objects are present, but an abrupt appearance 594
of a single target at an anticipated location is still required (Sommer 1994; Sommer 595
1997). When multiple targets appear abruptly, express saccades tend to only be made if: 596
1) a temporal asynchrony is introduced to the time the targets appear (Schiller et al. 597
2004), or 2) if only 2 targets are presented within close spatial proximity (i.e., within 45° 598
of visual angle from each other) (Edelman and Keller 1996; Edelman and Keller 1998). 599
When visual targets are presented in close proximity, the corresponding activity on the 600
SC sensory-motor map for nearby visual targets will likely overlap (Edelman and Keller 601
1998; Anderson et al. 1998; Marino et al. 2012b) forming a single hill of activity on the 602
SC map rather than multiple competing ones. 603
Here, we have demonstrated that target luminance is an important factor that 604
influences the express saccade generating mechanism by determining when and how 605
often express saccades are made. Luminance also impacts the influence of prediction 606
because changes to the timing of the visual transient allowed more buildup activity to 607

Marino et al. - 27
accumulate and influence saccade generation. This study further extends previous studies 608
whereby Boch and colleagues (Boch et al. 1984) observed a decrease in express saccades 609
with decreasing luminance, and Weber and colleagues (Weber et al. 1991) did not show 610
any effect of luminance contrast on the proportion of express saccades generated. 611
However as we have discussed, without insight into the corresponding modulations to the 612
visual response, it is difficult to interpret their negative result. This highlights the 613
importance of understanding how altered stimulus properties affect the timing and 614
magnitude of visual responses in the SCi before predictions or explanations can be made 615
as to how it impacts saccade performance. 616
617
Express Saccades without SRT Distribution Bimodality 618
Express saccades were first defined by the earliest distinct mode present within a 619
multimodal SRT distribution (Fischer and Boch 1983; Fischer 1986). However, the SRT 620
distributions (Fig. 3A) only demonstrate clear bimodality at the brightest luminance 621
levels employed. This bimodality gradually merged into a single mode when luminance 622
levels decreased toward detection threshold. However, if an express saccade was not 623
defined by bimodality, but instead by the temporal merging of visual and saccade motor 624
responses in the SCi (Fig. 1), then the poorly separated or single modes within the SRT 625
distributions for dimmer luminance levels still contained a proportion of express 626
saccades. 627
When regular and express saccade distributions temporally merge, the extent to 628
which they overlap is unclear. The potential for overlap poses a significant challenge for 629
dissociating between regular and express saccades at both the neural and behavioral level. 630
Marino et al. - 28
In this study, we addressed this problem by characterizing express saccades around a 631
narrow 30ms window that was constrained by afferent sensory response delays in the SC. 632
However, such an approach can only estimate express saccade latencies as it does not 633
account for potentially overlapping regular saccades in the same range. This approach 634
can potentially result in overestimation wherever overlap exists, and may account for the 635
decreases in express saccades below 3.5 cd/m2 that we observed (Fig. 3D). 636
637
Expanding Express Saccade Models 638
Previous models of express saccade generation have hypothesized that an express 639
saccade is generated when the visual response is sufficiently large enough to exceed a 640
neural threshold and generate a saccade (Edelman and Keller 1996). This idea was further 641
developed by Dorris and colleagues (Dorris et al. 1997; Dorris and Munoz 1998) who 642
suggested that it was the combination of both pre-visual activity and the visual response 643
that must cross a neural threshold to trigger the saccade. Based on our results, we 644
propose a further extension of this model (Fig. 8) whereby express saccades generated to 645
high luminance stimuli are more strongly influenced by larger visual responses in the 646
SCi. However, for dimmer stimuli that approach detection thresholds, express saccades 647
have longer SRTs, but can still be generated despite a significantly reduced visual 648
response because of the additional accumulation of buildup activity (Fig. 4, 6B). 649
Although it may at first seem puzzling that the visual responses of 650
VONLY SC neurons are not different during express saccades given that the “visual grasp 651
reflex” (Hess et al. 1946) is believed to bypass higher order cortical decisions and 652
transform visual responses into saccadic commands (Edelman and Keller 1996; Dorris et 653

Marino et al. - 29
al. 1997; Sparks et al. 2000). However, this seemingly counter-intuitive result can be 654
reconciled via a neural gate implemented downstream of the VONLY neurons that could 655
control whether an express saccade is triggered from the visual response. Isa and 656
colleagues have theorized such a neural gate between the visual only superficial and 657
visual-motor intermediate and deeper layers of the SC that controls express saccades (Isa 658
2002; Phongphanphanee et al. 2008). This theory suggests that an express saccade is only 659
triggered when the gate is closed and the visual response is directly propagated from the 660
SCs to the SCi to trigger the saccade (Isa 2002). Our results show that during express 661
saccades, the visual response increases in VM neurons (Fig. 5A) but stays the same in 662
VONLY neurons (Fig. 4A). Thus, our results are not inconsistent with this gating 663
mechanism which may exist between SCs and SCi, where express and regular saccadic 664
signals diverge. 665
666
Other Neural Parameters Influencing Express Saccades 667
The combined modulations of the peak visual response and accumulated buildup 668
activity could only account for increases in the proportion of express saccades at target 669
luminance levels below 3.5 cd/m2. Above this luminance level, changes to the visual peak 670
or buildup activity could not account for the decrease in express saccades with increasing 671
target luminance that we observed (Fig. 7 A,B). By adding the cumulative pre-saccadic 672
activity of VM neurons during express saccades we accounted for more of the behavioral 673
data, however not all of the proportion of express saccade behavior was accounted for, 674
indicating that additional neural mechanisms likely contribute. 675

Marino et al. - 30
One factor that may also influence express saccade generation is the fixation-676
related activity located in the rostral pole of the SCi (Munoz and Wurtz 1993a; Munoz 677
and Wurtz 1993b; Dorris and Munoz 1995; Everling et al. 1999). Neurons in the rostral 678
SCi have enhanced tonic discharge during active visual fixation which is hypothesized to 679
aid in anchoring gaze and inhibiting unwanted saccades (Munoz and Wurtz 1993a; 680
Munoz and Wurtz 1993b; Everling et al. 1999; Krauzlis 2005). During the gap period, 681
fixation-related activity in the SCi decreases (Dorris and Munoz 1995; Dorris et al. 1997; 682
Everling et al. 1999) and this decrease co-varies with mean SRT when the gap duration is 683
varied (Dorris and Munoz 1995). However when the gap duration remains constant, the 684
rate of decrease of fixation activity is largely invariant and does not correlate with inter-685
trial variations in SRT including express saccades (Dorris et al. 1997). This evidence 686
suggests that decreases in fixation activity can only influence SRT (either directly or 687
indirectly) when external stimulus properties (related to the timing of the visual response 688
relative to the disappearance of the fixation point) are altered. As luminance increases, 689
the visual response occurs earlier and allows less time for fixation related activity to 690
decrease and disinhibit the rest of the SC. A recent study of express saccades in humans 691
supports this hypothesis because it was found that express saccades increase when 692
fixation disengagement is facilitated (Bibi and Edelman 2009). 693
694
Another possible factor that may influence express saccade generation is the area 695
or size of the visual or motor population response (i.e., point image) within the 696
topographic SC map (McIlwain 1986; Marino et al. 2008; Marino et al. 2012b). This 697
point image is believed to be shaped by nigral inhibition (Hikosaka and Wurtz 1983) and 698

Marino et al. - 31
lateral interactions within the SC itself (i.e., local excitation and distal inhibition) 699
(Munoz and Istvan 1998; Trappenberg et al. 2001; Dorris et al. 2007) that have been 700
shown to differ between SCs and SCi. The SCs exhibits stronger lateral inhibition than 701
the SCi (Phongphanphanee et al. 2014), which suggests that the SCs is more optimized 702
for localizing stimuli, while the SCi is more suitable for implementing an accumulating 703
saccadic decision signal with cortical and basal ganglia influence (Fig. 1). 704
We have shown previously that the size of the visual point image in the SC 705
changes with luminance (Marino et al. 2007). Furthermore, we used a neural field model 706
of lateral interactions within the SCi to predict that changes to the size of visual point 707
images significantly affected SRT such that increases in point image area decreased and 708
then increased SRT (Marino et al. 2012b). This is because increases in point image size 709
will decrease SRT until the point image grows beyond the hypothesized spatial extent of 710
local excitation and into regions of distal inhibition in the SC which slows SRT. We 711
therefore hypothesize that the reduction in the proportion of express saccades above 3.5 712
cd/m2 could result from larger visual response point images in the SCi that may inhibit 713
the express saccade mechanism. Further study of the relationship between the spatial 714
extent of point images and their influence on saccades is needed to address this 715
possibility. 716
717
Model Limitations 718
Here we have proposed a neurophysiological definition of express saccades that 719
includes all visually triggered saccades that are coincident with the early part of the visual 720
response to an abruptly appearing visual target. It is also possible; however, that express 721

Marino et al. - 32
saccades involve other mechanisms that might better account for the overlapping of SRT 722
distributions and the reduction of the visual responses to different types of target stimuli 723
when describing regular and express latency saccades. Future investigations will have to 724
address such problems in order to improve the accuracy of separating regular and express 725
saccades when they overlap in order to improve the description of the underlying neural 726
mechanisms. 727
728
Conclusions 729
Express saccades represent the fastest and most direct sensory to motor 730
transformation in the visual system. The neural mechanisms underlying their generation 731
do not function at a fixed temporal latency but instead are strongly linked to the qualities 732
(timing, magnitude) of the visual response which can be modified by the external 733
properties of the stimulus. Therefore, the likelihood of producing an express saccade is 734
not only depended on advanced motor preparation but is also strongly influenced by 735
visual stimulus properties. 736
737
738

Marino et al. - 33
FIGURE LEGENDS 739
Figure 1. Conceptual neural model of express saccade generation based on trigger 740
thresholds in the SCi. 1A, Spiking activity from a visual-motor SCi neuron during a 741
regular (blue lines) and express (red lines) latency saccade. Each vertical line represents a 742
single action potential. 1B, Spikes expressed as a continuous spike density function. An 743
express saccade is triggered when the combined pre-visual activity (dashed red line) 744
visual response (solid red line) cross a neural threshold (dotted grey line) to trigger an 745
express saccade (Edelman and Keller 1996; Dorris and Munoz 1998). When this 746
combined response does not cross threshold, a regular latency saccade can be triggered at 747
a later time by a separate and distinct motor response (blue line). 748
749
Figure 2. Schematic representation of temporal events in the delay (A) and gap (B) tasks 750
for the fixation point (FP), target (T) and eye position (EYE). Vertical gray bars denote 751
key analysis epochs used to classify responses and neurons. 752
753
Figure 3. Effects of target luminance on express saccades and SC responses in the gap 754
task. (A) Relationship between express saccades and visual response latencies. Grey bars 755
denote a histogram of SRTs for correct saccades (above the zero line) and direction error 756
saccades (below the zero line) in the gap task across 7 different luminance levels (column 757
is organized from top to bottom in ascending luminance). The colored lines denote the 758
population activity of 63 VM neurons at each target luminance level in the gap task. 759
Population spike densities (Poisson Kernel) are aligned on target appearance and include 760
all correct trials (luminance specific visually triggered latencies) toward their optimal 761

Marino et al. - 34
location. Dotted lines denote earliest SRT bin where saccades are visually triggered. 762
Shaded SRT bins denote express saccade epoch derived from a combination of visual 763
response timing and earliest visually triggered SRT (see Methods). (B) Temporal 764
modulation of visual response properties (time of visual response onset latency and peak) 765
and the earliest visually triggered saccade latency (first histogram bin when saccade 766
performance exceeds chance). The onset and peak of the visual response are denoted by 767
solid and dotted grey lines respectively. The time of the first correct SRT bin is denoted 768
by a solid black line. (C) Linear correlations between VROL and the peak time of the 769
visual response (gray data points and line) and VROL and the earliest SRT response time 770
(black data points and line). (D). The mean proportion of express saccades across 771
monkeys 1 and 2 determined by the timing of the visual response properties and earliest 772
visually triggered SRT latencies. 773
774
Figure 4. Neural population spike density functions (Gaussian kernel σ = 5ms) 775
comparing regular (solid line) and express saccades (dotted lines) for all visual-only 776
neurons (Vs). Population spike densities are aligned on target appearance 4A and saccade 777
onset 4B and include all correct trials toward their optimal location in the gap task. 778
Express saccades were separated based on luminance specific ranges (see methods). 779
Colored lines denote the population response at each target luminance level (red: 42.5 780
cd/m2, orange 17.5 cd/m2, green 3.5 cd/m2, dark blue 0.4 cd/m2, cyan 0.044 cd/m2, pink 781
0.005 cd/m2, black 0.001 cd/m2). The width of the colored background shading denotes 782
the standard error of the mean. Shaded vertical bars denote the time of the saccade (4B). 783
Overlapping black asterisks (top of each subpanel) denote times when the activity for 784

Marino et al. - 35
express saccades and regular saccades were significantly different (5ms window, t-test, 785
p<0.05). 786
787
Figure 5. Neural population spike density functions (Gaussian kernel σ = 5ms) 788
comparing regular (solid line) and express saccades (dotted lines) in visual-motor 789
neurons (VMs). Express saccades were separated based on luminance specific ranges (see 790
methods). Population spike densities are aligned on target appearance 5A and saccade 791
onset 5B and include all correct trials toward their optimal location in the gap task. 792
Colored lines denote the population response at each target luminance level (red: 42.5 793
cd/m2, orange 17.5 cd/m2, green 3.5 cd/m2, dark blue 0.4 cd/m2, cyan 0.044 cd/m2, pink 794
0.005 cd/m2, black 0.001 cd/m2). The width of the colored background shading denotes 795
the standard error of the mean. Shaded vertical bars denote the pre-visual epoch and time 796
of visual peak (5A), and the pre-saccade epoch (5B). Overlapping black asterisks (top of 797
each subpanel) denote times when the activity for express saccades and regular saccades 798
were significantly different (5ms window, t-test, p<0.05). 799
800
Figure 6. A-D. Population spike density functions (Gaussian kernel σ = 5ms) from VMs 801
without buildup (A) and from all neurons with buildup (VMs and Ms) (B) aligned on 802
target appearance in the gap task. Colored lines denote the population response at each 803
target luminance level (red: 42.5 cd/m2, orange 17.5 cd/m2, green 3.5 cd/m2, dark blue 0.4 804
cd/m2, cyan 0.044 cd/m2, pink 0.005 cd/m2, black 0.001 cd/m2). C,D Mean peak visual 805
response (C) and buildup activity (D) for each luminance level. Buildup activity was 806

Marino et al. - 36
calculated seperately as both the instantaneous buildup prior to the visual response (grey 807
line) and the cumulative buildup (black line). 808
809
Figure 7. Model predicting express saccade likelihood from SC response parameters. A. 810
Sum of squares error (SSE) from best model fits to the mean proportion of express 811
saccades produced across target luminance levels. Cumulative (white bars) and 812
instantaneous (grey bars) build-up were calculated and modelled separately. Separate 813
model fits were calculated from different combinations of neural parameters in the SC. 814
Parameters modeled included the peak of the visual response (Peak), instantaneous build-815
up (BU), cumulative build-up (BU), and pre-saccadic (Pre-Sac) activity from VM and V 816
only neurons. B. The calculated parameter weights for the 2 and 3 parameter best fit 817
models. C. Best model fits to 2 and 3 parameter combinations of SC activity to the 818
measured express saccade likelihood at each target luminance level: 1) cumulative 819
buildup and peak visual response (light grey solid line), 2) instantaneous buildup and 820
peak visual response (grey dash-dotted line), and 3) cumulative buildup, peak visual 821
response and pre-saccadic activity (dark grey dotted line). 822
823
Figure 8. Our proposed extension of the pre-existing express saccade model whereby 824
bright stimuli trigger early express saccades (red line) and dim stimuli trigger later 825
express saccades (orange line). During express saccades, the merged visual and motor 826
responses produce an elongated visual response that triggers an express saccade when 827
this activity is accumulated and integrated. In this model early express saccades are more 828
prevalent because bright stimuli elicit larger visual responses. A reduced proportion of 829

Marino et al. - 37
late express saccades can still be triggered despite a significantly reduced visual response 830
because of the extra buildup activity that can accumulate. 831
832
833

Marino et al. - 38
REFERENCE LIST 834
Anderson RW, Keller EL, Gandhi NJ and Das S. Two-dimensional saccade-related 835
population activity in superior colliculus in monkey. J Neurophysiol 80: 798-817, 1998. 836
Barbur JL, Wolf J and Lennie P. Visual processing levels revealed by response 837
latencies to changes in different visual attributes. Proc Biol Sci 265: 2321-2325, 1998. 838
Basso MA and Wurtz RH. Modulation of neuronal activity in superior colliculus by 839
changes in target probability. J Neurosci 18: 7519-7534, 1998. 840
Basso MA and Wurtz RH. Modulation of neuronal activity by target uncertainty. 841
Nature 389: 66-69, 1997. 842
Bell AH, Meredith MA, Van Opstal AJ and Munoz DP. Stimulus intensity modifies 843
saccadic reaction time and visual response latency in the superior colliculus. Exp Brain 844
Res 174: 53-59, 2006. 845
Bibi R and Edelman JA. The influence of motor training on human express saccade 846
production. J Neurophysiol 102: 3101-3110, 2009. 847
Boch R, Fischer B and Ramsperger E. Express-saccades of the monkey: reaction times 848
versus intensity, size, duration, and eccentricity of their targets. Exp Brain Res 55: 223-849
231, 1984. 850
Boehnke SE and Munoz DP. On the importance of the transient visual response in the 851
superior colliculus. Curr Opin Neurobiol 2008. 852

Marino et al. - 39
Carpenter RH. Express saccades: is bimodality a result of the order of stimulus 853
presentation? Vision Res 41: 1145-1151, 2001. 854
Chan F, Armstrong IT, Pari G, Riopelle RJ and Munoz DP. Deficits in saccadic eye-855
movement control in Parkinson's disease. Neuropsychologia 43: 784-796, 2005. 856
Cusick CG. Anatomical organization of the superior colliculus in monkeys: corticotectal 857
pathways for visual and visuomotor functions. Prog Brain Res 75: 1-15, 1988. 858
Dickov LA and Morrison JD. Effects of uncertainty and target displacement on the 859
latency of express saccades in man. Vision Res 46: 2505-2512, 2006. 860
Dorris MC and Munoz DP. Saccadic probability influences motor preparation signals 861
and time to saccadic initiation. J Neurosci 18: 7015-7026, 1998. 862
Dorris MC and Munoz DP. A neural correlate for the gap effect on saccadic reaction 863
times in monkey. J Neurophysiol 73: 2558-2562, 1995. 864
Dorris MC, Olivier E and Munoz DP. Competitive integration of visual and 865
preparatory signals in the superior colliculus during saccadic programming. J Neurosci 866
27: 5053-5062, 2007. 867
Dorris MC, Pare M and Munoz DP. Neuronal activity in monkey superior colliculus 868
related to the initiation of saccadic eye movements. J Neurosci 17: 8566-8579, 1997. 869
Edelman JA and Keller EL. Dependence on target configuration of express saccade-870
related activity in the primate superior colliculus. J Neurophysiol 80: 1407-1426, 1998. 871

Marino et al. - 40
Edelman JA and Keller EL. Activity of visuomotor burst neurons in the superior 872
colliculus accompanying express saccades. J Neurophysiol 76: 908-926, 1996. 873
Everling S, Dorris MC, Klein RM and Munoz DP. Role of primate superior colliculus 874
in preparation and execution of anti-saccades and pro-saccades. J Neurosci 19: 2740-875
2754, 1999. 876
Fischer B. Express saccades in man and monkey. Prog Brain Res 64: 155-160, 1986. 877
Fischer B and Boch R. Saccadic eye movements after extremely short reaction times in 878
the monkey. Brain Res 260: 21-26, 1983. 879
Fischer B and Ramsperger E. Human express saccades: extremely short reaction times 880
of goal directed eye movements. Exp Brain Res 57: 191-195, 1984. 881
Fischer B and Weber H. Express saccades and visual attention. Behav Brain Sci 16: 882
553-610, 1993. 883
Fries W. Cortical projections to the superior colliculus in the macaque monkey: a 884
retrograde study using horseradish peroxidase. J Comp Neurol 230: 55-76, 1984. 885
Gandhi NJ and Katnani HA. Motor functions of the superior colliculus. Annu Rev 886
Neurosci 34: 205-231, 2011. 887
Gawne TJ. The simultaneous coding of orientation and contrast in the responses of V1 888
complex cells. Exp Brain Res 133: 293-302, 2000. 889

Marino et al. - 41
Hall WC and Moschovakis AK, eds. The Superior Colliculus: New Approaches for 890
Studying Sensorimotor Integration, Boca Raton, Fl: CRC Press, 2003. 891
Hess WR, Bürgi S and Bucher V. Motorische Funktion des Tektal- und 892
Tegmentalgebietes (motor functions of tectal and tegmental areas). Mschr Psychiat 893
Neurol 112: 1-52, 1946. 894
Hikosaka O and Wurtz RH. Visual and oculomotor functions of monkey substantia 895
nigra pars reticulata. IV. Relation of substantia nigra to superior colliculus. J 896
Neurophysiol 49: 1285-1301, 1983. 897
Isa T. Intrinsic processing in the mammalian superior colliculus. Curr Opin Neurobiol 898
12: 668-677, 2002. 899
Krauzlis RJ. The control of voluntary eye movements: new perspectives. Neuroscientist 900
11: 124-137, 2005. 901
Krauzlis RJ, Lovejoy LP and Zenon A. Superior colliculus and visual spatial attention. 902
Annu Rev Neurosci 36: 165-182, 2013. 903
Lee J, Williford T and Maunsell JH. Spatial attention and the latency of neuronal 904
responses in macaque area V4. J Neurosci 27: 9632-9637, 2007. 905
Lennie P. The physiological basis of variations in visual latency. Vision Res 21: 815-824, 906
1981. 907

Marino et al. - 42
Li X and Basso MA. Preparing to move increases the sensitivity of superior colliculus 908
neurons. J Neurosci 28: 4561-4577, 2008. 909
Lock TM, Baizer JS and Bender DB. Distribution of corticotectal cells in macaque. 910
Exp Brain Res 151: 455-470, 2003. 911
Marino RA, Trappenberg TP, Levy R and Munoz DP. Target luminance modulates 912
spatial visual receptive field sizes in the superior colliculus as predicted by a neural field 913
model. Soc Neurosci Abstr 2007. 914
Marino RA, Levy R, Boehnke S, White BJ, Itti L and Munoz DP. Linking visual 915
response properties in the superior colliculus to saccade behavior. Eur J Neurosci 35: 916
1738-1752, 2012a. 917
Marino RA and Munoz DP. The effects of bottom-up target luminance and top-down 918
spatial target predictability on saccadic reaction times. Exp Brain Res 197: 321-335, 919
2009. 920
Marino RA, Rodgers CK, Levy R and Munoz DP. Spatial relationships of visuomotor 921
transformations in the superior colliculus map. J Neurophysiol 100: 2564-2576, 2008. 922
Marino RA, Trappenberg TP, Dorris M and Munoz DP. Spatial interactions in the 923
superior colliculus predict saccade behavior in a neural field model. J Cogn Neurosci 24: 924
315-336, 2012b. 925
McIlwain JT. Point images in the visual system: new interest in an old idea. TINS 9: 926
354, 1986. 927

Marino et al. - 43
McPeek RM and Schiller PH. The effects of visual scene composition on the latency of 928
saccadic eye movements of the rhesus monkey. Vision Res 34: 2293-2305, 1994. 929
Milstein DM and Dorris MC. The influence of expected value on saccadic preparation. 930
J Neurosci 27: 4810-4818, 2007. 931
Munoz DP, Armstrong IT, Hampton KA and Moore KD. Altered control of visual 932
fixation and saccadic eye movements in attention-deficit hyperactivity disorder. J 933
Neurophysiol 90: 503-514, 2003. 934
Munoz DP and Istvan PJ. Lateral inhibitory interactions in the intermediate layers of 935
the monkey superior colliculus. J Neurophysiol 79: 1193-1209, 1998. 936
Munoz DP and Wurtz RH. Saccade-related activity in monkey superior colliculus. I. 937
Characteristics of burst and buildup cells. J Neurophysiol 73: 2313-2333, 1995. 938
Munoz DP and Wurtz RH. Fixation cells in monkey superior colliculus. I. 939
Characteristics of cell discharge. J Neurophysiol 70: 559-575, 1993a. 940
Munoz DP and Wurtz RH. Fixation cells in monkey superior colliculus. II. Reversible 941
activation and deactivation. J Neurophysiol 70: 576-589, 1993b. 942
Paré M and Munoz DP. Saccadic reaction time in the monkey: advanced preparation of 943
oculomotor programs is primarily responsible for express saccade occurrence. J 944
Neurophysiol 76: 3666-3681, 1996. 945

Marino et al. - 44
Phongphanphanee P, Kaneda K and Isa T. Spatiotemporal profiles of field potentials 946
in mouse superior colliculus analyzed by multichannel recording. J Neurosci 28: 9309-947
9318, 2008. 948
Phongphanphanee P, Marino RA, Kaneda K, Yanagawa Y, Munoz DP and Isa T. 949
Distinct local circuit properties of the superficial and intermediate layers of the rodent 950
superior colliculus. Eur J Neurosci 40: 2329-2343, 2014. 951
Robinson DL and McClurkin JW. The visual superior colliculus and pulvinar. Rev 952
Oculomot Res 3: 337-360, 1989. 953
Rodgers CK, Munoz DP, Scott SH and Pare M. Discharge properties of monkey 954
tectoreticular neurons. J Neurophysiol 95: 3502-3511, 2006. 955
Rolfs M and Vitu F. On the limited role of target onset in the gap task: support for the 956
motor-preparation hypothesis. J Vis 7: 7.1-20, 2007. 957
Saslow MG. Effects of components of displacement-step stimuli upon latency for 958
saccadic eye movement. J Opt Soc Am 57: 1024-1029, 1967. 959
Schiller PH, Haushofer J and Kendall G. An examination of the variables that affect 960
express saccade generation. Vis Neurosci 21: 119-127, 2004. 961
Schiller PH, Sandell JH and Maunsell JH. The effect of frontal eye field and superior 962
colliculus lesions on saccadic latencies in the rhesus monkey. J Neurophysiol 57: 1033-963
1049, 1987. 964

Marino et al. - 45
Sommer MA. The spatial relationship between scanning saccades and express saccades. 965
Vision Res 37: 2745-2756, 1997. 966
Sommer MA. Express saccades elicited during visual scan in the monkey. Vision Res 34: 967
2023-2038, 1994. 968
Sparks D, Rohrer WH and Zhang Y. The role of the superior colliculus in saccade 969
initiation: a study of express saccades and the gap effect. Vision Res 40: 2763-2777, 970
2000. 971
Tanaka T, Nishida S, Aso T and Ogawa T. Visual response of neurons in the lateral 972
intraparietal area and saccadic reaction time during a visual detection task. Eur J 973
Neurosci 37: 942-956, 2013. 974
Thompson KG, Hanes DP, Bichot NP and Schall JD. Perceptual and motor processing 975
stages identified in the activity of macaque frontal eye field neurons during visual search. 976
J Neurophysiol 76: 4040-4055, 1996. 977
Trappenberg TP, Dorris MC, Munoz DP and Klein RM. A model of saccade 978
initiation based on the competitive integration of exogenous and endogenous signals in 979
the superior colliculus. J Cogn Neurosci 13: 256-271, 2001. 980
Weber H and Fischer B. Differential effects of non-target stimuli on the occurrence of 981
express saccades in man. Vision Res 34: 1883-1891, 1994. 982
Weber H, Fischer B, Bach M and Aiple F. Occurrence of express saccades under 983
isoluminance and low contrast luminance conditions. Vis Neurosci 7: 505-510, 1991. 984

Marino et al. - 46
White BJ and Munoz DP. Separate visual signals for saccade initiation during target 985
selection in the primate superior colliculus. J Neurosci 31: 1570-1578, 2011. 986
987

Marino et al. Fig. 1
Saccade Trigger Threshold
Con
tinuo
us A
ctiv
ity(S
Ci n
euro
ns)
SRT
VROL
Established Express Saccade Model
ExpressRegular
ExpressRegular
Dis
cret
e A
ctiv
ity(S
Ci n
euro
ns)
B
A
FP
T
EYE
Pre-Visual Activity Increase

Visual Baseline
B GAP TASKDELAY TASKAVisual
Baseline
Marino et al. Fig. 2
Saccade Baseline
SaccadeEpoch
Target Epoch
SaccadeEpoch
Visual Epoch
Pre-Visual Epoch
200ms SRTSaccade
Onset
500 - 800ms
FP
TEYE
Pre-SaccadicEpoch
FP
T
500 - 800ms 500 - 800ms
EYE
SRTSaccadeOnset

Time from Target Appearance / SRT (ms)
Tota
l Tria
lsFirst Correct SRT BINVROL
Act
ivity
(Spi
kes/
s)
40
80
100
120
140
160
0.1 10.0
01 0.01
Target Luminance (cd/m2)
Tim
e (m
s)
42.5 cd/m242.5 cd/m2
17.5 cd/m217.5 cd/m2
3.5 cd/m23.5 cd/m2
0.4 cd/m20.4 cd/m2
0.044 cd/m20.044 cd/m2
0.005 cd/m20.005 cd/m2
0.001 cd/m20.001 cd/m2
Visual Peak
Timing of Visual Response and Saccade Behavior
SRT Behavior and Visual-Motor Neuron Population
Marino et al. Fig. 3
BA
60
80
100
120
140
160
Earliest Correct Behavior versus Visual Response
C
Tim
e of
Pea
k V
isua
l Res
pons
e(m
s)
Tim
e of
Firs
t Cor
rect
SR
T B
IN (m
s)
VROL (ms)60 14012010080 160
slope = 0.93r = 0.995
60
80
100
120
140
160
Onset of Correct Visually Triggerred Saccades
0
150
0
150
0
150
0
150
0
150
0
150
0 100 200 300
0
150
0
200
0
200
0
200
0
200
0
200
0
2000
200
60
4040
40
slope = 1.05r=0.996
0
5
10
15
20
25
% E
xpre
ss S
acca
des
Target Luminance (cd/m2)
Proportion of Express SaccadesD 30
10 100
0.1 10.0
01 0.01 10 10
0
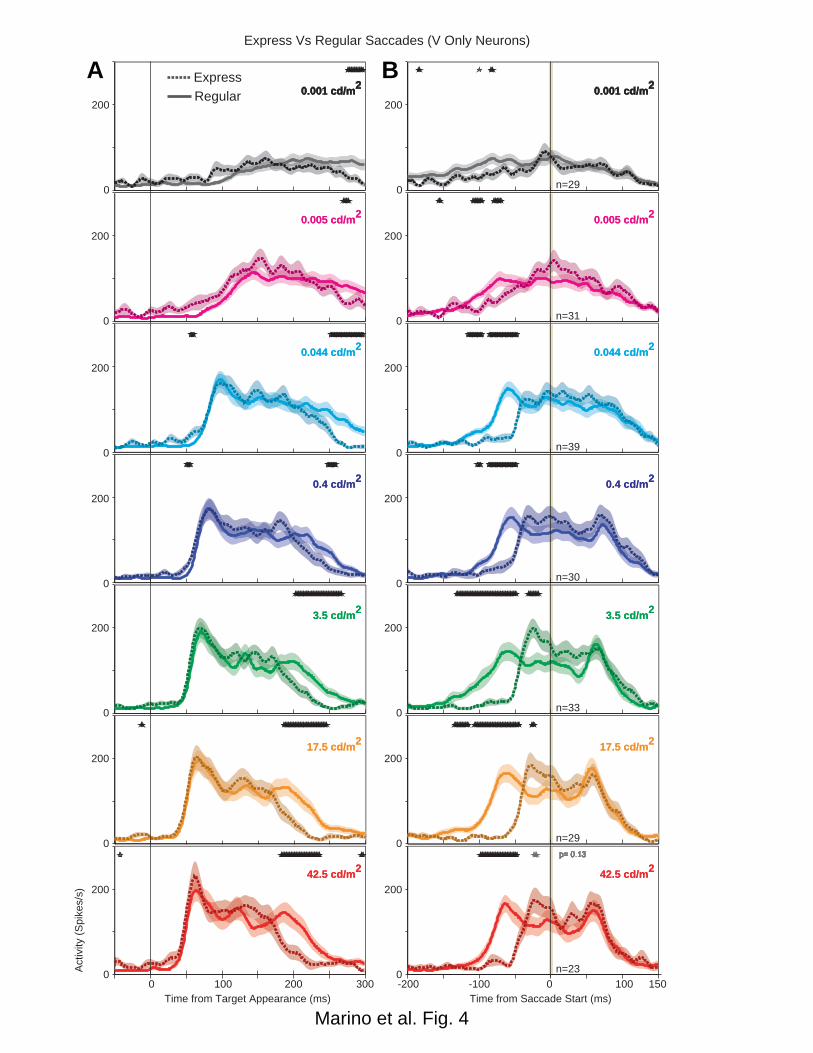
Marino et al. Fig. 4Time from Target Appearance (ms)
B
0 100 200 300
A A
ctiv
ity (S
pike
s/s)
42.5 cd/m242.5 cd/m2
17.5 cd/m217.5 cd/m2
3.5 cd/m23.5 cd/m2
0.4 cd/m20.4 cd/m2
0.044 cd/m20.044 cd/m2
0.005 cd/m20.005 cd/m2
0.001 cd/m20.001 cd/m2
Express Vs Regular Saccades (V Only Neurons)
0
200
0
200
0
200
0
200
0
200
0
200
0
200
Time from Saccade Start (ms) -200 -100 0 100 150
42.5 cd/m242.5 cd/m2
17.5 cd/m217.5 cd/m2
3.5 cd/m23.5 cd/m2
0.4 cd/m20.4 cd/m2
0.044 cd/m20.044 cd/m2
0.005 cd/m20.005 cd/m2
0.001 cd/m20.001 cd/m2
0
200
0
200
0
200
0
200
0
200
0
200
0
200
p= 0.13
Regular Express
n=23
n=29
n=29
n=30
n=31
n=39
n=33

Marino et al. Fig. 5
A
Time from Target Appearance (ms)
Act
ivity
(Spi
kes/
s)
42.5 cd/m242.5 cd/m2
17.5 cd/m217.5 cd/m2
3.5 cd/m23.5 cd/m2
0.4 cd/m20.4 cd/m2
0.044 cd/m20.044 cd/m2
0.005 cd/m20.005 cd/m2
0.001 cd/m20.001 cd/m2
Express Vs Regular Saccades (VM Neurons)
B
0 100 200 3000
200
0
200
0
200
0
200
0
200
0
200
0
200
Time from Saccade Start (ms)
42.5 cd/m242.5 cd/m2
17.5 cd/m217.5 cd/m2
3.5 cd/m23.5 cd/m2
0.4 cd/m20.4 cd/m2
0.044 cd/m20.044 cd/m2
0.005 cd/m20.005 cd/m2
0.001 cd/m20.001 cd/m2
-200 -100 0 1000
200
0
200
0
200
0
200
0
200
0
200
0
200
150
Regular Express
n=33
n=41
n=55
n=52
n=59
n=58
n=48

50
100
150
200
250
n=63 neurons
Visual-Motor Neurons (No Buildup)Gaussian Kernal
M and VM Neurons With BuildupPoisson Kernal42.5
17.5 3.5 0.4 0.044 0.005 0.001
Time From Target Onset (ms)
Pop
ulat
ion
Res
pons
e(S
pike
s/s)
Buildup
50 100 150 200 250Time From Target Onset (ms)
0-50-100
n=37 neurons
0
50
100
150
Pop
ulat
ion
Res
pons
e(S
pike
s/s)
Target Luminance (cd/m )2
Cum
ulat
ive
Bui
ld-u
p (A
rea
Und
er C
urve
)(S
pike
s/s
x m
s)
1000
7000Peak Visual Response
Target Luminance (cd/m )2
Pea
k V
isua
l Res
pons
e (S
pike
s/s)
50
250
200
150
100
42.517.5 3.5 0.4 0.044 0.005 0.001
Marino et al. Fig. 6
BA
DC50 100 150 200 2500-50-100
0
30
60
45
Inst
anta
neou
s B
uild
-up
Imm
edia
tely
Pre
ceed
ing
Vis
aul R
espo
nse
(Spi
kes/
s)
n=63 neurons n=37 neurons
0.1 10.0
01 0.01 10 10
0 0.1 10.0
01 0.01 10 10
0

Marino et al. Fig. 7
Predicting Luminance Specific Express Saccade Probability From SC Response Properties
Best Fit Parameter Weights
C
Target Luminance (cd/m )2
50
100
Nor
mal
ized
Pro
porti
on
70
90
Nor
mal
ized
Par
amet
er W
eigh
t
B
Boo
tstra
p M
odel
Err
or (B
est F
it - B
ehav
ior)
SS
E
A
2 Parameters 3 Parameters
2 parameters
Peak +
BU
+ VM P
re-Sac
Peak +
BU
+ V P
re-Sac
Peak +
BU
+ VROL
Peak +
BU
Instantaneous Build-Up (BU) Cumulative Build-Up (BU)
3 parameters
Express Saccade Behavior
Instantaneous BU + Peak
Best Model FitsCumulative BU + Peak
Instantaneous BU + Peak + VM Pre-Sac
0.2
0.8
BUPea
k
VM Pre-
SacBUPea
k
0.8
0.2
60
80
10 10 10 100 101 102
700
900
1100
1300
1500

Marino et al. Fig. 8
Delayed VROL increases time for pre-target preparatory acitivity
Expanded Express Saccade Model
Saccade Trigger Threshold
SRT Higher proportion ExpressLower proportion Express
Con
tinuo
us A
ctiv
ity (S
Ci n
euro
ns)
Targ
et O
nset
VR
OL
(Brig
ht)
VR
OL
(Dim
)
Regular
Express