article the properties of discs around planets and brown...
TRANSCRIPT

Article
The properties of discs around planets and brown dwarfs as evidence for disc fragmentation
Stamatellos, Dimitris and Herczeg, Gregory. J.
Available at http://clok.uclan.ac.uk/12680/
Stamatellos, Dimitris ORCID: 0000000245028344 and Herczeg, Gregory. J. (2015) The properties of discs around planets and brown dwarfs as evidence for disc fragmentation. Monthly Notices of the Royal Astronomical Society, 454 (3). pp. 34323440. ISSN 00358711
It is advisable to refer to the publisher’s version if you intend to cite from the work.http://dx.doi.org/10.1093/mnras/stv526
For more information about UCLan’s research in this area go to http://www.uclan.ac.uk/researchgroups/ and search for <name of research Group>.
For information about Research generally at UCLan please go to http://www.uclan.ac.uk/research/
All outputs in CLoK are protected by Intellectual Property Rights law, includingCopyright law. Copyright, IPR and Moral Rights for the works on this site are retained by the individual authors and/or other copyright owners. Terms and conditions for use of this material are defined in the http://clok.uclan.ac.uk/policies/
CLoKCentral Lancashire online Knowledgewww.clok.uclan.ac.uk

MNRAS 449, 3432–3440 (2015) doi:10.1093/mnras/stv526
The properties of discs around planets and brown dwarfs as evidencefor disc fragmentation
Dimitris Stamatellos1‹ and Gregory J. Herczeg2
1Jeremiah Horrocks Institute for Mathematics, Physics & Astronomy, University of Central Lancashire, Preston PR1 2HE, UK2Kavli Institute for Astronomy and Astrophysics, Peking University, Yi He Yuan Lu 5, Haidian District, Beijing 100871, China
Accepted 2015 March 9. Received 2015 March 5; in original form 2014 September 16
ABSTRACTDirect imaging searches have revealed many very low mass objects, including a small numberof planetary-mass objects, as wide-orbit companions to young stars. The formation mechanismof these objects remains uncertain. In this paper, we present the predictions of the discfragmentation model regarding the properties of the discs around such low-mass objects. Wefind that the discs around objects that have formed by fragmentation in discs hosted by Sun-likestars (referred to as parent discs and parent stars) are more massive than expected from theMdisc–M∗ relation (which is derived for stars with masses M∗ > 0.2 M�). Accordingly, theaccretion rates on to these objects are also higher than expected from the M∗−M∗ relation.Moreover, there is no significant correlation between the mass of the brown dwarf or planetwith the mass of its disc nor with the accretion rate from the disc on to it. The discs aroundobjects that form by disc fragmentation have larger than expected masses as they accrete gasfrom the disc of their parent star during the first few kyr after they form. The amount of gasthat they accrete and therefore their mass depend on how they move in their parent disc andhow they interact with it. Observations of disc masses and accretion rates on to very low massobjects are consistent with the predictions of the disc fragmentation model. Future observations(e.g. by Atacama Large Millimeter/submillimeter Array) of disc masses and accretion rateson to substellar objects that have even lower masses (young planets and young, low-massbrown dwarfs), where the scaling relations predicted by the disc fragmentation model divergesignificantly from the corresponding relations established for higher mass stars, will test thepredictions of this model.
Key words: accretion, accretion discs – hydrodynamics – methods: numerical –protoplanetary discs – brown dwarfs – stars: formation – stars: low-mass.
1 IN T RO D U C T I O N
Many very low mass objects, including a small number of planetary-mass objects, have been observed by direct imaging as companionsto young stars at distances from a few tens to a few hundred au(Kraus et al. 2008, 2014a; Marois et al. 2008; Faherty et al. 2009;Ireland et al. 2011; Kuzuhara et al. 2011, 2013; Aller et al. 2013;Bailey et al. 2014; Rameau et al. 2013; Galicher et al. 2014; Naudet al. 2014). The dominant mechanism for the formation of low-massstellar and substellar objects (low-mass hydrogen-burning stars,brown dwarfs, and giant planets) is still uncertain (e.g. Chabrieret al. 2014; Stamatellos 2014). It is believed that such objects mayform in three ways: (i) by collapsing molecular cloud cores, i.e. thesame way as Sun-like stars (Padoan & Nordlund 2004; Hennebelle
� E-mail: [email protected]
& Chabrier 2008, 2009; Hopkins 2013), (ii) by fragmentation ofprotostellar discs (Boss 1997; Stamatellos, Hubber & Whitworth2007a; Attwood et al. 2009; Boley 2009; Stamatellos & Whitworth2009a), which may not even be centrifugally supported (Offner et al.2010, 2012), and (iii) by ejection of protostellar embryos from theirnatal cloud cores (Reipurth & Clarke 2001; Bate, Bonnell & Bromm2002; Goodwin, Whitworth & Ward-Thompson 2004). Addition-ally, gas giant planets also form by core accretion, i.e. by coagu-lation of dust particles to progressively larger bodies (Safronov &Zvjagina 1969; Goldreich & Ward 1973; Mizuno 1980; Boden-heimer & Pollack 1986; Pollack et al. 1996). Objects formed bycore accretion may even become deuterium-burning brown dwarfs(e.g. Molliere & Mordasini 2012). However, gas giants on wideorbits (�100–300 au) are not believed to be able to form, at least insitu, by core accretion.
Substellar objects are difficult to form similarly to Sun-like stars,and it has been argued that a different mechanism may in fact
C© 2015 The AuthorsPublished by Oxford University Press on behalf of the Royal Astronomical Society
at The L
ibrary on Novem
ber 9, 2015http://m
nras.oxfordjournals.org/D
ownloaded from
Disc properties of low-mass objects 3433
be at play (e.g. Thies & Kroupa 2007; Whitworth et al. 2007;Reggiani & Meyer 2013). A low-mass pre-(sub)stellar core has tobe very dense and compact in order to be gravitationally unsta-ble. Up to now, only one clear-cut self-gravitating brown dwarfmass core has been observed (Andre, Ward-Thompson & Greaves2012), but such cores have small size and they are faint, makingthem difficult to observe. Another way to reach the high densi-ties that are required for the formation of substellar objects is inthe discs around young stars. This model has been studied exten-sively and has been shown to reproduce critical observational con-straints such as the low-mass initial mass function, the brown dwarfdesert, and the binary statistics of low-mass objects (Stamatellos &Whitworth 2009a; Lomax et al. 2014a,b). In the third formationscenario mentioned in previous paragraph, formation by ejection ofproto stellar embryos, objects that were destined to become Sun-likestars fail to fulfil their potential as they are ejected from their natalcloud before they accrete enough mass to become hydrogen-burningstars.
The presence of discs around substellar objects (and associatedphenomena, i.e. accretion and outflows) was initially thought tofavour a Sun-like formation mechanism (i.e. turbulent fragmen-tation and collapse of pre-substellar cores). However, all threemain formation mechanisms produce substellar objects that are sur-rounded by discs, albeit with different disc fractions. In the turbu-lent fragmentation scenario substellar objects almost always formwith discs (e.g. Machida, Shu-ichiro Inutsuka & Matsumoto 2009).Substellar objects that form by disc fragmentation also most likelyform with discs, but these discs may be disrupted as these objects areliberated from the disc in which they formed (Stamatellos & Whit-worth 2009a). In the ejection scenario, discs are also likely to bedisrupted but quite a few still survive. Bate (2009) finds that at least10 per cent of the very low mass objects formed in his simulationshave discs with sizes larger >40 au.
Although the presence of discs around substellar objects is con-sistent with all three formation theories, the properties of thesediscs may hide clues regarding their formation mechanism. Re-cently, many authors (Andrews et al. 2013; Mohanty et al. 2013;Kraus et al. 2014b; Ricci et al. 2014) have estimated the masses ofdiscs around young low-mass stellar and substellar objects downto a limit of ∼10−3 M�, using submillimetre observations. Theaccretion rates around many low-mass objects have also been deter-mined down to 10−13 M� yr−1 (Calvet et al. 2004; Natta et al. 2004;Mohanty, Jayawardhana & Basri 2005; Muzerolle et al. 2005; Her-czeg & Hillenbrand 2008; Antoniucci et al. 2011; Rigliaco et al.2011; Biazzo et al. 2012).
The goal of this paper is to compare these observations withthe theoretical predictions of the disc fragmentation model. This isparticularly topical as the discovery of many planetary-mass objectsat wide separations (a few tens to a few hundred au) from theirhost stars by direct imaging (Kraus et al. 2008, 2014a; Maroiset al. 2008; Faherty et al. 2009; Ireland et al. 2011; Kuzuhara et al.2011, 2013; Aller et al. 2013; Bailey et al. 2014; Rameau et al.2013; Naud et al. 2014; Galicher et al. 2014) has renewed thedebate whether these objects have formed by core accretion or byfragmentation in the discs of their parent stars, or have formedotherwise and were later captured by the parent stars (Perets &Kouwenhoven 2012). It is also uncertain whether such companionsmay have formed differently than field objects. More wide orbitsubstellar objects are bound to be discovered with focused surveyslooking for giant planets (Gemini Planet Imager, Macintosh et al.2014; SPHERE/VLT, Beuzit et al. 2008; HiCIAO/SUBARU, Suzukiet al. 2009) and therefore their properties and the properties of
their probable discs may be better determined in the near future,providing tighter constraints for theoretical models.
In this paper we present the predictions of the disc fragmenta-tion model regarding the masses of discs around low-mass stellarand substellar objects (brown dwarfs and planets) that are eithercompanion to higher mass stars or free-floating. We also determinethe accretion rates on to low-mass objects and compare them withobservations. In Section 2, we briefly review the hydrodynamicsimulations that we use for this study, and in Section 3 we discusshow we compute the evolution of the discs around brown dwarfsand planets, after these discs have separated from the discs of theirparent stars. In Section 4, we present the results of the model re-garding the disc masses of low-mass objects and discuss how theyfit with observations, and in Section 5 we discuss the accretion rateson to low-mass objects. Finally in Section 7, we summarize themain results of this work.
2 SI M U L ATI O N S O F T H E FO R M AT I O N O FW I D E - O R B I T P L A N E T S A N D B ROW N DWA R F SBY DI SC FRAG MENTATI ON
2.1 Overview
The properties of the low-mass stellar and substellar objects (plan-ets, brown dwarfs, and low-mass hydrogen-burning stars) formedby disc fragmentation have been studied in detail by Stamatelloset al. in a series of papers (Stamatellos et al. 2007a; Stamatellos& Whitworth 2009a,b, 2011). In this paper, we use the results ofthe simulations of Stamatellos & Whitworth (2009a) to determinethe properties of the discs around wide-orbit planets, brown dwarfs,and low-mass stars that form in the discs of Sun-like stars, and theaccretion rates on to these objects.
2.2 Initial Conditions
Stamatellos & Whitworth (2009a) performed 12 simulations ofgravitationally unstable discs around Sun-like stars. These simu-lations are different realizations of the same star-disc system, i.e.the properties of the system are the same in all simulations; the onlydifference is the random seed used to construct each disc. The starhas an initial mass of M∗ = 0.7 M�. The disc around it has an initialmass of MD = 0.7 M� and a radius of RD = 400 au. The surfacedensity of the disc is
�0 (R) = 0.014 M�au2
(R
au
)−7/4
, (1)
and its temperature
T0 (R) = 250 K
(R
au
)−1/2
+ 10 K . (2)
The disc has an initial Toomre parameter Q ∼ 0.9, and therefore, itis gravitationally unstable by construction. In a realistic situation,the disc forms around a young protostar and grows in mass byaccreting infalling material from the envelope (e.g. Attwood et al.2009; Stamatellos, Whitworth & Hubber 2011b, 2012; Lomax et al.2014a). The disc fragments once it has grown enough to becomegravitationally unstable at distance ∼100 au from its parent star andthis happen before it can reach the mass assumed by Stamatellos& Whitworth (2009a). In fact, even discs with masses ∼0.25 M�and radii 100 au can fragment (Stamatellos et al. 2011a). Suchdisc masses are comparable to the observed disc masses in young(Class 0, Class I) objects (e.g. Jorgensen et al. 2009; Tobin et al.
MNRAS 449, 3432–3440 (2015)
at The L
ibrary on Novem
ber 9, 2015http://m
nras.oxfordjournals.org/D
ownloaded from

3434 D. Stamatellos and G. J. Herczeg
2012; Murillo et al. 2013; Favre et al. 2014). In any case, anyevolutionary period with such a massive disc is short-lived as thedisc quickly (within a few thousand years) fragments.
The large disc mass and size assumed by Stamatellos &Whitworth (2009a) ensure that more low-mass objects form in thedisc to improve the statistical analysis of the results, but the proper-ties of these objects (mass, disc mass, and disc size) are similar tothe ones formed in lower mass discs (Stamatellos et al. 2011a). Thisis because the characteristic initial mass of objects formed by discfragmentaton is set by the opacity limit, which is thought to be ∼1–5 MJ (Low & Lynden-Bell 1976; Rees 1976; Silk 1977; Boss 1988;Boyd & Whitworth 2005; Whitworth & Stamatellos 2006; Boleyet al. 2010; Kratter, Murray-Clay & Youdin 2010; Forgan & Rice2011; Rogers & Wadsley 2012). Therefore, the typical initial massof the objects formed by fragmentation is the same for lower andhigher parent disc masses. The parent disc mass (in lower massdiscs) is distributed among fewer objects, and therefore, the massesof these objects and the masses of their discs are similar to the onesthat form in higher mass discs.
The simulations that we use start off with already formed discs;therefore, disc loading and other interactions with the star form-ing cloud (which may lead to non-axisymmetric discs) are ignored.Simulations that take these effects into account (e.g. Tsukamotoet al. 2015) have given similar results to the simulations ofStamatellos & Whitworth (2009a) used in this paper. We thereforedo not anticipate the choice of the specific set of disc simulationsto significantly alter the main conclusions of this paper.
2.3 Numerical method
The evolution and fragmentation of the disc of the parent star isfollowed using the smoothed particle hydrodynamics (SPH) codeDRAGON, which treats the radiation transport within the disc withthe diffusion approximation of (Stamatellos et al. 2007b, see alsoForgan et al. 2009b). The radiation feedback from the parent staris also taken into account. The code uses time-dependent viscositywith parameters α = 0.1, β = 2α (Morris & Monaghan 1997) anda Balsara switch (Balsara 1995).
2.4 Results
The parent disc is unstable and therefore within a few kyr it frag-ments into 5–11 secondary objects. In the 12 simulations a totalof 96 objects are formed. Some of them escape and others remainbound to the parent star at wide orbits (see Stamatellos & Whitworth2009a, 2011). Most of these objects are brown dwarfs (67 per cent;13 MJ < M < 80 MJ) and the rest are low-mass hydrogen-burningstars (30 per cent; M > 80 MJ), and planets (3 per cent; M < 13 MJ).These mass ranges are set by the hydrogen-burning limit (∼80 MJ)and the deuterium-burning limit (∼13 MJ). Stars can sustain hy-drogen burning, whereas brown dwarfs can sustain only deuteriumburning. Planets cannot sustain deuterium burning. However, thereis no reason for gas fragmentation to stop either at the hydrogen-burning limit or the deuterium-burning limit: the minimum mass ofan object that forms by gas fragmentation is given from the opacitylimit for fragmentation (∼1−5 MJ). On the other hand, planets thatform by core accretion may have masses >13 MJ (e.g. Molliere &Mordasini 2012). In this paper, we use the term planet to refer toobjects with mass <13 MJ regardless on their formation mechanism.
About 70 per cent of the secondary objects that form in the parentdisc are attended by their own individual discs. These discs havemasses up to a few tens of MJ and radii of a few tens of au (see
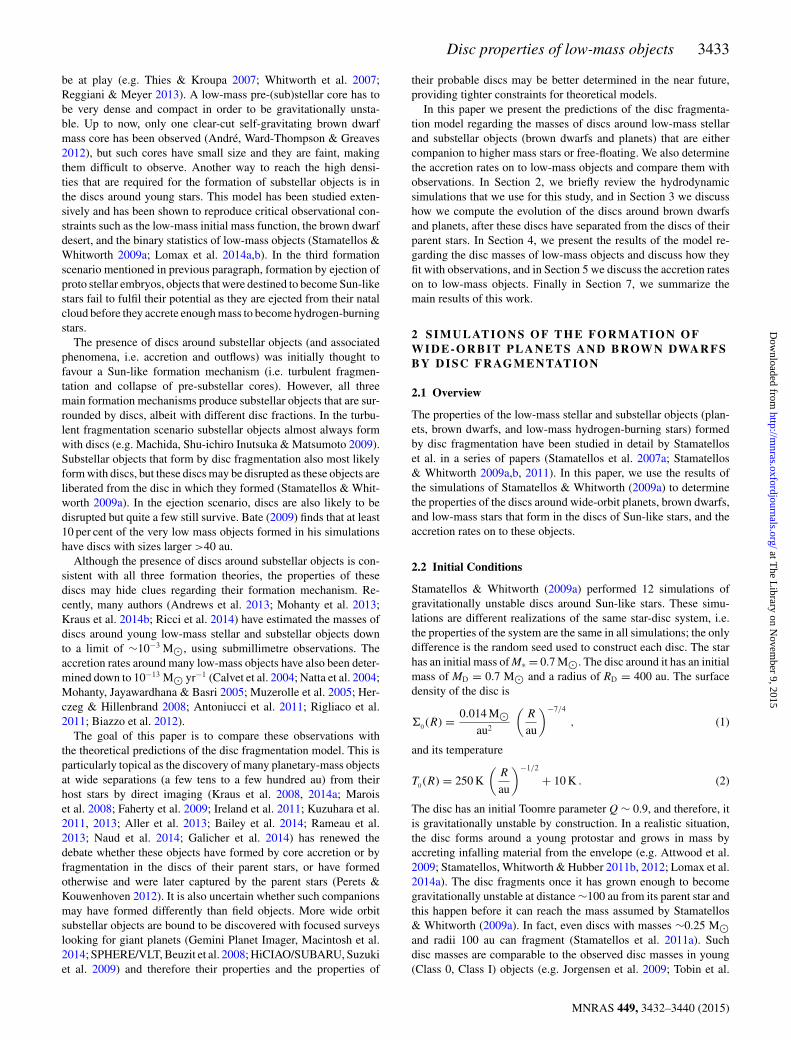
Figure 1. The masses of objects formed by disc fragmentation plottedagainst the semimajor axes of their orbits around the parent star. Most ofthese objects are brown dwarfs (with a few of them near the brown dwarf-planet boundary of 13MJ), and a few of them are planets and low-masshydrogen-burning stars. Low-mass hydrogen-burning stars tend to be closerto the parent star than brown dwarfs and planets.
Stamatellos & Whitworth 2009a). Out of these secondary objectswith discs, we select 34 single objects (i.e. they are not in a binarysystem with another secondary object formed in the parent disc, butthey may still be bound to the parent star) for which the propertiesof the discs can be determined (i.e. the discs are nearly Keplerian).The rest of the objects either were binaries or were attended bydisc-like structures whose properties could not be obtained (e.g.discs that were perturbed). Almost all of the objects in the sample(33 out of 34) are still bound to the parent star albeit in most casesat very wide orbits (see Fig. 1). Eventually many of these will beliberated and will become field objects (Stamatellos & Whitworth2009a). Therefore, in Sections 4 & 5, the properties of the discs ofthese objects and the accretion rates on to them will be comparedwith the observed properties of objects that are either wide-orbitcompanions to other stars, or field objects.
Fig. 1 presents the relation between the masses and the semimajoraxes of the orbits of these objects. Most of these objects are browndwarfs (with a few of them near the brown dwarf-planet boundaryof 13MJ) and a few of them planets and low-mass hydrogen-burningstars. Low-mass hydrogen-burning stars tend to be closer to theirparent stars than brown dwarfs and planets (the brown dwarf desert;Marcy & Butler 2000; Grether & Lineweaver 2006; Sahlmann et al.2011; Ma & Ge 2014). There are many brown dwarf companions toSun-like stars, but these tend to be at wide separations (Kraus et al.2008, 2011; Faherty et al. 2009, 2010; Evans et al. 2012; Duchene& Kraus 2013; Reggiani & Meyer 2013). As the above types ofobjects all form by the same mechanism in the disc irrespective oftheir mass, we will analyse their disc properties collectively.
Fig. 2 presents the mass of each disc versus the semimajor axisof its host object. There is no significant correlation between thetwo. The disc masses are determined by how these objects movewithin the disc of the parent star and accrete mass from it, ratherthan where they form in the parent disc.
MNRAS 449, 3432–3440 (2015)
at The L
ibrary on Novem
ber 9, 2015http://m
nras.oxfordjournals.org/D
ownloaded from

Disc properties of low-mass objects 3435
Figure 2. The disc masses around objects formed by disc fragmentationagainst the semimajor axes of their orbits around the parent star. There isno significant correlation between the two. The disc masses are probablydetermined by how these objects move in the disc of the parent star andaccrete mass from it, rather than where they form in the parent disc.
3 TH E E VO L U T I O N O F TH E D I S C S A RO U N DB ROW N DWA R F S A N D P L A N E T S
The hydrodynamic simulations provide the properties of the discsaround wide-orbit companions to Sun-like stars at the time when70–80 per cent of the parent disc around the parent Sun-like star hasbeen accreted, either on to the parent star or on to the low-massobjects that form in the parent disc. This typically happens within10–20 kyr from the start of each simulation. By this point, the massof the parent disc has been reduced to <0.01 M�. Considering thatthe secondary objects that formed in the parent disc are on wideorbits around the parent star, we do not expect interactions betweenthe parent disc and the secondary discs to be important. Additionally,in a cluster environment they are likely to be disrupted by stellarflybys and become free-floating objects (Heggie 1975; Kroupa et al.2003; Parker et al. 2009; Parker & Goodwin 2009; Spurzem et al.2009; Malmberg, Davies & Heggie 2011; Hao, Kouwenhoven &Spurzem 2013). Therefore, we assume that at this point (i) thatthe secondary discs (i.e. the discs around the low-mass objects thatform in the parent disc) have separated from their parent disc (ii) thatthey evolve independently (i.e. there are no dynamical interactionsbetween them and the parent disc, or other objects that form inthe parent disc), and (iii) that no further mass from the parent discis accreted on to them. These assumptions are not critical as theaccretion of additional material on to the secondary disc reinforcesour conclusions. To compare the properties of the discs aroundthese low-mass companions with the observed disc properties ofcompanions in nearby young stellar clusters (age ∼1–15 Myr) theseproperties need to be evolved in time. As this is not possible to bedone by hydrodynamic simulations due to the large computationalcost, we have employed an analytic model of viscous disc evolution.
We ignore any disc clearing due to photoevaporation fromradiation from the low-mass object hosting the disc (seeAlexander et al. 2013, and references therein). Photoevaporationof discs around low-mass objects (�0.15 M�) could happen (e.g.Alexander, Clarke & Pringle 2006) but because of our limitedknowledge on how ultraviolet and X-ray emission from low-massobjects would affect their discs, it is difficult to ascertain how im-portant photoevaporation is for disc dispersion.
The analytic model we employ assumes the disc (around a sec-ondary object) is geometrically thin and evolves viscously under theinfluence of the central object’s gravity (e.g. Lynden-Bell & Pringle1974), which in this case is the planet or brown dwarf (representedas point masses in the model). The surface density of such a disc�(R, t) at polar radius R and time t, evolves as follows
∂�
∂t= 3
R
∂
∂R
[R1/2 ∂
∂R(ν�R1/2)
], (3)
where ν(R, t) is the kinematic viscosity (Pringle 1981). In this equa-tion (and in subsequent equations), t = 0 corresponds to the timewhere these discs are decoupled from their parents discs (i.e. theend of the hydrodynamic simulations). Assuming that the viscos-ity is independent of time and can be expressed as a power law inR, ν ∝ Rγ , then the above evolution equation has a similarity solu-tion (Lynden-Bell & Pringle 1974; Hartmann et al. 1998)
�(R, t) = MD(0)(2 − γ )
2πR20r
γτ (5/2−γ )/(2−γ )exp
[− r2−γ
τ
], (4)
where r = R/R0 (R0 is the radius within which 60 per cent of thedisc mass is contained initially), and
τ = t/tν + 1 , (5)
where
tν = R20/[3(2 − γ )2ν(R0)] . (6)
The accretion rate on to the central object is then
M∗ = MD(0)
2(2 − γ )tντ−(5/2−γ )/(2−γ ) , (7)
and the disc mass
MD(t) = MD(0)τ−1/[2(2−γ )] . (8)
It has been argued that observations of the discs of T Tauri starssuggest that γ ∼ 1 (Hartmann et al. 1998, i.e. ν ∝ R), and thereforewe will adopt this value in the present study. The choice of γ is notcritical for the conclusions of this paper.
We use the α-viscosity parametrization (Shakura & Sunyaev1973)
ν = αcsH, (9)
where cs is the sound speed in the disc, H is the disc scale-height, andα the viscosity parameter. Assuming that the disc is locally verticallyisothermal we obtain H = cs/(R), which when used in equation (9)and assuming Keplerian rotation, i.e. (R) = (GM∗/R3)1/2, gives
ν ∝ α Td R3/2M−1/2∗ . (10)
Using equation (10) in equation (6) and assuming Td(R) ∝ R−1/2
(consistent with γ = 1), we obtain
tν = 8×10⁴( α
10−2
)−1(
R0
10 au
)(M∗
0.5 M�
)1/2(Td
10 K
)−1
yr, (11)
where Td is the disc temperature at 100 au.We can therefore calculate the disc mass and the accretion rate
on to the central object that hosts the disc (planet or brown dwarf)at any given time, using the initial disc mass MD(0), obtained by theSPH simulations, and using equations (7), (8), and (11).
MNRAS 449, 3432–3440 (2015)
at The L
ibrary on Novem
ber 9, 2015http://m
nras.oxfordjournals.org/D
ownloaded from

3436 D. Stamatellos and G. J. Herczeg
4 T H E M A S S E S O F D I S C S A RO U N DLOW-MASS STELLAR AND SUBSTELLARO B J E C T S
Observations of disc masses (e.g Andrews et al. 2013; Mohantyet al. 2013) over a wide range of host stellar and substellar massesfrom intermediate-mass stars to planetary-mass objects suggest alinear correlation between object mass and disc mass, i.e. MD ∝ M∗.
Andrews et al. (2013) using three different evolutionary mod-els for calculating stellar masses, they find that stellar1 massscales almost linearly with the disc mass, MD ≈ 10κMλ
∗ , whereκ = −2.3 ± 0.3, −2.7 ± 0.2, −2.5 ± 0.2, and λ = 1.4 ± 0.5,1.0 ± 0.4, 1.1 ± 0.4, when using the D’Antona & Mazzitelli (1997,hereafter DM97), Baraffe et al. (1998, BCAH98) and Siess et al.(2000, SDF00) models, respectively. Mohanty et al. (2013) followa similar approach using the SDF00 models for stars with mass>1.4 M�, the BCAH98 model for stars with masses 0.08–1.4 M�,and the dusty models of Chabrier et al. (2000) for stellar masses<0.08 M� and similarly find that MD ≈ 10−2.4M∗. We note how-ever that both Andrews et al. (2013) and Mohanty et al. (2013)have assumed that the scatter in disc mass is constant for all objectsirrespective of their mass; this may not be the case (Alexander &Armitage 2006).
It is evident (see fig. 9 in Andrews et al. 2013 and fig. 9 inMohanty et al. 2013) that (i) there is a considerable scatter in theMD–M∗ relation and (ii) there are only a few definite detectionsof discs around stars with masses <0.1 M�. For example in thesample of Andrews et al. (2013) using the DCAH98 model, thereare just 15 definite disc detections around stars with mass <0.1 M�(for 42 objects only upper limits for the disc masses were derived,these upper limits vary from 6 × 10⁻⁴–1.3 × 10⁻² M�). The largescatter in the data points and the small number of data points at lowmasses cast doubt to the suggestion that there is a simple relationbetween stellar and disc mass that holds from intermediate-massstars all the way to brown dwarfs and planetary-mass objects. Inother words, these data do not exclude different scaling relationsfor low- and high-mass objects. Another complication comes fromthe fact that when calculating the relation between stellar and discmasses the ages of these objects are not taken into account: discmasses are getting smaller with time either due to viscous evolutionor due to photoevaporation from the host star. Thus, consideringthat discs around low-mass objects have masses that are low andnear the detection limits of current observational facilities, it is morelikely to observe them when they are still young (and therefore havemore mass). Therefore, it may be expected that the discs aroundbrown dwarfs and planets are more massive than what a simpleextrapolation from the MD–M∗ relation for higher mass stars wouldsuggest. The exact effect that the object ages have on the analysesof Andrews et al. (2013) and Mohanty et al. (2013) is difficult toestimate as stellar ages cannot be determined accurately enough(Soderblom et al. 2013).
The disc masses of the objects formed by disc fragmentationin the Stamatellos & Whitworth (2009a) simulations are plottedagainst the masses of the objects in Fig. 3. The disc masses arecalculated from the disc masses in the hydrodynamic simulationsof Stamatellos & Whitworth (2009a) assuming that the discs evolveviscously and using equation (8) with α = 0.01. The time for whicheach disc is evolved is chosen randomly between 1–10 Myr, so
1 In this context, the terms star and stellar are used to refer to any objectsformed by gravitational instability, therefore including brown dwarfs andplanets, as well as hydrogen-burning stars (Whitworth et al. 2007).
Figure 3. Disc masses of objects formed by disc fragmentation versus themasses of the host objects (black squares). The disc masses are calculatedfrom the disc masses in the hydrodynamic simulations of Stamatellos &Whitworth (2009a) assuming that viscous disc evolution and α = 0.01. Thetime for which each disc is evolved is chosen randomly between 1 and10 Myr, so as to emulate the age spread of observed discs. On the graph, wealso plot the best-fitting line (solid black line) and the ±1σ region from thebest fit (dotted black line). The three coloured lines correspond the scalingrelations derived by Andrews et al. (2013) using different evolutionary mod-els (as marked on graph). The difference between the two relations indicatea different formation mechanism for low-mass objects. The difference ismore pronounced at the extreme low-mass regime.
as to emulate the age spread of observed discs. The same figureshows the relations derived by Andrews et al. (2013) using differentevolutionary models to calculate the masses of the host star (DM97,BCAH98, and SDF00 as marked on graph).
There is scatter in the calculated disc masses of objects formedby disc fragmentation due to differences in the initial disc masses(i.e. the mass they have when they separate from the disc of theparent star) and their ages. Most of these discs are more massivethan expected from the scaling MD–M∗ relation (which is mainlydetermined by higher mass stars) by more than a order of magnitudein a few cases. Additionally, there is no significant dependencebetween disc mass and stellar mass in contrast with higher masssystems; we find a relation log (MD) = −3.7−0.005 log (M∗) witha standard deviation of σ = 0.27.
Both of the above characteristics are consequences of formationby disc fragmentation. When a low-mass object forms from gas con-densing out in the parent disc, its properties (and its disc properties)are initially similar to an object that forms from a collapsing corein isolation. However as this object/disc system moves within theparent disc (but before it separates from the parent disc) it accretesmore gas, and therefore its mass increases. This mass is initiallyaccreted on to the object’s disc and then slowly flows on to object.Therefore, when a young object that has formed by disc fragmenta-tion separates from its parent disc and evolves independently, has amore massive disc than it would have if it had formed in an isolationin a collapsing core.
This scenario is consistent with the observations of Andrewset al. (2013) and Mohanty et al. (2013); at least a few discs aroundyoung low-mass objects are more massive than expected. In theirsamples, the detection limit is around ∼10−3 M� and a few of thelow-mass objects that they observed either have lower mass discsor no discs at all. These may be objects that have either formed
MNRAS 449, 3432–3440 (2015)
at The L
ibrary on Novem
ber 9, 2015http://m
nras.oxfordjournals.org/D
ownloaded from

Disc properties of low-mass objects 3437
Figure 4. The evolution of the disc masses of the low-mass objects formedby disc fragmentation in the simulations of Stamatellos & Whitworth(2009a). The disc masses are calculated assuming that viscous disc evo-lution with a viscosity parameter α = 0.01. Disc mass decreases with time.Due to the difference in the initial disc masses there is a wide range of discmasses for each given time.
by the collapse of a low-mass pre-(sub)stellar core like Sun-likestars, or objects that have formed by disc fragmentation but havelost their discs (through evolution with time, see Fig. 4, or due to in-teractions within the disc). The presence of low-mass discs aroundlow-mass objects are consistent with both formation scenarios, butthe presence of relatively high-mass discs are indicative of forma-tion by disc fragmentation. Observations of disc masses around verylow mass objects (�10 MJ), where the predicted MD–M∗ relationfor young objects diverges significantly from the established MD–M∗ relation derived for higher mass stars, will further test the discfragmentation model. Atacama Large Millimeter/submillimeter Ar-ray (ALMA) has the required sensitivity and spatial resolution toobserve such small discs. For example, Ricci et al. (2014), have es-timated disc masses down to ∼0.8–2.1MJ in three young low-massobjects in the Taurus star forming region.
5 AC C R E T I O N R AT E S O N TO W I D E - O R B I TLOW-MASS OBJE C TS
The accretion rates on to low- and higher mass objects may alsorelate to their formation mechanism. In some cases, it is possible toderive accretion rates even when the disc that provides the materialfor accretion is not detectable in the submm, where disc masses areusually measured (Herczeg, Cruz & Hillenbrand 2009; Joergenset al. 2013; Zhou et al. 2014). For example, Herczeg et al. (2009)and Zhou et al. (2014) estimate the accretion luminosity from theexcess line and continuum emission; for low-mass objects, they canestimate accretion rates down to ∼10−13 M� yr−1.
It has been argued that, similarly to the MD–M∗ relation men-tioned in the previous section, there is a relation between accretionrate on to a star and its mass. It has been suggested that this re-lation holds from intermediate-mass stars down to brown dwarfs,namely that M∗ ∝ Ma
∗ , where α ∼ 1.0–2.8, albeit with a large scatter(Calvet et al. 2004; Natta et al. 2004; Mohanty et al. 2005; Muze-rolle et al. 2005; Herczeg & Hillenbrand 2008; Antoniucci et al.2011; Biazzo et al. 2012).
Figure 5. The accretion rates on to stars against their masses for a widerange of stellar masses. The black squares correspond to the objects formedby disc fragmentation in the simulations of Stamatellos & Whitworth(2009a) with accretion rates calculated assuming that viscous disc evolutionwith α = 0.01. The time for which each disc is evolved is chosen randomlybetween 1 and 10 Myr, so as to emulate the age spread of observed discs. Onthe graph, we also plot the best-fitting line (solid black line) and the ±1σ
region from the best fit (dotted black line). The remaining points (coloured)correspond to observational data as marked on the graph. On the graph, wealso plot the best-fitting line for the observations (solid blue line) and the±1σ region from the best fit (dashed blue lines) as estimated by Zhou et al.(2014).
The accretion rates on to stars for a wide range of stellar massesare plotted against the stellar masses in Fig. 5. The accretion ratesshown here have all been measured directly from excess Balmercontinuum emission in the U-band (Gullbring et al. 1998; Herczeg& Hillenbrand 2008; Herczeg et al. 2009; Rigliaco et al. 2011, 2012;Ingleby et al. 2013; Alcala et al. 2014; Zhou et al. 2014). In the samefigure, the best-fitting line that was calculated by Zhou et al. (2014)is also plotted. It is evident from the graph that there is considerablescatter in M∗−M∗ relation, that may reflect a difference in the discinitial conditions (Alexander & Armitage 2006; Dullemond, Natta& Testi 2006). A part of the scatter could also be attributed to thedifferent ages of the systems plotted in Fig. 5; accretion rates dropas stars age (see Fig. 6).
The detection limits of accretion rates are relatively low for plan-ets and brown dwarfs. Most objects with excess emission in theinfrared also have measured U-band accretion rates; thus, it is ex-pected that there is no bias towards detecting only younger objectswith higher accretion rates. In fact most of the observed objectsexhibit low accretion rates. The estimated accretion rates for mostof the low-mass objects (<0.1 M�) are consistent with the M∗−M∗scaling relation derived for higher mass stars. In fact in a few casesthe accretion rates are lower than expected. However in a few cases,like the three planetary-mass companions observed by Zhou et al.(2014) (GSC 06214-00210 b, GQ Lup b, and DH Tau b), the ac-cretion rates are higher than expected; these accretion rates are anorder of magnitude higher than what is expected from the M∗−M∗relation.
In Fig. 5, we also plot the accretion rates of the objects formed bydisc fragmentation in the simulations of Stamatellos & Whitworth(2009a). These accretion rates are calculated using the viscous evo-lution model (equation (7)) with α = 0.01. The time for which eachdisc is evolved is chosen randomly between 1 and 10 Myr, so as
MNRAS 449, 3432–3440 (2015)
at The L
ibrary on Novem
ber 9, 2015http://m
nras.oxfordjournals.org/D
ownloaded from

3438 D. Stamatellos and G. J. Herczeg
Figure 6. The evolution of the accretion rates of the objects formed by discfragmentation in the simulations of Stamatellos & Whitworth (2009a). Theseaccretion rates are calculated using the viscous evolution model (equation (7)with α = 0.01). There is a wide range of accretion rates for a specific age dueto the spread in the initial disc masses. The three red triangles correspondsto the observations of Zhou et al. (2014). Considering the large uncertainties(∼1–5 Myr) in the estimated ages these relatively high accretion rates areconsistent with the predictions of the disc fragmentation model.
to emulate the age spread of observed discs. There is no significantcorrelation between the accretion rate and the mass of the object; wefind a relation log(M∗) = −10.5 − 0.12 log(M∗), with a standarddeviation of σ = 0.3. Moreover, in a few cases the accretion ratesare higher than expected from the M∗−M∗ scaling relation. In themodel that we present here, this is due to the higher initial massof the discs of these objects. As mentioned in the previous section,these secondary discs grow in mass as they move within the discs oftheir parent stars (before they start evolving independently). There-fore, we suggest that the relatively high accretion rates are indicativeof formation by disc fragmentation. On the other hand, low accre-tion rates are consistent with both formation by disc fragmentationor formation by the collapse of low-mass pre-(sub)stellar cores. Inthe former case low accretion rates could be due to time evolution(accretion rate drops with time; see Fig. 6) or due to disruption byinteractions with other objects in the parent disc.
Observations of accretion rates around very low mass objects(�10 MJ; e.g. Zhou et al. 2014), where the predicted M∗−M∗ re-lation relation diverges significantly from the established M∗−M∗relation derived for higher mass stars, will further test the modelpresented here.
6 T H E E F F E C T O F T H E V I S C O S I T YO F S E C O N DA RY D I S C S
We have so far assumed in our analysis that the physical processesfor redistributing angular momentum are the same for discs ofT Tauri stars and for discs of lower mass objects (brown dwarfs,planets). However, this may not be the case. It has been arguedthat the magneto-rotational instability may not be effective in discsaround low-mass objects (Fujii et al. 2014; Keith & Wardle 2014;Szulagyi et al. 2014), which means that the effective viscosity insuch discs should be smaller than the one presumed for T Tauristar discs (α = 0.01). However, these studies have focused on discsaround Jovian planets on Jovian orbits, i.e. orbits relatively close to
Figure 7. Disc masses of objects formed by disc fragmentation versus themasses of the host objects for different disc viscosities. The best-fitting linesare calculated similarly to the ones in Fig. 4, assuming that α = 0.001 (blacksolid line) or α = 0.05 (brown solid line). The dotted lines correspond to the±1σ region from the best fit for each case. The other three coloured linescorrespond to the scaling relations derived by Andrews et al. (2013) (seeFig. 4). The differences between this relation and the ones derived in thispaper (i.e. for objects formed by disc fragmentation) are more pronouncedfor low-viscosity secondary discs.
the central stars (e.g. Gressel et al. 2013). In our study, we focus onwide-orbit low-mass companions (see Fig. 2), whose discs are moreextended as they not limited by the Hill radii of their host secondaryobjects (see Stamatellos & Whitworth 2009a). These discs couldbe massive enough so that angular momentum can be effectivelytransported by gravitational torques.
Nevertheless, our knowledge of the effective viscosity in suchdiscs is limited, and it is important to examine the effect that theassumed disc viscosity has on the conclusions of our study. InFigs 7 and 8, we present the predictions of our model for low-viscosity discs (α = 0.001) and for high-viscosity discs (α = 0.05).As expected, low-viscosity discs evolve slower and their masses andaccretion rates remain higher for longer. Therefore, in this case thedifferences between the predicted MD–M∗ and M∗−M∗ relationsfor disc fragmentation and the observed relations for higher massstars are more pronounced (see black lines in Figs 7 and 8). Theopposite holds for high-viscosity discs (α = 0.05; see brown linesin Figs 7 and 8).
7 C O N C L U S I O N S
We suggest that substellar (planetary-mass objects and browndwarfs) and low-mass stellar objects (low-mass hydrogen-burningstars) that form by disc fragmentation, have disc masses and ac-cretion rates that (i) are independent of the mass of the host objectand (ii) are higher than what is expected from scaling relations de-rived from their intermediate and higher mass counterparts. Theselow-mass objects form similarly to higher mass objects by self-gravitating gas but as they move within the gas-rich parent disctheir individual discs accrete additional material; therefore, beforethese objects separate from their parent discs and evolve indepen-dently (i.e. within a few kyr), their discs grow more massive and theaccretion rates on to them are higher than if they were formedin isolation in collapsing low-mass pre-(sub)stellar cores. The
MNRAS 449, 3432–3440 (2015)
at The L
ibrary on Novem
ber 9, 2015http://m
nras.oxfordjournals.org/D
ownloaded from

Disc properties of low-mass objects 3439
Figure 8. The accretion rates on to stars against their masses for a widerange of stellar masses. The best-fitting lines are calculated similarly to theones in Fig. 5, assuming that α = 0.001 (black solid line) or α = 0.05(brown solid line). The dotted lines correspond to the ±1σ region from thebest fit for each case. On the graph, we also plot the best-fitting line for theobservations (solid blue line) and the ±1σ region from the best fit (dashedblue lines; Zhou et al. 2014). The differences between this relation and theones derived in this paper (i.e. for objects formed by disc fragmentation) aremore pronounced for low-viscosity secondary discs.
assumption of independent evolution is not critical as if these sec-ondary discs were still interacting with their parent disc they wouldaccrete additional material reinforcing the above conclusion. How-ever, we do not expect additional accretion to be important.
Observations of disc masses and accretion rates of low-massobjects are consistent with the predictions of the disc fragmentationmodel. Although the presence of low-mass discs (or lack of discs)and low accretion rates (or no accretion at all) may be attributedto disc evolution and/or disc disruption due to interactions withother objects within the parent disc, relatively high disc massesand high accretion rates are suggestive of formation due to discfragmentation. We therefore suggest that low-mass objects that havediscs with masses higher than expected (or equivalently accretionrates on to them higher than expected), such as GSC 06214-00210b, GQ Lup b, and DH Tau b (Zhou et al. 2014), are young objectsthat have formed by disc fragmentation.
The disc fragmentation model can further be tested by observa-tions of disc masses and accretion rates of very low mass objects(�10MJ). At these very low masses, the MD–M∗ and M∗−M∗ re-lations predicted by the model presented here diverge significantlyfrom the corresponding relations established for higher mass stars.We suggest that future analyses of the MD–M∗ and M∗−M∗ rela-tions should separate the sample into two subgroups, low-mass(<0.2 M�) and higher mass (>0.2 M�) objects, so as to testwhether these objects obey different scaling relations.
The intense interest in wide-orbit and free-floating planets hasgiven momentum to the development of instruments with high sen-sitivity and good spacial resolution. Therefore, observations in thenear future are expected to deliver many more such low-mass ob-jects. ALMA is already delivering such observations (Kraus et al.2014b; Ricci et al. 2014). The study of these objects, their disc prop-erties and the accretion rates on to them (if they are still young), willprovide further constraints regarding their formation mechanism.
AC K N OW L E D G E M E N T S
We would like to thank the referee for many insightful commentsthat helped to improve the paper and clarify our main conclusions.We thank Yifan Zhou for important input in the paper and RichardAlexander for useful comments on photoevaporation. DS thanksThijs Kouwenhoven for his hospitality during a visit to the KavliInstitute for Astronomy & Astrophysics at Peking University, wherepart of this work was completed.
R E F E R E N C E S
Alcala J. M. et al., 2014, A&A, 561, A2Alexander R. D., Armitage P. J., 2006, ApJ, 639, L83Alexander R. D., Clarke C. J., Pringle J. E., 2006, MNRAS, 369, 216Alexander R., Pascucci I., Andrews S., Armitage P., Cieza L., 2013, in-
Beuther H., Klessen R. S., Dullemond C. P., Henning T., (eds),Protostarsand Planets VI. Univ. Arizona Press, Tucson, AZ, p. 475
Aller K. M. et al., 2013, ApJ, 773, 63Andre P., Ward-Thompson D., Greaves J., 2012, Science, 337, 69Andrews S. M., Rosenfeld K. A., Kraus A. L., Wilner D. J., 2013, ApJ, 771,
129Antoniucci S. et al., 2011, A&A, 534, A32Attwood R. E., Goodwin S. P., Stamatellos D., Whitworth A. P., 2009, A&A,
495, 201Bailey V. et al., 2014, ApJ, 780, L4Baraffe I., Chabrier G., Allard F., Hauschildt P. H., 1998, A&A, 337, 403
(BCAH98)Balsara D. S., 1995, J. Comput. Phys., 121, 357Bate M. R., 2009, MNRAS, 392, 590Bate M. R., Bonnell I. A., Bromm V., 2002, MNRAS, 332, L65Beuzit J.-L. et al., 2008, in McLean I. S., Casali M. M., eds, Proc. SPIE
Conf. Ser., Vol. 7014, Ground-based and Airborne Instrumentation forAstronomy II. SPIE, Bellingham, p. 701418
Biazzo K., Alcala J. M., Covino E., Frasca A., Getman F., Spezzi L., 2012,A&A, 547, A104
Bodenheimer P., Pollack J. B., 1986, Icarus, 67, 391Boley A. C., 2009, ApJ, 695, L53Boley A. C., Hayfield T., Mayer L., Durisen R. H., 2010, Icarus, 207, 509Boss A. P., 1988, ApJ, 331, 370Boss A. P., 1997, Science, 276, 1836Boyd D. F. A., Whitworth A. P., 2005, A&A, 430, 1059Calvet N., Muzerolle J., Briceno C., Hernandez J., Hartmann L., Saucedo J.
L., Gordon K. D., 2004, AJ, 128, 1294Chabrier G., Baraffe I., Allard F., Hauschildt P., 2000, ApJ, 542, 464Chabrier G., Johansen A., Janson M., Rafikov R., 2014, in Beuther H.,
Klessen R. S., Dullemond C. P., Henning T., (eds), Protostars and PlanetsVI. Univ. Arizona Press, Tucson, AZ, p. 619
D’Antona F., Mazzitelli I., 1997, Mem. Soc. Astron. Ital., 68, 807 (DM97)Duchene G., Kraus A., 2013, ARA&A, 51, 269Dullemond C. P., Natta A., Testi L., 2006, ApJ, 645, L69Evans T. M. et al., 2012, ApJ, 744, 120Faherty J. K., Burgasser A. J., Cruz K. L., Shara M. M., Walter F. M., Gelino
C. R., 2009, AJ, 137, 1Faherty J. K., Burgasser A. J., West A. A., Bochanski J. J., Cruz K. L., Shara
M. M., Walter F. M., 2010, AJ, 139, 176Favre C., Jørgensen J. K., Field D., Brinch C., Bisschop S. E., Bourke T. L.,
Hogerheijde M. R., Frieswijk W. W. F., 2014, ApJ, 790, 55Forgan D., Rice K., 2011, MNRAS, 417, 1928Forgan D., Rice K., Stamatellos D., Whitworth A. P., 2009, MNRAS, 394,
882Fujii Y. I., Okuzumi S., Tanigawa T., Inutsuka S., 2014, ApJ, 785, 101Galicher R. et al., 2014, A&A, 565, L4Goldreich P., Ward W. R., 1973, ApJ, 183, 1051Goodwin S. P., Whitworth A. P., Ward-Thompson D., 2004, A&A, 414, 633Gressel O., Nelson R. P., Turner N. J., Ziegler U., 2013, ApJ, 779, 59Grether D., Lineweaver C. H., 2006, ApJ, 640, 1051
MNRAS 449, 3432–3440 (2015)
at The L
ibrary on Novem
ber 9, 2015http://m
nras.oxfordjournals.org/D
ownloaded from

3440 D. Stamatellos and G. J. Herczeg
Gullbring E., Hartmann L., Briceno C., Calvet N., 1998, ApJ, 492, 323Hao W., Kouwenhoven M. B. N., Spurzem R., 2013, MNRAS, 433, 867Hartmann L., Calvet N., Gullbring E., D’Alessio P., 1998, ApJ, 495, 385Heggie D. C., 1975, MNRAS, 173, 729Hennebelle P., Chabrier G., 2008, ApJ, 684, 395Hennebelle P., Chabrier G., 2009, ApJ, 702, 1428Herczeg G. J., Hillenbrand L. A., 2008, ApJ, 681, 594Herczeg G. J., Cruz K. L., Hillenbrand L. A., 2009, ApJ, 696, 1589Hopkins P. F., 2013, MNRAS, 430, 1653Ingleby L. et al., 2013, ApJ, 767, 112Ireland M. J., Kraus A. L., Martinache F., Law N., Hillenbrand L. A., 2011,
ApJ, 726, 113Joergens V., Bonnefoy M., Liu Y., Bayo A., Wolf S., Chauvin G., Rojo P.,
2013, A&A, 558, L7Jorgensen J. K., van Dishoeck E. F., Visser R., Bourke T. L., Wilner D. J.,
Lommen D., Hogerheijde M. R., Myers P. C., 2009, A&A, 507, 861Keith S. L., Wardle M., 2014, MNRAS, 440, 89Kratter K. M., Murray-Clay R. A., Youdin A. N., 2010, ApJ, 710, 1375Kraus A. L., Ireland M. J., Martinache F., Lloyd J. P., 2008, ApJ, 679, 762Kraus A. L., Ireland M. J., Martinache F., Hillenbrand L. A., 2011, ApJ,
731, 8Kraus A. L., Ireland M. J., Cieza L. A., Hinkley S., Dupuy T. J., Bowler
B. P., Liu M. C., 2014a, ApJ, 781, 20Kraus A. L., Andrews S. M., Bowler B. P., Herczeg G., Ireland M. J., Liu
M. C., Metchev S., Cruz K. L., 2014b, ApJL, 798, L23Kroupa P., Bouvier J., Duchene G., Moraux E., 2003, MNRAS, 346, 354Kuzuhara M., Tamura M., Ishii M., Kudo T., Nishiyama S., Kandori R.,
2011, AJ, 141, 119Kuzuhara M. et al., 2013, ApJ, 774, 11Lomax O., Whitworth A. P., Hubber D. A., Stamatellos D., Walch S., 2014a,
MNRAS, 439, 3039Lomax O., Whitworth A. P., Hubber D. A., Stamatellos D., Walch S., 2014b,
MNRAS, 447, 1550Low C., Lynden-Bell D., 1976, MNRAS, 176, 367Lynden-Bell D., Pringle J. E., 1974, MNRAS., 168, 603Ma B., Ge J., 2014, MNRAS, 439, 2781Machida M. N., Inutsuka S., Matsumoto T., 2009, ApJ, 699, L157Macintosh B. et al., 2014, Proc. Natl. Acad. Sci. India, 111, 12661Malmberg D., Davies M. B., Heggie D. C., 2011, MNRAS, 411, 859Marcy G. W., Butler R. P., 2000, PASP, 112, 137Marois C., Macintosh B., Barman T., Zuckerman B., Song I., Patience J.,
Lafreniere D., Doyon R., 2008, Science, 322, 1348Mizuno H., 1980, Prog. Theor. Phys., 64, 544Mohanty S., Jayawardhana R., Basri G., 2005, ApJ, 626, 498Mohanty S. et al., 2013, ApJ, 773, 168Molliere P., Mordasini C., 2012, A&A, 547, A105Morris J. P., Monaghan J. J., 1997, J. Comput. Phys., 136, 41Murillo N. M., Lai S.-P., Bruderer S., Harsono D., van Dishoeck E. F., 2013,
A&A, 560, A103Muzerolle J., Luhman K. L., Briceno C., Hartmann L., Calvet N., 2005,
ApJ, 625, 906Natta A., Testi L., Muzerolle J., Randich S., Comeron F., Persi P., 2004,
A&A, 424, 603Naud M.-E. et al., 2014, ApJ, 787, 5Offner S. S. R., Kratter K. M., Matzner C. D., Krumholz M. R., Klein R. I.,
2010, ApJ, 725, 1485Offner S. S. R., Capodilupo J., Schnee S., Goodman A. A., 2012, MNRAS,
420, L53Padoan P., Nordlund A., 2004, ApJ, 617, 559
Parker R. J., Goodwin S. P., 2009, MNRAS, 397, 1041Parker R. J., Goodwin S. P., Kroupa P., Kouwenhoven M. B. N., 2009,
MNRAS, 397, 1577Perets H. B., Kouwenhoven M. B. N., 2012, ApJ, 750, 83Pollack J. B., Hubickyj O., Bodenheimer P., Lissauer J. J., Podolak M.,
Greenzweig Y., 1996, Icarus, 124, 62Pringle J. E., 1981, ARA&A, 19, 137Rameau J. et al., 2013, A&A, 553, A60Rees M. J., 1976, MNRAS, 176, 483Reggiani M., Meyer M. R., 2013, A&A, 553, A124Reipurth B., Clarke C., 2001, AJ, 122, 432Ricci L., Testi L., Natta A., Scholz A., de Gregorio-Monsalvo I., Isella A.,
2014, ApJ, 791, 20Rigliaco E., Natta A., Randich S., Testi L., Covino E., Herczeg G., Alcala
J. M., 2011, A&A, 526, L6Rigliaco E., Natta A., Testi L., Randich S., Alcala J. M., Covino E., Stelzer
B., 2012, A&A, 548, A56Rogers P. D., Wadsley J., 2012, MNRAS, 423, 1896Safronov V. S., Zvjagina E. V., 1969, Icarus, 10, 109Sahlmann J. et al., 2011, A&A, 525, 95Shakura N. I., Sunyaev R. A., 1973, A&A, 24, 337Siess L., Dufour E., Forestini M., 2000, A&A, 358, 593 (SDF00)Silk J., 1977, ApJ, 214, 152Soderblom D. R., Hillenbrand L. A., Jeffries R. D., Mamajek E. E., Nay-
lor T., 2013, in Beuther H., Klessen R. S., Dullemond C. P., HenningT., (eds), Protostars and Planets VI. Univ. Arizona Press, Tucson, AZ,p. 219
Spurzem R., Giersz M., Heggie D. C., Lin D. N. C., 2009, ApJ, 697, 458Stamatellos D., 2014, in Stamatellos D., Goodwin S., Ward-Thompson D.,
eds, Astrophys. Space Sci. Proc., Vol. 36, The Labyrinth of Star Forma-tion. Springer-Verlag, Berlin, p. 17
Stamatellos D., Whitworth A. P., 2009a, MNRAS, 392, 413Stamatellos D., Whitworth A. P., 2009b, MNRAS, 400, 1563Stamatellos D., Whitworth A., 2011, Research, 16, 05001Stamatellos D., Hubber D. A., Whitworth A. P., 2007a, MNRAS, 382, L30Stamatellos D., Whitworth A. P., Bisbas T., Goodwin S., 2007b, A&A, 475,
37Stamatellos D., Maury A., Whitworth A., Andre P., 2011a, MNRAS, 413,
1787Stamatellos D., Whitworth A. P., Hubber D. A., 2011b, ApJ, 730, 32Stamatellos D., Whitworth A. P., Hubber D. A., 2012, MNRAS, 427, 1182Suzuki R. et al., 2009, in Usuda T., Tamura M., Ishii M., eds, AIP Conf.
Proc. Vol. 1158, Exoplanets and Disks: Their Formation and Diversity.Am. Inst. Phys., New York, p. 293
Szulagyi J., Morbidelli A., Crida A., Masset F., 2014, ApJ, 782, 65Thies I., Kroupa P., 2007, ApJ, 671, 767Tobin J. J., Hartmann L., Chiang H.-F., Wilner D. J., Looney L. W., Loinard
L., Calvet N., D’Alessio P., 2012, Nature, 492, 83Tsukamoto Y., Takahashi S. Z., Machida M. N., Inutsuka S., 2015, MNRAS,
446, 1175Whitworth A. P., Stamatellos D., 2006, A&A, 458, 817Whitworth A. P., Bate M. R., Nordlund A&A ., Reipurth B., Zinnecker H.,
2007, inReipurth B., Jewitt D., Keil K. (eds), Protostars and Planets V.Univ. Arizona Press, Tucson, AZ, p. 459
Zhou Y., Herczeg G. J., Kraus A. L., Metchev S., Cruz K. L., 2014, ApJ,783, L17
This paper has been typeset from a TEX/LATEX file prepared by the author.
MNRAS 449, 3432–3440 (2015)
at The L
ibrary on Novem
ber 9, 2015http://m
nras.oxfordjournals.org/D
ownloaded from