article j. braz. chem. soc. - sbq
TRANSCRIPT

Article J. Braz. Chem. Soc., Vol. 31, No. 5, 867-885, 2020Printed in Brazil - ©2020 Sociedade Brasileira de Química
http://dx.doi.org/10.21577/0103-5053.20190249
*e-mail: [email protected]; [email protected]
Crystal Structure and 1H NMR Experimental and Theoretical Study of Conformers of 5-Methyl-1-(4’-methylphenylsulfonylamino)-1H-[1,2,3]-triazole-4-carboxylic Acid Ethyl Ester
and 5-Methyl-1-(phenylsulfonylamino)-1H-[1,2,3]-triazole-4-carboxylic Acid Ethyl Ester
Maria C. R. Freitas, *,a Vinicius R. Campos,b Jackson A. L. C. Resende,c Marcos M. P. da Silva,d Vitor F. Ferreira,e Anna Claudia Cunha,b Jose W. M. Carneiro,f Mateus R. Lage,g,h
Leonardo A. de Souza,i Haroldo C. Silvaf and Wagner B. de Almeida *,f
aDepartamento de Química, Pavilhão de Química, Universidade Federal Rural do Rio de Janeiro, 23890-000 Seropédica-RJ, Brazil
bPrograma de Pós-Graduação em Química, Departamento de Química Orgânica, Instituto de Química, Universidade Federal Fluminense, 24020-141 Niterói-RJ, Brazil
cInstituto de Ciências Exatas e da Terra, Universidade Federal do Mato Grosso, Campus Universitário do Araguaia, 78698-000 Pontal do Araguaia-MT, Brazil
dLaboratório de Estudos do Estado Sólido, Coordenacão de Desenvolvimento Tecnológico da Fundacão Oswaldo Cruz (FIOCRUZ),
Avenida Comandante Guaranys, 447, 22775-903 Rio de Janeiro-RJ, Brazil
eDepartamento de Tecnologia Farmacêutica, Faculdade de Farmácia, Universidade Federal Fluminense, 24241-000 Niterói-RJ, Brazil
fDepartamento de Química Inorgânica, Instituto de Química, Universidade Federal Fluminense (UFF), Outeiro de São João Batista s/n, Campus do Valonguinho, Centro, 24020-141 Niterói-RJ, Brazil
gCoordenação do Curso de Ciência e Tecnologia, Universidade Federal do Maranhão, 65800-000 Balsas-MA, Brazil
hPrograma de Pós-Graduação em Ciência dos Materiais, Centro de Ciências Sociais, Saúde e Tecnologia, Universidade Federal do Maranhão, 65900-410 Imperatriz-MA, Brazil
iDepartamento de Química, Instituto de Ciências Exatas (ICEx), Universidade Federal de Minas Gerais, Campus Universitário, Pampulha, 31270-901 Belo Horizonte-MG, Brazil
We reported experimental and theoretical investigation of conformers of 1,2,3-triazole derivatives, substances of exclusively synthetic origin, subject of extensive studies, because of several biological properties, such as antiviral, antimicrobial and antileishmaniasis. We reported molecular/supramolecular X-ray structures of antiophidian compounds I and II. For I and II there are two crystallographic different molecules in the unit cell (A and B). To explore the causes of the similarities in the compound’s crystal structures, intermolecular interactions were explored using the Hirshfeld surface as the fingerprint plots. In addition, density functional theory (DFT) calculations were carried out at the ωB97x-D/6-31G(d,p)-PCM-CHCl3 level aiming to contribute to the interpretation of the experimental data and complement the experimental findings. Two structures named 2A and 5B were found in good agreement with the respective X-ray solid state ones (A and B). Theoretical 1H nuclear magnetic resonance (NMR) spectra calculated for 5B rotated structure (torsion angles deviation around 40° to 90°) was in fine agreement with experimental results (in CDCl3) indicating that the solution molecular structure is considerably different from optimized equilibrium geometries and solid-state structure. Therefore, care is needed when using X-ray structures or DFT geometries to model interaction of drugs with biological targets since significant conformational changes may take place in solution.
Keywords: crystal structure, triazoles, conformers, Hirshfeld surface, DFT calculations, 1H NMR chemical shifts
Crystal Structure and 1H NMR Experimental and Theoretical Study of Conformers of 5-Methyl-1-(4’-methylphenylsulfonylamino)-1H-[1,2,3]-triazole-4-carboxylic Acid Ethyl Ester
and 5-Methyl-1-(phenylsulfonylamino)-1H-[1,2,3]-triazole-4-carboxylic Acid Ethyl Ester
Maria C. R. Freitas, *,a Vinicius R. Campos,b Jackson A. L. C. Resende,c Marcos M. P. da Silva,d Vitor F. Ferreira,e Anna Claudia Cunha,b Jose W. M. Carneiro,f Mateus R. Lage,g,h
Leonardo A. de Souza,i Haroldo C. Silvaf and Wagner B. de Almeida *,f

Crystal Structure and 1H NMR Experimental and Theoretical Study of Conformers J. Braz. Chem. Soc.868
Introduction
Intermolecular interactions have been pointed out as the key hole in molecular recognition.1 Their consideration in pharmaceutical compounds are important for interpretation of physicochemical properties, such as melting points, stability, solubility and bioavailability.2 CrystalExplorer software,3,4 written by Spackman and McKinnon, based on the Hirshfeld partitioning scheme,5 is a good tool for the analyses of intermolecular interaction in crystalline structures. This can be performed through the use of Hirshfeld surfaces (HS), that define the promolecule electron density into the procrystal.6
On the top of Hirshfeld surface is possible to describe contacts, shorter/longer than the respective van der Walls radii (vdW), in colorimetric way.5 In addition to this tool the fingerprint plots (FPP) are used to map the distribution of atom distances, inside and outside the isosurface, showing molecular interactions indistinguishable feature. With the FPP, it is possible to map, for example, H-bonds, interactions like C−H···pi, C−H···halogen, halogen···halogen, as well as contacts involving sulfur.7
Spatial orientation of radical groups around simple bonds, due to free rotation degree, distinguish them in their conformers. If the rotational energy barrier is high, both conformers will be detected in the respective solutions, and in this case nuclear magnetic resonance (NMR) analysis is a good technique to distinguish them.8 However, for some cases where these barriers are not sufficiently high, and in solution, depending on the solvent, the conformers cannot be distinguished.
In solid state the intermolecular interactions can induce orientation of molecules inside the crystalline solid favoring one conformer over another.9,10 Since the intermolecular interactions are static and directly orientated, it is possible to observe the conformers orientation difference, forming, for example, polymorphic structures.9 For single crystal conformers, which structure can be determined by X-ray diffraction (XRD) technique, an investigation of their intermolecular interactions can be done through HS.
In this paper, we report an experimental and theoretical study of 1,2,3-triazole compounds, which represent an important class of five-membered nitrogenated aromatic heterocyclic molecules of exclusively synthetic origin.11-13 They have been the subject of extensive studies14-23 because of their several biological properties, such as antiviral, antineoplastic, trypanocidal, antimicrobial, anticlotting, antiplatelet activity and leishmaniasis. The 1,2,3-triazole derivatives are remarkably stable and essentially inert to oxidation, reduction and hydrolysis in acidic and basic conditions.
We described the synthesis of a ser ies of 1-arylsulfonylamino-5-methyl-1H-[1,2,3]-triazole-4-carboxylate derivatives, evaluated their ability to neutralize some in vitro and in vivo activities caused by Bothrops jararaca and Lachesis muta venoms.24,25 From this study we identified two compounds (I and II) (Scheme 1) with antiophidian activity, which may be useful as prototypes for the design of new molecules to improve the current treatment used for B. jararaca and L. muta snake bites.
The synthesis of the substances I and II is shown in Scheme 1. The ethyl 2-diazoacetoacetate (1) was
Scheme 1. Synthesis of compounds I and II with antiophidian activity.

Freitas et al. 869Vol. 31, No. 5, 2020
condensed with arylsulfonylhydrazides (3a-3b), yielding the corresponding diazo-hydrazone intermediates (4a-4b), which underwent 1,5-electrocyclization leading to the desired 1,2,3-triazole derivatives I and II.
Following our interest on the synthesis of triazoles with potential pharmacological activity, we reported here the molecular and supramolecular X-ray structures of antiophidian compounds I and II present in Scheme 1. It was observed conformational differentiation for both packings. For I and II there are two crystallographic different molecules in the unit cell (named A and B). To explore the causes of the similarities in the crystal structures of the compounds the intermolecular interactions were explored using the HS as the FPP. In addition, density functional theory (DFT) calculations were performed to sample the plausible molecular
structure for these triazole species, aiming to contribute to the interpretation of the experimental and complement the experimental findings.26 DFT NMR chemical shift calculations in chloroform solution was performed and comparison with experimental 1H NMR spectrum in CDCl3 enabled the elucidation of the molecular structure in solution, besides the X-ray determination of the solid-state structure.
Results and Discussion
Crystal structure
The crystallographic data of both compounds (I and II) are reported in Table 1 and in Figure 1 the Oak Ridge thermal ellipsoid plot (ORTEP) draw for both compounds
Table 1. Crystallographic data and structure refinement of I and II
Identification code I II
Empirical formula C24H28N8O8S2 C28HN4O8S2
Formula weight / (g mol-1) 620.67 648.71
Temperature / K 150(2) 293(2)
Crystal system monoclinic monoclinic
Space group P21 P21
a / Å 10.2099(5) 10.311(2)
b / Å 10.3544(4) 10.463(2)
c / Å 14.5191(8) 15.257(3)
α / degree 90 90
β / degree 107.530(5) 106.50(3)
γ / degree 90 90
Volume / Å3 1463.64(13) 1578.2(6)
Z 2 2
ρcalc / (g cm-3) 1.4082 1.365
μ / mm-1 0.242 0.228
F(000) 648.8 680.0
Crystal size / mm3 0.21 × 0.18 × 0.05 0.14 × 0.10 × 0.04
Radiation Mo Kα (λ = 0.71073 Å) Mo Kα (λ = 0.71073 Å)
2θ range for data collection / degree 4.18 to 58.84 6.796 to 50.052
Index ranges −13 ≤ h ≤ 14, −13 ≤ k ≤ 13, −12 ≤ l ≤ 18 −12 ≤ h ≤ 12, −12 ≤ k ≤ 12, −18 ≤ l ≤ 18
Reflections collected 11234 28424
Independent reflections 6788 [Rint = 0.0404, Rsigma = 0.0910] 5567 [Rint = 0.1577, Rsigma = 0.1016]
Data/restraints/parameters 6788/0/378 5567/1/397
Goodness-of-fit on F2 1.051 1.017
Final R indexes [I ≥ 2σ (I)] R1 = 0.0615, wR2 = 0.1127 R1 = 0.0588, wR2 = 0.0957
Final R indexes [all data] R1 = 0.0967, wR2 = 0.1323 R1 = 0.1575, wR2 = 0.1228
Largest diff. peak/hole / (e Å-3) 0.75/−0.47 0.17/−0.22
Z: number of formula units in the unit cell; ρcalc: calculated density; μ: absorption coefficient; F(000): structure factor evaluated in the zeroth order case; R: residual factor.

Crystal Structure and 1H NMR Experimental and Theoretical Study of Conformers J. Braz. Chem. Soc.870
(Figure 1a for I and Figure 1b for II) are shown. As can be seen in Table 1 both compounds belong to the monoclinic system. The symmetry element present in both structures is a 21 screw axe, along b. Both compounds crystallize as solvent-free in a non-centrosymmetric space group, P21. In the asymmetric unit there are two molecules, as can be seen in the ORTEP draw present in Figure 1a for I and Figure 1b for II, and in the primitive unit cell there are four molecules, Z = 2. The two distinct crystallographic
molecules in the asymmetric unit correspond to different conformers (named A and B). There is no chiral carbon in the molecule. However, the spatial differentiation is caused by the orientation of the phenyl group in relation to the methyl group in the C5 of triazole ring, forming different conformations.
The superimposings of the conformers present in the asymmetric unit are shown in Figure 2. Since the crystal structure belongs to a non-centrosymmetric space group
Figure 1. ORTEP draw of both conformers (A and B) present in the asymmetric unit of (a) I and (b) II, ellipsoids at 50% of probability.
Figure 2. Overlay diagram of the two enantiomers of molecular structures of: (a) I and (b) II where red corresponds to conformer A and green to B.
Freitas et al. 871Vol. 31, No. 5, 2020
and there are two distinguish conformers in the asymmetric unit, a racemic mixture is observed. In this case is not necessary to use the Cu Kα radiation to calculate Flack parameter.27 Here we would like to cite the possibility to find the absolute structure for non-centrosymmetric space groups, using the CRYSTALS software,28 as described in the recent paper of Cooper et al.28 published in 2016, for structures with just one conformer.
Bond distances and some selected angles are given in Table 2. The biggest bond distance concern C10‑S1, with observed values around 1.7 Å, which are bigger than characteristic sulfonamide functional group (1.633).29 Next are the bond distances for Csp3-Csp3 (C5−C6/C5B−C6B) which are equal to 1.480(5)/1.483(5) in I and 1.467(9)/1.458(10) in II. The C15−C16/C15B‑C16B distance found for the toluil are bigger than C5‑C6/C5B‑C6B in the triazole ring. This phenomenon is expected due to the strong dipolar moment in 1,2,3-triazole rings30 what makes the C5 deficient in electrons, shortening the C5−C6 bond compared to the C15−C16. As expected, the C−C bond distances in the triazole as well as in phenyl ring are all characteristic of aromatic bonds, since their average bonds distances are equal to 1.36(6) bigger than double bonds and shorter than simple bonds.31 The simple N4−S1 bond can allow free rotation, providing two different conformers (A and B), and the spatial conformation differentiation is caused by H-bond. The same interaction is observed for both conformers and the atoms involved are O3/O3B-carbonyl and N4–H4/N4B–H4B. It was observed that in both molecules due to these H-bonds a supramolecular structure is formed, exhibiting a 1D zig-zag chain along b axis (Figure 3). As a consequence of the H-bond orientation, regarding the dihedral angle N1‑N4−S1−C10 (f1), existence of free rotation in this point of the molecule drive to two different conformers. The dihedral angle values are equal to −61.9(4)° and 76.0(4)°, respectively for IA and IB, and −66.8(6)° and 77.7(6)° for IIA and IIB. Conformers’ geometrical difference concerns the orientation around the C5‑N1−N4−S1 as seen in Figure 2 by the superimpose of them. In Figure 3 is highlighted the H-bonds, which lead to these orientations. Also given in Table 2 are the C6‑C5‑N1−N4 and C5‑N1−N4−S1 dihedral angles, where very small changes are observed comparing I and II. As can be noticed in general the introduction of a methyl in the phenyl ring from compound I to II causes a discrete differentiation comparing the angle and bond distances. The intermolecular interaction was explored by the construction of the Hirshfeld surface (HS) as the fingerprint plots, using the CrystalExplorer software.32
Supramolecularity through HS
As described in the previous section, in both compounds two conformers are present in the solid state (A and B). The spatial orientation differentiation occurs over the dihedral angle C5−N1−N4−S1 (named f2). For the full description of these supramolecular arrays we have done the construction of the HS6 to map these H-bonds interactions33 as FPP.7 As can be seen in the Figure 4, surfaces constructed using dnorm function were illustrated as transparent hollow maps in order to clearly visualize the benzoannelated c-pyrone moiety inside the surface. The red regions colored in the dnorm of the HS correspond to close contacts, shorter than the van der Walls radii sum.33 For compound IA/B, dnorm surfaces are mapped over color scale of −0.533(A)/−0.621(B) (red) to 1.775(A)/1.800(B) Å (blue), and volume of 359.71(A)/358.09(B) Å3. For compound IIA/B dnorm surfaces are mapped over color scale of −0.256(A)/−0.301(B) (red) to 1.629(A)/1.636(B) Å (blue), and volume of 387.47(A)/387.47(B) Å3. As can be seen red regions occurrences are closer to the carbonyl group. Geometric parameters for H-bond distances as short contacts, specially found involving the phenyl group, are given in Table 3. In Figure 5, the FPP and the respective assignment of the short distances are shown. In the FPP, it was observed short wings that have been described as characteristic of C−H···π interaction33 besides H-bond. Comparing the FPP of I and II it can be noticed that the short contacts are H···H for II and O···H for I. This can be explained by the fact that II is more packed than I.
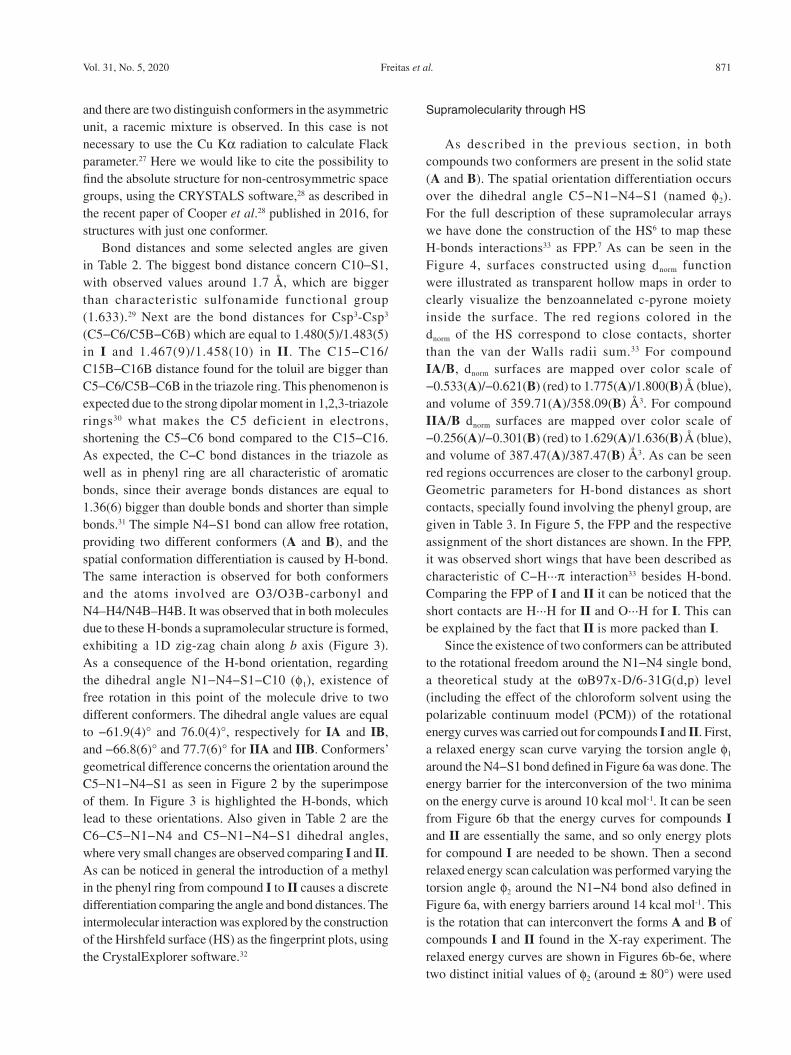
Since the existence of two conformers can be attributed to the rotational freedom around the N1−N4 single bond, a theoretical study at the ωB97x-D/6-31G(d,p) level (including the effect of the chloroform solvent using the polarizable continuum model (PCM)) of the rotational energy curves was carried out for compounds I and II. First, a relaxed energy scan curve varying the torsion angle f1 around the N4−S1 bond defined in Figure 6a was done. The energy barrier for the interconversion of the two minima on the energy curve is around 10 kcal mol-1. It can be seen from Figure 6b that the energy curves for compounds I and II are essentially the same, and so only energy plots for compound I are needed to be shown. Then a second relaxed energy scan calculation was performed varying the torsion angle f2 around the N1−N4 bond also defined in Figure 6a, with energy barriers around 14 kcal mol-1. This is the rotation that can interconvert the forms A and B of compounds I and II found in the X-ray experiment. The relaxed energy curves are shown in Figures 6b-6e, where two distinct initial values of f2 (around ± 80°) were used

Crystal Structure and 1H NMR Experimental and Theoretical Study of Conformers J. Braz. Chem. Soc.872
to generate two f1 scan curves varying each dihedral angle from 0 to 360° in step size of 20° (Figures 6b and 6c). The same hold for the two f2 scan curves with different initial values of the f1 dihedral angle (around ± 80°) as shown in Figures 6d and 6e. These initial f1/f2 values are indicated in
Figure 6. Therefore, six distinct minimum energy structures were located on the four energy curves (the A and B labels stand for the two forms of compounds I and II given by the f2 torsion angle). These six plausible structures were used in full geometry optimization calculation at the
Table 2. Selected bond lengths and angles for IA, IB, IIA and IIB
AtomsBond length / Å
IA/IB IIA/IB
N1–N2/N1B–N2B 1.372(4)/1.371(4) 1.354(7)/1.358(7)
N2–N3/N2B–N3B 1.291(4)/1.292(4) 1.281(7)/1.293(8)
N3–C4/N3B–C4B 1.382(5)/1.377(5) 1.356(8)/1.361(8)
C4–C5/C4B–C5B 1.380(5)/1.368(5) 1.377(9)/1.366(10)
C5–C6/C5B–C6B 1.480(5)/1.483(5) 1.467(9)/1.458(10)
C4–C7/C4B–C7B 1.466(5)/1.463(5) 1.440(9)/1.468(11)
C7–O3/C7B–O3 1.213(4)/1.223(4) 1.199(8)/1.197(9)
C7–O4/C7B–O4B 1.328(4)/1.319(4) 1.325(8)/1.313(9)
O4–C8/O4B–C8B 1.467(4)/1.469(4) 1.458(8)/1.465(9)
C8–C9/C8B–C9B 1.498(6)/1.484(5) 1.477(9)/1.461(11)
N1–C5/N1B–C5B 1.358(5)/1.348(5) 1.340(8)/1.336(8)
N1–N4/N1B–N4B 1.396(4)/1.384(4) 1.374(8)/1.361(8)
N4–S1/N4B–S1B 1.667(3)/1.649(3) 1.640(6)/1.628(6)
S1–O1/S1B–O1B 1.431(3)/1.430(3) 1.421(5)/1.426(5)
S1–O2/S1B–O2B 1.423(3)/1.442(3) 1.438(5)/1.420(5)
S1–C10/S1B–C10B 1.756(4)/1.754(4) 1.751(8)/1.761(8)
C10–C11/C10B–C11B 1.388(5)/1.387(5) 1.38(1)/1.380(9)
C11–C12/C11B–C12B 1.380(6)/1.377(6) 1.38(1)/1.39(1)
C12–C13/C12B–C13B 1.370(6)/1.390(6) 1.39(1)/1.37(1)
C13–C14/C13B–C14B 1.373(6)/1.363(6) 1.37(1)/1.359(1)
C14–C15/C14B–C15B 1.393(5)/1.400(6) 1.37(1)/1.38(1)
C15–C10/C15B–C10B 1.384(5)/1.383(5) 1.35(1)/1.35(1)
C15–C16/C15B–C16B – 1.51(1)/1.51(1)
Bond angle / degree
IA/IB IIA/IB
N1–N4–S1/N1B–N4B–S1B 115.6(2)/117.6(2) 117.2(5)/119.9(5)
N4–S1–C10/N4B–S1B–C10B 110.1(2)/110.5(2) 108.3(3)/109.4(3)
O1–S1–O2/O1B–S1B–O2B 121.5(2)/121.6(2) 121.6(4)/122.0(4)
C4–C5–N1/C4B–C5B–N1B 102.1(3)/102.9(3) 101.1(6)/101.7(7)
N3–N2–N1/N3B–N2B–N1B 106.2(3)/106.0(3) 106.0(5)/105.3(6)
O4–C8–C9 108.1(3)/107.9(3) 108.1(6)/107.7(8)
O4–C7–C4 114.4(3)/113.5(3) 114.4(7)/111.9(8)
Torsion angle / degree
IA/IB IIA/IB
N1–N4–S1–C10/N1B–N4B–S1B–C10B –61.9(4)/76.0(4) –66.8(6)/77.7(6)
C6–C5–N1–N4/C6B–C5B–N1B–N4B 5.1(7)/–2.1(7) 3.26(1)/–0.81(1)
C5–N1–N4–S1/C5B–N1B–N4B–S1B –97.1(5)/98.9(5) –93.8(7)/95.9(7)

Freitas et al. 873Vol. 31, No. 5, 2020
Figure 3. 1D extension representation of (a) I and (b, c) II. Red color corresponds to A and green to B conformers. All extensions are along b axes. Highlighted by the red circle is the phenyl group orientation in relation to the triazole ring caused by H-bond.
Figure 4. HS and neighbors’ molecules that interact due to H-bonds to compounds (a) I and (b) II.

Crystal Structure and 1H NMR Experimental and Theoretical Study of Conformers J. Braz. Chem. Soc.874
Table 3. Selected distances for conventional hydrogen-bonds interactions and short contacts
D−H···A D−H / Å H···A / Å D···A / Å D−H···A / degree
I
N4−H4···O3i 0.91 2.01 2.860(6) 156
N4−H4···N3i 0.91 2.62 3.253(6) 127
N4B−H4B···O3Bii 0.97 1.84 2.801(6) 168
C8−H8A···O2Biii 0.99 2.56 3.416(6) 144
C14−H14···O1iv 0.95 2.52 3.354(7) 146
C14B−H14B···O2Bv 0.95 2.53 3.399(6) 151
C15B−H15B···O1Bv 0.95 2.51 3.268(7) 136
II
N4−H4···O3ii 0.86 2.50 2.880(8) 108
N4−H4···O3ii 0.86 2.44 3.277(9) 163
N4B−H4B···O3Bvi 0.86 2.29 2.840(8) 122
N4B−H4B···N3Bvi 0.86 2.38 3.201(9) 159
C12−H12···O1vii 0.93 2.52 3.386(11) 154
C14B−H14B···O20iv 0.93 2.58 3.474(11) 160
i = -x, –1/2 + y, –z; ii = 1 – x, –1/2 + y, 1 – z; iii = –1 + x, 1 + y, z; iv = 1 – x, 1/2 + y, –z; v = 2 – x, 1/2 + y, 1 – z; vi = 2 – x, –1/2 + y, –z; vii = –x, 1/2 + y, 1 – z.
Figure 5. Fingerprint plots (FPP) with respective short contacts assigned in the graphics.
Freitas et al. 875Vol. 31, No. 5, 2020
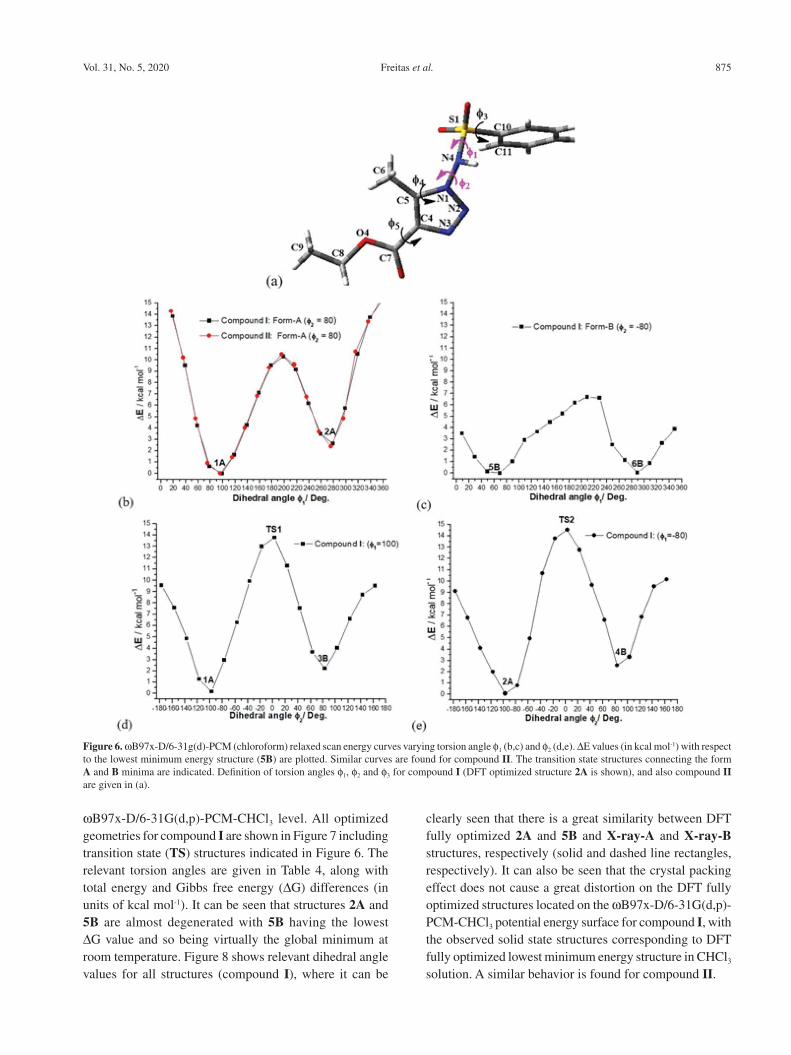
ωB97x-D/6-31G(d,p)-PCM-CHCl3 level. All optimized geometries for compound I are shown in Figure 7 including transition state (TS) structures indicated in Figure 6. The relevant torsion angles are given in Table 4, along with total energy and Gibbs free energy (ΔG) differences (in units of kcal mol-1). It can be seen that structures 2A and 5B are almost degenerated with 5B having the lowest ΔG value and so being virtually the global minimum at room temperature. Figure 8 shows relevant dihedral angle values for all structures (compound I), where it can be
clearly seen that there is a great similarity between DFT fully optimized 2A and 5B and X-ray-A and X-ray-B structures, respectively (solid and dashed line rectangles, respectively). It can also be seen that the crystal packing effect does not cause a great distortion on the DFT fully optimized structures located on the ωB97x-D/6-31G(d,p)-PCM-CHCl3 potential energy surface for compound I, with the observed solid state structures corresponding to DFT fully optimized lowest minimum energy structure in CHCl3 solution. A similar behavior is found for compound II.
Figure 6. ωB97x-D/6-31g(d)-PCM (chloroform) relaxed scan energy curves varying torsion angle f1 (b,c) and f2 (d,e). ΔE values (in kcal mol-1) with respect to the lowest minimum energy structure (5B) are plotted. Similar curves are found for compound II. The transition state structures connecting the form A and B minima are indicated. Definition of torsion angles f1, f2 and f3 for compound I (DFT optimized structure 2A is shown), and also compound II are given in (a).
Crystal Structure and 1H NMR Experimental and Theoretical Study of Conformers J. Braz. Chem. Soc.876
In addition to solid state X-ray diffraction results, determination of the molecular structure present in solution is of fundamental importance since the real application of drugs of potential biological activity is in solution (mainly aqueous media). To pursue this aim 1H NMR experiments in CDCl3 solution were conducted providing reliable indirect information on the molecular structure present in solution. DFT calculations of NMR chemical shifts for the equilibrium minimum energy structures shown in Figure 7 were carried out at the B3LYP/6-31G(d,p)-
PCM-CHCl3 level. The experimental and theoretical 1H NMR spectra for compound I are shown in Figure 9. It is worth saying that a comparison between experimental and B3LYP/6-31G(d,p)-PCM-dimethyl sulfoxide (DMSO) chemical shifts (CH and CH3 protons) results for a highly flexible flavonoid compound (rutin) enabled the unambiguous determination of the preferred molecular structure in DMSO solution,34 with analysis of experimental and calculated 1H NMR signals for CHn proton being shown to yield reliable information on the likely conformation of
Figure 7. ωB97x-D/6-31G(d,p)-PCM-chloroform fully optimized structures (a,c,d,f,g,h) from relaxed potential energy scans (Figure 1) and X-ray solid state structures (j,k) for compound I. The relevant dihedral angles f1, f2, f3 are specified. A new fully optimized structure (7A) obtained using as input a random combination of torsion angles is also shown (i). The atoms related to the dihedral angle f2 are highlighted since this angle differentiate the forms A and B of the X-ray structures. First order transition state (TS) structures connecting forms A and B are shown (b,e).

Freitas et al. 877Vol. 31, No. 5, 2020
organic molecules in solution. In the present work there is a relevant N−H proton signal that can be used to discriminate between various possible conformations. It is already known that the B3LYP functional describes well NMR signals for CHn protons, however, NMR signals for N−H protons are more difficult to be reproduced theoretically since they
are more likely to be affected by interactions with solvent molecules (commonly through H-bond). The difficulty of the PCM model to fully reproduce the effect of solvent hydrogen bonding on chemical shift, as is the case CHCl3, has been emphasized by Benzi et al.35 In order to address this specific point a detailed theoretical analysis of various amine compounds, where experimental data in CHCl3 solution is available, was carried out.36 The results pointed out that N−H 1H NMR chemical shifts are systematically underestimated at the DFT and ab initio post-Hartree Fock (HF) PCM-CHCl3 level of theory, with the size of deviation being strongly dependent on the specific molecule investigated. It was found that the use of explicit solvent molecules in the NMR calculations improves considerably the agreement with experimental data in solution, however, such approach is not computationally viable for large and flexible molecules. Nevertheless, it is possible to find an estimate scaling factor to correct for this limitation of the calculations using the PCM model to mimic the solvent effect, which is a simple procedure. An approximate average factor of 0.948 seems adequate to be used in the N−H proton magnetic isotropic tensor to generate chemical shift values that can be compared to the experimental data measured in chloroform solution reported in this work. Therefore, the N−H chemical shift data reported in Figure 9
Table 4. X-ray and DFT ωB97x-D/6-31G(d,p)-PCM-CHCl3 torsion angles (f) for fully optimized plausible structures of compound I. Relative DFT (ωB97x-D functional) energies are also given. See Figure 6 for definition of f. X-ray data and dihedral angles for transition state (TS1, TS2) and rotated structures (2A’, 5B’) are also given
Compound I
Torsion angle / degreeΔGrel (ΔErel) / (kcal mol-1)f1:
N1−N4−S1−C10f2:
C5−N1−N4−S1f3:
C11−C10−S1−Of’1:
H−N4−S1−C10f4:
C6−C5−N1−N4f5:
O4−C7−C4−C5
Fully optimized structures
1A 70.3 −100.2 −162.9 −164.4 −2.8 2.8 1.8 (0.2)
2A (ca. X-ray-A) −63.1 −92.6 −164.9 65.8 1.5 3.4 0.5 (0.0)
3B 89.0 80.8 −147.4 −139.3 0.8 −1.7 3.1 (2.3)
4B −56.4 88.6 −161.8 81.5 2.4 −0.6 3.7 (2.4)
5B (ca. X-ray-B) 63.9 93.7 −153.7 −65.0 −1.3 −1.5 0.0 (0.1)
6B −72.2 100.6 −155.5 162.6 1.8 −3.5 1.4 (0.2)
7A Opta 166.9 −93.8 −131.8 −70.2 1.0 2.4 2.0 (3.0)
TS1: 1A → 3B 67.9 2.9 168.1 −156.6 7.7 −1.5 13.8 (15.2)
TS2: 2A → 4B −65.4 2.9 −120.2 78.9 4.8 −0.5 14.5 (15.6)
X-ray structures
X-ray-A −61.9 (4) −97.1 (5) −146.1 (5) 70.4 (4) 5.1 (7) 11.1 (7) −
X-ray-B 76.0 (4) 98.8 (5) −166.8 (5) −55.8 (4) −1.9 (7) −6.4 (7) −
f1, f2, f3 rotated structures
2A’-rotated −150 −46 −95 −21.1 1.5 3.4 (26.4)
5B’-rotated −150 93.6 (Opt) −95 −21.1 −1.3 −1.5 (16.3)aNew structure, not contemplated by Figure 1, obtained from full re-optimization of structure 2A’-rotated. ΔGrel: Gibbs free energy difference; ΔErel: total energy difference.
Figure 8. ωB97x-D/6-31G(d,p)-PCM-chloroform fully optimized selected torsion angles for plausible molecular structures of compound I, along with corresponding X-ray data. The theoretical torsion angles equivalent to solid-state X-ray data are highlighted in the green (2A: form A) and pink (5B: form B) rectangles.
Crystal Structure and 1H NMR Experimental and Theoretical Study of Conformers J. Braz. Chem. Soc.878
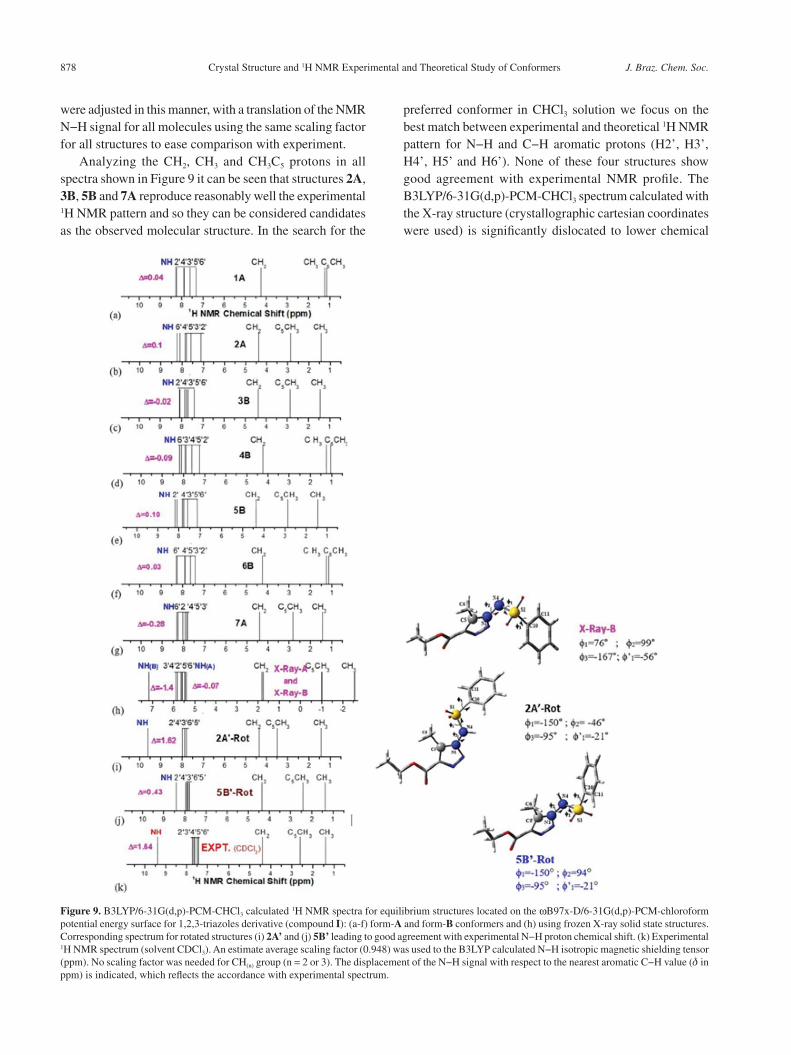
were adjusted in this manner, with a translation of the NMR N−H signal for all molecules using the same scaling factor for all structures to ease comparison with experiment.
Analyzing the CH2, CH3 and CH3C5 protons in all spectra shown in Figure 9 it can be seen that structures 2A, 3B, 5B and 7A reproduce reasonably well the experimental 1H NMR pattern and so they can be considered candidates as the observed molecular structure. In the search for the
preferred conformer in CHCl3 solution we focus on the best match between experimental and theoretical 1H NMR pattern for N−H and C−H aromatic protons (H2’, H3’, H4’, H5’ and H6’). None of these four structures show good agreement with experimental NMR profile. The B3LYP/6-31G(d,p)-PCM-CHCl3 spectrum calculated with the X-ray structure (crystallographic cartesian coordinates were used) is significantly dislocated to lower chemical
Figure 9. B3LYP/6-31G(d,p)-PCM-CHCl3 calculated 1H NMR spectra for equilibrium structures located on the ωB97x-D/6-31G(d,p)-PCM-chloroform potential energy surface for 1,2,3-triazoles derivative (compound I): (a-f) form-A and form-B conformers and (h) using frozen X-ray solid state structures. Corresponding spectrum for rotated structures (i) 2A’ and (j) 5B’ leading to good agreement with experimental N−H proton chemical shift. (k) Experimental 1H NMR spectrum (solvent CDCl3). An estimate average scaling factor (0.948) was used to the B3LYP calculated N−H isotropic magnetic shielding tensor (ppm). No scaling factor was needed for CH(n) group (n = 2 or 3). The displacement of the N−H signal with respect to the nearest aromatic C−H value (d in ppm) is indicated, which reflects the accordance with experimental spectrum.
Freitas et al. 879Vol. 31, No. 5, 2020
shift values, showing even negative chemical shift values for CH3 group evaluated with respect to tetramethylsilane (TMS). However, when the whole spectrum is translated to the right side it can be seen that there is an approximate agreement between X-ray and experimental NMR relative signal positions for N−H, CH-aromatic and CH2 protons. Analysis of 1H NMR profile is more useful than absolute chemical shift values, and so, even with this apparent agreement with experimental NMR pattern, the CH3 protons in the X-ray structure exhibit a large deviation (just over 1 ppm) from the corresponding signals in chloroform solution. It can be seen that scaling the X-ray simulated spectrum to reproduce the CH2 proton signal still leaves the CH3 NMR chemical shift far away from the experimental data in CDCl3 solution, strongly indicating that the X-ray structure (form B) is not present in solution as well all DFT fully optimized structures.
Following the procedure recently reported in de Souza et al.,34 we decided to perform random rotations of the torsion angles f1, f2 and f3 (see Figure 6a) for structures 2A and 5B, keeping the remaining geometrical parameters at their fully optimized values, followed by NMR calculations in attempt to find the best match between experimental and theoretical 1H NMR data. After various tentative inputs we found a combination of f’s that leads to a very reasonable accordance with experimental NMR profile (structures named 2A’-rotated and 5B’-rotated, last two lines of Table 4). These 1H NMR spectra are shown in Figures 9i and 9j, respectively, along with the corresponding structures and rotated dihedral angles. It can be seen that both rotated structures reproduce fairly well the NMR profile with the 5B’-rotated structure showing the best overall agreement for all protons (N−H, C−H aromatic, CH2 and CH3), being the best candidate as the observed molecular structure for compound I in chloroform solution. It should be said the theoretical N−H chemical shift must be seen as a qualitative value,36 however, allowing analysis of the 1H NMR pattern, which is the relevant information for structural analysis. A useful quantity to help examination of NMR spectrum is the difference between N−H signal and the largest C−H aromatic value, named here as Δ quote in Figure 9. The sizeable deviation between 5B’-rotated structure (Δ = 0.43 ppm) and experimental (Δ = 1.64 ppm) NH signal, shown in Figures 9j-9k, can be attributed to the difficulty in calculating the NH magnetic tensor, probably due to solvent effect, not properly accounted for by using the PCM continuum model. The structure 2A’-rotated was further fully optimized with the optimized f1, f2 and f3 torsion angles being given in Table 4 (named 7A) and the spectrum shown in Figure 9g. It can be seen that the accordance with experiment is destroyed when the torsion
angles are fully optimized (true minimum on the potential energy surface). The spectra reported in Figures 9i and 9j clearly reveal that the molecular structure predominant in chloroform solution are considerably different from the DFT fully optimized geometry and solid-state structure. This is an interesting result since in molecular modeling studies of drugs binding to biological targets it is a common procedure to use DFT gas phase optimized geometries or X-ray structures, assuming that there will be no significant change in the drug molecular structure in solution, where drug-receptor interaction takes place.
It should be mentioned that the energy barrier around 14 kcal mol-1 (evaluated including the chloroform solvent effect using the PCM model) obtained from Figures 6d and 6e for the rotation around the N1−N4 bond (f2) may not quite facilitate a fast interchange of the two minimum energy structures, which is also reflected in the 1H NMR spectrum, where no distinction between the two conformers (A and B forms) was observed by duplication in the chemical shifts. The f2 energy curves shown in Figure 6 allow us to estimate energy barriers for the interconversion between structures 1A and 3B (Figure 6d) and 2A and 4B (Figure 6e). However, the energy barrier for the interconversion between the two DFT optimized structures similar to X-ray-A and X-ray-B structures (2A ↔ 5B) cannot be directly obtained from the torsion energy curves. It can be seen that the discrimination between the conformers just occurs in the solid state. We can suppose that crystallization drives the molecule to two conformers, favored by the intermolecular interactions. It can be seen from Figure 9 that the spectra for 2A’-rotated and 5B’-rotated, showing an agreement with experimental 1H NMR profile in chloroform, exhibit distinct N−H and CH3‑C5 signals and these different NMR patterns should be experimentally observed, if a conformational interchange between these two structures would take place, producing a rather distinct 1H NMR profile than that experimentally observed in this work with just a single NMR signal for N−H and CH3‑C5 protons. These results are in consonance with the energy barriers for rotation around the N1−N4 bond (f2) reported in Figures 6d and 6e.
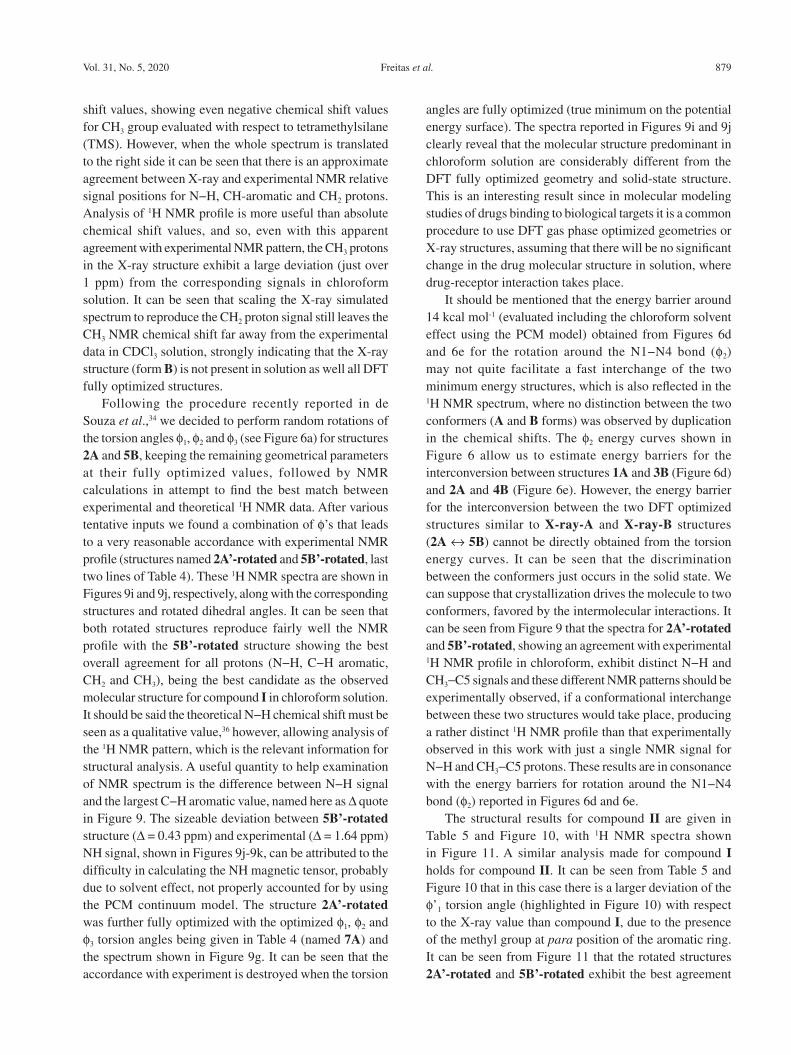
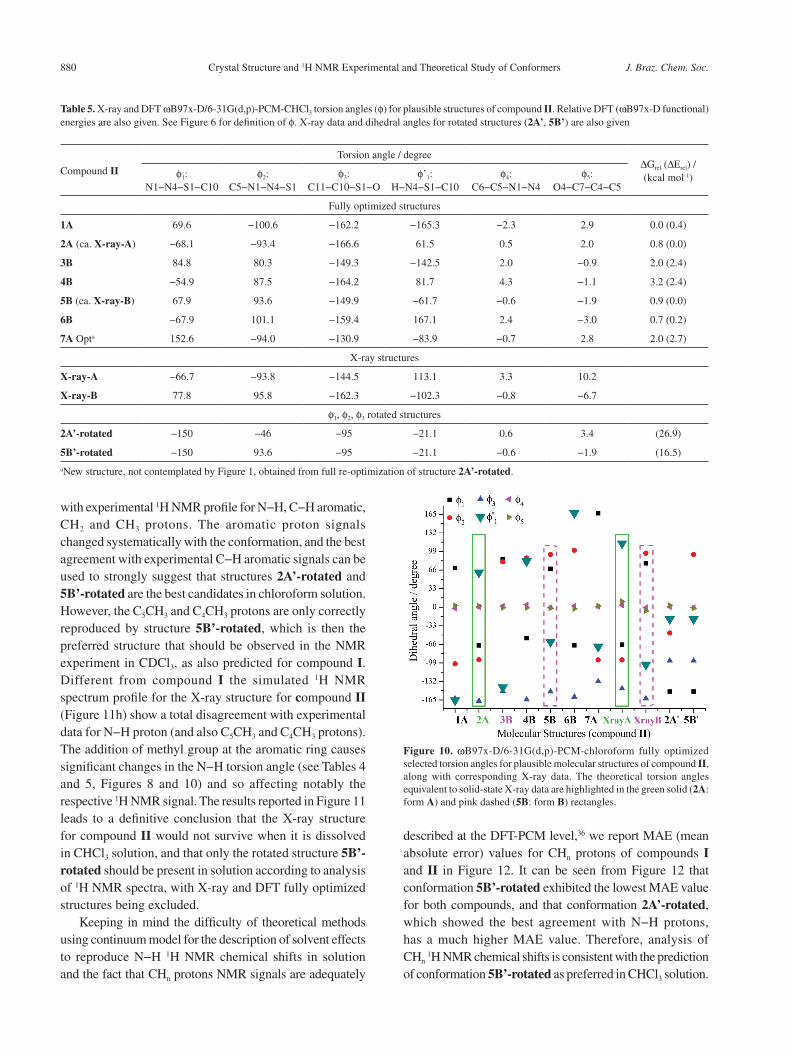
The structural results for compound II are given in Table 5 and Figure 10, with 1H NMR spectra shown in Figure 11. A similar analysis made for compound I holds for compound II. It can be seen from Table 5 and Figure 10 that in this case there is a larger deviation of the f’1 torsion angle (highlighted in Figure 10) with respect to the X-ray value than compound I, due to the presence of the methyl group at para position of the aromatic ring. It can be seen from Figure 11 that the rotated structures 2A’-rotated and 5B’-rotated exhibit the best agreement
Crystal Structure and 1H NMR Experimental and Theoretical Study of Conformers J. Braz. Chem. Soc.880
Figure 10. ωB97x-D/6-31G(d,p)-PCM-chloroform fully optimized selected torsion angles for plausible molecular structures of compound II, along with corresponding X-ray data. The theoretical torsion angles equivalent to solid-state X-ray data are highlighted in the green solid (2A: form A) and pink dashed (5B: form B) rectangles.
with experimental 1H NMR profile for N−H, C−H aromatic, CH2 and CH3 protons. The aromatic proton signals changed systematically with the conformation, and the best agreement with experimental C−H aromatic signals can be used to strongly suggest that structures 2A’-rotated and 5B’-rotated are the best candidates in chloroform solution. However, the C5CH3 and C4CH3 protons are only correctly reproduced by structure 5B’-rotated, which is then the preferred structure that should be observed in the NMR experiment in CDCl3, as also predicted for compound I. Different from compound I the simulated 1H NMR spectrum profile for the X-ray structure for compound II (Figure 11h) show a total disagreement with experimental data for N−H proton (and also C5CH3 and C4CH3 protons). The addition of methyl group at the aromatic ring causes significant changes in the N−H torsion angle (see Tables 4 and 5, Figures 8 and 10) and so affecting notably the respective 1H NMR signal. The results reported in Figure 11 leads to a definitive conclusion that the X-ray structure for compound II would not survive when it is dissolved in CHCl3 solution, and that only the rotated structure 5B’-rotated should be present in solution according to analysis of 1H NMR spectra, with X-ray and DFT fully optimized structures being excluded.
Keeping in mind the difficulty of theoretical methods using continuum model for the description of solvent effects to reproduce N−H 1H NMR chemical shifts in solution and the fact that CHn protons NMR signals are adequately
described at the DFT-PCM level,36 we report MAE (mean absolute error) values for CHn protons of compounds I and II in Figure 12. It can be seen from Figure 12 that conformation 5B’-rotated exhibited the lowest MAE value for both compounds, and that conformation 2A’-rotated, which showed the best agreement with N−H protons, has a much higher MAE value. Therefore, analysis of CHn 1H NMR chemical shifts is consistent with the prediction of conformation 5B’-rotated as preferred in CHCl3 solution.
Table 5. X-ray and DFT ωB97x-D/6-31G(d,p)-PCM-CHCl3 torsion angles (f) for plausible structures of compound II. Relative DFT (ωB97x-D functional) energies are also given. See Figure 6 for definition of f. X-ray data and dihedral angles for rotated structures (2A’, 5B’) are also given
Compound II
Torsion angle / degreeΔGrel (ΔErel) / (kcal mol-1)f1:
N1−N4−S1−C10f2:
C5−N1−N4−S1f3:
C11−C10−S1−Of’1:
H−N4−S1−C10f4:
C6−C5−N1−N4f5:
O4−C7−C4−C5
Fully optimized structures
1A 69.6 −100.6 −162.2 −165.3 −2.3 2.9 0.0 (0.4)
2A (ca. X-ray-A) −68.1 −93.4 −166.6 61.5 0.5 2.0 0.8 (0.0)
3B 84.8 80.3 −149.3 −142.5 2.0 −0.9 2.0 (2.4)
4B −54.9 87.5 −164.2 81.7 4.3 −1.1 3.2 (2.4)
5B (ca. X-ray-B) 67.9 93.6 −149.9 −61.7 −0.6 −1.9 0.9 (0.0)
6B −67.9 101.1 −159.4 167.1 2.4 −3.0 0.7 (0.2)
7A Opta 152.6 −94.0 −130.9 −83.9 −0.7 2.8 2.0 (2.7)
X-ray structures
X-ray-A −66.7 −93.8 −144.5 113.1 3.3 10.2
X-ray-B 77.8 95.8 −162.3 −102.3 −0.8 −6.7
f1, f2, f3 rotated structures
2A’-rotated −150 −46 −95 −21.1 0.6 3.4 (26.9)
5B’-rotated −150 93.6 −95 −21.1 −0.6 −1.9 (16.5)
aNew structure, not contemplated by Figure 1, obtained from full re-optimization of structure 2A’-rotated.

Freitas et al. 881Vol. 31, No. 5, 2020
Figure 11. B3LYP/6-31G(d,p)-PCM (CHCl3) calculated 1H NMR spectra for equilibrium structures located on the ωB97x-D/6-31G(d,p)-PCM-chloroform potential energy surface for 1,2,3-triazoles derivative (compound II): (a-g) form-A and form-B conformers and (h) using frozen X-ray solid state structures. Corresponding spectrum for rotated structures (i) 2A’ and (j) 5B’ leading to good agreement with experimental N−H proton chemical shift. (k) Experimental 1H NMR spectrum (solvent CDCl3). An estimate average scaling factor (0.948) was used to the B3LYP calculated N−H isotropic magnetic shielding tensor (ppm). No scaling factor was needed for CH(n) group (n = 2 or 3). The displacement of the N−H signal with respect to the nearest aromatic C−H value (d in ppm) is indicated, which reflects the accordance with experimental spectrum.
Conclusions
In this work we reported molecular and supramolecular X-ray structures of 1,2,3-triazoles derivatives (compounds I and II), which are recognized by the importance of the contribution of these heterocycles’ derivatives to the medicinal chemistry. Two conformers named A and B were found to coexist in the unit cell of the solid-state
structure. Intermolecular interactions were explored using the Hirshfeld surface as the fingerprint plots for the full description of these supramolecular arrays and mapping the hydrogen bonding interactions, where C−H···π interaction was observed besides H-bond. DFT calculations were carried out at the ωB97x-D/6-31G(d,p)-PCM-CHCl3 level aiming to contribute to the interpretation of the experimental data and complement the experimental

Crystal Structure and 1H NMR Experimental and Theoretical Study of Conformers J. Braz. Chem. Soc.882
Figure 12. B3LYP/6-31G(d,p)-PCM (CHCl3) 1H NMR MAE (mean absolute error) statistical index value, expressing average model prediction error, for equilibrium structures located on the ωB97x-D/6-31G(d,p)-PCM-chloroform potential energy surface for 1,2,3-triazoles derivatives (compounds I and II).
findings. The two molecules A and B present in the crystal structure were also predicted as true minima on the DFT potential energy surface calculated for compounds I and II (structures 2A and 5B), which provide support for the use of the ωB97x-D functional for structural determination and indicating that the crystal packing does not alter significantly the corresponding DFT-PCM fully optimized structure. Therefore, there is harmony between theoretical and experimental X-ray structural data.
As the practical use of chemical compound in pharmacological applications is in solution (usually aqueous media), experimental 1H NMR spectra in CDCl3 solution were recorded for analogous of 1,2,3-triazoles compounds I and II (d in ppm, relative to TMS) and B3LYP/6-31G(d,p)-PCM-CHCl3 calculations of NMR chemical shifts were carried out for all optimized structures and also using the X-ray atomic coordinates. None of these attempts reproduced correctly the experimentally observed 1H NMR profile in CDCl3 solution. The calculated DFT-PCM (chloroform solvent) 1H NMR spectrum for the 5B’ rotated structure, with torsion angles showing large deviation from fully optimized and X-ray structures (around 40° to 90°) was in fine agreement with experimental results (in CDCl3), revealing that the molecular structure present in the sample handled in the NMR experiment (in CDCl3) is considerably different from fully optimized equilibrium geometry and also X-ray form B solid state structure, probably due to intermolecular interactions in solution. This is an interesting result revealing that care is needed when modeling interactions of drugs with target biological sites in aqueous solution, once it is a common procedure the use of DFT gas phase optimized geometries or even X-ray structures to describe the pharmaco conformation. Our
combined experimental/theoretical 1H NMR study proved very promising for the determination of the conformation adopted by triazoles and other heterocyclic compounds in solution, which is not attainable by X-ray diffraction technique being a hard task for experimentalists regarding large molecules in solution. In addition, it can be considered a sound procedure for the determination of the distortion of DFT optimized structures due to the solvent effect.
Experimental
Material and methods
Melting points (mp) were measured on Fisher-Johns Melting Point Apparatus instrument and infrared (IR) spectra were recorded on a PerkinElmer FT-IR 1600 spectrophotometer using KBr pellets. 1H and 13C NMR spectra were recorded on a Varian Unity Plus 300 or 500 MHz spectrometer. Experimental NMR chemical shifts (d in ppm) were evaluated relative to TMS (CDCl3 as solvent). Chemical reagents and all solvents used in this study were purchased from Merck AG (Darmstadt, Germany) and Sigma-Aldrich (São Paulo, Brazil). Column chromatography was performed with silica gel flash. The reactions were routinely monitored by thin layer chromatography (TLC) on silica gel pre-coated F254.
General procedure for the preparation of 1,2,3-triazole derivatives I and II
To the sulfonylhydrazide solution (1 mmol) in MeOH/acetic acid (5:1) (10 mL), it was added ethyl 2-diazoacetoacetate (0.156 g, 1 mmol). The solution was kept stirring for 24 h, at room temperature, and the resulting mixture was concentrated under reduced pressure. The residue was purified by column chromatography using silica gel and ethyl acetate:hexane (3:7) as eluent to give the pure triazoles.24 For I, 60% yield, yellow solid, mp 151-152 °C and for II, 61% yield, yellow solid, mp 140-141 °C. Crystallization from methanol gave crystals of I and II suitable for single crystal X-ray diffraction.
Characterization and instrumentation
X-ray data collection and structure refinementSingle crystals of I as for II were selected, and
separately glued in Mitegen micromountTM of adequate size, using mineral oil. For data acquisition of I, performed at 150 K, it was used a Gemini Ultra diffractometer. The software CrysAlis PRO37 (Agilent Technologies, version 1.171.35.15, release 03-08-2011 CrysAlis 171

Freitas et al. 883Vol. 31, No. 5, 2020
.NET, compiled Aug 3 2011,13:03:54) was used for data acquisition, cell refinement and data reduction. For compound II data collected using a Bruker AXS BV, the measurement at room temperature. The cell refinement was performed with DIRAX/LSQ38 and data reduction with EVALCCD.39 For both compounds the structure was solved by the direct methods using SHELXS-9740 and refined in SHELXL-9740 using WingX software.29,41 Refinement was performed on F2 against all reflections. The weighted R-factor, wR and goodness of fit (S) are based on F2. All the non-H-atoms were refined anisotropically. H atoms were placed into the calculated idealized positions, using neutron distance data.31 All H atoms were refined with fixed individual displacement parameters [Uiso(H) = 1.2 Ueq (Csp2 and Car) or 1.5 Ueq (Csp3)] using a riding model. Molecular graphics draw using ORTEP-3 for Windows29,42 as Mercury.43 The crystallographic tables were constructed using Olex244 and for calculation of additional structural parameters the CrystalExplorer4 was used.
Computational details
Initially random input geometries of compounds I and II were fully optimized using the recently proposed DFT long-range corrected ωB97x-D functional, which has been shown to yield satisfactory accuracy for thermochemistry, kinetics, and non-covalent interactions, and the standard 6-31G(d,p) basis set.45,46 Then a relaxed energy scan varying the torsion angle around the N−S single bond (f1) from 0° to 360°, using a step size of 10°, was conducted for molecules I and II at the ωB97x-D/6-31G(d,p) level of calculation including solvent effects simulation (chloroform solvent, dielectric constant (ε) = 4.7113) using the PCM continuum model.47 A second ωB97x-D/6-31G(d,p) relaxed scan was performed varying the torsion angle around the N−N single bond (f2) from 0° to 360° in step size of 10°. Various distinct minimum energy structures were located on the energy curves for molecules I and II. Finally, ωB97x-D/6-31G(d,p) harmonic frequency calculations were carried out to characterize the optimized structures as true minimum (all frequencies being real), allowing the calculation of thermodynamic properties, followed by calculations of 1H magnetic shielding constants (σ), with chemical shifts (d), obtained on a d-scale relative to the TMS, taken as reference, using the gauge-independent atomic orbital (GIAO) method implemented by Wolinski et al.48 For the calculations of chemical shifts, the hybrid B3LYP functional was used, which has been shown to reproduce well the NMR spectra of organic molecules.49-52 All calculations have been done with the Gaussian 09 package.53
Supplementary Information
Supplementary information is available free of charge at http://jbcs.sbq.org.br as PDF file.
Crystallographic data is also available for download in CIF format at http://jbcs.sbq.org.br.
Acknowledgments
The authors are grateful to FAPEMIG, FAPERJ, CAPES, CNPq for financial support and fellowships, and the laboratories LDRX-UFF and LabCri-UFMG for X-ray diffraction data collection. W. B. A. would like to thank the Conselho Nacional de Desenvolvimento Científico e Tecnológico (CNPq) for a research fellowship (process No. 310102/2016-2) and Fundação Carlos Chagas Filho de Amparo à Pesquisa do Estado do Rio de Janeiro (FAPERJ) for support (process No. 233888.). H. C. S. thanks CNPq for a PhD scholarship.
References
1. Yu, G.; Jie, K.; Huang, F.; Chem. Rev. 2015, 115, 7240.
2. Rodríguez-Spong, B.; Price, C. P.; Jayasankar, A.; Matzger, A.
J.; Rodríguez-Hornedo, N.; Adv. Drug Delivery Rev. 2004, 56,
241.
3. McKinnon, J. J.; Spackman, M. A.; Mitchell, A. S.; Acta
Crystallogr., Sect. B: Struct. Sci., Cryst. Eng. Mater. 2004, 60,
627.
4. Wolff, S. K.; Grimwood, D. J.; McKinnon, J. J.; Turner, M.
J.; Jayatilaka, D.; Spackman, M. A.; CrystalExplorer 3.0;
University of Western Australia, Perth, Australia, 2012.
5. Spackman, M. A.; Byrom, P. G.; Chem. Phys. Lett. 1997, 267,
215.
6. Spackman, M. A.; Jayatilaka, D.; CrystEngComm 2009, 11, 19.
7. Spackman, M. A.; McKinnon, J. J.; CrystEngComm 2002, 4,
378.
8. Tormena, C. F.; Prog. Nucl. Magn. Reson. Spectrosc. 2016, 96, 73.
9. Sanphui, P.; Sarma, B.; Nangia, A.; J. Pharm. Sci. 2011, 100,
2287.
10. Cruz-Cabeza, A. J.; Bernstein, J.; Chem. Rev. 2014, 114, 2170.
11. Bortolot, C. S.; da Silva, L. M. F.; Marra, R. K. F.; Reis, M. I.
P.; Sá, B. V. F.; Filho, R. I.; Ghasemishahrestani, Z.; Sola-Penna,
M.; Zancan, P.; Ferreira, V. F.; da Silva, F. C.; Med. Chem. 2019,
15, 119.
12. He, Y. W.; Dong, C. Z.; Zhao, J. Y.; Ma, L. L.; Li, Y. H.; Aisa,
H. A.; Eur. J. Med. Chem. 2014, 76, 245.
13. Silva, B. N. M.; Sales, P. A.; Romanha, A. J.; Murta, S. M. F.;
Lima, C. H. S.; Albuquerque, M. G.; D’Elia, E.; de Aquino, J.
G.; Ferreira, V. F.; Silva, F. C.; Pinto, A. C.; Silva, B. V.; Med.
Chem. 2019, 15, 240.

Crystal Structure and 1H NMR Experimental and Theoretical Study of Conformers J. Braz. Chem. Soc.884
14. Jordão, A. K.; Afonso, P. P.; Ferreira, V. F.; de Souza, M. C. B.
V.; Almeida, M. C. B.; Beltrame, C. O.; Paiva, D. P.; Wardell,
S. M. S. V.; Wardell, J. L.; Tiekink, E. R. T.; Damaso, C. R.;
Cunha, A. C.; Eur. J. Med. Chem. 2009, 44, 3777.
15. Jordão, A. K.; Ferreira, V. F.; Souza, T. M. L.; Faria, G. G. S.;
Machado, V.; Abrantes, J. L.; de Souza, M. C. B. V.; Cunha, A.
C.; Bioorg. Med. Chem. 2011, 19, 1860.
16. Al-Masoudi, N. A.; Al-Soud, Y. A.; Tetrahedron Lett. 2002, 43,
4021.
17. da Silva, E. N.; Menna-Barreto, R. F. S.; Pinto, M. C. F. R.;
Silva, R. S. F.; Teixeira, D. V.; de Souza, M. C. B. V.; de Simone,
C. A.; de Castro, S. L.; Ferreira, V. F.; Pinto, A. V.; Eur. J. Med.
Chem. 2008, 43, 1774.
18. Patpi, S. R.; Pulipati, L.; Yogeeswari, P.; Sriram, D.; Jain, N.;
Sridhar, B.; Murthy, R.; Devi T., A.; Kalivendi, S. V.; Kantevari,
S.; J. Med. Chem. 2012, 55, 3911.
19. Lannes, A. C.; Leal, B.; Novais, J. S.; Lione, V.; Monteiro, G. C.
T. S.; Lourenço, A. L.; Sathler, P. C.; Jordão, A. K.; Rodrigues,
C. R.; Cabral, L. M.; Cunha, A. C.; Campos, V.; Ferreira, V.
F.; de Souza, M. C. B. V.; Santos, D. O.; Castro, H. C.; Curr.
Microbiol. 2014, 69, 357.
20. Jordão, A. K.; Ferreira, V. F.; Lima, E. S.; de Souza, M. C. B.
V.; Carlos, E. C. L.; Castro, H. C.; Geraldo, R. B.; Rodrigues,
C. R.; Almeida, M. C. B.; Cunha, A. C.; Bioorg. Med. Chem.
2009, 17, 3713.
21. Moura, D. A. L.; Almeida, A. C. M.; Silva, A. V.; de Souza, V.
R.; Ferreira, V. F.; Menezes, M. V.; Kaiser, C. R.; Ferreira, S.
B.; Fuly, A. L.; Med. Chem. 2016, 12, 733.
22. Cunha, A. C.; Figueiredo, J. M.; Tributino, J. L. M.; Miranda, A.
L. P.; Castro, H. C.; Zingali, R. B.; Fraga, C. A. M.; de Souza,
M. C. B. V.; Ferreira, V. F.; Barreiro, E. J.; Bioorg. Med. Chem.
2003, 11, 2051.
23. Ferreira, S. B.; Costa, M. S.; Boechat, N.; Bezerra, R. J. S.;
Genestra, M. S.; Canto-Cavalheiro, M. M.; Kover, W. B.;
Ferreira, V. F.; Eur. J. Med. Chem. 2007, 42, 1388.
24. Campos, V. R.; Abreu, P. A.; Castro, H. C.; Rodrigues, C. R.;
Jordão, A. K.; Ferreira, V. F.; de Souza, M. C. B. V.; Santos, F. D.
C.; Moura, L. A.; Domingos, T. S.; Carvalho, C.; Sanchez, E. F.;
Fuly, A. L.; Cunha, A. C.; Bioorg. Med. Chem. 2009, 17, 7429.
25. Domingos, T. F. S.; Moura, L. A.; Carvalho, C.; Campos, V. R.;
Jordão, A. K.; Cunha, A. C.; Ferreira, V. F.; de Souza, M. C.
B. V.; Sanchez, E. F.; Fuly, A.; BioMed Res. Int. 2013, 2013,
ID 294289.
26. Parr, R. G.; Yang, W.; Density-Functional Theory of Atoms and
Molecules; Oxford University Press: Oxford, 1989.
27. Flack, H. D.; Bernardinelli, G.; Acta Crystallogr., Sect. A 1999,
55, 908.
28. Cooper, R. I.; Watkin, D. J.; Flack, H. D.; Acta Crystallogr.,
Sect. C 2016, 72, 261.
29. Farrugia, L. J.; J. Appl. Crystallogr. 1997, 30, 565.
30. Schulze, B.; Schubert, U. S.; Chem. Soc. Rev. 2014, 43, 2522.
31. Allen, F. H.; Watson, D. G.; Brammer, L.; Orpen, A. G.; Taylor,
R. In International Tables for Crystallography, vol. C; Kluwer
Academic Publishers: Dordrecht, 2006, p. 790-811.
32. Jayatilaka, D.; Wolff, S. K.; Grimwood, D. J.; McKinnon, J. J.;
Spackman, M. A.; Acta Crystallogr., Sect. A 2006, A62, s90.
33. McKinnon, J. J.; Jayatilaka, D.; Spackman, M. A.; Chem.
Commun. 2007, 37, 3814.
34. de Souza, L. A.; da Silva, H. C.; de Almeida, W. B.;
ChemistryOpen 2018, 7, 902.
35. Benzi, C.; Crescenzi, O.; Pavone, M.; Barone, V.; Magn. Reson.
Chem. 2004, 42, S57.
36. da Silva, H. C.; de Almeida, W. B.; Chem. Phys. 2020, 528,
110479.
37. CrysAlisPRO; Oxford Diffraction/Agilent Technologies UK
Ltd., Yarnton, England, 2013.
38. Duisenberg, A. J. M.; J. Appl. Crystallogr. 1992, 25, 92.
39. Duisenberg, A. J. M.; Kroon-Batenburg, L. M. J.; Schreurs, A.
M. M.; J. Appl. Crystallogr. 2003, 36, 220.
40. Sheldrick, G. M.; SHELXS97, Program for Crystal Structure
Solution and Refinement; University of Göttingen, Göttingen,
Germany, 1997; Sheldrick, G. M.; SHELXL97, Program for
Crystal Structure Solution and Refinement; University of
Göttingen, Göttingen, Germany, 1997.
41. Farrugia, L. J.; J. Appl. Crystallogr. 1999, 32, 837.
42. Farrugia, L. J.; J. Appl. Crystallogr. 2012, 45, 849.
43. Macrae, C. F.; Edgington, P. R.; McCabe, P.; Pidcock, E.;
Shields, G. P.; Taylor, R.; Towler, M.; van de Streek, J.; J. Appl.
Crystallogr. 2006, 39, 453.
44. Dolomanov, O. V.; Bourhis, L. J.; Gildea, R. J.; Howard, J. A.
K.; Puschmann. H.; J. Appl. Crystallogr. 2009, 42, 339.
45. Chai, J.-D.; Head-Gordon, M.; Phys. Chem. Chem. Phys. 2008,
10, 6615.
46. Hehre, W. J.; Radom, L.; Schleyer, P. V. R.; Pople, J. A.; Ab
Initio Molecular Orbital Theory; Wiley: New York, 1986.
47. Mennucci, B.; Cancès, E.; Tomasi, J.; J. Phys. Chem. B 1997,
101, 10506.
48. Wolinski, K.; Hilton, J. F.; Pulay, P.; J. Am. Chem. Soc. 1990,
112, 8251.
49. Becke, A. D.; J. Chem. Phys. 1993, 98, 5648.
50. Lee, C.; Yang, W.; Parr, R. G.; Phys. Rev. B 1988, 37, 785.
51. de Almeida, M. V.; de Assis, J. V.; Couri, M. R. C.; Anconi, C.
P. A.; Guerreiro, M. C.; dos Santos, H. F.; de Almeida, W. B.;
Org. Lett. 2010, 12, 5458.
52. de Almeida, M. V.; Couri, M. R. C.; de Assis, J. V.; Anconi,
C. P. A.; dos Santos, H. F.; de Almeida, W. B.; Magn. Reson.
Chem. 2012, 50, 608.
53. Frisch, M. J.; Trucks, G. W.; Schlegel, H. B.; Scuseria, G. E.;
Robb, M. A.; Cheeseman, J. R.; Scalmani, G.; Barone, V.;
Mennucci, B.; Petersson, G. A.; Nakatsuji, H.; Caricato, M.;
Li, X.; Hratchian, H. P.; Izmaylov, A. F.; Bloino, J.; Zheng,
G.; Sonnenberg, J. L.; Hada, M.; Ehara, M.; Toyota, K.;

Freitas et al. 885Vol. 31, No. 5, 2020
Fukuda, R.; Hasegawa, J.; Ishida, M.; Nakajima, T.; Honda,
Y.; Kitao, O.; Nakai, H.; Vreven, T.; Montgomery Jr., J. A.;
Peralta, J. E.; Ogliaro, F.; Bearpark, M.; Heyd, J. J.; Brothers,
E.; Kudin, K. N.; Staroverov, V. N.; Kobayashi, R.; Normand,
J.; Raghavachari, K.; Rendell, A.; Burant, J. C.; Iyengar, S.
S.; Tomasi, J.; Cossi, M.; Rega, N.; Millam, N. J.; Klene, M.;
Knox, J. E.; Cross, J. B.; Bakken, V.; Adamo, C.; Jaramillo,
J.; Gomperts, R.; Stratmann, R. E.; Yazyev, O.; Austin, A.
J.; Cammi, R.; Pomelli, C.; Ochterski, J. W.; Martin, R. L.;
Morokuma, K.; Zakrzewski, V. G.; Voth, G. A.; Salvador, P.;
Dannenberg, J. J.; Dapprich, S.; Daniels, A. D.; Farkas, Ö.;
Foresman, J. B.; Ortiz, J. V.; Cioslowski, J.; Fox, D. J.; Gaussian
09; Gaussian, Inc., Wallingford, CT, 2009.
Submitted: June 6, 2019
Published online: October 23, 2019
This is an open-access article distributed under the terms of the Creative Commons Attribution License.