article 2 - conundrum.pdf
TRANSCRIPT

7/27/2019 Article 2 - Conundrum.pdf
http://slidepdf.com/reader/full/article-2-conundrumpdf 1/24
THE GLOBAL WARMINGCONUNDRUM
Thomas B. Fowler
G lobal warming, or climate change, has
become a highly c ontentiou s issue, with
political, economic, social, ecological, and
scientific implications. The hapless observer
is bombarded with books and documenta-
ries replete with apoc alyptic im ages, likely to
be familiar from Al Gore's An Inconvenient
Truth and Earth in the Balance as well as
writings by James Ha nsen and other climate
action activists, portraying a world overcome
with famine, flooding, and destruction. '
M eanw hile others deno unc e the whole global
wa rm ing theory as a cruel hoax th at will i tselfcondemn many to lives of deprivation and
starvation. Unfortunately, such issues drive
partisans to employ divisive rhetoric and
obfuscating arguments, with the result that
it can be difficult for an objective observer—
who simply wants to understand the issues
at s take—to make a reasoned judgment .
Global warming, in fact, has to some degree
displaced evolution as the subject where
public disagreement over science has turned
is different, however, in that there are man
more reputable scientists who publicly que
tion the supposed scientific consensus on
tha n is the case with evolution.
The purpose of this essay is to sort o
the issues and present each in as objectiv
a manner as possible, exploring the pr
and cons of both sides, and also to examin
the main reasons for the controversy. Th
goal is to give the interested reader enoug
understanding of the problem to be able
hear and evaluate properly arguments, ev
dence, and conclusions, and thus to makintelligent judgments about matters rela
ing to global warming and cl imate chang
The unfortunate politicization of scienc
so evident in this controversy, should als
become apparent to the reader. By taking
sufficiently long view of climate change, th
reader can gain a valuable perspective on th
controversy. It will become apparent that th
current arguments about the well-publicize
"hockey stick" temperature graph are real
7/27/2019 Article 2 - Conundrum.pdf
http://slidepdf.com/reader/full/article-2-conundrumpdf 2/24
THE GLOBAL WARMING CONUNDRUM
Overview of the Controversy
The controversy is not merely about changes
in the earth's climate, because we know
from historical records and paleoclimatol-ogy research that the earth's climate has
always been changing. Rather, the current
controversy is about the effect of human
activity on the earth's climate, and in par-
ticular whether human activity is causing the
earth's climate to warm significantly. By sig-
nificantly we mean enough to cause poten-
tially serious, deleterious, and widespread
changes to geography, flora, and fauna. This
is known as "anthropogenic global warm-
ing" (ACW).
The concern about global warming arose
because of temperature measurements m ade
over recent decades that suggest a relatively
rapid rate of warming. Climate change
research, indeed, has two directions: look-
ing back at past climate trends, primarilytemperature, and looking forward to pos-
sible changes in the future. Past tempera-
ture trends are reconstructed from proxy
data until the late nineteenth century, when
reliable instrument-based temperature mea-
surements began to be recorded. For the
future, computer-based climate simulation
models, known as "Ceneral CirculationModels," or CCMs, are preferentially
employed to project the effect of various
types and degrees of climate change, based
on recent trends and assumptions about
climate-related matters.
If the more pessimistic warming predic-
tions are true, the inference usually drawn
is that action on a global scale is required to
mitigate that warming so as to avoid these
generally attributed to excess carbon dioxide
emissions, which come about from the burn-
ing of these fuels. Obviously, any program to
accomplish this goal would involve coercive
measures on a very large scale and manysignificant remediation expenses and efforts,
as well as disruptions in individual ways of
living, social organization, business prac-
tices, and other areas. On the other hand,
taking action when none is warranted will
inevitably condemn many—especially the
poor—to lives of unnecessary deprivation
and possibly starvation.
The term global warming can refer (1) to
the recent sharp rise in global temperatures,
or (2) to the explanation of it most com-
monly given, namely, human activity
and specifically the production of large
amounts of carbon dioxide released into the
atmosphere. A fact and its explanation are
always separate, and one can accept the first
but reject the second. In today's politicallycharged environm ent, however, this is often
ignored; those who reject the anthropogenic
explanation are labeled "climate deniers"
and equated with "Holocaust deniers" and
yahoos who claim gravity is a hoax.̂ The fact
of the temperature rise and its explanation
are often purposely conflated on account
of a perceived need for political action; inthis way one can use the veracity of the first
to justify the second, and so silence critics
without the need to address their argum ents.
For the sake of clarity, we shall list those
matters not in dispute, followed by those
that are in dispute.* First, points not in
dispute and not rejected by the "climate
deniers":
* There are irrational people on both sides of the
7/27/2019 Article 2 - Conundrum.pdf
http://slidepdf.com/reader/full/article-2-conundrumpdf 3/24
MODERNAGE 2012
1. The recent rise in global tempera-
tures, since about 1980, which is well
attested by both ground-based and
satellite measurements
2. Increased carbon dioxide levels in theatmosphere, from 290 parts per mil-
lion (ppm) in 1900 to mote than 390
ppm in 2012 (though CO2 is less than
0.1% of the atmosphere by volume)"*
3. Human activity as the principal
source of the increase in CO2 and
other greenhouse gases
4 . Carbon dioxide and other green-house gases as climate "forcing func-
tions," which cause heating of the
atmosphere*
5. Feedback loops in the climate system
that can amplify or diminish climate
forcing
W h a t is in dispute is the explanation for
the recent rise in temperature, involving
these factors:
1. The temperature record over the past
one thousand years
2. The nature of the feedback loops in
the climate system (resulting in ampli-
fication or diminution)
3. The impact of factors other thangreenhouse gases on the atmosphere
4 . The overall dynamics of the climate
system
5. The degree of natural variability in the
climate system
Effectively, those who support the AGW
hypothesis believe that the dynamics of the
climate system are such that they amplify t
greenhouse gas effect, causing an increas
rate of warming; those who reject it belie
that the dynamics cause the greenhouse g
effect to be diminished, and possibly ouweighed by other factors, resu lting in little
no new warming. Unquestionably, howeve
the fact of the recent warming requires som
sort of explanation, regardless of wheth
one agrees with the prevailing opinion th
it is ultimately caused by human activity.
In this problem as in many others, it
useful to be aware of the orders of magntude involved. So for reference, the earth
current level of CO2 is usually rated at 1
watts/square m eter of forcing, m etha ne at 0
watts/square meter, and all greenhouse gas
together at about 2.4 watts/square met
Solar irradiance (energy from the sun) is
the order of 1,368 watts/square meter at t
top of the earth's atmosphere when the s
is overhead. Taking into account the low
angle of the sun in most locations, reflecti
by the atmosphere, the absence of sun
night, and other factors, the amount of sol
energy actually incident on the earth's surfa
averages about 240 watts/square meter. Th
means that g reenhouse gases are abou t 1%
the sun with respect to forcing. If there we
no amplification or diminution of the effeof the greenhouse gases, a doubling of the
(expected over the next fifty to one hundr
years) would raise the earth's temperature
about 1°C. As we shall see, forecasts are f
increases about three times higher than this
The organization primarily responsib
for coordinating and collecting research
climate change, and formulating policies,
the United Nations Intergovernmental Pan
7/27/2019 Article 2 - Conundrum.pdf
http://slidepdf.com/reader/full/article-2-conundrumpdf 4/24
THE GLOBAL WARMING GONUNDRUM
called "assessments," and is preparing a fifth.
The IPGG assessments are quite detailed and
represent contributions from climate scien-
tists worldwide; they are clearly the product
of an enormous amount of research anddata collection. The IPCC assessments are
intended to synthesize the best knowledge
we have about the earth's climate and to
make judgments accordingly. For this reason
the assessments are often taken, not without
justification, as the final word on the subject.
The IPGG's general position is that naturally
driven climate change occurs over relatively
short periods; a sustained temperature rise
lasting thirty years is unprecedented and
therefore must be the result of a nonnatural
forcing function. The IPGG does not pub-
lish dissenting views, despite acknowledged
uncertainties in climate science and the
brevity of the instrumented climate record.
With this background in mind, we can
itemize the questions that must be answered:
1. Has there been significant warming in
the recent time period (fifty years, one
hundred years, etc.)?
2. Is this trend unusual in context of
historical global temperatures (tens,
hundreds of thousands of years)? That
is, does it represent an anomaly?
3 . How good are the data on which pre-
dictions (pro and con) are based?
4. What are the known or suspected
correlations with temperature change
(solar activity, human activity, etc.)?
5. What are the best available projections
of future changes, and how reliable are
they?
6. What percent of recent warming can
reasonably be attributed to human
8. What realistically can be done to curb
this activity?
These questions are not entirely indepen-
dent, of course, but it is convenient to con-sider them separately, as they are often con-
Hated in the raucous argumentation about
global warming and climate change. At this
point we can also perceive the reasons why
the controversy has become so acrimonious:
1. Remediation costs could be extremely
high, meaning that there are political/
economic issues that potentially over-
shadow scientific concerns.
2. Gosts/benefits may be unevenly dis-
tributed. Benefits may accrue to some
individuals, industries, or countries,
whereas there could be high costs for
others, often with few or no direct
benefits.
3 . Dire predictions cause the controversy
to assume a quasi-religious nature,
since some are genuinely convinced
that global warming is a threat to the
planet and humanity.
4. GGMs are still evolving and subject to
dispute, especially about causal infiu-
ence and drivers. Thus the magnitude
and timing of effects of climate change
are very uncertain.
5. Gomprehensive measured data are only
available for a relatively short period (a
few decades), compared to the known
time constants for climate change.
6. Reputations of individuals and organi-
zations are now staked on one position
or another, making any concessions
potentially embarrassing and career
wrecking.
7/27/2019 Article 2 - Conundrum.pdf
http://slidepdf.com/reader/full/article-2-conundrumpdf 5/24
MODERN AGE 2012
chang es in the way we live were small, there
would be little or no objection to any mitiga-
tion program, if for no other reason than as
an "insurance policy." No one wants to take
unnecessary chances with Mother Nature.But the higher the po tential cost for rem edia-
tion, the greater the certa inty n eeded, at least
with respect to political action. No elected
politician will impose onerous new laws or
taxes without something close to irrefutable
evidence; and even then, a crisis sometimes
must be imminent or al ready upon us. And
few if any businesses will voluntarily assume
a large cost burden in the absence of com-
pelling reasons and, in most cases, some
guarantee that other businesses are required
to do the same.
It is, in fact, the economics of global
warming more than anything else that has
led to the politicization of what should be
a strictly scientific question. This is most
unf ortu nate , because it obscures the fact tha tdisagreements are common in science and,
indeed, are one of its most valuable drivers.
Th e process of w ork ing out theore tical dif-
ferences commonly involves data gathering
and experimentat ion to determine which
theory is correct. This process requires that
all participants have an open mind and not
cling to their theories for extra-scientific rea-
sons; it also requires honesty, forthrightness,
and completeness in documenting findings
and methodologies . Otherwise the whole
scientific process breaks down. Scientists
are human and can also lose sight of their
responsibilities, owing to ideology, money,
prestige, political pressure, or simply ego.
Greenhouse Effect and Creenhouse Cases
greenhouse effect. The greenhouse effect refe
to the fact that many substances—not ju
glass used in real greenhouses but also gas
such as CO 2 and water vapor— will t ransm
light at certain wavelengths but block it others. Sunlight enters a real greenhou se an
warms the objects inside. When the objec
inside are heated, they themselves begin
radiate energy by the laws of th erm ody nam
ics; b u t they radiate energy at wavelengths
which glass is opaque. Thus that energy ju
reflects off the glass and back into the gree
house. In this way the greenhouse heats u
because most of the energy it receives fro
the sun remains trapped inside it . (The fa
that air cannot circulate between the insi
and outside of the greenhouse also contri
utes to the heating effect.)
The earth's atmosphere behaves in a sim
lar way, trapping the heat from sunlight.
this case the earth's surface is heated an
then radiates energy outward that is reflecteoff the atmosphere. This is highly desirab
to a certain degree. For example, it preven
the dark side of the earth (the side facin
away from the sun at any time) from coolin
extremely quickly, as does the dark side
the moon, for instance. Without the gree
house cases, the earth's temperature wou
be on the order of -18°C (O-'F); the gree
house gases raise our average temperature
about +15°C (59°F). With respect to glob
wa rm ing, the quest ion is whether hu m a
activity is creating dangerously high leve
of these gases, and associated warming, th
triggering potential catastrophic effects.
The gases in the earth's atmosphe
responsible for the greenhouse effect includ
water vapor, CO2, nitrous oxide, ozone, an
methane. Water vapor is by far the mo
7/27/2019 Article 2 - Conundrum.pdf
http://slidepdf.com/reader/full/article-2-conundrumpdf 6/24
THE GLOBAL WARMING CONUNDRUM
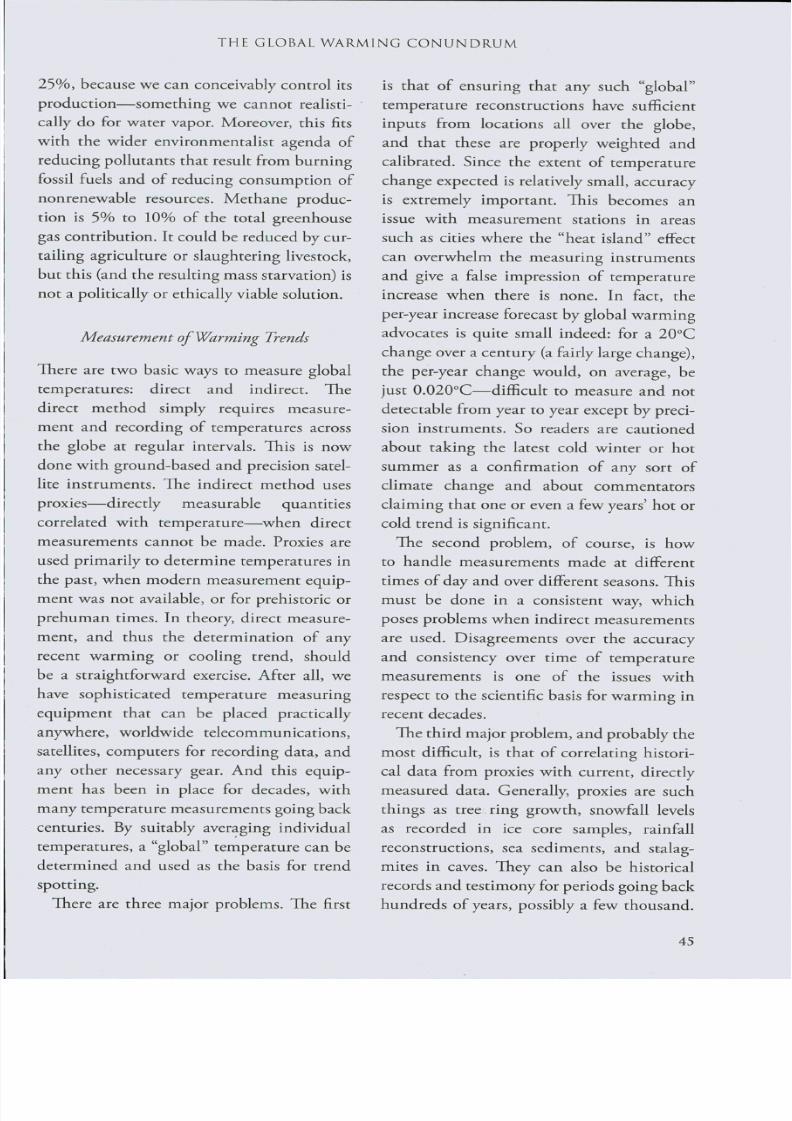
2 5 % , because we can conceivably control its
production—something we cannot real ist i -
cally do for water vapor. Moreover, this fits
with the wider environmentalist agenda of
reducing pollutants that result from burn ingfossil fuels and of reducing consumption of
nonrenewable resources. Methane produc-
tion is 5% to 10% of the total greenhouse
gas contribution. It could be reduced by cur-
tailing agriculture or slaughtering livestock,
but this (and the resulting mass starvation) is
not a politically or ethically viable solution.
Measurement of Warming Trends
There are two basic ways to measure global
temperatures: direct and indirect. The
direct method simply requires measure-
ment and recording of temperatures across
the globe at regular intervals. This is now
done with ground-based and precision satel-
lite instruments. The indirect method uses
proxies—directly measurable quantities
correlated with temperature—when direct
measurements cannot be made. Proxies are
used primarily to determine temperatures in
the past, when modern measurement equip-
ment was not available, or for prehistoric or
prehuman times. In theory, direct measure-
ment, and thus the determination of anyrecent warming or cooling trend, should
be a straightforward exercise. After all, we
have sophisticated temperature measuring
equipment that can be placed practically
anywhere, worldwide telecommunications,
satellites, computers for recording data, and
any other necessary gear. And this equip-
ment has been in place for decades, with
many temperature measurements going back
centuries. By suitably averaging individual
is that of ensuring that any such "global"
temperature reconstructions have sufficient
inputs from locations all over the globe,
and that these are properly weighted and
calibrated. Since the extent of temperature
change expected is relatively small, accuracy
is extremely important. This becomes an
issue with measurement stations in areas
such as cities where the "heat island" effect
can overwhelm the measuring instruments
and give a false impression of temperature
increase when there is none. In fact, the
per-year increase forecast by global w arm ingadvocates is quite small indeed: for a 20°C
change over a century (a fairly large change),
the per-year change would, on average, be
just 0.020°C— difficult to measure and not
detectable from year to year except by preci-
sion instruments. So readers are cautioned
about taking the latest cold winter or hot
summer as a confirmation of any sort of
climate change and about commentators
claiming that one or even a few years' hot or
cold trend is significant.
The second problem, of course, is how
to handle measurements made at different
times of day and over different seasons. This
must be done in a consistent way, which
poses problems when ind irect measurem ents
are used. Disagreements over the accuracyand consistency over time of temperature
measurements is one of the issues with
respect to the scientific basis for warming in
recent decades.
The third major problem, and probably the
most difficult, is that of correlating histori-
cal data from proxies with current, directly
measured data. Generally, proxies are such
things as tree ring growth, snowfall levels

7/27/2019 Article 2 - Conundrum.pdf
http://slidepdf.com/reader/full/article-2-conundrumpdf 7/24
MODERN AGE 2012
Fortunately, proxies are available quite far
back, at least for some parts of the globe;
but it can be difficult to calibrate them (i.e.,
determine the absolute temperature at any
given time, rather than just relative tempera-ture changes). There is no way, ultimately, to
determine the accuracy of reconstructions
based on proxies; although relying on cor-
relations with historical data, we have some
reason to think that they give an approximate
measure at least. It is also the case tha t prox-
ies are not usually complete, in the sense of
encompassing the entire globe, or the entire
time span at a single location. Furthermore,
they do not generally permit us to find the
temperature for a particular year, but only
an average over a span of thirty years or so.
Looking Back: Temperature Trend Analysis
Temperature trends are one major focus of
the global warm ing controversy. For the sake
of convenience, temperature trend analysis
can be broken into three periods, which
reflect different evidence and different mea-
surement m ethods and models:
• Recent temperatures, roughly one
hund red years, for which good instru-
mented data are available• Temperature trend since the year AD
1000
• Tem perature trends before the year
AD 1000, back several hundred thou-
sand years
Though of quite unequal length, these
three periods have been chosen because they
correspond closely to the degree of contro-
since it is based prim arily on ice core sampl
that go back hundreds of thousands of yea
Only the second is highly controversi
due in large measure to the now famo
"hockey stick" graph, the work of climatolgist Michael M ann , first published in 1998
This graph purports to show that glob
temperatures were steady from about A
1000 until the twentieth century, when th
began a sharp uptrend, presumably owi
to accelerating human use of carbon-bas
fuels. Mann's graph is controversial in pa
because it does not show either the M ediev
Warm Period or the Little Ice Age, both
which are well-documented in historic
records. Mann claims that these were,
fact, regional rather than global phenomen
Recent Temperature Trends
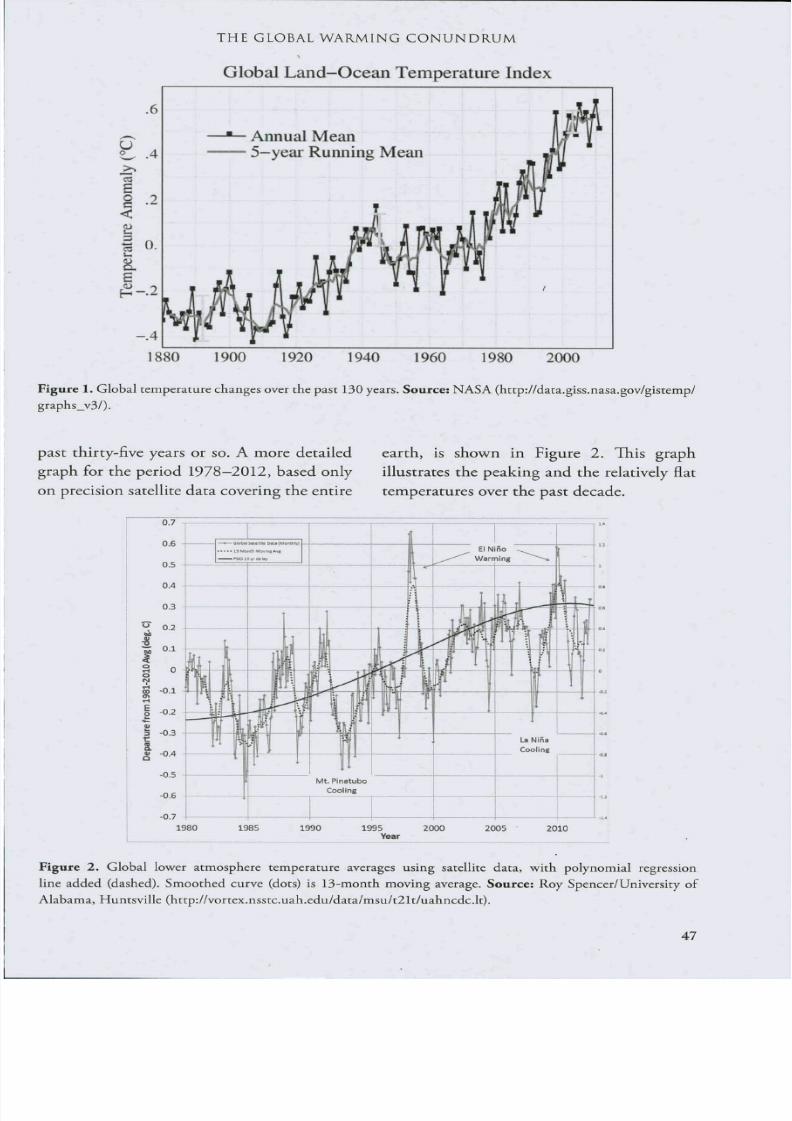
Figure 1, which shows the temperature tre
over the past 130 years, from the end of t
Little Ice Age (sixteenth to nineteenth cen
ries) to the present, is from NASA, a reliab
source. This is the graph usually cited wh
evidence of global warming is needed a
when action is called for. Not to belabor t
obvious, but a few comments on the gra
are appropriate. First, note that the tem
perature anomaly (deviation from assumnormal) is less than 10°C over the perio
Second, there was an actual decrease fro
about 1940 to 1975, probably forming t
basis for predictions, made at that time, o
new Ice Age. Third, this graph begins at t
end of the Little Ice Age, when temperatur
were significantly cooler than today, so som
degree of warm ing is to be expected as part
normal climate cycles. A key question— a
it is difficult and controversial—is how
7/27/2019 Article 2 - Conundrum.pdf
http://slidepdf.com/reader/full/article-2-conundrumpdf 8/24
THE GLOBAL WARMING GONUNDRUM
Global Land -Oc ean Tem perature Index
U
o
.6
.4
I -2
i 0.
Annual Mean•
5-year Running Mean
1880 1900 1920 1940 1960 1980 2000
Figure 1. Global temperature changes over the past 130 years. Source: NASA (http://data.giss.nasa.gov/gistemp/
graphs_v3/).
past thirty-five years or so. A more detailed
graph for the period 1978-2012, based only
on precision satellite data covering the entire
earth, is shown in Figute 2. This graph
illustrates the peaking and the relatively flat
temperatures over the past decade.
0.7
0.6
0.5
- 0 . 6
• • • • • IS M s i ^ ucpvmi *< (
naavM*/
J i t 11
Mt11
PinatuboCooling
Î111 «̂
1 ^W it
El Niño ^ ^ ^^^..^'^^ Warming ^~^-«
, ll
illif !r
1 A
if1
f1
LsNIña
Cooling
7/27/2019 Article 2 - Conundrum.pdf
http://slidepdf.com/reader/full/article-2-conundrumpdf 9/24
MO DE RN AGE 2012
The Intermediate Term
Is the temperature rise shown in Figures
1 and 2 unusual or just normal variability?
That is the key driver of the global warming
controversy—if normal variability, we have
nothing to worry about; if abnormal, then
possibly catastrophic results could ensue. If
an abnormality exists, it is presumed to be
due to human action altering the climate.
To begin to answer this question, we must
examine temperature records going back a
millennium. Unfortunately, records become
spotty more than two hundred years in thepast, and measurements back to the Middle
Ages require proxies of various ty pes. This has
led to the most heated disputes in the global
warming controversy, because it is both
directly relevant to the question of contem-
porary anthropogenic warming and involves
disputed methods and data for temperature
reconstructions over the past one thousand
years. In particular, there is the question of
converting proxies such as tree rings to tem-
peratu re data o n a worldwide scale.
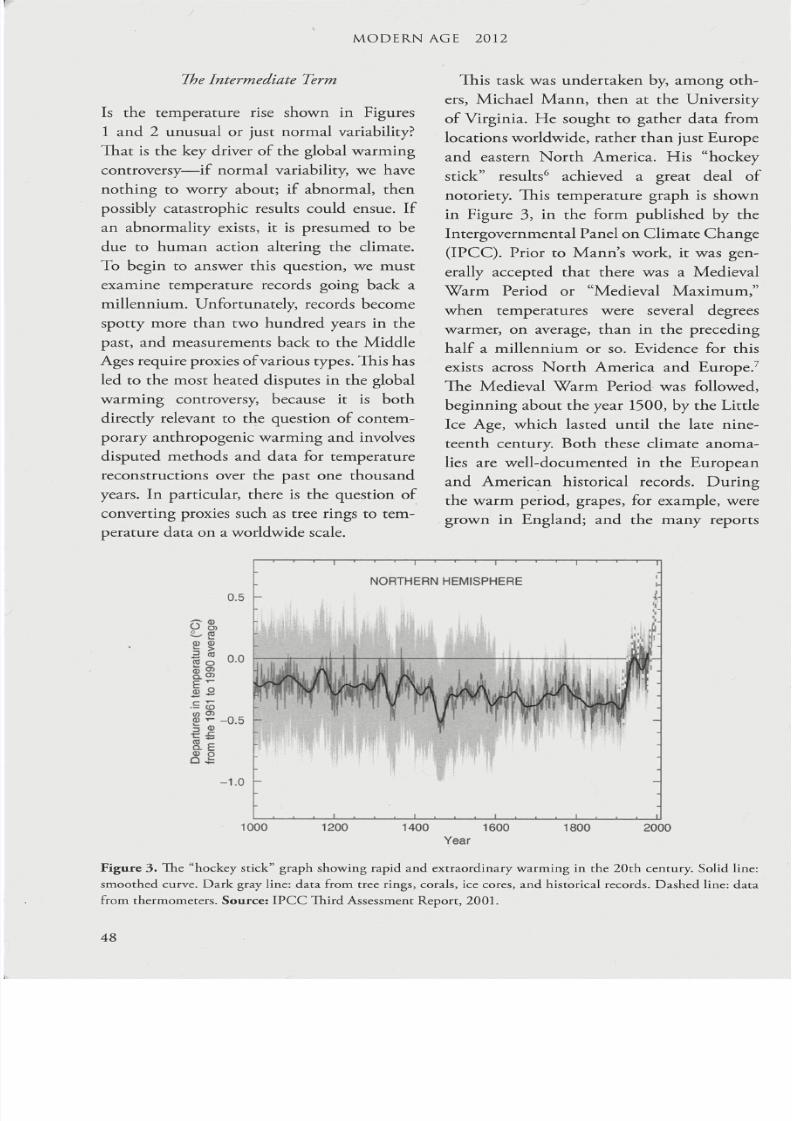
This task was undertaken by, among ot
ers, Michael Mann, then at the Universi
of Virginia. He sought to gather data fro
locations worldwide, rather tha n just E uro
and eastern North America. His "hockstick" results'^ achieved a great deal
notoriety. This temperature graph is show
in Figure 3, in the form published by t
Intergovernmental Panel on Glimate Ghan
(IPGG). Prior to Mann's work, it was ge
erally accepted that there was a Mediev
Warm Period or "Medieval Maximum
when temperatures were several degre
warmer, on average, than in the precedi
half a millennium or so. Evidence for th
exists across North America and Europe
The Medieval Warm Period was followe
beginning about the year 1500, by the Lit
Ice Age, which lasted until the late nin
teenth century. Both these climate anom
lies are well-documented in the Europe
and American historical records. Durithe warm period, grapes, for example, we
grown in England; and the many repor
7/27/2019 Article 2 - Conundrum.pdf
http://slidepdf.com/reader/full/article-2-conundrumpdf 10/24
THE GLOBAL WARMING CONUNDRUM
of bitterly cold winters, combined with oil
paintings of winter scenes during the Little
Ice Age, such as those by Brueghel, clearly
show that i t was abnormally cold during
much of tha t per iod.What Mann sought to demonstrate is
that these two anomalies were restricted
to Europe, or perhaps Europe and parts of
N or th Am erica, but were not global pheno m -
ena. In this way, he believed he could show
that global temperatures were fairly steady
for about nine hundred years, only to begin
a steep rise in the twentieth century. Thus
was born the hockey stick, shown in Figure
3 . H e did this by assembling a large database
of temperature record proxies (mainly tree
rings) going back one thousand years. These
proxies were in the form of tree ring data
from various worldwide locations, which
spanned parts of the thousand-year period.
Mann's results fit with prevailing concerns
about climate, and as a result were widelytou ted a nd are still used today as the basis for
calls to reduce greenhouse gas emissions. The
graph was remarkable because it effectively
el iminated the well-known Medieval Warm
Period and scarcely showed the Little Ice
Age (sixteenth to nineteenth centuries), thus
making present-day temperatures appear to
be extraordinarily high.
There were, however, doubts on the part
of many researchers with respect to the data
sets used:
Many tree ring researchers in particular
doubted whether the graph had got
it right. Initially Mann shared such
concerns. . . . Reconstructing past
temperatures from proxy data is fraught
with danger. Tree ring records, the
York, said: "Mann has a series from
central China that we believe is more
a moisture signal than a temperature
sig na l.. . . H e included it because he had
a gap. That was a mistake and it madetree-ring people angry." A large data set
he used from bristlecone pines in the
American west has attracted similar
concern.^
Tree ring data is suspect because exami-
nation of tree rings from the late twentieth
century has shown that they do not, in
fact, demonstrate sensitivity to the unusual
warmth during that period. If this is true
generally, it would entail that the tree rings
underest imate warming in the past , and
temperature reconstructions based on them
wou ld thu s show less variation th an actually
existed, especially on the high side—pre-
cisely what the hockey stick shows.'
There is another, perhaps more serious
problem. When confronted with large
amounts of data, much of which is "noisy,"
assumptions need to be made about how
to combine the data into one meaningful
picture. In this case, that picture is a graph
of worldwide average temperatures. In par-
ticular, one has to decide how much weight
to put on each data set, and how to fill ingaps in the data, or in some cases whether
to extrapolate it. This involves building a
statistical model that allows one to com-
bine the data into a coherent whole. Now,
modeling is a well-respected tool in modern
science, since it allows scientists to explore
and reconstruct phenomena in ways that
are impractical or impossible through direct
observational methods. But any modeling
technique must be robust in the sense that small
7/27/2019 Article 2 - Conundrum.pdf
http://slidepdf.com/reader/full/article-2-conundrumpdf 11/24
MODERN AGE 2012
past reconstructions of temperature. In
fact, insertion or deletion of one or a few
data elements (such as temperatures from
a particular location) should have only a
small effect on the model output. Otherwisethere can be little confidence in the model,
because future data set changes from better
measurements or more accurate reconstruc-
tions from proxies could then result in a
completely different model output. A danger
in any sort of modeling and reconstruction
exercise such as this is that the researchers
will cherry-pick the data to get their desired
result. Consequently, an honest presentation
requires openness and a willingness to share
data and methodology.
In theory, it should not be so difficult
to resolve the question of the temperature
record from a scientific standpoint. Given
the importance of the question of global
warming, there should be a large interna-
tional, publicly available data base to which
new d ata, as they become available from suit-
able sources, are added. Then any researcher
who wishes to reconstruct past temperatures
• could do so and, by publishing his me thodo l-
ogy and ind icating how and w hy he selected
and weighted his data, thus mak e a contribu-
tion to the field. Science works on the basis
of reproducibility: any scientist who claimsto have achieved a result must disclose his
method, materials, and data sources so that
others can reconstruct what he did for verifi-
cation. Whether the scientist did an experi-
ment in a lab or analyzed data to reconstruct
past events (common in astronomy, geology,
and cosmo logy as well as climatology) mak es
no difference. Reproducibility ensures that
no one cheats—something, even in science,
humans are prone to do, especially given the
It is therefore troubling that Micha
Mann's famous hockey stick graph was n
immediately scrutinized by climate scie
tists worldwide. Those who favor the idea
anthropogenic global warming must surehave been aware that a well-documented a
consistently duplicated result would ha
been a much more potent weapon than
poorly documented result that could not
easily duplicated. Alas, that verification a
duplication did not happe n; M ann's result w
shouted to the heavens, but no one wanted
see if it was really valid. M an n did event
ally make his dat-a sources public but not h
methodology. He finally released his co
when asked to do so by Congress, but wh
was released was, and remains, incomplete.
As it happen s, the first person who attem pt
to verify Mann's work, and replicate his da
analysis and results, quickly discovered th
it was not a straightforward process and th
Mann himself had little interest in enabli
this crucial scientific step. He also discover
that it was not very robust with respect
data sets, thus calling into question its valu
This action led to a review by the Nation
Academy of Sciences, which determined th
the graph was in fact the result of flaw
methodology." A subsequent version of t
graph had the Medieval Warm Period reapearing, along w ith the L ittle Ice Age.
Prior to that, however, the graph w
adopted by IPCC for its Third Assessme
Report (2001) and became widely circulate
This gave clear evidence that the warmi
of the late twentieth century was unpre
edented, and quickly led to calls for poli
cal action. But in 2009 the "Climategat
scandal broke. This incident involved t
unplanned release of e-mails among vario
7/27/2019 Article 2 - Conundrum.pdf
http://slidepdf.com/reader/full/article-2-conundrumpdf 12/24
THE GLOBAL WARMING CO NU ND RU M
agenda than with objective science, and in
fact were trying to suppress views that con-
tradicted their own. '^
The net result of this incident was a sig-
nificant increase in the skepticism alreadysurrounding the claims for anthropogenic
global warming. It became clear that despite
claims of "consensus" and "settled science"—
som ething essential if coordin ated worldwide
abatement efforts are to gain traction—the
matter of explanation of the recent tem-
perature rise is still far from being resolved.
And it also appears that we will need at least
twenty more years of data to be able to state
with any confidence whether the pause in
warming since 2001 is temporary or indeed
represents some sort of top. At this point, the
IPCC appears to be backing away from the
hockey stick as the prim ary im petus to action
(although it still supports the basic finding
of unprecedented warmth in the twent ieth
century);'^ instead, the focus is now on otheraspects of their scientific case, primarily the
mechanisms believed responsible, mecha-
nisms that operate regardless of whether the
hockey stick is true.
Longer-Term Findings
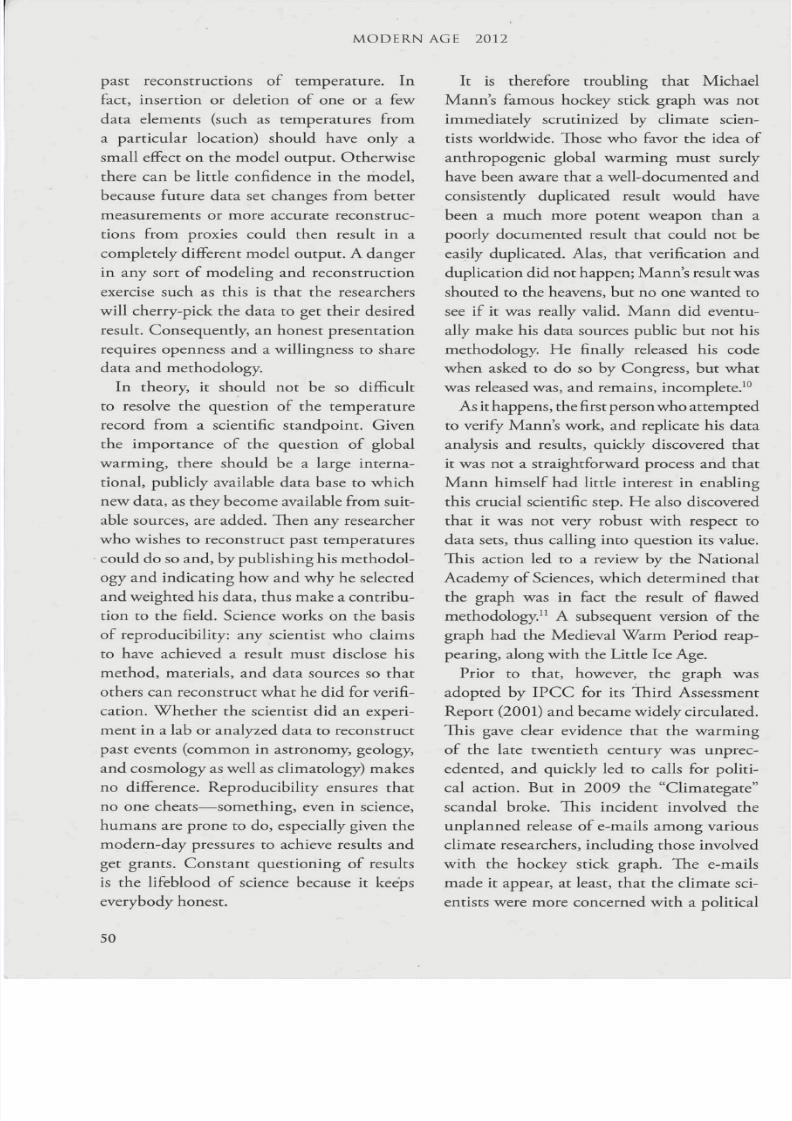
Perhaps the best way to put the currentglobal warming controversy into perspective
is to look at temperature records over longer
historical period s. These records are obtain ed
by proxies, and the main proxy used is ice
core samples from central Creenland, made
by NOAA. These are shown in Figure 4,beginning with the period from AD 1400
to the present, illustrating the controversial
"hockey stick":
It appears that things may be getting
pretty bad today. But let us move to a slightly
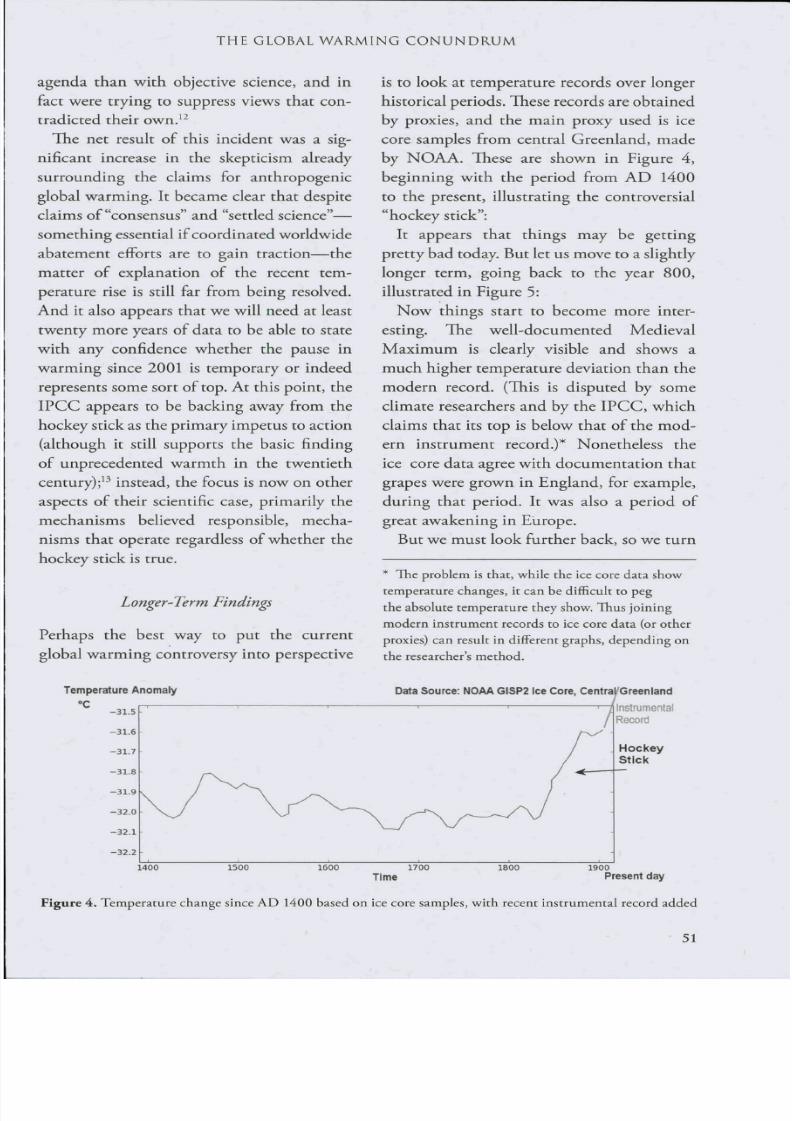
longer term, going back to the year 800,
illustrated in Figure 5:
Now things start to become more inter-
est ing. The well-documented Medieval
Maximum is clearly visible and shows a
much higher temperature deviat ion than the
modern record. (This is disputed by some
climate researchers and by the IPCC, which
claims that its top is below that of the mod-
ern instrum ent record.)* No netheless the
ice core data agree w ith docum enta tion that
grapes were grown in England, for example,during that period. It was also a period of
great awakening in Europe.
But we m ust look further back, so we tu rn
* The problem is that, while the ice core data show
temp erature changes, it can be difficult to peg
the absolute tem perature they show. Thus joining
modern instrum ent records to ice core data (or other
proxies) can result in different graphs, depending onthe researcher s method.
Temperature Anomaly
"C
Data Source: NOAA G ISP2 Ice Core, Central/Greenland
Instrumental
Record
HockeyStick
7/27/2019 Article 2 - Conundrum.pdf
http://slidepdf.com/reader/full/article-2-conundrumpdf 13/24
Temperature
•C
-3 2 . 0
80 0
MODERNAGE 2012
Data Source: NOAA GISP2 Ice Core, Central Greenland
Instrumental
Record
Hockey
Stick
Present day
Figure 5. Temperature change since AD 800 based on ice core samples, with recent instrumental record adde
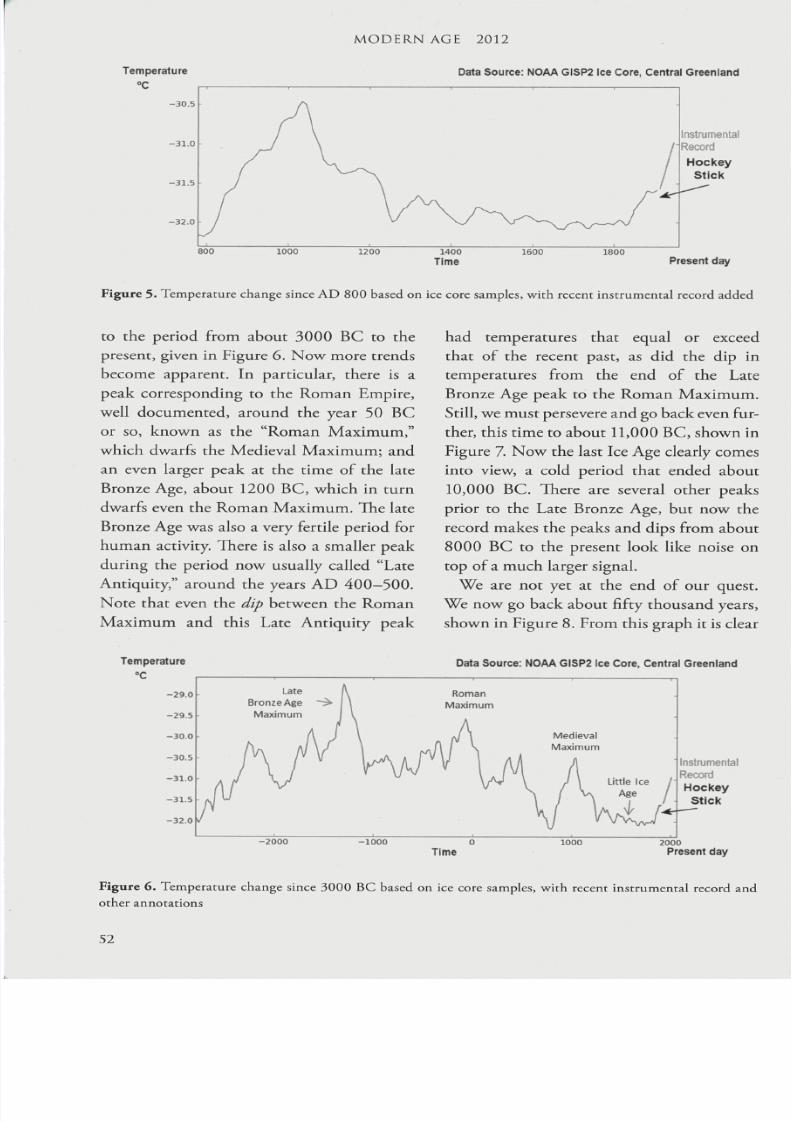
to the period from about 3000 BC to the
present, given inFigure 6. Now more ttends
become apparent. In particular, there is a
peak corresponding to theRoman Empire,
well documented, around the year 50 BC
or so, known as the "Roman Maximum,"
which dwarfs the Medieval Maximum; and
an even larger peak at the time of the late
Bronze Age, about 1200 BC, which in turn
dwarfs even the R oman Maximum. The late
Bronze Age was also a very fertile period for
human activity. There isalso asmaller peak
during theperiod now usually called "Late
Antiquity," around theyears AD 400-500.
Note that even the dip between theRoman
Maximum and this Late Antiquity peak
Temperature
"C
had temperatures that equal or exce
that of the recent past, asdid the dip
temperatures from the end of the La
Bronze Age peak to theRoman Maximum
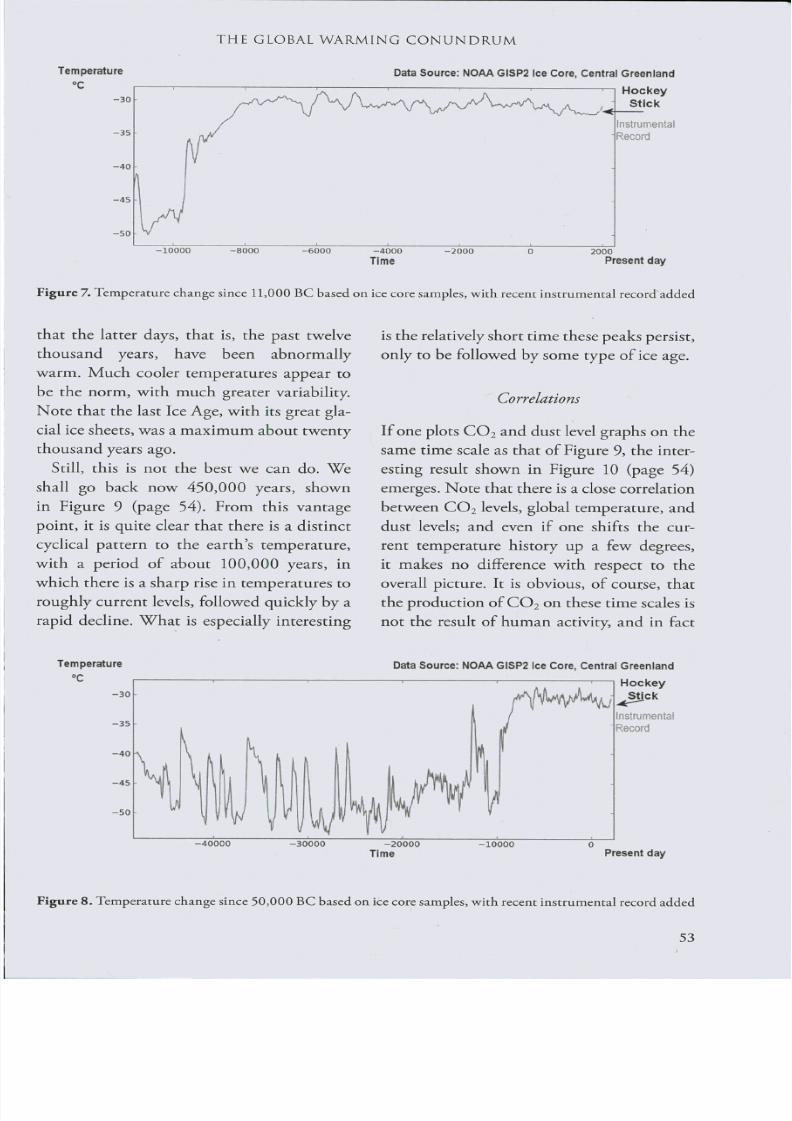
Still, we must persevere and go back even f
ther, this time to about 11,000 BC, shown
Figure 7. Now the last Ice Age clearly com
into view, a cold period that ended abo
10,000 BC. There are several other pea
prior to theLate Bronze Age, but now th
record makes the peaks and dips from abo
8000 BC to thepresent look like noise o
top of a much larger signal.
We are not yetat the endof our que
We now go back about fifty thousand yea
shown in Figure 8. From th is graph it is cle
Data Source: NOAA G ISP2 ice Core, Central Greenland
-29.0
-29.5
-30.0
-30.5
-31 .0
-31.5
-32 .0
Late kBronze Age ~> 1 1
Maximum I \
J\J ^Roman
Maximum
A
A AMedieval
Maximum
nI A Little Ice /•
Age /
Instrumental
Record
Hockey
Stick
7/27/2019 Article 2 - Conundrum.pdf
http://slidepdf.com/reader/full/article-2-conundrumpdf 14/24
THE GLOBAL WARMING GONUNDRUM
Temperature
•C
- 3 0
Data Source: NOAA GISP2 Ice Core, Central Greenland
Ho c k e y
Stick
Instrumental
Record
-10000 -8000 -6000 -4000Time
2000
Present day
Figure 7. Temp erature change since 11,000 BG based on ice core samples, with recent instrum ental record added
that the latter days, that is, the past twelve
thousand years, have been abnormally
warm. Much cooler temperatures appear to
be the norm, with much greater variability.
Note that the last Ice Age, with its great gla-
cial ice sheets, was a m axi m um about twe nty
thousand years ago.
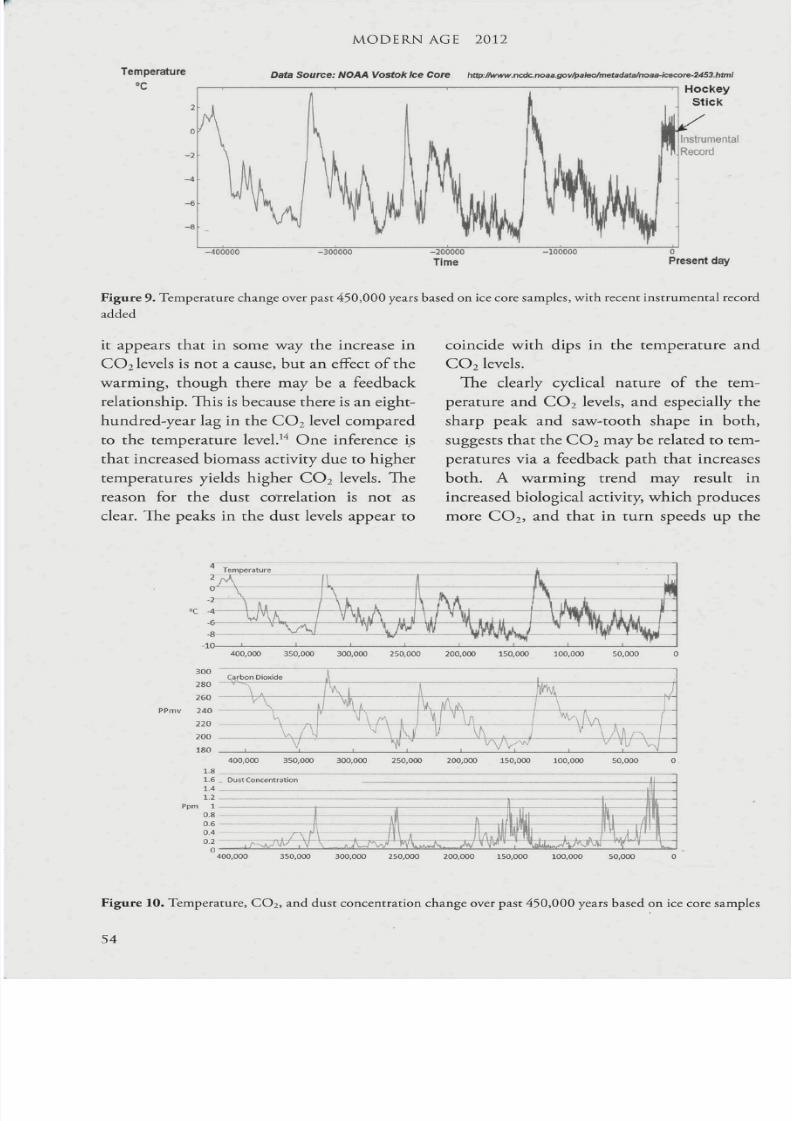
Still, this is not the best we can do. We
shall go back now 450,000 years, shown
in Figure 9 (page 54). From this vantage
point, it is quite clear that there is a distinct
cyclical pattern to the earth 's temperature,
with a period of about 100,000 years, in
which there is a sharp rise in temperatures to
roughly current levels, followed quickly by a
rapid decline. W h a t is especially interesting
is the relatively short ti m e these pe aks persist,
only to be followed by some type of ice age.
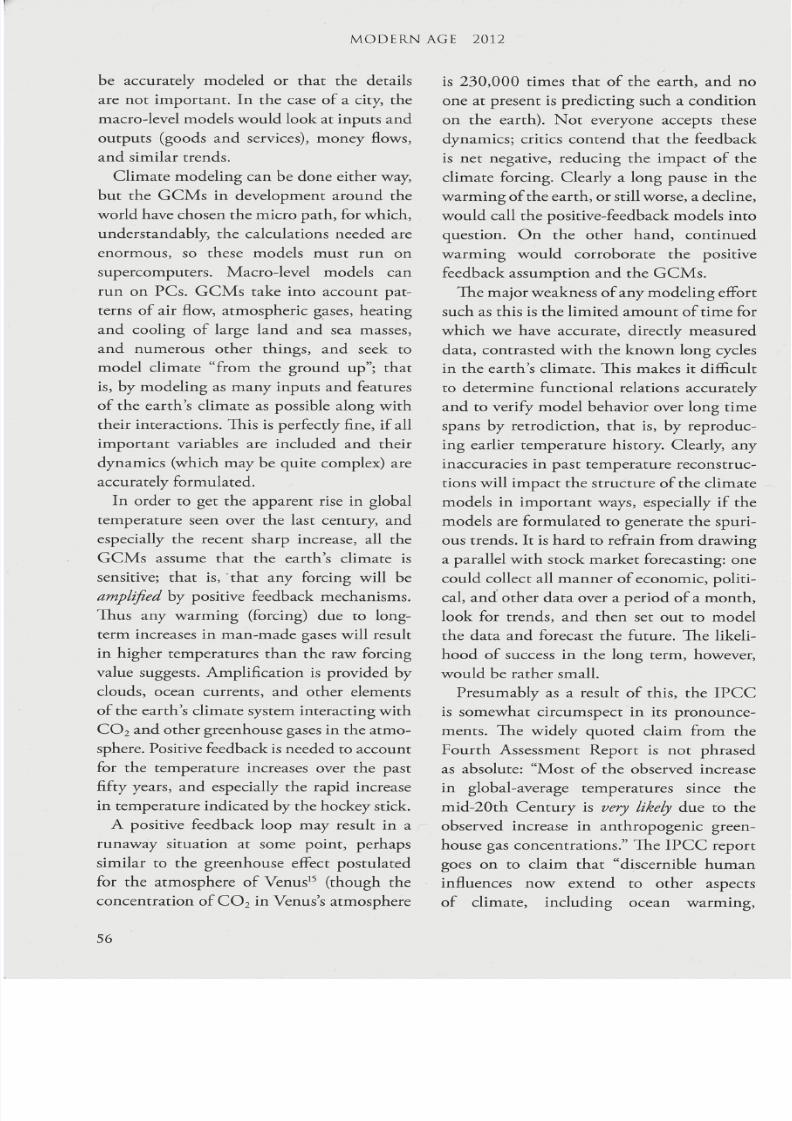
Correlations
If one plots GO2 an d d ust level graphs on the
same time scale as that of Figure 9, the inter-
esting result shown in Figure 10 (page 54)
emerges. Note that there is a close correlation
between GO2 levels, global temperature, and
dust levels; and even if one shifts the cur-
rent temperature history up a few degrees,
it makes no difference with respect to the
overall picture. It is obvious, of course, that
the prod uction of GO2 on these time scales is
not the result of human activity, and in fact
Temperature
- 3 0
Data Source: NOAA GISP2 Ice Core, Central Greenland
Ho c k e y
^ c k
Instrumental
Record
7/27/2019 Article 2 - Conundrum.pdf
http://slidepdf.com/reader/full/article-2-conundrumpdf 15/24
MO DE RN AGE 2012
Tempera ture
»C
Data Source: NOAA Vostoklce Core
Present day
Figure 9. Temp erature change over past 450,000 years based on ice core samples, with recent instrumen tal reco
added
it appears that in some way the increase in
C O 2 levels is not a cause, but an effect of the
warming, though there may be a feedback
relationship. This is because there is an eight-
hundred-year lag in the CO2 level compared
to the temperature level.'^ One inference is
tha t increased biomass activity due to higher
temperatures yields higher CO2 levels. Thereason for the dust correlation is not as
clear. The peaks in the dust levels appear to
coincide with dips in the temperature a
CO2 levels.
The clearly cyclical nature of the tem
perature and CO2 levels, and especially t
sharp peak and saw-tooth shape in bot
suggests that the CO2 may be related to tem
peratures via a feedback path that increas
both. A warming trend may result increased biological activity, which produc
more CO2, and that in turn speeds up t
4 0 0 , 0 0 0 3 5 0 , 0 0 0 3 0 0 , 0 0 0 2 5 0 , 0 0 0 2 0 0 , 0 0 0 1 5 0 , 0 0 0 1 0 0 , 0 0 0 5 0 , 0 0 0
300
4 0 0 , 0 0 0 3 5 0 , 0 0 0 3 0 0 , 0 0 0 2 5 0 , 0 0 0 2 0 0 , 0 0 0 1 5 0 , 0 0 0 1 0 0 , 0 0 0 5 0 , 0 0 0 0

7/27/2019 Article 2 - Conundrum.pdf
http://slidepdf.com/reader/full/article-2-conundrumpdf 16/24
THE GLOBAL WARMING CONUNDRUM
warming somewhat, in a positive feedback
loop, accounting for the very steep rise in
temperature. But when the CO2 or the
temperature level reaches a certain thresh-
old, it triggers an effect leading to globalcooling. Such an effect could be significantly
increased cloud cover, for example, increas-
ing the albedo (reflectivity) of the earth. The
earth would then slowly cool, until the effect
dissipated, and then the cycle would repeat.
What the graph shows could easily be this
type of feedback mechanism, although there
could be other causes, such as long-term
solar cycles. James Hansen, a prominent
global warming advocate, has sought to link
this long-term behavior with Milankovitch
cycles, which are long-term cycles in the
earth's orbit (eccentricity, obliquity, and pte-
cession). At present it remains unresolved.
LookingForward: The IPCC and the GCMs
The IPCC report (the latest is the fourth,
2007, available publicly on the Internet) col-
lects a large amount of data on climate change,
including temperatures in the atmosphere,
on land masses, and in the oceans, saliniza-
tion levels, sea level changes, greenhouse gas
levels, snow cover, and other factors related
to climate change. The IPCC reviews thesewith respect to causality and the likelihood
and extent of anthropogenic influences.
The analysis the IPCC has done is certainly
impressive, and it canno t be dismissed easily.
The reader is encouraged to download and
peruse the report to get a better feel for the
depth of the data collection and analysis.
Even critics of the IPCC 's conclusions admit
that the scientists who support the IPCC
work have summarized well the scientific
causes) on one hand , and feedback functions
on the other. (The critics disagree about the
nature and direction of the feedback.) The
large number of trends that seem to be mov-
ing in the same direction naturally elicitsthe question, "What is the forcing function
behind these trends?" The obvious answer
is "human activity," and then the inference
is greenhouse gas production. Anyone who
disputes this answer is justifiably confronted
with the question, "What else is there?" An
answer such as "natural processes" is not par-
ticularly interesting, nor does it lend itself to
remedial action. This does not mean that it
is not correct, however.
The hockey stick and similar graphs are
useful for revealing temperature trends up
to the present, but policymakers are more
interested in future trends, in causation, and
in possible mitigation strategies. For this it
is possible simply to extrapolate the trends,
though the variability of the data, as well asthe controversy and uncertainty surround-
ing that data, make such extrapolation very
problematic and not particularly convincing.
Instead, various computer-based climate
models, the GCMs mentioned earlier, are
intended to model the w orld's climate in such
a way that reliable extrapolations into the
future can be made under various strategies.There are two types of mathematical/
simulation models that can be devised:
micro and macro. Micro-level models look at
all the individual pieces, write code to simu-
late or model them, then try to describe all
their interactions, and thus characterize the
behavior of the complete system. It would be
like simulating a city economy by modeling
each type of shop, industry, and household;
then transportation, banking, law, and
7/27/2019 Article 2 - Conundrum.pdf
http://slidepdf.com/reader/full/article-2-conundrumpdf 17/24
MODERNAGE 2012
be accurately modeled or that the details
are not important. In the case of a city, the
macro-level models would look at inputs and
outputs (goods and services), money flows,
and similar trends.Climate modeling can be done either way,
but the CCMs in development around the
world have chosen the m icro path, for which,
understandably, the calculations needed are
enormous, so these models must run on
supercomputers. Macro-level models can
run on PCs. CCMs take into account pat-
terns of air flow, atmospheric gases, heating
and cooling of large land and sea masses,
and numerous other things, and seek to
model climate "from the ground up"; that
is, by modeling as many inpu ts and features
of the earth's climate as possible along with
their interactions. This is perfectly fine, if all
important variables are included and their
dynamics (which may be quite complex) are
accurately formulated.In order to get the apparent rise in global
temperature seen over the last century, and
especially the recent sharp increase, all the
CCMs assume that the earth's climate is
sensitive; that is, that any forcing will be
amplified by positive feedback mechanisms.
Thus any warming (forcing) due to long-
term increases in man-made gases will resultin higher temperatures than the raw forcing
value suggests. Amplification is provided by
clouds, ocean currents, and other elements
of the earth's climate system interacting with
CO2 and other greenhouse gases in the atmo-
sphere. Positive feedback is needed to account
for the temperature increases over the past
fifty years, and especially the rapid increase
in temperature indicated by the hockey stick.
A positive feedback loop may result in a
is 230,000 times that of the earth, and n
one at present is predicting such a conditio
on the earth). Not everyone accepts the
dynamics; critics contend that the feedbac
is net negative, reducing the impact of thclimate forcing. Clearly a long pause in th
warm ing of the earth, or still worse, a declin
would call the positive-feedback models in
question. On the other hand, continue
warming would corroborate the positiv
feedback assumption and the CCMs.
The major weakness of any modeling effo
such as this is the limited am ount of time f
which we have accurate, directly measure
data, contrasted with the known long cycl
in the earth's climate. This makes it difficu
to determine functional relations accurate
and to verify model behavior over long tim
spans by retrodiction, that is, by reprodu
ing earlier temperature history. Clearly, an
inaccuracies in past temperature reconstru
tions will impact the structure of the climamodels in important ways, especially if th
models are formulated to generate the spur
ous trends. It is hard to refrain from drawin
a parallel with stock market forecasting: on
could collect all manner of econom ic, polit
cal, and other data over a period of a mont
look for trends, and then set out to mod
the data and forecast the future. The likelhood of success in the long term, howeve
would be rather small.
Presumably as a result of this, the IPC
is somewhat circumspect in its pronounc
ments. The widely quoted claim from th
Fourth Assessment Report is not phrase
as absolute: "Most of the observed increas
in global-average temperatures since th
mid-20th Century is very likely due to th
7/27/2019 Article 2 - Conundrum.pdf
http://slidepdf.com/reader/full/article-2-conundrumpdf 18/24
THE GLOBAL WARMING GONUNDRUM
continental-average temperatures, tempera-
ture extremes and wind patterns." They also
argue that natural variability is not sufficient:
The observed widespread warming ofthe atmosphere and ocean, together with
ice mass loss, suppott the conclusion
that it is extremely unlikely that global
climate change of the past 50 years can
be explained without external forcing,
and very likely tha t it is not due to kn ow n
natural causes alone.'^
The IPCC defines its terms with respect to
probability ranges as follows: extremely likely
>95 % ; very likely >90%; likely >GG%.''^ The
IPCC projects future temperature ranges
and , assumin g a doubling of CO 2 concentra-
tions over the next century or so, concludes
that the global average tempetature increase
"is likely to be in the range 2°C to 4.5°C
with a best estimate of about 3°C, and isvery unlikely to be less than 1.5°C. Values
substantially higher than 4.5°C cannot be
excluded."'** The assessment specifically pro-
jects an increase of 0.2°C per decade for the
next two decades (to 2027) and claims that
even if greenhouse gas emissions had been
held at yeat 2000 levels, there would still
be an increase of 0.1°C per decade. This is
a significant increase, larger than the recent
increase (0.07°C per decade over the twen-
tieth century, 0.13°C over the past thirty
years), which would affect glacial melting,
agriculture, ocean currents and salinization,
and many othet climate elements, most
in a negative way with respect to human
interests. The IPCC does admit that there
are large uncertainties tegarding clouds andtheir effect," and indeed a change in aver-
The fact that there has been essentially no
warming since about the year 2000, despite
the continual dumping of large amounts of
CO2 into the atmosphere, is causing con-
sternation among supporters of the IPCCand the global warming hypothesis. James
Lovelock, British environmentalist and orig-
inator of the "Caia" theory of the earth as
a single, integrated organism, has recanted:
"There's noth ing much really happen ing yet.
We were supposed to be halfway toward a
frying world now. The world has not warmed
up very much since the millennium. Twelve
years is a reasonable time. The temperature
has stayed almost co nstan t, whereas it should
have been rising. Carbon dioxide is rising,
no question about that."^"
The IPCC's credibility has been dam-
aged by several errors in this report. First,
the IPCC had to issue a retraction owing
to incorrect statements about the melting
of Himalayan ice. Then it emerged that thereport contained claims about disappearing
mountain ice that were based on a student
dissertation and an article in a mountaineer-
ing magazine. A diagram intended to show
the potential for generating electricity from
wave motion was found to contain errors.^'
The repo rt also relied on papers by the W orld
Wildlife Foundation (an advocacy organiza-
tion) for its claims that global warming
could kill off 40% of the rain forest. The
IPCC argues, with some justification, that
the errors do not affect the substance of the
report; but when a highly controversial sub-
ject is under discussion, credibility is easily
damaged by gaffes such as these. More seri-
ous is the loss of credibility due to backped-
aling on the hockey stick—a case where theIPCC uncritically accepted a crucial piece of
7/27/2019 Article 2 - Conundrum.pdf
http://slidepdf.com/reader/full/article-2-conundrumpdf 19/24
MODERNAGE 2012
Answers to the Questions
We may now review the questions asked at
the beginning of this study and see what
answers make sense:
1. Has there been recent warm ing (fifty
years, one hundred years, etc.)? Yes, the
instrumental record indicates a warm-
ing trend, especially over the past
thirty years.
2. Is this trend unusua l in context of histor-
ical global temperatures (tens, hundreds
of thousands of years)? That is, does it
represent an anomaly? This is a more
difficult question. Glearly, on the scale
of hundreds of thousands of years, the
recent temperature rise is little more
than noise and in that context cannot
be regarded as an anomaly, with or
without the hockey stick. That does
not mean that it is insignificant, how-
ever, since changes over long periods
have wrought major ice ages, when
large parts of the earth were covered
with thick ice sheets. Warming is
of course the opposite effect, but its
continuation over a long period could
also result in major climatic changes,
including sea level rise together with
concomitant flooding, as well as sig-
nificant changes in growth patterns
for flora and fauna over large areas.
This is true regardless of the validity
of the hockey stick and is the reason
m any are alarmed by the recent trends.
3. How good are the data on wh ich predic-
tions (pro and con) are based? Recent
data (past one hundred years or so)
cores appear to be fairly reliable; tr
rings can be more problematic
temperature indicators, because th
depend on factors other than temper
ture (e.g., GO2 levels, moisture). Moresearch on this is clearly neede
and long-term data from more glob
locations is also necessary to put
rest questions about the hockey stic
On the other hand, there is oth
evidence of wa rm ing in the form
sea level changes, reductions in glac
ice sheets, and snow cover decrease
among others ( though many of the
phenomena have been observed in t
past).
4. What are the known or suspected c
relations with temperature chan
(solar activity, huma n activity, etc
Glearly human activity is suspect
with regard to the recent increa
in global temperatures (since 1980
There is a suspected correlation wi
solar activity over a longer ter m (abo
four hundred years), although th
cannot account for the recent run-u
and our data about solar irradiance
not go back far enough to establi
the presence or absence of a conne
tion between solar activity and globtemperatures. There definitely
however, a correlation of solar activi
with temperatures at least in Europ
during the Little Ice Age, solar acti
ity, as measured by sunspots, w
sharply down, though how mu
that changed insolation (solar ener
impinging on the earth) is not dea
GGMs generally assume a variatio
of 0.1 % in solar outpu t (correspon
7/27/2019 Article 2 - Conundrum.pdf
http://slidepdf.com/reader/full/article-2-conundrumpdf 20/24
THE GLOBAL WAEIMING CONUNDRUM
changes in the earth's albedo up to
about 9 wat ts /square meter—several
times the total forcing of greenhouse
gases. The GCMs do not consider
such large changes in albedo. Albedois largely a function of cloud cover,
an acknowledged area of uncertainty
in the IPCC assessment, and albedo
changes are strongly correlated with
recent temperature t rends. Ocean cur-
rent trends such as the Pacific decadal
oscillation (PDO) are also strongly
correlated with recent temperature
records.
5 . What are the best available projections
of future changes, and how reliable are
they? Th is is a very difficult que stion ,
because the climate models that we
have, the General Circulation Models,
are based on limited data about pro-
cesses that unfold over very long peri-
ods. In addition, as the answer to thelast question indicates, we do no t really
understand all the causal influences
on climate, or exactly how any one of
them affects climate. The IP C C adm its
this but believes that we have enough
data to construct reasonably accurate
models , and that our understanding
of key functional relationships among
climate variables is robust. These
models generally forecast a tempera-
ture increase of about 0.2°C for each
of the next two decades (2010-20,
2020—30). If these forecasts are accu-
rate, the models (and the underlying
theory) will be corroborated; if they
are not, we may be back to the draw ing
board. Forecasts of global temperatureincreases have not been met in recent
we cannot say definitively how much.
It depends, partly, on how much con-
fidence one places in the hockey stick
graph. Various other explanations
have been given, including the PacificDecadal Oscillation,^^ solar activity,
and changes in the earth's albedo.^^ A
cautionary estimate of 50% seems rea-
sonable, provided that one acknowl-
edges that the actual number could '
be anywhere from 5% to 95%, and
that it may be decades before we have
enough empirical data for an accurate
est imate.
7. How much of this hum an activity is
associated with use of carbon-ba sed
fuels? The exact answer to the question
is not known, but is probably in the
50—90% range. Any human act ivi ty
tha t uses energy not from the sun gen-
erates heat. Obviously, burning virtu-
ally any fossil fuel in the atmosphereinvolves production of CO2 (although
wood burning is carbon-neutral
because trees use CO2 to make wood,
so whether a tree is burned for fuel or
just decomposes after it dies, the same
am ou nt of CO2 is released but later
absorbed by new trees) . Other human
activity is known to produce green-
house gases, including cultivation of
rice in paddies (which behave simi-
larly to wetlands in the production of
methane), raising of farm animals
that produce methane in the process
of digestion (mainly cattle), emissions
from landfills, a nd na tura l gas leaks.^^
8. Wh at rea listically can be done to curb
this activity? There are two conflicting
problems: (1) We don't want to spend

7/27/2019 Article 2 - Conundrum.pdf
http://slidepdf.com/reader/full/article-2-conundrumpdf 21/24
MODERN AGE 2012
extreme weather, and steadily increas-
ing heat. Erring on the side of caution
is generally a good idea, although
there is a high o ppo rtun ity cost in this
case—lost jobs, reduced productivity,even starvation; the burden, as usual,
would fall unequally on the poor. The
Kyoto protocol expires in 2012, and
no replacement treaty is in place. The
next ten years or so should tell the tale:
if there is no significant warming, or
even cooling, the credibility of the
IPCC will be destroyed. If warming
resumes, its credibility will be signifi-
cantly enhanced.
Where We Stand Now
The earth's climate is always changing, and
climate research seeks to understand it by
looking back to past events and trends, and
forward by modeling the climate and pro-jecting future trends. Not in dispute are (1)
the recent high rate of temperature increase;
(2) the increase in atmospheric CO2 and
other greenhouse gases; (3) the responsi-
bility of human activity for increases in
greenhouse gases; (4) the climate forcing of
CO2 and other greenhouse gases; and (5) the
existence of positive and negative feedbacks
in the earth's climate system. W ha t is in dis-
pute is explanation of the temperature rise,
the nature of the feedbacks in the climate
system, and future temperature projections.
The prevailing position is that of the IPCC,
that the warming is unprecedented and
must be the result of climate forcing from
hum an-origin ated greenhouse gas emissions,
amplified by feedback in the earth's climate
system. The primary remedy is curtailment
tons of fossil fuels annually (coal, oil, natur
gas), a great deal of CO^ is produced, alo
with various airborne pollutants. This lev
of consumption is undesirable for sever
reasons that have nothing to do with globwarming: (1) we need to husband resourc
for future generations—the supply of fos
fuels is not unlimited (sustainability); (2) u
of fuels imported from unstable regions
the world leaves us vulnerable to geopolitic
events that could interrupt our supply; an
(3) we should seek to reduce pollution, an
burning of many types of fossil fuel leads
relatively high pollution levels. This mea
that the question of fossil fuel use and co
servation should be decoupled from that
global warming. The ideal solution would
to fund alternative energy research to fin
alternative heat and carbon-neutral ways
generating power.
At this time the Climategate scandal an
problems with the hockey stick graph hav
adversely affected the credibility of glob
warming advocates (though not necessari
their scientific case). The global recessio
that began in 2008 has effectively killed ser
ous global efforts at CO2 mitigation. As f
future action, opinion polls on the subje
of global warming vary considerably an
depend on the particular questions askethe percent of the population that believ
global warming is happening or is a thre
ranges from 30 to 70,^' ' '̂' with a recent Ya
poll putting the number at 60%, at least i
the Unite d States.^^ A Na tur e Co nserv anc
poll from 2008 disclosed that only 18%
respondents thought that global warmin
was real, harmful, and due to human acti
ity.^* These numbers are very inconsisten
which suggests that support is below th
7/27/2019 Article 2 - Conundrum.pdf
http://slidepdf.com/reader/full/article-2-conundrumpdf 22/24
THE GLOBAL WARMING CONUNDRUM
prestige of the IPCC and its predictions of
significant future temperature increases if
CO2 production is not curtailed. The con-
troversy has assumed a religious nature, in
part because of biblical passages interpretedas enjoining environmental stewardship on
mankind, and because for some environ-
mentalism has become a surrogate religion:
"We are going to destroy the creation," James
Hansen has warned us.^ ' Indeed, both sides
are claiming the moral high ground: those
al igned with the IPCC contend that our
failure to curtail greenhouse gas production
will result in a catastrophe for the earth and
humanity; those opposed argue that there
will be a catastrophe, but of a different sort,
especially for the poor, if the gas abatement
proceeds. In light of this situation, there are
three basic positions that a rational observer
may take:
1. Wo rldwide action to redu ce fossil fuel
use should be taken immediately. To many,
including the IPCC, historical trends and
climate models strongly indicate that there
will be catastrophe on a global scale, includ-
ing flooding, famine, property destruction,
and reductions in the habitability of the
earth unless CO2 emissions are sharply
curtailed, which means a significant drop in
fossil fuel use. Abatement, for them, is theonly prud ent course.
2. No significant reduction in fossil fuel
use is needed. Others dispute the notion of
global warming on account of (a) disagree-
ment about temperature reconstructions for
the past and thus about the seriousness of the
recent rise; (b) disagreement about the valid-
i ty of the CCMs and in part icular about
the sensitivity of the climate system with
vs. positive feedback); and (c) the large sums
of money and the economic and social dislo-
cations necessary for any effective mitigation
strategy, including the degree of coercion
that would be required. This implies that
unwarranted actions to reduce CO2 by
reducing fossil fuel consumption will itself
lead to catastrophe, including starvation and
significantly reduced living standards, espe-
cially for the poor, since the richer countries
will be able to afford the higher prices for
food, energy, and other goods stemming
from greenhouse gas abatement efforts.3 . Suspend judgment. The relatively short
period of time over which we have reliable
measurements means that c l imate model-
ing and thus forecasting is difficult; hence
the degree of cer tainty needed for difficult
and possibly irreversible political changes is
lacking. The next ten years will give us much
more information about the earth's climate
and, in particular, about temperature trends.
Most likely we shall have to wait that long
before there is any certainty one way or
the other regarding the effect of CO2 and
thus the need for a mitigation strategy. So
a wait-and-see attitude for now is the best
course. This course of action is not without
risk, however, because global wa rm ing could
escalate, rendering mitigation far moredifficult.
The old Chinese curse seems appropriate
here, "May you live in interesting times!"
We do, thanks in part to the global warm ing
controversy. The next decade or so will tell
the tale: either science (or at least establish-
ment science) will enjoy one of its greatest
triumphs and save humanity or suffer i ts
most embarrassing and humiliating failure.

7/27/2019 Article 2 - Conundrum.pdf
http://slidepdf.com/reader/full/article-2-conundrumpdf 23/24
MO DE RN AGE 2012
1 Al Gore, An Inconvenient Truth: The Crisis of Global Warming (New York: Viking , 2007— also a well-known video); Earth
in the Balance: Forging a New Common Purpose (London: Earthscan, 2007); James Hansen, Storms of My Grandchildren: Th
Truth About the Coming Climate C atastrophe and the Last Chance to Save Humanity (New York: Bloomsbury, 2009).
2 Letters to the Editor, University of Chicago Magazine (January—February 2012), 6.3 J. Farmer and M. Baxter, "Atmo spheric carbo n dioxide levels as indic ated by the stable isotope record in woo d," Nature 247
(February 1974): 273-275; NOAA Earth Research Laboratory, "Recent Mauna Loa CO2," http://www.esrl.noaa.gov/gmd/ccgg/trends/. Article "Air," from Encyclopedia Britannica, http://ww w.britann ica.com/E Bcheck ed/topic/10 582/air.
4 Intergovernm ental Panel on Climate Chan ge History, IP CC web page, http://www.ipcc.ch/org anization/org anization_h istos h tml# . T 5agnNmQOeY.
5 M . M an n, R. Bradley, and M. Hu ghe s, "Global-scale tem pera ture patterns and climate forcing over the past six centur ies,"Afet«ri-392 (1998): 779-87.
6 M. Ma nn, R. Bradley, and M . Hug hes, "No rthern Hem isphere Temperatures during the Past Millen ium: Inferences,Uncertainties, and Limitations," Geophysical Research Letters 26, no . 6 : 759-6 2 .
7 C. Wo odhou se, D. Mek o, G. Mac Don ald, D. Stahle, E. Cook , "A 1,200-year perspective of 21st century d roug ht insouthwestern North America," Proc. National Academy of Sciences 50 (December 14, 2010): 212 83 -88 , ht tp: / /www.pnas .orcon tem/ea r ly /2010 /12 /06 /09 in97107fu ll . pd f+h tml .
8 Fred Pearce, "Hockey Stick Graph Took Pride of Place in IP CC Re port, Despite Dou bts," Guardian Special Investigation,February 9, 2010, http://www .guardian.co.uk/env ironm ent/2010/feb/0 9/hockey- stick-graph-ipcc-rep ort.
9 Roy Spencer, The Great GlobalWarmingBlunder {^QVjYork:¥.nco\xntcrVioo\is,2Q\0), 11 .
10 A. W. Mon tford, private com mun ication to the author.11 G. N or th et al., Surface T emperature Reconstructions or the Last 2000 í í a « (Washington, DC : Nat ional Academies Press,
2006) .
12 A. W. Mon tford, The Hockey Stick Illusion (London: Stacey International, 2010), 402-20.13 Intergovernmen tal Panel on Clim ate Cha nge, Climate Change 2007: The Physical Science Basis (New York: Cambridge
University Press, 2007), Figure TS. 20, p. 55. The figure shows twelve different reconstructions of northern hemispheretempera tures, most of which show some medieval warm ing and some subsequent cooling. But ail show that curre nttemperatures are significantly higher than in the medieval period, by 0.5''C or more.
14 Spencer, Great Global Warming Blunder, 29.15 European Space Agency, "ESA Venus Express," http://www .esa. int/esaMI/V enus_E xpress/S EMF PY8 08BE _0.htm l.
16 Ibid ., 10.17 Intergovernm ental Panel on Clim ate Cha nge, Climate Change 2007: Synthesis Report, Geneva, Switzerland, 27, http://www
ipcc.ch/publ ica t ions_and_data /ar4/syr/en/contents .html.
18 Ibid., 12.
19 Intergovernm ental Panel on Clim ate Cha nge, Climate Change 2007: The Physical Science Basis (New York: CambridgeUniversity Press, 2007), 88 .
20 "Climate Change Alarmist Recants: '1 Made a Mistak e, '" report from MS NB C, reported in Newsmax, www.newsmax.com,April, 29, 2012.
21 R. Gray and B. Leach, "New errors in IP CC climate change report," Telegraph, February 6, 2010, http://www.telegrapb.coearth/environment/c l imatechange/7177230/New-errors - in-IPCC-cl imate-change-report .html.
22 Spencer, Great Global Warming Blunder, 14 .23 Project Earthshin e; see comm ents on forcings due to albedo and greenhouse gases, "Earth's Albedo Tells an Interesting Stor
ht tp: / /current .com/lgabu4c.
24 J. Mir alda-E scud é, "The anth rop oge nic greenhouse effect: radiative forcings," Inst itut e of Space Sciences, Bellaterra, Spa in,http://www.ice.csic.es/personal/miralda/fsgw/lect3.html.
25 Gray and Leach, "New errors in IP CC climate change report."26 J. Eilperin, "Fewer Am ericans believe in global war min g, poll shows," Washington Post, November 25, 2009, ht tp: / /www .
was h ing tonpos t .com/wp-dyn /con ten t / a r ti c l e /2009 / l l /24 /AR20091I2402989 . h tml .
27 S. Papp as, "Ne w poll shows 63 percent of Am ericans believe global wa rm ing is occu rring ," LiveScience, http: / /www.ninn.co
earth-matters/climate-weather/stories/new-poll-shows-63-percent-of-americans-believe-global-warming-.
28 "W hat Do Am ericans Believe Abo ut Clima te Chang e?" Natu re Conservancy, October, 2008 , www .nature.org/initiatives/
c l imatechange/fea tures/art26253.html.
29 S. Rothschild, "NASA Climate Expert War ns Kansans of Dire Consequences of Global Wa rmin g," Lawrence Journal-World
September 23, 2008.
N O TE : Som e of the data shown in the figures are updated mo nthly by the sources. Readers who desire updated , larger, color versof all the figures in this article should contact the author directly: [email protected].

7/27/2019 Article 2 - Conundrum.pdf
http://slidepdf.com/reader/full/article-2-conundrumpdf 24/24
Copyright of Modern Age is the property of Intercollegiate Studies Institute and its content may not be copied
or emailed to multiple sites or posted to a listserv without the copyright holder's express written permission.
However, users may print, download, or email articles for individual use.