articledrperumalramasamy.com/recent-papers/chitosan.pdfuse of plasticizers has disadvantages such as...
TRANSCRIPT

Copyright © 2014 American Scientific PublishersAll rights reservedPrinted in the United States of America
ArticleJournal of
Nanoscience and NanotechnologyVol. 14, 1–13, 2014www.aspbs.com/jnn
Chitosan–Gold–Lithium Nanocompositesas Solid Polymer Electrolyte
S. N. Suraiya Begum1, Ramanathaswamy Pandian2,Vinod K. Aswal3, and Radha Perumal Ramasamy1∗
1Department of Applied Science and Technology, ACT campus, Anna University, Chennai 600025, India2Nanomaterials and Characterization Section, Surface and Nanoscience Division, Materials Science Group,
Indra Gandhi Center for Atomic Research, Kalpakkam 603102, India3Solid State Physics Division, Bhabha Atomic Research Centre, Trombay, Mumbai 400085, India
Lithium micro batteries are emerging field of research. For environmental safety biodegradable filmsare preferred. Recently biodegradable polymers have gained wide application in the field of solidpolymer electrolytes. To make biodegradable polymers films plasticizers are usually used. However,use of plasticizers has disadvantages such as inhomogenities in phases and mechanical insta-bility that will affect the performance of Lithium micro batteries. We have in this research usedgold nanoparticles that are environmentally friendly, instead of plasticizers. Gold nanoparticles weredirectly template upon chitosan membranes by reduction process so as to enhance the interactionsof Lithium with the polymer. In this article, for the first time the characteristics of Chitosan–gold–Lithium nanocomposite films are investigated. The films were prepared using simple solution castingtechnique. We have used various characterization tools such as Small Angle Neutron Scattering(SANS), XRD, FTIR, Raman, FESEM, and AFM, Light scattering, Dielectric and electrical conduc-tivity measurements. Our investigations show that incorporation of gold results in enhancement ofconductivity in Lithium containing Chitosan films. Also it affects the dielectric characteristics of thefilms. We conclude through various characterization tools that the enhancement in the conductivitywas due to the retardation of crystal growth of lithium salt in the presence of gold nanoparticles.A model is proposed regarding the formation of the new nanocomposite. The conductivity of thesebiodegradable films is comparable to those of the current inorganic Lithium micro batteries. Thisnew chitosan–Au–Li nanocomposite has potential applications in the field of Lithium micro batteries.
Keywords:
1. INTRODUCTIONSolid state polymer batteries have gained enormousinterest due to its compactness and reliability without leak-age. Uses of biodegradable polymers for solid state bat-teries that are friendly to the environment have gained lotof scientific interest recently. Over last few decades, stepshave been taken to increase the ionic conductivity of thepolymers.12 The fascinating properties of nanostructurematerials and their functions related to size effect incurthem in many applications and have been of great scientificinterest in recent times. The challenging task in mod-ern material science involves the preparation of nanocom-posites for biological and environmental applications.34
∗Author to whom correspondence should be addressed.
Metallic nanoparticles especially noble metals are ofimportance due to their unique optical, electrical and elec-trochemical properties.5 Particularly, gold nanoparticleshave been used because of its chemical stability, non-toxicnature, biocompatibility and capability to transfer moreelectrons.6 Due to its unique properties gold nanoparti-cles has been used for making materials that are environ-mentally friendly and it has been greatly used in areas ofbiomedical and electro analysis.7
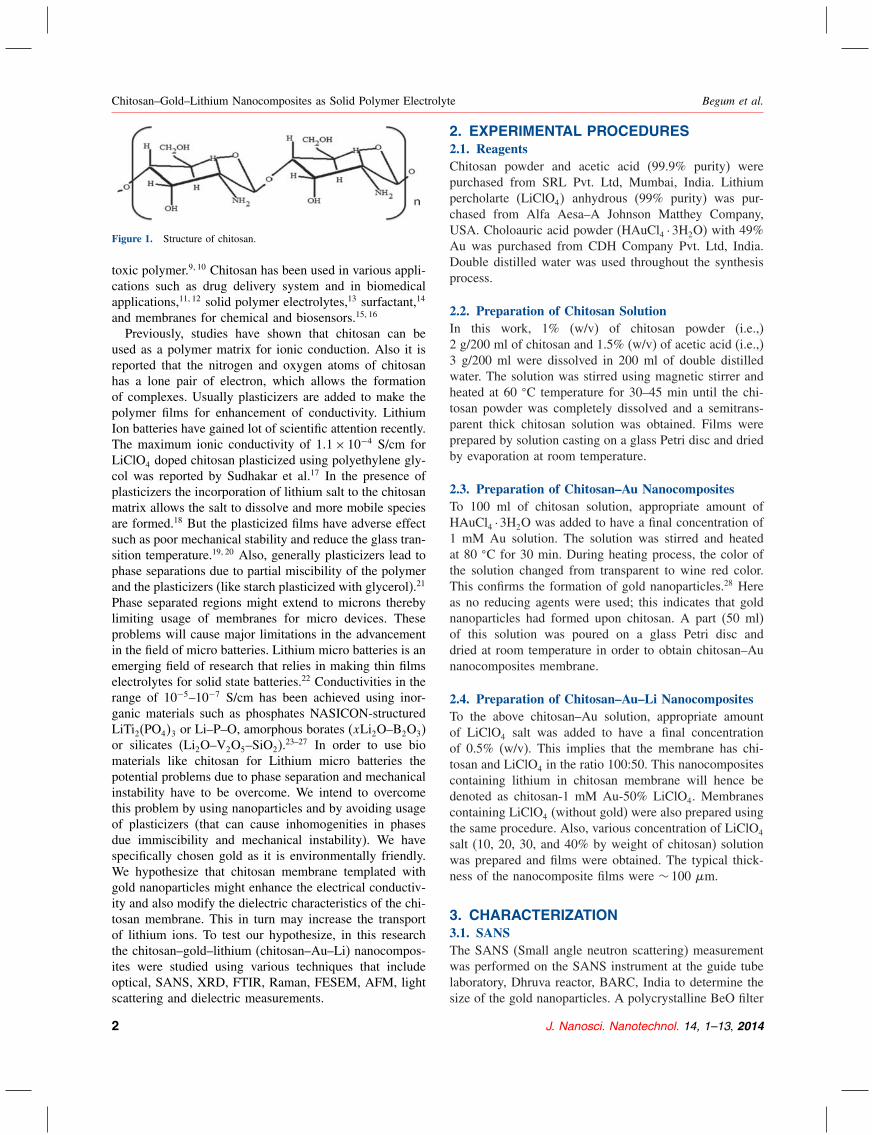
Chitosan is natural polysaccharide that is obtained fromthe cuticle of the marine crustaceans such as crabs andshrimps. It is a naturally occurring organic polymer (1, 4)2-amino-2-deoxy-d-glucopyranose) which is derived fromthe deacetylation of chitin8 (Fig. 1). Chitosan has been use-ful in the development of composites due to its functionalgroups. It includes biodegradable, biocompatible and non
J. Nanosci. Nanotechnol. 2014, Vol. 14, No. xx 1533-4880/2014/14/001/013 doi:10.1166/jnn.2014.8994 1
Chitosan–Gold–Lithium Nanocomposites as Solid Polymer Electrolyte Begum et al.
Figure 1. Structure of chitosan.
toxic polymer.910 Chitosan has been used in various appli-cations such as drug delivery system and in biomedicalapplications,1112 solid polymer electrolytes,13 surfactant,14
and membranes for chemical and biosensors.1516
Previously, studies have shown that chitosan can beused as a polymer matrix for ionic conduction. Also it isreported that the nitrogen and oxygen atoms of chitosanhas a lone pair of electron, which allows the formationof complexes. Usually plasticizers are added to make thepolymer films for enhancement of conductivity. LithiumIon batteries have gained lot of scientific attention recently.The maximum ionic conductivity of 11× 10−4 S/cm forLiClO4 doped chitosan plasticized using polyethylene gly-col was reported by Sudhakar et al.17 In the presence ofplasticizers the incorporation of lithium salt to the chitosanmatrix allows the salt to dissolve and more mobile speciesare formed.18 But the plasticized films have adverse effectsuch as poor mechanical stability and reduce the glass tran-sition temperature.1920 Also, generally plasticizers lead tophase separations due to partial miscibility of the polymerand the plasticizers (like starch plasticized with glycerol).21
Phase separated regions might extend to microns therebylimiting usage of membranes for micro devices. Theseproblems will cause major limitations in the advancementin the field of micro batteries. Lithium micro batteries is anemerging field of research that relies in making thin filmselectrolytes for solid state batteries.22 Conductivities in therange of 10−5–10−7 S/cm has been achieved using inor-ganic materials such as phosphates NASICON-structuredLiTi2(PO43 or Li–P–O, amorphous borates (xLi2O–B2O3)or silicates (Li2O–V2O5–SiO2).
23–27 In order to use biomaterials like chitosan for Lithium micro batteries thepotential problems due to phase separation and mechanicalinstability have to be overcome. We intend to overcomethis problem by using nanoparticles and by avoiding usageof plasticizers (that can cause inhomogenities in phasesdue immiscibility and mechanical instability). We havespecifically chosen gold as it is environmentally friendly.We hypothesize that chitosan membrane templated withgold nanoparticles might enhance the electrical conductiv-ity and also modify the dielectric characteristics of the chi-tosan membrane. This in turn may increase the transportof lithium ions. To test our hypothesize, in this researchthe chitosan–gold–lithium (chitosan–Au–Li) nanocompos-ites were studied using various techniques that includeoptical, SANS, XRD, FTIR, Raman, FESEM, AFM, lightscattering and dielectric measurements.
2. EXPERIMENTAL PROCEDURES2.1. ReagentsChitosan powder and acetic acid (99.9% purity) werepurchased from SRL Pvt. Ltd, Mumbai, India. Lithiumpercholarte (LiClO4 anhydrous (99% purity) was pur-chased from Alfa Aesa–A Johnson Matthey Company,USA. Choloauric acid powder (HAuCl4 ·3H2O) with 49%Au was purchased from CDH Company Pvt. Ltd, India.Double distilled water was used throughout the synthesisprocess.
2.2. Preparation of Chitosan SolutionIn this work, 1% (w/v) of chitosan powder (i.e.,)2 g/200 ml of chitosan and 1.5% (w/v) of acetic acid (i.e.,)3 g/200 ml were dissolved in 200 ml of double distilledwater. The solution was stirred using magnetic stirrer andheated at 60 C temperature for 30–45 min until the chi-tosan powder was completely dissolved and a semitrans-parent thick chitosan solution was obtained. Films wereprepared by solution casting on a glass Petri disc and driedby evaporation at room temperature.
2.3. Preparation of Chitosan–Au NanocompositesTo 100 ml of chitosan solution, appropriate amount ofHAuCl4 ·3H2O was added to have a final concentration of1 mM Au solution. The solution was stirred and heatedat 80 C for 30 min. During heating process, the color ofthe solution changed from transparent to wine red color.This confirms the formation of gold nanoparticles.28 Hereas no reducing agents were used; this indicates that goldnanoparticles had formed upon chitosan. A part (50 ml)of this solution was poured on a glass Petri disc anddried at room temperature in order to obtain chitosan–Aunanocomposites membrane.
2.4. Preparation of Chitosan–Au–Li NanocompositesTo the above chitosan–Au solution, appropriate amountof LiClO4 salt was added to have a final concentrationof 0.5% (w/v). This implies that the membrane has chi-tosan and LiClO4 in the ratio 100:50. This nanocompositescontaining lithium in chitosan membrane will hence bedenoted as chitosan-1 mM Au-50% LiClO4. Membranescontaining LiClO4 (without gold) were also prepared usingthe same procedure. Also, various concentration of LiClO4
salt (10, 20, 30, and 40% by weight of chitosan) solutionwas prepared and films were obtained. The typical thick-ness of the nanocomposite films were ∼ 100 m.
3. CHARACTERIZATION3.1. SANSThe SANS (Small angle neutron scattering) measurementwas performed on the SANS instrument at the guide tubelaboratory, Dhruva reactor, BARC, India to determine thesize of the gold nanoparticles. A polycrystalline BeO filter
2 J. Nanosci. Nanotechnol. 14, 1–13, 2014
Begum et al. Chitosan–Gold–Lithium Nanocomposites as Solid Polymer Electrolyte
was used as a monochromator in the diffractometer withthe incident neutron beam wavelength as 5.2 Å. The angu-lar distribution of the scattered neutron was recorded using1 m long He3 position sensitive detector. The data wererecorded in the accessible Q range of 0.017–0.35 Å−1. Thesample cross-section was 2.5 cm× 1.2 cm and thicknesswas 1 mm. The measured SANS data were corrected forthe background, the empty cell contribution and solventcontribution were normalized using standard procedure.
3.2. Structural StudiesThe XRD studies were recorded using Bruker D8 X-raydiffractometer at scanning rate of 0.2/min with 2 rang-ing from 10 to 80, using wavelength of Cu K radia-tion ( = 015405 nm). The morphology was studied byusing SUPRA 55 FESEM/ EDX, Carl Zeiss, Germany.The electron gun was operates at 30 kV. The instrumentalresolution was 1.4 nm at 15 kV. The Surface of the filmswas studied using XE-70 Parker system AFM. The lightscattering measurements were carried out using MalvernZetasizer version 6.20.
3.3. Raman and FTIR StudiesRaman spectra was obtained using Raman spectropho-tometer (Model Aspire 785 L) with a diode laser sourceof Laser wavelength 785 nm in 150–1,800 cm−1 range atroom temperature. Fourier transform Infrared spectroscopy(FTIR) was carried out using Perkin Elmer Spectrum OneFT-IR spectrometer. The spectral resolution was 4 cm−1.
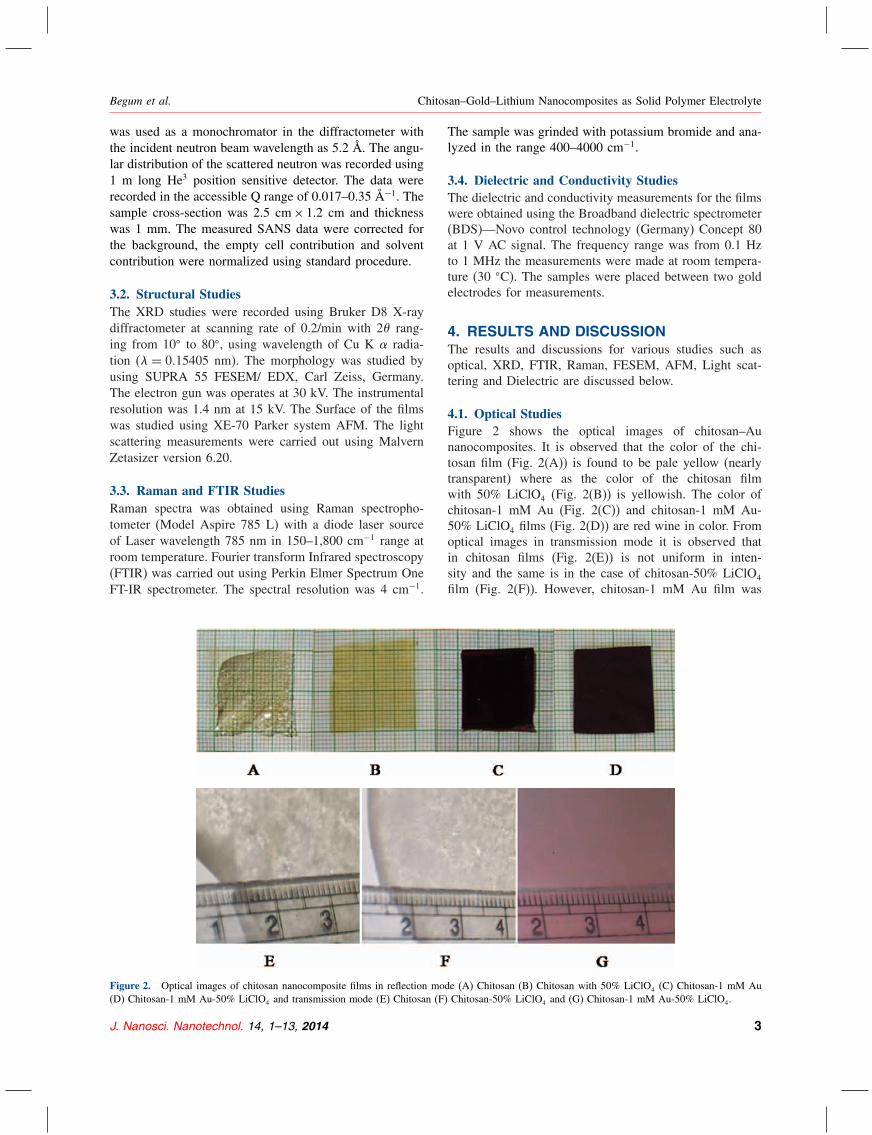
Figure 2. Optical images of chitosan nanocomposite films in reflection mode (A) Chitosan (B) Chitosan with 50% LiClO4 (C) Chitosan-1 mM Au(D) Chitosan-1 mM Au-50% LiClO4 and transmission mode (E) Chitosan (F) Chitosan-50% LiClO4 and (G) Chitosan-1 mM Au-50% LiClO4.
The sample was grinded with potassium bromide and ana-lyzed in the range 400–4000 cm−1.
3.4. Dielectric and Conductivity StudiesThe dielectric and conductivity measurements for the filmswere obtained using the Broadband dielectric spectrometer(BDS)—Novo control technology (Germany) Concept 80at 1 V AC signal. The frequency range was from 0.1 Hzto 1 MHz the measurements were made at room tempera-ture (30 C). The samples were placed between two goldelectrodes for measurements.
4. RESULTS AND DISCUSSIONThe results and discussions for various studies such asoptical, XRD, FTIR, Raman, FESEM, AFM, Light scat-tering and Dielectric are discussed below.
4.1. Optical StudiesFigure 2 shows the optical images of chitosan–Aunanocomposites. It is observed that the color of the chi-tosan film (Fig. 2(A)) is found to be pale yellow (nearlytransparent) where as the color of the chitosan filmwith 50% LiClO4 (Fig. 2(B)) is yellowish. The color ofchitosan-1 mM Au (Fig. 2(C)) and chitosan-1 mM Au-50% LiClO4 films (Fig. 2(D)) are red wine in color. Fromoptical images in transmission mode it is observed thatin chitosan films (Fig. 2(E)) is not uniform in inten-sity and the same is in the case of chitosan-50% LiClO4
film (Fig. 2(F)). However, chitosan-1 mM Au film was
J. Nanosci. Nanotechnol. 14, 1–13, 2014 3

Chitosan–Gold–Lithium Nanocomposites as Solid Polymer Electrolyte Begum et al.
Figure 3. Optical images of chitosan nanocomposite films (A) Chitosan (B) Chitosan-50% LiClO4 (C) Chitosan-1 mM Au (D) Chitosan-1 mMAu-50% LiClO4.
uniform in color (Fig. 2(G)). The same was observed withchitosan-1 mM Au-50% LiClO4 film. The darker color oflithium included chitosan film (Fig. 2(B)) when comparedto only chitosan film (Fig. 2(A)) indicate that chitosan–lithium complexes could have formed. The wine red colorin chitosan-1 mM Au film is because of gold nanoparticlesformation.28 These gold nanoparticles are formed becauseof reduction of gold on chitosan in the presence of aceticacid. Typically the chitosan film thickness was 100 micronand with increases in concentration of lithium salt, thethickness was found to increase. When the lithium con-centration increased to 50% (of weight of chitosan) thethickness was increased by 30% (from 100–130 micron).Figure 3 shows that the films containing lithium are
more flexible than those that do not have lithium. Theflexibility increases with lithium salt concentration. Theseresults indicate the lithium salt has a plasticizing effect onchitosan. Chitosan film with lithium had more crystallitesthan those in chitosan films with 1 mM Au with the sameamount of lithium. This indicates that lithium dissolvesmore in chitosan solution containing gold nanoparticles.
4.2. SANS AnalysisIn this technique, the scattering as a function of wave vec-tor transfer Q Q = 4 sin / is measured, where isthe wavelength of the incident neutron and 2 is the scat-tering angle. For a nanoparticles system, d/d can bewritten as
d/d= npV2p p− s
2PQSQ+B
where np denotes the number density of nanoparticles, p
and s are scattering length densities of nanoparticles andsolvent respectively and Vp is the volume of the nanopar-ticles, PQ is intra-particle form factor and SQ is inter-particle structure factor and it is unity for dilute solutions,B is the constant due to incoherent scattering.The scattering cross section shows a significant change
at low Q values between chitosan-1 mM Au film andchitosan film (Fig. 4). The fitting was carried out usingSASfit software. The data fits well by considering simplesphere particle model for Chitosan–Au film. The mean sizeof the gold nanoparticles was found to be 42± 01 nm
with poly-dispersity value of 0.45. This also confirms tothe gold nanoparticles templating on the chitosan matrix.The radius of gyration for chitosan was found to be 60±05 nm by fitting a model of Gaussian polymer.
4.3. XRD AnalysisThe XRD pattern (Fig. 5) for chitosan powder (A) showsthe prominent peak with 2 angle at approximately 19
and less intense broad peak of 2 angles at 13.5, 30
and 42. Chitosan film (B) shows sharp and less intensepeak with 2 angle at 11.5. It also shows broad peak with2 angles at 18.2, 30 and 42. Previously it has beenshown that chitosan films made with 0.5 M/L of aceticacid and 10 g/L of chitosan has peaks of 2 angles at11.5 and 18.2 respectively.29 The first peak of 2 angleat 11.5 is related to crystal (1) having unit cell of a =776 Å, b = 1091 Å, c = 1038 Å and = 90 and thesecond peak of 2 angle at 18.2 is related to crystal (2)is a= 44 Å, b = 10 Å, c = 103 Å and = 90. The unitcell of crystals is larger than that of crystal (2), also theintensities of 2 angle at 18.2 was nearly the same as thatof 11.5.30 For our samples the concentration of acetic acidis 0.25 M/L. The intensity for 2 angle at 11.5 was foundto be less than that of 2 angle at 18.5. We attribute thereduction in the intensity of peak with 2 angle at 11.5
0.00 0.05 0.10 0.15 0.20 0.25 0.30 0.350.5
1.0
1.5
2.0
2.5
3.0
3.5
dΣ/d
Ω(c
m–1
)
Q (A°–1)
Chitosan Film
Chitosan -1 mM Au Film
Figure 4. SANS data of (a) Chitosan film and (b) Chitosan-1 mM Au.
4 J. Nanosci. Nanotechnol. 14, 1–13, 2014

Begum et al. Chitosan–Gold–Lithium Nanocomposites as Solid Polymer Electrolyte
0 10 20 30 40 50 60 70 80 90
F
E
D
C
B
A
37º
43º
77º
77º
66º
66º
42º
30º
30º
13.5
º
42º30
º
11.5
º
30º
20º
13º
Inte
nsity
(ar
b)
Two Theta (deg)
19º
Figure 5. XRD data for (A) Chitosan powder (B) Chitosan films(C) Chitosan-50% LiClO4 (D) Chitosan-1 mM Au4 (E) Chitosan-1 mMAu-50% LiClO4 (F) LiClO4 powder.
(crystal (1)) to the lesser acetic acid contribution in oursamples (0.25 m/L) as against 0.5 M/L acetic acid used inSamuels et al.30
Chitosan-50% LiClO4 film (C) did not show any peakat 11.5 or 18.2. But it shows broad peaks with 2 anglesat 20, 30 and 41. The peak positions were same asthat of chitosan powder and they were broad. The absenceof peaks with 2 angles at 11.5 and 18.2 indicate thatthe formation of crystals due to acetic acid has been sup-pressed due to incorporation of lithium, thereby reducingthe interaction of acetic acid with chitosan. The suppres-sion of interaction between acetic acid and chitosan bylithium should be the reason for the membranes containinglithium to be more flexible than those of without lithium.XRD for chitosan-1 mM Au film (D) shows prominentpeaks of 2 angles at 37 and 43 and less intense peaksof 2 angles at 66 and 77. These peaks indicate the pres-ence of gold nanoparticles. The crystal structure of thegold nanoparticles was found to be FCC (JCPDS NO 04-0784) and the size was calculated using Scherer formulaas ∼ 6 nm.28 The broad peaks of 2 angles at 21 and 29
were also present. The sharp peak of 2 angle at 11.5 wasnot observed indicating that HAuCl4 could have interactedwith acetic acid.Chitosan-1 mM Au-50% LiClO4 film (E) shows sharp
peaks of 2 angle at 37 and broad peaks of 2 anglesat 66 and 77 (indicating gold nanoparticles) and alsoa broad peaks of 2 angle at 30 was observed simi-lar to that of chitosan powder. Interestingly a broad peakwas observed at roughly 14 of 2 angle. Also the inten-sity of the peak at 14 was found to be highest. Thisbroad peak is probably because of induced morphologicalchanges due to the interaction between lithium, gold andchitosan.
4.4. FTIR SpectroscopyFTIR spectroscopy is used to analyze and identify thefunctional groups and their modifications. FTIR spectra(Fig. 6) for the samples in the region 400–4000 cm−1
were carried out. In this spectrum, broad band in theregion 3200–3500 cm−1 is due to the H– bonded N Hand O H stretching vibration.31 The absorbance peak at2920 cm−1 is due to C H– stretching vibrations.31 Thespectra for chitosan-1 mM Au nanocomposites (Fig. 6(D))shows an intense and broad band at 2500–3600 cm−1. Theabsorbance peak for chitosan powder at 3473 cm−1 wasshifted to 3608 cm−1 in chitosan-1 mM Au nanocompos-ites. Also no absorbance peak was observed at 2920 cm−1.This shows that the N H and O H stretching vibra-tions was affected due to formation of gold nanoparti-cles. Hence, this indicates that the gold nanoparticles wereattached to the chitosan. For chitosan the amide I, amide IIand amide III bands are located at 1656, 1593 and 1373cm−1.31 For our samples the absorbance peaks for chitosanpowder, chitosan film, chitosan-1 mM Au film, chitosan-50% LiClO4 film and chitosan-1 mM Au-50% LiClO4 filmwere found to be at 1652,1652,1666,1646 and 1643 cm−1.The shift in the position of the peaks indicates that thevibrations of the amide I band have been affected dueto gold nanoparticles and lithium. The amide II bandpresent at 1593 cm−1 for chitosan powder is absent forchitosan film. So is the case with chitosan-1 mM Au-50% LiClO4 film. This indicates that both acetic acidand gold nanoparticles affects the amide II band. How-ever, chitosan-50% LiClO4 and chitosan-1 mM Au-50%LiClO4 films show presence of amide II band (with smallshifts). This indicates that LiClO4 reacts with acetic acid,preventing it from affecting the amide II group. Theamide III band in the region 1373 cm−1 observed for
0 500 1000 1500 2000 2500 3000 3500 4000
E
D
C
B
Abs
orba
nce
(arb
)
Wave Number (cm–1)
A
2140
1373
3473
2920
166910
86
Figure 6. FTIR spectra for (A) Chitosan Powder (B) Chitosan Film(C) Chitosan-50% LiClO4 (D) Chitosan-1 mM Au (E) Chitosan-1 mMAu–LiClO4.
J. Nanosci. Nanotechnol. 14, 1–13, 2014 5

Chitosan–Gold–Lithium Nanocomposites as Solid Polymer Electrolyte Begum et al.
500 1000 1500
Inte
nsity
(A
rb. U
nit)
Raman Shift500 1000 1500
Inte
nsity
(A
rb. U
nit)
Raman Shift
500 1000 1500
Inte
nsity
(A
rb. U
nit)
Raman Shift500 1000 1500
Inte
nsity
(A
rb. U
nit)
Raman Shift
(A) (B)
(C) (D)
Figure 7. Raman spectra for (A) Chitosan film (B) Chitosan-50% LiClO4 film (C) Chitosan-1 mM Au film (D) Chitosan-1 mM Au-50% LiClO4 film.
chitosan powder is shifted to 1431 cm−1 due to aceticacid in the films. Chitosan-50% LiClO4 film also showsa peak at 1431 cm−1. This indicates that lithium does notaffect the effect of acetic acid in the amide III group.For chitosan-1 mM Au-50% LiClO4 and chitosan-1 mMAu films, the amide III band disappears. These resultsindicate that the lithium and gold nanoparticles does nothave the same effect on the different amide groups. Thepeak for C O stretching for saccharide was assigned at1086 cm−1 for chitosan powder. This peak for chitosanfilm was shifted to 1095 cm−1. However this peak wasfound to be absent for chitosan-1 mM Au and chitosan-1 mM Au-50% LiClO4 films. Over all the absorbanceof chitosan-1 mM Au film are more than the chitosan-50% LiClO4 and chitosan-1 mM Au-50% LiClO4 films.This implies that the lesser absorbance of chitosan-1 mMAu-50% LiClO4 film, when compared to chitosan-1 mMAu film was due to the interaction between the gold andlithium. Since several peaks are absent in the case ofchitosan-1 mM Au film. This implies that the interactionof gold with the chitosan membrane (chitosan with aceticacid) during its formation is greater than that of interactionof LiClO4 with the membrane.
4.5. Raman SpectroscopyThe Raman peaks associated with chitosan are (i) theC C stretching region (1050–1200 cm−1), (ii) the
C NH bending region (1290–1350 cm−1), (iii) amide-III(1445 cm−1), (iv) amide-II (1550 cm−1) and (v) amide-I(1650 cm−1).32 Raman spectra for our samples are shownin Figure 7. For chitosan powder (Fig. 7(A)) prominentpeaks were observed at 325, 409, 1255, 1338, 1540 and1650 cm−1. Broad peak observed at 1338 cm−1 is associ-ated with C NH bending and the weak peak at 1541 cm−1
is due to amide II. The amide I peak at 1650 cm −1 isweaker than the amide II peak. For chitosan film, peaks areobserved similar to that of chitosan powder. However theamide I peak and amide III peak are absent. This indicatesthat acetic acid affects the amide I and amide III group.Chitosan-50% LiClO4 film shows peak at 639, 1347 and1540 cm−1 with reduced intensities. For chitosan-1 mMAu film and chitosan-1 mM Au-50% LiClO4 film, thespectra is nearly flat and no peaks are observed. This alsoindicates that the films are amorphous in nature. Theseresults show that the amide regions are affected due tothe formation of gold nanoparticles and that gold interactsmore strongly with chitosan membrane than LiClO4.
4.6. SEMFor further investigating the micro-structure of thenanocomposite films, FESEM was used. Figure 8(A)shows the FESEM images for chitosan film. It is observedthat the film is not completely smooth. Figure 8(B) showsthe higher magnification for the same sample. Aggregates
6 J. Nanosci. Nanotechnol. 14, 1–13, 2014
Begum et al. Chitosan–Gold–Lithium Nanocomposites as Solid Polymer Electrolyte
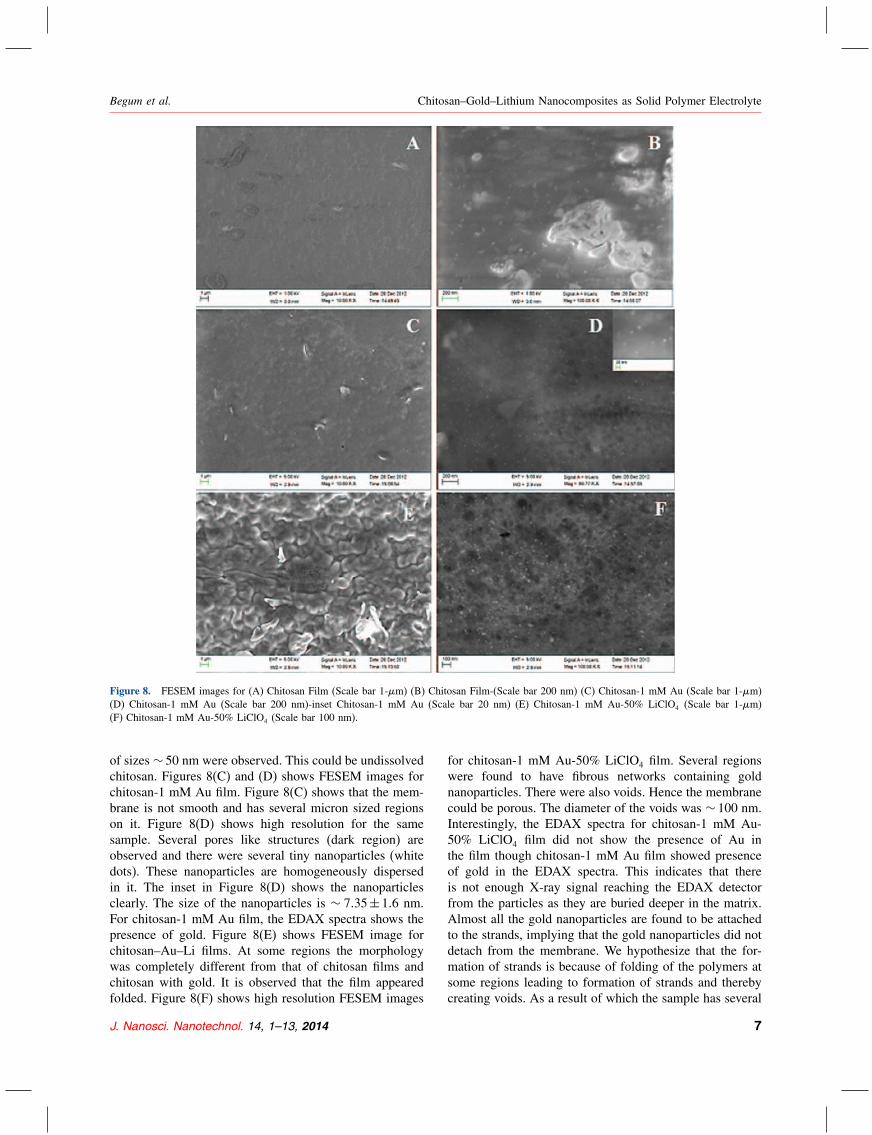
Figure 8. FESEM images for (A) Chitosan Film (Scale bar 1-m) (B) Chitosan Film-(Scale bar 200 nm) (C) Chitosan-1 mM Au (Scale bar 1-m)(D) Chitosan-1 mM Au (Scale bar 200 nm)-inset Chitosan-1 mM Au (Scale bar 20 nm) (E) Chitosan-1 mM Au-50% LiClO4 (Scale bar 1-m)(F) Chitosan-1 mM Au-50% LiClO4 (Scale bar 100 nm).
of sizes ∼ 50 nm were observed. This could be undissolvedchitosan. Figures 8(C) and (D) shows FESEM images forchitosan-1 mM Au film. Figure 8(C) shows that the mem-brane is not smooth and has several micron sized regionson it. Figure 8(D) shows high resolution for the samesample. Several pores like structures (dark region) areobserved and there were several tiny nanoparticles (whitedots). These nanoparticles are homogeneously dispersedin it. The inset in Figure 8(D) shows the nanoparticlesclearly. The size of the nanoparticles is ∼ 735± 16 nm.For chitosan-1 mM Au film, the EDAX spectra shows thepresence of gold. Figure 8(E) shows FESEM image forchitosan–Au–Li films. At some regions the morphologywas completely different from that of chitosan films andchitosan with gold. It is observed that the film appearedfolded. Figure 8(F) shows high resolution FESEM images
for chitosan-1 mM Au-50% LiClO4 film. Several regionswere found to have fibrous networks containing goldnanoparticles. There were also voids. Hence the membranecould be porous. The diameter of the voids was ∼ 100 nm.Interestingly, the EDAX spectra for chitosan-1 mM Au-50% LiClO4 film did not show the presence of Au inthe film though chitosan-1 mM Au film showed presenceof gold in the EDAX spectra. This indicates that thereis not enough X-ray signal reaching the EDAX detectorfrom the particles as they are buried deeper in the matrix.Almost all the gold nanoparticles are found to be attachedto the strands, implying that the gold nanoparticles did notdetach from the membrane. We hypothesize that the for-mation of strands is because of folding of the polymers atsome regions leading to formation of strands and therebycreating voids. As a result of which the sample has several
J. Nanosci. Nanotechnol. 14, 1–13, 2014 7

Chitosan–Gold–Lithium Nanocomposites as Solid Polymer Electrolyte Begum et al.
interconnected fibers. We also hypothesize that the pres-ence of gold could affect conductivity of lithium ions inthe membrane.In the Chitosan-50% LiClO4 film, lithium salt crystals
of ∼ 100 micron size were observed under optical micro-scope (Fig. 9(A)). But for chitosan-1 mM Au-50% LiClO4
film very few crystals were observed and their sizes were∼ 100–200 nm (Fig. 9(B)). This indicates that retarda-tion of crystal growth of Lithium salts happens due to Aunanoparticles.
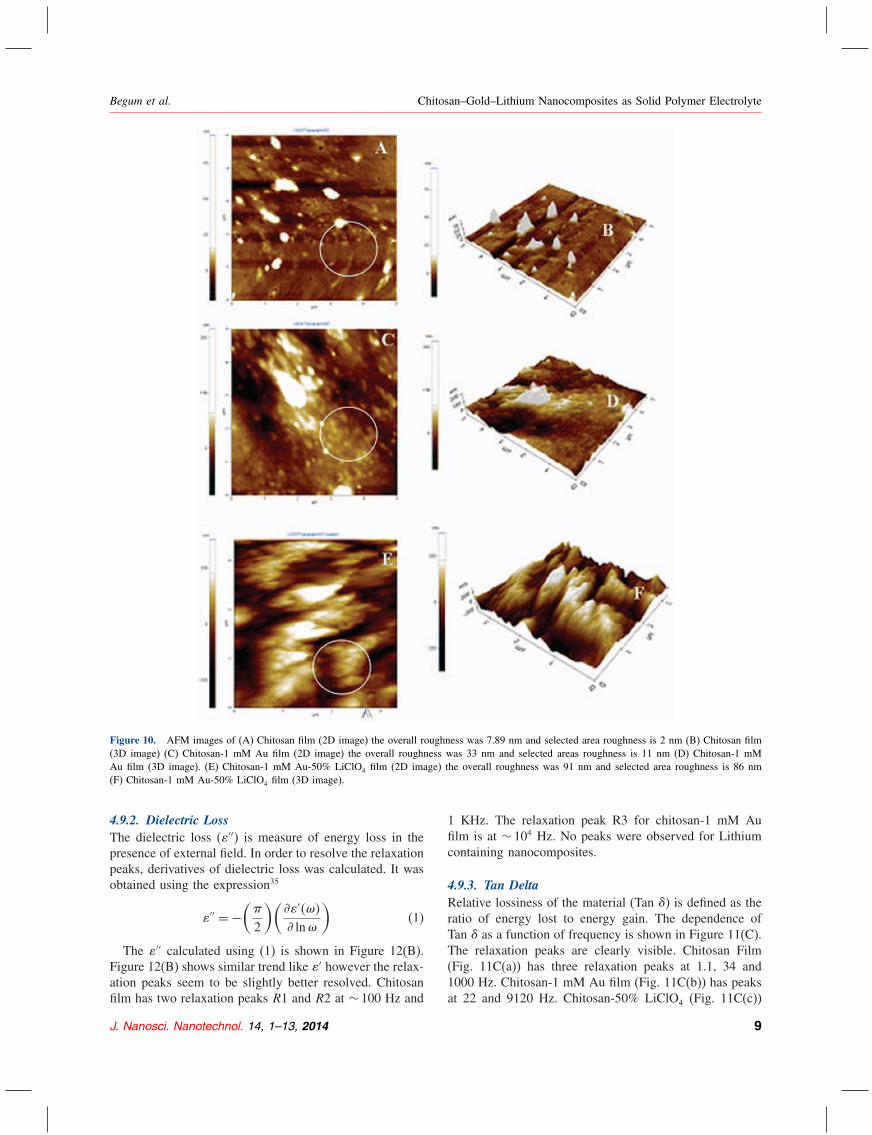
4.7. AFM ImagingIn order to check the surface roughness of the nanocom-posites, AFM was used. AFM images for chitosan films(Figs. 10(A) and (B)) show the presence of hill like struc-tures. The overall roughness was found to be 7.89 nm.These regions correspond to the agglomeration region seenin the FESEM. The regions (within the white circle) ofthe film which did not have aggregates had roughnessof ∼ 2 nm. For chitosan-1 mM Au films (Figs. 10(C)and (D)), less agglomerates were observed on the sur-face. The overall roughness was 33 nm and the rough-ness of regions (within the white circle) not having largeaggregates is approx 11 nm. This implies that chitosan-1 mM Au film has higher roughness than chitosan films.Figure 10(E) shows the AFM image for chitosan-1 mMAu-50% LiClO4 film and it is observed that the overallroughness was 91 nm and the roughness for selected area(within the white circle) was 86 nm. We therefore concludethat the chitosan-1 mM Au-50% LiClO4 film form com-plexes and result in the formation of films with modifiedmorphology as compared to that of films of chitosan andchitosan-1 mM Au films. The AFM results are in agree-ment with that of FESEM images. Chitosan-50% LiClO4
film (without gold) was found to be very smooth and softand therefore could not be scanned.
4.8. Light Scattering MeasurementsIn order to further understand the chitosan nanocom-posite system, light scattering was used to study it in
Figure 9. (A) Chitosan-50% LiClO4 (optical microscope image)(B) Chitosan-1 mM Au-50% LiClO4 (FESEM image).
solution phase. Figure 11(A) shows light scattering datafor chitosan solution. Two distributions are observed(a) 77±9 nm with 6.2% intensity and (b) 1122±173 nmwith 93% intensity. The particles with size 77± 9 nmrepresent undissolved chitosan aggregates (as observed inSEM) while those with sizes 1122± 173 nm most likelyrepresent the networks. Since scattering is proportionalto R2 the number of large sized particles need not bemore than the number of small sized particles. There-fore it is not possible to conclude from Figure 11(A),the ratio of the chitosan aggregates to that of the largesized particles. Chitosan-50% LiClO4 solution (Fig. 11(B))shows a single distribution of size 1995± 273 nm with100% intensity. Interestingly, the distribution for chitosanat ∼ 78 nm was not observed. This indicates that com-plexes would have formed in solution due to lithium.For chitosan-1 mM Au solution (Fig. 11(C)) two distri-butions are observed (a) 78± 33 nm with 94% intensityand (b) 4802± 728 nm with 5.8% intensity. Since theintensity of smaller sized particles are more than that oflarger sized particle, this clearly indicates that the num-ber of networks are lesser than the number of chitosanunit with gold nanoparticles (scattering is proportional toR2). Also since the size of the network in chitosan-1 mMAu solution is greater than that of in chitosan solution,this indicates that the gold nanoparticles favor the forma-tion of networks. Chitosan-1 mM Au-50% LiClO4 solution(Fig. 11(D)) shows three size distributions (a) 143±67 nmwith 61% intensity (b) 735±286 nm with 28% intensityand (c) 4838±711 nm. These results clearly indicate thatcomplexes are formed in solution phase.
4.9. Dielectric and Conductivity Measurements4.9.1. Dielectric Constant ′To understand the polymer dynamics and their modifica-tions, at room temperature conditions, dielectric measure-ments were done on the chitosan nanocomposite films.Figure 12(A) shows the dependence of dielectric constantupon frequency at room temperature. Dielectric constant(′) is a measure of ability of the material for storage ofcharges.33 The peaks in the dielectric spectra were broad.For chitosan film (Fig. 11A(a)) a broad peak was observedat ∼ 1–10 Hz. For chitosan-1 mM Au film (Fig. 12A(b)),a broad peak was observed ∼ 103–104 Hz. There wereno peaks for chitosan-50% LiClO4 (Fig. 12A(c)) andchitosan-1 mM Au-50% LiClO4 (Fig. 12A(d)) films. The′ was found to increases at low frequencies. Also it wasvery large for lithium containing nanocomposites, indicat-ing higher electrode polarization.34 The ′ values at highfrequency (106 Hz) for chitosan film, chitosan-1 mM Aufilm, chitosan-50% LiClO4 film and chitosan-1 mM Au-50% LiClO4 film are 0.77, 2.36, 109 and 12 respectively.These results indicated that these chitosan nanocompos-ites have greater charge storing capacity than chitosanfilm.
8 J. Nanosci. Nanotechnol. 14, 1–13, 2014
Begum et al. Chitosan–Gold–Lithium Nanocomposites as Solid Polymer Electrolyte
Figure 10. AFM images of (A) Chitosan film (2D image) the overall roughness was 7.89 nm and selected area roughness is 2 nm (B) Chitosan film(3D image) (C) Chitosan-1 mM Au film (2D image) the overall roughness was 33 nm and selected areas roughness is 11 nm (D) Chitosan-1 mMAu film (3D image). (E) Chitosan-1 mM Au-50% LiClO4 film (2D image) the overall roughness was 91 nm and selected area roughness is 86 nm(F) Chitosan-1 mM Au-50% LiClO4 film (3D image).
4.9.2. Dielectric LossThe dielectric loss (′′) is measure of energy loss in thepresence of external field. In order to resolve the relaxationpeaks, derivatives of dielectric loss was calculated. It wasobtained using the expression35
′′ = −(
2
)(′ ln
)(1)
The ′′ calculated using (1) is shown in Figure 12(B).Figure 12(B) shows similar trend like ′ however the relax-ation peaks seem to be slightly better resolved. Chitosanfilm has two relaxation peaks R1 and R2 at ∼ 100 Hz and
1 KHz. The relaxation peak R3 for chitosan-1 mM Aufilm is at ∼ 104 Hz. No peaks were observed for Lithiumcontaining nanocomposites.
4.9.3. Tan DeltaRelative lossiness of the material (Tan ) is defined as theratio of energy lost to energy gain. The dependence ofTan as a function of frequency is shown in Figure 11(C).The relaxation peaks are clearly visible. Chitosan Film(Fig. 11C(a)) has three relaxation peaks at 1.1, 34 and1000 Hz. Chitosan-1 mM Au film (Fig. 11C(b)) has peaksat 22 and 9120 Hz. Chitosan-50% LiClO4 (Fig. 11C(c))
J. Nanosci. Nanotechnol. 14, 1–13, 2014 9

Chitosan–Gold–Lithium Nanocomposites as Solid Polymer Electrolyte Begum et al.
Figure 11. Light scattering measurement for (A) Chitosan solution (B) Chitosan-50% LiClO4 solution (C) Chitosan-1 mM Au solution and(D) Chitosan-1 mM Au-50% LiClO4 solution.
film show peak at 29302 Hz and Chitosan-1 mM Au-50%LiClO4 film (Fig. 11C(d)) has peaks at 34 Hz and281564 Hz. In general, it is observed that the relaxationpeaks are present at higher frequencies for the nanocom-posites. Since the relaxation time ( = 1/2f ) is thelowest for chitosan-1 mM Au-50% LiClO4 film. Theseresults clearly indicate that gold containing nanocompos-ites respond better to the applied electric field.
4.9.4. Electric Modulus StudiesThe electric modulus provides information on therelaxation and conductivity of the materials. The elec-tric modulus is the reciprocal of the permittivity. Theelectric modulus corresponds to the relaxation of theelectric field in the material when the electric displace-ment remains constant. For a pure conduction processM ′′ would have a peak while ′′ will not have a peak.For dielectric relaxation process peaks appear at bothcomplex electric modulus and complex dielectric.36 Thereal part M ′() and the imaginary part M ′′() of theelectric modulus as a function of frequency are shownin Figures 12(D) and (E). The M ′′ for chitosan filmshows peak at 929 Hz while for Chitosan-1 mM Au film(Fig. 12E(b)), the peak was observed at 22253 Hz. Thisindicates that the dielectric relaxation process happens forchitosan films and chitosan-1 mM Au film. However nopeaks for M ′′ were observed for Chitosan-50% LiClO4 and
Chitosan-1 mM Au-50% LiClO4 film. Since for Lithiumcontaining nanocomposites, no peaks for M ′′ was present,while peaks for tan were observed - this indicates that itis neither dielectric relaxation process nor pure conductionprocess. It also implies that there are free charge carri-ers in the lithium containing chitosan nanocomposites.36
At low frequencies the M ′ exhibit low values for lithiumcontaining nanocomposites which is due to accumulationof charges at the electrode interface.37
4.9.5. Conductivity StudiesThe variation of conductivity as a function of fre-quency for the chitosan nanocomposites films is shown inFigure 12(F). The conductivity for Chitosan-1 mM Au-50% LiClO4 film is found to be the highest among allthe films for all frequencies. Table I shows the conductivi-ties for various weight percentage of LiClO4 in Chitosan–LiClO4 film (column A in Table I) and Chitosan-1 mMAu–LiClO4 film (column B in Table I). The numbersinside the brackets (in italics) represent the ratio of theconductivity of the sample with respect to the conduc-tivity of chitosan film (118× 10−10 S/cm). The conduc-tivities of the samples increase with increase in Lithiumconcentration. Interestingly the conductivity (at 0.1 Hz)of Chitosan-1 mM Au-50% LiClO4 film is greater thanthe sum of the conductivities of chitosan-1 mM Au filmand chitosan-50% LiClO4 film. These results indicate that
10 J. Nanosci. Nanotechnol. 14, 1–13, 2014

Begum et al. Chitosan–Gold–Lithium Nanocomposites as Solid Polymer Electrolyte
d
c
b
Mod
ulus
'
a
0.00
0.05
0.10
0.15
0.20
0.25
0.30
0.35
0.40
dc
bMod
ulus
″
a
10–10
10–9
10–8
10–7
10–6
10–5
10–4d
c
b
σ′ S
/cm
a
10–1 100 101 102 103 104 105 10610–1 10–2
100
101
102
103
104
105
106
107
108
10–110–8
10–7
10–6
10–5
10–4
10–3
10–2
10–1
100
101
d
c
bε′
Freq. [Hz]10–1 100 101 102 103 104 105 106
Freq. [Hz]
10–1 100 101 102 103 104 105 106
Freq. [Hz]100 101 102 103 104 105 106
Freq. [Hz]
10–110–1 100 101 102 103 104 105 106
Freq. [Hz]100 101 102 103 104 105 106
Freq. [Hz]
a
0.1
1
10 d
c
b
Tan
δ
a
100
102
104
106
108
R4
R3
R2R1
d
c
b
a
ε″ d
er
(E) (F)
(C) (D)
(A) (B)
Figure 12. Frequency dependence of (A) ′, (B) ′′ (derived using Eq. (1)), (C) Tan , (D) M ′ (E) M ′′ and (F) for the chitosan nanocomposites(a) chitosan film (b) Chitosan-1 mM Au (C) Chitosan-50% LiClO4 and (D) Chitosan-1 mM Au-50% LiClO4 films.
the d.c conductivities of chitosan–Au–Li nanocompositesare not equal to that of the sum of the conductivity ofthe components. Hence gold enhances the conductivityof the films. This enhancement in conductivity could bebecause if (a) Au ions, (b) conducting channels due togold nanoparticles or (c) increase in the concentration ofmobile lithium ions. Since only low concentration of the
Table I. Comparison of conductivity values for chitosan nanocompositefilms.
(B) Conductivity of(A) Conductivity of the films in the
Lithium wt% the films (S/cm) presence of Au (S/cm)
0% lithium 118×10−10 579×10−9 (49)10% lithium 228×10−9 (19) 995×10−8 (843)20% lithium 841×10−9 (71) 157×10−7 (1330)30% lithium 124×10−7 (1050) 344×10−7 (2920)50% lithium 605×10−7 (5130) 722×10−7 (6120)
Au solution (1 mM) was used and the FESEM imagesshow that nanoparticles are distinctly separated, the pres-ence of free Au ions is unlikely as all the Au ions wouldhave got reduced to nanoparticles. Also the particles arewell separated and spherical in shape. This implies thatthe possibility of the formation of conducting channels dueto gold is less. Therefore the enhancement in the conduc-tivity should be because of increase in the concentrationof mobile lithium ions. This is supported by the FESEMand optical images (Figs. 8(A) and (B)) that clearly showreduction in the size of the lithium crystallites due to pres-ence of gold nanoparticles. The presence of gold leads toformation of complexes with lithium and thereby retard-ing the crystal growth of lithium salts during film for-mation. These complexes are loosely bound and liberatelithium ions. Hence the conductivity of chitosan–Au–Linanocomposite films is greater than that of chitosan–Lifilms.
J. Nanosci. Nanotechnol. 14, 1–13, 2014 11

Chitosan–Gold–Lithium Nanocomposites as Solid Polymer Electrolyte Begum et al.
Figure 13. Model for formation of chitosan nanocomposites.
Hence we have
Chi−Au–Lifilms > Chi−Aufilms+Chi−Lifilms
The results are summarized using the model as under.Also the conductivity of these biodegradable films arecomparable to those of the current inorganic Lithium microbatteries (10−5–10−7 S/cm)22 making these films as goodcandidates for Lithium micro batteries.
4.10. ModelWhen LiClO4 is added to chitosan solution and dried, bothmobile and immobile (crystallites) species of Lithium areformed (Fig. 13(A)). Only the mobile species contribute tothe conductivity upon application of electric field. WhenHAuCl4 is added to chitosan solution (with acetic acid),gold nanoparticles are formed upon chitosan by reductionreaction (Fig. 13(B)). These particles are fixed to the chi-tosan membrane. The conductivity is increased by ∼ 50×due to the presence of gold nanoparticles as they make thepaths more conducting. Inclusion of LiClO4 to Chitosan–Au nanocomposite solution results in the formation ofcomplexes thereby retarding the formation of Lithium saltcrystallites (that contribute to the immobile species) dur-ing film formation (Fig. 13(C)). The retardation of crys-tal growth of Lithium salts during drying due to the goldnanoparticles results in availability of more mobile speciesof Lithium and thereby there is greater conductivity inchitosan–Au–Li nanocomposite when compared to that ofchitosan–Li films.
5. CONCLUSIONOptical and SEM studies shows that Chitosan film withlithium had more crystallites than chitosan-1 mM Au withthe same amount of lithium. Upon inclusion of 1 mMHAuCl4 the size of the crystallites were reduced from∼ 100 m to ∼ 100–200 nm. Uniform gold nanoparticles
were observed. The morphology of the films was mod-ified due to the presence of Lithium in chitosan–Au–Linanocomposites. Also no trace of gold was observed inthe EDAX measurements indicating the formation of com-plexes in the presence of in chitosan–Au–Li films.FTIR and Raman results indicate that the interaction
of gold with the chitosan membrane (chitosan with aceticacid) during the formation of nanoparticles is greater thanthat of interaction of LiClO4 with the chitosan membraneas some of the amide groups were more affected by Authan by LiClO4. AFM results show that the roughnessof the films were greatest for chitosan–Au–Lithium films.Light scattering results clearly indicate that complexes areformed in solutions also. Dielectric measurement resultsindicated that these chitosan nanocomposites have greatercharge storing capacity than chitosan film. Also, gold con-taining nanocomposites respond better to the applied elec-tric field. While chitosan films and chitosan–Au films showdielectric relaxation behavior, chitosan–Au–Li nanocom-posites show neither dielectric relaxation process norpure conduction process. It also implies that there arefree charge carriers in the lithium containing chitosannanocomposites. The d.c conductivity of chitosan–Au–Lifilm is greater than the sum of the conductivities ofchitosan–Au film and chitosan–Li films. An enhancementin the conductivities is observed due to incorporation ofgold in the chitosan nanocomposites. The enhancement inthe conductivity was explained using a model. The conduc-tivity of these biodegradable films is comparable to thoseof the current inorganic Lithium micro batteries.
Acknowledgment: The authors gratefully thank Pro-fessor Jayavel, Centre For Nanoscience and Tech. AnnaUniversity Chennai, India for providing AFM and lightscattering facility. The authors gratefully thank ProfessorMoorthy Babu of Crystal Growth Center, Anna Univer-sity for providing Raman spectroscopy measurements. Theresearch was made possible due to funding provided byUGC-DAE-CSR project (CRS-M-176) India.
References and Notes1. J. Ma and Y. Sahai, Carbohydr. Polym. 92, 955 (2013).2. X. Zhaoa, L. Lva, B. Pana, W. Zhanga, S. Zhanga, and Q. Zhanga,
Chem. Eng. J. 170, 381 (2011).3. S. K. Shukla, A. K. Mishra, O. A. Arotiba, and B. B. Mamba, Int.
J. Biol. Macromol. 59, 46 (2013).4. A. Sugunana, C. Thanachayanontb, J. Duttaa, and J. G. Hilbornc,
Science and Technology of Advanced Material 6, 335 (2005).5. Y. Xiao and C. M. Li, Electroanalysis 20, 648 (2008).6. Y. Liu, M. Yuan, L. Liu, and R. Guo, Sens. Actuators B 176, 592
(2013).7. S. C. Lee, S. W. Lee, and I. J. Kang, Surf. Rev. Lett. 17, 165 (2010).8. M. N. V. Ravi Kumar, React. Funct. Polym. 46, 1 (2000).9. P. K. Dutta, J. Dutta, and V. S. Tripathi, J. Sci. Ind. Res. 63, 20 (2004).10. C. K. S. Pillai, W. Paul, and C. P. Sharma, Prog. Polym. Sci. 34, 641
(2009).11. J. Singh, M. Srivastava, A. Roychoudhury, D. W. Lee, S. H. Lee,
and B. D. Malhotra, J. Phys. Chem. B. DOI.org/10.1021/jp309639w.
12 J. Nanosci. Nanotechnol. 14, 1–13, 2014

Begum et al. Chitosan–Gold–Lithium Nanocomposites as Solid Polymer Electrolyte
12. K. Karuppasamy, S. Thanikaikarasan, R. Antony, S. Balakumar, andX. S. Shajan, Ionics 18, 737 (2012).
13. Y. N. Sudhakar and M. Selvakumar, J. Appl. Electrochem. 43, 21(2013).
14. A. N. Ananth, S. Umapathy, G. Ghosh, T. Ramprasath, and M. A. J.Rajan, Adv. Nat. Sci.: Nanosci. Nanotechnol. 3, 045010 (2012).
15. X. Kanga, J. Wanga, H. Wua, I. A. Aksayc, J. Liua, and Y. Lina,Biosens. Bioelectron. 25, 901 (2009).
16. Y. Du, X. L. Luo, J. J. Xu, and H. Y. Chen, Bioelectrochemistry 70,342 (2007).
17. Y. N. Sudhakar, M. Selvakumar, and D. K. Bhat, Ionics. (2011), DOI10.1007/s11581-012-0745-5 (2007).
18. M. Z. A. Yahya and A. K. Arof, Eur. Polym. J. 38, 1191 (2002).19. N. A. A. Razak, T. Winie, F. S. A. Ghani, and A. H. Ahmad, Solid
State Science and Technology 16, 1 (2008).20. S. Fuente, P. J. Retuert, and G. Gonzalez, Electrochimica Act. 53,
1417 (2007).21. P. Ramasamy, Ionics (2011), DOI 10.1007/s11581-011-0636-1.22. E. Quartarone and P. Mustarelli, Chem. Soc. Rev. 40, 2525
(2011).23. J. M. Kim, G. B. Park, K. C. Lee, H. Y. Park, S. C. Nam, and S. W.
Song, J. Power Sources 189, 211 (2009).24. A. Patil, V. Patil, D. W. Shin, J. W. Choi, D. S. Paik, and S. J. Yoon,
Mater. Res. Bull. 43, 1913 (2008).
25. F. Wu, Y. Liu, R. Chen, S. Chen, and G. Wang, J. Power Sources189, 467 (2009).
26. N. Kuwata, J. Kawamura, K. Toribami, T. Hattori, and N. Sata, Elec-trochem. Commun. 6, 417 (2004).
27. N. Kuwata, R. Kumar, K. Toribami, T. Suzuki, T. Hattori, andJ. Kawamura, Solid State Ionics 177, 2827 (2006).
28. X. F. Qiu, J. J. Zhu, and H. Y. Chen, J. Cryst. Growth 257, 378(2003).
29. C. G. A. Lima, R. S. de Oliveira, S. D. Figueiro, C. F. Wehmann,J. C. Goes, and A. S. B. Sombra, Mater. Chem. Phys. 99, 284 (2006).
30. R. J. Samuels, J. Polym. Sci., Polym. Phys. 19, 1081 (1981).31. K. C. R. Bahadur, S. Aryal, S. R. Bhattarai, N. Bhattarai, C. H. Kim,
and H. Y. Kim, J. Biomater. Sci. Polymer. 17, 579 (2006).32. R. Nirmala1, B. Woo, R. Navamathavan, M. H. El-Newehy, and
H. Y. Kim, Macromolecular Research 19, 345 (2011).33. Y. N. Sudhakar and M. Selvakumar, Electrochimica Acta 78, 398
(2012).34. C. Y. Liu and K. S. Zhao, Soft Matter. 6, 2742 (2010).35. M. Wubbenhorst and J. V. Turnhout, J. Non-Cryst. Solids 305, 40
(2002).36. A. S. Bhatt, D. K. Bhat, S. Santosha, and C. Tai, J. Mater. Chem.
21, 13490 (2011).37. Z. Osman, Z. A. Ibrahim, and A. K. Arof, Carbohydr. Polym. 44,
167 (2001).
Received: 31 July 2013. Accepted: 26 September 2013.
J. Nanosci. Nanotechnol. 14, 1–13, 2014 13