arthur well integrity - university of tulsa cese ... · estimated leak rates source 2018 emissions...
TRANSCRIPT

WELL INTEGRITY ANALYSIS WELL INTEGRITY ANALYSIS USING INFRARED IMAGINGUSING INFRARED IMAGING
Copyright © 2016 ALL Consulting
Presented by: J. Daniel Arthur, P.E., SPECPresented by: J. Daniel Arthur, P.E., SPEC
Presented at:Presented at:
23rd IPEC Conference23rd IPEC Conference
November 8November 8--10, 201610, 2016
New Orleans, New Orleans, LouisianaLouisiana

OUTLINEOUTLINE
� Introduction
� Infrared imaging
� New regulations� New regulations
� Field applications
� Conclusions
2Copyright © 2016 ALL Consulting

INTRODUCTIONINTRODUCTION
� Most well integrity test methods have been around for decades
� Infrared (IR) camera oil & gas use is relatively recent
� Use of IR camera has been expanding
� Accepted by regulators and industry for use to assess integrity of surface equipment
� IR camera is a reliable qualitative screening tool to identify fugitive hydrocarbon emissions at the surface
� Applications for IR camera use are emerging
3Copyright © 2016 ALL Consulting
Aliso Canyon Gas Leak
Source: EDF

METHANE IMAGING IN INFRAREDMETHANE IMAGING IN INFRARED
� Clouds or smoke appear in IR camera images where absorption differences in specific IR wavelengths are detected. These IR wavelengths correspond to the absorption wavelengths of chemicals present in the atmosphere. IR cameras do not distinguish which chemicals are present or allow quantitation of the chemicals in the images.
The absorption of infrared � The absorption of infrared
light by methane is stronger at 3.3 µm, making this frequency the most useful for the detection of methane
Copyright © 2016 ALL Consulting 4
A Wave Number of 3019/cm Correlates
to a Wavelength of 3.3 µm*
A Wave Number of 1306/cm Correlates to
a Wavelength of 7.6 µm*
Source: Raf Vandersmissen

OIL & GASOIL & GAS USES OF USES OF INFRAREDINFRARED
� Air permit compliance monitoring for fugitive emissions
� Leak detection
Copyright © 2016 ALL Consulting 5
Hydrocarbon Vapor
Hydrocarbon Vapor
Hydrocarbon Vapor

NEW REGULATIONSNEW REGULATIONS
� June 3, 2016 - US EPA published changes to New Source Performance Standards (40 CFR 60 Subpart OOOOa), effective August 2, 2016 (81 FR 35824)
� New requirements for operators of new or modified oil & gas well sites to monitor and repair fugitive emission components with an optical gas imaging camera initially and then twice/year
� Method 21 “sniffer” is an alternative method under the rule
Copyright © 2016 ALL Consulting 6
� Method 21 “sniffer” is an alternative method under the rule
Hydrocarbon Vapor

ESTIMATED LEAK RATESESTIMATED LEAK RATES
Source
2018
Emissions
(Bcf)
Percent of
Total
Reciprocating Compressor Fugitives 53.8 13%
High Bleed Pneumatic Devices 28.7 7%
LDC Meters and Regulators 28.7 7%
Centrifugal Compressors (wet seals) 24.0 6%
Gas Engine Exhaust 22.2 5%
Well Fugitives 20.8 5%
Reciprocating Compressor Rod Packing 17.6 4%
Liquids Unloading ‐ Wells w/ Plunger Lifts 13.2 3%
Intermittent Bleed Pneumatic Devices 13.0 3%
• Ohio RBDMS data for 2015 indicates inspectors responded to wellhead leaks at 908 wells, 6.4% of Intermittent Bleed Pneumatic Devices 13.0 3%
Kimray Pumps 11.5 3%
Oil Tanks 11.5 3%
Flares 9.0 2%
Stranded Gas Venting from Oil Wells 8.4 2%
Intermittent Bleed Pneumatic Devices ‐ Dump Valves 7.7 2%
Oil Well Completions ‐ with Fracturing 6.9 2%
Pipeline Leaks (All) 6.7 2%
Pipeline Venting (Transmission) 6.6 2%
Centrifugal Compressors 6.4 2%
Mains – Plastic 6.3 2%
Mains ‐ Cast Iron 6.3 2%
Transmission Station Venting 6.2 2%
Chemical Injection Pumps 5.9 1%
Residential 5.6 1%
Gathering and Boosting Stations 5.6 1%
Miscellaneous (assorted 105 sources)
Copyright © 2016 ALL Consulting 7
Source: ICF 2014Source: ICF 2014
908 wells, 6.4% of Ohio’s wells
• Well fugitives rank #6 in projected oil & gas industry methane emissions for 2018 (see table)

INFRARED SCREENINGINFRARED SCREENING BENEFITSBENEFITS
� Surface well mechanical integrity testing
� Enhanced ability to identify leaks at the wellhead
� Guide to rapid repair/maintenance
� Potential subsurface integrity problems
� May identify gas migration outside of wellbore
� Informed decision-making for repair/remediation� Informed decision-making for repair/remediation
Copyright © 2016 ALL Consulting 8
Hydrocarbon Vapor
EXAMPLE FIELD EXAMPLE FIELD EXPERIENCEEXPERIENCE
� In a limited study of orphan wells, half of the orphan wells exhibited fugitive gas emissions, one-third of which exceeded the lower explosive limit (LEL)
� In a limited study of producing wells:
� 20% were reported as having bubbling cellars:
� 64% of these bubbling cellars were eliminated through equipment � 64% of these bubbling cellars were eliminated through equipment servicing, including:
� Tightening nuts on flanges
� Tightening threaded connections
� Greasing valve stems
� Closing valves
� IR Screening reduced time spent finding leaks but does not estimate venting flow rate
Copyright © 2016 ALL Consulting 9

WELL INTEGRITY EVALUATIONWELL INTEGRITY EVALUATION
� Integrity issues observed at the surface
� Ports lacking plugs
� Lack of well caps
� Corroded well casings
� Valves left open� Valves left open
� Leaking flanges
� Leaking glands
� Loose threaded fittings
� Valves requiring grease
� Uncontrolled instrument gas venting
Copyright © 2016 ALL Consulting 10

APPLICATION TO APPLICATION TO WELL WELL TYPESTYPES
� Production
� Historic production
� Orphan wells
� Plugged & abandoned
� Gas storage wells� Gas storage wells
Copyright © 2016 ALL Consulting 11
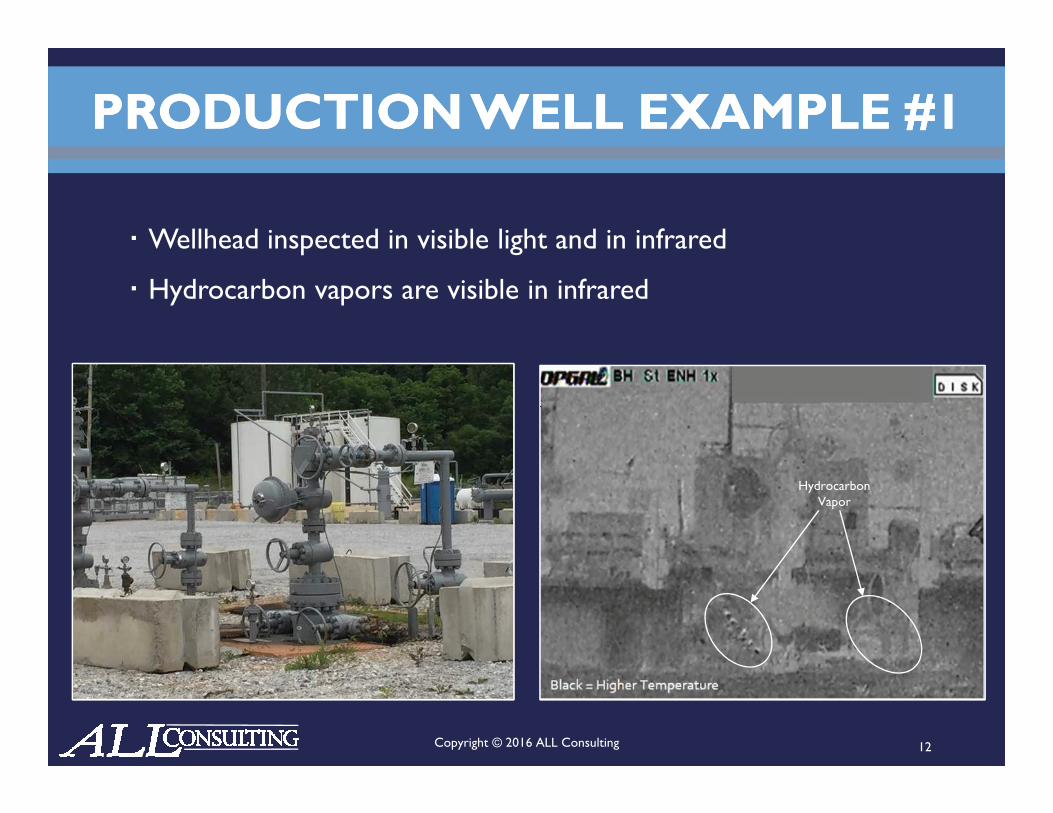
PRODUCTION WELL EXAMPLE #1PRODUCTION WELL EXAMPLE #1
� Wellhead inspected in visible light and in infrared
� Hydrocarbon vapors are visible in infrared
Copyright © 2016 ALL Consulting 12
Hydrocarbon Vapor

PRODUCTION PRODUCTION WELL EXAMPLE #2WELL EXAMPLE #2
� Wellhead inspected in visible light and in infrared
� Hydrocarbon vapors are visible in infrared
Copyright © 2016 ALL Consulting 13
Hydrocarbon Vapor

GAS STORAGE WELL EXAMPLEGAS STORAGE WELL EXAMPLE
� Wellhead inspected in visible light and in infrared
� Hydrocarbon vapors are visible in infrared
Copyright © 2016 ALL Consulting 14
Hydrocarbon Vapor

HISTORIC PRODUCTION WELLHISTORIC PRODUCTION WELL
� Wellhead (age undetermined) inspected in visible light and in infrared
� Hydrocarbon vapors exceed the LEL and are visible in infrared
Hydrocarbon
Copyright © 2016 ALL Consulting 15
Hydrocarbon Vapor

� Wellhead (age 112 yrs) inspected in visible light and in infrared
� Hydrocarbon vapors are visible in infrared
ORPHAN WELL EXAMPLE #1ORPHAN WELL EXAMPLE #1
Copyright © 2016 ALL Consulting 16
Hydrocarbon Vapor

ORPHAN WELL EXAMPLE #2ORPHAN WELL EXAMPLE #2
� Wellhead (age uncertain) inspected in visible light and in infrared
� No hydrocarbon vapors are visible in infrared
Copyright © 2016 ALL Consulting 17
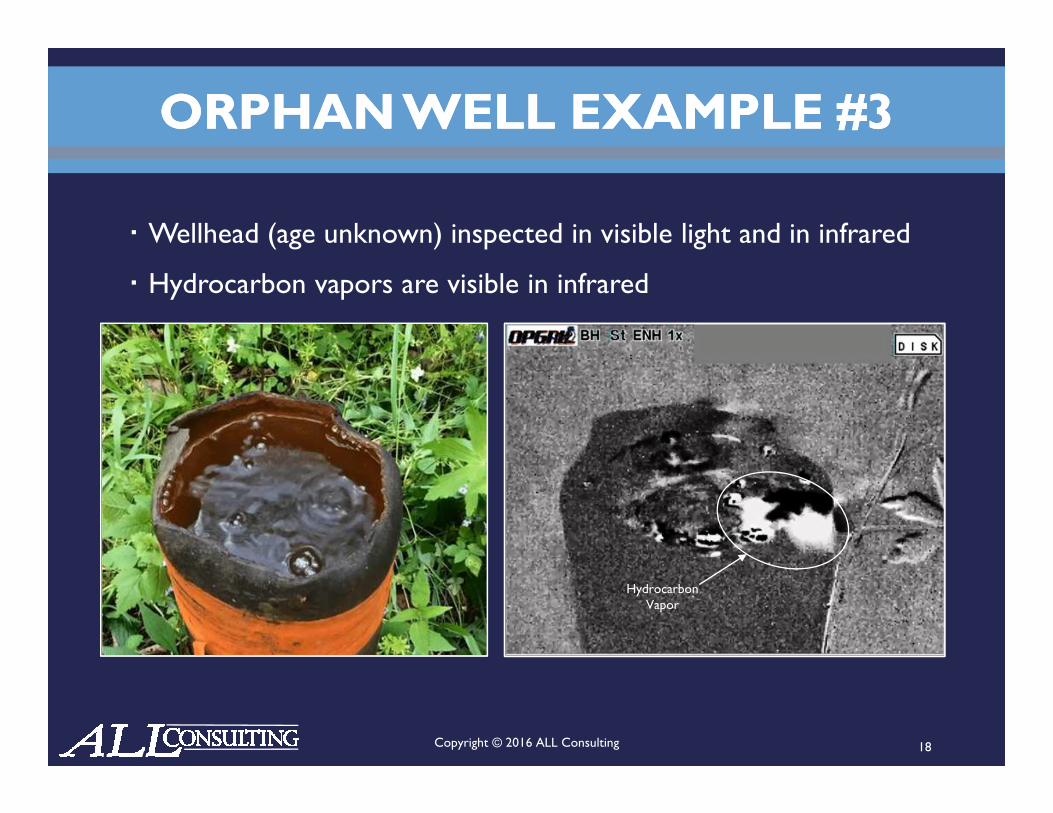
ORPHAN ORPHAN WELL EXAMPLE WELL EXAMPLE #3#3
� Wellhead (age unknown) inspected in visible light and in infrared
� Hydrocarbon vapors are visible in infrared
Copyright © 2016 ALL Consulting 18
Hydrocarbon Vapor

PLUGGED & ABANDONED WELLPLUGGED & ABANDONED WELL
� Well inspected in visible light and in infrared. Well age is unknown
� No apparent hydrocarbon emissions were identified
Copyright © 2016 ALL Consulting 19
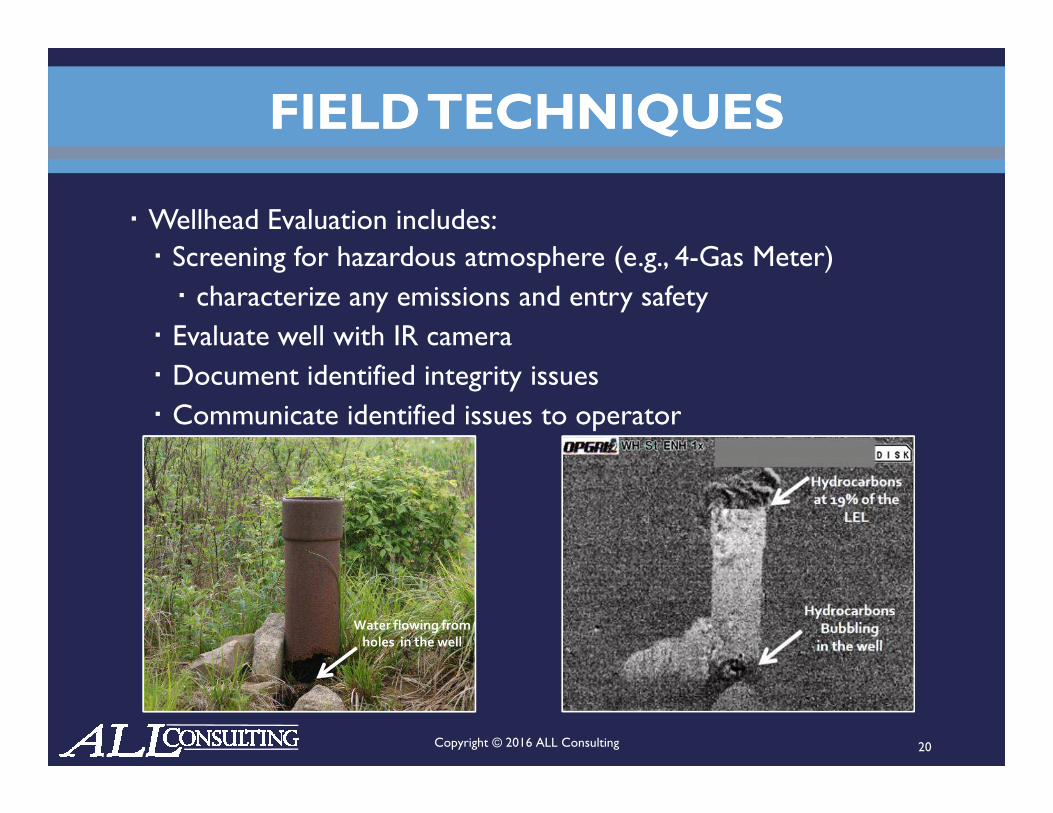
FIELD TECHNIQUESFIELD TECHNIQUES
� Wellhead Evaluation includes:
� Screening for hazardous atmosphere (e.g., 4-Gas Meter)
� characterize any emissions and entry safety
� Evaluate well with IR camera
� Document identified integrity issues
� Communicate identified issues to operator� Communicate identified issues to operator
Copyright © 2016 ALL Consulting 20
Water flowing from holes in the well
Water flowing from holes in the well
Water flowing from holes in the well

SCREENING FOR SCREENING FOR HAZARDSHAZARDS
� Wellhead area screened to establish entry safety, e.g., with a 4-Gas Meter:
� Percent of the lower explosive limit (LEL)
� Hydrogen sulfide
� Carbon monoxide
� Oxygen
Copyright © 2016 ALL Consulting 21

ADD SCALE TO ESTIMATE AREAADD SCALE TO ESTIMATE AREA
� Add scale to give context to emissions descriptions� Place scale at water surface (bubbles)
� Half inch grate for IR work
� Can’t quantify emissions with IR camera� Can’t quantify emissions with IR camera
Copyright © 2016 ALL Consulting 22
Hydrocarbon Vapor

DIFFERENTIATING WATER VAPORDIFFERENTIATING WATER VAPOR
� Water vapor tends to appear "2-dimensional," across a surface; whereas hydrocarbons tend to rise or fall from their sources
Copyright © 2016 ALL Consulting 23
Hydrocarbon Vapor
WaterVapor
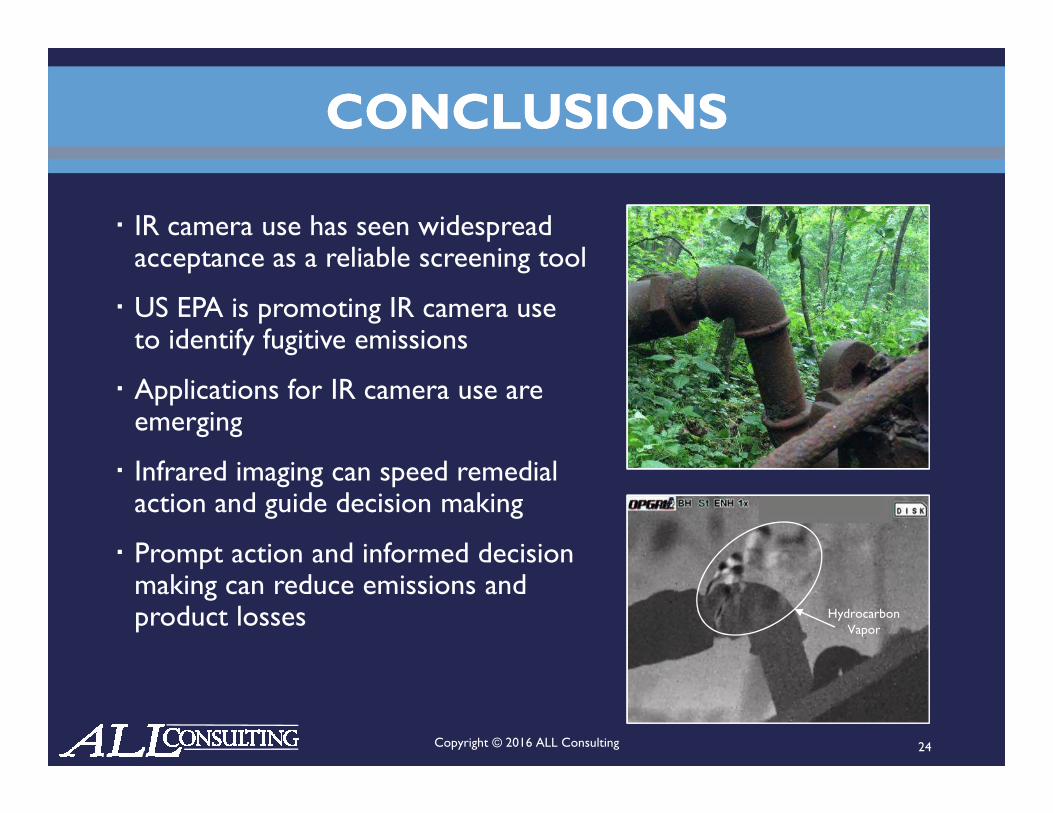
CONCLUSIONSCONCLUSIONS
� IR camera use has seen widespread acceptance as a reliable screening tool
� US EPA is promoting IR camera use to identify fugitive emissions
� Applications for IR camera use are emergingApplications for IR camera use are emerging
� Infrared imaging can speed remedial action and guide decision making
� Prompt action and informed decision making can reduce emissions and product losses
Copyright © 2016 ALL Consulting 24
Hydrocarbon Vapor

CONTACT INFORMATIONCONTACT INFORMATION
J. Daniel Arthur, P.E. SPEC J. Daniel Arthur, P.E. SPEC ALL Consulting
O: 918.382.7581
J. Daniel Arthur, P.E. (ALL Consulting), William Green, P.G. (ALL Consulting), Kris Andersen (ALL Consulting) “Well Integrity Analysis using Infrared Imaging” Presented at the 23rd IPEC Conference, New Orleans, LA, November 8-10, 2016.
CITATION INFORMATIONCITATION INFORMATION::
25Copyright © 2016 ALL Consulting