arterial pressure-blood flow relations during limb elevation in man
TRANSCRIPT

Acta Physiol Scand 1983, 118: 405413
Arterial pressure-blood flow relations during limb elevation in man
HENRIK VAGN NIELSEN
Department of Medicine, Horsholm Sygehus and Department of Medical Physiology B, Panum Institute, University of Copenhagen, Denmark
NIELSEN, H. V.: Arterial pressure-blood flow relations during limb elevation in man. Acta Physiol Scand 1983, 118:405413. Received 27 Jan. 1983. ISSN 0001-6772. Depart- ment of Medicine, Horsholm Sygehus and Department of Medical Physiology B, Panum Institute, University of Copenhagen, Denmark.
The effect of local arterial hypotension upon blood flow was studied in 13 healthy humans. Blood flow was measured by the local ‘33Xe washout technique in the calf or foot region. Changes in arterial pressure was achieved by elevation of the leg above heart level, while the subject rested in supine position. In papaverine-infiltrated subcutaneous tissue, local arterial pressure and blood flow was linearly related. In subcutaneous and skeletal muscle tissue with normal vasomotor tone, blood flow remained constant during a decrease in regional arterial pressure of 30 mmHg-autoregulation of blood flow. Blood flow ceased in vasoparalysed tissue as well as in tissue with normal vasomotor tone, when the local diastolic arterial pressure was reduced to zero. The elevated foot showed signs of vascular ischaemia during these conditions. When the vessels in the ischaemic foot were distended by inflating a femur cuff to a pressure level above the diastolic blood pressure beneath the cuff, the colour of the foot changed into bluish-red and a substantial blood flow was recorded. It is concluded, that the arteries-arterioles seemed to be collapsed with blood flow cessation, when the diastolic portion of a pulsatile inflow pressure was reduced to zero. Vascular distension seemed to reopen the arterial-arteriolar collapse, and during these conditions the vascular bed offered only little resistance to the systolic peak injec- tion.
Key words: Human leg, subcutaneous tissue, skeletal muscle, vasoparalysis, normal vasomotor tone, ‘33Xe, blood flow cessation
In the intact living organism the blood pressure in the whole precapillary section is pulsatile (Wieder- hielm et al. 1964, Intaglietta et al. 1970). Further- more a phasic backward flow is seen in the arteries (McDonald 1960) well illustrated by the to and fro volume changes observed during plethysmographic recordings. Nevertheless, it is generally assumed that the Haagen-Poiseuille relation, which is evalu- ated and based upon recordings in rigid tubes with steady pressures and flow, can be applied to pulsa- tile vascular systems, when the inflow pressure is calculated as the mean arterial pressure.
In 1951 Burton observed that blood flow ceases before the mean inflow pressure is reduced to zero, i.e. a positive pressure intercept is seen on the pressure-flow diagram (“critical closing pres- sure”). Whether the mean arterial pressure repre-
sents the “true” driving pressure for distal and foreward directed blood flow in pulsatile vascular systems has been a matter of much controversy ever since, as previously surveyed by Ehrlich et al. (1980).
In the present study it is suggested, that blood flow cessation in pulsatile pressure systems can be ascribed to pressure variations in the inflow ves- sels. Arterial pressure-blood flow data are obtained from peripheral tissues during leg elevation in man. This procedure reduces local arterial pressure equal to the hydrostatic column of blood above heart level. Capillary blood flow is estimated by the local ’33Xe washout technique. The limb elevation proce-
Mailing address: Dr Henrik Vagn Nielsen, Nordskrznten 27, DK-2980 Kokkedal, Denmark.
Acta Physiol Scand 118
406 H . Vagn Nielsen
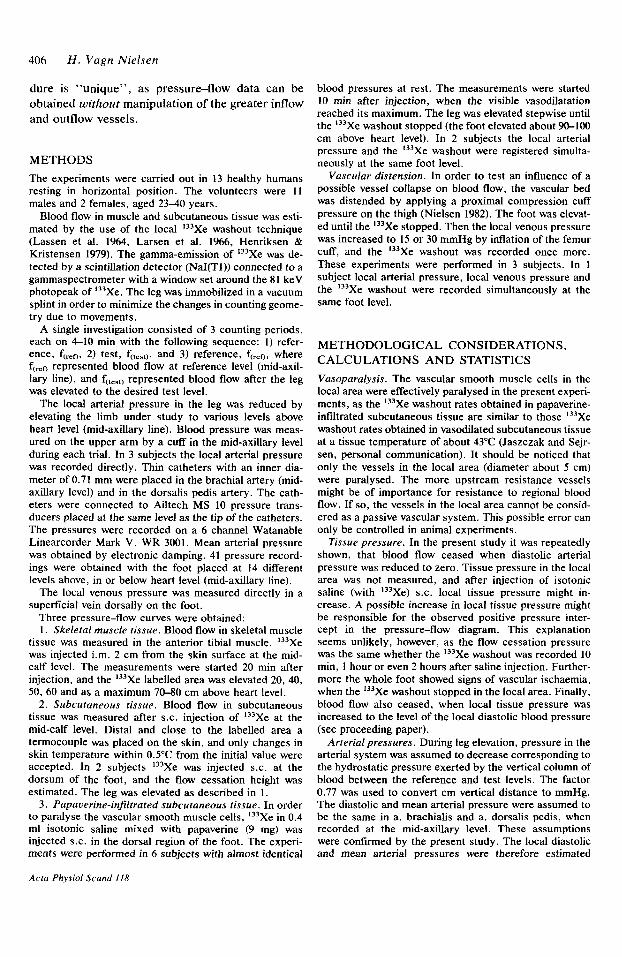
dure is "unique", as pressure-flow data can be obtained without manipulation of the greater inflow and outflow vessels.
METHODS The experiments were carried out in 13 healthy humans resting in horizontal position. The volunteers were 11 males and 2 females, aged 2340 years.
Blood flow in muscle and subcutaneous tissue was esti- mated by the use of the local '33Xe washout technique (Lassen et al. 1964, Larsen et al. 1966, Henriksen & Kristensen 1979). The gamma-emission of '33Xe was de- tected by a scintillation detector (NaI(T1)) connected to a gammaspectrometer with a window set around the 81 keV photopeak of '33Xe. The leg was immobilized in a vacuum splint in order to minimize the changes in counting geome- try due to movements.
A single investigation consisted of 3 counting periods, each on 4-10 min with the following sequence: 1) refer- ence, f(reo, 2) test, f(test), and 3) reference, f(re,-,, where f(=,-, represented blood flow at reference level (mid-axil- lary line), and f(test) represented blood flow after the leg was elevated to the desired test level.
The local arterial pressure in the leg was reduced by elevating the limb under study to various levels above heart level (mid-axillary line). Blood pressure was meas- ured on the upper arm by a cuff in the mid-axillary level during each trial. In 3 subjects the local arterial pressure was recorded directly. Thin catheters with an inner dia- meter of 0.71 mm were placed in the brachial artery (mid- axillary level) and in the dorsalis pedis artery. The cath- eters were connected to Ailtech MS 10 pressure trans- ducers placed at the same level as the tip of the catheters. The pressures were recorded on a 6 channel Watanable Linearcorder Mark V, WR 3001. Mean arterial pressure was obtained by electronic damping. 41 pressure record- ings were obtained with the foot placed at 14 different levels above, in or below heart level (mid-axillary line).
The local venous pressure was measured directly in a superficial vein dorsally on the foot.
Three pressure-flow curves were obtained: 1. Skeletal muscle tissue. Blood flow in skeletal muscle
tissue was measured in the anterior tibia1 muscle. '33Xe was injected i.m. 2 cm from the skin surface at the mid- calf level. The measurements were started 20 min after injection, and the '33Xe labelled area was elevated 20, 40, 50, 60 and as a maximum 70-80 cm above heart level.
2. Subcutaneous tissue. Blood flow in subcutaneous tissue was measured after S.C. injection of '33Xe at the mid-calf level. Distal and close to the labelled area a termocouple was placed on the skin, and only changes in skin temperature within 0.5"C from the initial value were accepted. In 2 subjects '33Xe was injected S.C. at the dorsum of the foot, and the flow cessation height was estimated. The leg was elevated as described in 1.
3 . Papauerine-injlltrated subcutaneous tissue. In order to paralyse the vascular smooth muscle cells, '33Xe in 0.4 ml isotonic saline mixed with papaverine (9 mg) was injected S.C. in the dorsal region of the foot. The experi- ments were performed in 6 subjects with almost identical
Acta Physiol Scand I18
blood pressures at rest. The measurements were started 10 min after injection, when the visible vasodilatation reached its maximum. The leg was elevated stepwise until the '33Xe washout stopped (the foot elevated about 90-100 cm above heart level). In 2 subjects the local arterial pressure and the '33Xe washout were registered simulta- neously at the same foot level.
Vascular distension. In order to test an influence of a possible vessel collapse on blood flow, the vascular bed was distended by applying a proximal compression cuff pressure on the thigh (Nielsen 1982). The foot was elevat- ed until the '33Xe stopped. Then the local venous pressure was increased to 15 or 30 mmHg by inflation of the femur cuff, and the "3Xe washout was recorded once more. These experiments were performed in 3 subjects. In 1 subject local arterial pressure, local venous pressure and the '33Xe washout were recorded simultaneously at the same foot level.
METHODOLOGICAL CONSIDERATIONS, CALCULATIONS AND STATISTICS Vasoparalysis. The vascular smooth muscle cells in the local area were effectively paralysed in the present experi- ments, as the "'Xe washout rates obtained in papaverine- infiltrated subcutaneous tissue are similar to those 133Xe washout rates obtained in vasodilated subcutaneous tissue at a tissue temperature of about 43°C (Jaszczak and Sejr- sen, personal communication). It should be noticed that only the vessels in the local area (diameter about 5 cm) were paralysed. The more upstream resistance vessels might be of importance for resistance to regional blood flow. If so, the vessels in the local area cannot be consid- ered as a passive vascular system. This possible error can only be controlled in animal experiments.
Tissue pressure. In the present study it was repeatedly shown, that blood flow ceased when diastolic arterial pressure was reduced to zero. Tissue pressure in the local area was not measured, and after injection of isotonic saline (with '33Xe) S.C. local tissue pressure might in- crease. A possible increase in local tissue pressure might be responsible for the observed positive pressure inter- cept in the pressure-flow diagram. This explanation seems unlikely, however, as the flow cessation pressure was the same whether the '33Xe washout was recorded 10 min, 1 hour or even 2 hours after saline injection. Further- more the whole foot showed signs of vascular ischaemia, when the '33Xe washout stopped in the local area. Finally, blood flow also ceased, when local tissue pressure was increased to the level of the local diastolic blood pressure (see proceeding paper).
Arterial pressures. During leg elevation, pressure in the arterial system was assumed to decrease corresponding to the hydrostatic pressure exerted by the vertical column of blood between the reference and test levels. The factor 0.77 was used to convert cm vertical distance to mmHg. The diastolic and mean arterial pressure were assumed to be the same in a. brachialis and a. dorsalis pedis, when recorded at the mid-axillary level. These assumptions were confirmed by the present study. The local diastolic and mean arterial pressures were therefore estimated

Circulatory effects of limb elevation in man 407
of 133Xe washout was an adequate measure of cessation of blood flow in the microcirculation (Bolund & Holstein 1976). In human experiments the 133Xe washout method often cannot distinguish between minimal washout and no washout as 2 SD computed for these two washout curves often will overlap each other. The reason is that awake subjects cannot be absolutely immobile for several min- utes, thereby inducing discrete changes in counting geom- etry. Although the induced vasodilatation tends to mini- mize this difficulty, zero blood flow (f=O) was only ac- cepted if the '33Xe washout was computed to be zero or negative within 1 SD from zero washout. Furthermore zero blood flow was succeeded by subjective and objec- tive signs of ischaemia.
In the experiments with vascular distension, venous stasis was held several min before the '33Xe washout was registered to assure that the '33Xe diffusion in the local area was in steady state. If not, blood flow would be underestimated due to accumulation of 133Xe in the dis- tended veins and in fluid accumulated in the tissue by capillary filtration (Sejrsen et al. 1981).
Vascular resistance. The local perfusion pressure, PI,,, was calculated according to two models:
PI,,= Pa-Ph-P,, and (1)
Ploc=Pdiast-Ph-Pvr (2)
where Pa and Pdiast denote the mean and diastolic arterial pressure at the heart level (mid-axillary line), Ph denotes the pressure of the vertical column of blood between reference and test levels and P, signifies venous pressure.
Relative vascular resistance, R(testjR(ren, was calculat- ed from obtained values of relative blood flow and local perfusion pressure. R(t,,t) denotes vascular resistance during test conditions, and R(r,n signifies average vascu- lar resistance calculated for the two reference periods.
Significance tests were performed by the Wilcoxon rank sum test, and 0.05 was chosen as level of signifi- cance.
-- 100
-- 80 -- 60 -- 40
'arm (heart levell- 'foot. mm Hg
above . foot position -- 20 20 40 60 80 I00
. diastolic art. pres. -60 t \
. systolic art. pres. -100 -80/ \ o mean art. pres.
Fig. 1 . Diastolic, mean and systolic arterial pressure re- cordings from a. brachialis and a. dorsalis pedis obtained from two subjects placed in horizontal position. The foot was placed at different levels above or below heart level (mid-axillary line). The pressure difference between the arm and the foot was plotted against the vertical distance (in mmHg) between the arm and the foot.
from arterial pressures in the arm, measured by the ascul- tatory method. The mean arterial pressure was calculated as the diastolic pressure plus 1/3 of the pulse pressure (confirmed by direct pressure recordings).
Capillary blood flow. Mean perfusion coefficient, f , in the tissues was calculated according to the formula
f = k.h.100 ml.min-l.(100 g)-l
where k denotes the washout rate constant in min-' and A the tissue to blood partition coefficient in m1.g;'.
Relative blood flow during elevation, f(test,/f(renr was calculated as k(t,,t&(,,n, since h was assumed to remain constant during a triad of measurements. k(,,n and denote the average of the washout rate constants and perfusion coefficients, respectively, obtained at reference level before and after elevation. The washout rate con- stants k SD were calculated by the method of least squares from each of the curves. The pressure-flow data were analysed by linear regression according to the equa- tion y=a tbx .
In the present study capillary blood flow was estimated indirectly by the 133Xe washout technique. 133Xe is an inert gas and it can only be removed by blood flow in the present experiments. During normal conditions the '33Xe washout gives a reliable estimate of blood flow variations, when relative measurements are performed from the same '33Xe depot (Tennesen & Sejrsen 1970, Nielsen 1972). In animal experiments, it has been shown that the cessation
(Kety, 1951),
RESULTS
Arterial pressures When the arterial pressures were recorded simulta- neously in the brachial and the dorsalis pedis arte- ries at the same horizontal level (mid-axillary level) no difference between the corresponding diastolic and the corresponding mean arterial pressures was observed (APdiast (arm-foot) = 1+2 mmHg (SD), n=9, p>O. 1 and APa (arm-foot) = l f 3 mmHg (SD), n=9, p>O.l) . The systolic arterial pressure %as however significantly higher in the dorsalis pedis artery (APsyst (arm-foot) = -39f8 mmHg (SD), n=9, p<O.Ol). When the mean arterial pressure in the arm was calculated as the diastolic pressure plus 1/3 of the pulse pressure, it was estimated to 102+7 mmHg (SD, n=9), not significantly different
Acta Physiol Scand 118
408 H . Vagn Nielsen
1.0 - I 0.9- I
-3- W "l - 3 2 0.8-
.; I- 0.7-
2 ,k 1 0.6-
0 '0 f 0.5-
+ 6 2 0.4- 2 a 0.3- n 3 c
O az- E 0.1 -
10 6
9 8
P.001
10 i P'OOI
P ' 0 0 1
0.oJ /- 80 70 60 50 40 30 20 10 0
elevotion above heart level in m m Hg
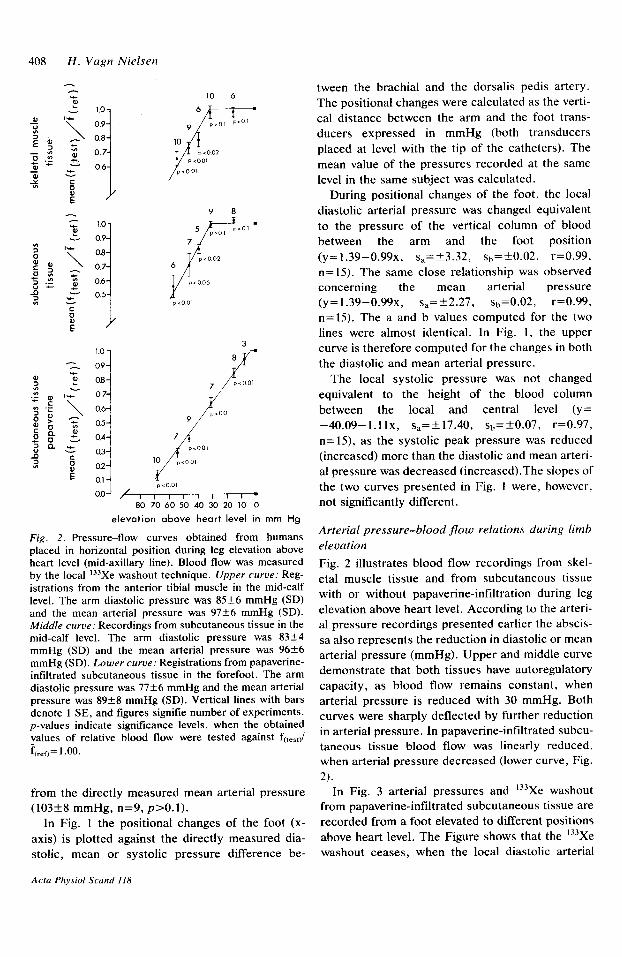
Fig. 2. Pressure-flow curves obtained from humans placed in horizontal position during leg elevation above heart level (mid-axillary line). Blood flow was measured by the local '33Xe washout technique. Upper curve: Reg- istrations from the anterior tibia1 muscle in the mid-calf level. The arm diastolic pressure was 85+6 mmHg (SD) and the mean arterial pressure was 97+6 mmHg (SD). Middle curve: Recordings from subcutaneous tissue in the mid-calf level. The arm diastolic pressure was 83f4 mmHg (SD) and the mean arterial pressure was 9 6 f 6 mmHg (SD). Lower curve: Registrations from papaverine- infiltrated subcutaneous tissue in the forefoot. The arm diastolic pressure was 7 7 f 6 mmHg and the mean arterial pressure was 89+8 mmHg (SD). Vertical lines with bars denote 1 SE, and figures signifie number of experiments. p-values indicate significance levels, when the obtained values of relative blood flow were tested against f(test)/ f(rcTo= 1 .oo.
from the directly measured mean arterial pressure (103+8 mmHg, n=9, p>O.l) .
In Fig. 1 the positional changes of the foot (x- axis) is plotted against the directly measured dia- stolic, mean or systolic pressure difference be-
tween the brachial and the dorsalis pedis artery. The positional changes were calculated as the verti- cal distance between the arm and the foot trans- ducers expressed in mmHg (both transducers placed at level with the tip of the catheters). The mean value of the pressures recorded at the same level in the same subject was calculated.
During positional changes of the foot, the local diastolic arterial pressure was changed equivalent to the pressure of the vertical column of blood between the arm and the foot position
n=15). The same close relationship was observed concerning the mean arterial pressure (y=1.39-0.99~, s,=+.2.27, sb=0.02, r=0.99, n=15). The a and b values computed for the two lines were almost identical. In Fig. 1, the upper curve is therefore computed for the changes in both the diastolic and mean arterial pressure.
The local systolic pressure was not changed equivalent to the height of the blood column between the local and central level (y= -40.09-l.llx, s,=+17.40, sh=+0.07, r=0.97, n=15), as the systolic peak pressure was reduced (increased) more than the diastolic and mean arteri- al pressure was decreased (increased).The slopes of the two curves presented in Fig. 1 were, however, not significantly different.
(y=1.39-0.99~, ~,=+3.32, sh=-t0.02, r=0.99,
Arterial pressure-blood flow relations during limb elevation Fig. 2 illustrates blood flow recordings from skel- etal muscle tissue and from subcutaneous tissue with or without papaverine-infiltration during leg elevation above heart level. According to the arteri- al pressure recordings presented earlier the abscis- sa also represents the reduction in diastolic or mean arterial pressure (mmHg). Upper and middle curve demonstrate that both tissues have autoregulatory capacity, as blood flow remains constant, when arterial pressure is reduced with 30 mmHg. Both curves were sharply deflected by further reduction in arterial pressure. In papaverine-infiltrated subcu- taneous tissue blood flow was linearly reduced, when arterial pressure decreased (lower curve, Fig.
In Fig. 3 arterial pressures and '33Xe washout from papaverine-infiltrated subcutaneous tissue are recorded from a foot elevated to different positions above heart level. The Figure shows that the 133Xe washout ceases, when the local diastolic arterial
Acta Phvsiol Scand 118

Circulatory effects of limb elevation in man 409
arterial p re s su re
rnm Hg 160 1
133Xe washout
log activity
f = o E 8.1 0 c o .......................................... .? 160
- Pa= 21 . Pdia,t. = 0
O J
160
0 h
- 0
I ..................... Fa= 3 4 : Pdiast. 16 .I
I f = 1 3 . 3 + 1 . 0 .... ........... ......... *.-.. ............ .. %=42;Pdiost. = 21
f = 44.3? 1.2 . . . .
.*. . .*. ..... ...... *..
t 160
P =lO1.Pdiast. = 80 80 a .
I I I I I I I I I
0 1 2 3 4 0 1 2 3 4 5 6 7 8 set min
Fig. 3 . Arterial pressures in the arm and the foot (left panel) recorded simultaneously with the local washout of ’33Xe from papaverine-infiltrated subcutaneous tissue in the foot (right panel). The subject rested in horizontal position. Arterial pressure was recorded from a. brachialis in heart level (lower curves) and from a. dorsalis pedis with the foot placed in different positions above heart level (upper curves). The horizontal part of the arterial pressure curves represented the mean arterial pressure obtained by electronic damping. f denotes the perfusion coefficient in ml’min-’. (lOOg)-’ (SD). Pa and Pdlast represented the directly measured mean and diastolic arterial pressure in a. dorsalis pedis (mmHg).
pressure is reduced to zero. The pulse pressure was was elevated “equivalent” to the arm diastolic still present, though somewhat reduced in ampli- pressure, the 133Xe washout ceased in papaverine- tude, at the tip of the catheter in a. dorsalis pedis. infiltrated subcutaneous tissue in the dorsum of the This observation was confirmed by performing the foot (9 legs in 6 subjects). When the experiments same experiment in another subject. When the foot were repeated without mixing 133Xe with papave-
Acta Physiol Scand 118

410 H . Vagn Nielsen
100 - 90 -
80 - 70 - 60 -
50 -
40 -
30 -
20 -
100
x 80 901
10 -
0
2o 1 /i
,:
I I I I I I I I I 1
i 10 -
0 ;
.:/
/ /
I I I I I 1 , I I ,
. /: . / / ./.
meon arterial pressure. in per cent
Fig. 4. Relative blood flow in vasoparalysed (papaverine) subcutaneous tissue in the foot plotted against the mean arterial pressure both given in per cent of the reference values obtained in heart level. Procedure as described in Fig. 2. Local mean arterial pressure was estimated from the arm mean arterial pressure minus the vertical distance between the foot and arm expressed in mmHg. When analysed by linear regression (y=a+bx) a was calculated to -19.4451.44 (SD) and b to 1.24OkO.026 (SD), (r=0.99, n=53). The curve intercepted the abscissa at 15.7f0.8% (SD).
rine, blood flow also ceased, when the foot was elevated equivalent to the arm diastolic pressure (4 legs in 2 subjects).
In Fig. 4 all the flow data obtained from papaver- ine-infiltrated subcutaneous tissue are plotted against the local mean arterial pressure given in per cent of the reference mean arterial pressure at heart level. Blood flow and local mean arterial pressure was linearly related. The curve intercepted the pressure axis, when local mean arterial pressure was reduced with 84.3+0.8% (SD). The remaining 16% of the mean pressure energy seemed not to produce any blood flow.
In Fig. 5 the same flow data (Fig. 4) are plotted against the local diastolic arterial pressure given in per cent of the reference diastolic blood pressure at heart level. The pressure-flow curve shows a direct proportionality between blood flow and local dia- stolic blood pressure.
In Fig. 6 local vascular resistance was computed according to the flow results obtained from papa- verine-infiltrated subcutaneous tissue (Fig. 4 and Fig. 5). The results were arranged in groups in
Acta Physiol Scand 118
i-'. / / :
/ / /
,/ / . .<
L .
diastolic arterial pressure, in per cent
Fig. 5. The figure illustrates the flow results in Fig. 4 plotted against the local diastolic arterial pressure given in per cent of the reference pressure in heart level. a= -0.164k 1.054 (SD), b= 1.051 k0.021 (SD), r=0.99, n=53. The square on the abscissa represented 9 measure- ments.
which the arterial pressures were almost the same to allow calculations of the mean and SEM. Assum- ing that local mean arterial pressure minus venous pressure was the driving force for distal blood flow, local vascular resistance was progressively in- creased towards infinity at low arterial pressures, upper curve, Fig. 6. A linear relation between blood flow and local diastolic blood pressure (Fig. 5) might indicate, that the driving force for distal blood flow was more dependent on the diastolic pressure than the mean arterial pressure. When local perfusion pressure was calculated as local diastolic blood pressure minus venous pressure, local vascular resistance remained almost un- changed during arterial pressure reduction, lower curve, Fig. 6.
Effects of vascular distension upon blood flow cessation Blood flow ceased, when the foot was elevated equivalent to the arm diastolic pressure (n=6) as observed earlier. The foot was livid, ischaemic looking without a capillary refilling response after finger compression. Furthermore the subjects expe- rienced pains in the foot, when the elevated posi- tion was held for a prolonged period. A cuff was then placed on the thigh and inflated above the diastolic pressure level beneath the cuff. When ven-

Circulatory effects of limb elevation in man 41 1
3.0
2.5
2D
1.5
1.0
subcutaneous tissue papaverine
P>O.l p < 0.05
10 % p>oos 7 9 8
I I I I I I I .
mean arterial pressure,rnm Hg
P > O l p>oos p7>o, P > O l
i o 20 30 40 50 60 70 80 90
I I I I I I I I 0 10 20 30 40 50 60 70
diastolic arterial presrure,mm Hg
Fig. 6. Mean relative vascular resistance in a local area plotted against a decrease in local arterial pressure, achieved by elevation of the area above heart level. Local vascular resistance was calculated from obtained values of relative blood flow (Fig. 4 and Fig. 5 ) and local perfu- sion pressure. In upper curve local perfusion pressure was calculated as mean arterial pressure minus venous pres- sure, but in lower curve as diastolic arterial pressure minus venous pressure.
ous pressure in the foot was increased to IS mmHg by this procedure, a significant '33Xe washout was recorded from the formerly ischaemic foot (f~,,,,~=11.5+1.8 (SE) ml~min-'.(100 g)-', n=6, p<O.OI). The '33Xe washout continued, when local venous pressure was increased to 30 mmHg by further cuff inflation (f(,,,,,=9.0+2.3 (SE) ml.min-'.(100 g)-', n=3). During vascular dis- tension the colour of the elevated foot was changed into bluish-red, a capillary refilling response was observed and tha pains were relieved. As soon as the cuff was deflated the foot became ischaemic again.
In one subject arterial pressure, venous pressure and '"Xe washout were recorded simultaneously. The foot was elevated equivalent to the arm diastol- ic pressure and the '33Xe washout stopped, local
venous and diastolic arterial pressure were zero, while mean arterial pressure was 10 mmHg. The femur cuff was then inflated to the diastolic pres- sure level beneath the cuff (60 mmHg) and although the local diastolic pressure increased to 2 4 mmHg, no detectable '33Xe washout was recorded. When the femur cuff was inflated to 70 mmHg, local diastolic arterial pressure increased to 16 mmHg, mean arterial pressure to 24 mmHg, and local ve- nous pressure was increased to 10 mmHg. The colour of the foot changed, and a significant wash- out was recorded (10.1k1.6 (SD) ml.min-'.(lOO g)-'). Further inflation of the femur cuff to 90 mmHg increased local diastolic pressure to 32 mmHg, mean arterial pressure to 36 mmHg, local venous pressure to 28 mmHg and there was still a significant 133Xe washout. Central arterial pressure (a. brachialis) remained constant during all these experiments. The observed increase in local arterial pressure took place within few heart beats after instantaneous femur cuff inflation.
DISCUSSION
Pressure-flow relations during arterial pressure reduction A local vascular bed with papaverine induced pa- ralysis displayed a linear arterial pressure-blood flow relationship, when arterial pressure was re- duced (Fig. 2, 4-5). In animal experiments with better controlled and direct measurements of maxi- mum blood flow and arterial pressures, the pres- sure-flow relationship (lower half) also tends to be linear (Green & Rapela 1964), although a curve reflection is seen at low flow rates (Baeckstrom et al. 1971, L'Abbate et al. 1980). It is, however, difficult to compare the present results with earlier findings, as the major vessels are left non-manipu- lated by the present limb elevation procedure. In most of other experimental setups arterial pressure is reduced by clamping the inflow artery. This pro- cedure may prevent the retrograde blood flow in the arteries during the diastole and thereby distend- ing the vascular system distal to the clamped ar- tery.
The pressure-flow curves obtained from tissues with normal vasomotor tone showed the well known "autoregulatory plateau" (Fig. 2), as dem- onstrated in several other tissues (Henriksen et al. 1973a, b , Hams@ 1981).
According to the conventional concept, the posi-
Acta Physiol Scand 118

412 H. Vagn Nielsen
tive pressure intercept in the pressure-flow dia- gram (Fig. 4) is explained by a massive increase in local vascular resistance at low arterial pressures (Fig. 6). This increase in vascular resistance has been suggested to be caused by changes in blood viscosity and elastic recoil of the microvessels (Fol- kow & Lofving 1956, Djojosugito et al. 1970, Baeckstrom et al. 1971). Alternatively, it has been suggested, that the diastolic portion of a pulsatile inflow pressure may be the proper driving force for distal blood flow (Uchida 1956, Dahn et al. 1967) and accordingly, the pressure-intercept is vanished (Fig. 5) , and there are only small adaptive changes in local vascular resistance during arterial pressure reduction (Fig. 6). In the present study it is suggest- ed, that the positive pressure intercept can be ascribed to pressure variations in the inflow ves- sels.
Blood flow cessation The main finding of the present study was that capillary blood flow ceased, when the diastolic ar- terial pressure was reduced to zero, but reap- peared, when the vascular bed was distended dur- ing compression of the inflow and out-flow vessels. Due to the indirect techniques used an exact esti- mation of the blood flow cessation pressure is im- possible. The whole foot showed, however, signs of vascular ischaemia, when the ‘33Xe washout stopped in the local area.
Normally, the vascular bed is distended and kept well rounded up by a positive pressure head. The precapillary vessels will tend to collapse during the diastole, when local diastolic arterial pressure is reduced to zero. A part of the precapillary section is more or less rounded up again, when arterial pressure is raised above zero during a brief systolic peak. The pulse volume of blood injected at each heart beat into a semicollapsed arterial tree is in all probability much smaller, than the total volume of the limb arteries-arterioles. Therefore only the proximal part of the precapillary section is filled with blood during the systole. When local pressure again reaches zero at diastole, this proximal filling will be emptied retrograde towards proximal arteri- al sections, as there are here no valves to prevent the backflow. Simply, blood flow ceases because the precapillary vessels are not opened in full length during the systole. The total foreward flow equals the total backward flow and there is no through flow (Windkessel effect). Evidently, the mean arte-
rial pressure is not the driving pressure for distal blood flow in this situation.
Blood flow was reestablished in the elevated is- chaemic foot by applying a proximal compression cuff pressure on the thigh. As the proximal com- pression cuff was inflated above the level of the local diastolic arterial pressure, the inflow arteries underneath the cuff were collapsed during the dias- tole (Gardner 1962). Consequently, the pulse vol- ume of blood injected during the systole is forced through this artificially imposed “valve” in the femoral arteries. The valve function prevents a ret- rograde blood flow in the diastole, and the pulse volume of blood is instead accumulated in the ele- vated limb. Diastolic and mean arterial pressure are increased locally, and the foot vascular bed is dis- tended in the flow direction. Now much less of the pulse pressure energy is “wasted” by rounding up and distending the precapillary vessels, and there is enough pressure energy left to cause through flow. A simultaneous rise in local venous pressure was also observed, and a retrograde filling of the mi- crovessels from the venous side might also be re- sponsible for the reappearance of blood flow. These experiments clearly demonstrate, that the pulse pressure energy certainly matters as a driving force for distal blood flow.
In conclusion, the experimental findings suggest- ed, that the precapillary vessels were collapsed with cessation of blood flow, when local diastolic arterial pressure was zero. The volume of blood injected during the systolic peak was too small to expand also the distal sections of the precapillary vessels. The systolic peak volume of blood was instead returned in proximal direction as backflow during diastole i.e. the pulse pressure energy was eliminated by the Windkessel effect. In all other situations, the mean arterial pressure might be the driving force for distal blood flow depending on whether some part of the pulse pressure energy was wasted in the precapillary section (flow turbulence, Windkessel effect).
I wish to express my gratitude to N. A. Lassen, M.D., Ph.D., for inspiration to the present study and for offering me excellent working conditions at Dept. of Clinical Physiology, Bispebjerg Hospital. I further want to thank 0. Henriksen, M.D., Ph.D. for assistance with the arterial pressure recordings and P. Sejrsen, M.D. , Ph.D., for comments about the manuscript. This study has been supported by a grant from Frederiksborg Amts sygehus- vaesen.
Acra Physiol Scand 118

Circulatory effects of limb elevation in man 413
REFERENCES INTAGLIETTA, M., PAWULO, R. F. & TOMKINS,
BAECKSTROM, P., FOLKOW, B., KENDRICK, E . , LOFVING, B. & OBERG, B. 1971. Effects of vaso- constriction on blood viscosity in vivo. Acta Physiol Scand 81: 376-384.
BOLUND, S. & HOLSTEIN, P. 1976. Blood flow cessa- tion at external pressure in rat skinflaps, isotope wash- out compared to vital capillary microscopy. Microvasc Res 11: 381-390.
BURTON, A. C. 1951. On the physical equilibrium of small blood vessels. Am J Physiol 164: 319-329.
DAHN, I., LASSEN, N . A. & WESTLING, H. 1967. Blood flow in human muscles during external pressure or venous stasis. Clin Sci 32: 467473.
DJOJOSUGITO, A. M., FOLKOW, B., OBERG, B. & WHITE, S. 1970. A comparison of blood viscosity measured in vitro and in a vascular bed. Acta Physiol Scand 78: 70-84.
EHRLICH, W.. BAER, R. W., BELLAMY, F. & RAN- DAZZO, R. 1980. Instantaneous femoral artery pres- sure-flow relations in supine anaesthetized dogs and the effect of unilateral elevation of femoral venous pressure. Circ Res 47: 88-98.
FOLKOW, B. & LOFVING, B. 1956. The distensibility of the systemic resistance blood vessels. Acta Physiol Scand 38: 37-52.
GARDNER, W. J. 1962. An inflatable emergency splint. Cleveland Clin Quart 29-30: 54-56.
GREEN, H. D. & RAPELA, C. E. 1964. Blood flow in passive vascular beds. Circ Res 14-15: 11-16.
HAUNSP), S. 1981. Lower limits of blood flow autoregu- lation in different myocardial layers of the left ventric- ular free wall of dogs. Acta Physiol Scand 112: 349-350.
HENRIKSEN, 0. & KRISTENSEN, J. K . 1979. ‘Disten- sibility’ of the papaverine-relaxed vascular bed in hu- man subcutaneous tissue. Acta Physiol Scand 106: 109-113.
HENRIKSEN, O., NIELSEN, S. L. & PAASKE, W. P. 1973 a . Autoregulation of blood flow in human adipose tissue. Acta Physiol Scand 89: 531-537.
HENRIKSEN, O., NIELSEN, S. L., PAASKE, W. P. & SEJRSEN, P. 1973 b. Autoregulation of blood flow in human cutaneous tissue. Acta Physiol Scand 89: 538-543.
W. R. 1970. Pressure measurements in the mammalian microvasculature. Microvasc Res 2: 2 12-220.
KETY, S. S. 1951. Theory and application of the ex- change of inert gas of the lungs and tissues. Pharmacol Rev 3: 1 4 1 .
L’ABBATE, A., MORZELLI, M., BALLESTRA, A. M., CAMICI, P., TRIVELLA, M. G., PELOSI, G . & KLASSEN, G. 1980. Opposite transmural gradients of coronary resistance and extravascular pressure in the working dog’s heart. Circ Res 14: 21-29.
LARSEN, 0. A,, LASSEN, N. A. & QUAADE, F. 1966. Blood flow through human adipose tissue determined with radioactive Xenon. Acta Physiol Scand
LASSEN, N. A, , LINDBJERG, I. F. & MUNCK. 0. 1964. Measurement of blood flow through skeletal muscle by intramuscular injection of 133Xe. Lancet I: 686-689.
McDONALD, D. A. 1960. Blood flow in arteries. Edward Arnold (Publishers), London.
NIELSEN, H. V. 1982. Effects of externally applied com- pression on blood flow in subcutaneous and skeletal muscle tissue in the human supine leg. Clinical Physi-
NIELSEN, S. L. 1972. Adipose tissue blood flow deter- mined by washout of locally injected I3’Xe. Scand J Clin Lab Invest 29: 31-36.
SEJRSEN, P., HENRIKSEN, O., PAASKE, W. P. & NIELSEN, S. L. 1981. Duration of increase in vascu- lar volume during venous stasis. Acta Physiol Scand
TgNNESEN, K. H . & SEJRSEN, P. 1970. Washout of 13Xe after intramuscular injection and direct measure- ment of blood flow in skeletal muscle. Scand J Clin Lab Invest 25: 71-81.
UCHIDA, S. 1956. The pulsating viscous flow super- posed on the steady laminar motion of imcompressible fluid in a circular pipe. ZAMP 7: 4034122.
WIEDERHIELM, C. A,, WOODBURY, J. W., KIRK, S. & RUSHMER, R. F. 1964. Pulsatile pressures in the microcirculation of frog’s mesentery. Am J Physiol
66: 337-345.
ology 2: 447457.
1 I 1: 293-298.
207: 173-176.
Acta Physiol S a n d 118