arterial performance measurement using high-resolution ...ritslab.rutgers.edu/images/pdf/4-2...
TRANSCRIPT
1
Arterial Performance Measurement Using High-Resolution Traffic Signal Data
Dr. Henry LiuDepartment of Civil Engineering
University of Minnesota — Twin Cities
June 7th, 2010
NSF Workshop on Dynamic Route Guidance and Coordinated Traffic Control

2
Question to Be Answered
How can we automatically and continuously monitor and measure traffic conditions for signalized arterials using the existing infrastructure?
3
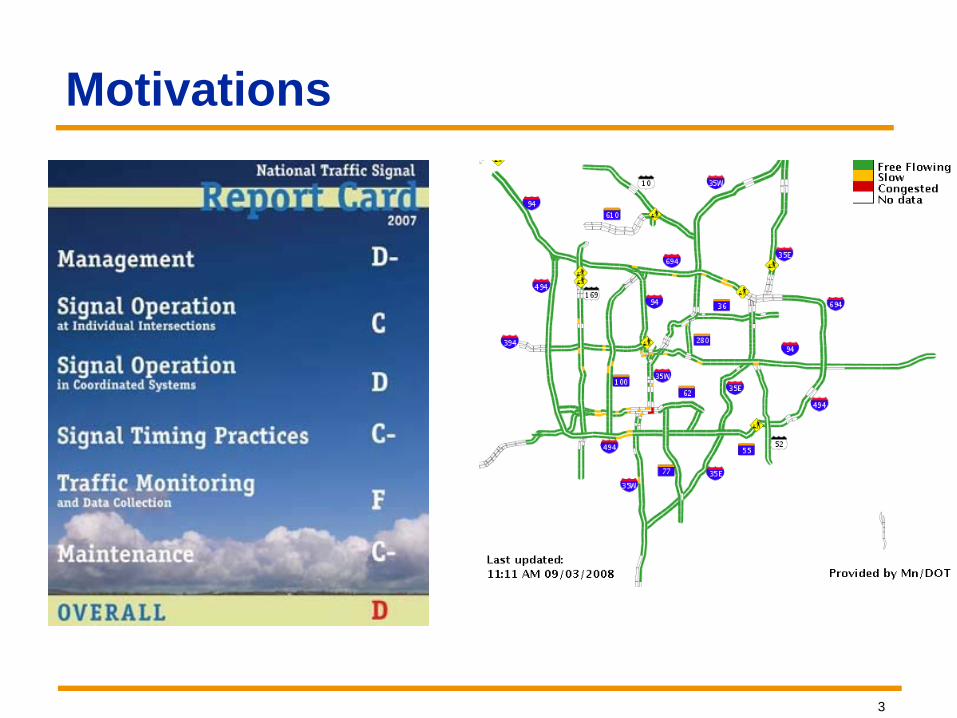
Motivations

4
• An automatic and continuous data collection system from existing traffic signals
• A performance measurement system for intersection queue length and arterial travel time, especially under congested traffic conditions
• A performance tuning system for optimization of traffic signal parameters
5
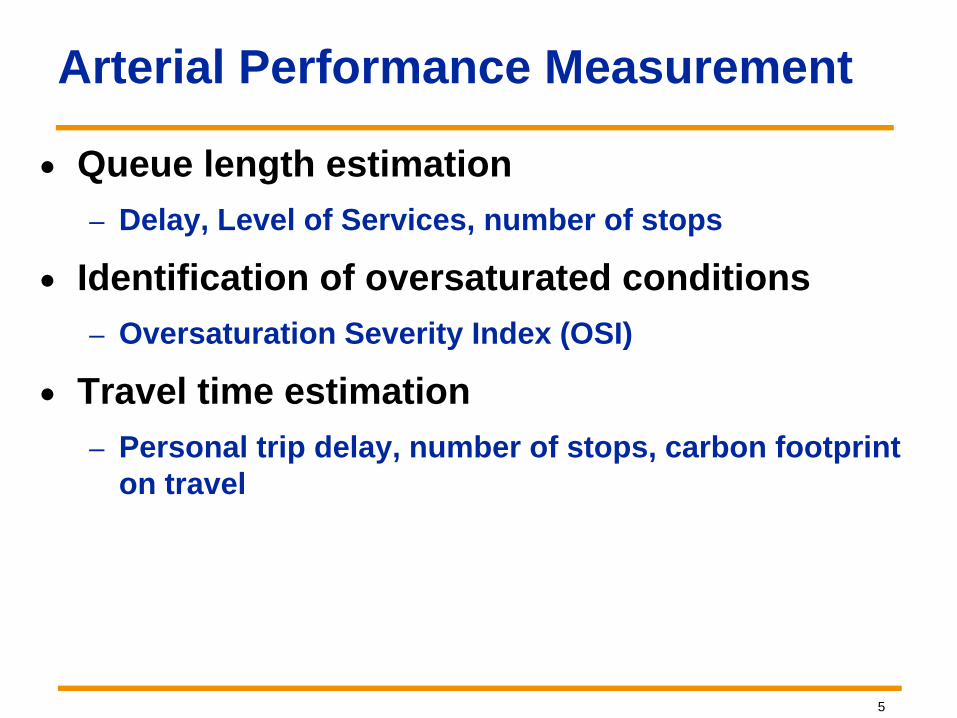
• Queue length estimation– Delay, Level of Services, number of stops
• Identification of oversaturated conditions– Oversaturation Severity Index (OSI)
• Travel time estimation– Personal trip delay, number of stops, carbon footprint
on travel
Arterial Performance Measurement
6
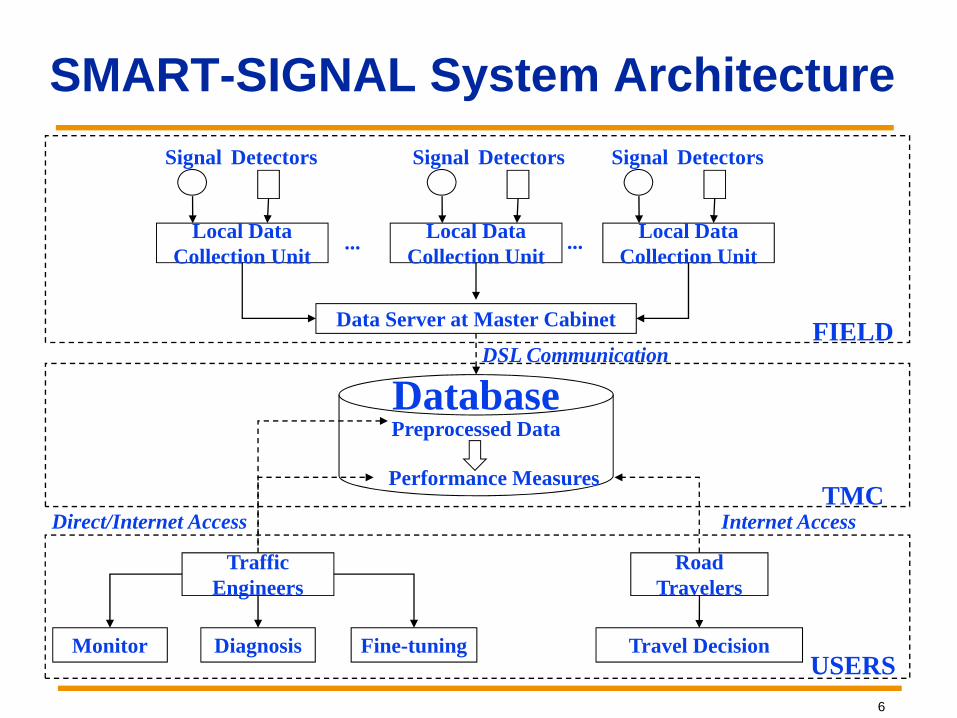
SMART-SIGNAL System ArchitectureDetectorsSignal
Local Data Collection Unit
Data Server at Master Cabinet
... ...
FIELD
DetectorsSignal
Local Data Collection Unit
DetectorsSignal
Local Data Collection Unit
TMC
DatabasePreprocessed Data
Performance Measures
DSL Communication
Road Travelers
Traffic Engineers
USERSMonitor Diagnosis Fine-tuning Travel Decision
Direct/Internet Access Internet Access

7
Terminal Box
DAC
Data Collection

8
Prairie Center Dr. and Technology Dr. (Eden Prairie)
2010/02/04

9
08 :09:15 .012, D8 on, 7.902s 08 :09:15 .481, D8 o ff, 0 .468s 08 :09:16 .761, G3 o ff, 29.389s 08 :09:16 .761, Y3 on, 179 .021s 08 :09:17 .620, D9 on, 2.686s 08 :09:18 .151, D10 on , 2.593s 08 :09:18 .307, D9 o ff, 0 .687s 08 :09:18 .823, D10 off, 0.671s 08 :09:20 .244, Y3 o ff, 3 .482s 08 :09:21 .649, D22 on , 80 .953s 08 :09:22 .008, D22 off, 0.359s 08 :09:23 .242, G1 on, 172 .806s
Detector #8 on at 08:09:15.012;Vacant time is 7.902s
Green Phase #3 off at 08:09:16.761;Green duration time is 29.389s
Detector #9 off at 08:09:18.307;Occupy time is 0.687s
Yellow Phase #3 off at 08:09:20.244;Yellow duration time is 3.482s
Green Phase #1 on at 08:09:23.242;Red duration time is 172.806s
Event-Based Data

10
• 11 intersections on France Ave. in Bloomington (March 07 – June 09)
• 6 intersections on TH55 in Golden Valley (Feb. 08 – Sept. 09)
• 3 intersections on PCD in Eden Prairie (Current)• 14 intersections on TH13 (Aug. 2010, Expected)• 16 intersections on TH55 (Aug. 2010, Expected)• 6 intersections in the City of Pasadena,
California (Iteris, Aug. 2010, Expected)
SMART-Signal Implementation Sites

11
Queue Length Estimation• Instead of traditional input-output
approach, we estimate queue length by taking advantage of queue discharge process
• Based on LWR shockwave theory

12
Queue Length Estimation• Utilize the data collected by advance detector• Identify Critical Points: A, B, C
Distance
Time
1v
2v
ngT n
rT nTmax1+n
gT
3v
nTmin
5v
1+nrT
4v
A B CLoopDetector
H
AT BTCT
dL
nLmax
D
nLmin
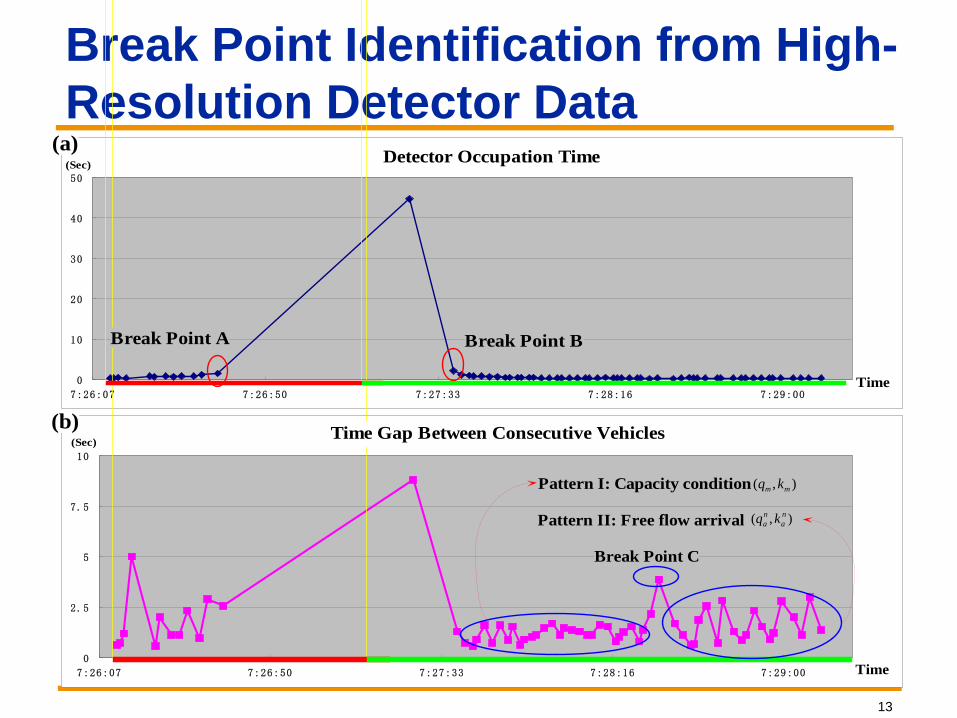
13
Break Point Identification from High-Resolution Detector Data
Case 1 - Long Queue
0
10
20
30
40
50
7:26:07 7:26:50 7:27:33 7:28:16 7:29:00
Case 1 - Long Queue
0
2.5
5
7.5
10
7:26:07 7:26:50 7:27:33 7:28:16 7:29:00
Detector Occupation Time
Break Point A Break Point B
Time Gap Between Consecutive Vehicles
),( mm kq
),( na
na kq
Pattern I: Capacity condition
Pattern II: Free flow arrival
Break Point C
(Sec)
(Sec)
Time
Time
(a)
(b)
14
Oversaturation Severity Index (OSI) • OSI: the ratio between unusable green time and total
available green time in a cycle.
• Further differentiate OSI into T-OSI and S-OSI. – Temporal dimension (T-OSI)
• The detrimental effects created by residual queue
– Spatial dimension (S-OSI)• The detrimental effects caused by spill-over
15
Identification of Spillover
• Queue spillover blocks upstream intersections and reduces useable green time for upstream movements– Queue-over-detector (QOD):
• Some vehicles stay on the detector for a relatively long time creating prolonged detector occupancy time when traffic light is green

16
Identify Queue-over-detector (QOD) Caused by Spillover
QOD caused byred interval
Distance
Time
A SC
QODST OCC
StQOD
ET
4v2v
QOD caused byspillover
Stop-bar detector
Advance detector
ngT n
rT 1ngT +OCC
Et
E
Downstream
Upstream

17
Queue Estimation with SpilloverDistance
Time
1v
2v
ngT n
rT
3v
QODendT 1+n
rT
A B
C
LoopDetector
H
AT BT
dL
maxnL
D
minnL
1v
Time
4v
B'
QODstartT
2v2v
2v1v
C'
QOD Caused by Spillover
4v
A'
Intersection i
Intersection i+1

18
Travel Time Estimation • Track a virtual probe vehicle
– Signal delay– Queuing delay– Acceleration/deceleration/no-speed-change
1d
2 n
2d ndO D
1

19
Safe Space Headway?
Queue Ahead?
No
Speed of Last Queued Vehicle
YesSignal Status
No
Desired Speed
Yes
D
NoDesired Speed
Green
ZeroSpeed
Red Able to Cross?
Yellow
A
<
N
=
D
>
N
=
A
<
N
=
D
>
N
=
A
<
N
=
Desired Speed
Yes
Maneuver Decision Tree

20
Self-Correction Property x
tTa
xs
xf
Td
a
c
b
d
TcTb
FasterVehicle
SlowerVehicle
Stop-line

21
Field Tests on TH55 in Minneapolis
TH 55
Advanced detectors
Rhode Island Ave.
Glenwood Ave.
TH 55
Stopbar detectors
Winnetka Ave.Boone Ave.
Additional detectors
Phase 6
Phase 2400 ft
2635 ft 842 ft 1777 ft
375 ft
22
Independent Evaluation of Performance Measures on TH55• By Alliant Engr. Inc• Queue length
Manually count the vehicles (Two persons per approach)Four peak hours (July 22nd and 23rd, 2009)
• Travel timeFloating car method with GPSFour peak hours (July 22nd and 23rd , 2009)More than 70 runs

23
Results – Maximum Queue Length
0
200
400
600
800
1000
6:57:36 7:12:00 7:26:24 7:40:48 7:55:12 8:09:36 8:24:00
July 22nd for TH55WB at Rhode Island Intersection (AM)
MaxQL-Estimation
MaxQL-Observation
0
200
400
600
800
6:57:36 7:04:48 7:12:00 7:19:12 7:26:24 7:33:36 7:40:48 7:48:00 7:55:12 8:02:24
July 23rd for TH55WB at Rhode Island Intersection (AM)
MaxQL-Estimation
MaxQL-Observation
24
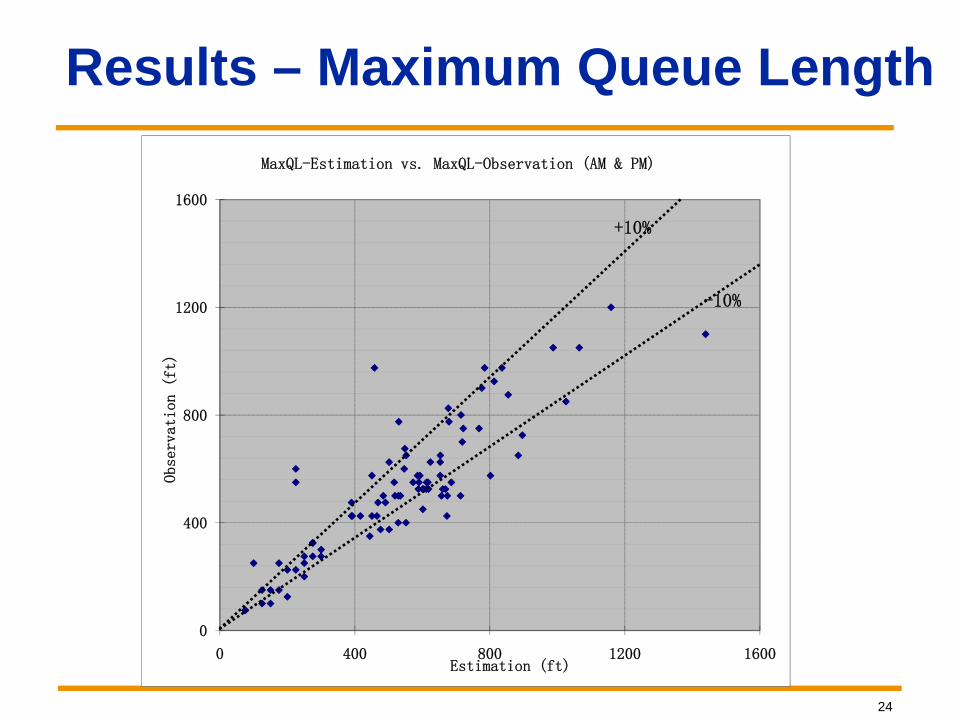
0
400
800
1200
1600
0 400 800 1200 1600
Observation (ft)
Estimation (ft)
MaxQL-Estimation vs. MaxQL-Observation (AM & PM)
+10%
-10%
Results – Maximum Queue Length
25
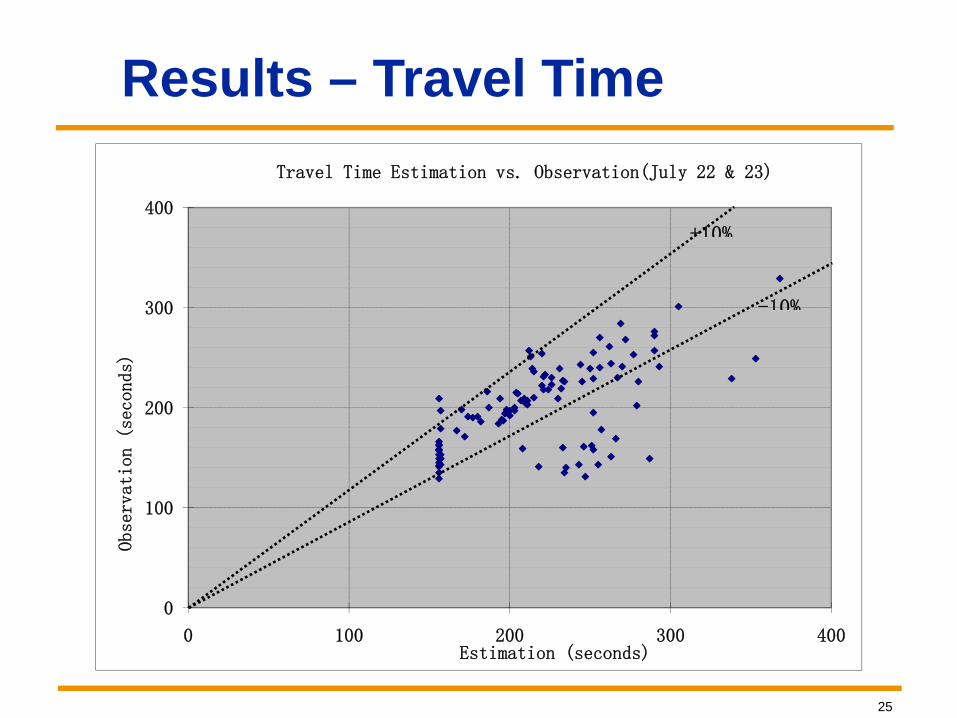
0
100
200
300
400
0 100 200 300 400
Observation (seconds)
Estimation (seconds)
Travel Time Estimation vs. Observation(July 22 & 23)
+10%
-10%
Results – Travel Time

26
Identification of Spillover
Occupation Time
6800
7000
7200
7400
7600
7800
17:12:20 17:13:03 17:13:47 17:14:30 17:15:13
Detector Occupancy Time for Westbound TH 55 at Rhode Island Ave.Distance (feet)
Time
Occupancy Time of Advance DetectorOccupancy Time of Stop-bar Detector
2v2vQOD caused by red phase QOD caused by spillover
Stop-barDetector
AdvanceDetector

27
Queue Profile for Downstream Intersection
0
300
600
900
1200
1500
1800
17:05:17 17:12:29 17:19:41 17:26:53 17:34:05 17:41:17
Time
Queue Length Profile at the Intersection of WinnetkaDistance (feet)
L=842 ft
28
Summary • Developed the SMART-Signal System for
arterial data collection and performance measurement
• Proposed a long queue estimation approachbased on shockwave theory
• Proposed a quantifiable measure of oversaturation (TOSI and SOSI)
• Proposed a virtual probe vehicle approach to calculate time-dependent arterial travel times
• Results of performance measures has been validated through field implementation
29
Publications• Liu, H. and Ma, W., (2009) A virtual vehicle probe
model for time-dependent travel time estimation on signalized arterials, Transp. Res. Part C, 17(1), 11-26.
• Liu, H., Wu, X., Ma, W., and Hu, H., (2009) Real-Time queue length estimation for congested signalized intersections, Transp. Res. Part C, 17(4), 412-427.
• Wu, X., Liu, H. and Gettman, D. (2010) Identification of Oversaturated Intersections Using High-Resolution Traffic Signal Data, Transp. Res. Part C, 18(4), 626-638.
• Wu, X., Liu, H, and Geroliminis, N. (2010) An Empirical Analysis on the Arterial Fundamental Diagram, Transp. Res. Part B, Accepted.