Årsmöteskonferensen 2014 michael menhart the social and economic value of insurance send out
TRANSCRIPT

The Social and Economic Value of Insurance
14 May 2014
Michael Menhart
Chief Economist
Munich Re

The Social and Economic Value of Insurance
Value of insurance for economy and society: obvious, but often
misunderstood
Natural catastrophes: Economic consequences and the role of
insurance
Too important to fail? The systemic risk debate and insurance
2
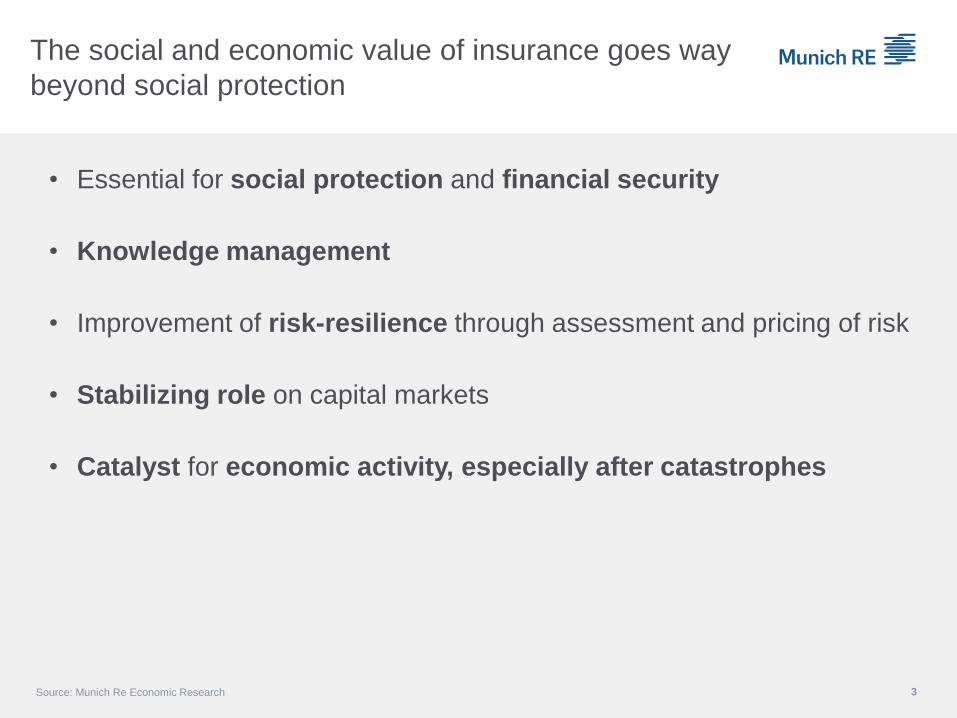
The social and economic value of insurance goes way
beyond social protection
Source: Munich Re Economic Research 3
• Essential for social protection and financial security
• Knowledge management
• Improvement of risk-resilience through assessment and pricing of risk
• Stabilizing role on capital markets
• Catalyst for economic activity, especially after catastrophes

Insurance addresses fundamental human emotions…
• Risk permeates our lives:
• Property damage
• Natural disaster
• Sickness and disability
• Accidents and death
• Insurance addresses two fundamental interconnected human emotions:
• Hope
• Fear
• Insurance is an intrinsic part of society and social behaviour
Source: Munich Re Economic Research 4

…but is poorly understood and often maligned
(Woody Allen,
Love and Death, 1975)
SourceMunich Re Economic Research 5
“There are worse things
in life than death. Have
you ever spent an
evening with an
insurance salesman?”
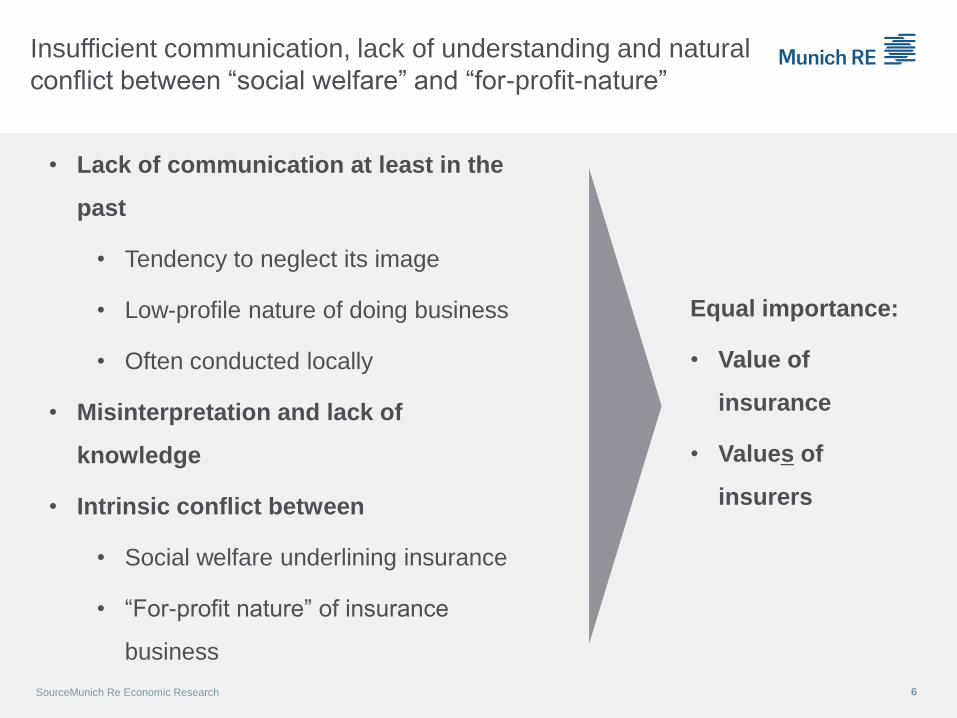
Insufficient communication, lack of understanding and natural
conflict between “social welfare” and “for-profit-nature”
• Lack of communication at least in the
past
• Tendency to neglect its image
• Low-profile nature of doing business
• Often conducted locally
• Misinterpretation and lack of
knowledge
• Intrinsic conflict between
• Social welfare underlining insurance
• “For-profit nature” of insurance
business
SourceMunich Re Economic Research 6
Equal importance:
• Value of
insurance
• Values of
insurers
The Social and Economic Value of Insurance
Value of insurance for economy and society: obvious, but often
misunderstood
Natural catastrophes: Economic consequences and the role of
insurance
Too important to fail? The systemic risk debate and insurance
7
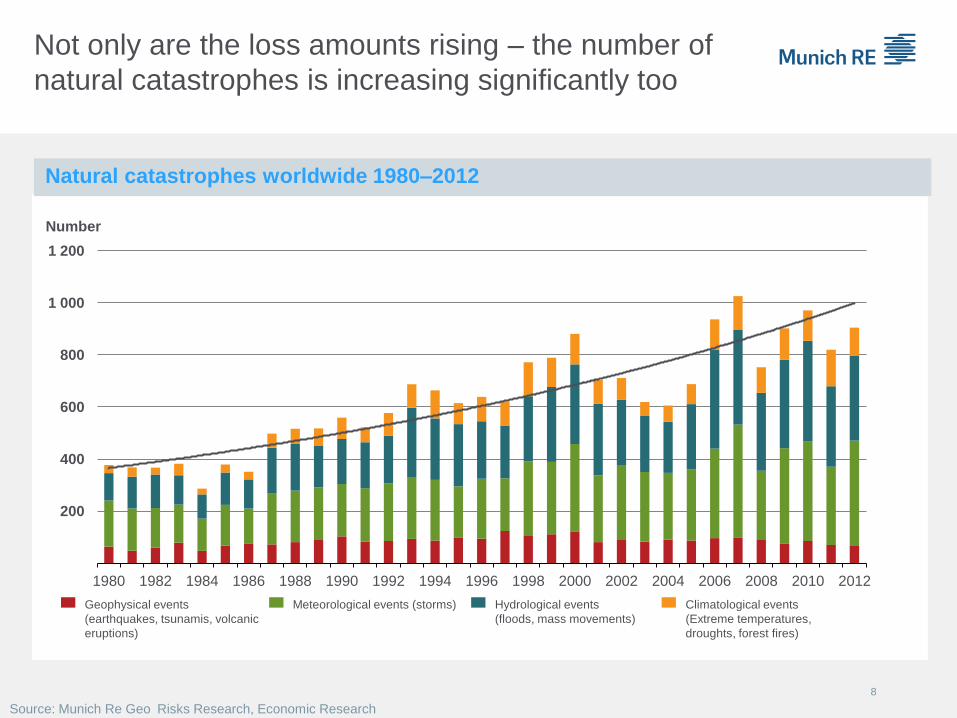
Not only are the loss amounts rising – the number of
natural catastrophes is increasing significantly too
8
Meteorological events (storms) Hydrological events
(floods, mass movements)
Climatological events
(Extreme temperatures,
droughts, forest fires)
Geophysical events
(earthquakes, tsunamis, volcanic
eruptions)
Number
Source: Munich Re Geo Risks Research, Economic Research
200
400
600
800
1 000
1 200
1980 1982 1984 1986 1988 1990 1992 1994 1996 1998 2000 2002 2004 2006 2008 2010 2012
Natural catastrophes worldwide 1980–2012
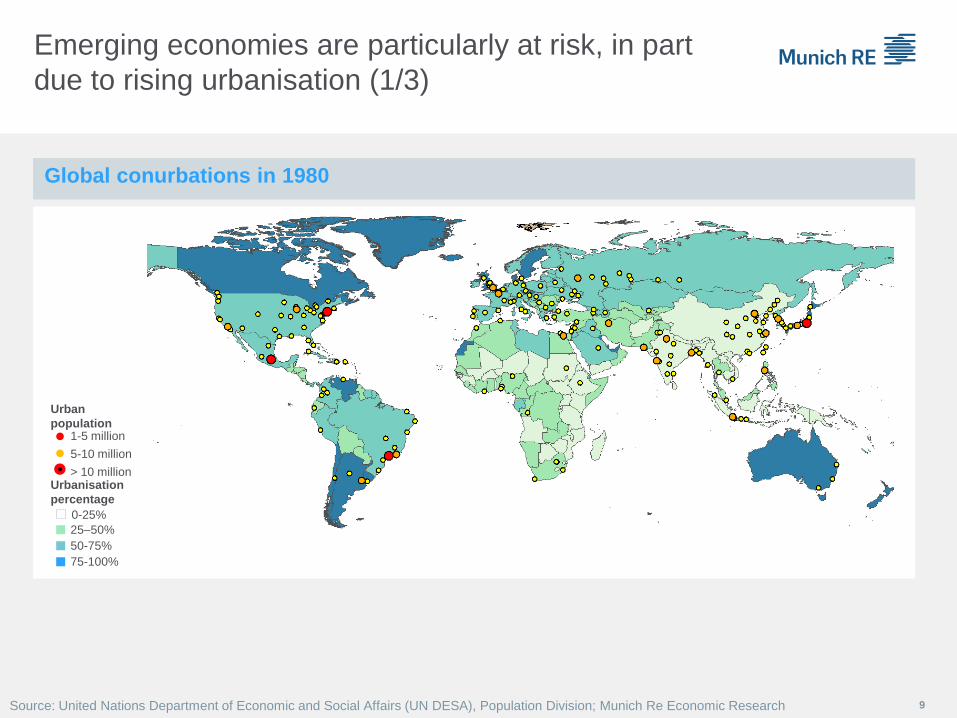
Global conurbations in 1980
9
Emerging economies are particularly at risk, in part
due to rising urbanisation (1/3)
0-25%
25–50%
50-75%
75-100%
Urbanisation
percentage
Urban
population 1-5 million
5-10 million
> 10 million
Source: United Nations Department of Economic and Social Affairs (UN DESA), Population Division; Munich Re Economic Research

Global conurbations in 2011
10
Emerging economies are particularly at risk, in part
due to rising urbanisation (2/3)
0-25%
25–50%
50-75%
75-100%
Urbanisation
percentage
Urban
population 1-5 million
5-10 million
> 10 million
Source: United Nations Department of Economic and Social Affairs (UN DESA), Population Division, Munich Re Economic Research

Global conurbations in 2025
11
Emerging economies are particularly at risk, in part
due to rising urbanisation (3/3)
0-25%
25–50%
50-75%
75-100%
Urbanisation
percentage
Urban
population 1-5 million
5-10 million
> 10 million
Source: United Nations Department of Economic and Social Affairs (UN DESA), Population Division; Munich Re Economic Research
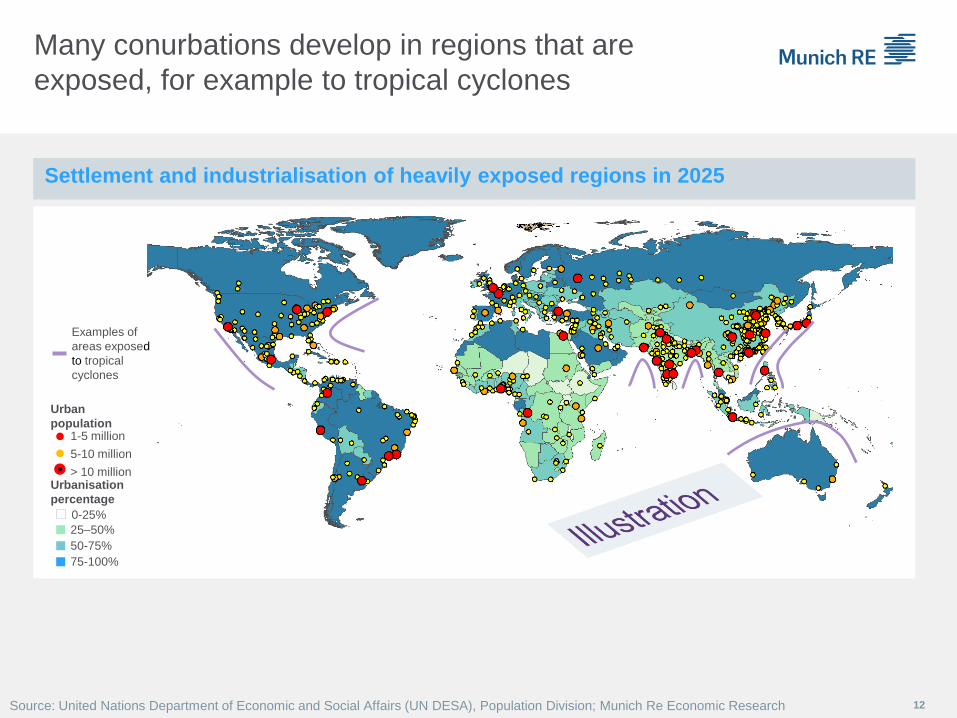
Settlement and industrialisation of heavily exposed regions in 2025
12
Many conurbations develop in regions that are
exposed, for example to tropical cyclones
0-25%
25–50%
50-75%
75-100%
Urbanisation
percentage
Urban
population 1-5 million
5-10 million
> 10 million
Source: United Nations Department of Economic and Social Affairs (UN DESA), Population Division; Munich Re Economic Research
Examples of
areas exposed
to tropical
cyclones

The overall economic effect results from both the direct
and the indirect effects
13
Economic effects of natural catastrophes
Overall effect
Direct losses
Direct consequences of the
forces of nature
Usually not directly evident from
the development of GDP*
Personal injury
Direct economic losses, e.g.
damage to capital assets and
resources
Indirect effects = “positive” + negative indirect effects
All effects not caused directly by the natural catastrophe
but by the resultant direct losses
Indirect effects are usually changes in GDP compared
with the hypothetical development of GDP in the
absence of a natural catastrophe
“Positive” indirect effects,
e.g. through
Reconstruction stimulus
“Prosperity incentives”, e.g.
construction of new, better-
quality houses
“Creative destruction”, e.g.
the destruction fosters
innovation; new production
facilities are more modern
than those destroyed
*) Exemptions are droughts and heat waves which directly impair GDP
Source: Munich Re Economic Research
Negative indirect effects,
e.g. through
Loss of production due to
destroyed installations
Degradation of human
capital
Damaged and destroyed
infrastructure
Often higher inflation
Frequently, an increase in
government debt
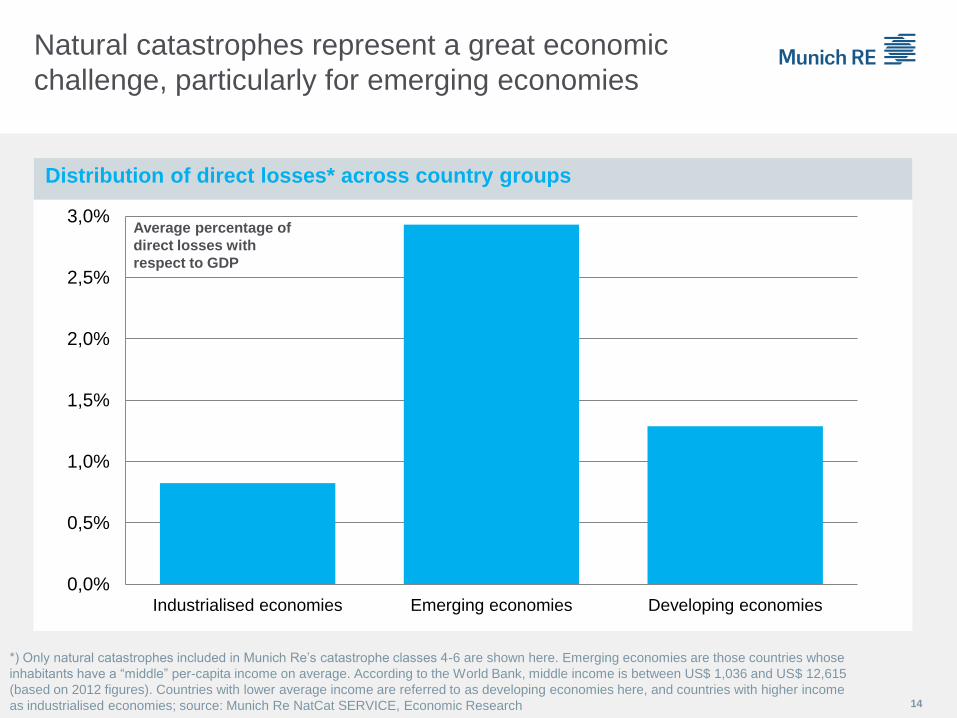
0,0%
0,5%
1,0%
1,5%
2,0%
2,5%
3,0%
Industrialised economies Emerging economies Developing economies
Average percentage of
direct losses with
respect to GDP
14
Natural catastrophes represent a great economic
challenge, particularly for emerging economies
Distribution of direct losses* across country groups
*) Only natural catastrophes included in Munich Re’s catastrophe classes 4-6 are shown here. Emerging economies are those countries whose
inhabitants have a “middle” per-capita income on average. According to the World Bank, middle income is between US$ 1,036 and US$ 12,615
(based on 2012 figures). Countries with lower average income are referred to as developing economies here, and countries with higher income
as industrialised economies; source: Munich Re NatCat SERVICE, Economic Research

15
Example: Hurricane Gustav caused higher absolute damage in the USA,
but lower relative damage than in Jamaica. This is explained, in part, by the countries’
respective absolute economic strength and economic level of development
*) In original values, **) In 2005 values and purchasing power parity; source: Global Insight, “Tropical Cyclone Report: Hurricane Gustav” from the National Hurricane Center; Munich Re Geo Risks Research, Economic Research; Source of photos: Dpa / Picture Alliance
US$ 4.3bn
0.03 %
11
Overall losses*
Overall losses
(relative to GDP)
Fatalities
US$ 14,292bn GDP 2008*
US$ 43,161 GDP per capita
2008**
USA
US$ 0.21bn
1.5%
15
Overall losses*
Overall losses
(relative to GDP)
Fatalities
US$ 14bn GDP 2008*
US$ 7,437 GDP per capita
2008**
Jamaica

The overall economic effect results from both the direct
and the indirect effects
16
Economic effects of natural catastrophes
Overall effect
Direct losses
Direct consequences of the
forces of nature
Usually not directly evident from
the development of GDP*
Personal injury
Direct economic losses, e.g.
damage to capital assets and
resources
Indirect effects = “positive” + negative indirect effects
All effects not caused directly by the natural catastrophe
but by the resultant direct losses
Indirect effects are usually changes in GDP compared
with the hypothetical development of GDP in the
absence of a natural catastrophe
“Positive” indirect effects,
e.g. through
Reconstruction stimulus
“Prosperity incentives”, e.g.
construction of new, better-
quality houses
“Creative destruction”, e.g.
the destruction fosters
innovation; new production
facilities are more modern
than those destroyed
*) Exemptions are droughts and heat waves which directly impair GDP
Source: Munich Re Economic Research
Negative indirect effects,
e.g. through
Loss of production due to
destroyed installations
Degradation of human
capital
Damaged and destroyed
infrastructure
Often higher inflation
Frequently, an increase in
government debt
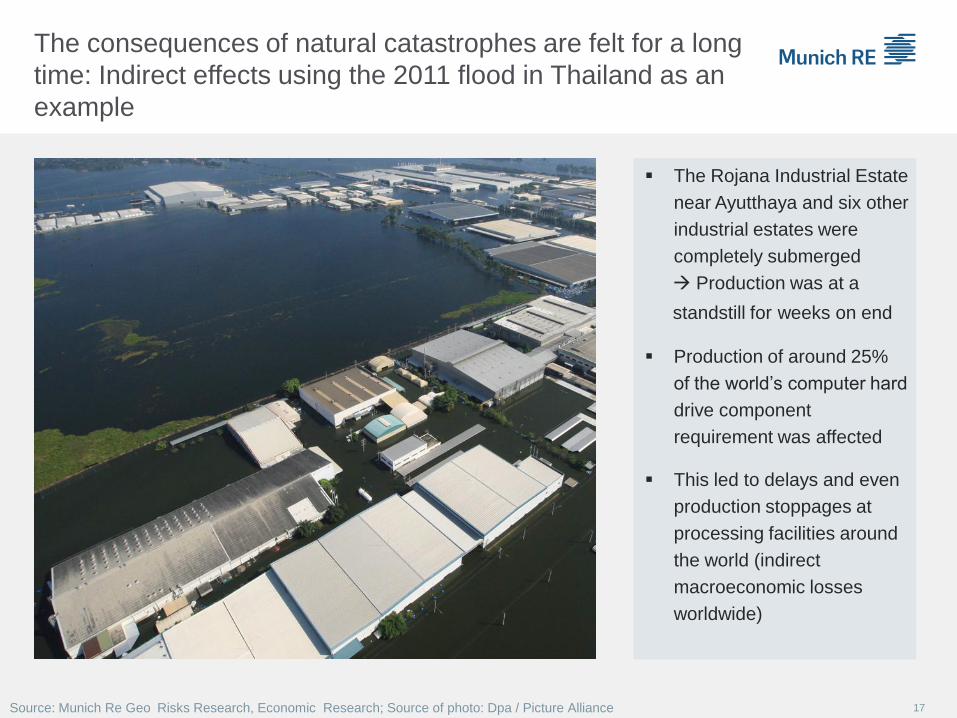
The Rojana Industrial Estate
near Ayutthaya and six other
industrial estates were
completely submerged
Production was at a
standstill for weeks on end
Production of around 25%
of the world’s computer hard
drive component
requirement was affected
This led to delays and even
production stoppages at
processing facilities around
the world (indirect
macroeconomic losses
worldwide)
The consequences of natural catastrophes are felt for a long
time: Indirect effects using the 2011 flood in Thailand as an
example
Source: Munich Re Geo Risks Research, Economic Research; Source of photo: Dpa / Picture Alliance 17

As a consequence of the 2011 earthquake and tsunami in Japan, there were production stoppages
and supply interruptions for many Japanese and foreign firms
The automobile industry was particularly impacted; Toyota, for example, had to close all 12 of its
Japanese plants temporarily. As a result, automobile exports, e.g. to the USA, collapsed
The 2011 earthquake and tsunami in Japan also led
to production stoppages
18
Example of a negative indirect effect: Lost production
Source: Munich Re Economic Research, Reuters; Source of figure: Leckcivilize, A. (2012): The Impact of Supply Chain Disruptions: Evidence from the Japanese Tsunami.
Earthquake and tsunami (March-June 2011)
Car parts and components
Passenger vehicles
Ex
po
rts
(tu
rno
ve
r) t
o t
he
US
A
(in
de
x:
Ja
nu
ary
20
09
= 1
00
)
Exports declined
by more than half

19 Source: Munich Re Economic Research, IMF
In emerging economies, government debt often rises
significantly following natural catastrophes – example Chile
- 40
- 20
0
20
40
60
80
0
2000
4000
6000
8000
10000
12000
14000
16000
2001 2002 2003 2004 2005 2006 2007 2008 2009 2010 2011 2012
Government debt (left axis))
Growth rate of government debt (right axis)
Government debt Chile
in bn pesos
Start of 2010:
Earthquake in Chile

The overall economic effect results from both the direct
and the indirect effects
20
Economic effects of natural catastrophes
Overall effect
Direct losses
Direct consequences of the
forces of nature
Usually not directly evident from
the development of GDP*
Personal injury
Direct economic losses, e.g.
damage to capital assets and
resources
Indirect effects = “positive” + negative indirect effects
All effects not caused directly by the natural catastrophe
but by the resultant direct losses
Indirect effects are usually changes in GDP compared
with the hypothetical development of GDP in the
absence of a natural catastrophe
“Positive” indirect effects,
e.g. through
Reconstruction stimulus
“Prosperity incentives”, e.g.
construction of new, better-
quality houses
“Creative destruction”, e.g.
the destruction fosters
innovation; new production
facilities are more modern
than those destroyed
*) Exemptions are droughts and heat waves which directly impair GDP
Source: Munich Re Economic Research
Negative indirect effects,
e.g. through
Loss of production due to
destroyed installations
Degradation of human
capital
Damaged and destroyed
infrastructure
Often higher inflation
Frequently, an increase in
government debt

21
GDP
level
Time Occurrence of
catastrophe
GDP losses in the wake
of the catastrophe (=indirect
negative effects)
Hypothetical GDP growth
without catastrophe
Actual GDP growth
Rise in GDP due to
the stimulus from
reconstruction
(= indirect positive effects)
End of
reconstruction
Several years
Indirect effects over time: Typical GDP growth after a
natural catastrophe
Illustration: Indirect effects of an average* natural catastrophe in the short and medium term
(up to five years)
*) Relative to average direct losses as a percentage of GDP
Source: Graph based on Hallegatte S. et al. (2010):The Economics of Natural Disasters, Munich Re Economic Research
22
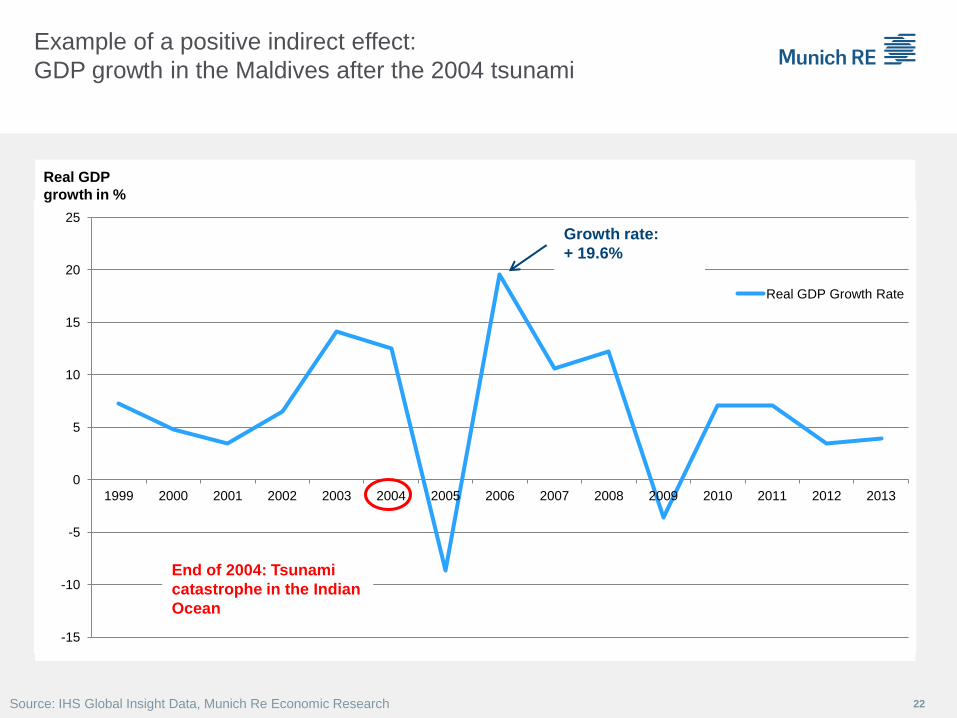
Example of a positive indirect effect:
GDP growth in the Maldives after the 2004 tsunami
-15
-10
-5
0
5
10
15
20
25
1999 2000 2001 2002 2003 2004 2005 2006 2007 2008 2009 2010 2011 2012 2013
Real GDP Growth Rate
Growth rate:
+ 19.6%
End of 2004: Tsunami
catastrophe in the Indian
Ocean
Source: IHS Global Insight Data, Munich Re Economic Research
Real GDP
growth in %

Example: The indirect effects of Hurricane Katrina in Louisiana
Example: Despite the financial crisis that began in 2008,
GDP in Louisiana started growing again soon after Hurricane Katrina
23 Sources: Federal Reserve Economic Data, Munich Re Economic Research
Hurricane
Katrina
-8
-6
-4
-2
0
2
4
6
8
10
2001 2002 2003 2004 2005 2006 2007 2008 2009 2010 2011
Real G
DP
gro
wth
(in
per
cen
t)
Louisiana USA Differenz
% Louisiana grows faster than
the USA as a whole
(probably the result of
reconstruction)
Louisiana grows more slowly
than the USA as a whole
High level of development and interregional interconnection can mitigate negative GDP effects

The overall effect depends on the time horizon under review
24
Source: Munich Re Economic Research
Indirect effects
Short- and medium-term effects (up to 5 years) Long-term effects (over 5 years)
Direct effects +
GDP growth is negatively impacted in the short and medium term by a natural catastrophe
The GDP level declines in the short to medium term compared with the hypothetical trend without
the natural catastrophe
The GDP level also remains below the long-term hypothetical trend without the natural
catastrophe, except if the natural catastrophe increases long-term growth (based on the status of
research as of today, this is rather “unlikely”)
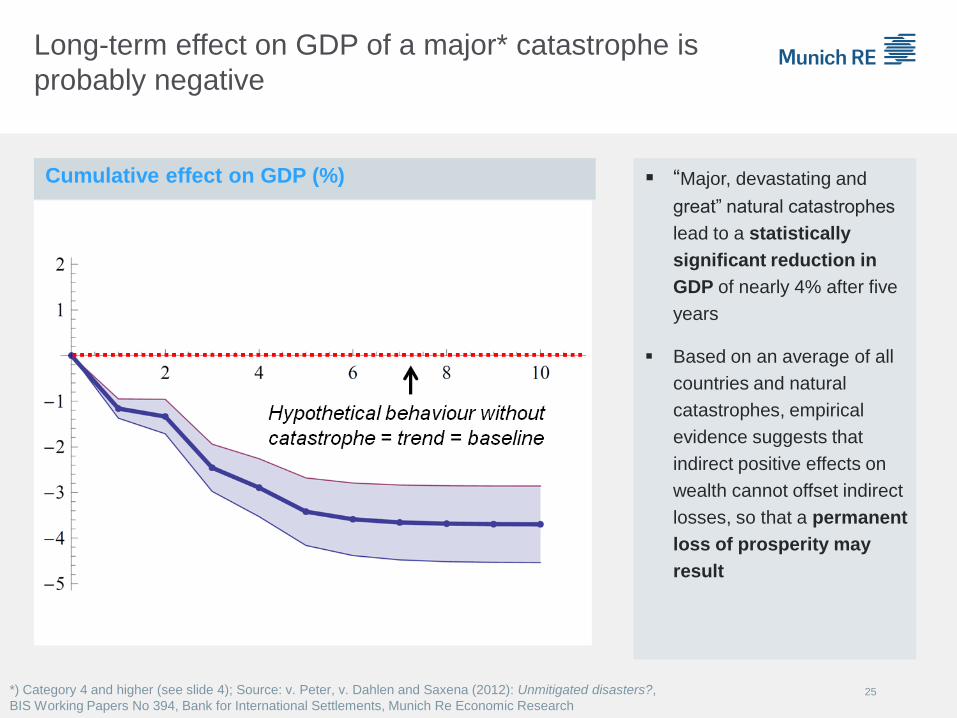
“Major, devastating and
great” natural catastrophes
lead to a statistically
significant reduction in
GDP of nearly 4% after five
years
Based on an average of all
countries and natural
catastrophes, empirical
evidence suggests that
indirect positive effects on
wealth cannot offset indirect
losses, so that a permanent
loss of prosperity may
result
Cumulative effect on GDP (%)
25
Long-term effect on GDP of a major* catastrophe is
probably negative
*) Category 4 and higher (see slide 4); Source: v. Peter, v. Dahlen and Saxena (2012): Unmitigated disasters?,
BIS Working Papers No 394, Bank for International Settlements, Munich Re Economic Research

26
Insurance cover significantly helps economic recovery
following a natural catastrophe
GDP
level
Time Occurrence of
catastrophe
Hypothetical GDP trend
without the disaster
GDP growth in countries
with low insurance
penetration
End of
reconstruction
Several years
GDP growth in countries
with high insurance
penetration
Increase in GDP from the
economic stimulus of
reconstruction (= indirect
positive effects)
GDP losses following the
catastrophe (= indirect
negative effects)
Illustration of indirect effects of an average* natural catastrophe in the short and medium term
*) Relative to average direct losses as a percentage of GDP
Source: Munich Re Economic Research; graph based on Hallegatte S. et al. (2010): The Economics of Natural Disasters.
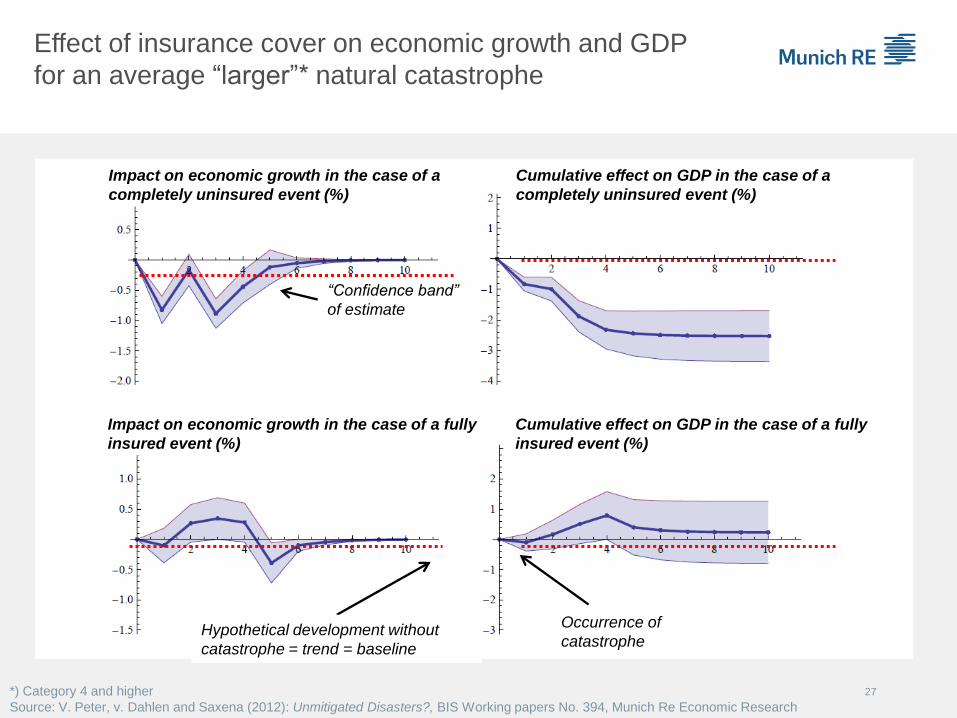
Impact on economic growth in the case of a
completely uninsured event (%)
Cumulative effect on GDP in the case of a
completely uninsured event (%)
Impact on economic growth in the case of a fully
insured event (%)
Cumulative effect on GDP in the case of a fully
insured event (%)
“Confidence band”
of estimate
Hypothetical development without
catastrophe = trend = baseline
Occurrence of
catastrophe
27
Effect of insurance cover on economic growth and GDP
for an average “larger”* natural catastrophe
*) Category 4 and higher
Source: V. Peter, v. Dahlen and Saxena (2012): Unmitigated Disasters?, BIS Working papers No. 394, Munich Re Economic Research

Development of per-capita debt at different levels of insurance penetration
Low insurance penetration (left) leads to a statistically significant rise in government debt
The insurance penetration of a country has a considerable
influence on its government debt following natural
catastrophes
28
Source: Source: Melecky und Raddatz (2011): How Do Governments Respond after
Catastrophes? World Bank, Munich Re Economic Research
Per-capita debt with low insurance
penetration Per-capita debt with high insurance
penetration
Years after
climatic
catastrophe
“Confidence band”
for estimate
30%
20%
10%
0%
50%
0%
- 50%
- 100% Hypothetical development without
the catastrophe = trend = baseline
29
Source: Munich Re Economic Research; Englmaier and Stowasser (2013): The Effect of
Insurance Markets on Countries’ Resilience to Disasters, Mimeo, University of Würzburg/LMU.
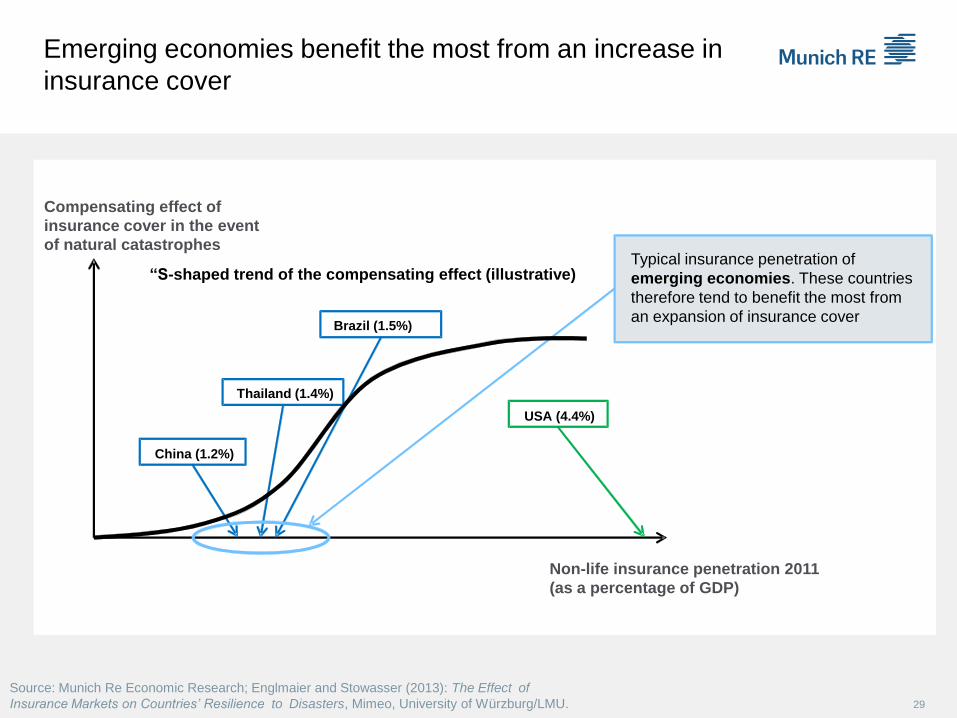
Emerging economies benefit the most from an increase in
insurance cover
Compensating effect of
insurance cover in the event
of natural catastrophes
China (1.2%)
Thailand (1.4%)
Brazil (1.5%)
USA (4.4%)
Non-life insurance penetration 2011
(as a percentage of GDP)
Typical insurance penetration of
emerging economies. These countries
therefore tend to benefit the most from
an expansion of insurance cover
“S-shaped trend of the compensating effect (illustrative)

The Social and Economic Value of Insurance
Value of insurance for economy and society: obvious, but often
misunderstood
Natural catastrophes: Economic consequences and the role of
insurance
Too important to fail? The systemic risk debate and insurance
30

The “AIG case” – sound insurance business, but problems
caused by FP division led to massive public attention
31
Source: Munich Re Economic Research

“SIFIs” (systemically important financial institutions) –
definition according to Financial Stability Board
SIFIs are “…those institutions
whose disorderly failure, because of their
size, complexity and systemic interconnectedness,
would cause significant disruption
to the wider financial system
and economic activity.”
Later lack of substitutability was added as indicator. (FSB)
32
Source: Financial Stability Board, Munich Re Economic Research

G-SIBs – The systemically relevant banks 2013
33
Source: Financial Stability Board, Munich Re Economic Research

Insurers and banks - differences in business models
important for systemic risk discussion
Economic function of banks
Essential for payment, clearing and settlement
Saving deposits of public always with at least “implicit government
guarantee”
Different economic role of insurers
No comparable interconnectedness (no “inter-banking market”
needed for financing)
Traditional insurance activities have an inverted cycle of
production (pre-funding of liabilities)
Payments depend on occurrence of “insured event”
No risk of “bank-run” on insurers 34
Source: Munich Re Economic Research
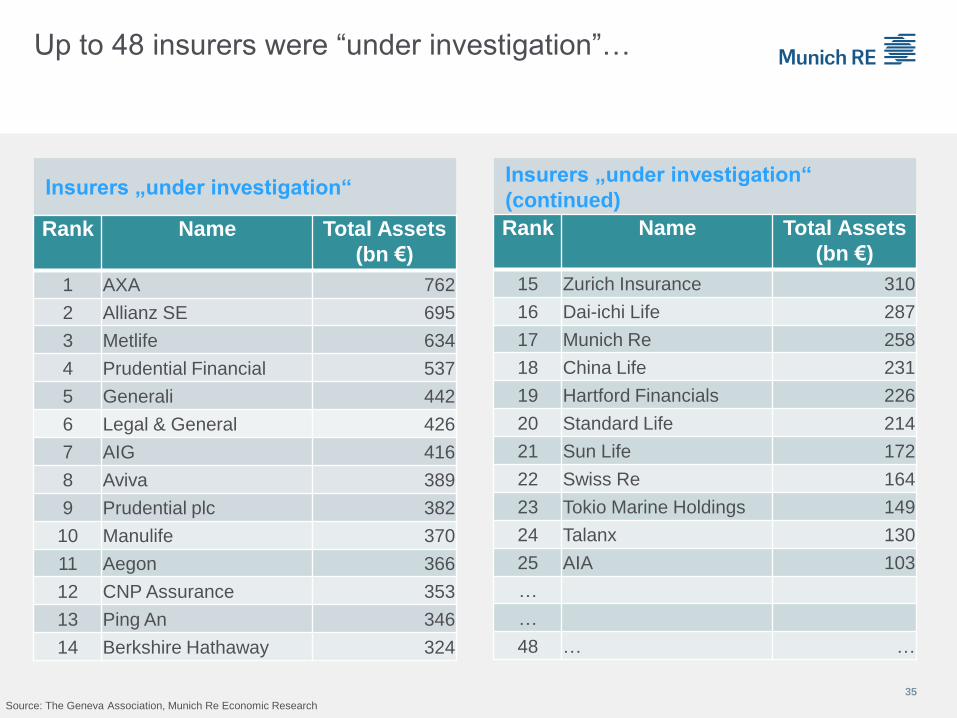
Up to 48 insurers were “under investigation”…
35
Insurers „under investigation“ Insurers „under investigation“
(continued)
Rank Name Total Assets
(bn €)
1 AXA 762
2 Allianz SE 695
3 Metlife 634
4 Prudential Financial 537
5 Generali 442
6 Legal & General 426
7 AIG 416
8 Aviva 389
9 Prudential plc 382
10 Manulife 370
11 Aegon 366
12 CNP Assurance 353
13 Ping An 346
14 Berkshire Hathaway 324
Rank Name Total Assets
(bn €)
15 Zurich Insurance 310
16 Dai-ichi Life 287
17 Munich Re 258
18 China Life 231
19 Hartford Financials 226
20 Standard Life 214
21 Sun Life 172
22 Swiss Re 164
23 Tokio Marine Holdings 149
24 Talanx 130
25 AIA 103
…
…
48 … …
Source: The Geneva Association, Munich Re Economic Research
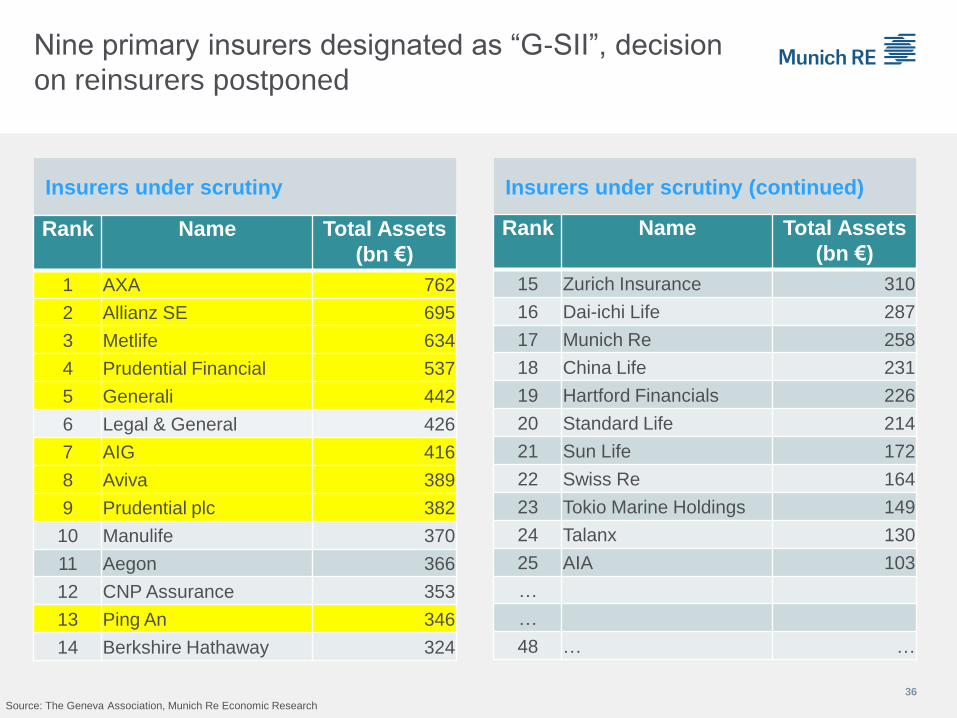
Nine primary insurers designated as “G-SII”, decision
on reinsurers postponed
36
Insurers under scrutiny Insurers under scrutiny (continued)
Rank Name Total Assets
(bn €)
1 AXA 762
2 Allianz SE 695
3 Metlife 634
4 Prudential Financial 537
5 Generali 442
6 Legal & General 426
7 AIG 416
8 Aviva 389
9 Prudential plc 382
10 Manulife 370
11 Aegon 366
12 CNP Assurance 353
13 Ping An 346
14 Berkshire Hathaway 324
Rank Name Total Assets
(bn €)
15 Zurich Insurance 310
16 Dai-ichi Life 287
17 Munich Re 258
18 China Life 231
19 Hartford Financials 226
20 Standard Life 214
21 Sun Life 172
22 Swiss Re 164
23 Tokio Marine Holdings 149
24 Talanx 130
25 AIA 103
…
…
48 … …
Source: The Geneva Association, Munich Re Economic Research
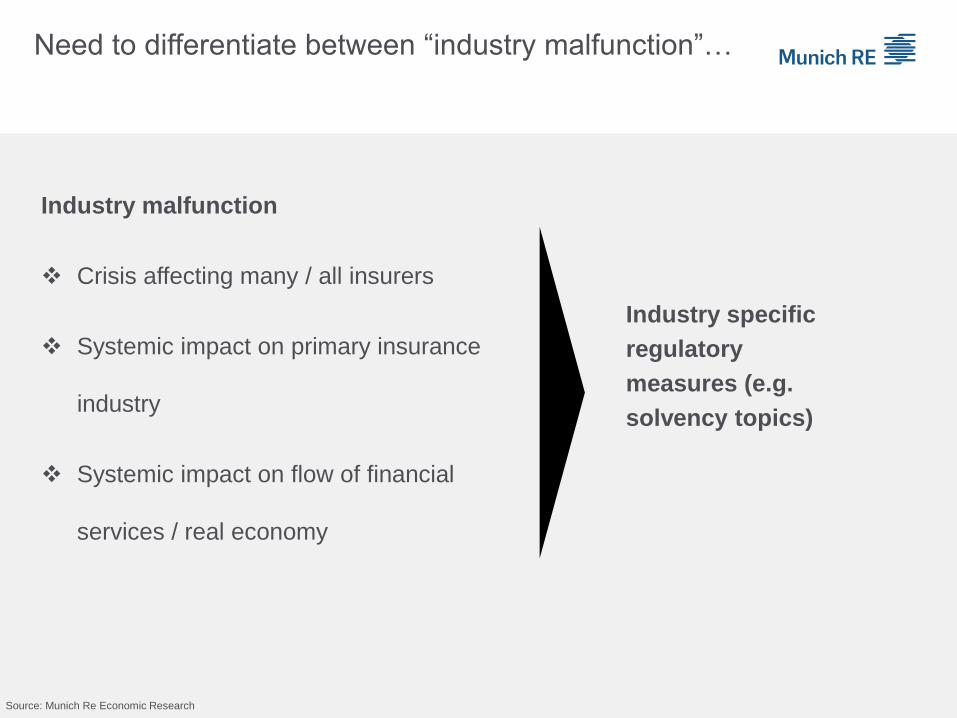
Need to differentiate between “industry malfunction”…
Industry specific
regulatory
measures (e.g.
solvency topics)
Industry malfunction
Crisis affecting many / all insurers
Systemic impact on primary insurance
industry
Systemic impact on flow of financial
services / real economy
Source: Munich Re Economic Research
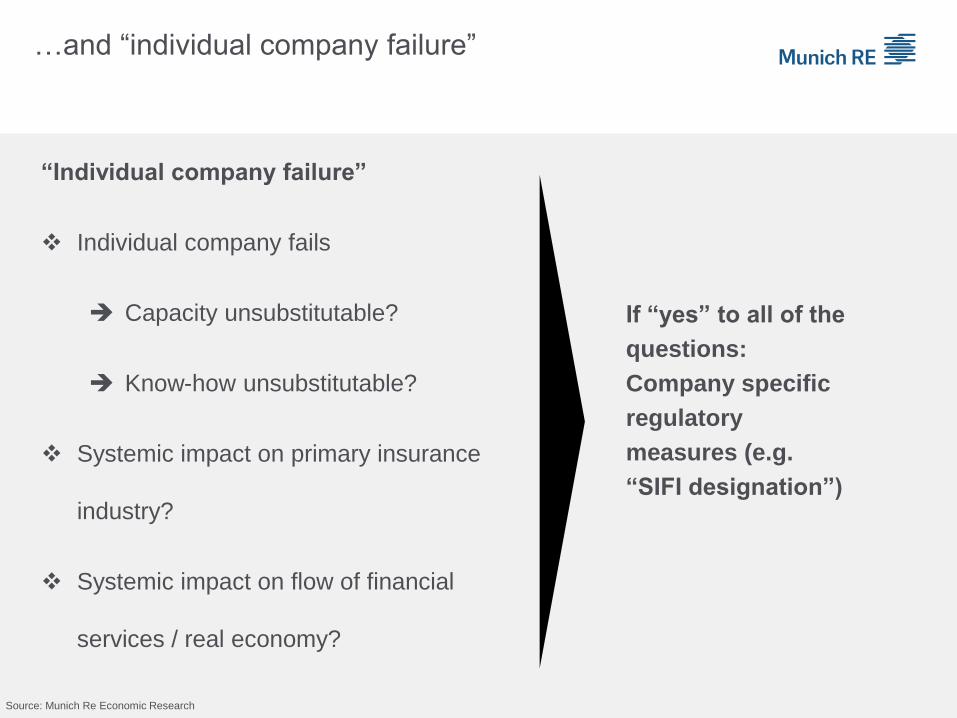
…and “individual company failure”
If “yes” to all of the
questions:
Company specific
regulatory
measures (e.g.
“SIFI designation”)
“Individual company failure”
Individual company fails
Capacity unsubstitutable?
Know-how unsubstitutable?
Systemic impact on primary insurance
industry?
Systemic impact on flow of financial
services / real economy?
Source: Munich Re Economic Research

Summary: The social and economic value of insurance
39
Source: Munich Re Economic Research
• The insurance industry is of utmost importance for the
functioning of any economy
• However, this does not imply systemic relevance of
individual insurance companies
1
• Insurance coverage is key for economic recovery after
natural catastrophes
• Especially emerging market economies would benefit from
increasing insurance penetration
2
• The social and economic value of insurance is obvious, but
often misunderstood
• Having, communicating and living values will be key 3