arsenic uptake by trees at a highly contaminated siteavangeen/publications/docum… · ·...
TRANSCRIPT

1
Arsenic Uptake by Trees at a Highly Contaminated Site
Zhongqi Cheng1, Brendan M. Buckley1, Beth Katz1, William Wright1, Richard Bailey2, Kevin T. Smith3, Alexander van Geen1
1. Lamont Doherty Earth Observatory of Columbia University, 61 Rt. 9W, Palisades, NY 10964 2. Sevensons Environmental Services, Vineland, NJ 08360 3. USDA Forest Service, Northeastern Research Station, Durham, NH 03824
Corresponding Author
Zhongqi Cheng, Ph.D. Lamont Doherty Earth Observatory of Columbia University
206 New Core Lab 61 Route 9W, Palisades, NY 10964
Phone: (845) 365-8649 Fax: (845) 365-8154
Email: [email protected]
Submitted to Environmental Science and Technology, July 27th 2005

2
Abstract
Arsenic concentrations were measured in annual rings, pith, bark, and leaves of four tree
species from a site highly contaminated with As in Vineland, New Jersey, and two nearby
uncontaminated areas. The highest As concentrations were measured in bark (0.88±1.10
mg/kg, n=10) and leaves (1.3±1.6 mg/kg, n=3) from the contaminated area. Arsenic
levels in tree-rings from the contaminated area (0.30±0.20 mg/kg, n=20) were low but
still considerably higher than in tree-rings from the control areas (0.06±0.06 mg/kg,
n=28). Comparison of radial profiles of tree-ring width from the contaminated site and
control areas suggests that As uptake had no impact on tree growth. Concentrations of P,
a chemical analog for As(V) in aerated soils, were similar in tree rings from the
contaminated site and the control areas. Detailed profiles of tree-ring chemistry for a
pine and an oak from the contaminated site show that conversion from sapwood to
heartwood resulted in a large reduction in P concentrations, whereas As concentrations
remained elevated. Elevated As concentrations in rings formed before the onset of
contamination indicate that the pine and oak trees are not suitable archives for
reconstructing the history of contamination of a site by As.
Keywords: Arsenic, tree ring, radial profile, dendrochemistry

3
Introduction
The behavior and fate of As in the environment has received increasing attention in
recent years because of the serious threat to human health posed by this metalloid. As an
aid to the management of contaminated sites, dated river and lake sediment cores have
widely been used as archives of past inputs of contaminants including As (1-3). But this
approach is not suitable to soils where datable material is typically not available and the
level of contamination can be spatially heterogeneous. Furthermore, As contamination
records in sediments are susceptible to post-depositional distribution that is unrelated to
the input history (4-6). The present study explores the use of tree-rings as an alternative
approach for reconstructing the history of As input, using a Superfund site in the United
States that is particularly contaminated as a test case.
Dendrochemistry, the analysis of the chemical composition of the datable, annual growth
rings of trees, has been proposed as a method to explore the chronology and spreading of
toxic elements, as well as their effect on organisms (7). The idea has been tested for
different tree species and several contaminants such Pb, Cd, and Ni, with mixed results
(7-12). Progress has been hampered by the lack of sufficient understanding of the
behavior of such contaminants in the rhizosphere, their uptake by woody plants, and
subsequent storage in woody tissue. A key issue from the perspective of historical
reconstruction is the possibility of translocation of contaminants across tree rings. The
difficulty of dendrochemical studies for As has been further compounded by the
inadequate sensitivity of various analytical methods for tree-ring samples which are

4
relatively small (13,14). One previous study comparing two orchards, one of which had
been treated with arsenical pesticides and the other not, showed no detectable difference
in the As content of tree-rings from the two sites, whereas As concentrations in bark and
pith samples from the treated site were clearly elevated (15).
Live trees from the Vineland Chemical Superfund site in New Jersey, with a known
history of As contamination, provided the opportunity to determine whether the As
content of tree-rings can be used to reconstruct past contamination. Production of
arsenical pesticides at the site lasted over 4 decades (1950-1994) and included both
inorganic and organo-arsenicals. Before 1977 the company stored by-product arsenic
salts in open piles and chicken coops, which resulted in extensive contamination of soils,
groundwater, the nearby Maurice River, and Union Lake further downstream (16). A
small wastewater treatment system was installed in 1982, but it was not until 1999 that a
massive groundwater pump-and-treat operation was initiated. Excavation and cleanup of
an estimated 268,000 tons of contaminated soil started in 2003 when tree samples were
collected for this study.
The As content of various tree issues in post oak (Quercus stellata), white oak (Quercus
alba), pitch pine (Pinus rigida), Eastern red cedar (Juniperus virginiana), and pignut
hickory (Carya glabra) growing on soil containing 20-1000 mg/kg As was measured.
Results are compared to trees of the same species growing in two nearby uncontaminated
control areas. High-resolution inductively coupled plasma mass spectrometry (HR ICP-
MS) provided the analytical sensitivity required to measure the As content of single tree-

5
ring samples and to generate complementary data for the nutrient elements P and K. This
allowed us to compare the uptake and distribution of P with As(V), its chemical analog in
aerobic soils.
Methods
A total of 17 live trees (numbered 1-18) were sampled at the Superfund site (Fig. 1).
Within this group, trees 7, 13, 15-18 were located outside contaminated soil zones
outlined for treatment by mitigation personnel, whereas the remaining trees were located
within these zones (Table 1 and Fig. 1). A total of 14 live trees were sampled in two
uncontaminated control areas. Trees numbered 19-24 were sampled near Arbor Lake,
about 3 km upstream of the contaminated site. Trees 25-31 were collected only 100 m
from the western boundary of the Superfund site, on the other side of Mill Road (Fig. 1).
Most tree samples were collected as increment cores, obtained from roughly breast height
using a Hagloff Swedish increment corer that removes a 5.15 mm dowel of stem tissue
along the radial axis of a tree. The cores were placed in clear plastic straws in the field,
sealed, and taken to the Tree-Ring Laboratory at Lamont-Doherty Earth Observatory for
analysis. The cores were air dried for 1-3 days, mounted in wooden core mounts with
water-based glue, and polished with progressively finer sandpaper up to 600-grit in order
to expose the anatomical structure of the wood for identification of annual ring
boundaries (17,18). Because few tree-ring data are available for this specific area, the
ring widths of trees from the control site were used to establish a cross-dated ring width

6
chronology, following standard methods in dendrochronology (17-19). This absolutely
dated time series of annual ring width was used for comparison with the growth patterns
of trees from the contaminated areas. We examined the accuracy of our cross-dated tree
ring width time series using the quality control program COFECHA (20). After
confirming that the cores were cross-dated correctly, we developed an average ring-width
chronology to compare with the contaminated trees, the rings of which were counted,
measured, dated, and scanned.
The individual rings or, depending on samples size, groups of rings spanning up to 3
years, of two cores from the contaminated area were analyzed in their entirety. The cores
were dissected with a stainless-steel surgical scalpel, taking care to remove all glue
residues. The first core was collected from a pine tree (13), on the bank of a small stream
along the northern margin of the generally contaminated area (Fig. 1). The second core
(14) was obtained from an oak tree that had been removed from a highly-contaminated
soil area only a few weeks earlier (Fig. 1). The bark from this tree was also divided into
five sub-samples for chemical analysis from the vascular cambium to the outer bark
surface. For all other trees, only the bark, outer ring(s), inner ring(s), and the pith were
analyzed. In addition to woody tissue samples, leaves were collected from different tree
species within the contaminated area, each in triplicate from the same branch. The leaves
were rinsed with purified water (>18 MΏ) to wash off dust particles that might contain
high levels of As.

7
The wood and leaf samples were dried further in an oven for 24 hours at approximately
60 ˚C. Wood and leaf samples (0.02-0.15 g dry weight) were placed in acid-cleaned 7-ml
Teflon vessels, followed by the addition of 1.0 ml of high purity HNO3 (Optima, Fisher).
The vessels were tightly capped and left on a hotplate at approximately 150 ˚C for
overnight digestion. Upon complete dissolution, ~0.5 ml of high purity 30% H2O2 (J.T.
Baker) was added to each sample and the combined solution was slowly evaporated at
~70-80 ˚C while the organic fragments were decomposing. The HNO3-H2O2 digestion
procedure was repeated when necessary. After digestion and complete evaporation, 0.5
ml of 10% HNO3 was added to the warm vessel. The solution was transferred to 0.5 ml
tubes and centrifuged at 3000 rpm for 10 min to separate any minor insoluble residue.
An aliquot of the supernatant (0.2 ml) was diluted with 1.8 ml of an internal calibration
solution containing 250 µg/L Ge.
Arsenic concentrations in the digest solutions were measured on a magnetic sector HR
ICP-MS (21). The use of Ge as an internal calibration element corrects for the reduction
in nebulization flow that is typically observed for organic digests. Arsenic data were
acquired at high mass resolution (~10K) to eliminate possible polyatomic interference
from ArCl. Standard reference material produced from tomato leaf (SRM 1573a,
National Institute of Standards Technology) was analyzed with each batch of samples. A
total of 9 measurements of this standard gave an average value of 110±15 (±13%) mg/kg,
which agrees well with the reference value of 112±4 mg/kg. Three blanks were included
with each batch of analyses. The average procedural blank was 50±30 ng (n=9). The

8
effective detection limit of the method for wood samples was ~0.01 mg/kg, estimated by
tripling the standard deviation of the blank measurements.
Results
Arsenic Concentrations in Tree Rings and Other Tissues. Concentrations of As are
very low in most woody tissue samples (Table 1). At the contaminated site, for instance,
As concentrations in tree rings range from 0.08-0.99 mg/kg, several orders of magnitude
below the As content of surrounding soils (20-1000 mg/kg). Concentrations of As are
higher in bark and leaves from the contaminated area, but still <4 mg/kg (Table 1). Trees
from the contaminated area are significantly enriched in As compared to trees in the
control areas, however (Fig. 2). Arsenic concentrations in the bark, outer ring(s), and
inner ring(s) of 11 trees from the most contaminated area average 0.9+1.1, 0.2+0.2, and
0.5+0.4 mg/kg, respectively. The As content of bark, outer ring(s), and inner ring(s) of
14 trees from the control areas is 0.04+0.02, 0.08+0.08, and 0.04+0.02 mg/kg,
respectively. Trees from locations adjacent to the contaminated soil zones (samples #7,
#13, #15-18) have variable As levels, with averages of 0.4±0.4, 0.2±0.1, and
0.2±0.1mg/kg for bark, outer rings, and inner rings, respectively (Fig. 1 and Table 1).
There is considerable variability in As concentrations among individual trees of the same
species and within different parts of the trees collected from the contaminated zone. The
level of variability obscures any potential systematic differences in As uptake between
oak, cedar, hickory, and pine (Table 1). The differences in As concentration within the
9
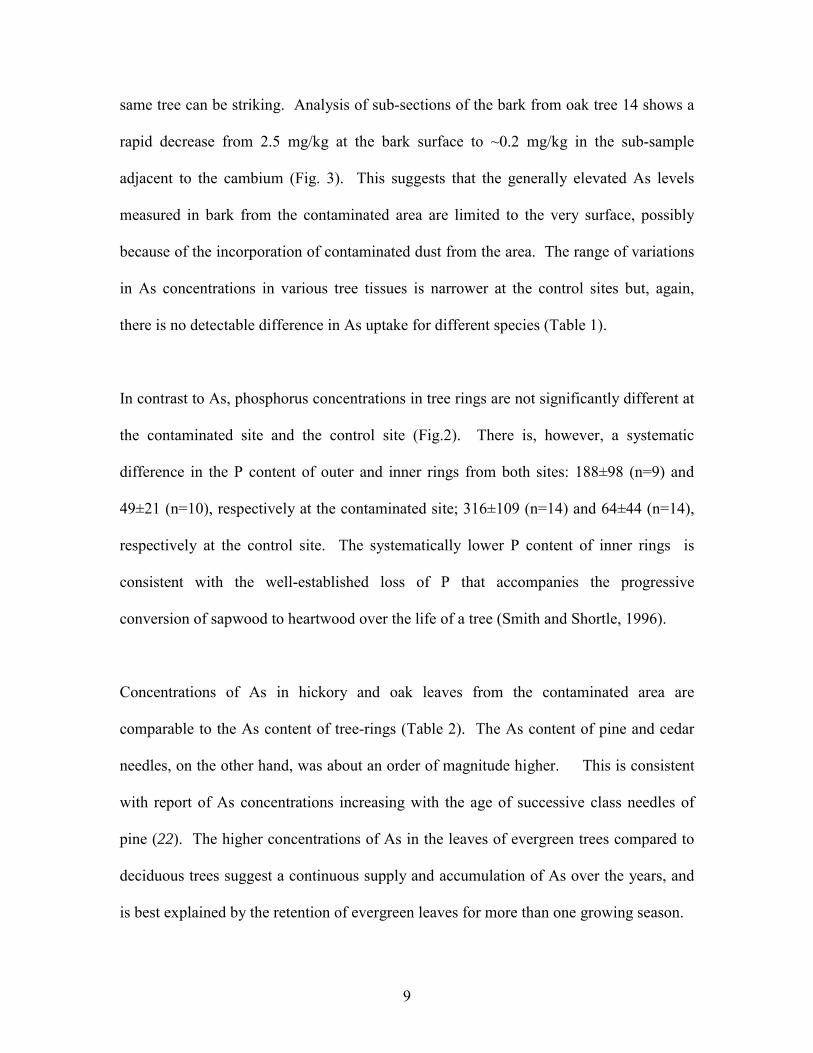
same tree can be striking. Analysis of sub-sections of the bark from oak tree 14 shows a
rapid decrease from 2.5 mg/kg at the bark surface to ~0.2 mg/kg in the sub-sample
adjacent to the cambium (Fig. 3). This suggests that the generally elevated As levels
measured in bark from the contaminated area are limited to the very surface, possibly
because of the incorporation of contaminated dust from the area. The range of variations
in As concentrations in various tree tissues is narrower at the control sites but, again,
there is no detectable difference in As uptake for different species (Table 1).
In contrast to As, phosphorus concentrations in tree rings are not significantly different at
the contaminated site and the control site (Fig.2). There is, however, a systematic
difference in the P content of outer and inner rings from both sites: 188±98 (n=9) and
49±21 (n=10), respectively at the contaminated site; 316±109 (n=14) and 64±44 (n=14),
respectively at the control site. The systematically lower P content of inner rings is
consistent with the well-established loss of P that accompanies the progressive
conversion of sapwood to heartwood over the life of a tree (Smith and Shortle, 1996).
Concentrations of As in hickory and oak leaves from the contaminated area are
comparable to the As content of tree-rings (Table 2). The As content of pine and cedar
needles, on the other hand, was about an order of magnitude higher. This is consistent
with report of As concentrations increasing with the age of successive class needles of
pine (22). The higher concentrations of As in the leaves of evergreen trees compared to
deciduous trees suggest a continuous supply and accumulation of As over the years, and
is best explained by the retention of evergreen leaves for more than one growing season.

10
Radial Concentration Profiles of As and P.
Pine. Sapwood, differentiated from heartwood by color, contains ~60 annual
rings and extends over two-thirds of the stem radius in the core from pine 13 (Fig. 4).
The growth pattern of this tree is nearly identical to the local pine control chronology
established by 5 healthy pines from the uncontaminated area (Fig.1). Concentrations of
As in the entire core span a considerably wider range (0.05-0.75 mg/kg) than the inner
and outer tree rings of the same tree (0.20 and 0.36 mg/kg). Within the sapwood, As
concentrations are systematically higher in narrow rings produced during low-growth
years. When annual storage is calculated on the basis of the As content and the width of
each ring, the effect of higher concentration dominates (Fig. 4). The radial profile shows
that the concentration of P in tree-rings drops dramatically at the independently
determined transition from sapwood to heartwood. Within the sapwood section, narrow
rings containing elevated As concentrations are generally also higher in P. There is no
obvious relationship in the core between As concentrations and the nutrient K in the tree-
rings (Fig. 4).
Oak. There are notable differences between the growth pattern indicated by the
core from tree 14 and the control chronology based on oak trees from Arbor Lake, one of
the control areas (Fig.5). The growth of the control trees was relatively steady, whereas
oak 14 grew more slowly than the controls trees in the 1930’s and faster between 1959
and 1970. Sapwood extends to only 10 tree-rings from the stem radius of this core.
Concentrations of As are relatively low within the larger heartwood section of this core,
with the exception of 8 tree rings closest to the heartwood-sapwood transition. The

11
transition is centered on a broad As peak spanning rings formed from the mid 1980’s to
the mid 1990’s. Unlike the pine core, there is no systematic relation between As
concentrations and tree-ring width (Fig. 5).
Discussion
Uptake of P and As from soil. Soil from the contaminated site and the control areas was
not analyzed for P but, on the basis of other studies, concentrations probably ranged from
10 to 200 mg/kg for soils in the absence of fertilization (23). These levels are
comparable to P concentrations in sapwood (Table 1), which confirms that these trees are
effectively extracting this essential nutrient from soil through their roots (24). In
contrast, As concentrations in sapwood from the contaminated area ranged from 0.1 to
only 0.5 mg/kg, even though As concentrations in the soil of 20-1000 mg/kg were
comparable to the level of P in the soil.
The discrimination against As uptake by several tree species relative to P is striking
because As(V) is believed to be the dominant form of As in aerobic soils and a chemical
analogue of phosphate P(V). It may reflect suppression of the high affinity P(V)/As(V)
uptake system at the root-soil interface, which has a higher affinity for P compared to As
(25,26). Alternatively, the discrimination against As may reflect reduction of As(V) to
As(III) within the tree, which is commonly reported for plants (27-28), and preferential
transport in sapwood of P(V) compared to As(III).

12
Soil from the control areas was not analyzed for As, but concentrations are likely to be at
background level typically ranged from 2-20 mg/kg (23). This indicates that although
considerably less As is taken up from soils compared to P, some degree of proportionality
between the As content of soils and sapwood is maintained over a range of environments,
at least in the case of the four tree species that were studied here (10,29,30). Martin et al.
(15), in contrast, reported that As concentrations in tree rings of a pear tree growing on
contaminated soil did not indicate any enhanced uptake of As.
As contamination and tree growth. The adverse effect of soil contamination with As
on tree growth has been invoked to explain the death of many trees around the Vineland
Superfund site. Some plant species that are not resistant to As indeed suffer considerable
stress upon exposure, with symptoms ranging from inhibition of root growth to death
(31,32). The toxic threshold concentration of As that reduces tree growth is not known,
however, and may be species dependent. It does not appear to have been reached at the
location of pine tree 13. Contamination of the site with As, presumably soon after
manufacturing of arsenicals started in 1950, did not preclude the pine tree from
responding to climatic forcing in the same way in the same way as the control trees (Fig.
4). The growth pattern of oak tree 14 within the contaminated site did not match that of
the controls, but was actually higher than average between 1950 and 1970 suggesting,
again, no adverse effect of As contamination on tree growth (Fig. 5). Natural or induced
flooding is therefore the more likely cause of tree deaths reported in low-lying areas
around and within the Superfund site.

13
Implications for historical reconstruction. Many tree species contain an outer band of
sapwood that surrounds an inner core of heartwood. In coniferous wood with a relatively
simple structure, water movement passes through several annual rings in the outer part of
the stem (7). In the core from pine tree 13, with a particularly wide sapwood section, an
exact chronology of soil contamination with As should therefore not be expected. This
likely explains why elevated As concentrations in this core pre-date the onset of
production of arsenicals in 1950 (Fig. 4). In addition, the multiple peaks observed within
the sapwood section during low growth years are probably not an indication of elevated
soil As levels at the time, but instead a reflection of higher flux of water passing through
the sapwood during dry years (33).
In ring porous wood such as oak, however, the transport of minerals reaches mainly the
current year’s ring (7). Conditions in oak tree 14, with a much narrower sapwood
section, should therefore be more favorable for establishing a chronology of As
contamination. For reasons that are unclear, As concentrations in this core rise
significantly only after 1980, when the improper storage of arsenicals had stopped and
small scale remediation started. We speculate that the pattern could reflect enhanced
mobilization of As during initial remediation activities. However, even the pre-1950
rings of the oak core (0.15±0.07 mg/kg, n=27) are enriched about three-fold compared to
inner rings from all oak trees in the control areas (0.05±0.02 mg/kg, n=14). This suggests
that As may not be transported and stored only with sap flow in the axial direction but
also in radial strands of living cells that cross tree rings (called “rays”), as has been
established for other minerals (7). Such behavior, further complicated by heterogeneities
14
in soil As concentrations, may explain why it may not be possible to accurately
reconstruct the history of contamination by As, and possibly a host of other elements, on
the basis of the chemical composition of dated tree rings.
Acknowledgments
This study was supported by a seeding grant and a summer internship from the Climate
Center at Lamont-Doherty Earth Observatory and Columbia NIEHS Superfund Basic
Research Program grant P42ES10349. We thank Ashley Curtis and Jinbao Li for
assistance with tree sampling, and Neil Pederson for consultation regarding tree growth
and climate relationships for the region. We also thank engineers from Sevensons
Environmental Services and US EPA Region II for their permission and assistance in
collecting samples. The study benefited from discussions with Steven Chillrud and
Martin Stute (LDEO). This is Lamont Doherty Earth Observatory contribution number
XXX.

15
Literature Cited:
1. Forstner, U.; Wittmann, G.T.W. Metal pollution in the aquatic environment, 2nd revision. Springer-Verlag, New York, 1983.
2. Schuck, R.A. An historical record of arsenic contamination in the sediments of
Arrowhead Mountain Lake, Milton, Vermont. Master's theses, University of Vermont, Burlington, 1995.
3. Rice, K.C.; Conko, K.M.; Hornberger, G.M. Anthropogenic Sources of Arsenic
and Copper to Sediments in a Suburban Lake, Northern Virginia. Environ. Sci. Technol. 2002, 36(23), 4962-4967.
4. Linge, K.L.; Oldham, C.E. Arsenic remobilization in a shallow lake; the role of
sediment resuspension. J. Environ. Qual. 2002, 31(3), 822-828.
5. Martin, A.J.; Pedersen, T.F. Seasonal and interannual mobility of arsenic in a lake impacted by metal mining. Environ. Sci. Technol. 2002, 36(7), 1516-1523.
6. Keimowitz, A.R.; Zheng, Y.; Chillurd, S.N.; Mailloux, B.; Jung, H.B.; Stute, M.;
Simpson, H.J. Arsenic redistribution between sediments and water near a highly contaminated source. Environ. Sci. Technol. In review, July 2005.
7. Hagemeyer, J. Monitoring trace metal pollution with tree rings: a critical
assessment. In: Market, B. (eds.), Plants and Biomonitors, 541-562. VCH_Publishers, New York, 1993.
8. Nabais, C.; Freitas, H.; Hagemeyer, J.; Breckle, S.W. Radial distribution of Ni in
stemwood of Quercus ilex L. trees grown on serpentine and sandy loam (umbric leptosol) soils of NE-Portugal. Plant Soil 1996, 183, 181-185.
9. Smith, K.T.; Shortle, W.C. Tree biology and dendrochemistry. In: Dean, J.S.,
Meko, D.M., Swetnam, T.W. (eds.), Tree rings, Environment and Humanity. Radiocarbon 1996, 629-635.
10. Baes, C.F.; McLaughlin, S.B. Trace elements in tree rings: Evidence of recent
and historical air pollution. Science 1984, 224, 494-497.
11. Punshon, T.; Bertsch, P.M.; Lanzirotti, A.; McLeod, K.; Burger, J. Geochemical signature of contaminant sediment remobilization revealed by spatially resolved x-ray microanalysis of annual rings of Salix nigra. Environ. Sci. Technol. 2003, 37, 1766-1774.

16
12. Yakosky, T.M.; Vroblesky, D.A. Element analysis of tree rings in groundwater contamination studies. In: Lewis, T.E. eds., Tree Rings as Indicators of Ecosystem Health, 177-208. CRC press, New York, 1995.
13. Watmough, S.A.; Hutchinson, T.C.; Evans, R.D. The quantitive analysis of the
sugar maple tree rings by laser ablation in conjuction with ICP-MS. J. Environ. Qual. 1998, 27, 1087-1094.
14. Parson, J.G.; Aldrich, M.V.; Gardea-Torresdey, J.L. Environmental and
biological applications of extended x-ray adsorption fine structure (EXAFS) and x-ray adsorption near edge structure (XANES) spectroscopies. Appl. Spectr. Rev. 2002, 37(2),187-222.
15. Martin, R.R.; Tonlin, A.; Marsello, B. Arsenic uptake in orchard trees:
implication for dendroanalysis. Chemosphere 2000, 41, 635-637.
16. http://www.epa.gov/region02/superfund/npl/0200209c.pdf. Accessed July 2005.
17. Stokes, M. A.; Smiley, T. L. An introduction to tree ring dating, University of Chicago Press, Chicago, 1968.
18. Fritts, H. C. Tree rings and climate, Academic Press, London, 1976.
19. Cook, E. R.; Kairiukstis, L. A. Methods of Dendrochronology: Applications in
the Environmental Sciences, Kluwer Academic Publisher, Boston, 1990.
20. Holmes, R.L. Computer-assisted quality control in tree-ring dating and measurement. Tree-Ring Bullet. 1983, 43, 69-78.
21. Cheng, Z.; Zheng, Y.; Mortlock, R.; van Geen, A. Rapid multi-element analysis
of groundwater by high-resolution inductively coupled plasma mass spectrometry. Anal. Bioanal. Chem. 2004, 379, 513-518.
22. Wyttenbach, A.; Bajo, S.; Tobler, L. Arsenic concentrations in successive needle
age classes of Norway spruce (Picea abies [L.] Karst). Fresenius J Anal. Chem. 1996, 354, 668-671.
23. Malcolm S. Handbook of Soil Science, CRC Press, New York, 2000.
24. Bohm, H.L.; McNeal, B.L.; O'Connor, G.A. Soil chemistry, Wiley, New York,
2001.
25. Meharg, A.A.; Macnair, M.R. Suppression of the high-affinity phosphate uptake system – a mechanism of arsenate tolerance in Holcus Lanatus L. J. Exper. Botany 1992, 43, 519-524.

17
26. Meharg, A.A.; Naylor, J.; Macnair, M.R. Phosphorous-nutrition of arsenate tolerant and non-tolerant phenol-types of Velvetgrass. J. Environ. Qual. 1994, 23, 234-238.
27. Mehrag, A.A.; Whitaker, J.H. Arsenic uptake and metabolism in arsenic resistant
and nonresistant plant species. New Phyt. 2002, 154,29-43.
28. Le, X.C. Arsenic speciation in the environment and humans. In: Frankenberger W.T., Jr. Ed., Environmental Chemistry of Arsenic, 95-116. Marcel Dekker, New York, 2002.
29. Bechtel Jacobs Company LLC, Empirical models for the uptake of inorganic
chemicals from soil by plants. US Dept of Energy (Contract DE-AC05-98OR22700, BJC/OR-133), 1998. .
30. Jiang, Q.Q.; Singh, B.R. Effect of different forms and sources of arsenic on crop
yield and arsenic concentration. Water, Air, Soil Pollut. 1994, 74, 321-343.
31. Macnair, M.R.; Cumbes, Q. Evidence that arsenic tolerance in Holcus Lanatus L. is caused by an altered phosphate uptake system. New Phyt. 1987, 107, 387-394.
32. Meharg, A.A.; Macnair, M.R. The mechanisms of arsenate tolerance in
Deschampsia cespitosa (L.) Beauv and Agrostis L. New Phyt. 1991, 119, 291-297.
33. Kozlowski, T.T.; Pallardy, S.G. Physiology of woody plants, Academic Press,
New York, 1997.

18
Table 1. Arsenic and phosphorus concentrations in bark, outer ring(s), and inner ring(s) of four wood species at Vineland, New Jersey.
As concentrations
(mg/kg) P concentrations
(mg/kg) Core # Species
# of rings (±5) Bark Outer
Ring Inner Ring
Outer Ring
Inner Ring
Most contaminated area 01 Oak 70 0.22 - 0.40 - 101 02 Oak 79 0.13 0.25 0.27 256 42 03 Oak 70 - 0.18 - - - 10 Oak 85 0.22 0.46 0.99 187 45 14 Oak 83 2.34 0.22 0.53 361 22 08 Pine 37 0.41 0.13 0.18 170 51 04 Cedar 55 2.75 0.22 0.27 100 57 06 Cedar 35 0.16 0.12 0.36 161 38 09 Cedar 58 0.33 0.20 0.40 292 34 05 Hickory 60 2.07 0.17 0.30 71 38 12 Hickory 82 0.14 0.20 0.14 96 57
Adjacent to most contaminated area 16 Oak 99 0.40 0.10 0.41 307 17 Oak 91 0.21 0.10 0.08 391 24 18 Oak 98 0.18 0.10 0.21 230 29 07 Pine 32 0.17 0.14 0.06 220 29 13 Pine 86 1.10 0.37 0.20 756 37 15 Cedar 60 0.12 0.28 0.08 248 39
Uncontaminated control areas 19 Oak 101 0.03 0.03 0.03 283 16 20 Oak 104 0.04 0.03 0.05 440 172 21 Oak 105 - 0.04 0.03 417 41 21 Oak 105 0.04 0.04 0.05 355 28 22 Oak 102 0.03 0.05 0.07 474 35 23 Oak 105 0.02 0.08 0.06 273 76 24 Oak 97 0.02 0.09 0.06 488 12 30 Oak 57 0.02 0.04 0.04 352 97 31 Oak 50 0.09 0.34 0.03 273 72 25 Pine 83 0.07 0.02 0.02 280 46 26 Pine 62 - 0.04 0.01 121 53 27 Pine 88 0.04 0.12 0.07 234 116 28 Pine 89 0.06 0.09 0.02 229 36 29 Pine 92 0.06 0.12 0.08 205 96

19
Table 2. Arsenic and phosphorus concentrations in pith and leaves of four wood species at Vineland, New Jersey. Leaf data show average and standard deviation of 3 replicates from the same branch. Core # Tree species Site Category Pith As (mg/kg) Leaf As (mg/kg)
04 Cedar Contaminated 0.27 3.14±0.48 08 Pine Contaminated 0.44 - 10 Oak Contaminated - 0.29±0.08 12 Hickory Contaminated 0.32 0.45±0.11 14 Oak Contaminated 0.57 - 07 Pine Nearby 0.59 3.64±1.33 18 Oak Control 1.62 - 24 Oak Control 0.09 -

20
Mill
Ro a
d
N
Blackwater Branch
TreatmentPlant
To Arbor L
ake, ~
3 km
Samples 19-24
13
2526
28
27
2930
15
7
16 18
17
5 6811
1234
1
142
2
910
Contaminated soil zone being treated
Contaminated soil zoneto be treated
Tree sampling sites
Wells
100 m
Figure 1. Sketch map of the Vineland Superfund Site showing the extent of soil contamination and sampling locations (REFERENCE).

21
As
(mg/
kg)
0.0
0.1
0.2
0.3
0.4
0.5
0.6
0.7
outer ringinner ring
Contaminated
P (m
g/kg
)
0
100
200
300
400
Control
Figure 2. Comparison of tree tissue arsenic and phosphorus levels for tree samples collected from contaminated (n=11) and control (n=14) areas.

22
Distance from Cambium (cm)
0.0 0.3 0.6 0.9 1.2 1.5
As
(mg/
kg)
0.0
0.5
1.0
1.5
2.0
2.5
cambium
Figure 3. Arsenic levels in five sub-samples of the bark of Core #14. Note that the As concentration in the inner sub-samples are similar to that in the 2002-2003 rings (i.e., the cambium As level).

23
SapwoodHeartwood
Annu
al S
tora
ge(1
0 m
m2 m
g/kg
)
50
100
150
As
(mg/
kg)
0.2
0.4
0.6
0.8Annual storageAs
Year of Growth
1920 1930 1940 1950 1960 1970 1980 1990 2000
P (m
g/kg
)
300
600
900
1200
K (m
g/kg
)
200
400
600
800
P K
Rin
g W
idth
(mm
)
0
2
4
6 Control ChronologyYear vs Width
Figure 4. Tree-ring width and radial profiles of As, P, and K as function of chronology for pine 13 .

24
SapwoodHeartwood
Annu
al S
tora
ge(1
0 m
m2 m
g/kg
)
50
100
150
As
(mg/
kg)
0.2
0.4
0.6
0.8Annual storageAs
Year of Growth
1920 1930 1940 1950 1960 1970 1980 1990 2000
P (m
g/kg
)
100
200
300
K (m
g/kg
)
300
600
900
1200
1500
1800
P K
Rin
g W
idth
(mm
)
0
1
2
3
4 Control ChronologyWidth
Figure 5. Tree-ring width and radial profiles of As, P, and K as function of chronology of oak 14.