arsenic and selenium - elte
TRANSCRIPT
Tre
11.2 Arsenic and SeleniumJA Plant, Centre for Environmental Policy/Earth Science & Engineering, Imperial College London, London, UKJ Bone and N Voulvoulis, Centre for Environmental Policy, Imperial College London, London, UKDG Kinniburgh and PL Smedley, British Geological Survey, Wallingford, UKFM Fordyce, British Geological Survey, Edinburgh, UKB Klinck, British Geological Survey, Nottingham, UK
ã 2014 Elsevier Ltd. All rights reserved.
This article is a revision of the previous edition article by J.A. Plant, D.G. Kinniburgh, P.L. Smedley, F.M. Fordyce, B.A. Klinck, volume 9, pp. 17–66,© 2003, Elsevier Ltd.
11.2.1 Introduction 1411.2.2 Sampling 1611.2.2.1 Rocks, Soils, and Sediments 1611.2.2.2 Water 1611.2.2.2.1 Techniques 1611.2.2.2.2 Filtered or unfiltered samples 1711.2.2.2.3 Sample preservation and redox stability 1711.2.3 Analytical Methods 1811.2.3.1 Arsenic 1811.2.3.1.1 Total arsenic in aqueous samples 1811.2.3.1.2 Total arsenic in solid samples 1911.2.3.1.3 Arsenic speciation 1911.2.3.2 Selenium 2011.2.3.2.1 Total selenium in aqueous samples 2011.2.3.2.2 Selenium in solid samples 2111.2.3.2.3 Selenium speciation 2111.2.3.3 Quality Control and Standard Reference Materials 2111.2.4 Abundance and Forms of Arsenic in the Natural Environment 2211.2.4.1 Abundance in Rocks, Soils, and Sediments 2211.2.4.2 National and International Standards for Drinking Water 2211.2.4.3 Abundance and Distribution in Natural Waters 2311.2.4.3.1 Atmospheric precipitation 2311.2.4.3.2 River water 2411.2.4.3.3 Lake water 2411.2.4.3.4 Seawater and estuaries 2511.2.4.3.5 Groundwater 2511.2.4.3.6 Sediment pore water 2611.2.4.3.7 Acid mine drainage 2611.2.4.4 Arsenic Species in Natural Waters 2711.2.4.4.1 Inorganic species 2711.2.4.4.2 Organic species 2811.2.4.4.3 Observed speciation in different water types 2811.2.4.5 Microbial Controls 2911.2.5 Pathways and Behavior of Arsenic in the Natural Environment 2911.2.5.1 Release from Primary Minerals 3011.2.5.1.1 Examples of mining-related arsenic problems 3011.2.5.1.2 Modern practice in mine-waste stabilization 3111.2.5.2 Role of Secondary Minerals 3111.2.5.2.1 The importance of arsenic cycling and diagenesis 3111.2.5.2.2 Redox behavior 3111.2.5.3 Adsorption of Arsenic by Oxides and Clays 3211.2.5.4 Arsenic Transport 3311.2.5.5 Impact of Changing Environmental Conditions 3311.2.5.5.1 Release of arsenic at high pH 3311.2.5.5.2 Release of arsenic on reduction 3311.2.5.6 Case Studies 3311.2.5.6.1 The Bengal Basin, Bangladesh, and India 33
atise on Geochemistry 2nd Edition http://dx.doi.org/10.1016/B978-0-08-095975-7.00902-5 13
14 Arsenic and Selenium
11.2.5.6.2 Chaco-Pampean Plain, Argentina 3511.2.5.6.3 Eastern Wisconsin, USA 3711.2.6 Abundance and Forms of Selenium in the Natural Environment 3811.2.6.1 Abundance in Rocks, Soils, and Sediments 3811.2.6.2 National and International Standards in Drinking Water 4011.2.6.3 Abundance and Distribution in Natural Waters 4011.2.6.3.1 Atmospheric precipitation 4111.2.6.3.2 River and lake water 4111.2.6.3.3 Seawater and estuaries 4111.2.6.3.4 Groundwater 4111.2.6.3.5 Sediment pore water 4211.2.6.3.6 Mine drainage 4211.2.6.4 Selenium Species in Water, Sediment, and Soil 4211.2.7 Pathways and Behavior of Selenium in the Natural Environment 4311.2.7.1 Release from Primary Minerals 4311.2.7.2 Adsorption of Selenium by Oxides and Clays 4311.2.7.3 Selenium Transport 4411.2.7.3.1 Global fluxes 4411.2.7.3.2 Selenium fluxes in air 4411.2.7.3.3 Soil–water–plant relationships 4511.2.7.4 Case Studies 4611.2.7.4.1 Kesterson Reservoir, USA 4611.2.7.4.2 Enshi, China 4611.2.7.4.3 Soan-Sakesar Valley, Pakistan 4711.2.7.4.4 Selenium deficiency, China 4811.2.8 Concluding Remarks 48Acknowledgments 49References 49
11.2.1 Introduction
Arsenic (As) and selenium (Se) have become increasingly im-
portant in environmental geochemistry because of their signif-
icance to human health. Their concentrations vary markedly in
the environment, partly in relation to geology and partly as a
result of human activity. Some of the contamination evident
today probably dates back to the first settled civilizations that
used metals.
Arsenic is in Group 15 of the Periodic Table (Table 1) and is
usually described as a metalloid. It has only one isotope, 75As.
It can exist in the�III,�I, 0, III, or V oxidation states (Table 2).
Selenium is in Group 16 of the Periodic Table and although
it has chemical and physical properties intermediate between
metals and nonmetals (Table 1), it is usually described as a
nonmetal. The chemical behavior of selenium has some simi-
larities to that of sulfur. Formally, selenium can exist in the�II,
0, IV, and VI oxidation states (Table 2). Selenium has six
natural stable isotopes, the most important being 78Se and80Se. Although 82Se is generally regarded as a stable isotope,
it is a b-emitter with a very long half-life (1.4 � 1020 years).
Both arsenic and selenium tend to be covalently bonded in all
their compounds.
Arsenic is 47th and selenium 70th in abundance of the 88
naturally occurring elements. Much more has become known
about the distribution and behavior of arsenic and selenium
in the environment since the 1980s because of the increased
application of improved analytical methods such as inductively
coupled plasma-mass spectrometry (ICP-MS), inductively
coupled plasma-atomic emission spectrometry (ICP-AES),
and hydride generation-atomic fluorescence spectrometry
(HG-AFS). These methods can detect the low concentrations of
arsenic and, generally, selenium found in environmental and
biological media accurately, and as a result, arsenic and
selenium are increasingly included in determinand suites during
systematic geochemical mapping and monitoring campaigns
(Plant et al., 2003).
Arsenic is highly toxic and can lead to a wide range of
health problems in humans. Arsenic has become increasingly
important in considering environmental quality because of its
high toxicity (Bodenan et al., 2004) and recent evidence of
severe health impacts at the population level, especially in
Bangladesh. It is carcinogenic, mutagenic, and teratogenic
(National Research Council, 2001). Symptoms of arsenicosis
include skin lesions (melanosis, keratosis) and skin cancer.
Internal cancers, notably bladder and lung cancer, have also
been associated with arsenic poisoning. Other problems in-
clude cardiovascular disease, respiratory problems, and diabe-
tes mellitus. There is no evidence of a beneficial role for arsenic
(IOM (Institute of Medicine), 2001; National Research Coun-
cil, 2001) and it is unclear whether there is any safe dose for
humans. Indeed, the precise nature of the relationship between
arsenic dose and carcinogenic effect at low arsenic concentra-
tions remains a matter of much debate (Clewell et al., 1999;
Smith et al., 2002). It has been shown that normal cells can
become cancerous when treated with inorganic arsenic
(Waalkes et al., 2007). When cancer cells are placed near
normal stem cells, the normal stem cells very rapidly acquire
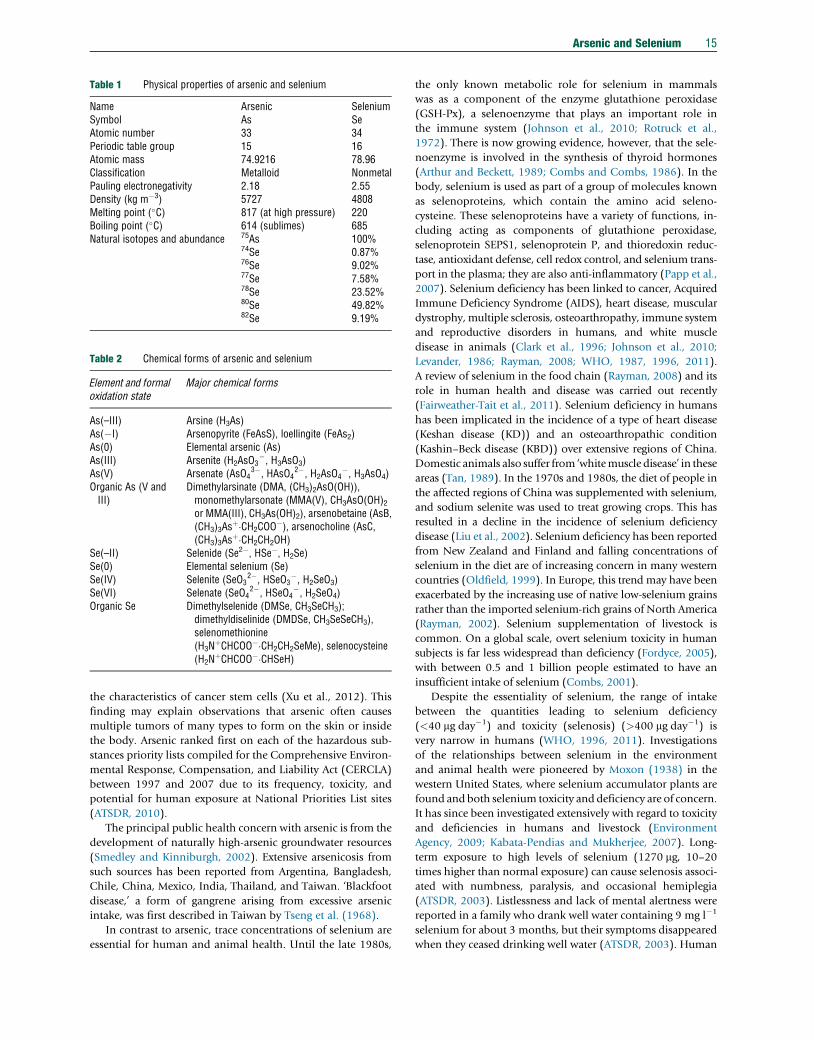
Table 1 Physical properties of arsenic and selenium
Name Arsenic SeleniumSymbol As SeAtomic number 33 34Periodic table group 15 16Atomic mass 74.9216 78.96Classification Metalloid NonmetalPauling electronegativity 2.18 2.55Density (kg m�3) 5727 4808Melting point (�C) 817 (at high pressure) 220Boiling point (�C) 614 (sublimes) 685Natural isotopes and abundance 75As 100%
74Se 0.87%76Se 9.02%77Se 7.58%78Se 23.52%80Se 49.82%82Se 9.19%
Table 2 Chemical forms of arsenic and selenium
Element and formaloxidation state
Major chemical forms
As(–III) Arsine (H3As)As(�I) Arsenopyrite (FeAsS), loellingite (FeAs2)As(0) Elemental arsenic (As)As(III) Arsenite (H2AsO3
�, H3AsO3)As(V) Arsenate (AsO4
3�, HAsO42�, H2AsO4
�, H3AsO4)Organic As (V andIII)
Dimethylarsinate (DMA, (CH3)2AsO(OH)),monomethylarsonate (MMA(V), CH3AsO(OH)2or MMA(III), CH3As(OH)2), arsenobetaine (AsB,(CH3)3As
þ�CH2COO�), arsenocholine (AsC,
(CH3)3Asþ�CH2CH2OH)
Se(–II) Selenide (Se2�, HSe�, H2Se)Se(0) Elemental selenium (Se)Se(IV) Selenite (SeO3
2�, HSeO3�, H2SeO3)
Se(VI) Selenate (SeO42�, HSeO4
�, H2SeO4)Organic Se Dimethylselenide (DMSe, CH3SeCH3);
dimethyldiselinide (DMDSe, CH3SeSeCH3),selenomethionine(H3N
þCHCOO��CH2CH2SeMe), selenocysteine(H2N
þCHCOO��CHSeH)
Arsenic and Selenium 15
the characteristics of cancer stem cells (Xu et al., 2012). This
finding may explain observations that arsenic often causes
multiple tumors of many types to form on the skin or inside
the body. Arsenic ranked first on each of the hazardous sub-
stances priority lists compiled for the Comprehensive Environ-
mental Response, Compensation, and Liability Act (CERCLA)
between 1997 and 2007 due to its frequency, toxicity, and
potential for human exposure at National Priorities List sites
(ATSDR, 2010).
The principal public health concern with arsenic is from the
development of naturally high-arsenic groundwater resources
(Smedley and Kinniburgh, 2002). Extensive arsenicosis from
such sources has been reported from Argentina, Bangladesh,
Chile, China, Mexico, India, Thailand, and Taiwan. ‘Blackfoot
disease,’ a form of gangrene arising from excessive arsenic
intake, was first described in Taiwan by Tseng et al. (1968).
In contrast to arsenic, trace concentrations of selenium are
essential for human and animal health. Until the late 1980s,
the only known metabolic role for selenium in mammals
was as a component of the enzyme glutathione peroxidase
(GSH-Px), a selenoenzyme that plays an important role in
the immune system (Johnson et al., 2010; Rotruck et al.,
1972). There is now growing evidence, however, that the sele-
noenzyme is involved in the synthesis of thyroid hormones
(Arthur and Beckett, 1989; Combs and Combs, 1986). In the
body, selenium is used as part of a group of molecules known
as selenoproteins, which contain the amino acid seleno-
cysteine. These selenoproteins have a variety of functions, in-
cluding acting as components of glutathione peroxidase,
selenoprotein SEPS1, selenoprotein P, and thioredoxin reduc-
tase, antioxidant defense, cell redox control, and selenium trans-
port in the plasma; they are also anti-inflammatory (Papp et al.,
2007). Selenium deficiency has been linked to cancer, Acquired
Immune Deficiency Syndrome (AIDS), heart disease, muscular
dystrophy, multiple sclerosis, osteoarthropathy, immune system
and reproductive disorders in humans, and white muscle
disease in animals (Clark et al., 1996; Johnson et al., 2010;
Levander, 1986; Rayman, 2008; WHO, 1987, 1996, 2011).
A review of selenium in the food chain (Rayman, 2008) and its
role in human health and disease was carried out recently
(Fairweather-Tait et al., 2011). Selenium deficiency in humans
has been implicated in the incidence of a type of heart disease
(Keshan disease (KD)) and an osteoarthropathic condition
(Kashin–Beck disease (KBD)) over extensive regions of China.
Domestic animals also suffer from ‘whitemuscle disease’ in these
areas (Tan, 1989). In the 1970s and 1980s, the diet of people in
the affected regions of China was supplemented with selenium,
and sodium selenite was used to treat growing crops. This has
resulted in a decline in the incidence of selenium deficiency
disease (Liu et al., 2002). Selenium deficiency has been reported
from New Zealand and Finland and falling concentrations of
selenium in the diet are of increasing concern in many western
countries (Oldfield, 1999). In Europe, this trend may have been
exacerbated by the increasing use of native low-selenium grains
rather than the imported selenium-rich grains of North America
(Rayman, 2002). Selenium supplementation of livestock is
common. On a global scale, overt selenium toxicity in human
subjects is far less widespread than deficiency (Fordyce, 2005),
with between 0.5 and 1 billion people estimated to have an
insufficient intake of selenium (Combs, 2001).
Despite the essentiality of selenium, the range of intake
between the quantities leading to selenium deficiency
(<40 mg day�1) and toxicity (selenosis) (>400 mg day�1) is
very narrow in humans (WHO, 1996, 2011). Investigations
of the relationships between selenium in the environment
and animal health were pioneered by Moxon (1938) in the
western United States, where selenium accumulator plants are
found and both selenium toxicity and deficiency are of concern.
It has since been investigated extensively with regard to toxicity
and deficiencies in humans and livestock (Environment
Agency, 2009; Kabata-Pendias and Mukherjee, 2007). Long-
term exposure to high levels of selenium (1270 mg, 10–20
times higher than normal exposure) can cause selenosis associ-
ated with numbness, paralysis, and occasional hemiplegia
(ATSDR, 2003). Listlessness and lack of mental alertness were
reported in a family who drank well water containing 9 mg l�1
selenium for about 3 months, but their symptoms disappeared
when they ceased drinking well water (ATSDR, 2003). Human

16 Arsenic and Selenium
selenosis at the population level is rare and is generally related
to excesses from food rather than from drinking water. It has
been reported from China and Venezuela, where selenium-rich
food is grown and consumed locally (Tan, 1989; WHO, 1996,
2011). Cancers of the skin and pancreas have been attributed to
high selenium intakes (Vinceti et al., 1998). Selenium sulfide is
used in antidandruff shampoos and is potentially carcinogenic,
but is not absorbed through the skin unless there are lesions
(WHO, 1987). Selenium toxicity can lead to hair and nail loss
and disruption of the nervous and digestive systems in humans
and to ‘alkali’ disease in animals. Chronic selenosis in animals
is not common, but has been reported from parts of Australia,
China, Ireland, Israel, Russia, South Africa, the United States,
and Venezuela (Oldfield, 1999). Liver damage is a feature of
chronic selenosis in animals (WHO, 1987). Selenium was
number 147 on the US 2007 CERCLA hazardous substances
priority list (ATSDR, 2010).
It is now recognized that arsenic and selenium interact with
each other in various metabolic functions and animal models
indicate that each element can substitute for the other to some
extent (Davis et al., 2000). This could partly explain the
reported protective effect of selenium against some diseases,
including some cancers (Shamberger and Frost, 1969). Arsenic
was also shown long ago to protect against selenium poisoning
in experimental studies with rats (Moxon, 1938). Following
the relatively recent discovery of dissimilatory As(V) reduction
and the various mechanisms that organisms have evolved to
deal with the toxicity of As(V) and As(III), there has been a
rapid increase in the understanding of the microbial chemistry
of arsenic (see Frankenberger, 2002 and the individual chap-
ters therein) and its consequences for the broader environ-
ment. Selenium chemistry is also closely linked to microbial
processes but these are less well understood.
Contamination as a result of human activity is of increasing
concern for both elements, but especially for arsenic. In the
past, the problem was exacerbated by an absence of waste
management strategies.
Arsenic concentrations in the natural environment have in-
creased as a result of a number of activities, including mining
and smelting, the combustion of arsenical coals, petroleum
recovery (involving the release of production waters), refining,
chemical production and use, the use of biocides including
wood preservatives, the use of fertilizers, the manufacture and
use of animal feed additives, and the development of high-
arsenic groundwater for drinking water and irrigation. Such
activities have progressively transferred arsenic from the geo-
sphere into the surface environment and have distributed it
through the biosphere, where it poses a potential risk to humans
and the wider environment. Endemic arsenic poisoning is asso-
ciated mostly with naturally high concentrations of arsenic in
drinking water, although in China it is a result of burning coal
rich in arsenic (Ng et al., 2003; Sun, 2004). In certain occupa-
tional settings, the principal pathway of arsenic to humans can
be through inhalation. Arsenicosis caused by the indoor com-
bustion of arsenic-rich coals has also been reported from Gui-
zhou province, China (Aihua et al., 2000; Ding et al., 2000;
Finkelman et al., 2003), where open coal burning stoves are
used to dry chili peppers, increasing arsenic levels from 1 to
500 mg kg�1 (Kapaj et al., 2006; Zheng et al., 1996).
Human activities that have increased the concentrations of
selenium in the environment include the mining and
processing of base metal, gold, coal, and phosphate deposits,
the use of rock phosphate as fertilizer, the manufacture of de-
tergents and shampoos, and the application of sewage sludge to
land. The increased use of selenium in the pharmaceutical, glaz-
ing, photocopying, ceramic, paint, and electronics industries
may also be increasing the amount of selenium entering the
environment.
In the following sections, the source and occurrence of
arsenic in the environment are first reviewed and then its
pathways are considered as a basis for an improved under-
standing of exposure and risk assessment. This should lead to
better risk management. A similar format is followed for sele-
nium. In discussing the two elements, and in line with the
threats outlined earlier, the emphasis on arsenic is on the
behavior of arsenic in water, whereas in the case of selenium
it is on the soil–water–plant relationships.
11.2.2 Sampling
Selenium and arsenic have been measured in a wide range of
environmental media. Here sampling procedures for rocks,
soils, sediments, and natural waters are described.
11.2.2.1 Rocks, Soils, and Sediments
In the case of rocks, soils, and sediments, sufficient material
representative of the medium to be analyzed should be
collected. Soil and sediment samples should be dried at tem-
peratures <35 �C to avoid volatilization losses of arsenic or
selenium (Rowell, 1994) and ideally freeze-dried (BGS,
1978–2006). Sampling, analysis, and quality control should
be carried out by recognized procedures wherever possible
(Darnley, 1995; Salminen and Gregorauskiene, 2000).
11.2.2.2 Water
11.2.2.2.1 TechniquesAs with other solutes, sampling natural waters for arsenic
and selenium requires (1) the sample to represent the water
body under investigation, and (2) that no artifacts are intro-
duced during sampling or storage. Sampling methods vary
according to whether ‘dissolved,’ ‘particulate,’ or ‘total’ concen-
trations are to be determined and whether speciation studies
are to be undertaken. Water samples are most commonly
analyzed for ‘total’ concentrations of arsenic and selenium.
Speciation measurements require additional precautions to
ensure preservation of the in situ species until separation or
measurement.
As arsenic and selenium are normally present in natural
waters at only trace concentrations (<10 mg l�1 and frequently
much lower), considerable care is required to perform reliable
trace analyses. Marine chemists were the first to undertake
reliable low-level trace analyses of natural waters and develop
‘clean/ultraclean’ sampling procedures (Horowitz et al., 1996).
Probably the most thorough accounts of sampling procedures
for surface water and groundwaters are those given by the US
Geological Survey (USGS) (Wilde and Radtke, 2008). Specific
procedures for sampling rainwater, lake water, and seawater
are also given. The precautions required in sampling for arsenic
and selenium are the same as those for other trace elements
Arsenic and Selenium 17
present in water at micrograms per liter concentrations. For
example, there should be minimal contact between the sample
and metallic substances. Sample bottles should be tested first
by analyzing deionized water stored in them to ensure that
they do not contaminate the sample. They should also be
rinsed thoroughly with the sample water before collection.
Ideally, groundwater should be sampled from purpose-
built water quality monitoring boreholes or piezometers.
In practice, existing wells or boreholes are frequently used.
As far as practically possible, it is important to purge the bore-
hole by pumping at least three borehole volumes to remove
standing water before sampling. Low-flow (<4 lmin�1) pump-
ing is preferred to minimize resuspension of colloidal material.
Several procedures have been devised to obtain water
quality depth profiles in wells and aquifers. These include
depth samplers, nested piezometers, strings of diffusion cells,
multilevel samplers, and multiple packers. Each method has its
advantages and disadvantages, with very different costs and
sampling logistics. As yet, few methods have been devised for
arsenic and selenium profiling specifically; probably the most
detailed profiling has been carried out in ocean sediments
(Sullivan and Aller, 1996). Pore water, including from the
unsaturated zone, can be obtained using a high-pressure
squeezer or high-speed centrifugation (Kinniburgh and Miles,
1983; Sullivan and Aller, 1996).
There are as yet no methods for the in situ determination or
continuous monitoring of arsenic and selenium. However, the
diffusive gradient thin-films (DGT)method is a novel sampling
method that has been used mainly for cationic metals, but may
be adaptable for measuring arsenic and selenium, as it has been
for phosphorus (Zhang et al., 1998). In this case, the normal
cation exchange resin is replaced by an iron oxide (ferrihydrite)
gel. Solutes sorbed by the resin or gel are displaced and subse-
quently analyzed in the laboratory. In principle, the DGT ap-
proach is sensitive with detection limits of the order of
nanograms per liter. The method also has the advantage that
it canmeasure a wide range of solutes simultaneously with high
spatial resolution (at the mm scale) and determine the average
water quality over relatively long timescales (days or longer).
Most water samples do not require pretreatment for a
total elemental analysis, but where organic arsenic or selenium
compounds are suspected, pretreatment by digestion with a
strong acid mixture, for example, a 3-min sulfuric acid–
potassium persulfate digestion or a nitric acid digestion is
necessary. Where preconcentration is required, cold-trapping
of the hydrides or liquid–solid extraction has been used, but
this is very labor intensive when performed off-line. Ground-
water samples usually need no pretreatment.
11.2.2.2.2 Filtered or unfiltered samplesStudies of the behavior of arsenic and selenium usually require
the proportions of their dissolved and particulate components
to be identified as this affects their biological availability,
toxicity, and transport. It also affects the interpretation of their
mineral solubility, adsorption, and redox behavior. Specifica-
tions for compliance testing vary with regulatory authority; for
example, the US Environmental Protection Agency (US EPA)
specifies a 0.45-mm filter while most authorities in developing
countries specify (or assume) that water samples are unfiltered.
If the water is reducing, it should be filtered before any oxida-
tion occurs. Geochemists typically filter water samples using
membrane filters in the range 0.1–0.45 mm, but the effective
size of the filter can change as it becomes clogged. There con-
tinues to be much discussion about the merits of various filter-
ing strategies (Hinkle and Polette, 1999; Horowitz et al., 1996;
Shiller and Taylor, 1996). Small iron-rich particles with
adsorbed arsenic, selenium, and other trace elements can pass
through traditional filters (Chen et al., 1994; Litaor and Keigley,
1991) and subsequently dissolve when the sample is acidified.
Colloids tend to be most abundant in reducing ground-
waters and turbid surface waters. In clear groundwater samples
that have usually been filtered naturally by movement through
an aquifer, differences between concentrations in filtered and
unfiltered aliquots are often relatively small. Filtered and
unfiltered groundwater samples from high-arsenic areas in
Bangladesh were found to have broadly similar arsenic con-
centrations (within�10%) although larger differences were
found occasionally (Smedley et al., 2001b). Similarly, 9 out
of 10 groundwater samples from arsenic-affected wells in
Oregon showed little difference (mostly <10%) between fil-
tered and unfiltered samples (Hinkle and Polette, 1999).
Some studies have reported larger differences. A survey of
49 unfiltered groundwater sources in the United States found
that particulate arsenic accounted for more than half of the
total arsenic in 30% of the sources (Chen et al., 1999) although
arsenic concentrations were all relatively small.
11.2.2.2.3 Sample preservation and redox stabilityFor analysis of total arsenic and selenium, samples are nor-
mally preserved by adding ultrapure acid (1 or 2 vol.%), with
the choice of acid depending on the analytical procedures to be
used. HCl is used before hydride generation-atomic absorption
spectrometry (HG-AAS), hydride generation-atomic emission
spectrometry (HG-AES), HG-AFS, and HNO3 before ICP-MS,
graphite furnace-atomic absorption spectrometry (GF-AAS),
and anodic stripping voltammetry (ASV). Acidification also
helps to stabilize the speciation (see later discussions) al-
though Hall et al. (1999) recommended that nitric acid should
not be used for acidifying samples collected for speciation.
Organic arsenic species are relatively stable and inorganic
As(III) species are the least stable (National Research Council,
1999). There are as yet no well-established methods for pre-
serving water samples for arsenic or selenium speciation
analysis, although methods are being investigated for arsenic
(Kumar and Riyazuddin, 2010; National Research Council,
1999; Rasmussen and Andersen, 2002).
Laboratory observations indicate that the oxidation of
As(III) and Se(IV) by air is slow and is often associated with
microbial activity. MnO2(s), which can precipitate following
atmospheric oxidation of manganese-rich water, is also known
to be a very efficient catalyst for the chemical oxidation of
As(III) (Daus et al., 2000; Driehaus et al., 1995; Oscarson
et al., 1983). Iron oxides have also been implicated in increas-
ing the abiotic rate of oxidation of As(III) although the evi-
dence for this is somewhat equivocal and it probably does not
occur in minutes or hours unless some H2O2 is present
(Voegelin and Hug, 2003). Precipitation of manganese and
iron oxides can be minimized by ensuring sufficient acidity
(pH 2 or less) and/or adding a reducing/complexing agent such
as ascorbic acid, Ethylenediaminetetraacetic acid (EDTA), or
phosphate. Recent studies have demonstrated the efficacy of
18 Arsenic and Selenium
EDTA (Bednar et al., 2002; Gallagher et al., 2001) and phos-
phate (Daus et al., 2002) for preserving arsenic speciation.
Arsenic speciation in urine is stable for at least 2 months
without additives at 4 �C (National Research Council, 1999),
though the stability of arsenic species has been found to be
dependent on urine matrices (Feldmann et al., 1999). It is rea-
sonable to conclude that natural water samples probably behave
in a similarway. As(III) in samples ofOttawa riverwater survived
oxidation for at least 3 days at ambient temperature and without
preservatives (Hall et al., 1999). The lowest rates of oxidation
occur under slightly acidic conditions (Driehaus and Jekel,
1992) and acidification to pH 3–5 has been found to help
stabilize As(III), although it is not always successful (Cabon
and Cabon, 2000). HCl normally prevents reduction of As(V)
to As(III) and arsenic speciation has recently been shown to be
preserved for many months, even in the presence of high Fe(II)
concentrations, if water samples are filtered and acidified in the
usual way (1 or 2% HCl) (McCleskey et al., 2004). Traces of
chlorine in HCl can lead to some long-term oxidation of As(III).
One of the critical factors enhancing the oxidation of As(III)
is the presence of dissolved Fe(III). On the other hand, the
presence of Fe2þ or SO42�, two species often found in arsenic-
rich acid mine drainage (AMD) waters, inhibits the oxidation
(McCleskey et al., 2004).
Reduction of As(V) can occur in the presence of air if
samples contain dissolved organic carbon (DOC), arsenate-
reducing bacteria, and no preservatives (Bednar et al., 2002;
Hall et al., 1999; Inskeep et al., 2002). Arsenic(V) can then be
reduced rapidly, within a few days. Storage at 3–5 �C and in the
dark helps to preserve the speciation (Hall et al., 1999;
Lindemann et al., 2000). Ideally, speciation studies for either
arsenic or selenium should involve the minimum of time
between sampling and analysis.
An alternative approach to the determinationof As(III)/As(V)
speciation is to separate the As(V) species in the field, using an
anion exchange column (Bednar et al., 2002; Vagliasindi and
Benjamin, 2001; Wilkie and Hering, 1998; Yalcin and Le, 1998).
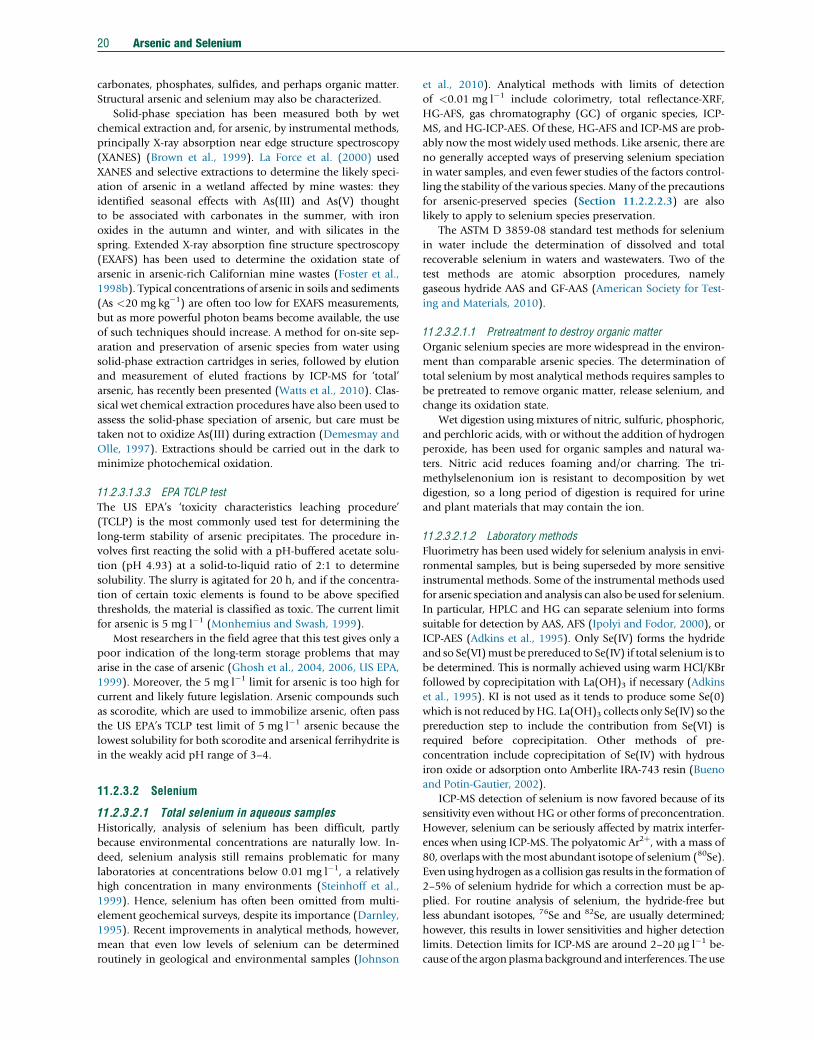
Table 3 Recognized methods of arsenic analysis
Technique LoD (mg l�1) Samplesize (ml)
Equipmentcost (US$)
Analyticalthroughpu
HG-AAS 0.05 50 20–100000 30–60
GF-AAS 1–5 1–2 40–100000 50–100
ICP-AES 35–50 10–20 60–100000 50–100
ICP-MS 0.02–1 10–20 150–400000 20–100
HG-AFS 0.01 40–50 20–25000 30–60
ASV 0.1 25–50 10–20000 25–50SDDC 1–10 100 2–10000 20–30
HG, hydride generation; AAS, atomic absorption spectrometry; GF, graphite furnace; AES, at
spectrometry; ASV, anodic stripping voltammetry; SDDC, silver diethyldithiocarbamate. ISO,
Methods’; US EPA, US Environmental Protection Agency; LoD, limit of detection.
Source: Rasmussen L and Andersen K (2002) Environmental health and human exposure as
ch. 2. Geneva: World Health Organization.
At near-neutral to acidic pH, typical of most natural waters,
uncharged As(III) is not retained by the resin and the retained
As(V) can be eluted subsequently with high-purity acid. Provid-
ing that total arsenic is known, As(III) can be estimated by
difference. Bednar et al. (2002) favored an acetate resin because
of its high pH-buffering capacity. Such anion exchange methods
do not work for selenium speciation as both the Se(IV) and
Se(VI) species are negatively charged and retainedby the column.
11.2.3 Analytical Methods
11.2.3.1 Arsenic
11.2.3.1.1 Total arsenic in aqueous samples11.2.3.1.1.1 Laboratory methods
Methods for arsenic analysis in water, food, and biological
samples have been reviewed in detail elsewhere (ATSDR, 2007;
Irgolic, 1994; National Research Council, 1999; Rasmussen and
Andersen, 2002) (Table 3).
Early colorimetric methods for arsenic analysis used the
reaction of arsine gas with either mercuric bromide captured
on filter paper to produce a yellow–brown stain (Gutzeit
method) or with silver diethyldithiocarbamate (SDDC) to pro-
duce a red dye. The SDDC method is still widely used in
developing countries. The molybdate blue spectrophotometric
method that is widely used for phosphate determination can
be used for As(V), but the correction for P interference is
difficult. Methods based on atomic absorption spectrometry
(AAS) linked to hydride generation (HG) or a graphite furnace
(GF) have become widely used. Other sensitive and specific
arsenic detectors (e.g., AFS, ICP-MS, and ICP-AES) are becom-
ing increasingly available. The accuracy is much better using
atomic absorption methods than ICP (Nathanail and Bardos,
2004). HG-AFS in particular is now widely used for routine
arsenic determinations because of its sensitivity, reliability, and
relatively low capital cost.
t per dayComments Accredited
procedure
Single element ISO 11969SM 3114
ISO/CD 15586SM 3113
Multielement; requires Ar gas supply.Can reduce LoD with HG
ISO/CD 11885SM 3120
Multielement SM 3125US EPA 1638
Single element but can be adapted forSe and Hg
Only free dissolved As US EPA 7063Simple instrumentation SM 3500
ISO 6595
omic emission spectrometry; MS, mass spectrometry; AFS, atomic fluorescence
International Standards Organization; ISO/CD, ISO Committee Draft; SM, ‘Standard
sessment (draft). United Nations Synthesis Report on Arsenic in Drinking Water,
Arsenic and Selenium 19
Conventional ICP-MS has great sensitivity but suffers from
serious interferences. Cl interference leads to the formation of40Ar35Clþ which has the same mass/charge ratio as the mono-
isotopic 75As (m/z¼75). Hence, HCl and HClO4 should not be
used for preservation or dissolution if ICP-MS is to be used.
There may also be significant interference in samples with
naturally high Cl/As ratios. A Cl concentration of
1000 mg l�1 gives an arsenic signal equivalent to about
3–10 mg l�1. The use of a high-resolution magnetic sector
mass spectrometer, which can resolve the small difference in
m/z for 75Asþ at 74.922 from that of 40Ar35Clþ at 74.931,
eliminates the Cl interference. New collision-cell techniques,
in which the atomized samples are mixed with a second gas
(usually H2) in a reaction cell, also minimize this interference.
Arsenic detection limits of a few nanograms per liter have been
reported in matrices containing 1000 mg l�1 NaCl. The Cl
interference can also be avoided by preseparation using HG,
GF, or chromatography.
The American Society for Testing and Materials (ASTM) D
2972-08 standard test methods for arsenic in water cover the
photometric and atomic absorption determination of arsenic
in most waters and wastewaters. Three test methods are de-
tailed in the standard; that is, silver diethyldithiocarbamate
colorimetric; atomic absorption hydride generation; and
atomic absorption, graphite furnace (American Society for
Testing and Materials, 2010).
Recently, the use of carbon nanotubes has been proposed in
several analytical methods, including use as solid-phase extrac-
tion adsorbents for arsenic pretreatment and enrichment from
water samples (Li et al., 2009a), and in ASV (Xiao et al., 2008).
11.2.3.1.1.2 Field-test kits
Adetailed study of fieldmeasurement and sensors for arsenic has
been carried out by Melamed (2004). A large number of wells
need to be tested (and retested) for arsenic worldwide. Hence,
there is a need for reliable field-test kits that can measure arsenic
concentrations down to 10 mg l�1, the World Health Organiza-
tion (WHO) guideline value for arsenic in drinking water. Test
kits offer the advantage of being relatively inexpensive, portable,
and effective for indicating the presence of arsenic. Some of the
more recently developed kits based on the Gutzeit method are
semiquantitative (Kinniburgh and Kosmus, 2002). Several field-
test kits based on this method are available commercially, but
their performance is variable (Spear, 2006).
The main limitations of test kits for arsenic in water are that
other chemical reactions may interfere; the sensitivity and
accuracy of the kits fluctuate depending on the model used
and there are differences between field workers, especially as
many kits rely on comparison of a test strip to a color chart
(Petrusevski et al., 2007).
11.2.3.1.2 Total arsenic in solid samplesX-ray fluorescence spectrometry (XRF) and instrumental neutron
activation analysis (INAA) are commonly used for multielement
analysis of rock, soil, and sediment samples as they do not
require chemical dissolution. However, the detection limit for
arsenic using XRF, for example, is of the order of 5 mg kg�1 and is
too high for many environmental purposes. Once dissolved,
arsenic can be determined usingmany of the methods described
earlier for aqueous samples, although the method of digestion
must be capable of destroying all solids containing arsenic.
11.2.3.1.3 Arsenic speciation11.2.3.1.3.1 Aqueous speciation
At its simplest, speciation of arsenic consists of separating it
into its two major oxidation states, As(III) and As(V). This can
be achieved on unacidified samples by ion chromatography.
More detailed speciation involves determining organic species
and less common inorganic species such as sulfide (thio),
carbonate, and cyanide complexes, as well as less common
oxidation states such as As(III) and As(0). There is increasing
interest in the bioavailability of arsenic. Organic speciation
usually involves quantifying the two or three major (mainly
the methylated) species present. The oxidation state of arsenic
in these organic species can be either As(III) or As(V).
Generally, such studies are carried out in research rather than
water-testing laboratories.
A two-stage approach to speciation is often used: this in-
volves preseparation by high-performance liquid chromatogra-
phy (HPLC) or ion chromatography followed by arsenic
detection. The detection methods must be highly sensitive
and capable of quantifying inorganic and organic species at
the nanograms per liter to micrograms per liter level (Yalcin
and Le, 1998). Many combinations of separation and detection
methods have been used (Bohari et al., 2001; Ipolyi and Fodor,
2000; Lindemann et al., 2000; Martinez-Bravo et al., 2001;
National Research Council, 1999; Taniguchi et al., 1999). All
of them require expensive instrumentation and highly skilled
operators and none has acquired ‘routine’ or accredited status.
A widely used but indirect method of As(III)/As(V) specia-
tion involves no preseparation but involves two separate de-
terminations, with and without prereduction. The rate of AsH3
production by sodium borohydride (NaBH4) reduction de-
pends primarily on the initial oxidation state of the arsenic
in solution and the solution pH. Under typical operating con-
ditions of about pH 6 where the neutral As(III) species,
H3AsO3, predominates, only As(III) is converted to the hydride
(Anderson et al., 1986; Driehaus and Jekel, 1992). For themost
part, the negatively charged As(V) species are not converted.
For the determination of total arsenic, As(V) to As(III) pre-
reduction can be achieved by adding a mixture of HCl, KI,
and ascorbic acid ideally at pH<1 to ensure full protonation
and efficient hydride generation. High concentrations of HCl
are particularly effective at this. As(V) can then be estimated by
difference. AFS or AAS provide sensitive and fairly robust de-
tectors for the arsine gas produced. High concentrations of
some metal ions, particularly Fe3þ and Cu2þ, can interfere
with the hydride generation, but this can be overcome by
adding masking agents such as thiourea (Anderson et al.,
1986) or by their prior removal with a cation-exchange resin.
11.2.3.1.3.2 Solid-phase speciation
While most speciation studies have been concerned with redox
speciation in solution, speciation in the solid phase is also of
interest. Both reduced and oxidized arsenic and selenium spe-
cies can be adsorbed on minerals, soils, and sediments, albeit
with differing affinities (see Sections 11.2.5.3 and 11.2.7.2).
Such adsorption has been demonstrated on metal oxides and
clays and also probably takes place to some extent on
20 Arsenic and Selenium
carbonates, phosphates, sulfides, and perhaps organic matter.
Structural arsenic and selenium may also be characterized.
Solid-phase speciation has been measured both by wet
chemical extraction and, for arsenic, by instrumental methods,
principally X-ray absorption near edge structure spectroscopy
(XANES) (Brown et al., 1999). La Force et al. (2000) used
XANES and selective extractions to determine the likely speci-
ation of arsenic in a wetland affected by mine wastes: they
identified seasonal effects with As(III) and As(V) thought
to be associated with carbonates in the summer, with iron
oxides in the autumn and winter, and with silicates in the
spring. Extended X-ray absorption fine structure spectroscopy
(EXAFS) has been used to determine the oxidation state of
arsenic in arsenic-rich Californian mine wastes (Foster et al.,
1998b). Typical concentrations of arsenic in soils and sediments
(As <20 mg kg�1) are often too low for EXAFS measurements,
but as more powerful photon beams become available, the use
of such techniques should increase. A method for on-site sep-
aration and preservation of arsenic species from water using
solid-phase extraction cartridges in series, followed by elution
and measurement of eluted fractions by ICP-MS for ‘total’
arsenic, has recently been presented (Watts et al., 2010). Clas-
sical wet chemical extraction procedures have also been used to
assess the solid-phase speciation of arsenic, but care must be
taken not to oxidize As(III) during extraction (Demesmay and
Olle, 1997). Extractions should be carried out in the dark to
minimize photochemical oxidation.
11.2.3.1.3.3 EPA TCLP test
The US EPA’s ‘toxicity characteristics leaching procedure’
(TCLP) is the most commonly used test for determining the
long-term stability of arsenic precipitates. The procedure in-
volves first reacting the solid with a pH-buffered acetate solu-
tion (pH 4.93) at a solid-to-liquid ratio of 2:1 to determine
solubility. The slurry is agitated for 20 h, and if the concentra-
tion of certain toxic elements is found to be above specified
thresholds, the material is classified as toxic. The current limit
for arsenic is 5 mg l�1 (Monhemius and Swash, 1999).
Most researchers in the field agree that this test gives only a
poor indication of the long-term storage problems that may
arise in the case of arsenic (Ghosh et al., 2004, 2006, US EPA,
1999). Moreover, the 5 mg l�1 limit for arsenic is too high for
current and likely future legislation. Arsenic compounds such
as scorodite, which are used to immobilize arsenic, often pass
the US EPA’s TCLP test limit of 5 mg l�1 arsenic because the
lowest solubility for both scorodite and arsenical ferrihydrite is
in the weakly acid pH range of 3–4.
11.2.3.2 Selenium
11.2.3.2.1 Total selenium in aqueous samplesHistorically, analysis of selenium has been difficult, partly
because environmental concentrations are naturally low. In-
deed, selenium analysis still remains problematic for many
laboratories at concentrations below 0.01 mg l�1, a relatively
high concentration in many environments (Steinhoff et al.,
1999). Hence, selenium has often been omitted from multi-
element geochemical surveys, despite its importance (Darnley,
1995). Recent improvements in analytical methods, however,
mean that even low levels of selenium can be determined
routinely in geological and environmental samples (Johnson
et al., 2010). Analytical methods with limits of detection
of <0.01 mg l�1 include colorimetry, total reflectance-XRF,
HG-AFS, gas chromatography (GC) of organic species, ICP-
MS, and HG-ICP-AES. Of these, HG-AFS and ICP-MS are prob-
ably now the most widely used methods. Like arsenic, there are
no generally accepted ways of preserving selenium speciation
in water samples, and even fewer studies of the factors control-
ling the stability of the various species. Many of the precautions
for arsenic-preserved species (Section 11.2.2.2.3) are also
likely to apply to selenium species preservation.
The ASTM D 3859-08 standard test methods for selenium
in water include the determination of dissolved and total
recoverable selenium in waters and wastewaters. Two of the
test methods are atomic absorption procedures, namely
gaseous hydride AAS and GF-AAS (American Society for Test-
ing and Materials, 2010).
11.2.3.2.1.1 Pretreatment to destroy organic matter
Organic selenium species are more widespread in the environ-
ment than comparable arsenic species. The determination of
total selenium by most analytical methods requires samples to
be pretreated to remove organic matter, release selenium, and
change its oxidation state.
Wet digestion using mixtures of nitric, sulfuric, phosphoric,
and perchloric acids, with or without the addition of hydrogen
peroxide, has been used for organic samples and natural wa-
ters. Nitric acid reduces foaming and/or charring. The tri-
methylselenonium ion is resistant to decomposition by wet
digestion, so a long period of digestion is required for urine
and plant materials that may contain the ion.
11.2.3.2.1.2 Laboratory methods
Fluorimetry has been used widely for selenium analysis in envi-
ronmental samples, but is being superseded by more sensitive
instrumental methods. Some of the instrumental methods used
for arsenic speciation and analysis can also be used for selenium.
In particular, HPLC and HG can separate selenium into forms
suitable for detection by AAS, AFS (Ipolyi and Fodor, 2000), or
ICP-AES (Adkins et al., 1995). Only Se(IV) forms the hydride
and so Se(VI)must be prereduced to Se(IV) if total selenium is to
be determined. This is normally achieved using warm HCl/KBr
followed by coprecipitation with La(OH)3 if necessary (Adkins
et al., 1995). KI is not used as it tends to produce some Se(0)
which is not reduced byHG. La(OH)3 collects only Se(IV) so the
prereduction step to include the contribution from Se(VI) is
required before coprecipitation. Other methods of pre-
concentration include coprecipitation of Se(IV) with hydrous
iron oxide or adsorption onto Amberlite IRA-743 resin (Bueno
and Potin-Gautier, 2002).
ICP-MS detection of selenium is now favored because of its
sensitivity even without HG or other forms of preconcentration.
However, selenium can be seriously affected by matrix interfer-
ences when using ICP-MS. The polyatomic Ar2þ, with a mass of
80, overlaps with themost abundant isotope of selenium (80Se).
Even using hydrogen as a collision gas results in the formation of
2–5% of selenium hydride for which a correction must be ap-
plied. For routine analysis of selenium, the hydride-free but
less abundant isotopes, 76Se and 82Se, are usually determined;
however, this results in lower sensitivities and higher detection
limits. Detection limits for ICP-MS are around 2–20 mg l�1 be-
cause of the argon plasmabackground and interferences. The use
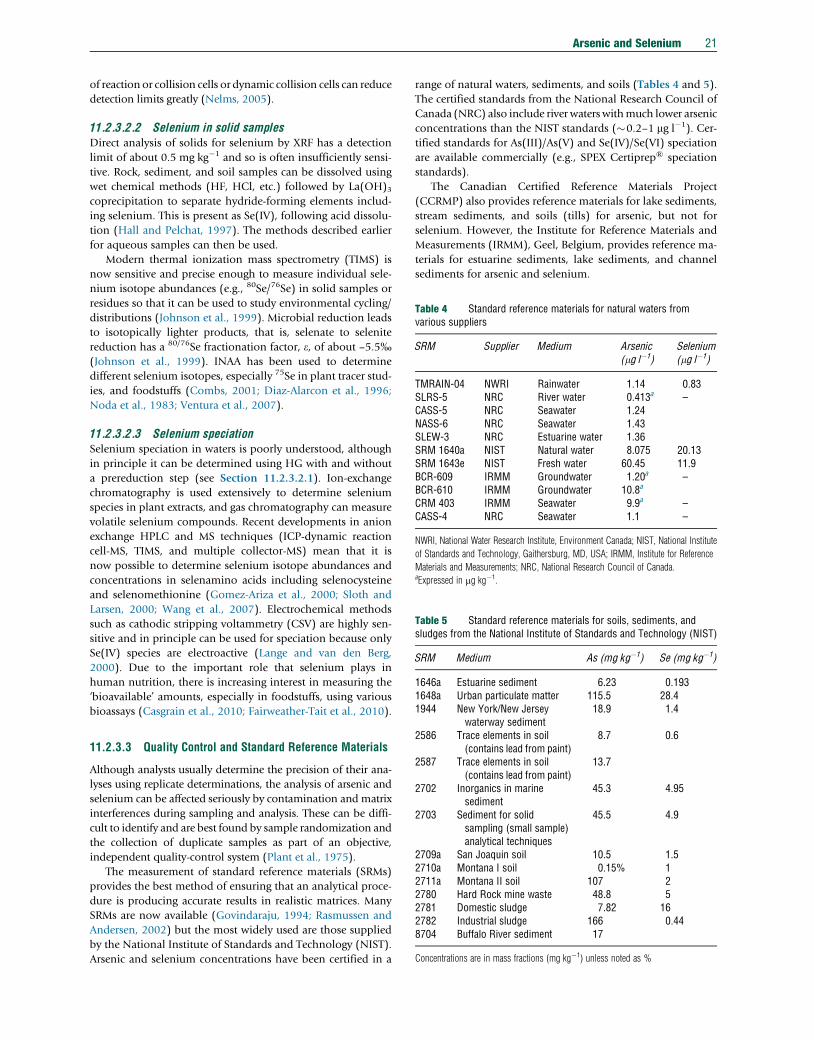
Table 4 Standard reference materials for natural waters fromvarious suppliers
SRM Supplier Medium Arsenic(mg l�1)
Selenium(mg l�1)
TMRAIN-04 NWRI Rainwater 1.14 0.83SLRS-5 NRC River water 0.413a –CASS-5 NRC Seawater 1.24NASS-6 NRC Seawater 1.43SLEW-3 NRC Estuarine water 1.36SRM 1640a NIST Natural water 8.075 20.13SRM 1643e NIST Fresh water 60.45 11.9BCR-609 IRMM Groundwater 1.20a –BCR-610 IRMM Groundwater 10.8a
CRM 403 IRMM Seawater 9.9a –CASS-4 NRC Seawater 1.1 –
NWRI, National Water Research Institute, Environment Canada; NIST, National Institute
of Standards and Technology, Gaithersburg, MD, USA; IRMM, Institute for Reference
Materials and Measurements; NRC, National Research Council of Canada.aExpressed in mg kg�1.
Table 5 Standard reference materials for soils, sediments, andsludges from the National Institute of Standards and Technology (NIST)
SRM Medium As (mg kg�1) Se (mg kg�1)
1646a Estuarine sediment 6.23 0.1931648a Urban particulate matter 115.5 28.41944 New York/New Jersey 18.9 1.4
Arsenic and Selenium 21
of reaction or collision cells or dynamic collision cells can reduce
detection limits greatly (Nelms, 2005).
11.2.3.2.2 Selenium in solid samplesDirect analysis of solids for selenium by XRF has a detection
limit of about 0.5 mg kg�1 and so is often insufficiently sensi-
tive. Rock, sediment, and soil samples can be dissolved using
wet chemical methods (HF, HCl, etc.) followed by La(OH)3coprecipitation to separate hydride-forming elements includ-
ing selenium. This is present as Se(IV), following acid dissolu-
tion (Hall and Pelchat, 1997). The methods described earlier
for aqueous samples can then be used.
Modern thermal ionization mass spectrometry (TIMS) is
now sensitive and precise enough to measure individual sele-
nium isotope abundances (e.g., 80Se/76Se) in solid samples or
residues so that it can be used to study environmental cycling/
distributions (Johnson et al., 1999). Microbial reduction leads
to isotopically lighter products, that is, selenate to selenite
reduction has a 80/76Se fractionation factor, e, of about –5.5%(Johnson et al., 1999). INAA has been used to determine
different selenium isotopes, especially 75Se in plant tracer stud-
ies, and foodstuffs (Combs, 2001; Diaz-Alarcon et al., 1996;
Noda et al., 1983; Ventura et al., 2007).
11.2.3.2.3 Selenium speciationSelenium speciation in waters is poorly understood, although
in principle it can be determined using HG with and without
a prereduction step (see Section 11.2.3.2.1). Ion-exchange
chromatography is used extensively to determine selenium
species in plant extracts, and gas chromatography can measure
volatile selenium compounds. Recent developments in anion
exchange HPLC and MS techniques (ICP-dynamic reaction
cell-MS, TIMS, and multiple collector-MS) mean that it is
now possible to determine selenium isotope abundances and
concentrations in selenamino acids including selenocysteine
and selenomethionine (Gomez-Ariza et al., 2000; Sloth and
Larsen, 2000; Wang et al., 2007). Electrochemical methods
such as cathodic stripping voltammetry (CSV) are highly sen-
sitive and in principle can be used for speciation because only
Se(IV) species are electroactive (Lange and van den Berg,
2000). Due to the important role that selenium plays in
human nutrition, there is increasing interest in measuring the
‘bioavailable’ amounts, especially in foodstuffs, using various
bioassays (Casgrain et al., 2010; Fairweather-Tait et al., 2010).
waterway sediment2586 Trace elements in soil(contains lead from paint)
8.7 0.6
2587 Trace elements in soil(contains lead from paint)
13.7
2702 Inorganics in marinesediment
45.3 4.95
2703 Sediment for solidsampling (small sample)analytical techniques
45.5 4.9
2709a San Joaquin soil 10.5 1.52710a Montana I soil 0.15% 12711a Montana II soil 107 22780 Hard Rock mine waste 48.8 52781 Domestic sludge 7.82 162782 Industrial sludge 166 0.448704 Buffalo River sediment 17
Concentrations are in mass fractions (mg kg�1) unless noted as %
11.2.3.3 Quality Control and Standard Reference Materials
Although analysts usually determine the precision of their ana-
lyses using replicate determinations, the analysis of arsenic and
selenium can be affected seriously by contamination and matrix
interferences during sampling and analysis. These can be diffi-
cult to identify and are best found by sample randomization and
the collection of duplicate samples as part of an objective,
independent quality-control system (Plant et al., 1975).
The measurement of standard reference materials (SRMs)
provides the best method of ensuring that an analytical proce-
dure is producing accurate results in realistic matrices. Many
SRMs are now available (Govindaraju, 1994; Rasmussen and
Andersen, 2002) but the most widely used are those supplied
by the National Institute of Standards and Technology (NIST).
Arsenic and selenium concentrations have been certified in a
range of natural waters, sediments, and soils (Tables 4 and 5).
The certified standards from the National Research Council of
Canada (NRC) also include river waters withmuch lower arsenic
concentrations than the NIST standards (�0.2–1 mg l�1). Cer-
tified standards for As(III)/As(V) and Se(IV)/Se(VI) speciation
are available commercially (e.g., SPEX Certiprep® speciation
standards).
The Canadian Certified Reference Materials Project
(CCRMP) also provides reference materials for lake sediments,
stream sediments, and soils (tills) for arsenic, but not for
selenium. However, the Institute for Reference Materials and
Measurements (IRMM), Geel, Belgium, provides reference ma-
terials for estuarine sediments, lake sediments, and channel
sediments for arsenic and selenium.
22 Arsenic and Selenium
The Geological Survey of Japan (GSJ) provides a wide range
of rock SRMs along with ‘recommended’ arsenic and selenium
concentrations. The USGS issues 17 SRMs for which it provides
‘recommended’ and ‘information’ (when less than three inde-
pendent methods have been used) concentrations. Nine of
these include data for arsenic and two for both arsenic and
selenium (the SGR-1 shale and CLB-1 coal samples). Hall and
Pelchat (1997) have analyzed 55 geological SRMs for As, Bi, Sb,
Se, and Te, including SRMs from theUSGS, Institute of Geophys-
ical and Geochemical Exploration (IGGE; China), GSJ, CCRMP,
and NRC programs. Methods have been developed recently for
the determination of selenium in geological materials at
nanograms per gram and lower levels (Forrest et al., 2009).
11.2.4 Abundance and Forms of Arsenic in theNatural Environment
11.2.4.1 Abundance in Rocks, Soils, and Sediments
The average crustal abundance of arsenic is 1.5 mg kg�1 and it
is strongly chalocophile. Approximately 60% of natural arsenic
minerals are arsenates, 20% sulfides and sulfosalts, and the
remaining 20% are arsenides, arsenites, oxides, alloys, and
polymorphs of elemental arsenic. Arsenic concentrations of
more than 100000 mg kg�1 have been reported in sulfide
minerals and up to 76000 mg kg�1 in iron oxides (Smedley
and Kinniburgh, 2002). However, concentrations are typically
much lower. Arsenic is incorporated into primary rock-forming
minerals only to a limited extent, for example, by the substitu-
tion of As3þ for Fe3þ or Al3þ. Therefore arsenic concentrationsin silicate minerals are typically of the order of 1 mg kg�1 or
less (Smedley and Kinniburgh, 2002). Consequently, many
igneous and metamorphic rocks have average arsenic concen-
trations of 1–10 mg kg�1. Similar concentrations are found in
carbonate minerals and rocks.
Arsenic concentrations in sedimentary rocks can be more
variable. The highest arsenic concentrations (20–200 mg kg�1)
are typically found in organic-rich and sulfide-rich shales, sed-
imentary ironstones, phosphatic rocks, and some coals
(Smedley and Kinniburgh, 2002).
Although arsenic concentrations in coals can range up to
35000 mg kg�1 in some parts of China, concentrations in the
range <1–17 mg kg�1 are more typical (Gluskoter et al., 1977;
Palmer and Klizas, 1997; Sun, 2004). Evidence for arsenic
enrichment in peat is equivocal. Shotyk (1996) found a max-
imum of 9 mg kg�1 arsenic in two 5000–10000-year-old Swiss
peat profiles and in the profile with the lower ash content, the
arsenic content was 1 mg kg�1 or lower.
In sedimentary rocks, arsenic is concentrated in clays and
other fine-grained sediments, especially those rich in sulfide
minerals, organic matter, secondary iron oxides, and phos-
phates. The average concentration of arsenic in shale is an
order of magnitude greater than in sandstones, limestones,
and carbonate rocks. Arsenic is strongly sorbed by oxides of
iron, aluminum, and manganese as well as some clays, leading
to its enrichment in ferromanganese nodules and manganifer-
ous deposits.
Alluvial sands, glacial till, and lake sediments typically
contain <1–15 mg kg�1 arsenic although higher concentra-
tions are found occasionally (Farmer and Lovell, 1986).
Based on a survey of 747 flood-plain sediment samples and
852 stream sediment samples over Europe, median arsenic
concentrations of 6.00 and 6.00 mg kg�1, respectively, were
reported (FOREGS, 2005). Sediments from Qinghai Lake on
the Tibetan Plateau have been shown to have arsenic enrich-
ment factors of up to 2� pre-1900 levels; this has been sug-
gested to reflect the burning of arsenical coal for industrial
development in western China (Wang et al., 2010).
Stream sediments from England and Wales had a median
arsenic concentration of 10 mg kg�1 (Webb, 1978). A more
detailed survey of stream sediments in Wales gave a median
concentration of 14 mg kg�1 (BGS, 1978–2006). Black et al.
(2004) state that one grain of arsenopyrite �200 mm across in
a 5-g stream sediment sample is equivalent to approximately
1 mg kg�1 arsenic in the sample. The median arsenic concen-
tration in stream sediments from 20 study areas across the
United States collected as part of the National Water-Quality
Assessment (NAWQA) program was 6.3 mg kg�1 (Rice, 1999).
The arsenic concentration in soils shows a similar range to
that found in sediments, except where they are contaminated
by industrial or agricultural activity. Organic-rich soils tend to
have higher concentrations of arsenic due to the presence of
sulfide minerals; for example, peaty and boggy soils have
an average concentration of 13 mg kg�1 (Dissanayake and
Chandrajith, 2009; Smedley and Kinniburgh, 2002). A survey
of 2600 soils from the Welsh borders had a median arsenic
concentration of 11 mg kg�1 (BGS, 1978–2006). A survey of
the concentrations of arsenic in rural soils, thought to reflect
‘background’ conditions in the United Kingdom, reported a
range of 0.50–143 mg kg�1 (Ross et al., 2007). A survey of soil
profiles covering 26 countries in Europe gave a median arsenic
concentration of 7.03 mg kg�1 in topsoils (840 samples) and
6.02 mg kg�1 in subsoils (783 samples) (FOREGS, 2005).
Concentrations of 1000 mg kg�1 or more have been found at
contaminated sites close to smelters or industrial sites (Lumsdon
et al., 2001). Arsenic and its compounds are used as pesticides,
especially herbicides and insecticides, and high arsenic levels in
soils over the cotton-growing areas of theUnited States reflect the
past use of such pesticides (US EPA, 2006; see Chapter 11.15).
Comparison of soil samples taken following the 2005 flooding
of New Orleans with archived soil samples collected in
1998–1999 suggests that the flooding resulted in the deposition
of arsenic-contaminated sediments (Rotkin-Ellman et al., 2010).
11.2.4.2 National and International Standards forDrinking Water
National standards for maximum concentrations of arsenic
in drinking water have been declining over the last few decades
as the toxicity of arsenic has become apparent. The 1903
report of the Royal Commission on Arsenic Poisoning in the
United Kingdom set a standard of 150 mg l�1. In 1942, the US
Public Health Service set a drinking-water standard of 50 mg l�1
for interstate water carriers and this was adopted nationally by
the US EPA in 1975.
The WHO guideline value for arsenic in drinking water was
reduced from 50 mg l�1 to a provisional value of 10 mg l�1 in
1993, based on a 6�104 excess skin cancer risk, 60 times higher
than the factor normally used to protect human health (Kapaj
et al., 2006). In most western countries, the limit for arsenic in
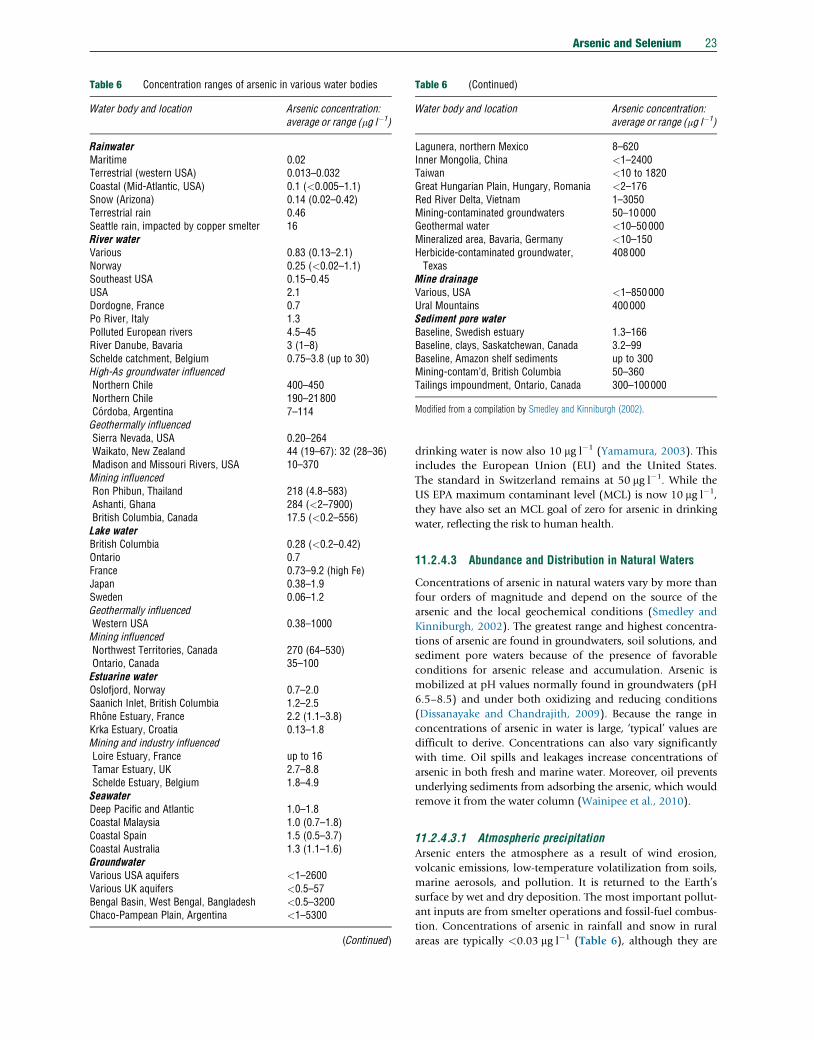
Table 6 Concentration ranges of arsenic in various water bodies
Water body and location Arsenic concentration:average or range (mg l�1)
RainwaterMaritime 0.02Terrestrial (western USA) 0.013–0.032Coastal (Mid-Atlantic, USA) 0.1 (<0.005–1.1)Snow (Arizona) 0.14 (0.02–0.42)Terrestrial rain 0.46Seattle rain, impacted by copper smelter 16River waterVarious 0.83 (0.13–2.1)Norway 0.25 (<0.02–1.1)Southeast USA 0.15–0.45USA 2.1Dordogne, France 0.7Po River, Italy 1.3Polluted European rivers 4.5–45River Danube, Bavaria 3 (1–8)Schelde catchment, Belgium 0.75–3.8 (up to 30)High-As groundwater influencedNorthern Chile 400–450Northern Chile 190–21800Cordoba, Argentina 7–114Geothermally influencedSierra Nevada, USA 0.20–264Waikato, New Zealand 44 (19–67): 32 (28–36)Madison and Missouri Rivers, USA 10–370Mining influencedRon Phibun, Thailand 218 (4.8–583)Ashanti, Ghana 284 (<2–7900)British Columbia, Canada 17.5 (<0.2–556)Lake waterBritish Columbia 0.28 (<0.2–0.42)Ontario 0.7France 0.73–9.2 (high Fe)Japan 0.38–1.9Sweden 0.06–1.2Geothermally influencedWestern USA 0.38–1000Mining influencedNorthwest Territories, Canada 270 (64–530)Ontario, Canada 35–100Estuarine waterOslofjord, Norway 0.7–2.0Saanich Inlet, British Columbia 1.2–2.5Rhone Estuary, France 2.2 (1.1–3.8)Krka Estuary, Croatia 0.13–1.8Mining and industry influencedLoire Estuary, France up to 16Tamar Estuary, UK 2.7–8.8Schelde Estuary, Belgium 1.8–4.9SeawaterDeep Pacific and Atlantic 1.0–1.8Coastal Malaysia 1.0 (0.7–1.8)Coastal Spain 1.5 (0.5–3.7)Coastal Australia 1.3 (1.1–1.6)GroundwaterVarious USA aquifers <1–2600Various UK aquifers <0.5–57Bengal Basin, West Bengal, Bangladesh <0.5–3200Chaco-Pampean Plain, Argentina <1–5300
(Continued)
Table 6 (Continued)
Water body and location Arsenic concentration:average or range (mg l�1)
Lagunera, northern Mexico 8–620Inner Mongolia, China <1–2400Taiwan <10 to 1820Great Hungarian Plain, Hungary, Romania <2–176Red River Delta, Vietnam 1–3050Mining-contaminated groundwaters 50–10000Geothermal water <10–50000Mineralized area, Bavaria, Germany <10–150Herbicide-contaminated groundwater,Texas
408000
Mine drainageVarious, USA <1–850000Ural Mountains 400000Sediment pore waterBaseline, Swedish estuary 1.3–166Baseline, clays, Saskatchewan, Canada 3.2–99Baseline, Amazon shelf sediments up to 300Mining-contam’d, British Columbia 50–360Tailings impoundment, Ontario, Canada 300–100000
Modified from a compilation by Smedley and Kinniburgh (2002).
Arsenic and Selenium 23
drinking water is now also 10 mg l�1 (Yamamura, 2003). This
includes the European Union (EU) and the United States.
The standard in Switzerland remains at 50 mg l�1. While the
US EPA maximum contaminant level (MCL) is now 10 mg l�1,
they have also set an MCL goal of zero for arsenic in drinking
water, reflecting the risk to human health.
11.2.4.3 Abundance and Distribution in Natural Waters
Concentrations of arsenic in natural waters vary by more than
four orders of magnitude and depend on the source of the
arsenic and the local geochemical conditions (Smedley and
Kinniburgh, 2002). The greatest range and highest concentra-
tions of arsenic are found in groundwaters, soil solutions, and
sediment pore waters because of the presence of favorable
conditions for arsenic release and accumulation. Arsenic is
mobilized at pH values normally found in groundwaters (pH
6.5–8.5) and under both oxidizing and reducing conditions
(Dissanayake and Chandrajith, 2009). Because the range in
concentrations of arsenic in water is large, ‘typical’ values are
difficult to derive. Concentrations can also vary significantly
with time. Oil spills and leakages increase concentrations of
arsenic in both fresh and marine water. Moreover, oil prevents
underlying sediments from adsorbing the arsenic, which would
remove it from the water column (Wainipee et al., 2010).
11.2.4.3.1 Atmospheric precipitationArsenic enters the atmosphere as a result of wind erosion,
volcanic emissions, low-temperature volatilization from soils,
marine aerosols, and pollution. It is returned to the Earth’s
surface by wet and dry deposition. The most important pollut-
ant inputs are from smelter operations and fossil-fuel combus-
tion. Concentrations of arsenic in rainfall and snow in rural
areas are typically <0.03 mg l�1 (Table 6), although they are
24 Arsenic and Selenium
generally higher in areas affected by smelters, coal burning,
and volcanic emissions. Andreae (1980) found arsenic concen-
trations of about 0.5 mg l�1 in rainfall from areas affected by
smelting and coal burning. Higher concentrations (average
16 mg l�1) have been reported in rainfall 35 km downwind of
a copper smelter in Seattle, USA (Crecelius, 1975). Values for
Arizona snowpacks (Barbaris and Betterton, 1996) are also
slightly above baseline concentrations, probably because of
inputs from smelters, power plants, and soil dust. A study of
sediments in Canada found that profiles of arsenic reflected its
deposition as a result of past coal combustion and historical
measurements of arsenic in dry and wet atmospheric deposi-
tion in rural areas of North America (Couture et al., 2008). In
most industrialized countries, sources of airborne arsenic are
limited as a result of air pollution-control measures. Unless
significantly contaminated, atmospheric precipitation contrib-
utes little arsenic to surface waters.
11.2.4.3.2 River waterConcentrations of arsenic in river waters are also low (typically
in the range 0.1–2.0 mg l�1; Table 6; see Chapter 7.7). They
vary according to bedrock lithology, river flow, the composi-
tion of the surface recharge, and the contribution from base-
flow. The lowest concentrations have been found in rivers
draining arsenic-poor bedrocks. Seyler and Martin (1991)
reported average concentrations as low as 0.13 mg l�1 in rivers
flowing over karstic limestone in the Krka region of Yugoslavia.
Lenvik et al. (1978) also reported average concentrations of
about 0.25 mg l�1 arsenic in rivers draining basement rocks in
Norway.
Relatively high concentrations of naturally occurring arse-
nic in rivers can occur as a result of geothermal activity or the
influx of high-arsenic groundwaters. Arsenic concentrations of
10–70 mg l�1 have been reported in river waters from geother-
mal areas, including the western United States and New Zealand
(McLaren and Kim, 1995; Nimick et al., 1998; Robinson et al.,
1995). Higher concentrations, up to 370 mg l�1, from the
Yellowstone geothermal system have been reported in the
Madison River in Wyoming and Montana as a result of geo-
thermal influence. Wilkie and Hering (1998) also found con-
centrations in the range of 85–153 mg l�1 in Hot Creek, a
tributary of the Owens River, California. Values higher than
27 mg l�1 are reported over the volcanic area of Naples, Italy
(FOREGS, 2005). Some river waters affected by geothermal
activity show distinct seasonal variations in arsenic concentra-
tion. Concentrations in the Madison River are highest during
low-flow conditions, reflecting the increased proportion of geo-
thermal water (Nimick et al., 1998). In the Waikato river system
of New Zealand, arsenic maxima occur in the summer months,
reflecting temperature-controlled microbial reduction of As(V)
to the more mobile As(III) species (McLaren and Kim, 1995).
Increased arsenic concentrations are also found in some
river waters dominated by baseflow in arid areas. Such waters
often have a high pH and alkalinity. For example, surface
waters from the Loa River Basin of northern Chile (Atacama
desert) contain naturally occurring arsenic in the range
190–21800 mg l�1 (Caceres et al., 1992). The high arsenic
concentrations correlate with high salinity. While geothermal
inputs of arsenic are likely to be important, evaporative con-
centration of the baseflow-dominated river water is also likely
to concentrate arsenic in the prevailing arid conditions. In-
creased arsenic concentrations (up to 114 mg l�1) have also
been reported in alkaline river waters from central Argentina
where regional groundwater arsenic concentrations are high
(Lerda and Prosperi, 1996).
Although bedrock influences river water arsenic concentra-
tions, rivers with typical pH and alkalinity values (�pH 5–7,
HCO3 < 100 mg l�1) generally contain lower concentrations
of arsenic, even where groundwater concentrations are high,
because of oxidation and adsorption of arsenic onto particu-
late matter in the stream bed and dilution by surface runoff.
Arsenic concentrations in the range of 0.5–2.7 mg l�1 have been
reported for seven river water samples from Bangladesh, with
one sample containing 29 mg l�1 (BGS and DPHE, 2001).
High arsenic concentrations in river waters can also reflect
pollution from industrial or sewage effluents. Andreae and
Andreae (1989) reported arsenic concentrations up to 30 mg l�1
in water from the River Zenne, Belgium, which is affected by
urban and industrial waste, particularly sewage. The background
arsenic concentration was in the range 0.75–3.8 mg l�1. Durum
et al. (1971) found that 79% of surface waters from the United
States had arsenic concentrations below the detection limit of
10 mg l�1. The highest concentration, 1100 mg l�1, was reported
from Sugar Creek, South Carolina, downstream of an industrial
complex.
Arsenic can also be derived from mine wastes and tailings.
Azcue and Nriagu (1995) reported baseline concentrations of
0.7 mg l�1 in the Moira River, Ontario, upstream of gold mine
tailings, with concentrations up to 23 mg l�1 downstream.
Azcue et al. (1994) reported concentrations up to 556 mg l�1
(average 17.5 mg l�1) in streams drainingmine tailings in British
Columbia. Williams et al. (1996) and Smedley (1996) noted
high arsenic concentrations (typically around 200–300 mg l�1)
in surface waters from areas of tin and goldmining, respectively.
Such anomalies tend to be localized because of the strong
adsorption of arsenic by oxide minerals, especially iron oxide,
under oxidizing and neutral to acidic conditions typical of many
surface waters. Arsenic concentrations are therefore not always
very high even in mining areas. For example, stream water
arsenic concentrations from the Dalsung Cu–W mining area of
Korea ranged from 0.8 to 19.1 mg l�1 (Jung et al., 2002).
11.2.4.3.3 Lake waterArsenic concentrations in lake waters are typically close to
or lower than those of river waters. Baseline concentrations
of <1 mg l�1 have been reported from Canada (Table 6)
(Azcue and Nriagu, 1995; Azcue et al., 1995). Higher concen-
trations in lake waters may reflect geothermal sources ormining
activity. Concentrations of 100–500 mg l�1 have been reported
in some mining areas and up to 1000 mg l�1 in geothermal
areas. However, arsenic concentrations can be much lower in
mining-affected lake waters as a result of adsorption onto iron
oxides under neutral to mildly acidic conditions. For example,
Azcue et al. (1994) reported concentrations in lake waters af-
fected by mining activity in Canada of about 0.3 mg l�1, close to
background values.
High arsenic concentrations can also occur in alkaline,
closed-basin lakes. Mono Lake, CA, has dissolved arsenic con-
centrations of 10000–20000 mg l�1 with pH values in the
range 9.5–10 as a result of the combined influences of
Arsenic and Selenium 25
geothermal activity, weathering of mineralized volcanic rocks,
evaporation of water at the lake surface, and a thriving popu-
lation of arsenate-respiring bacteria (Maest et al., 1992;
Oremland et al., 2000).
Arsenic concentrations show considerable variations in
stratified lakes because of changes in redox conditions or
biological activity (Aggett and O’Brien, 1985; Hering and
Kneebone, 2002). Arsenic concentrations increase with depth
in lake waters in Ontario, probably because of an increasing
ratio of As(III) to As(V) and an influx of mining-contaminated
sediment porewaters at the sediment–water interface (Azcue and
Nriagu, 1995). In other cases, seasonal depletion at the surface
parallels that of nutrients such as silicate (Kuhn and Sigg, 1993).
Concentrations are higher at depth in summer when the pro-
portion of As(III) is greatest, probably reflecting lower oxygen
concentrations as a result of biological productivity.
11.2.4.3.4 Seawater and estuariesAverage arsenic concentrations in open seawater are typically
around 1.5 mg l�1 (Table 6; see Chapter 8.2). Surface deple-
tion, as with nutrients such as silicate, has been observed in
some seawater samples, but not others. Concentrations in
estuarine water are more variable because of different river
inputs and salinity or redox gradients, but they typically con-
tain less than 4 mg l�1. Peterson and Carpenter (1983) found
arsenic concentrations of between 1.2 and 2.5 mg l�1 in waters
from Saanich Inlet, British Columbia. Concentrations of less
than 2 mg l�1 were found in Oslofjord, Norway (Abdullah
et al., 1995). Higher concentrations reflect industrial or mining
effluents (e.g., Tamar, Schelde, Loire Estuaries) or inputs of
geothermal water.
Some studies have reported conservative behavior during
estuarine mixing. In the unpolluted Krka Estuary of Yugoslavia,
Seyler and Martin (1991) observed a linear increase in total
arsenic with increasing salinity, ranging from 0.13 mg l�1 in
freshwaters to 1.8 mg l�1 offshore. Other studies, however,
have observed nonconservative behavior in estuaries due to
processes such as diffusion from sediment pore waters and
coprecipitation with iron oxides or anthropogenic inputs
(Andreae and Andreae, 1989; Andreae et al., 1983). The floccu-
lation of iron oxides at the freshwater–saline interface as a result
of increases in pH and salinity can lead tomajor decreases in the
arsenic flux to the oceans (Cullen and Reimer, 1989).
11.2.4.3.5 GroundwaterThe concentration of arsenic in most groundwater is<10 mg l�1
(Edmunds et al., 1989;Welch et al., 2000; seeChapter 11.1) and
often below the detection limits of routine analytical methods.
An analysis of groundwaters used for public supply in the
United States showed that only 7.6% exceeded 10 mg l�1 with
64% containing <1 mg l�1 (Focazio et al., 1999). Nonetheless,
naturally high-arsenic groundwaters are found in aquifers in
some areas of the world and concentrations occasionally reach
the milligram per liter range (Smedley and Kinniburgh, 2002).
Arsenic levels are naturally high in groundwaters in Bangladesh,
Hungary (Smedley and Kinniburgh, 2002), and Holland (Van
der Veer, 2006), associated with subsiding Holocene deltaic
sediments near recently emergent Himalayan or Alpine moun-
tain ranges. Industrially contaminated groundwater can also
give rise to very high dissolved arsenic concentrations, but
areas affected are usually localized. For example, Kuhlmeier
(1997) found concentrations of arsenic up to 408000 mg l�1 in
groundwater close to a herbicide plant in Texas.
The physicochemical conditions favoring arsenic mobiliza-
tion in aquifers are variable, complex, and poorly understood,
although some of the key factors leading to high groundwater
arsenic concentrations are now known. Mobilization can occur
under strongly reducing conditions where arsenic, mainly as
As(III), is released by desorption from, and/or dissolution of,
iron oxides. Many such aquifers are sufficiently reducing for
sulfate reduction, and in some cases for methane generation, to
occur (Ahmed et al., 1998). Immobilization under reducing
conditions is also possible: some sulfate-reducing microorgan-
isms can respire As(V) leading to the formation of an As2S3precipitate (Newman et al., 1997a,b). Some immobilization of
arsenic may also occur if iron sulfides are formed.
Reducing conditions favorable for arsenic mobilization
have been reported most frequently from young (Quaternary)
alluvial, deltaic sediments, where the interplay of tectonic,
isostatic, and eustatic factors have resulted in complex patterns
of sedimentation and the rapid burial of large amounts of
sediment together with fresh organic matter during delta pro-
gradation. Thick sequences of young sediments are quite often
the sites of high groundwater arsenic concentrations. The most
notable example of these conditions is the Bengal Basin which
incorporates Bangladesh and West Bengal (BGS and DPHE,
2001). Other examples include Nepal, Myanmar, Cambodia,
parts of northern China (Luo et al., 1997; Smedley et al., 2003;
Wang and Huang, 1994), the Great Hungarian Plain of
Hungary and Romania (Gurzau and Gurzau, 2001; Varsanyi
et al., 1991), the Red River Delta of Vietnam (Berg et al., 2001),
Mekong River Delta, Vietnam (Hoang et al., 2010), and parts
of western United States (Korte, 1991; Welch et al., 2000).
Recent groundwater extraction in many of these areas, either
for public supply or for irrigation, will have induced increased
groundwater flow and this could induce further transport of the
arsenic (Harvey et al., 2002). Probability modeling and mea-
sured arsenic concentrations in the Red River Delta, Vietnam,
indicate drawdown of arsenical waters from Holocene aquifers
to previously uncontaminated Pleistocene aquifers as a result
of >100 years of groundwater abstraction (Winkel et al., 2011).
High concentrations of naturally occurring arsenic are also
found in oxidizing conditions where groundwater pH values
are high (�>8) (Smedley and Kinniburgh, 2002). In such
environments, inorganic As(V) predominates and arsenic
concentrations are positively correlated with those of other
anion-forming species such as HCO3�, F�, H3BO3, and
H2VO4�. Examples include parts of western United States, for
example, the San Joaquin Valley, California (Fujii and Swain,
1995), Lagunera region of Mexico (Del Razo et al., 1990),
Antofagasta area of Chile (Caceres et al., 1992; Sancha and
Castro, 2001), and the Chaco-Pampean Plain of Argentina
(Nicolli et al., 1989; Smedley et al., 2002) (Table 6). These
high-arsenic groundwater provinces are usually in arid or semi-
arid regionswhere groundwater salinity is also high. Evaporation
has been suggested to be an important additional cause of arse-
nic accumulation in some arid areas (Welch and Lico, 1998).
High concentrations of arsenic have also been found in
groundwater from areas of bedrock and placer mineralization,
which are often the sites of mining activities. Arsenic
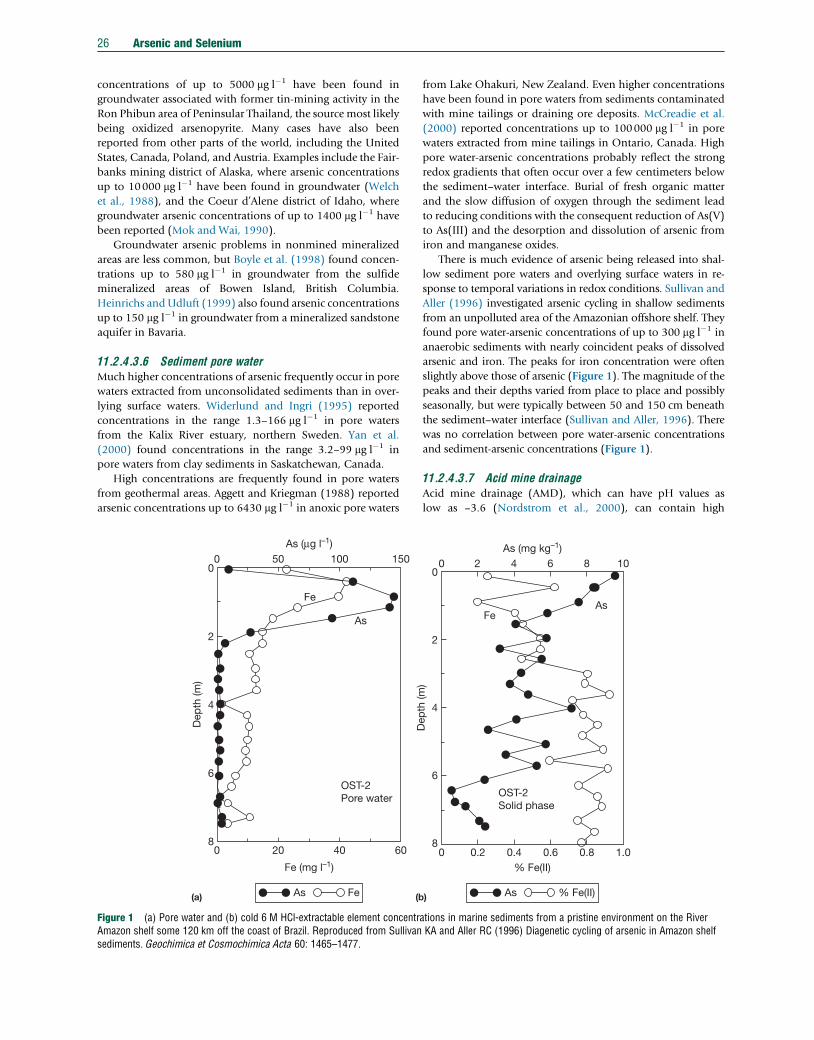
26 Arsenic and Selenium
concentrations of up to 5000 mg l�1 have been found in
groundwater associated with former tin-mining activity in the
Ron Phibun area of Peninsular Thailand, the source most likely
being oxidized arsenopyrite. Many cases have also been
reported from other parts of the world, including the United
States, Canada, Poland, and Austria. Examples include the Fair-
banks mining district of Alaska, where arsenic concentrations
up to 10000 mg l�1 have been found in groundwater (Welch
et al., 1988), and the Coeur d’Alene district of Idaho, where
groundwater arsenic concentrations of up to 1400 mg l�1 have
been reported (Mok and Wai, 1990).
Groundwater arsenic problems in nonmined mineralized
areas are less common, but Boyle et al. (1998) found concen-
trations up to 580 mg l�1 in groundwater from the sulfide
mineralized areas of Bowen Island, British Columbia.
Heinrichs and Udluft (1999) also found arsenic concentrations
up to 150 mg l�1 in groundwater from a mineralized sandstone
aquifer in Bavaria.
11.2.4.3.6 Sediment pore waterMuch higher concentrations of arsenic frequently occur in pore
waters extracted from unconsolidated sediments than in over-
lying surface waters. Widerlund and Ingri (1995) reported
concentrations in the range 1.3–166 mg l�1 in pore waters
from the Kalix River estuary, northern Sweden. Yan et al.
(2000) found concentrations in the range 3.2–99 mg l�1 in
pore waters from clay sediments in Saskatchewan, Canada.
High concentrations are frequently found in pore waters
from geothermal areas. Aggett and Kriegman (1988) reported
arsenic concentrations up to 6430 mg l�1 in anoxic pore waters
(b
0
0 20
Dep
th (m
)
OST-2Pore water
(a)
As
Fe (mg l–1)
As (µg l–1)
Fe
40 60
0
2
4
6
8
50 100 150
As Fe
Figure 1 (a) Pore water and (b) cold 6 M HCl-extractable element concentrAmazon shelf some 120 km off the coast of Brazil. Reproduced from Sullivansediments. Geochimica et Cosmochimica Acta 60: 1465–1477.
from Lake Ohakuri, New Zealand. Even higher concentrations
have been found in pore waters from sediments contaminated
with mine tailings or draining ore deposits. McCreadie et al.
(2000) reported concentrations up to 100000 mg l�1 in pore
waters extracted from mine tailings in Ontario, Canada. High
pore water-arsenic concentrations probably reflect the strong
redox gradients that often occur over a few centimeters below
the sediment–water interface. Burial of fresh organic matter
and the slow diffusion of oxygen through the sediment lead
to reducing conditions with the consequent reduction of As(V)
to As(III) and the desorption and dissolution of arsenic from
iron and manganese oxides.
There is much evidence of arsenic being released into shal-
low sediment pore waters and overlying surface waters in re-
sponse to temporal variations in redox conditions. Sullivan and
Aller (1996) investigated arsenic cycling in shallow sediments
from an unpolluted area of the Amazonian offshore shelf. They
found pore water-arsenic concentrations of up to 300 mg l�1 in
anaerobic sediments with nearly coincident peaks of dissolved
arsenic and iron. The peaks for iron concentration were often
slightly above those of arsenic (Figure 1). The magnitude of the
peaks and their depths varied from place to place and possibly
seasonally, but were typically between 50 and 150 cm beneath
the sediment–water interface (Sullivan and Aller, 1996). There
was no correlation between pore water-arsenic concentrations
and sediment-arsenic concentrations (Figure 1).
11.2.4.3.7 Acid mine drainageAcid mine drainage (AMD), which can have pH values as
low as –3.6 (Nordstrom et al., 2000), can contain high
0 2 4 6 8 10
0 0.2 0.4 0.6 0.8 1.0
Dep
th (m
)
As
)
Fe
As (mg kg–1)
% Fe(II)
OST-2Solid phase
0
2
4
6
8
% Fe(II)As
ations in marine sediments from a pristine environment on the RiverKA and Aller RC (1996) Diagenetic cycling of arsenic in Amazon shelf
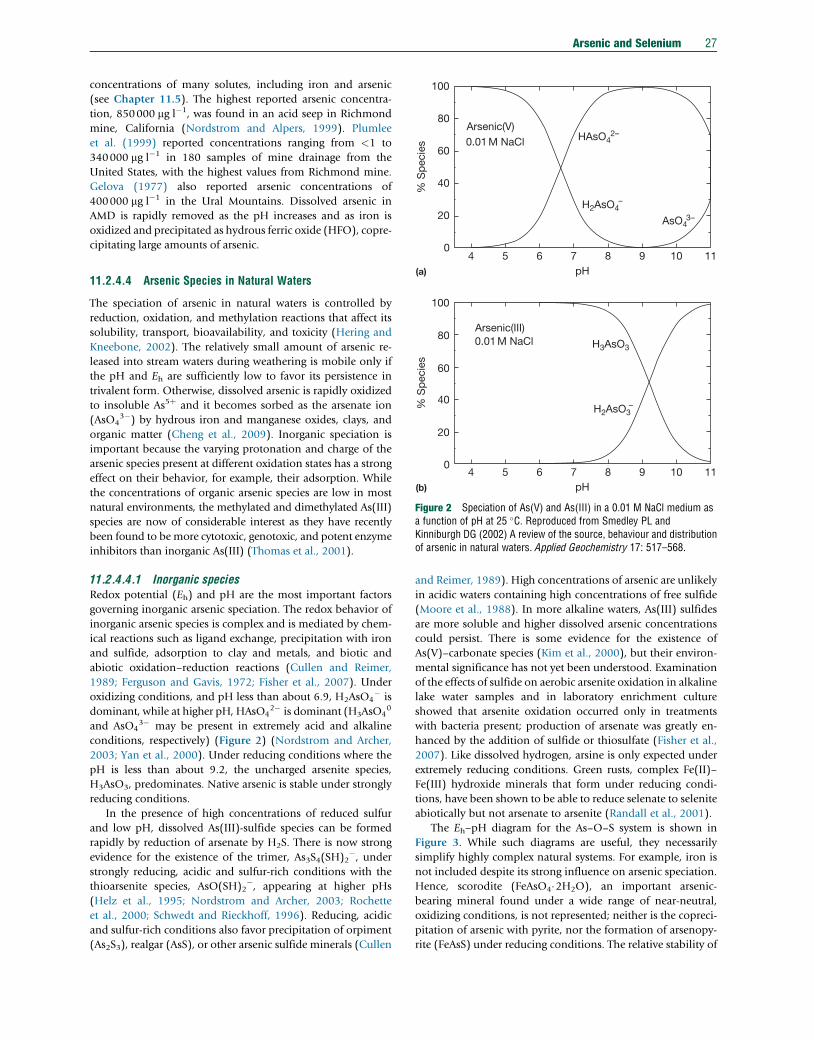
100
80Arsenic(V)0.01 M NaCl
% S
pec
ies HAsO4
2–
AsO4 3–
H2AsO4 –
60
40
20
0
Arsenic and Selenium 27
concentrations of many solutes, including iron and arsenic
(see Chapter 11.5). The highest reported arsenic concentra-
tion, 850000 mg l�1, was found in an acid seep in Richmond
mine, California (Nordstrom and Alpers, 1999). Plumlee
et al. (1999) reported concentrations ranging from <1 to
340000 mg l�1 in 180 samples of mine drainage from the
United States, with the highest values from Richmond mine.
Gelova (1977) also reported arsenic concentrations of
400000 mg l�1 in the Ural Mountains. Dissolved arsenic in
AMD is rapidly removed as the pH increases and as iron is
oxidized and precipitated as hydrous ferric oxide (HFO), copre-
cipitating large amounts of arsenic.
pH4
(a)
5 6 7 8 9 10 11
Arsenic(III)0.01 M NaCl
H2AsO3 –
H3AsO3
100
80
% S
pec
ies
60
40
20
0
(b) pH4 5 6 7 8 9 10 11
Figure 2 Speciation of As(V) and As(III) in a 0.01 M NaCl medium asa function of pH at 25 �C. Reproduced from Smedley PL andKinniburgh DG (2002) A review of the source, behaviour and distributionof arsenic in natural waters. Applied Geochemistry 17: 517–568.
11.2.4.4 Arsenic Species in Natural Waters
The speciation of arsenic in natural waters is controlled by
reduction, oxidation, and methylation reactions that affect its
solubility, transport, bioavailability, and toxicity (Hering and
Kneebone, 2002). The relatively small amount of arsenic re-
leased into stream waters during weathering is mobile only if
the pH and Eh are sufficiently low to favor its persistence in
trivalent form. Otherwise, dissolved arsenic is rapidly oxidized
to insoluble As5þ and it becomes sorbed as the arsenate ion
(AsO43�) by hydrous iron and manganese oxides, clays, and
organic matter (Cheng et al., 2009). Inorganic speciation is
important because the varying protonation and charge of the
arsenic species present at different oxidation states has a strong
effect on their behavior, for example, their adsorption. While
the concentrations of organic arsenic species are low in most
natural environments, the methylated and dimethylated As(III)
species are now of considerable interest as they have recently
been found to be more cytotoxic, genotoxic, and potent enzyme
inhibitors than inorganic As(III) (Thomas et al., 2001).
11.2.4.4.1 Inorganic speciesRedox potential (Eh) and pH are the most important factors
governing inorganic arsenic speciation. The redox behavior of
inorganic arsenic species is complex and is mediated by chem-
ical reactions such as ligand exchange, precipitation with iron
and sulfide, adsorption to clay and metals, and biotic and
abiotic oxidation–reduction reactions (Cullen and Reimer,
1989; Ferguson and Gavis, 1972; Fisher et al., 2007). Under
oxidizing conditions, and pH less than about 6.9, H2AsO4� is
dominant, while at higher pH, HAsO42� is dominant (H3AsO4
0
and AsO43� may be present in extremely acid and alkaline
conditions, respectively) (Figure 2) (Nordstrom and Archer,
2003; Yan et al., 2000). Under reducing conditions where the
pH is less than about 9.2, the uncharged arsenite species,
H3AsO3, predominates. Native arsenic is stable under strongly
reducing conditions.
In the presence of high concentrations of reduced sulfur
and low pH, dissolved As(III)-sulfide species can be formed
rapidly by reduction of arsenate by H2S. There is now strong
evidence for the existence of the trimer, As3S4(SH)2�, under
strongly reducing, acidic and sulfur-rich conditions with the
thioarsenite species, AsO(SH)2�, appearing at higher pHs
(Helz et al., 1995; Nordstrom and Archer, 2003; Rochette
et al., 2000; Schwedt and Rieckhoff, 1996). Reducing, acidic
and sulfur-rich conditions also favor precipitation of orpiment
(As2S3), realgar (AsS), or other arsenic sulfide minerals (Cullen
and Reimer, 1989). High concentrations of arsenic are unlikely
in acidic waters containing high concentrations of free sulfide
(Moore et al., 1988). In more alkaline waters, As(III) sulfides
are more soluble and higher dissolved arsenic concentrations
could persist. There is some evidence for the existence of
As(V)–carbonate species (Kim et al., 2000), but their environ-
mental significance has not yet been understood. Examination
of the effects of sulfide on aerobic arsenite oxidation in alkaline
lake water samples and in laboratory enrichment culture
showed that arsenite oxidation occurred only in treatments
with bacteria present; production of arsenate was greatly en-
hanced by the addition of sulfide or thiosulfate (Fisher et al.,
2007). Like dissolved hydrogen, arsine is only expected under
extremely reducing conditions. Green rusts, complex Fe(II)–
Fe(III) hydroxide minerals that form under reducing condi-
tions, have been shown to be able to reduce selenate to selenite
abiotically but not arsenate to arsenite (Randall et al., 2001).
The Eh–pH diagram for the As–O–S system is shown in
Figure 3. While such diagrams are useful, they necessarily
simplify highly complex natural systems. For example, iron is
not included despite its strong influence on arsenic speciation.
Hence, scorodite (FeAsO4�2H2O), an important arsenic-
bearing mineral found under a wide range of near-neutral,
oxidizing conditions, is not represented; neither is the copreci-
pitation of arsenic with pyrite, nor the formation of arsenopy-
rite (FeAsS) under reducing conditions. The relative stability of
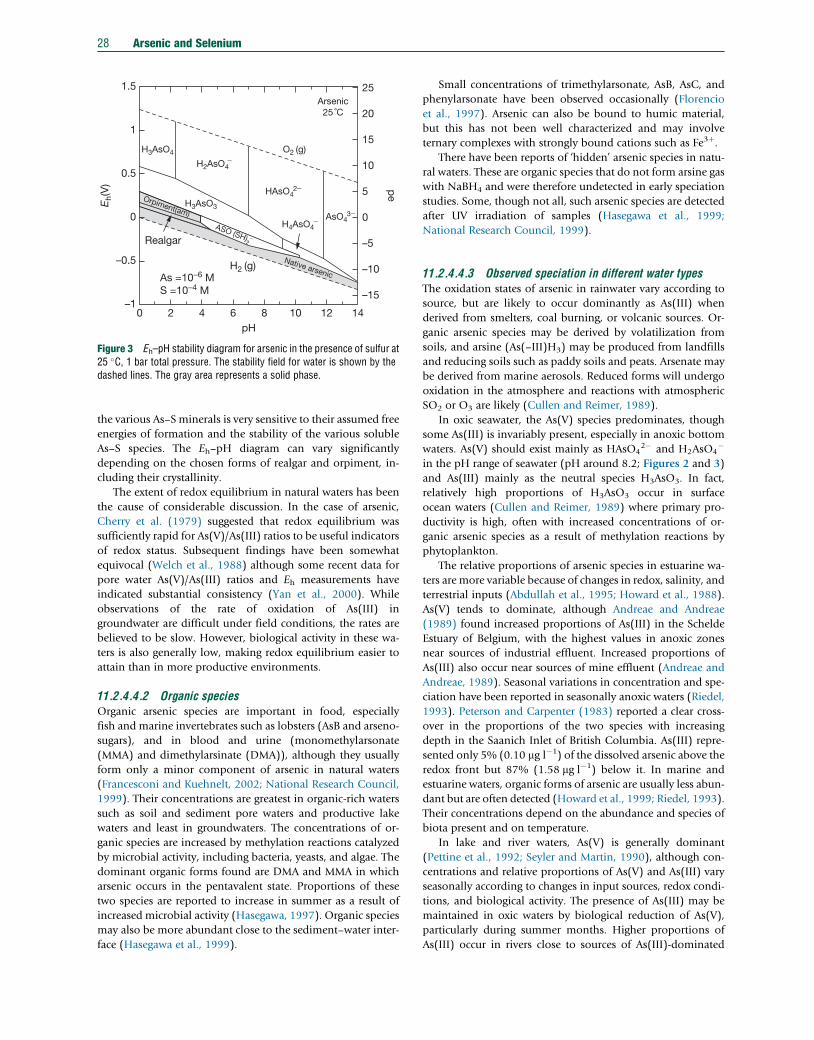
1.5
1
0.5
0
–0.5
–10 2 4 6 8 10 12 14
25
20
15
10
5
0
–5
–10
–15
H2AsO4 −
H4AsO4 −
H3AsO4 O2 (g)
H2 (g)
pH
Arsenic25 ˚C
pe
Eh(
V)
Realgar
As =10−6 MS =10−4 M
HAsO4 2−
AsO4 3−
H3AsO3Orpiment(am)
Native arsenic
ASO (SH)2
−
Figure 3 Eh–pH stability diagram for arsenic in the presence of sulfur at25 �C, 1 bar total pressure. The stability field for water is shown by thedashed lines. The gray area represents a solid phase.
28 Arsenic and Selenium
the various As–S minerals is very sensitive to their assumed free
energies of formation and the stability of the various soluble
As–S species. The Eh–pH diagram can vary significantly
depending on the chosen forms of realgar and orpiment, in-
cluding their crystallinity.
The extent of redox equilibrium in natural waters has been
the cause of considerable discussion. In the case of arsenic,
Cherry et al. (1979) suggested that redox equilibrium was
sufficiently rapid for As(V)/As(III) ratios to be useful indicators
of redox status. Subsequent findings have been somewhat
equivocal (Welch et al., 1988) although some recent data for
pore water As(V)/As(III) ratios and Eh measurements have
indicated substantial consistency (Yan et al., 2000). While
observations of the rate of oxidation of As(III) in
groundwater are difficult under field conditions, the rates are
believed to be slow. However, biological activity in these wa-
ters is also generally low, making redox equilibrium easier to
attain than in more productive environments.
11.2.4.4.2 Organic speciesOrganic arsenic species are important in food, especially
fish and marine invertebrates such as lobsters (AsB and arseno-
sugars), and in blood and urine (monomethylarsonate
(MMA) and dimethylarsinate (DMA)), although they usually
form only a minor component of arsenic in natural waters
(Francesconi and Kuehnelt, 2002; National Research Council,
1999). Their concentrations are greatest in organic-rich waters
such as soil and sediment pore waters and productive lake
waters and least in groundwaters. The concentrations of or-
ganic species are increased by methylation reactions catalyzed
by microbial activity, including bacteria, yeasts, and algae. The
dominant organic forms found are DMA and MMA in which
arsenic occurs in the pentavalent state. Proportions of these
two species are reported to increase in summer as a result of
increased microbial activity (Hasegawa, 1997). Organic species
may also be more abundant close to the sediment–water inter-
face (Hasegawa et al., 1999).
Small concentrations of trimethylarsonate, AsB, AsC, and
phenylarsonate have been observed occasionally (Florencio
et al., 1997). Arsenic can also be bound to humic material,
but this has not been well characterized and may involve
ternary complexes with strongly bound cations such as Fe3þ.There have been reports of ‘hidden’ arsenic species in natu-
ral waters. These are organic species that do not form arsine gas
with NaBH4 and were therefore undetected in early speciation
studies. Some, though not all, such arsenic species are detected
after UV irradiation of samples (Hasegawa et al., 1999;
National Research Council, 1999).
11.2.4.4.3 Observed speciation in different water typesThe oxidation states of arsenic in rainwater vary according to
source, but are likely to occur dominantly as As(III) when
derived from smelters, coal burning, or volcanic sources. Or-
ganic arsenic species may be derived by volatilization from
soils, and arsine (As(–III)H3) may be produced from landfills
and reducing soils such as paddy soils and peats. Arsenate may
be derived from marine aerosols. Reduced forms will undergo
oxidation in the atmosphere and reactions with atmospheric
SO2 or O3 are likely (Cullen and Reimer, 1989).
In oxic seawater, the As(V) species predominates, though
some As(III) is invariably present, especially in anoxic bottom
waters. As(V) should exist mainly as HAsO42� and H2AsO4
�
in the pH range of seawater (pH around 8.2; Figures 2 and 3)
and As(III) mainly as the neutral species H3AsO3. In fact,
relatively high proportions of H3AsO3 occur in surface
ocean waters (Cullen and Reimer, 1989) where primary pro-
ductivity is high, often with increased concentrations of or-
ganic arsenic species as a result of methylation reactions by
phytoplankton.
The relative proportions of arsenic species in estuarine wa-
ters are more variable because of changes in redox, salinity, and
terrestrial inputs (Abdullah et al., 1995; Howard et al., 1988).
As(V) tends to dominate, although Andreae and Andreae
(1989) found increased proportions of As(III) in the Schelde
Estuary of Belgium, with the highest values in anoxic zones
near sources of industrial effluent. Increased proportions of
As(III) also occur near sources of mine effluent (Andreae and
Andreae, 1989). Seasonal variations in concentration and spe-
ciation have been reported in seasonally anoxic waters (Riedel,
1993). Peterson and Carpenter (1983) reported a clear cross-
over in the proportions of the two species with increasing
depth in the Saanich Inlet of British Columbia. As(III) repre-
sented only 5% (0.10 mg l�1) of the dissolved arsenic above the
redox front but 87% (1.58 mg l�1) below it. In marine and
estuarine waters, organic forms of arsenic are usually less abun-
dant but are often detected (Howard et al., 1999; Riedel, 1993).
Their concentrations depend on the abundance and species of
biota present and on temperature.
In lake and river waters, As(V) is generally dominant
(Pettine et al., 1992; Seyler and Martin, 1990), although con-
centrations and relative proportions of As(V) and As(III) vary
seasonally according to changes in input sources, redox condi-
tions, and biological activity. The presence of As(III) may be
maintained in oxic waters by biological reduction of As(V),
particularly during summer months. Higher proportions of
As(III) occur in rivers close to sources of As(III)-dominated
Arsenic and Selenium 29
industrial effluent (Andreae and Andreae, 1989) or where there
is a component of geothermal water.
Proportions of As(III) and As(V) are particularly variable in
stratified lakes with seasonally variable redox gradients (Kuhn
and Sigg, 1993). In the stratified, hypersaline, hyperalkaline
Mono Lake (California, USA), As(V) predominates in the
upper oxic layer and As(III) in the reducing layer (Maest
et al., 1992; Oremland et al., 2000). Oremland et al. (2000)
measured in situ rates of dissimilatory As(V) reduction in the
lake and found that this could potentially mineralize 8–14% of
the annual pelagic primary productivity during meromixis, a
significant amount for a trace element, and about one-third of
the amount of sulphate reduction. Such reduction does not
occur in the presence of NO3. In fact, NO3 leads to the rapid,
microbial reoxidation of As(III) to As(V) (Hoeft et al., 2002).
Fe(III) acts similarly.
The speciation of arsenic in lakes does not always follow
thermodynamic predictions. Recent studies have shown that
arsenite predominates in the oxidized epilimnion of some
stratified lakes while arsenate may persist in the anoxic hypo-
limnion (Kuhn and Sigg, 1993; Newman et al., 1998; Seyler
and Martin, 1989). Proportions of arsenic species can also vary
according to the availability of particulate iron and manganese
oxides (Kuhn and Sigg, 1993; Pettine et al., 1992). Sunlight
could promote oxidation in surface waters (Voegelin and Hug,
2003).
In groundwaters, the ratio of As(III) to As(V) can vary
greatly in relation to changes in the abundance of redox-active
solids, especially organic carbon, the activity of microorgan-
isms, and the extent of convection and diffusion of oxygen
from the atmosphere. As(III) typically dominates in strongly
reducing aquifers in which Fe(III) and sulfate reduction is
taking place. Reducing high-arsenic groundwaters from
Bangladesh have As(III)/AsT ratios varying between 0.1 and
0.9 but are typically around 0.5–0.6 (Smedley et al., 2001a).
Ratios in reducing groundwaters from Inner Mongolia are
typically 0.6–0.9 (Smedley et al., 2003). Concentrations of
organic forms of arsenic are generally small or negligible in
groundwaters (e.g., Chen et al., 1995; Del Razo et al., 1990).
11.2.4.5 Microbial Controls
The toxicity of arsenic results from its ability to interfere with a
number of key biochemical processes. Arsenate can interfere
with phosphate biochemistry (oxidative phosphorylation) as a
result of their chemical similarity. Arsenite tends to inactivate
sulfhydryl groups of cysteine residues in proteins (Oremland
et al., 2002; Santini et al., 2002). Microbes have evolved various
detoxification strategies for dealing with this (Frankenberger,
2002; Mukhopadhyay et al., 2002; Rosen, 2002). Some mi-
crobes have also evolved to use arsenic as an energy source.
Certain chemoautotrophs oxidize As(III) by using O2, nitrate,
or Fe(III) as a terminal electron acceptor and CO2 as their sole
carbon source. A select group of other organisms grows in
anaerobic environments by using As(V) for the oxidation of
organic matter or H2 gas (Newman et al., 1998; Oremland and
Stolz, 2003; Oremland et al., 2002, 2000; Stolz and Oremland,
1999). Such so-called dissimilatory arsenate reduction (DAsR)
was discovered only relatively recently (Ahmann et al., 1994).
Fourteen species of Eubacteria, including Sulfurospirullum
species, have so far been shown to be capable of DAsR
(Herbel et al., 2002a) as well as two species of hyperthermo-
philes from the domain Archaea. Laboratory studies indicate
that microbial processes involved in As(V) reduction and
mobilization are many times faster than inorganic chemical
transformations and that microorganisms play an important
role in subsurface arsenic cycling (Ahmann et al., 1997;
Bhattacharya et al., 2007; Islam et al., 2004; Jones et al.,
2000). In Mono Lake, eastern California, a hypersaline and
alkaline water body bacterium strain GFAJ-1 of the Halomo-
nadaceae has been reported, which substitutes arsenic for
phosphorus to sustain its growth (Wolfe-Simon et al., 2011).
The bacterium Thiobacillus has been shown to have a direct
role in precipitating ferric arsenate sulfate (Leblanc et al.,
1996). Temporal variations between the proportions of arse-
nate and arsenite have been observed in the Waikato River,
New Zealand, and may reflect the reduction of As(V) to As(III)
by epiphytic bacteria associated with the alga Anabaena oscillar-
oides. Arsenate reduction does not necessarily take place as an
energy-providing (dissimilatory) process (Hoeft et al., 2002).
Detoxifying arsenate reductases in the cytoplasm does not
provide a means of energy generation. Macur et al. (2001)
found active As(V) to As(III) reduction under oxic conditions
in limed mine tailings, which they ascribed to a detoxification
rather than an energy-producing, respiratory process. This is
often combined with an As(III) efflux pump to expel the toxic
As(III) from the cell. Purely chemical (abiotic) reduction of
As(V) to As(III) has not been documented.
Arsenic can also be released indirectly as a result of other
microbially induced redox reactions. For example, the dissim-
ilatory iron-reducing bacterium Shewanella alga (strain BrY)
reduces Fe(III) to Fe(II) in scorodite (FeAsO4�2H2O), releasing
As(V) but not As(III) (Cummings et al., 1999). This process can
be rapid (Langner and Inskeep, 2000).
The rapid oxidation of As(III) has also been observed in the
geothermally fed Hot Creek in California (Wilkie and Hering,
1998). Oxidation with a pseudo-first-order half-life of approx-
imately 0.3 h was found to be controlled by bacteria attached
to macrophytes. Where microbial activity is high, there is
frequently a lack of equilibrium between the various redox
couples, including that of arsenic (Section 11.2.4.4). This is
especially true of soils (Masscheleyn et al., 1991).
11.2.5 Pathways and Behavior of Arsenic in theNatural Environment
Most high-arsenic natural waters are groundwaters from par-
ticular settings such as mineralized, mined, and geothermal
areas, young alluvial deltaic basins, and inland semiarid ba-
sins (Smedley and Kinniburgh, 2002). The most extensive
areas of affected groundwater are found in the low-lying
deltaic areas of Southeast Asia, especially the Bengal Basin,
and in the large plains (‘pampas’) of South America. The
sediments of these areas typically have ‘average’ total arsenic
concentrations although concentrations may increase in iron
oxide-rich sediments. The chemical, microbiological, and
hydrogeological processes involved in the mobilization of
arsenic in such groundwaters are poorly understood, but
30 Arsenic and Selenium
probably involve early diagenetic reactions driven by redox
and/or pH changes.
11.2.5.1 Release from Primary Minerals
The arsenic in many natural waters is likely to have been derived
naturally from the dissolution of a mineral phase. The most
important primary sources are sulfide minerals, particularly ar-
senic-rich pyrite, which can contain up to 10% arsenic, and
arsenopyrite (FeAsS). In one study, the greatest concentrations
of arsenic were found in fine-grained (<2 mm) pyrite formed at
relatively low temperatures (120–200 �C) (Simon et al., 1999).
A variety of other sulfide minerals such as orpiment As2S3and realgar As2S2 also occur in association with gold and base
metal deposits. Arsenic is a component of some complex
copper sulfides such as enargite (Cu3As4) and tennantite ((Cu,
Fe)12As4S13). Rare arsenides are also found inmineralized areas.
All of these minerals oxidize rapidly on exposure to the atmo-
sphere, releasing the arsenic to partition between water and
various secondaryminerals, particularly ironoxides. Bothmicro-
bially mediated redox reactions (Section 11.2.4.5) and abiotic
processes are involved. Bacteria can influence the oxidation state
of arsenic in aquatic environments (Oremland and Stolz, 2003).
Themicrobial oxidation of arsenicminerals such as arsenopyrite,
enargite, and orpiment has been discussed by Ehrlich (2002).
Oxidation of sulfide minerals can occur naturally or as a
result of mining activity. Arsenic-rich minerals around mines
may therefore produce arsenic-rich drainage locally, but this
tends to be attenuated rapidly as a result of adsorption of
various arsenic species by secondary minerals. Some of the
best-documented cases of arsenic contamination therefore
occur in areas of sulfide mineralization, particularly those
associated with gold deposits.
Oxidation is enhanced by mining excavations, mine dewa-
tering, ore roasting, and the redistribution of tailings in ponds
and heaps. In the past, this has been the cause of serious
environmental damage leading to high arsenic concentrations
in soils, stream sediments, surface waters and some groundwa-
ters, and even the local atmosphere. Although these activities
have often had a severe impact on the local environment, the
arsenic contamination in surface water and groundwater tends
to be restricted to within a few kilometers of the mine site.
Oxidation of arsenopyrite can be described by the reaction:
4FeAsSþ 13O2 þ 6H2O¼ 4Fe2þ þ 4AsO43� þ 4SO4
2� þ 12Hþ
which involves the release of acid, arsenic, and sulfate as
AMD (see Chapter 11.5). Further acidity is released by oxida-
tion of the Fe2þ and precipitation of HFO or schwertmannite.
These minerals readsorb some of the released arsenic, reducing
dissolved arsenic concentrations, and may eventually lead to
the formation of scorodite (FeAsO4�2H2O).
Experience from bioleaching of arsenic-rich gold ores has
shown that the ratio of pyrite to arsenopyrite is an important
factor controlling the speciation of the arsenic released
(Nyashanu et al., 1999). In the absence of pyrite, about 72%
of the arsenic released was As(III) whereas in the presence of
pyrite and Fe(III), 99% of the arsenic was As(V). It appears that
pyrite catalyzed the oxidation of As(III) by Fe(III) as Fe(III)
alone did not oxidize the arsenic (Nyashanu et al., 1999).
11.2.5.1.1 Examples of mining-related arsenic problemsMining and mineral processing can cause arsenic contamina-
tion of the atmosphere (in the form of airborne dust), sedi-
ment, soil, and water. The contamination can be long-lasting
and remain in the environment long after the activities have
ceased (Camm et al., 2003). Recent estimates suggest that there
are approximately 11 million tonnes of arsenic associated with
copper and lead reserves globally (USGS, 2005). In developing
mines containing significant amounts of arsenic, careful con-
sideration is now given to treatment of wastes and effluents to
ensure compliance with legislation on permitted levels of ar-
senic that can be emitted to the environment. Such legislation
is becoming increasingly stringent. Arsenic contamination
from former mining activities has been identified in many
areas of the world including the United States (Plumlee et al.,
1999; Welch et al., 1999, 1988, 2000), Canada, Thailand,
Korea, Ghana, Greece, Austria, Poland, and the United Kingdom
(Smedley and Kinniburgh, 2002). Groundwater in some of
these areas has been found with arsenic concentrations as
high as 48000 mg l�1. Elevated arsenic concentrations have
been reported in soils of various mining regions around the
world (Kreidie et al., 2011). Some mining areas have AMD
with such low pH values that the iron released by oxidation
of the iron sulfide minerals remains in solution and therefore
does not scavenge arsenic. Well-documented cases of arsenic
contamination in the United States include the Fairbanks gold-
mining district of Alaska (Welch et al., 1988; Wilson and
Hawkins, 1978), the Coeur d’Alene Pb–Zn–Ag mining area of
Idaho (Mok and Wai, 1990), the Leviathan Mine (S), California
(Webster et al., 1994), Mother Lode (Au), California (Savage
et al., 2000), Summitville (Au), Colorado (Pendleton et al.,
1995), Kelly Creek Valley (Au), Nevada (Grimes et al., 1995),
Clark Fork river (Cu), Montana (Welch et al., 2000), Lake
Oahe (Au), South Dakota (Ficklin and Callender, 1989), and
RichmondMine (Fe, Ag, Au, Cu, Zn), IronMountain, California
(Nordstrom et al., 2000).
Phytotoxic effects attributed to high concentrations of arse-
nic have also been reported around theMina Turmalina copper
mine in the Andes, northeast of Chiclayo, Peru (Bech et al.,
1997). The main ore minerals involved are chalcopyrite,
arsenopyrite, and pyrite. Arsenic-contaminated groundwater
in the Zimapan Valley, Mexico, has also been attributed to
interaction with Ag–Pb–Zn, carbonate-hosted mineralization
(Armienta et al., 1997). Arsenopyrite, scorodite, and tennantite
were identified as probable source minerals in this area. In-
creased concentrations of arsenic have been found as a result of
arsenopyrite occurring naturally in Cambro–Ordovician lode
gold deposits in Nova Scotia, Canada. Tailings and stream
sediment samples show high concentrations of arsenic
(39 ppm), and dissolved arsenic concentrations in surface wa-
ters and tailing pore waters indicate that the tailings continue
to release significant quantities of arsenic. Biological sampling
demonstrated that both arsenic and mercury have bioaccumu-
lated to various degrees in terrestrial and marine biota, includ-
ing eels, clams, and mussels (Parsons et al., 2006).
Data for 34 mining localities of different metallogenic types
in different climatic settings were reviewed byWilliams (2001).
He proposed that arsenopyrite is the principal source of arsenic
released in such environments and concluded that in situ
oxidation generally resulted in the formation of poorly soluble
Arsenic and Selenium 31
scorodite, which limited the mobility and ecotoxicity of arse-
nic. The Ron Phibun tin-mining district of Thailand is an
exception (Williams et al., 1996). In this area, arsenopyrite
oxidation products were suggested to have formed in the allu-
vial placer gravels during the mining phase. Following cessa-
tion of mining activity and pumping, groundwater rebound
caused dissolution of the oxidation products. The role of scor-
odite in the immobilization of arsenic frommine workings has
been questioned by Roussel et al. (2000), who point out that
the solubility of this mineral exceeds drinking water standards
irrespective of pH.
11.2.5.1.2 Modern practice in mine-waste stabilizationAlthough large international mining companies now generally
work to high environmental standards, mineral working by
uncontrolled and disorganized groups (especially for gold)
continues to cause environmental problems in a number of
developing countries.
Modern mining practices including waste storage and treat-
ment are designed to minimize the risk of environmental
impacts (Johnson, 1995). In most countries, environmental
impact assessments and environmental management plans
are now a statutory requirement of the mining approval pro-
cess. Such plans include criteria for siting and management of
waste heaps and for effluent control. Closure plans involving
waste stabilization and capping to limit AMD generation are
also required to reduce any legacy of environmental damage
(Lima and Wathern, 1999).
Treatment of AMD includes the use of liming, coagulation,
and flocculation (Kuyucak, 1998). Other passive technologies
include constructing wetlands that rely on sulfate reduction,
alkali generation, and the precipitation of metal sulfides. These
are often used as the final step in treating discharged water.
More recently, permeable reactive barriers (PRBs) have been
advocated. For example, Harris and Ragusa (2001) have dem-
onstrated that sulfate-reducing bacteria can be stimulated to
precipitate arsenic sulfides by the addition of rapidly decom-
posing plant material. Monhemius and Swash (1999) investi-
gated the addition of iron to copper- and arsenic-rich liquors to
form scorodite. The arsenic is immobilized by incorporation
into a crystalline, poorly soluble compound (Sides, 1995).
Swash and Monhemius (1996) have also investigated the
stabilization of arsenic as calcium arsenate.
11.2.5.2 Role of Secondary Minerals
11.2.5.2.1 The importance of arsenic cycling anddiagenesisThe close association between arsenic and iron in minerals is
frequently reflected by their strong correlation in soils and
sediments. Iron oxides play a crucial role in adsorbing arsenic
species, especially As(V), thereby lowering the concentration of
arsenic in natural waters. O’Reilly et al. (2001) suggested that
arsenic is specifically sorbed onto goethite through an inner-
sphere complex through a ligand-exchange process. Manga-
nese oxides play a role in the oxidation of As(III) to As(V)
and also adsorb significant quantities, although to a much
lesser degree than the more abundant iron oxides. HFO is a
very fine-grained, high surface area form of iron oxide that is
often formed in iron-rich environments in response to rapid
changes in redox or pH. It is frequently involved in the cycling
of As(III) and As(V). Significant As(V) desorption occurs at pH
values of approximately pH 8 and higher (Lumsdon et al.,
2001) and this process has been suggested to be important in
generating high-arsenic groundwaters (Smedley, 2003; Welch
et al., 2000). Arsenic can also be released under reducing
conditions (Section 11.2.5.5).
The mobility of arsenic can also be limited in sulfur-rich,
anaerobic environments by its coprecipitation with secondary
sulfide minerals, and more generally by clays. The precise
behavior of arsenic in sediments is poorly understood, but it
is likely that important changes occur during sediment diagen-
esis. Arsenic adsorbed on mineral surfaces is likely to be sensi-
tive to changes in the mineral properties such as surface charge
and surface area. A very small mass transfer from solid to
solution can lead to a large change in dissolved arsenic con-
centration. For example, sediments with average arsenic concen-
trations of less than 5–10 mg kg�1 can generate milligram per
liter concentrations of arsenic when only a small fraction
(<1%) of the total arsenic is partitioned into the water.
11.2.5.2.2 Redox behaviorSolid surfaces of many minerals, especially redox-sensitive
minerals like iron and manganese oxides, also play an impor-
tant role in redox reactions and interactions with microbes
(Brown et al., 1999; Grenthe et al., 1992). Solid Mn(IV)O2,
notably birnessite (d-MnO2), assists in the oxidation of As(III)
to As(V) while being partially reduced to Mn(II) (Oscarson
et al., 1983; Scott and Morgan, 1995). The rate of oxidation
depends on the surface area and surface charge of the MnO2
and is slightly greater at low pH (pH 4). The Mn(II) and As(V)
produced are partially retained or readsorbed by the MnO2
surface, which may lead in turn to a deceleration in the rate
of As(III) oxidation (Manning et al., 2002). Reactions with
birnessite at very high initial As(III) concentrations may lead
to the insoluble mineral krautite (MnHAsO4�H2O) being
formed on the birnessite surface (Tournassat et al., 2002).
The catalytic role of solid MnO2 in removing As(III) is used
to advantage in water treatment (Daus et al., 2000; Driehaus
et al., 1995). TiO2 minerals and Ti-containing clays may also
be able to oxidize As(III).
HFO and other iron oxides may also play a significant role
in the oxidation of As(III) in natural waters, as the oxidation of
As(III) adsorbed by HFO is catalyzed by H2O2 (Voegelin and
Hug, 2003). This reaction may be significant in natural
environments, with high H2O2 concentrations (1–10 mM)
and alkaline pHs, or in water treatment systems where H2O2
is used. Similar surface-catalyzed reactions do not occur with
aluminum oxides (Voegelin and Hug, 2003).
The reductive dissolution of Fe(III) oxides in reducing sed-
iments and soils (McGeehan et al., 1998) can also lead to the
release of adsorbed and coprecipitated arsenic. Reduction
and release of arsenic can precede any dissolution of the iron
oxides themselves (Masscheleyn et al., 1991). These processes
are likely to be the same as those responsible for the develop-
ment of high-arsenic groundwaters in the Bengal Basin
(Bhattacharya et al., 1997; Kinniburgh et al., 2003; Nickson
et al., 2000) and other reducing alluvial aquifers (Korte and
Fernando, 1991). The release of sorbed arsenic during diagenetic
changes of iron oxides, including loss of surface area, changes in
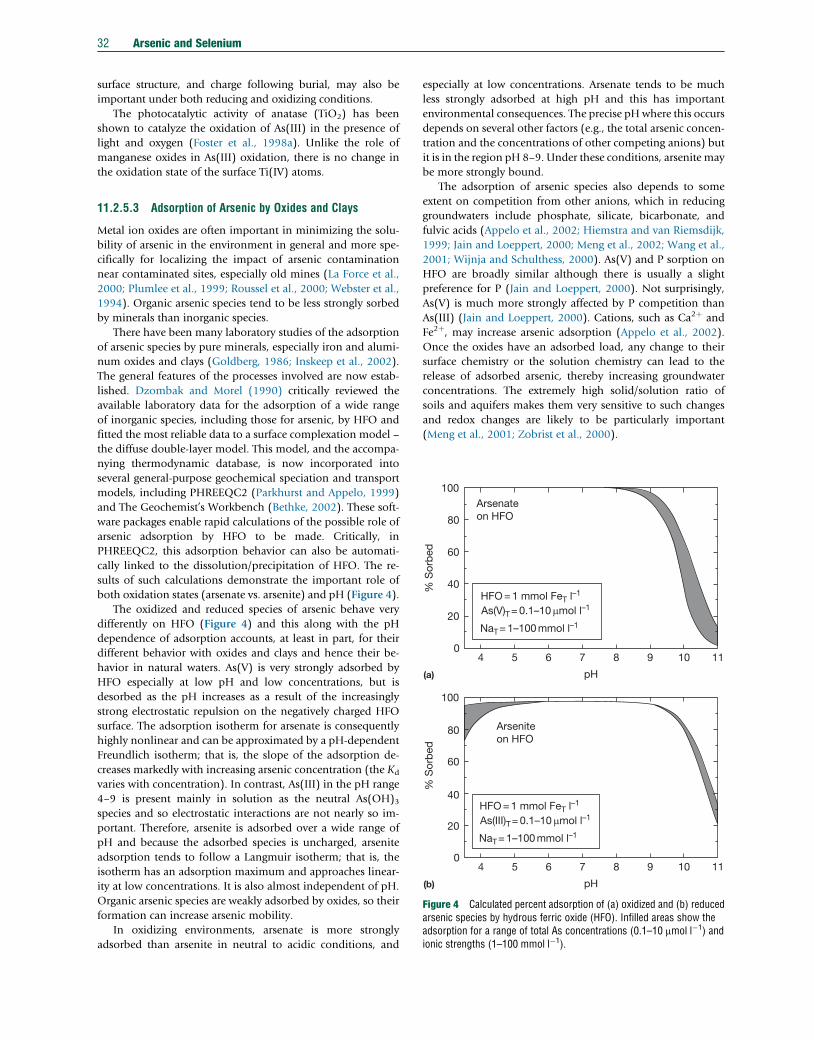
32 Arsenic and Selenium
surface structure, and charge following burial, may also be
important under both reducing and oxidizing conditions.
The photocatalytic activity of anatase (TiO2) has been
shown to catalyze the oxidation of As(III) in the presence of
light and oxygen (Foster et al., 1998a). Unlike the role of
manganese oxides in As(III) oxidation, there is no change in
the oxidation state of the surface Ti(IV) atoms.
100Arsenateon HFO80
60
% S
orb
ed%
Sor
bed
40
20
0
100
80
60
40
20
0
4 5 6
As(V)T= 0.1–10mmol l–1
NaT= 1–100 mmol l–1
HFO = 1 mmol FeT l–1
Arseniteon HFO
As(III)T= 0.1–10mmol l–1
NaT= 1–100 mmol l–1
HFO = 1 mmol FeT l–1
7
pH(a)
(b) pH
8 9 10 11
4 5 6 7 8 9 10 11
Figure 4 Calculated percent adsorption of (a) oxidized and (b) reducedarsenic species by hydrous ferric oxide (HFO). Infilled areas show theadsorption for a range of total As concentrations (0.1–10 mmol l�1) andionic strengths (1–100 mmol l�1).
11.2.5.3 Adsorption of Arsenic by Oxides and Clays
Metal ion oxides are often important in minimizing the solu-
bility of arsenic in the environment in general and more spe-
cifically for localizing the impact of arsenic contamination
near contaminated sites, especially old mines (La Force et al.,
2000; Plumlee et al., 1999; Roussel et al., 2000; Webster et al.,
1994). Organic arsenic species tend to be less strongly sorbed
by minerals than inorganic species.
There have been many laboratory studies of the adsorption
of arsenic species by pure minerals, especially iron and alumi-
num oxides and clays (Goldberg, 1986; Inskeep et al., 2002).
The general features of the processes involved are now estab-
lished. Dzombak and Morel (1990) critically reviewed the
available laboratory data for the adsorption of a wide range
of inorganic species, including those for arsenic, by HFO and
fitted the most reliable data to a surface complexation model –
the diffuse double-layer model. This model, and the accompa-
nying thermodynamic database, is now incorporated into
several general-purpose geochemical speciation and transport
models, including PHREEQC2 (Parkhurst and Appelo, 1999)
and The Geochemist’s Workbench (Bethke, 2002). These soft-
ware packages enable rapid calculations of the possible role of
arsenic adsorption by HFO to be made. Critically, in
PHREEQC2, this adsorption behavior can also be automati-
cally linked to the dissolution/precipitation of HFO. The re-
sults of such calculations demonstrate the important role of
both oxidation states (arsenate vs. arsenite) and pH (Figure 4).
The oxidized and reduced species of arsenic behave very
differently on HFO (Figure 4) and this along with the pH
dependence of adsorption accounts, at least in part, for their
different behavior with oxides and clays and hence their be-
havior in natural waters. As(V) is very strongly adsorbed by
HFO especially at low pH and low concentrations, but is
desorbed as the pH increases as a result of the increasingly
strong electrostatic repulsion on the negatively charged HFO
surface. The adsorption isotherm for arsenate is consequently
highly nonlinear and can be approximated by a pH-dependent
Freundlich isotherm; that is, the slope of the adsorption de-
creases markedly with increasing arsenic concentration (the Kd
varies with concentration). In contrast, As(III) in the pH range
4–9 is present mainly in solution as the neutral As(OH)3species and so electrostatic interactions are not nearly so im-
portant. Therefore, arsenite is adsorbed over a wide range of
pH and because the adsorbed species is uncharged, arsenite
adsorption tends to follow a Langmuir isotherm; that is, the
isotherm has an adsorption maximum and approaches linear-
ity at low concentrations. It is also almost independent of pH.
Organic arsenic species are weakly adsorbed by oxides, so their
formation can increase arsenic mobility.
In oxidizing environments, arsenate is more strongly
adsorbed than arsenite in neutral to acidic conditions, and
especially at low concentrations. Arsenate tends to be much
less strongly adsorbed at high pH and this has important
environmental consequences. The precise pH where this occurs
depends on several other factors (e.g., the total arsenic concen-
tration and the concentrations of other competing anions) but
it is in the region pH 8–9. Under these conditions, arsenite may
be more strongly bound.
The adsorption of arsenic species also depends to some
extent on competition from other anions, which in reducing
groundwaters include phosphate, silicate, bicarbonate, and
fulvic acids (Appelo et al., 2002; Hiemstra and van Riemsdijk,
1999; Jain and Loeppert, 2000; Meng et al., 2002; Wang et al.,
2001; Wijnja and Schulthess, 2000). As(V) and P sorption on
HFO are broadly similar although there is usually a slight
preference for P (Jain and Loeppert, 2000). Not surprisingly,
As(V) is much more strongly affected by P competition than
As(III) (Jain and Loeppert, 2000). Cations, such as Ca2þ and
Fe2þ, may increase arsenic adsorption (Appelo et al., 2002).
Once the oxides have an adsorbed load, any change to their
surface chemistry or the solution chemistry can lead to the
release of adsorbed arsenic, thereby increasing groundwater
concentrations. The extremely high solid/solution ratio of
soils and aquifers makes them very sensitive to such changes
and redox changes are likely to be particularly important
(Meng et al., 2001; Zobrist et al., 2000).
Arsenic and Selenium 33
Adsorption by aluminum and manganese oxides and clays
has not been studied much (Inskeep et al., 2002). As(III) binds
strongly to amorphous Al(OH)3 over pH range 6–9.5, a some-
what greater range than found for HFO. It also binds signifi-
cantly but somewhat less strongly to montmorillonitic and
kaolinitic clays (Manning and Goldberg, 1997). As(V) shows
the same declining affinity for clays at high pH as shown by
HFO, but in the case of the clays, this decline may begin to
occur above pH 7.
11.2.5.4 Arsenic Transport
There are few observations of arsenic transport in aquifers and
its rate of movement under a range of conditions is poorly
understood. The transport of arsenic, as with many other che-
micals, is closely related to adsorption–desorption reactions
(Appelo and Postma, 1993). Arsenate and arsenite have differ-
ent adsorption isotherms and would be predicted therefore to
travel through aquifers at different velocities, leading to their
separation along the flow path.
Gulens et al. (1979) used breakthrough experiments with
columns of sand (containing 0.6% iron and 0.01% manga-
nese) and various groundwaters pumped continuously from
piezometers to study As(III) and As(V) mobility over a range of
Eh and pH conditions. Radioactive 74As (half-life¼17.7 days)
and 76As (half-life¼26.4 h) were used to monitor the break-
through of arsenic. The results showed that (1) As(III) moved
5–6 times faster than As(V) under oxidizing conditions with
pH in the range 5.7–6.9; (2) As(V) moved much faster at the
lowest pH but was still slower than As(III) under reducing
groundwater conditions; and (3) with a pH of 8.3, both
As(III) and As(V) moved rapidly through the column but
when the amount of arsenic injected was substantially reduced,
the mobility of the As(III) and As(V) was greatly reduced. This
chromatographic effect (used to advantage in analytical chem-
istry to speciate arsenic) may account in part for the highly
variable As(III)/As(V) ratios found in many reducing aquifers.
Chromatographic separation of arsenic and other species
during transport would also destroy the original source char-
acteristics, for example, between arsenic and iron, further com-
plicating interpretation of well water analyses.
Few field-based investigations, which allow the partition
coefficient (Kd) or retardation factor of arsenic species to be
determined directly, have been carried out on natural systems.
However, the work of Sullivan and Aller (1996) indicates thatKd
values calculated for sediment profiles from the Amazon Shelf
are in the approximate range of 11–5000 lkg�1. High-arsenic
pore waters were mostly found in zones with low Kd values
(typically <100 lkg�1). Evidence from various studies also sug-
gests low Kd values (<10 lkg�1) for arsenic in aquifers in which
there are high arsenic concentrations (Smedley and Kinniburgh,
2002). Factors controlling the partition coefficients are poorly
understood and involve the chemistry of the groundwater and
the surface chemistry and stability of solid phases present.
11.2.5.5 Impact of Changing Environmental Conditions
Arsenic moves between different environmental compartments
(rock–soil–water–air–biota) from the local to the global scale
partly as a result of pH and redox changes. Being a minor
component in the natural environment, arsenic responds to
such changes rather than creates them. These changes are
driven by the major (bio)geochemical cycles.
11.2.5.5.1 Release of arsenic at high pHHigh arsenic concentrations can develop in groundwaters as
As(V) is released from oxide minerals and clays at high pH.
High pH conditions frequently develop in arid areas as a result
of extensive mineral weathering with proton uptake. This is
especially true in environments dominated by sodium rather
than by calcium, as CaCO3 minerals restrict the development
of high pHs.
11.2.5.5.2 Release of arsenic on reductionFlooding of soils generates anaerobic conditions and can lead
to the rapid release of arsenic (and phosphate) to the soil
solution (Deuel and Swoboda, 1972; Reynolds et al., 1999).
Similarly, arsenic can be released to pore water in buried
sediments. The concentration of dissolved arsenic in some
north Atlantic pore waters varies inversely with the concentra-
tion of easily leachable arsenic in the solid phase and directly
with increasing concentrations of solid phase Fe(II) (Sullivan
and Aller, 1996). This reflects a strong redox coupling between
arsenic and iron whereby oxidized arsenic is associated with
iron oxides in surface sediments and is subsequently reduced
and released into pore water with burial. Upward diffusion and
reworking of sediment releases the dissolved arsenic to the
water column or releases it for readsorption in surface sedi-
ments as HFO is formed (Petersen et al., 1995). Some reducing,
iron-rich aquifers also contain high concentrations of arsenic
(Korte, 1991), but there are also many iron-rich groundwaters
with low arsenic concentrations.
11.2.5.6 Case Studies
11.2.5.6.1 The Bengal Basin, Bangladesh, and IndiaIn terms of the number of people at risk, the high-arsenic
groundwaters from the alluvial and deltaic aquifers of
Bangladesh and West Bengal represent the most serious threat
to public health from arsenic yet identified. Health problems
from this source were first identified inWest Bengal in the 1980s
but remained unrecognized in Bangladesh until 1993. In fact,
the scale of this disaster in Bangladesh is greater than any
such previous incident, including the accidents at Bhopal,
India, in 1984, and Chernobyl, Ukraine, in 1986 (Smith et al.,
2000). Concentrations of arsenic in groundwaters from the af-
fected areas have a very large range from <0.5 to �3200 mg l�1
(Kinniburgh et al., 2003). In a surveyof Bangladesh groundwater
by BGS and DPHE (2001), 27% of shallow (<150 m) tubewells
in Bangladesh were found to contain more than the national
standard of 50 mg l�1 for arsenic in drinking water.
Groundwater surveys indicate that the worst-affected area
is in southeast Bangladesh (Figure 5) where more than 60%
of the wells in some districts are affected. It is estimated
that approximately 30–35 million people in Bangladesh and 6
million inWest Bengal are at risk from arsenic concentrations of
more than 50 mg l�1 in their drinking water (BGS and DPHE,
2001). A study of the data collected by the DPHE–UNICEF
(Bangladesh Department of Public Health Engineering–United
Nations International Children’s Emergency Fund) arsenic
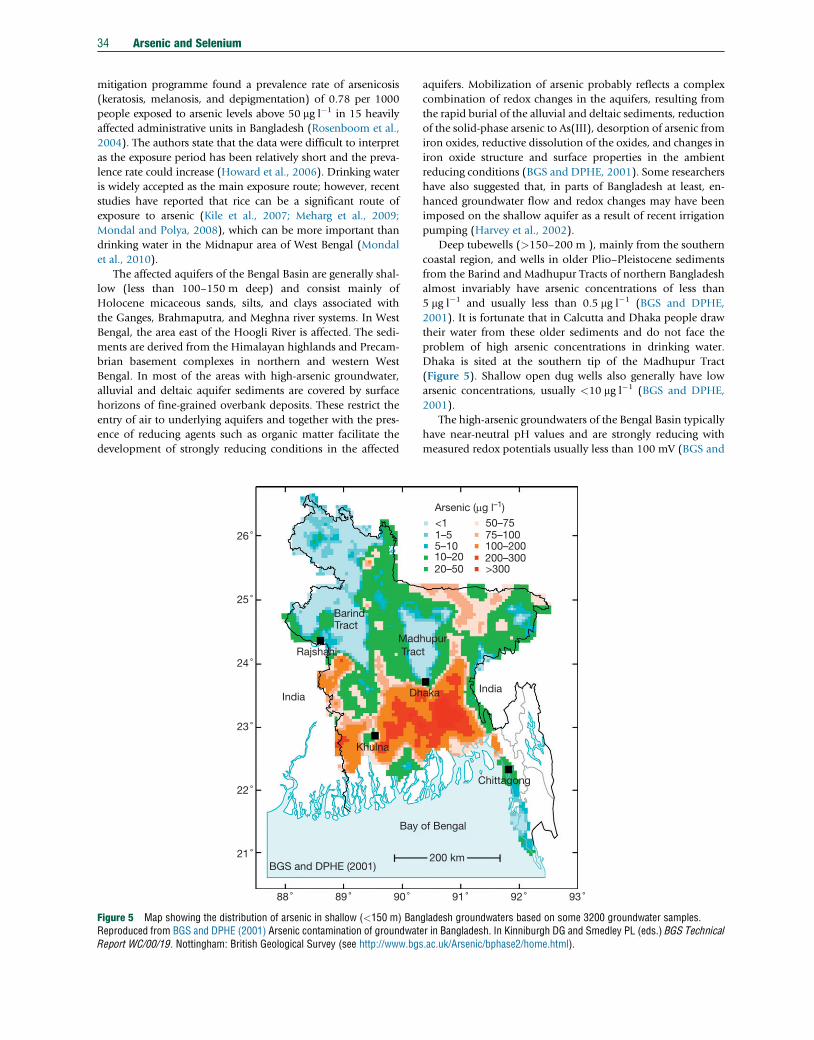
34 Arsenic and Selenium
mitigation programme found a prevalence rate of arsenicosis
(keratosis, melanosis, and depigmentation) of 0.78 per 1000
people exposed to arsenic levels above 50 mg l�1 in 15 heavily
affected administrative units in Bangladesh (Rosenboom et al.,
2004). The authors state that the data were difficult to interpret
as the exposure period has been relatively short and the preva-
lence rate could increase (Howard et al., 2006). Drinking water
is widely accepted as the main exposure route; however, recent
studies have reported that rice can be a significant route of
exposure to arsenic (Kile et al., 2007; Meharg et al., 2009;
Mondal and Polya, 2008), which can be more important than
drinking water in the Midnapur area of West Bengal (Mondal
et al., 2010).
The affected aquifers of the Bengal Basin are generally shal-
low (less than 100–150 m deep) and consist mainly of
Holocene micaceous sands, silts, and clays associated with
the Ganges, Brahmaputra, and Meghna river systems. In West
Bengal, the area east of the Hoogli River is affected. The sedi-
ments are derived from the Himalayan highlands and Precam-
brian basement complexes in northern and western West
Bengal. In most of the areas with high-arsenic groundwater,
alluvial and deltaic aquifer sediments are covered by surface
horizons of fine-grained overbank deposits. These restrict the
entry of air to underlying aquifers and together with the pres-
ence of reducing agents such as organic matter facilitate the
development of strongly reducing conditions in the affected
26 ˚
25 ˚BarindTract
Rajshahi
India
Khulna
Dh
TracMad
Bay
BGS and DPHE (2001)
24 ˚
23 ˚
22 ˚
21 ˚
88 ˚ 89 ˚ 90 ˚
Figure 5 Map showing the distribution of arsenic in shallow (<150 m) BanReproduced from BGS and DPHE (2001) Arsenic contamination of groundwatReport WC/00/19. Nottingham: British Geological Survey (see http://www.bgs
aquifers. Mobilization of arsenic probably reflects a complex
combination of redox changes in the aquifers, resulting from
the rapid burial of the alluvial and deltaic sediments, reduction
of the solid-phase arsenic to As(III), desorption of arsenic from
iron oxides, reductive dissolution of the oxides, and changes in
iron oxide structure and surface properties in the ambient
reducing conditions (BGS and DPHE, 2001). Some researchers
have also suggested that, in parts of Bangladesh at least, en-
hanced groundwater flow and redox changes may have been
imposed on the shallow aquifer as a result of recent irrigation
pumping (Harvey et al., 2002).
Deep tubewells (>150–200 m ), mainly from the southern
coastal region, and wells in older Plio–Pleistocene sediments
from the Barind and Madhupur Tracts of northern Bangladesh
almost invariably have arsenic concentrations of less than
5 mg l�1 and usually less than 0.5 mg l�1 (BGS and DPHE,
2001). It is fortunate that in Calcutta and Dhaka people draw
their water from these older sediments and do not face the
problem of high arsenic concentrations in drinking water.
Dhaka is sited at the southern tip of the Madhupur Tract
(Figure 5). Shallow open dug wells also generally have low
arsenic concentrations, usually <10 mg l�1 (BGS and DPHE,
2001).
The high-arsenic groundwaters of the Bengal Basin typically
have near-neutral pH values and are strongly reducing with
measured redox potentials usually less than 100 mV (BGS and
aka
thupur
<11–55–1010–2020–50 >300
200–300100–20075–10050–75
Arsenic (mg l–1)
India
Chittagong
of Bengal
200 km
91 ˚ 92 ˚ 93 ˚
gladesh groundwaters based on some 3200 groundwater samples.er in Bangladesh. In Kinniburgh DG and Smedley PL (eds.) BGS Technical.ac.uk/Arsenic/bphase2/home.html).
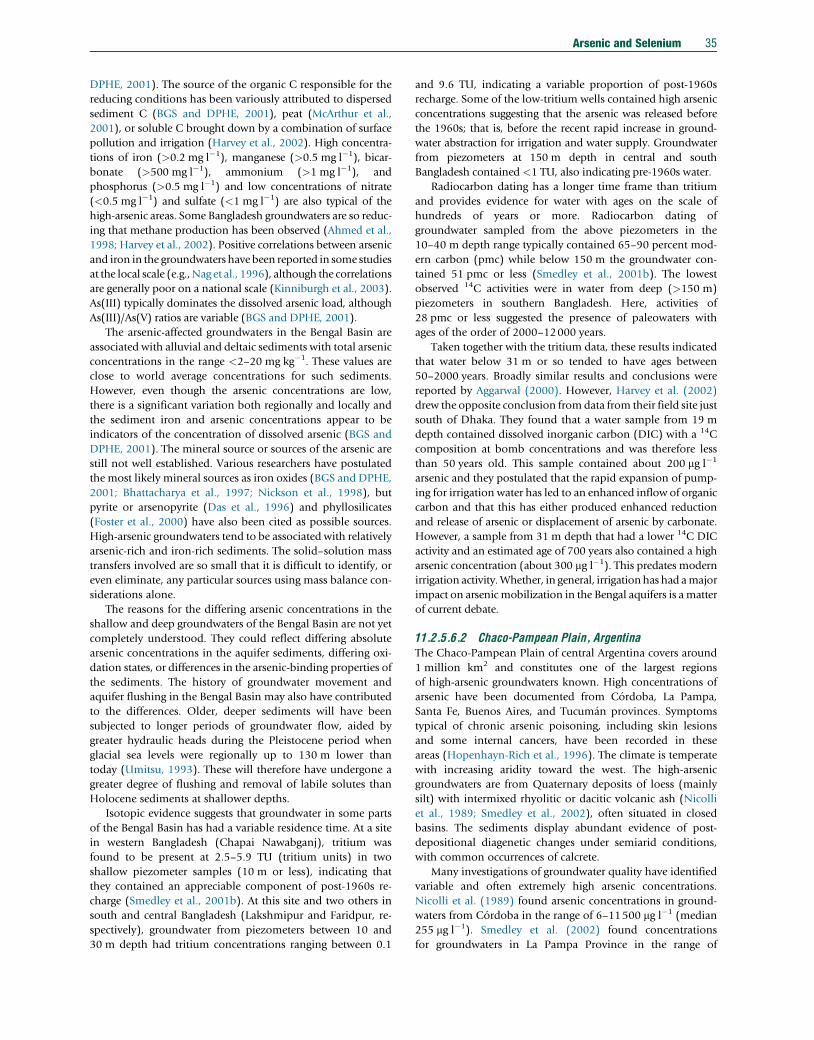
Arsenic and Selenium 35
DPHE, 2001). The source of the organic C responsible for the
reducing conditions has been variously attributed to dispersed
sediment C (BGS and DPHE, 2001), peat (McArthur et al.,
2001), or soluble C brought down by a combination of surface
pollution and irrigation (Harvey et al., 2002). High concentra-
tions of iron (>0.2 mg l�1), manganese (>0.5 mg l�1), bicar-
bonate (>500 mg l�1), ammonium (>1 mg l�1), and
phosphorus (>0.5 mg l�1) and low concentrations of nitrate
(<0.5 mg l�1) and sulfate (<1 mg l�1) are also typical of the
high-arsenic areas. Some Bangladesh groundwaters are so reduc-
ing that methane production has been observed (Ahmed et al.,
1998; Harvey et al., 2002). Positive correlations between arsenic
and iron in the groundwaters have been reported in some studies
at the local scale (e.g.,Nag et al., 1996), although the correlations
are generally poor on a national scale (Kinniburgh et al., 2003).
As(III) typically dominates the dissolved arsenic load, although
As(III)/As(V) ratios are variable (BGS and DPHE, 2001).
The arsenic-affected groundwaters in the Bengal Basin are
associated with alluvial and deltaic sediments with total arsenic
concentrations in the range <2–20 mg kg�1. These values are
close to world average concentrations for such sediments.
However, even though the arsenic concentrations are low,
there is a significant variation both regionally and locally and
the sediment iron and arsenic concentrations appear to be
indicators of the concentration of dissolved arsenic (BGS and
DPHE, 2001). The mineral source or sources of the arsenic are
still not well established. Various researchers have postulated
the most likely mineral sources as iron oxides (BGS and DPHE,
2001; Bhattacharya et al., 1997; Nickson et al., 1998), but
pyrite or arsenopyrite (Das et al., 1996) and phyllosilicates
(Foster et al., 2000) have also been cited as possible sources.
High-arsenic groundwaters tend to be associated with relatively
arsenic-rich and iron-rich sediments. The solid–solution mass
transfers involved are so small that it is difficult to identify, or
even eliminate, any particular sources using mass balance con-
siderations alone.
The reasons for the differing arsenic concentrations in the
shallow and deep groundwaters of the Bengal Basin are not yet
completely understood. They could reflect differing absolute
arsenic concentrations in the aquifer sediments, differing oxi-
dation states, or differences in the arsenic-binding properties of
the sediments. The history of groundwater movement and
aquifer flushing in the Bengal Basin may also have contributed
to the differences. Older, deeper sediments will have been
subjected to longer periods of groundwater flow, aided by
greater hydraulic heads during the Pleistocene period when
glacial sea levels were regionally up to 130 m lower than
today (Umitsu, 1993). These will therefore have undergone a
greater degree of flushing and removal of labile solutes than
Holocene sediments at shallower depths.
Isotopic evidence suggests that groundwater in some parts
of the Bengal Basin has had a variable residence time. At a site
in western Bangladesh (Chapai Nawabganj), tritium was
found to be present at 2.5–5.9 TU (tritium units) in two
shallow piezometer samples (10 m or less), indicating that
they contained an appreciable component of post-1960s re-
charge (Smedley et al., 2001b). At this site and two others in
south and central Bangladesh (Lakshmipur and Faridpur, re-
spectively), groundwater from piezometers between 10 and
30 m depth had tritium concentrations ranging between 0.1
and 9.6 TU, indicating a variable proportion of post-1960s
recharge. Some of the low-tritium wells contained high arsenic
concentrations suggesting that the arsenic was released before
the 1960s; that is, before the recent rapid increase in ground-
water abstraction for irrigation and water supply. Groundwater
from piezometers at 150 m depth in central and south
Bangladesh contained <1 TU, also indicating pre-1960s water.
Radiocarbon dating has a longer time frame than tritium
and provides evidence for water with ages on the scale of
hundreds of years or more. Radiocarbon dating of
groundwater sampled from the above piezometers in the
10–40 m depth range typically contained 65–90 percent mod-
ern carbon (pmc) while below 150 m the groundwater con-
tained 51 pmc or less (Smedley et al., 2001b). The lowest
observed 14C activities were in water from deep (>150 m)
piezometers in southern Bangladesh. Here, activities of
28 pmc or less suggested the presence of paleowaters with
ages of the order of 2000–12000 years.
Taken together with the tritium data, these results indicated
that water below 31 m or so tended to have ages between
50–2000 years. Broadly similar results and conclusions were
reported by Aggarwal (2000). However, Harvey et al. (2002)
drew the opposite conclusion fromdata from their field site just
south of Dhaka. They found that a water sample from 19 m
depth contained dissolved inorganic carbon (DIC) with a 14C
composition at bomb concentrations and was therefore less
than 50 years old. This sample contained about 200 mg l�1
arsenic and they postulated that the rapid expansion of pump-
ing for irrigation water has led to an enhanced inflow of organic
carbon and that this has either produced enhanced reduction
and release of arsenic or displacement of arsenic by carbonate.
However, a sample from 31 m depth that had a lower 14C DIC
activity and an estimated age of 700 years also contained a high
arsenic concentration (about 300 mg l�1). This predates modern
irrigation activity.Whether, in general, irrigationhas had amajor
impact on arsenic mobilization in the Bengal aquifers is a matter
of current debate.
11.2.5.6.2 Chaco-Pampean Plain, ArgentinaThe Chaco-Pampean Plain of central Argentina covers around
1 million km2 and constitutes one of the largest regions
of high-arsenic groundwaters known. High concentrations of
arsenic have been documented from Cordoba, La Pampa,
Santa Fe, Buenos Aires, and Tucuman provinces. Symptoms
typical of chronic arsenic poisoning, including skin lesions
and some internal cancers, have been recorded in these
areas (Hopenhayn-Rich et al., 1996). The climate is temperate
with increasing aridity toward the west. The high-arsenic
groundwaters are from Quaternary deposits of loess (mainly
silt) with intermixed rhyolitic or dacitic volcanic ash (Nicolli
et al., 1989; Smedley et al., 2002), often situated in closed
basins. The sediments display abundant evidence of post-
depositional diagenetic changes under semiarid conditions,
with common occurrences of calcrete.
Many investigations of groundwater quality have identified
variable and often extremely high arsenic concentrations.
Nicolli et al. (1989) found arsenic concentrations in ground-
waters from Cordoba in the range of 6–11500 mg l�1 (median
255 mg l�1). Smedley et al. (2002) found concentrations
for groundwaters in La Pampa Province in the range of
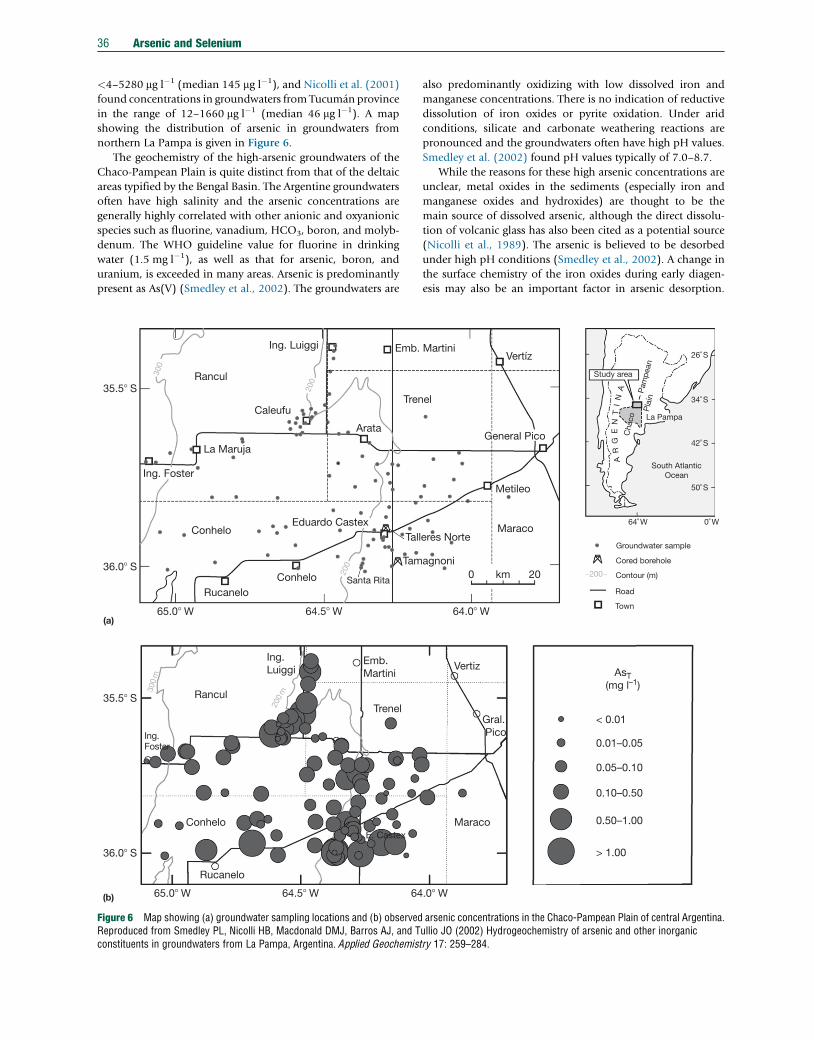
36 Arsenic and Selenium
<4–5280 mg l�1 (median 145 mg l�1), and Nicolli et al. (2001)
found concentrations in groundwaters from Tucuman province
in the range of 12–1660 mg l�1 (median 46 mg l�1). A map
showing the distribution of arsenic in groundwaters from
northern La Pampa is given in Figure 6.
The geochemistry of the high-arsenic groundwaters of the
Chaco-Pampean Plain is quite distinct from that of the deltaic
areas typified by the Bengal Basin. The Argentine groundwaters
often have high salinity and the arsenic concentrations are
generally highly correlated with other anionic and oxyanionic
species such as fluorine, vanadium, HCO3, boron, and molyb-
denum. The WHO guideline value for fluorine in drinking
water (1.5 mg l�1), as well as that for arsenic, boron, and
uranium, is exceeded in many areas. Arsenic is predominantly
present as As(V) (Smedley et al., 2002). The groundwaters are
Rancul300
200
200
300
m
200
m
35.5� S
36.0� S
35.5� S
36.0� S
65.0� W 64.5� W
65.0� W 64.5� W 64
Rancul
La Maruja
Ing. Foster
Ing.Foster
Conhelo
ConheloE. Castex
Rucanelo
(a)
(b)
Rucanelo
Conhelo Santa Rita
Tam
TallEduardo Castex
Caleufu
Arata
Tren
Trenel
Emb.
Emb.Martini
Ing. Luiggi
Ing.Luiggi
Figure 6 Map showing (a) groundwater sampling locations and (b) observedReproduced from Smedley PL, Nicolli HB, Macdonald DMJ, Barros AJ, and Tconstituents in groundwaters from La Pampa, Argentina. Applied Geochemis
also predominantly oxidizing with low dissolved iron and
manganese concentrations. There is no indication of reductive
dissolution of iron oxides or pyrite oxidation. Under arid
conditions, silicate and carbonate weathering reactions are
pronounced and the groundwaters often have high pH values.
Smedley et al. (2002) found pH values typically of 7.0–8.7.
While the reasons for these high arsenic concentrations are
unclear, metal oxides in the sediments (especially iron and
manganese oxides and hydroxides) are thought to be the
main source of dissolved arsenic, although the direct dissolu-
tion of volcanic glass has also been cited as a potential source
(Nicolli et al., 1989). The arsenic is believed to be desorbed
under high pH conditions (Smedley et al., 2002). A change in
the surface chemistry of the iron oxides during early diagen-
esis may also be an important factor in arsenic desorption.
64.0� W
.0� W
Vertiz
Gral. Pico
agnoni
eres Norte
Vertíz
Study area
La Pampa
South AtlanticOcean
Groundwater sample
64˚ W
42˚ S
50˚ S
34˚ S
26˚ S
0˚ W
Cored borehole
Contour (m)
Road
Town
Pla
inP
ampe
an
Cha
co
General Pico
Metileo
Maraco
Maraco
< 0.01
AsT(mg l–1)
0.01–0.05
0.05–0.10
0.10–0.50
0.50–1.00
> 1.00
0 km 20
el
Martini
AR
GE
NT
IN
A
−200−
arsenic concentrations in the Chaco-Pampean Plain of central Argentina.ullio JO (2002) Hydrogeochemistry of arsenic and other inorganictry 17: 259–284.
Arsenic and Selenium 37
The released arsenic tends to accumulate where natural ground-
water movement is slow, especially in low-lying discharge areas.
Evaporative concentration is also a factor, but the lack of corre-
lation between arsenic and chlorine concentrations in the
groundwaters suggests that it is not the dominant control
(Smedley et al., 2002).
11.2.5.6.3 Eastern Wisconsin, USAThe analysis of some 31350 groundwaters throughout the
United States indicates that about 10% exceed the current
10 mg l�1 drinking water MCL (Welch et al., 2000). At a
broad regional scale (Figure 7), arsenic concentrations exceed-
ing 10 mg l�1 are more frequently observed in the western
United States than in the east. The Mississippi delta shows a
locally high pattern but is not exceptional, when viewed na-
tionally. Arsenic concentrations in groundwater from the Ap-
palachian Highlands and the Atlantic Plain are generally very
low (<1 mg l�1). Concentrations are somewhat greater in the
Interior Plains and the Rocky Mountains and within the last
decade, areas in New England, Michigan, Minnesota, South
Dakota, Oklahoma, and Wisconsin have been shown to have
groundwaters with arsenic concentrations exceeding 10 mg l�1,
sometimes appreciably so. Eastern Wisconsin is one such area.
The St. Peter Sandstone (Ordovician) aquifer of eastern
Wisconsin (Brown, Outagamie, Winnebago Counties) is a lo-
cally important source of water for private supplies. Arsenic
contamination was first identified at two locations in 1987 and
subsequent investigations showed that 18 out of 76 sources
(24%) in Brown County, 45 out of 1116 sources (4.0%) in
Outagamie County, and 23 out of 827 sources (2.8%) in
Hawaii
Alaska
USGS
Figure 7 Map of the United States showing the regional distribution of arsefig3.html after Ryker, 2001). This shows where 25% of water samples withinIt is computed from 31350 water samples and updated from the results pres
Winnebago County exceeded the then current MCL for arsenic
of 50 mg l�1 (Burkel and Stoll, 1999). The highest arsenic con-
centration found was 1200 mg l�1. A depth profile in one of the
affected wells showed that most of the groundwater was
slightly acidic (pH 5.2–6.6) and in some places very acidic
(pH<4). There were also high concentrations of iron, cad-
mium, zinc, manganese, copper, and sulfate, and it was con-
cluded that the arsenic and other elements were released
following the oxidation of sulfide minerals (pyrite and marca-
site) present in a cement horizon at the boundary of the
Ordovician Sinnipee Group and the underlying unit, either
the St. Peter Sandstone or the Prairie du Chien Group depend-
ing on the location. The low pH values are consistent with iron
sulfide mineral oxidation.
Subsequent detailed studies in the Fox River valley towns of
Algoma and Hobart confirmed the importance of the sulfide-
rich cement horizon as a probable source of the arsenic
(Schreiber et al., 2000) (Figure 8). In the town of Algoma,
one well contained 12000 mg l�1 arsenic. There was, however,
much apparently random spatial variation. Two wells close to
the high-arsenic well contained much lower arsenic concentra-
tions (12 and 34 mg l�1). The highest arsenic concentration
found in wells from the town of Hobart was 790 mg l�1.
Oxidation of sulfide minerals appears to have been pro-
moted by groundwater abstraction, which has led to the low-
ering of the piezometric surface at a rate of around
0.6 m year�1 since the 1950s, leading to partial dewatering of
the confined aquifer. The high arsenic concentrations occur
where the piezometric surface intersects, or lies close to, the
sulfide cement horizon (Schreiber et al., 2000).
Puerto Rico
Arsenic concentrations in at least25% of samples exceed:
Insufficientdata
50 µg l−1
10
5
31
nic in wells (from http://water.usgs.gov/nawqa/trace/pubs/geo_v46n11/a moving 50-km radius exceed a certain arsenic concentration.ented by Welch et al. (2000).
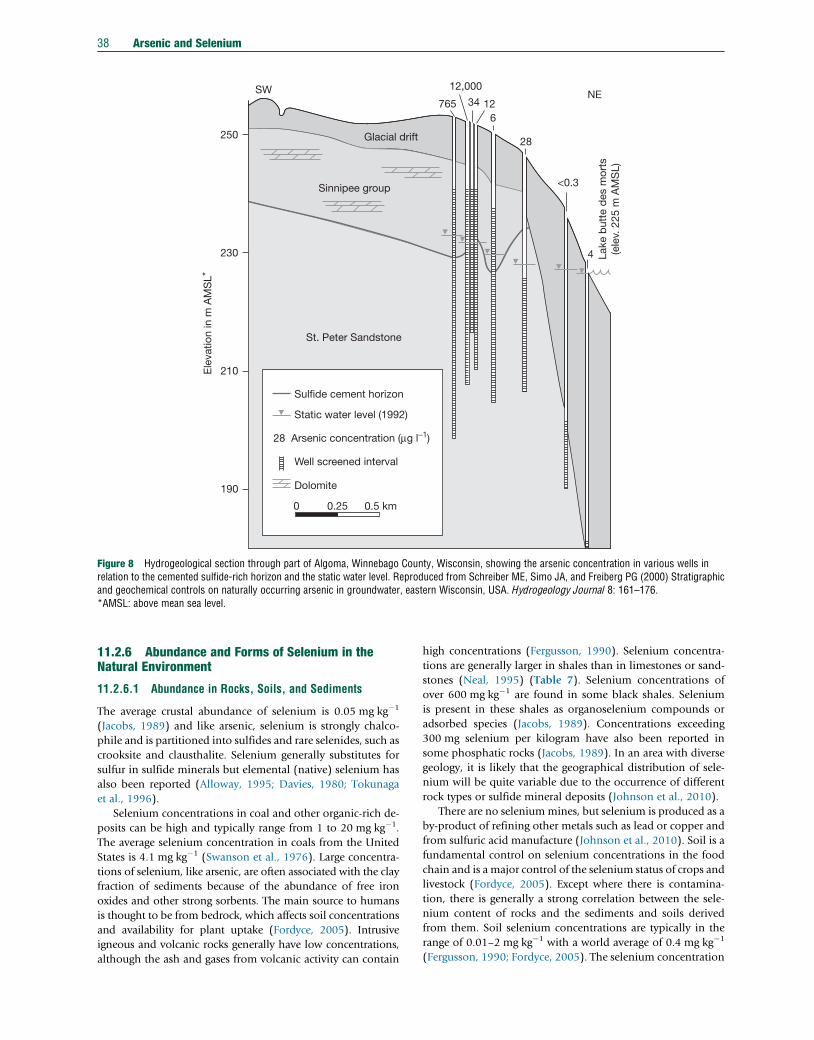
SW
Glacial drift
12,000
765 34 126
28
NE
<0.3
4 Lake
but
te d
es m
orts
(ele
v. 2
25 m
AM
SL)
Sinnipee group
250
230
210Ele
vatio
n in
m A
MS
L*
190
St. Peter Sandstone
Sulfide cement horizon
Static water level (1992)
Well screened interval
0 0.25 0.5 km
28 Arsenic concentration (µg l−1)
Dolomite
Figure 8 Hydrogeological section through part of Algoma, Winnebago County, Wisconsin, showing the arsenic concentration in various wells inrelation to the cemented sulfide-rich horizon and the static water level. Reproduced from Schreiber ME, Simo JA, and Freiberg PG (2000) Stratigraphicand geochemical controls on naturally occurring arsenic in groundwater, eastern Wisconsin, USA. Hydrogeology Journal 8: 161–176.*AMSL: above mean sea level.
38 Arsenic and Selenium
11.2.6 Abundance and Forms of Selenium in theNatural Environment
11.2.6.1 Abundance in Rocks, Soils, and Sediments
The average crustal abundance of selenium is 0.05 mg kg�1
(Jacobs, 1989) and like arsenic, selenium is strongly chalco-
phile and is partitioned into sulfides and rare selenides, such as
crooksite and clausthalite. Selenium generally substitutes for
sulfur in sulfide minerals but elemental (native) selenium has
also been reported (Alloway, 1995; Davies, 1980; Tokunaga
et al., 1996).
Selenium concentrations in coal and other organic-rich de-
posits can be high and typically range from 1 to 20 mg kg�1.
The average selenium concentration in coals from the United
States is 4.1 mg kg�1 (Swanson et al., 1976). Large concentra-
tions of selenium, like arsenic, are often associated with the clay
fraction of sediments because of the abundance of free iron
oxides and other strong sorbents. The main source to humans
is thought to be from bedrock, which affects soil concentrations
and availability for plant uptake (Fordyce, 2005). Intrusive
igneous and volcanic rocks generally have low concentrations,
although the ash and gases from volcanic activity can contain
high concentrations (Fergusson, 1990). Selenium concentra-
tions are generally larger in shales than in limestones or sand-
stones (Neal, 1995) (Table 7). Selenium concentrations of
over 600 mg kg�1 are found in some black shales. Selenium
is present in these shales as organoselenium compounds or
adsorbed species (Jacobs, 1989). Concentrations exceeding
300 mg selenium per kilogram have also been reported in
some phosphatic rocks (Jacobs, 1989). In an area with diverse
geology, it is likely that the geographical distribution of sele-
nium will be quite variable due to the occurrence of different
rock types or sulfide mineral deposits (Johnson et al., 2010).
There are no seleniummines, but selenium is produced as a
by-product of refining other metals such as lead or copper and
from sulfuric acid manufacture (Johnson et al., 2010). Soil is a
fundamental control on selenium concentrations in the food
chain and is a major control of the selenium status of crops and
livestock (Fordyce, 2005). Except where there is contamina-
tion, there is generally a strong correlation between the sele-
nium content of rocks and the sediments and soils derived
from them. Soil selenium concentrations are typically in the
range of 0.01–2 mg kg�1 with a world average of 0.4 mg kg�1
(Fergusson, 1990; Fordyce, 2005). The selenium concentration
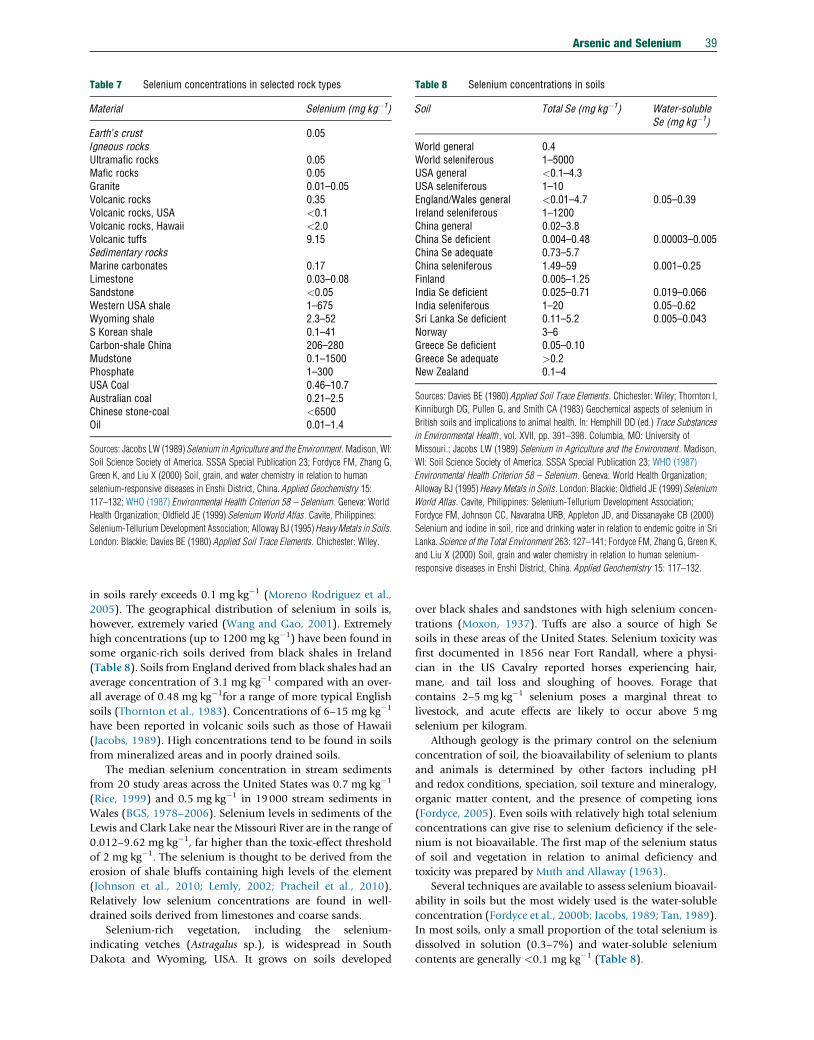
Table 7 Selenium concentrations in selected rock types
Material Selenium (mg kg�1)
Earth’s crust 0.05Igneous rocksUltramafic rocks 0.05Mafic rocks 0.05Granite 0.01–0.05Volcanic rocks 0.35Volcanic rocks, USA <0.1Volcanic rocks, Hawaii <2.0Volcanic tuffs 9.15Sedimentary rocksMarine carbonates 0.17Limestone 0.03–0.08Sandstone <0.05Western USA shale 1–675Wyoming shale 2.3–52S Korean shale 0.1–41Carbon-shale China 206–280Mudstone 0.1–1500Phosphate 1–300USA Coal 0.46–10.7Australian coal 0.21–2.5Chinese stone-coal <6500Oil 0.01–1.4
Sources: Jacobs LW (1989) Selenium in Agriculture and the Environment. Madison, WI:
Soil Science Society of America. SSSA Special Publication 23; Fordyce FM, Zhang G,
Green K, and Liu X (2000) Soil, grain, and water chemistry in relation to human
selenium-responsive diseases in Enshi District, China. Applied Geochemistry 15:
117–132; WHO (1987) Environmental Health Criterion 58 – Selenium. Geneva: World
Health Organization; Oldfield JE (1999) Selenium World Atlas. Cavite, Philippines:
Selenium-Tellurium Development Association; Alloway BJ (1995) Heavy Metals in Soils.
London: Blackie; Davies BE (1980) Applied Soil Trace Elements. Chichester: Wiley.
Table 8 Selenium concentrations in soils
Soil Total Se (mg kg�1) Water-solubleSe (mg kg�1)
World general 0.4World seleniferous 1–5000USA general <0.1–4.3USA seleniferous 1–10England/Wales general <0.01–4.7 0.05–0.39Ireland seleniferous 1–1200China general 0.02–3.8China Se deficient 0.004–0.48 0.00003–0.005China Se adequate 0.73–5.7China seleniferous 1.49–59 0.001–0.25Finland 0.005–1.25India Se deficient 0.025–0.71 0.019–0.066India seleniferous 1–20 0.05–0.62Sri Lanka Se deficient 0.11–5.2 0.005–0.043Norway 3–6Greece Se deficient 0.05–0.10Greece Se adequate >0.2New Zealand 0.1–4
Sources: Davies BE (1980) Applied Soil Trace Elements. Chichester: Wiley; Thornton I,
Kinniburgh DG, Pullen G, and Smith CA (1983) Geochemical aspects of selenium in
British soils and implications to animal health. In: Hemphill DD (ed.) Trace Substances
in Environmental Health, vol. XVII, pp. 391–398. Columbia, MO: University of
Missouri.; Jacobs LW (1989) Selenium in Agriculture and the Environment. Madison,
WI: Soil Science Society of America. SSSA Special Publication 23; WHO (1987)
Environmental Health Criterion 58 – Selenium. Geneva: World Health Organization;
Alloway BJ (1995) Heavy Metals in Soils. London: Blackie; Oldfield JE (1999) Selenium
World Atlas. Cavite, Philippines: Selenium-Tellurium Development Association;
Fordyce FM, Johnson CC, Navaratna URB, Appleton JD, and Dissanayake CB (2000)
Selenium and iodine in soil, rice and drinking water in relation to endemic goitre in Sri
Lanka. Science of the Total Environment 263: 127–141; Fordyce FM, Zhang G, Green K,
and Liu X (2000) Soil, grain and water chemistry in relation to human selenium-
responsive diseases in Enshi District, China. Applied Geochemistry 15: 117–132.
Arsenic and Selenium 39
in soils rarely exceeds 0.1 mg kg�1 (Moreno Rodriguez et al.,
2005). The geographical distribution of selenium in soils is,
however, extremely varied (Wang and Gao, 2001). Extremely
high concentrations (up to 1200 mg kg�1) have been found in
some organic-rich soils derived from black shales in Ireland
(Table 8). Soils from England derived from black shales had an
average concentration of 3.1 mg kg�1 compared with an over-
all average of 0.48 mg kg�1for a range of more typical English
soils (Thornton et al., 1983). Concentrations of 6–15 mg kg�1
have been reported in volcanic soils such as those of Hawaii
(Jacobs, 1989). High concentrations tend to be found in soils
from mineralized areas and in poorly drained soils.
The median selenium concentration in stream sediments
from 20 study areas across the United States was 0.7 mg kg�1
(Rice, 1999) and 0.5 mg kg�1 in 19000 stream sediments in
Wales (BGS, 1978–2006). Selenium levels in sediments of the
Lewis and Clark Lake near theMissouri River are in the range of
0.012–9.62 mg kg�1, far higher than the toxic-effect threshold
of 2 mg kg�1. The selenium is thought to be derived from the
erosion of shale bluffs containing high levels of the element
(Johnson et al., 2010; Lemly, 2002; Pracheil et al., 2010).
Relatively low selenium concentrations are found in well-
drained soils derived from limestones and coarse sands.
Selenium-rich vegetation, including the selenium-
indicating vetches (Astragalus sp.), is widespread in South
Dakota and Wyoming, USA. It grows on soils developed
over black shales and sandstones with high selenium concen-
trations (Moxon, 1937). Tuffs are also a source of high Se
soils in these areas of the United States. Selenium toxicity was
first documented in 1856 near Fort Randall, where a physi-
cian in the US Cavalry reported horses experiencing hair,
mane, and tail loss and sloughing of hooves. Forage that
contains 2–5 mg kg�1 selenium poses a marginal threat to
livestock, and acute effects are likely to occur above 5 mg
selenium per kilogram.
Although geology is the primary control on the selenium
concentration of soil, the bioavailability of selenium to plants
and animals is determined by other factors including pH
and redox conditions, speciation, soil texture and mineralogy,
organic matter content, and the presence of competing ions
(Fordyce, 2005). Even soils with relatively high total selenium
concentrations can give rise to selenium deficiency if the sele-
nium is not bioavailable. The first map of the selenium status
of soil and vegetation in relation to animal deficiency and
toxicity was prepared by Muth and Allaway (1963).
Several techniques are available to assess selenium bioavail-
ability in soils but the most widely used is the water-soluble
concentration (Fordyce et al., 2000b; Jacobs, 1989; Tan, 1989).
In most soils, only a small proportion of the total selenium is
dissolved in solution (0.3–7%) and water-soluble selenium
contents are generally <0.1 mg kg�1 (Table 8).
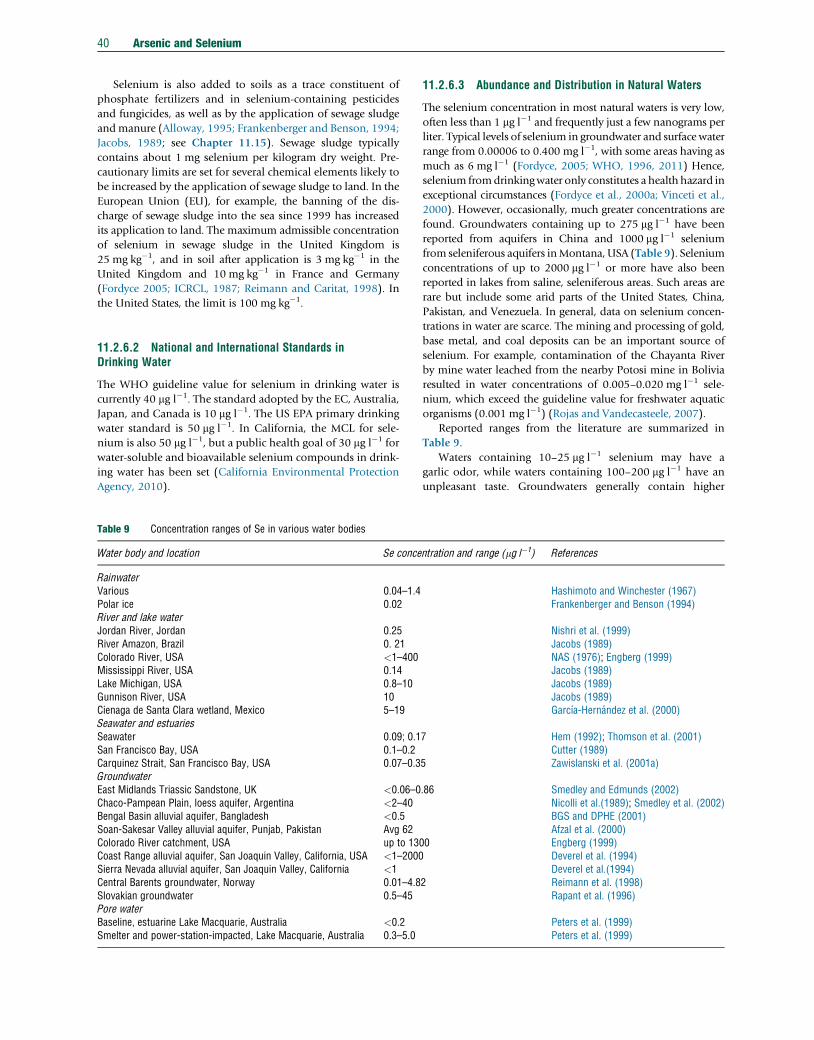
40 Arsenic and Selenium
Selenium is also added to soils as a trace constituent of
phosphate fertilizers and in selenium-containing pesticides
and fungicides, as well as by the application of sewage sludge
andmanure (Alloway, 1995; Frankenberger and Benson, 1994;
Jacobs, 1989; see Chapter 11.15). Sewage sludge typically
contains about 1 mg selenium per kilogram dry weight. Pre-
cautionary limits are set for several chemical elements likely to
be increased by the application of sewage sludge to land. In the
European Union (EU), for example, the banning of the dis-
charge of sewage sludge into the sea since 1999 has increased
its application to land. The maximum admissible concentration
of selenium in sewage sludge in the United Kingdom is
25 mg kg�1, and in soil after application is 3 mg kg�1 in the
United Kingdom and 10 mg kg�1 in France and Germany
(Fordyce 2005; ICRCL, 1987; Reimann and Caritat, 1998). In
the United States, the limit is 100 mg kg�1.
11.2.6.2 National and International Standards inDrinking Water
The WHO guideline value for selenium in drinking water is
currently 40 mg l�1. The standard adopted by the EC, Australia,
Japan, and Canada is 10 mg l�1. The US EPA primary drinking
water standard is 50 mg l�1. In California, the MCL for sele-
nium is also 50 mg l�1, but a public health goal of 30 mg l�1 for
water-soluble and bioavailable selenium compounds in drink-
ing water has been set (California Environmental Protection
Agency, 2010).
Table 9 Concentration ranges of Se in various water bodies
Water body and location Se conce
RainwaterVarious 0.04–1.4Polar ice 0.02River and lake waterJordan River, Jordan 0.25River Amazon, Brazil 0. 21Colorado River, USA <1–400Mississippi River, USA 0.14Lake Michigan, USA 0.8–10Gunnison River, USA 10Cienaga de Santa Clara wetland, Mexico 5–19Seawater and estuariesSeawater 0.09; 0.1San Francisco Bay, USA 0.1–0.2Carquinez Strait, San Francisco Bay, USA 0.07–0.3GroundwaterEast Midlands Triassic Sandstone, UK <0.06–0Chaco-Pampean Plain, loess aquifer, Argentina <2–40Bengal Basin alluvial aquifer, Bangladesh <0.5Soan-Sakesar Valley alluvial aquifer, Punjab, Pakistan Avg 62Colorado River catchment, USA up to 13Coast Range alluvial aquifer, San Joaquin Valley, California, USA <1–2000Sierra Nevada alluvial aquifer, San Joaquin Valley, California <1Central Barents groundwater, Norway 0.01–4.8Slovakian groundwater 0.5–45Pore waterBaseline, estuarine Lake Macquarie, Australia <0.2Smelter and power-station-impacted, Lake Macquarie, Australia 0.3–5.0
11.2.6.3 Abundance and Distribution in Natural Waters
The selenium concentration in most natural waters is very low,
often less than 1 mg l�1 and frequently just a few nanograms per
liter. Typical levels of selenium in groundwater and surface water
range from 0.00006 to 0.400 mg l�1, with some areas having as
much as 6 mg l�1 (Fordyce, 2005; WHO, 1996, 2011) Hence,
selenium fromdrinkingwater only constitutes a health hazard in
exceptional circumstances (Fordyce et al., 2000a; Vinceti et al.,
2000). However, occasionally, much greater concentrations are
found. Groundwaters containing up to 275 mg l�1 have been
reported from aquifers in China and 1000 mg l�1 selenium
from seleniferous aquifers inMontana, USA (Table 9). Selenium
concentrations of up to 2000 mg l�1 or more have also been
reported in lakes from saline, seleniferous areas. Such areas are
rare but include some arid parts of the United States, China,
Pakistan, and Venezuela. In general, data on selenium concen-
trations in water are scarce. The mining and processing of gold,
base metal, and coal deposits can be an important source of
selenium. For example, contamination of the Chayanta River
by mine water leached from the nearby Potosi mine in Bolivia
resulted in water concentrations of 0.005–0.020 mg l�1 sele-
nium, which exceed the guideline value for freshwater aquatic
organisms (0.001 mg l�1) (Rojas and Vandecasteele, 2007).
Reported ranges from the literature are summarized in
Table 9.
Waters containing 10–25 mg l�1 selenium may have a
garlic odor, while waters containing 100–200 mg l�1 have an
unpleasant taste. Groundwaters generally contain higher
ntration and range (mg l�1) References
Hashimoto and Winchester (1967)Frankenberger and Benson (1994)
Nishri et al. (1999)Jacobs (1989)NAS (1976); Engberg (1999)Jacobs (1989)Jacobs (1989)Jacobs (1989)Garcıa-Hernandez et al. (2000)
7 Hem (1992); Thomson et al. (2001)Cutter (1989)
5 Zawislanski et al. (2001a)
.86 Smedley and Edmunds (2002)Nicolli et al.(1989); Smedley et al. (2002)BGS and DPHE (2001)Afzal et al. (2000)
00 Engberg (1999)Deverel et al. (1994)Deverel et al.(1994)
2 Reimann et al. (1998)Rapant et al. (1996)
Peters et al. (1999)Peters et al. (1999)
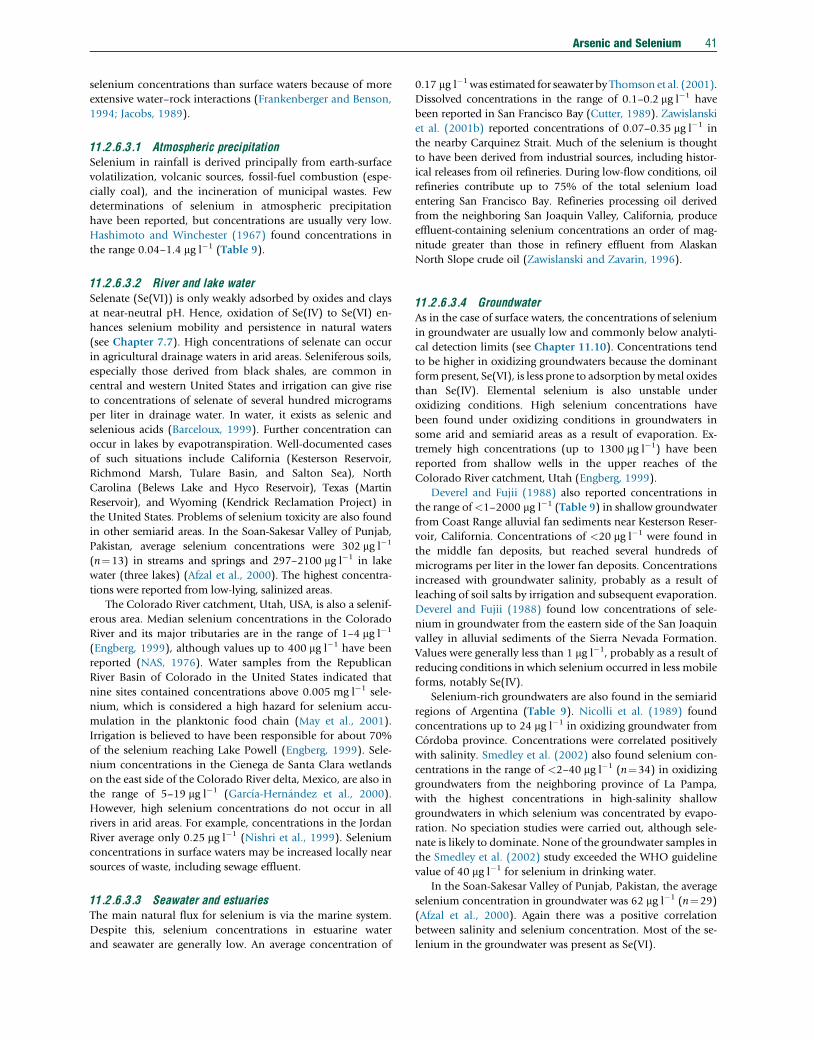
Arsenic and Selenium 41
selenium concentrations than surface waters because of more
extensive water–rock interactions (Frankenberger and Benson,
1994; Jacobs, 1989).
11.2.6.3.1 Atmospheric precipitationSelenium in rainfall is derived principally from earth-surface
volatilization, volcanic sources, fossil-fuel combustion (espe-
cially coal), and the incineration of municipal wastes. Few
determinations of selenium in atmospheric precipitation
have been reported, but concentrations are usually very low.
Hashimoto and Winchester (1967) found concentrations in
the range 0.04–1.4 mg l�1 (Table 9).
11.2.6.3.2 River and lake waterSelenate (Se(VI)) is only weakly adsorbed by oxides and clays
at near-neutral pH. Hence, oxidation of Se(IV) to Se(VI) en-
hances selenium mobility and persistence in natural waters
(see Chapter 7.7). High concentrations of selenate can occur
in agricultural drainage waters in arid areas. Seleniferous soils,
especially those derived from black shales, are common in
central and western United States and irrigation can give rise
to concentrations of selenate of several hundred micrograms
per liter in drainage water. In water, it exists as selenic and
selenious acids (Barceloux, 1999). Further concentration can
occur in lakes by evapotranspiration. Well-documented cases
of such situations include California (Kesterson Reservoir,
Richmond Marsh, Tulare Basin, and Salton Sea), North
Carolina (Belews Lake and Hyco Reservoir), Texas (Martin
Reservoir), and Wyoming (Kendrick Reclamation Project) in
the United States. Problems of selenium toxicity are also found
in other semiarid areas. In the Soan-Sakesar Valley of Punjab,
Pakistan, average selenium concentrations were 302 mg l�1
(n¼13) in streams and springs and 297–2100 mg l�1 in lake
water (three lakes) (Afzal et al., 2000). The highest concentra-
tions were reported from low-lying, salinized areas.
The Colorado River catchment, Utah, USA, is also a selenif-
erous area. Median selenium concentrations in the Colorado
River and its major tributaries are in the range of 1–4 mg l�1
(Engberg, 1999), although values up to 400 mg l�1 have been
reported (NAS, 1976). Water samples from the Republican
River Basin of Colorado in the United States indicated that
nine sites contained concentrations above 0.005 mg l�1 sele-
nium, which is considered a high hazard for selenium accu-
mulation in the planktonic food chain (May et al., 2001).
Irrigation is believed to have been responsible for about 70%
of the selenium reaching Lake Powell (Engberg, 1999). Sele-
nium concentrations in the Cienega de Santa Clara wetlands
on the east side of the Colorado River delta, Mexico, are also in
the range of 5–19 mg l�1 (Garcıa-Hernandez et al., 2000).
However, high selenium concentrations do not occur in all
rivers in arid areas. For example, concentrations in the Jordan
River average only 0.25 mg l�1 (Nishri et al., 1999). Selenium
concentrations in surface waters may be increased locally near
sources of waste, including sewage effluent.
11.2.6.3.3 Seawater and estuariesThe main natural flux for selenium is via the marine system.
Despite this, selenium concentrations in estuarine water
and seawater are generally low. An average concentration of
0.17 mg l�1was estimated for seawater by Thomson et al. (2001).
Dissolved concentrations in the range of 0.1–0.2 mg l�1 have
been reported in San Francisco Bay (Cutter, 1989). Zawislanski
et al. (2001b) reported concentrations of 0.07–0.35 mg l�1 in
the nearby Carquinez Strait. Much of the selenium is thought
to have been derived from industrial sources, including histor-
ical releases from oil refineries. During low-flow conditions, oil
refineries contribute up to 75% of the total selenium load
entering San Francisco Bay. Refineries processing oil derived
from the neighboring San Joaquin Valley, California, produce
effluent-containing selenium concentrations an order of mag-
nitude greater than those in refinery effluent from Alaskan
North Slope crude oil (Zawislanski and Zavarin, 1996).
11.2.6.3.4 GroundwaterAs in the case of surface waters, the concentrations of selenium
in groundwater are usually low and commonly below analyti-
cal detection limits (see Chapter 11.10). Concentrations tend
to be higher in oxidizing groundwaters because the dominant
formpresent, Se(VI), is less prone to adsorption bymetal oxides
than Se(IV). Elemental selenium is also unstable under
oxidizing conditions. High selenium concentrations have
been found under oxidizing conditions in groundwaters in
some arid and semiarid areas as a result of evaporation. Ex-
tremely high concentrations (up to 1300 mg l�1) have been
reported from shallow wells in the upper reaches of the
Colorado River catchment, Utah (Engberg, 1999).
Deverel and Fujii (1988) also reported concentrations in
the range of<1–2000 mg l�1 (Table 9) in shallow groundwater
from Coast Range alluvial fan sediments near Kesterson Reser-
voir, California. Concentrations of <20 mg l�1 were found in
the middle fan deposits, but reached several hundreds of
micrograms per liter in the lower fan deposits. Concentrations
increased with groundwater salinity, probably as a result of
leaching of soil salts by irrigation and subsequent evaporation.
Deverel and Fujii (1988) found low concentrations of sele-
nium in groundwater from the eastern side of the San Joaquin
valley in alluvial sediments of the Sierra Nevada Formation.
Values were generally less than 1 mg l�1, probably as a result of
reducing conditions in which selenium occurred in less mobile
forms, notably Se(IV).
Selenium-rich groundwaters are also found in the semiarid
regions of Argentina (Table 9). Nicolli et al. (1989) found
concentrations up to 24 mg l�1 in oxidizing groundwater from
Cordoba province. Concentrations were correlated positively
with salinity. Smedley et al. (2002) also found selenium con-
centrations in the range of <2–40 mg l�1 (n¼34) in oxidizing
groundwaters from the neighboring province of La Pampa,
with the highest concentrations in high-salinity shallow
groundwaters in which selenium was concentrated by evapo-
ration. No speciation studies were carried out, although sele-
nate is likely to dominate. None of the groundwater samples in
the Smedley et al. (2002) study exceeded the WHO guideline
value of 40 mg l�1 for selenium in drinking water.
In the Soan-Sakesar Valley of Punjab, Pakistan, the average
selenium concentration in groundwater was 62 mg l�1 (n¼29)
(Afzal et al., 2000). Again there was a positive correlation
between salinity and selenium concentration. Most of the se-
lenium in the groundwater was present as Se(VI).
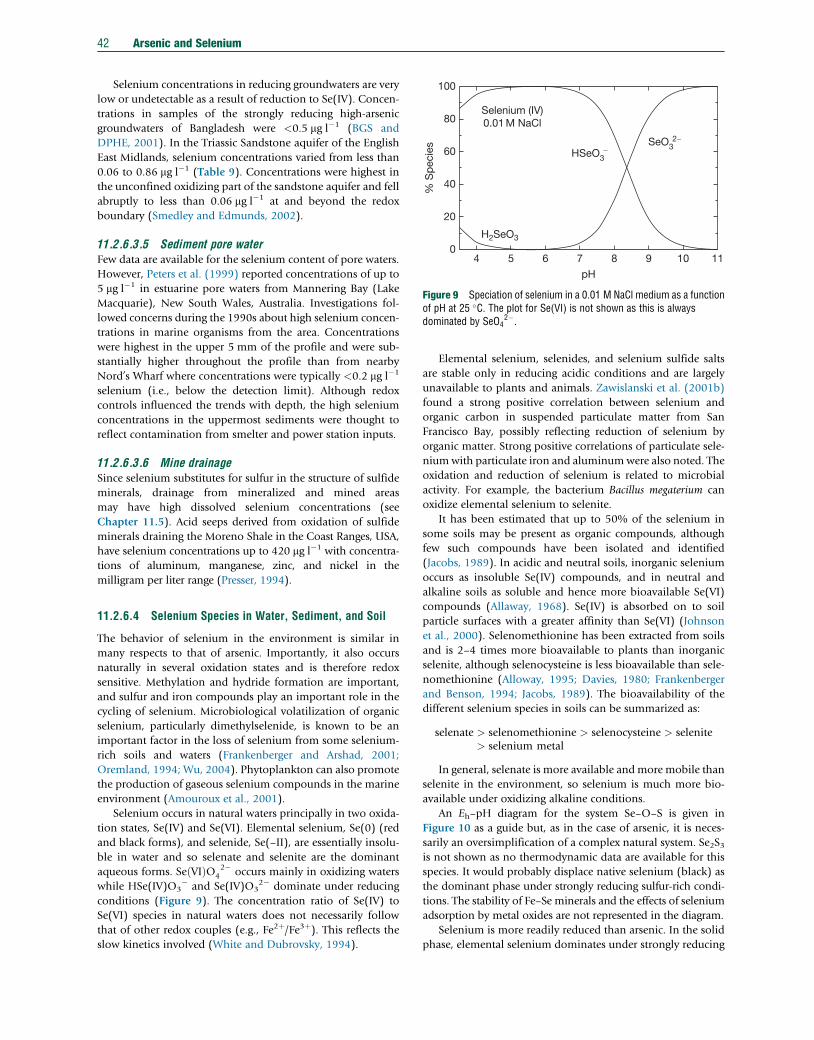
100
Selenium (IV)0.01 M NaCl
H2SeO3
HSeO3 −
SeO3 2−
80
60
40
% S
pec
ies
20
04 5 6 7
pH
8 9 10 11
Figure 9 Speciation of selenium in a 0.01 M NaCl medium as a functionof pH at 25 �C. The plot for Se(VI) is not shown as this is alwaysdominated by SeO4
2�.
42 Arsenic and Selenium
Selenium concentrations in reducing groundwaters are very
low or undetectable as a result of reduction to Se(IV). Concen-
trations in samples of the strongly reducing high-arsenic
groundwaters of Bangladesh were <0.5 mg l�1 (BGS and
DPHE, 2001). In the Triassic Sandstone aquifer of the English
East Midlands, selenium concentrations varied from less than
0.06 to 0.86 mg l�1 (Table 9). Concentrations were highest in
the unconfined oxidizing part of the sandstone aquifer and fell
abruptly to less than 0.06 mg l�1 at and beyond the redox
boundary (Smedley and Edmunds, 2002).
11.2.6.3.5 Sediment pore waterFew data are available for the selenium content of pore waters.
However, Peters et al. (1999) reported concentrations of up to
5 mg l�1 in estuarine pore waters from Mannering Bay (Lake
Macquarie), New South Wales, Australia. Investigations fol-
lowed concerns during the 1990s about high selenium concen-
trations in marine organisms from the area. Concentrations
were highest in the upper 5 mm of the profile and were sub-
stantially higher throughout the profile than from nearby
Nord’s Wharf where concentrations were typically <0.2 mg l�1
selenium (i.e., below the detection limit). Although redox
controls influenced the trends with depth, the high selenium
concentrations in the uppermost sediments were thought to
reflect contamination from smelter and power station inputs.
11.2.6.3.6 Mine drainageSince selenium substitutes for sulfur in the structure of sulfide
minerals, drainage from mineralized and mined areas
may have high dissolved selenium concentrations (see
Chapter 11.5). Acid seeps derived from oxidation of sulfide
minerals draining the Moreno Shale in the Coast Ranges, USA,
have selenium concentrations up to 420 mg l�1 with concentra-
tions of aluminum, manganese, zinc, and nickel in the
milligram per liter range (Presser, 1994).
11.2.6.4 Selenium Species in Water, Sediment, and Soil
The behavior of selenium in the environment is similar in
many respects to that of arsenic. Importantly, it also occurs
naturally in several oxidation states and is therefore redox
sensitive. Methylation and hydride formation are important,
and sulfur and iron compounds play an important role in the
cycling of selenium. Microbiological volatilization of organic
selenium, particularly dimethylselenide, is known to be an
important factor in the loss of selenium from some selenium-
rich soils and waters (Frankenberger and Arshad, 2001;
Oremland, 1994; Wu, 2004). Phytoplankton can also promote
the production of gaseous selenium compounds in the marine
environment (Amouroux et al., 2001).
Selenium occurs in natural waters principally in two oxida-
tion states, Se(IV) and Se(VI). Elemental selenium, Se(0) (red
and black forms), and selenide, Se(–II), are essentially insolu-
ble in water and so selenate and selenite are the dominant
aqueous forms. SeðVIÞO42� occurs mainly in oxidizing waters
while HSe(IV)O3� and Se(IV)O3
2� dominate under reducing
conditions (Figure 9). The concentration ratio of Se(IV) to
Se(VI) species in natural waters does not necessarily follow
that of other redox couples (e.g., Fe2þ/Fe3þ). This reflects theslow kinetics involved (White and Dubrovsky, 1994).
Elemental selenium, selenides, and selenium sulfide salts
are stable only in reducing acidic conditions and are largely
unavailable to plants and animals. Zawislanski et al. (2001b)
found a strong positive correlation between selenium and
organic carbon in suspended particulate matter from San
Francisco Bay, possibly reflecting reduction of selenium by
organic matter. Strong positive correlations of particulate sele-
niumwith particulate iron and aluminumwere also noted. The
oxidation and reduction of selenium is related to microbial
activity. For example, the bacterium Bacillus megaterium can
oxidize elemental selenium to selenite.
It has been estimated that up to 50% of the selenium in
some soils may be present as organic compounds, although
few such compounds have been isolated and identified
(Jacobs, 1989). In acidic and neutral soils, inorganic selenium
occurs as insoluble Se(IV) compounds, and in neutral and
alkaline soils as soluble and hence more bioavailable Se(VI)
compounds (Allaway, 1968). Se(IV) is absorbed on to soil
particle surfaces with a greater affinity than Se(VI) (Johnson
et al., 2000). Selenomethionine has been extracted from soils
and is 2–4 times more bioavailable to plants than inorganic
selenite, although selenocysteine is less bioavailable than sele-
nomethionine (Alloway, 1995; Davies, 1980; Frankenberger
and Benson, 1994; Jacobs, 1989). The bioavailability of the
different selenium species in soils can be summarized as:
selenate > selenomethionine > selenocysteine > selenite> selenium metal
In general, selenate is more available andmore mobile than
selenite in the environment, so selenium is much more bio-
available under oxidizing alkaline conditions.
An Eh–pH diagram for the system Se–O–S is given in
Figure 10 as a guide but, as in the case of arsenic, it is neces-
sarily an oversimplification of a complex natural system. Se2S3is not shown as no thermodynamic data are available for this
species. It would probably displace native selenium (black) as
the dominant phase under strongly reducing sulfur-rich condi-
tions. The stability of Fe–Se minerals and the effects of selenium
adsorption by metal oxides are not represented in the diagram.
Selenium is more readily reduced than arsenic. In the solid
phase, elemental selenium dominates under strongly reducing
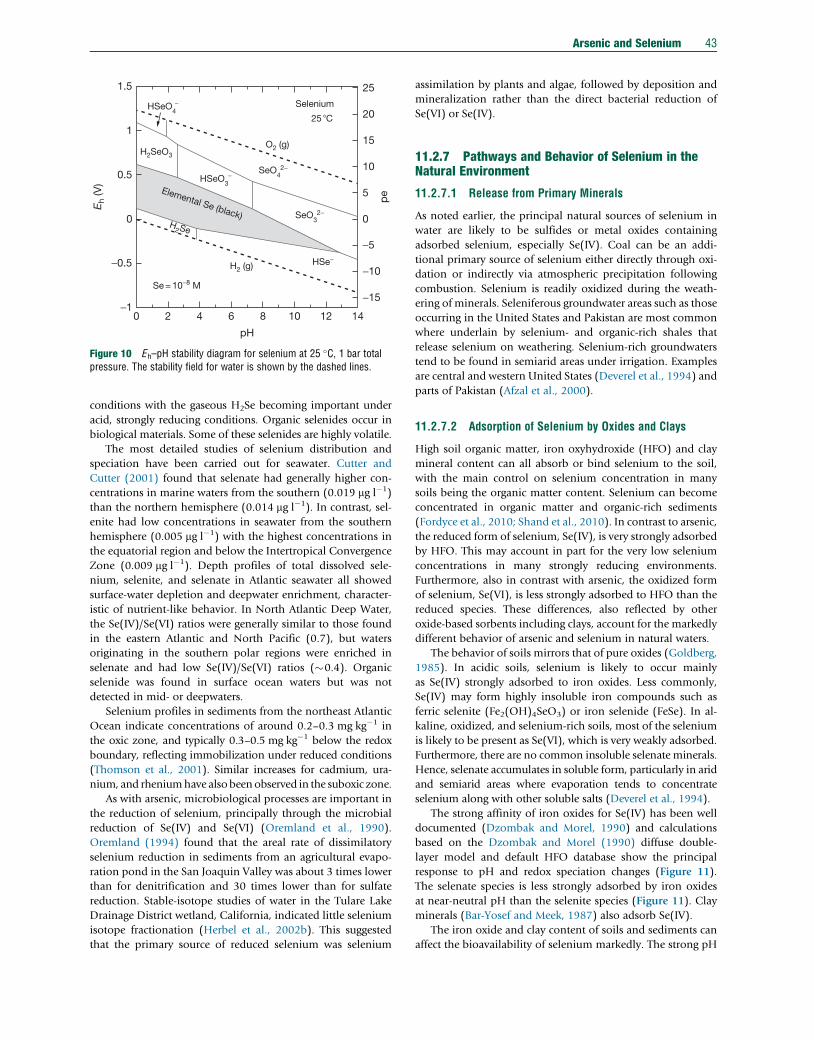
1.5 25
Selenium
Se = 10−8 M
O2 (g)
H2 (g)
H2Se
Elemental Se (black)
H2SeO3
HSeO4 −
SeO4 2−
HSeO3 −
HSe −
SeO3 2−
25 �C 20
15
10
5
−5
−10
−15
0
1
0.5
Eh
(V)
pe
−0.5
−1
0
0 2 4 6
pH
8 10 12 14
Figure 10 Eh–pH stability diagram for selenium at 25 �C, 1 bar totalpressure. The stability field for water is shown by the dashed lines.
Arsenic and Selenium 43
conditions with the gaseous H2Se becoming important under
acid, strongly reducing conditions. Organic selenides occur in
biological materials. Some of these selenides are highly volatile.
The most detailed studies of selenium distribution and
speciation have been carried out for seawater. Cutter and
Cutter (2001) found that selenate had generally higher con-
centrations in marine waters from the southern (0.019 mg l�1)
than the northern hemisphere (0.014 mg l�1). In contrast, sel-
enite had low concentrations in seawater from the southern
hemisphere (0.005 mg l�1) with the highest concentrations in
the equatorial region and below the Intertropical Convergence
Zone (0.009 mg l�1). Depth profiles of total dissolved sele-
nium, selenite, and selenate in Atlantic seawater all showed
surface-water depletion and deepwater enrichment, character-
istic of nutrient-like behavior. In North Atlantic Deep Water,
the Se(IV)/Se(VI) ratios were generally similar to those found
in the eastern Atlantic and North Pacific (0.7), but waters
originating in the southern polar regions were enriched in
selenate and had low Se(IV)/Se(VI) ratios (�0.4). Organic
selenide was found in surface ocean waters but was not
detected in mid- or deepwaters.
Selenium profiles in sediments from the northeast Atlantic
Ocean indicate concentrations of around 0.2–0.3 mg kg�1 in
the oxic zone, and typically 0.3–0.5 mg kg�1 below the redox
boundary, reflecting immobilization under reduced conditions
(Thomson et al., 2001). Similar increases for cadmium, ura-
nium, and rheniumhave alsobeenobserved in the suboxic zone.
As with arsenic, microbiological processes are important in
the reduction of selenium, principally through the microbial
reduction of Se(IV) and Se(VI) (Oremland et al., 1990).
Oremland (1994) found that the areal rate of dissimilatory
selenium reduction in sediments from an agricultural evapo-
ration pond in the San Joaquin Valley was about 3 times lower
than for denitrification and 30 times lower than for sulfate
reduction. Stable-isotope studies of water in the Tulare Lake
Drainage District wetland, California, indicated little selenium
isotope fractionation (Herbel et al., 2002b). This suggested
that the primary source of reduced selenium was selenium
assimilation by plants and algae, followed by deposition and
mineralization rather than the direct bacterial reduction of
Se(VI) or Se(IV).
11.2.7 Pathways and Behavior of Selenium in theNatural Environment
11.2.7.1 Release from Primary Minerals
As noted earlier, the principal natural sources of selenium in
water are likely to be sulfides or metal oxides containing
adsorbed selenium, especially Se(IV). Coal can be an addi-
tional primary source of selenium either directly through oxi-
dation or indirectly via atmospheric precipitation following
combustion. Selenium is readily oxidized during the weath-
ering of minerals. Seleniferous groundwater areas such as those
occurring in the United States and Pakistan are most common
where underlain by selenium- and organic-rich shales that
release selenium on weathering. Selenium-rich groundwaters
tend to be found in semiarid areas under irrigation. Examples
are central and western United States (Deverel et al., 1994) and
parts of Pakistan (Afzal et al., 2000).
11.2.7.2 Adsorption of Selenium by Oxides and Clays
High soil organic matter, iron oxyhydroxide (HFO) and clay
mineral content can all absorb or bind selenium to the soil,
with the main control on selenium concentration in many
soils being the organic matter content. Selenium can become
concentrated in organic matter and organic-rich sediments
(Fordyce et al., 2010; Shand et al., 2010). In contrast to arsenic,
the reduced form of selenium, Se(IV), is very strongly adsorbed
by HFO. This may account in part for the very low selenium
concentrations in many strongly reducing environments.
Furthermore, also in contrast with arsenic, the oxidized form
of selenium, Se(VI), is less strongly adsorbed to HFO than the
reduced species. These differences, also reflected by other
oxide-based sorbents including clays, account for the markedly
different behavior of arsenic and selenium in natural waters.
The behavior of soils mirrors that of pure oxides (Goldberg,
1985). In acidic soils, selenium is likely to occur mainly
as Se(IV) strongly adsorbed to iron oxides. Less commonly,
Se(IV) may form highly insoluble iron compounds such as
ferric selenite (Fe2(OH)4SeO3) or iron selenide (FeSe). In al-
kaline, oxidized, and selenium-rich soils, most of the selenium
is likely to be present as Se(VI), which is very weakly adsorbed.
Furthermore, there are no common insoluble selenate minerals.
Hence, selenate accumulates in soluble form, particularly in arid
and semiarid areas where evaporation tends to concentrate
selenium along with other soluble salts (Deverel et al., 1994).
The strong affinity of iron oxides for Se(IV) has been well
documented (Dzombak and Morel, 1990) and calculations
based on the Dzombak and Morel (1990) diffuse double-
layer model and default HFO database show the principal
response to pH and redox speciation changes (Figure 11).
The selenate species is less strongly adsorbed by iron oxides
at near-neutral pH than the selenite species (Figure 11). Clay
minerals (Bar-Yosef and Meek, 1987) also adsorb Se(IV).
The iron oxide and clay content of soils and sediments can
affect the bioavailability of selenium markedly. The strong pH
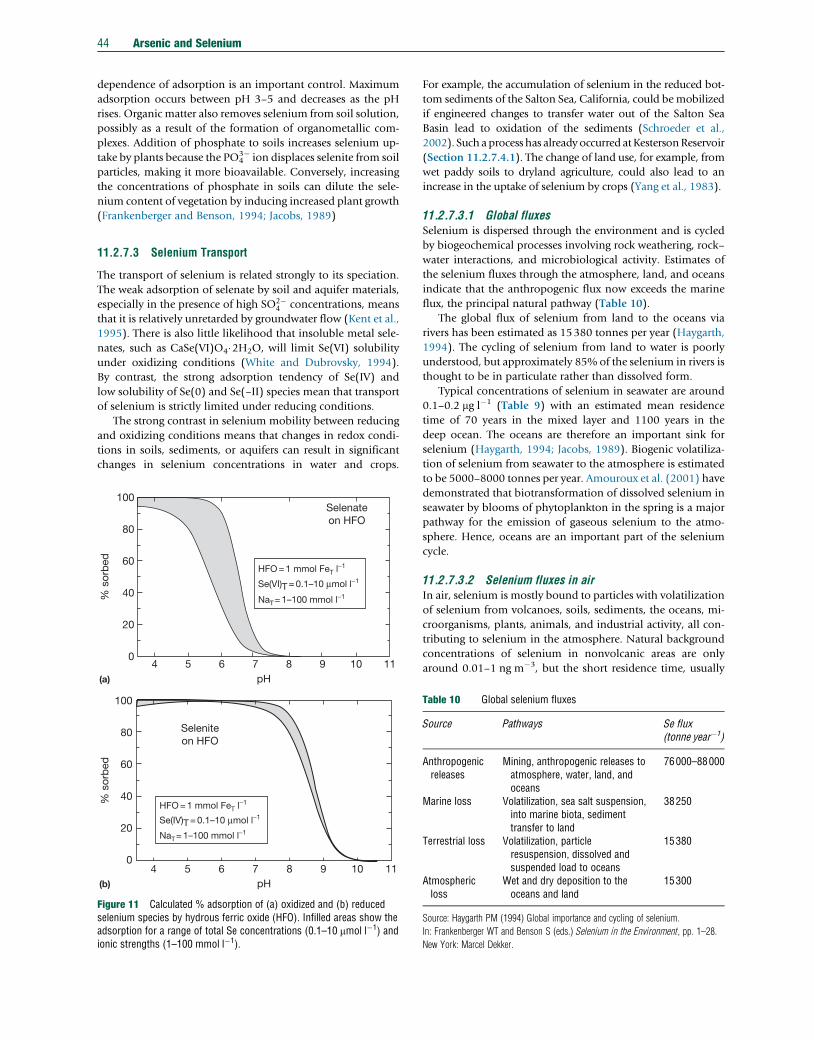
44 Arsenic and Selenium
dependence of adsorption is an important control. Maximum
adsorption occurs between pH 3–5 and decreases as the pH
rises. Organic matter also removes selenium from soil solution,
possibly as a result of the formation of organometallic com-
plexes. Addition of phosphate to soils increases selenium up-
take by plants because the PO43� ion displaces selenite from soil
particles, making it more bioavailable. Conversely, increasing
the concentrations of phosphate in soils can dilute the sele-
nium content of vegetation by inducing increased plant growth
(Frankenberger and Benson, 1994; Jacobs, 1989)
11.2.7.3 Selenium Transport
The transport of selenium is related strongly to its speciation.
The weak adsorption of selenate by soil and aquifer materials,
especially in the presence of high SO2�4 concentrations, means
that it is relatively unretarded by groundwater flow (Kent et al.,
1995). There is also little likelihood that insoluble metal sele-
nates, such as CaSe(VI)O4�2H2O, will limit Se(VI) solubility
under oxidizing conditions (White and Dubrovsky, 1994).
By contrast, the strong adsorption tendency of Se(IV) and
low solubility of Se(0) and Se(–II) species mean that transport
of selenium is strictly limited under reducing conditions.
The strong contrast in selenium mobility between reducing
and oxidizing conditions means that changes in redox condi-
tions in soils, sediments, or aquifers can result in significant
changes in selenium concentrations in water and crops.
100
80
60
40
20
0
100
80
60
40
20
0
4 5 6 7pH
Selenateon HFO
Seleniteon HFO
8 9 10 11
4 5 6 7pH
8 9 10 11
% s
orb
ed%
sor
bed
(a)
(b)
Se(VI)T = 0.1–10 µmol l−1
NaT= 1–100 mmol l−1
HFO = 1 mmol FeT l−1
Se(IV)T = 0.1–10 µmol l−1
NaT= 1–100 mmol l−1
HFO = 1 mmol FeT l−1
Figure 11 Calculated % adsorption of (a) oxidized and (b) reducedselenium species by hydrous ferric oxide (HFO). Infilled areas show theadsorption for a range of total Se concentrations (0.1–10 mmol l�1) andionic strengths (1–100 mmol l�1).
For example, the accumulation of selenium in the reduced bot-
tom sediments of the Salton Sea, California, could be mobilized
if engineered changes to transfer water out of the Salton Sea
Basin lead to oxidation of the sediments (Schroeder et al.,
2002). Such a process has already occurred atKestersonReservoir
(Section 11.2.7.4.1). The change of land use, for example, from
wet paddy soils to dryland agriculture, could also lead to an
increase in the uptake of selenium by crops (Yang et al., 1983).
11.2.7.3.1 Global fluxesSelenium is dispersed through the environment and is cycled
by biogeochemical processes involving rock weathering, rock–
water interactions, and microbiological activity. Estimates of
the selenium fluxes through the atmosphere, land, and oceans
indicate that the anthropogenic flux now exceeds the marine
flux, the principal natural pathway (Table 10).
The global flux of selenium from land to the oceans via
rivers has been estimated as 15380 tonnes per year (Haygarth,
1994). The cycling of selenium from land to water is poorly
understood, but approximately 85% of the selenium in rivers is
thought to be in particulate rather than dissolved form.
Typical concentrations of selenium in seawater are around
0.1–0.2 mg l�1 (Table 9) with an estimated mean residence
time of 70 years in the mixed layer and 1100 years in the
deep ocean. The oceans are therefore an important sink for
selenium (Haygarth, 1994; Jacobs, 1989). Biogenic volatiliza-
tion of selenium from seawater to the atmosphere is estimated
to be 5000–8000 tonnes per year. Amouroux et al. (2001) have
demonstrated that biotransformation of dissolved selenium in
seawater by blooms of phytoplankton in the spring is a major
pathway for the emission of gaseous selenium to the atmo-
sphere. Hence, oceans are an important part of the selenium
cycle.
11.2.7.3.2 Selenium fluxes in airIn air, selenium is mostly bound to particles with volatilization
of selenium from volcanoes, soils, sediments, the oceans, mi-
croorganisms, plants, animals, and industrial activity, all con-
tributing to selenium in the atmosphere. Natural background
concentrations of selenium in nonvolcanic areas are only
around 0.01–1 ng m�3, but the short residence time, usually
Table 10 Global selenium fluxes
Source Pathways Se flux(tonne year�1)
Anthropogenicreleases
Mining, anthropogenic releases toatmosphere, water, land, andoceans
76000–88000
Marine loss Volatilization, sea salt suspension,into marine biota, sedimenttransfer to land
38250
Terrestrial loss Volatilization, particleresuspension, dissolved andsuspended load to oceans
15380
Atmosphericloss
Wet and dry deposition to theoceans and land
15300
Source: Haygarth PM (1994) Global importance and cycling of selenium.
In: Frankenberger WT and Benson S (eds.) Selenium in the Environment, pp. 1–28.
New York: Marcel Dekker.
Arsenic and Selenium 45
a matter of weeks, makes the atmosphere a rapid transport
route for selenium. Most urban air has concentrations of
0.1–10 ng m�3 (WHO, 1996, 2011). Higher levels may be
found in the vicinity of coal-fired thermal power stations
(90 ng m�3; background level, 10 ng m�3) with selenium in
an amorphous state (Giere et al., 2006; Jayasekher, 2009). For
example, in the United Kingdom, soil samples collected be-
tween 1861 and 1990 by the Rothamstead Agricultural Exper-
imental Station show that the highest concentrations of
selenium were between 1940 and 1970, coinciding with a
period of intensive coal use. The decline in selenium in herb-
age more recently is thought to reflect a switch to fuel sources
such as nuclear, oil, and gas (Haygarth, 1994).
Volatilization of selenium into the atmosphere results from
microbial methylation of selenium from soil, plant, and water
and is affected by the availability of selenium, the presence of
an adequate carbon source, oxygen availability, and tempera-
ture (Frankenberger and Benson, 1994; Jacobs, 1989).
Most gaseous selenium is thought to be in the dimethylse-
lenide (DMSe) form and it is estimated that terrestrial biogenic
sources contribute 1200 tonnes per year of selenium to the
atmosphere. Atmospheric dust derived from volcanoes and
wind erosion of the Earth’s surface (180 tonnes per year) and
suspended sea salts (550 tonnes per year) from the oceans are
also significant sources of atmospheric selenium. Particle-
bound selenium can be transported several thousands of kilo-
meters before deposition. Wet deposition from rain, snow, and
other types of precipitation is thought to contribute 5610
tonnes per hectare per year of selenium to the terrestrial envi-
ronment. In the United Kingdom, for example, wet deposition
has been shown to account for 76–93% of the total with>70%
in soluble form. Near-to-point sources of selenium, for
example, from industry and atmospheric deposition, can ac-
count for 33–82% of the selenium present on the leaves of
plants (Frankenberger and Benson, 1994; Jacobs, 1989). A
study of selenium in plant rings near a village close to coal-
fired power stations burning seleniferous coal in China
reported much higher concentrations than in plants collected
away from the source (Liu et al., 2007).
11.2.7.3.3 Soil–water–plant relationshipsDespite selenium being essential for some green algae such
as Chlamydomonas, it has not been shown to be essential for
higher plants (Novoselov et al., 2002; Pilon-Smits and LeDuc,
2009). The selenium concentrations in plants generally reflect
those of the soils in which they are grown. An important factor
which may determine whether or not selenium-related health
problems affect man and animals is the variable capacity of
different plant species to accumulate selenium (Alloway, 1995;
Frankenberger and Benson, 1994; Jacobs, 1989; Oldfield,
1999). Plants with �25 mg kg�1 selenium may cause acute
poisoning of animals, but these plants are generally distasteful
and not eaten unless the animals are especially hungry (Knight
and Walter, 2001).
Rosenfield and Beath (1964) classified plants into three
groups based on their selenium uptake from seleniferous
soils. They are: (1) selenium accumulator plants which can
contain >1000 mg kg�1 selenium and grow well on high-
selenium soils; (2) secondary selenium absorbers with concen-
trations in the range of 50–100 mg kg�1; and (3) others which
include grains and grasses that can contain up to 50 mg kg�1
selenium. Selenium concentrations can range from 0.005 to
5500 mg kg�1 in selenium accumulators, with most plants
containing less than 10 mg kg�1.
Plants that require selenium for growth are called obligate
accumulators; they are capable of accumulating 10 times the
amount of selenium present in soil and include Astragalus,
Conopsis, Xylorhiza, and Stanleya. Plants known as facultative
accumulators do not require selenium for growth, but will
bind selenium in its organic forms if it is present in the soil;
these plants belong to the genera Acacia, Artemisia, Aster, Atri-
plex, Castilleja, Penstemon, and Grindelia (Knight and Walter,
2001). Accumulators belonging to the plant genera Astragalus,
Haplopappus, and Stanleya are commonly found in the semiarid
seleniferous environments of the western United States and
elsewhere and are used as indicators of high-selenium environ-
ments, although other species of these genera are non-
accumulators (Alloway, 1995; Jacobs, 1989).
The exclusion of selenium from the proteins of accumulator
plants is thought to be the basis for their selenium tolerance
with selenium metabolism based mainly on water-soluble,
nonprotein forms such as selenium–methylselenomethionine
(Jacobs, 1989). The ‘garlic’ odor characteristic of selenium-
accumulating plants reflects the volatile organic compounds
DMSe and dimethyldiselenide. Plants can suffer selenium tox-
icity as a result of selenium competition with essential metabo-
lites for biochemical sites, replacement of essential ions by
selenium, mainly major cations, selenate occupation of the
sites of essential groups such as phosphate and nitrate, or sele-
nium substitution in essential sulfur compounds.
Experimental evidence suggests that there is a negative cor-
relation between very high soil selenium concentrations and
plant growth. Alfalfa yields have been shown to decline when
extractable selenium in soil exceeds 500 mg kg�1. Yellowing,
black spots, and chlorosis of plant leaves and pink root tissue
can occur (Frankenberger and Benson, 1994; Jacobs, 1989).
Phytotoxicity in nature has been reported only from China,
where high selenium concentrations in soil caused discolor-
ation of maize corn-head embryos and also affected the growth
and yield of wheat and pea crops, respectively (Yang et al.,
1983).
In alkaline soils, selenium is often present as selenite, which
is bioavailable to plants and may prevent selenium deficiency
in people who eat them. The oxidation state of selenium is
critical in determining its availability in the food chain. For
example, in neutral to alkaline soils, Se6þ (selenate) is the
dominant state. This form of selenium is generally more solu-
ble and mobile in soils and is readily available for plant uptake
than selenite (Se4þ), which has lower solubility and greater
affinity for adsorption on soil particle surfaces (Mikkelsen
et al., 1989).
Food crops generally have a low selenium tolerance but
most crops have the potential to accumulate selenium in quan-
tities toxic to animals and humans (Jacobs, 1989). In general,
root crops contain the highest selenium concentrations
(Table 11) with plant leaves containing a higher concentration
than the tuber. For example, Yang et al. (1983) noted that
selenium concentrations in vegetables (0.3–81.4 mg kg�1)
were generally higher than in cereal crops (0.3–28.5 mg kg�1
in rice and maize) in seleniferous regions of China. Brassicas
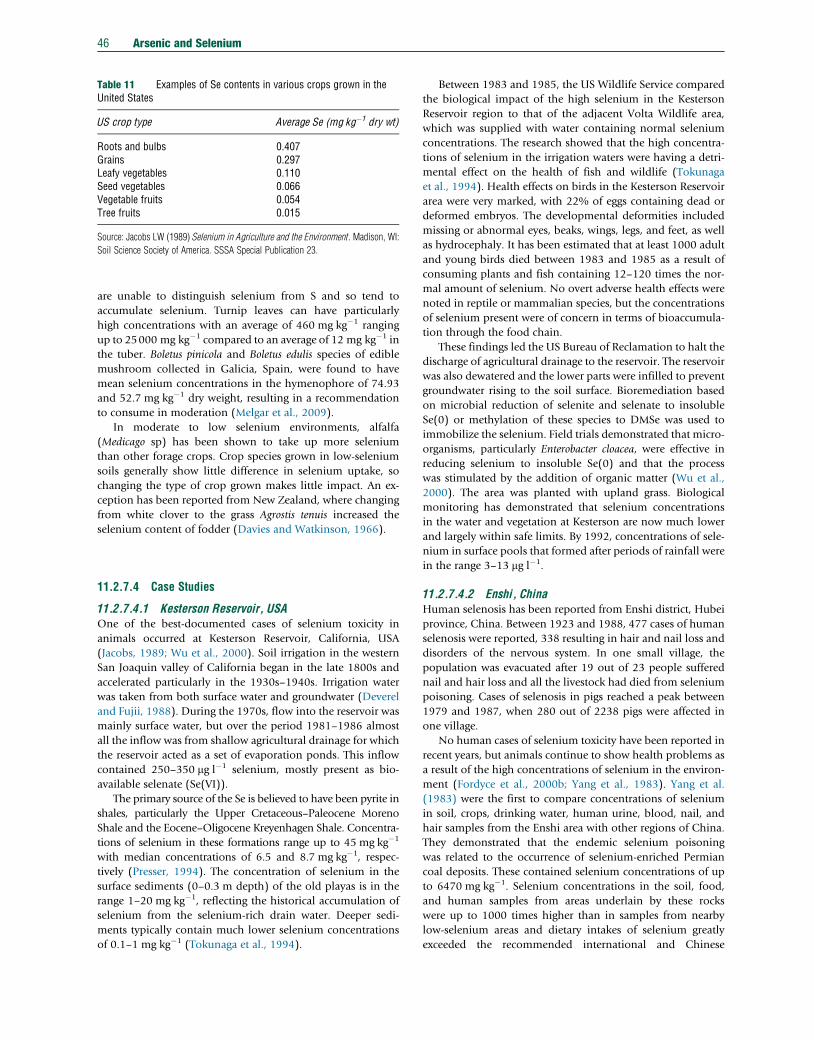
Table 11 Examples of Se contents in various crops grown in theUnited States
US crop type Average Se (mg kg�1 dry wt)
Roots and bulbs 0.407Grains 0.297Leafy vegetables 0.110Seed vegetables 0.066Vegetable fruits 0.054Tree fruits 0.015
Source: Jacobs LW (1989) Selenium in Agriculture and the Environment. Madison, WI:
Soil Science Society of America. SSSA Special Publication 23.
46 Arsenic and Selenium
are unable to distinguish selenium from S and so tend to
accumulate selenium. Turnip leaves can have particularly
high concentrations with an average of 460 mg kg�1 ranging
up to 25000 mg kg�1 compared to an average of 12 mg kg�1 in
the tuber. Boletus pinicola and Boletus edulis species of edible
mushroom collected in Galicia, Spain, were found to have
mean selenium concentrations in the hymenophore of 74.93
and 52.7 mg kg�1 dry weight, resulting in a recommendation
to consume in moderation (Melgar et al., 2009).
In moderate to low selenium environments, alfalfa
(Medicago sp) has been shown to take up more selenium
than other forage crops. Crop species grown in low-selenium
soils generally show little difference in selenium uptake, so
changing the type of crop grown makes little impact. An ex-
ception has been reported from New Zealand, where changing
from white clover to the grass Agrostis tenuis increased the
selenium content of fodder (Davies and Watkinson, 1966).
11.2.7.4 Case Studies
11.2.7.4.1 Kesterson Reservoir, USAOne of the best-documented cases of selenium toxicity in
animals occurred at Kesterson Reservoir, California, USA
(Jacobs, 1989; Wu et al., 2000). Soil irrigation in the western
San Joaquin valley of California began in the late 1800s and
accelerated particularly in the 1930s–1940s. Irrigation water
was taken from both surface water and groundwater (Deverel
and Fujii, 1988). During the 1970s, flow into the reservoir was
mainly surface water, but over the period 1981–1986 almost
all the inflow was from shallow agricultural drainage for which
the reservoir acted as a set of evaporation ponds. This inflow
contained 250–350 mg l�1 selenium, mostly present as bio-
available selenate (Se(VI)).
The primary source of the Se is believed to have been pyrite in
shales, particularly the Upper Cretaceous–Paleocene Moreno
Shale and the Eocene–Oligocene Kreyenhagen Shale. Concentra-
tions of selenium in these formations range up to 45 mg kg�1
with median concentrations of 6.5 and 8.7 mg kg�1, respec-
tively (Presser, 1994). The concentration of selenium in the
surface sediments (0–0.3 m depth) of the old playas is in the
range 1–20 mg kg�1, reflecting the historical accumulation of
selenium from the selenium-rich drain water. Deeper sedi-
ments typically contain much lower selenium concentrations
of 0.1–1 mg kg�1 (Tokunaga et al., 1994).
Between 1983 and 1985, the US Wildlife Service compared
the biological impact of the high selenium in the Kesterson
Reservoir region to that of the adjacent Volta Wildlife area,
which was supplied with water containing normal selenium
concentrations. The research showed that the high concentra-
tions of selenium in the irrigation waters were having a detri-
mental effect on the health of fish and wildlife (Tokunaga
et al., 1994). Health effects on birds in the Kesterson Reservoir
area were very marked, with 22% of eggs containing dead or
deformed embryos. The developmental deformities included
missing or abnormal eyes, beaks, wings, legs, and feet, as well
as hydrocephaly. It has been estimated that at least 1000 adult
and young birds died between 1983 and 1985 as a result of
consuming plants and fish containing 12–120 times the nor-
mal amount of selenium. No overt adverse health effects were
noted in reptile or mammalian species, but the concentrations
of selenium present were of concern in terms of bioaccumula-
tion through the food chain.
These findings led the US Bureau of Reclamation to halt the
discharge of agricultural drainage to the reservoir. The reservoir
was also dewatered and the lower parts were infilled to prevent
groundwater rising to the soil surface. Bioremediation based
on microbial reduction of selenite and selenate to insoluble
Se(0) or methylation of these species to DMSe was used to
immobilize the selenium. Field trials demonstrated that micro-
organisms, particularly Enterobacter cloacea, were effective in
reducing selenium to insoluble Se(0) and that the process
was stimulated by the addition of organic matter (Wu et al.,
2000). The area was planted with upland grass. Biological
monitoring has demonstrated that selenium concentrations
in the water and vegetation at Kesterson are now much lower
and largely within safe limits. By 1992, concentrations of sele-
nium in surface pools that formed after periods of rainfall were
in the range 3–13 mg l�1.
11.2.7.4.2 Enshi, ChinaHuman selenosis has been reported from Enshi district, Hubei
province, China. Between 1923 and 1988, 477 cases of human
selenosis were reported, 338 resulting in hair and nail loss and
disorders of the nervous system. In one small village, the
population was evacuated after 19 out of 23 people suffered
nail and hair loss and all the livestock had died from selenium
poisoning. Cases of selenosis in pigs reached a peak between
1979 and 1987, when 280 out of 2238 pigs were affected in
one village.
No human cases of selenium toxicity have been reported in
recent years, but animals continue to show health problems as
a result of the high concentrations of selenium in the environ-
ment (Fordyce et al., 2000b; Yang et al., 1983). Yang et al.
(1983) were the first to compare concentrations of selenium
in soil, crops, drinking water, human urine, blood, nail, and
hair samples from the Enshi area with other regions of China.
They demonstrated that the endemic selenium poisoning
was related to the occurrence of selenium-enriched Permian
coal deposits. These contained selenium concentrations of up
to 6470 mg kg�1. Selenium concentrations in the soil, food,
and human samples from areas underlain by these rocks
were up to 1000 times higher than in samples from nearby
low-selenium areas and dietary intakes of selenium greatly
exceeded the recommended international and Chinese
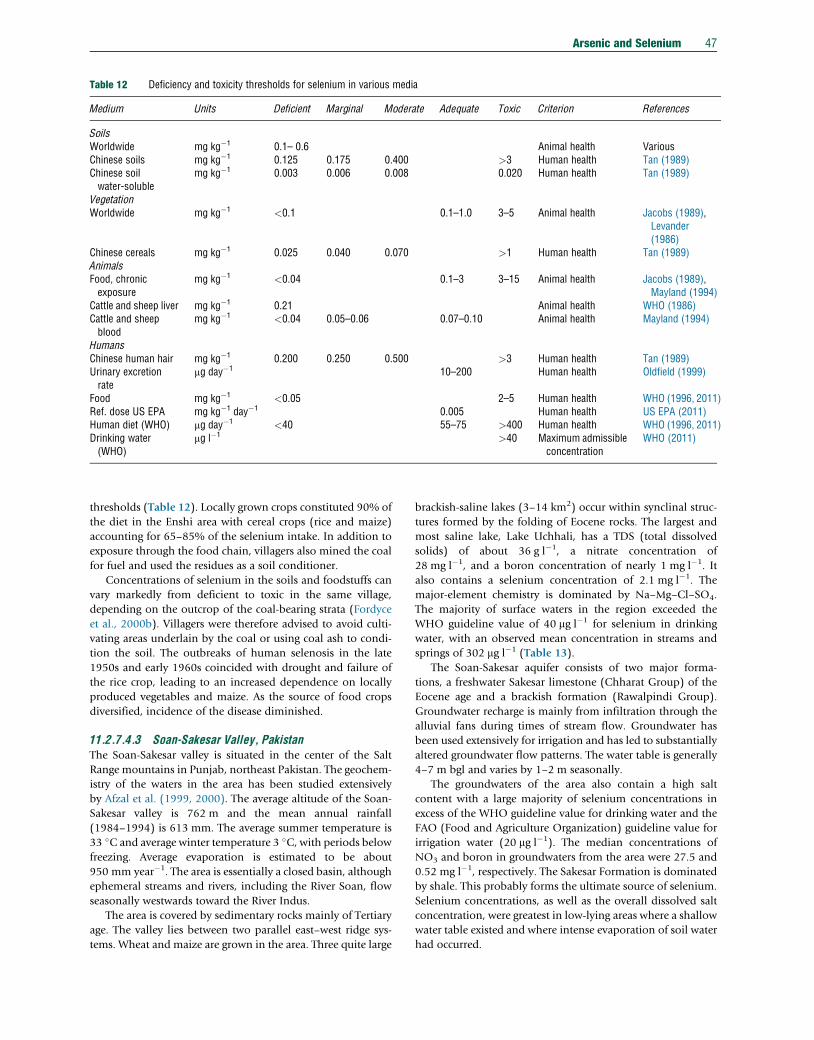
Table 12 Deficiency and toxicity thresholds for selenium in various media
Medium Units Deficient Marginal Moderate Adequate Toxic Criterion References
SoilsWorldwide mg kg�1 0.1– 0.6 Animal health VariousChinese soils mg kg�1 0.125 0.175 0.400 >3 Human health Tan (1989)Chinese soilwater-soluble
mg kg�1 0.003 0.006 0.008 0.020 Human health Tan (1989)
VegetationWorldwide mg kg�1 <0.1 0.1–1.0 3–5 Animal health Jacobs (1989),
Levander(1986)
Chinese cereals mg kg�1 0.025 0.040 0.070 >1 Human health Tan (1989)AnimalsFood, chronicexposure
mg kg�1 <0.04 0.1–3 3–15 Animal health Jacobs (1989),Mayland (1994)
Cattle and sheep liver mg kg�1 0.21 Animal health WHO (1986)Cattle and sheepblood
mg kg�1 <0.04 0.05–0.06 0.07–0.10 Animal health Mayland (1994)
HumansChinese human hair mg kg�1 0.200 0.250 0.500 >3 Human health Tan (1989)Urinary excretionrate
mg day�1 10–200 Human health Oldfield (1999)
Food mg kg�1 <0.05 2–5 Human health WHO (1996, 2011)Ref. dose US EPA mg kg�1 day�1 0.005 Human health US EPA (2011)Human diet (WHO) mg day�1 <40 55–75 >400 Human health WHO (1996, 2011)Drinking water(WHO)
mg l�1 >40 Maximum admissibleconcentration
WHO (2011)
Arsenic and Selenium 47
thresholds (Table 12). Locally grown crops constituted 90% of
the diet in the Enshi area with cereal crops (rice and maize)
accounting for 65–85% of the selenium intake. In addition to
exposure through the food chain, villagers also mined the coal
for fuel and used the residues as a soil conditioner.
Concentrations of selenium in the soils and foodstuffs can
vary markedly from deficient to toxic in the same village,
depending on the outcrop of the coal-bearing strata (Fordyce
et al., 2000b). Villagers were therefore advised to avoid culti-
vating areas underlain by the coal or using coal ash to condi-
tion the soil. The outbreaks of human selenosis in the late
1950s and early 1960s coincided with drought and failure of
the rice crop, leading to an increased dependence on locally
produced vegetables and maize. As the source of food crops
diversified, incidence of the disease diminished.
11.2.7.4.3 Soan-Sakesar Valley, PakistanThe Soan-Sakesar valley is situated in the center of the Salt
Range mountains in Punjab, northeast Pakistan. The geochem-
istry of the waters in the area has been studied extensively
by Afzal et al. (1999, 2000). The average altitude of the Soan-
Sakesar valley is 762 m and the mean annual rainfall
(1984–1994) is 613 mm. The average summer temperature is
33 �C and average winter temperature 3 �C, with periods below
freezing. Average evaporation is estimated to be about
950 mm year�1. The area is essentially a closed basin, although
ephemeral streams and rivers, including the River Soan, flow
seasonally westwards toward the River Indus.
The area is covered by sedimentary rocks mainly of Tertiary
age. The valley lies between two parallel east–west ridge sys-
tems. Wheat and maize are grown in the area. Three quite large
brackish-saline lakes (3–14 km2) occur within synclinal struc-
tures formed by the folding of Eocene rocks. The largest and
most saline lake, Lake Uchhali, has a TDS (total dissolved
solids) of about 36 g l�1, a nitrate concentration of
28 mg l�1, and a boron concentration of nearly 1 mg l�1. It
also contains a selenium concentration of 2.1 mg l�1. The
major-element chemistry is dominated by Na–Mg–Cl–SO4.
The majority of surface waters in the region exceeded the
WHO guideline value of 40 mg l�1 for selenium in drinking
water, with an observed mean concentration in streams and
springs of 302 mg l�1 (Table 13).
The Soan-Sakesar aquifer consists of two major forma-
tions, a freshwater Sakesar limestone (Chharat Group) of the
Eocene age and a brackish formation (Rawalpindi Group).
Groundwater recharge is mainly from infiltration through the
alluvial fans during times of stream flow. Groundwater has
been used extensively for irrigation and has led to substantially
altered groundwater flow patterns. The water table is generally
4–7 m bgl and varies by 1–2 m seasonally.
The groundwaters of the area also contain a high salt
content with a large majority of selenium concentrations in
excess of the WHO guideline value for drinking water and the
FAO (Food and Agriculture Organization) guideline value for
irrigation water (20 mg l�1). The median concentrations of
NO3 and boron in groundwaters from the area were 27.5 and
0.52 mg l�1, respectively. The Sakesar Formation is dominated
by shale. This probably forms the ultimate source of selenium.
Selenium concentrations, as well as the overall dissolved salt
concentration, were greatest in low-lying areas where a shallow
water table existed and where intense evaporation of soil water
had occurred.
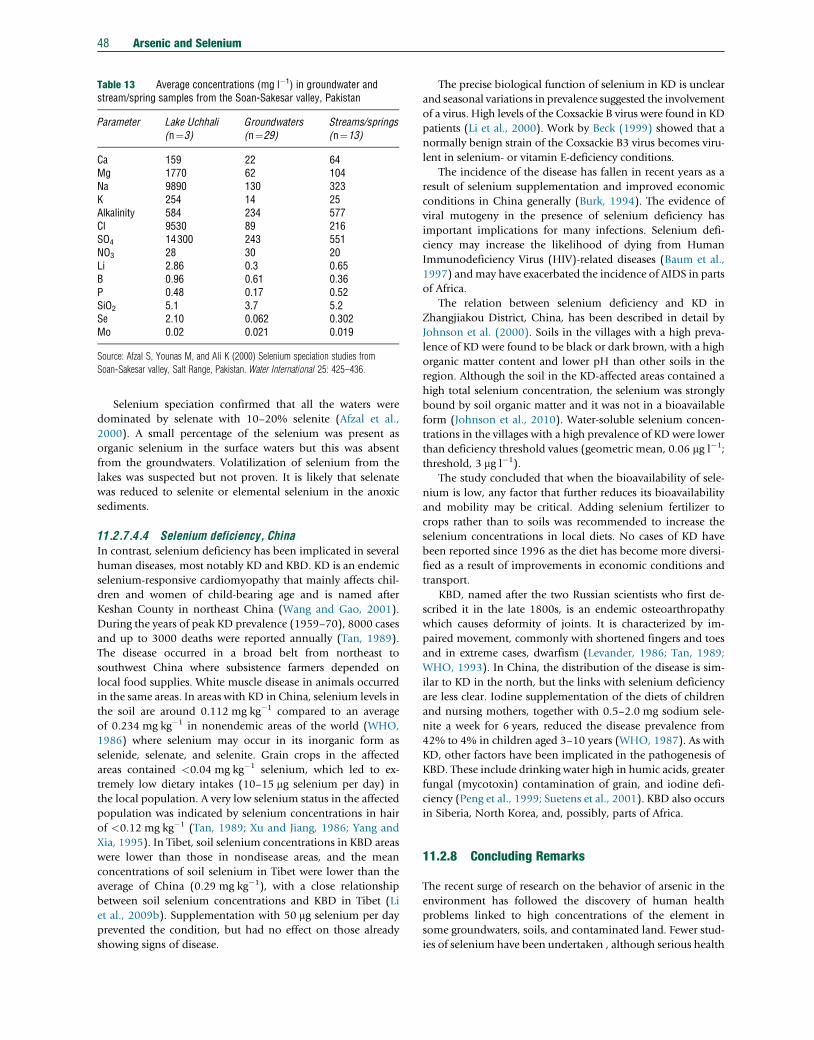
Table 13 Average concentrations (mg l�1) in groundwater andstream/spring samples from the Soan-Sakesar valley, Pakistan
Parameter Lake Uchhali(n¼3)
Groundwaters(n¼29)
Streams/springs(n¼13)
Ca 159 22 64Mg 1770 62 104Na 9890 130 323K 254 14 25Alkalinity 584 234 577Cl 9530 89 216SO4 14300 243 551NO3 28 30 20Li 2.86 0.3 0.65B 0.96 0.61 0.36P 0.48 0.17 0.52SiO2 5.1 3.7 5.2Se 2.10 0.062 0.302Mo 0.02 0.021 0.019
Source: Afzal S, Younas M, and Ali K (2000) Selenium speciation studies from
Soan-Sakesar valley, Salt Range, Pakistan. Water International 25: 425–436.
48 Arsenic and Selenium
Selenium speciation confirmed that all the waters were
dominated by selenate with 10–20% selenite (Afzal et al.,
2000). A small percentage of the selenium was present as
organic selenium in the surface waters but this was absent
from the groundwaters. Volatilization of selenium from the
lakes was suspected but not proven. It is likely that selenate
was reduced to selenite or elemental selenium in the anoxic
sediments.
11.2.7.4.4 Selenium deficiency, ChinaIn contrast, selenium deficiency has been implicated in several
human diseases, most notably KD and KBD. KD is an endemic
selenium-responsive cardiomyopathy that mainly affects chil-
dren and women of child-bearing age and is named after
Keshan County in northeast China (Wang and Gao, 2001).
During the years of peak KD prevalence (1959–70), 8000 cases
and up to 3000 deaths were reported annually (Tan, 1989).
The disease occurred in a broad belt from northeast to
southwest China where subsistence farmers depended on
local food supplies. White muscle disease in animals occurred
in the same areas. In areas with KD in China, selenium levels in
the soil are around 0.112 mg kg�1 compared to an average
of 0.234 mg kg�1 in nonendemic areas of the world (WHO,
1986) where selenium may occur in its inorganic form as
selenide, selenate, and selenite. Grain crops in the affected
areas contained <0.04 mg kg�1 selenium, which led to ex-
tremely low dietary intakes (10–15 mg selenium per day) in
the local population. A very low selenium status in the affected
population was indicated by selenium concentrations in hair
of <0.12 mg kg�1 (Tan, 1989; Xu and Jiang, 1986; Yang and
Xia, 1995). In Tibet, soil selenium concentrations in KBD areas
were lower than those in nondisease areas, and the mean
concentrations of soil selenium in Tibet were lower than the
average of China (0.29 mg kg�1), with a close relationship
between soil selenium concentrations and KBD in Tibet (Li
et al., 2009b). Supplementation with 50 mg selenium per day
prevented the condition, but had no effect on those already
showing signs of disease.
The precise biological function of selenium in KD is unclear
and seasonal variations in prevalence suggested the involvement
of a virus. High levels of the Coxsackie B virus were found in KD
patients (Li et al., 2000). Work by Beck (1999) showed that a
normally benign strain of the Coxsackie B3 virus becomes viru-
lent in selenium- or vitamin E-deficiency conditions.
The incidence of the disease has fallen in recent years as a
result of selenium supplementation and improved economic
conditions in China generally (Burk, 1994). The evidence of
viral mutogeny in the presence of selenium deficiency has
important implications for many infections. Selenium defi-
ciency may increase the likelihood of dying from Human
Immunodeficiency Virus (HIV)-related diseases (Baum et al.,
1997) andmay have exacerbated the incidence of AIDS in parts
of Africa.
The relation between selenium deficiency and KD in
Zhangjiakou District, China, has been described in detail by
Johnson et al. (2000). Soils in the villages with a high preva-
lence of KD were found to be black or dark brown, with a high
organic matter content and lower pH than other soils in the
region. Although the soil in the KD-affected areas contained a
high total selenium concentration, the selenium was strongly
bound by soil organic matter and it was not in a bioavailable
form (Johnson et al., 2010). Water-soluble selenium concen-
trations in the villages with a high prevalence of KD were lower
than deficiency threshold values (geometric mean, 0.06 mg l�1;
threshold, 3 mg l�1).
The study concluded that when the bioavailability of sele-
nium is low, any factor that further reduces its bioavailability
and mobility may be critical. Adding selenium fertilizer to
crops rather than to soils was recommended to increase the
selenium concentrations in local diets. No cases of KD have
been reported since 1996 as the diet has become more diversi-
fied as a result of improvements in economic conditions and
transport.
KBD, named after the two Russian scientists who first de-
scribed it in the late 1800s, is an endemic osteoarthropathy
which causes deformity of joints. It is characterized by im-
paired movement, commonly with shortened fingers and toes
and in extreme cases, dwarfism (Levander, 1986; Tan, 1989;
WHO, 1993). In China, the distribution of the disease is sim-
ilar to KD in the north, but the links with selenium deficiency
are less clear. Iodine supplementation of the diets of children
and nursing mothers, together with 0.5–2.0 mg sodium sele-
nite a week for 6 years, reduced the disease prevalence from
42% to 4% in children aged 3–10 years (WHO, 1987). As with
KD, other factors have been implicated in the pathogenesis of
KBD. These include drinking water high in humic acids, greater
fungal (mycotoxin) contamination of grain, and iodine defi-
ciency (Peng et al., 1999; Suetens et al., 2001). KBD also occurs
in Siberia, North Korea, and, possibly, parts of Africa.
11.2.8 Concluding Remarks
The recent surge of research on the behavior of arsenic in the
environment has followed the discovery of human health
problems linked to high concentrations of the element in
some groundwaters, soils, and contaminated land. Fewer stud-
ies of selenium have been undertaken , although serious health
Arsenic and Selenium 49
problems related to selenium toxicity or deficiency have been
reported. There have also been many studies on the distribu-
tion of arsenic, and more recently selenium, for metalliferous,
especially gold, exploration.
This chapter has outlined the main effects of arsenic and
selenium on human and animal health, their abundance
and distribution in the environment, sampling and analysis,
and the main factors controlling their speciation and cycling.
Such information should help to identify aquifers, water
resources, and soils at risk from high concentrations of arsenic
and selenium, and areas of selenium deficiency. Human activ-
ity has had, and is likely to continue to have, a major role in
releasing arsenic and selenium from the geosphere and in
perturbing the natural distribution of these and other elements
over the Earth’s surface.
Arsenic and selenium demonstrate many similarities in
their behavior in the environment. Both are redox-sensitive
and occur in several oxidation states under different environ-
mental conditions. Both partition preferentially into sulfide
minerals and metal oxides and are concentrated naturally in
areas of mineralization and geothermal activity. Also, both
elements occur as oxyanions in solution and, depending on
redox status, are potentially mobile in the near-neutral to
alkaline pH conditions that typify many natural waters. How-
ever, some major differences also exist. Selenium is immobile
under reducing conditions, while the mobility of arsenic is less
predictable and depends on a range of other factors. Selenium
also appears to partition more strongly with organic matter
than does arsenic.
While concern with arsenic in the environment relates prin-
cipally to toxicity conditions, concerns with selenium relate to
both deficiency and toxicity conditions. The optimum range of
selenium concentrations for health is narrow. In certain envi-
ronments, high intakes of arsenic or selenium, or very low
intakes of selenium, can occur, potentially leading to a wide
range of disease conditions, not all of which are well under-
stood and some of which may not yet have been recognized.
Many of the health and environmental problems caused by
arsenic and selenium were not predicted until recently because
of a lack of knowledge of the distribution and behavior of
arsenic and selenium in the environment. Recent improve-
ments in understanding have been aided by improved and
cost-effective analytical techniques and more powerful data
processing, which have made it easier to prepare high-
resolution geochemical maps. Also, modern digital datasets
of geochemical and hydrochemical data are used increasingly
in modeling studies to estimate element speciation,
bioavailability, and risk.
The discovery of high concentrations of arsenic in ground-
water from parts of the Bengal Basin of Bangladesh and West
Bengal and elsewhere after several years of groundwater devel-
opment has highlighted the need to analyze for a wide range of
water-quality parameters before using such water sources. With
the advent of modern multielement analytical techniques capa-
ble of measuring arsenic and selenium at environmentally rele-
vant concentrations on an almost routine basis, it should be
possible to include arsenic and selenium in more geochemical
and hydrochemical surveys and thereby acquire a much better
picture of their distribution, behavior, and role in the
environment.
Acknowledgments
The authors would like to thank Kirk Nordstrom for an early
copy of his review of the thermodynamics of the As–O–S
system and also an anonymous reviewer for constructive com-
ments about the microbiology of arsenate reduction. The con-
tribution of David Kinniburgh, Pauline Smedley, Fiona
Fordyce, and Ben Klinck to the chapter is published with the
permission of the Executive Director of the British Geological
Survey (Natural Environment Research Council).
References
Abdullah MI, Shiyu Z, and Mosgren K (1995) Arsenic and selenium species in theoxic and anoxic waters of the Oslofjord, Norway. Marine Pollution Bulletin31: 116–126.
Adkins R, Walsh N, Edmunds W, and Trafford JM (1995) Inductively coupled plasmaatomic emission spectrometric analysis of low levels of selenium in natural waters.Analyst 120: 1433–1436.
Afzal S, Younas M, and Ali K (2000) Selenium speciation studies from Soan-Sakesarvalley, Salt Range, Pakistan. Water International 25: 425–436.
Afzal S, Younas M, and Hussain K (1999) Selenium speciation of surface sedimentsfrom saline lakes of the Soan-Sakesar Valley Salt-Range, Pakistan. Water QualityResearch Journal of Canada 34: 575–588.
Aggarwal PK (2000) Preliminary Report of Investigations – Isotope Hydrology ofGroundwater in Bangladesh: Implications for Characterization and Mitigation ofArsenic in Groundwater. Vienna: International Atomic Energy Agency.
Aggett J and O’Brien GA (1985) Detailed model for the mobility of arsenic in lacustrinesediments based on measurements in Lake Ohakuri. Environmental Science &Technology 19: 231–238.
Aggett J and Kriegman MR (1988) The extent of formation of arsenic (III) in sedimentinterstitial waters and its release to hypolimnetic waters in Lake Ohakuri. WaterResearch 4: 407–411.
Ahmann D, Krumholz LR, Hemond HF, Lovley DR, and Morel FMM (1997) Microbialmobilization of arsenic from sediments of the Aberjona watershed. EnvironmentalScience & Technology 31: 2923–2930.
Ahmann D, Roberts AL, Krumholz LR, and Morel FMM (1994) Microbe grows byreducing arsenic. Nature 371: 750.
Ahmed KM, Hoque M, Hasan MK, Ravenscroft P, and Chowdhury LR (1998)Occurrence and origin of water well methane gas in Bangladesh. Journal of theGeological Society of India 51: 697–708.
Aihua Z, Xiaoxin H, Xianyao J, Peng L, Yucheng G, and Shouzheng X (2000)The progress of study on endemic arsenism due to burning arsenic containing coalin Guizhou province. Metal Ions in Biology and Medicine 6: 53–55.
Allaway WH (1968) Control of environmental levels of selenium. Trace Substances inEnvironmental Health 2: 181–206.
Alloway BJ (1995) Heavy Metals in Soils. London: Blackie Academic.American Society for Testing and Materials (2010) Annual Book of ASTM Standards.
West Conshohocken, PA: American Society for Testing and Materials.Amouroux D, Liss PS, Tessier E, Hamren-Larsson M, and Donard OFX (2001) Role of
oceans as biogenic sources of selenium. Earth and Planetary Science Letters189: 277–283.
Anderson RK, Thompson M, and Culbard E (1986) Selective reduction of arsenicspecies by continuous hydride generation. Part II. Validation of methods forapplication to natural waters. Analyst 111: 1153–1157.
Andreae MO (1980) Arsenic in rain and the atmospheric mass balance of arsenic.Journal of Geophysical Research 85: 4512–4518.
Andreae MO and Andreae TW (1989) Dissolved arsenic species in the Scheldeestuary and watershed, Belgium. Estuarine, Coastal and Shelf Science29: 421–433.
Andreae MO, Byrd TJ, and Froelich ON (1983) Arsenic, antimony, germanium and tin inthe Tejo estuary, Portugal: Modelling of a polluted estuary. Environmental Science& Technology 17: 731–737.
Appelo CAJ and Postma D (1993) Geochemistry Groundwater and Pollution.The Netherlands: AA Balkema.
Appelo CAJ, Van der Weiden MJJ, Tournassat C, and Charlet L (2002) Surfacecomplexation of ferrous iron and carbonate on ferrihydrite and the mobilization ofarsenic. Environmental Science & Technology 36: 3096–3103.
50 Arsenic and Selenium
Armienta MA, Rodriguez R, Aguayo A, Ceniceros N, Villasenor G, and Cruz O (1997)Arsenic contamination of groundwater at Zimapan, Mexico. Hydrogeology Journal5: 39–46.
Arthur JR and Beckett GT (1989) Selenium deficiency and thyroid hormone metabolism.In: Wendell A (ed.) Selenium in Biology and Medicine, pp. 90–95. New York:Springer.
ATSDR (2003) Toxicological Profile for Selenium. Atlanta, GA: US Department of Healthand Human Services, Public Health Service.
ATSDR (2007) Toxicological Profile for Arsenic. Atlanta, GA: US Department of Healthand Human Services, Public Health Service.
ATSDR (2010) CERCLA Priority List of Hazardous Substances. Atlanta, GA: Agency forToxic Substances & Disease Registry. http://www.atsdr.cdc.gov/cercla/, Accessed25 January 2011.
Azcue JM, Mudroch A, Rosa F, and Hall GEM (1994) Effects of abandoned gold minetailings on the arsenic concentrations in water and sediments of Jack of Clubs Lake,BC. Environmental Technology 15: 669–678.
Azcue JM, Mudroch A, Rosa F, Hall GEM, Jackson TA, and Reynoldson T (1995) Traceelements in water, sediments, porewater, and biota polluted by tailings from anabandoned gold mine in British Columbia, Canada. Journal of GeochemicalExploration 52: 25–34.
Azcue JM and Nriagu JO (1995) Impact of abandoned mine tailings on the arsenicconcentrations in Moira Lake, Ontario. Journal of Geochemical Exploration52: 81–89.
Barbaris B and Betterton EA (1996) Initial snow chemistry survey of the Mogollon Rimin Arizona. Atmospheric Environment 30: 3093–3103.
Barceloux DG (1999) Selenium. Clinical Toxicology 37(2): 145–172.Bar-Yosef B and Meek D (1987) Selenium sorption by kaolinite and montmorillonite.
Soil Science 144: 12–19.Baum MK, Shor-Posner G, Lai SH, et al. (1997) High risk of HIV-related mortality is
associated with selenium deficiency. Journal of Acquired Immune DeficiencySyndromes and Human Retrovirology 15: 370–374.
Bech J, Poschenreider C, Llugany M, et al. (1997) Arsenic and heavy metalcontamination of soil and vegetation around a copper mine in Northern Peru.The Science of the Total Environment 203: 83–91.
Beck MA (1999) Selenium and host defense towards viruses. Proceedings of theNutrition Society 58: 707–711.
Bednar AJ, Garbarino JR, Ranville JF, and Wildeman TR (2002) Preserving thedistribution of inorganic arsenic species in groundwater and acid mine drainagesamples. Environmental Science & Technology 36: 2213–2218.
Berg M, Tran HC, Nguyen TC, Pham HV, Schertenleib R, and Giger W (2001) Arseniccontamination of groundwater and drinking water in Vietnam: A human health threat.Environmental Science & Technology 35: 2621–2626.
Bethke C (2002) The Geochemist’s Workbench: User Guide. Urbana: University ofIllinois.
BGS (1978–2006) Regional Geochemical Atlas Series. Nottingham: British GeologicalSurvey (formerly Institute of Geological Sciences).
BGS and DPHE (2001) Arsenic contamination of groundwater in Bangladesh(four volumes). In: Kinniburgh DG and Smedley PL (eds.) BGS Technical ReportWC/00/19. Nottingham: British Geological Survey.
Bhattacharya P, Chatterjee D, and Jacks G (1997) Occurrence of arsenic-contaminatedgroundwater in alluvial aquifers from delta plains, Eastern India: Options for safedrinking water supply. Water Resources Development 13: 79–92.
Bhattacharya P,Welch AH, Stollenwerk KG,McLaughlinMJ, Bundschuh J, and Panaullah G(2007) Arsenic in the environment: Biology and chemistry. The Science of the TotalEnvironment 379: 109–120. http://dx.doi.org/10.1016/j.scitotenv.2007.02.037.
Black A, Craw D, Youngson JH, and Karubaba J (2004) Natural recovery rates of a riversystem impacted by mine tailing discharge: Shag River, East Otago, New Zealand.Journal of Geochemical Exploration 84(1): 21–34.
Bodenan F, Baranger P, Piantone A, et al. (2004) Arsenic behaviour in gold-ore milltailings, Massif Central, France: Hydrogeochemical study and investigation of in situredox signatures. Applied Geochemistry 19(11): 1785–1800.
Bohari Y, Astruc A, Astruc M, and Cloud J (2001) Improvements of hydride generationfor the speciation of arsenic in natural freshwater samples by HPLC-HG-AFS.Journal of Analytical Atomic Spectrometry 16: 774–778.
Boyle DR, Turner RJW, and Hall GEM (1998) Anomalous arsenic concentrations ingroundwaters of an island community, Bowen Island, British Columbia.Environmental Geochemistry and Health 20: 199–212.
Brown GE, Henrich VE, Casey WH, et al. (1999) Metal oxide surfaces and theirinteractions with aqueous solutions and microbial organisms. Chemical Reviews77–174.
Bueno M and Potin-Gautier M (2002) Solid-phase extraction for thesimultaneous preconcentration of organic (selenocystine) and inorganic Se(IV),Se(VI) selenium in natural waters. Journal of Chromatography A 963: 185–193.
Burk RF (1994) Selenium in Biology and Human Health. New York: Springer.Burkel RS and Stoll RC (1999) Naturally occurring arsenic in sandstone aquifer water
supply wells of north-eastern Wisconsin. Ground Water Monitoring andRemediation 19: 114–121.
Cabon JY and Cabon N (2000) Determination of arsenic species in seawater byflow injection hydride generation in situ collection followed by graphite furnaceatomic absorption spectrometry – Stability of As(III). Analytica Chimica Acta418: 19–31.
Caceres L, Gruttner E, and Contreras R (1992) Water recycling in arid regions –Chilean case. Ambio 21: 138–144.
California Environmental Protection Agency (2010) Public Health Goals for Chemicalsin Drinking Water; Selenium. Sacramento, CA: California Environmental ProtectionAgency.
Camm GS, Butcher AR, Pirrie D, Hughes PK, and Glass HJ (2003) Secondary mineralphases associated with a historic arsenic calciner identified using automatedscanning electron microscopy: A pilot study from Cornwall, UK. MineralsEngineering 16(12): 1269–1277.
Casgrain A, Collings R, Harvey LJ, Boza JJ, and Fairweather-Tait SJ (2010)Micronutrient bioavailability research priorities. The American Journal of ClinicalNutrition 91: 14235–14295.
Chen SL, Dzeng SR, Yang MH, Chlu KH, Shieh GM, and Wal CM (1994) Arsenicspecies in groundwaters of the Blackfoot disease areas, Taiwan. EnvironmentalScience & Technology 28: 877–881.
Chen HW, Frey MM, Clifford D, McNeill LS, and Edwards M (1999) Arsenic treatmentconsiderations. Journal of American Water Works Association 91: 74–85.
Chen SL, Yeh SJ, Yang MH, and Lin TH (1995) Trace element concentration and arsenicspeciation in the well water of a Taiwan area with endemic Blackfoot disease.Biological Trace Element Research 48: 263–274.
Cheng H, Hu Y, Luo J, Xu B, and Zhao J (2009) Geochemical processes controlling fateand transport of arsenic in acid mine drainage (AMD) and natural systems.Journal of Hazardous Materials 165: 13–26.
Cherry JA, Shaikh AU, Tallman DE, and Nicholson RV (1979) Arsenic species asan indicator of redox conditions in groundwater. Journal of Hydrology43: 373–392.
Clark LC, Combs GF Jr, Turnbull BW, et al. (1996) Effects of selenium supplementationfor cancer prevention in patients with carcinoma of the skin. Journal of the AmericanMedical Association 276(24): 1957–1963.
Clewell HJ, Gentry PR, Barton HA, Shipp AM, Yager JW, and Andersen ME (1999)Requirements for a biologically realistic cancer risk assessment for inorganicarsenic. International Journal of Toxicology 18: 131–147.
Combs GF (2001) Selenium in global food systems. British Journal of Nutrition85: 517–547.
Combs GF and Combs SB (1986) The Role of Selenium in Nutrition. Orlando, FL:Academic Press.
Couture RM, Gobeil C, and Tessier A (2008) Chronology of atmospheric deposition ofarsenic inferred from reconstructed sedimentary records. Environmental Science& Technology 42: 6508–6513.
Crecelius EA (1975) The geochemical cycle of arsenic in Lake Washington and itsrelation to other elements. Limnology and Oceanography 20: 441–451.
Cullen WR and Reimer KJ (1989) Arsenic speciation in the environment. ChemicalReviews 89: 713–764.
Cummings DE, Caccavo F, Fendorf S, and Rosenzweig RF (1999) Arsenic mobilizationby the dissimilatory Fe(III)-reducing bacterium Shewanella alga BrY. EnvironmentalScience & Technology 33: 723–729.
Cutter GA (1989) The estuarine behavior of selenium in San Francisco Bay (California,USA). Estuarine, Coastal and Shelf Science 28: 13–34.
Cutter GA and Cutter LS (2001) Sources and cycling of selenium in the western andequatorial Atlantic Ocean. Deep Sea Research Part II: Topical Studies inOceanography 48: 2917–2931.
Darnley AG (1995) International geochemical mapping – A review. Journal ofGeochemical Exploration 55: 5–10.
Das D, Samanta G, Mandal BK, et al. (1996) Arsenic in groundwater in six districts ofWest Bengal, India. Environmental Geochemistry and Health 18: 5–15.
Daus B, Mattusch J, Paschke A, Wennrich R, and Weiss H (2000) Kinetics of the arseniteoxidation in seepage water from a tin mill tailings pond. Talanta 51: 1087–1095.
Daus B, Mattusch J, Wennrich R, and Weiss H (2002) Investigation on stability andpreservation of arsenic species in iron rich water samples. Talanta 58: 57–65.
Davies BE (1980) Applied Soil Trace Elements. Chichester: Wiley.Davies E and Watkinson J (1966) Uptake of native and applied Se by pasture species.
New Zealand Journal of Agricultural Research 9: 317–324.Davis C, Uthus E, and Finley J (2000) Dietary selenium and arsenic affect DNA
methylation in vitro in Caco-2 cells and in vivo in rat liver and colon. Journal ofNutrition 130: 2903–2909.
Arsenic and Selenium 51
Del Razo LM, Arellano MA, and Cebrian ME (1990) The oxidation states of arsenic inwell-water from a chronic arsenicism area of northern Mexico. EnvironmentalPollution 64: 143–153.
Demesmay C and Olle M (1997) Application of microwave digestion to the preparationof sediment samples for arsenic speciation. Fresenius’ Journal of AnalyticalChemistry 357: 1116–1121.
Deuel LE and Swoboda AR (1972) Arsenic solubility in a reduced environment.Soil Science Society of America Proceedings 36: 276–278.
Deverel S, Fio J, and Dubrovsky N (1994) Distribution and mobility of selenium ingroundwater in the western San Joaquin valley of California. In: Benson S (ed.)Selenium in the Environment, ch. 7, pp. 157–183. New York: Marcel Dekker.
Deverel SJ and Fujii R (1988) Processes affecting the distribution of selenium inshallow groundwater in agricultural areas, western San Josquin Valley, California.Water Resources Research 24: 516–524.
Diaz-Alarcon JP, Navarro-Alarcon M, de la Serrana HLG, and Lopez-Martinez MC(1996) Determination of selenium in meat products by hydride generation atomicabsorption spectrometry: Selenium levels in meat, organ meats, and sausages inSpain. Journal of Agricultural and Food Chemistry 44: 1494–1497.
Ding Z, Finkelman R, Belkin H, Aheng B, Hu T, and Xie U (2000) The mode ofoccurrence of arsenic in high arsenic coals from endemic arsenosis areasin Southwest Guizhou province, China. Metal Ions in Biology and Medicine6: 56–58.
Dissanayake CB and Chandrajith R (2009) Medical geology of arsenic. Introduction toMedical Geology, pp. 157–189. Berlin: Springer.
Driehaus W and Jekel M (1992) Determination of As(III) and total inorganic arsenic byon-line pretreatment in hydride generation atomic absorption spectrometry.Fresenius’ Journal of Analytical Chemistry 343: 352–356.
Driehaus W, Seith R, and Jekel M (1995) Oxidation of arsenate(III) with manganeseoxides in water-treatment. Water Research 29: 297–305.
Durum WH, Hem JD, and Heidel SG (1971) Reconnaissance of selected minor elementsin surface waters of the United States. US Geological Survey Circular 64, pp. 1–49.Menlo Park, CA: US Geological Survey.
Dzombak DA and Morel FMM (1990) Surface Complexation Modelling – HydrousFerric Oxide. New York: Wiley.
Edmunds WM, Cook JM, Kinniburgh DG, Miles DL, and Trafford JM (1989)Trace-element occurrence in British groundwaters. British Geological SurveyResearch Report SD/89/3. Keyworth: British Geological Survey.
Ehrlich H (2002) Bacterial oxidation of As(III) compounds. In: Frankenberger W (ed.)Environmental Chemistry of Arsenic, ch. 7, pp. 313–342. New York: Marcel Dekker.
Engberg RA (1999) Selenium budgets for Lake Powell and the upper Colorado RiverBasin. Journal of the American Water Resources Association 35: 771–786.
Environment Agency (2009) Contaminants in soil: Updated collation of toxicologicaldata and intake values for humans. Selenium. Environment Agency Science ReportSC050021. Bristol: Environment Agency.
Fairweather-Tait S, Bao Y, Broadley M, et al. (2011) Selenium in human health anddisease. Antioxidants & Redox Signalling 14(7): 1337–1383. http://dx.doi.org/10.1089/ars.2010.3275.
Fairweather-Tait SJ, Collings R, and Hurst R (2010) Selenium bioavailability: Currentknowledge and future research requirements. The American Journal of ClinicalNutrition 91: 1484S–1491S.
Farmer JG and Lovell MA (1986) Natural enrichment of arsenic in Loch Lomondsediments. Geochimica et Cosmochimica Acta 50: 2059–2067.
Feldmann J, Lai VWM, Cullen WR, Ma M, Lu X, and Le XC (1999) Sample preparationand storage can change arsenic speciation in human urine. Clinical Chemistry45: 1988.
Ferguson JF and Gavis J (1972) A review of the arsenic cycle in natural waters.Water Research 6(11): 1259–1274.
Fergusson JE (1990) The Heavy Elements: Chemistry, Environmental Impact and HealthEffects. London: Pergamon Press.
Ficklin WH and Callender E (1989) Arsenic geochemistry of rapidly accumulatingsediments, Lake Oahe, South Dakota. In: Mallard GE and Ragone SE (eds.)US Geological Survey Water-Resources Investigations Report 88-4420.US Geological Survey Toxic Substances Hydrology Program – Proceedings of theTechnical Meeting, Phoenix, Arizona, 26–30 Sept 1988, pp. 217–222. Menlo Park,CA: US Geological Survey.
Finkelman RB, Belkin HE, Centeno JA, and Baoshan Z (2003) Geological epidemiology:Coal combustion in china. In: Skinner HC and Berger AR (eds.) Geology and Health:Closing the Gap, p. 45. Oxford: Oxford University Press.
Fisher JC, Wallschlager D, Planer-Friedrich B, and Hollibaugh JT (2007) A newrole for sulfur in arsenic cycling. Environmental Science & Technology 42(1):81–85.
Florencio MH, Duarte MF, Facchetti S, et al. (1997) Identification of inorganic,methylated and hydride-refractory arsenic species in estuarine waters. Advances
by electrospray, ES-MS, pyrolysis-GC-MS and HPLC-ICP/MS. Analysis25: 226–229.
Focazio MJ, Welch AH, Watkins SA, Helsel DR, and Horng MA (1999) A retrospectiveanalysis on the occurrence of arsenic in ground-water resources of the United Statesand limitations in drinking-water-supply characterizations. US Geological SurveyWater-Resources Investigations Report 99-4279. Menlo Park, CA: US GeologicalSurvey.
Fordyce FM (2005) Selenium deficiency and toxicity in the environment. In: Selinus O,Alloway B, Centeno JA, Finkelman RB, Fuge R, Lindh U, and Smedley P (eds.)Essentials of Medical Geology, pp. 373–415. London: Elsevier.
Fordyce FM, Brereton N, Hughes J, Luo W, and Lewis J (2010) An initial study toassess the use of geological parent materials to predict the Se concentration inoverlying soils and in five staple foodstuffs produced on them in Scotland.Science of the Total Environment 408(22): 5295–5305.
Fordyce FM, Johnson CC, Navaratna URB, Appleton JD, and Dissanayake CB (2000a)Selenium and iodine in soil, rice and drinking water in relation to endemic goitre inSri Lanka. The Science of the Total Environment 263: 127–141.
Fordyce FM, Zhang G, Green K, and Liu X (2000b) Soil, grain and water chemistry inrelation to human selenium-responsive diseases in Enshi District, China. AppliedGeochemistry 15: 117–132.
FOREGS (2005) Geochemical Atlas of Europe: Part 1 – Background Information,Methodology, and Maps. Espoo, Finland: Geological Survey of Finland.
Forrest A, Kingsley R, and Schilling JG (2009) Determination of selenium and telluriumin basalt rock reference materials by isotope dilution hydride generation-inductivelycoupled plasma-mass spectrometry (ID-HG-ICP-MS). Geostandards andGeoanalytical Research 33(2): 261–269.
Foster AL, Brown GE, and Parks GA (1998a) X-ray absorption fine-structurespectroscopy study of photocatalyzed, heterogeneous As(III) oxidation on kaolinand anatase. Environmental Science & Technology 32: 1444–1452.
Foster AL, Brown GE, Tingle TN, and Parks GA (1998b) Quantitative arsenic speciationin mine tailings using X-ray absorption spectroscopy. American Mineralogist83: 553–568.
Foster AL, Breit GN, Whitney JW, et al. (2000) X-ray absorption fine structurespectroscopic investigation of arsenic species in soil and aquifer sediments fromBrahmanbaria, Bangladesh. 4th Annual Arsenic Conference, San Diego, 18–22 Jun.
Francesconi KA and Kuehnelt D (2002) Arsenic compounds in the environment.In: Frankenberger W (ed.) Environmental Chemistry of Arsenic, ch. 3, pp. 51–94.New York: Marcel Dekker.
Frankenberger WT (2002) Environmental Chemistry of Arsenic, pp. 391. New York:Marcel Dekker.
Frankenberger WT and Arshad M (2001) Bioremediation of selenium-contaminatedsediments and water. Biofactors 14: 241–254.
Frankenberger WT and Benson S (1994) Selenium in the Environment, pp. 456.New York: Marcel Dekker.
Fujii R and Swain WC (1995) Areal distribution of selected trace elements, salinity, andmajor ions in shallow ground water, Tulare Basin, Southern San Joaquin Valley,California. US Geological Survey Water-Resources Investigations Report 95-4048.Menlo Park, CA: US Geological Survey.
Gallagher PA, Schwegel CA, Wei XY, and Creed JT (2001) Speciation and preservationof inorganic arsenic in drinking water sources using EDTA with IC separation andICP-MS detection. Journal of Environmental Monitoring 3: 371–376.
Garcıa-Hernandez J, Glenn EP, Artiola J, and Baumgartner DJ (2000) Bioaccumulationof selenium (Se) in the Cienega de Santa Clara wetland, Sonora, Mexico.Ecotoxicology and Environmental Safety 46: 298–304.
Gelova GA (1977) Hydrogeochemistry of Ore Elements. Moscow: Nedra.Ghosh A, Mukiibi M, and Ela W (2004) TCLP underestimates leaching of arsenic from
solid residuals under landfill conditions. Environmental Science & Technology38: 4677–4682.
Ghosh A, Mukiibi M, Saez AE, and Ela WP (2006) Leaching of arsenic from granularferric hydroxide residuals under mature landfill conditions. Environmental Science& Technology 40: 6070–6075.
Giere R, Blackford M, and Smith K (2006) TEM Study of PM2.5 emitted from coal andtire combustion in a thermal power station. Enivronmental Science & Technology40: 6235–6240.
Gluskoter HJ, Ruch RR, Miller WG, Cahill RA, Dreher GB, and Kuhn JK (1977) TraceElements in Coal – Occurrence and Distribution, p. 154. Champaign, IL: IllinoisState Geological Survey.
Goldberg S (1985) Chemical modeling of anion competition on goethite using theconstant capacitance model. Soil Science Society of America Journal 49(4): 851–856.
Goldberg S (1986) Chemical modeling of arsenate adsorption on aluminum and ironoxide minerals. Soil Science Society of America Journal 50: 1154–1157.
Gomez-Ariza JL, Velasco-Arjona A, Giraldez I, Sanchez-Rodas D, and Morales E (2000)Coupling pervaporation-gas chromatography for speciation of volatile forms of
52 Arsenic and Selenium
selenium in sediments. International Journal of Environmental Analytical Chemistry78: 427–440.
Govindaraju K (1994) Compilation of working values and description for 383geostandards. Geostandards Newsletter 18: 1–158.
Grenthe I, Stumm W, Laaksuharju M, Nilsson AC, and Wikberg P (1992) Redoxpotentials and redox reactions in deep groundwater systems. Chemical Geology98: 131–150.
Grimes DJ, Ficklin WH, Meier AL, and McHugh JB (1995) Anomalous gold, antimony,arsenic, and tungsten in ground water and alluvium around disseminated golddeposits along the Getchell Trend, Humboldt County, Nevada. Journal ofGeochemical Exploration 52: 351–371.
Gulens J, Champ DR, and Jackson RE (1979) Influence of redox environments on themobility of arsenic in ground water. In: Jenne EA (ed.) Chemical Modeling inAqueous Systems, vol. 93, pp. 81–95. Washington, DC: American Chemical Society.
Gurzau ES and Gurzau AE (2001) Arsenic exposure from drinking groundwater inTransylvania, Romania: An overview. In: Chappell WR, Abernathy CO, and Calderon RL(eds.) Arsenic Exposure and Health Effects, vol. IV, pp. 181–184. Amsterdam: Elsevier.
Hall G and Pelchat J-C (1997) Determination of As, Bi, Sb, Se and Te in fifty five referencematerials by hydride generation ICP-MS. Geostandards Newsletter 21: 85–91.
Hall GEM, Pelchat JC, and Gauthier G (1999) Stability of inorganic arsenic(III) andarsenic(V) in water samples. Journal of Analytical Atomic Spectrometry 14: 205–213.
Harris MA and Ragusa S (2001) Bioremediation of acid mine drainage usingdecomposable plant material in a constant flow bioreactor. Environmental Geology40: 1192–1204.
Harvey CF, Swartz CH, Badruzzaman ABM, et al. (2002) Arsenic mobility andgroundwater extraction in Bangladesh. Science 298: 1602–1606.
Hasegawa H (1997) The behavior of trivalent and pentavalent methylarsenicals in LakeBiwa. Applied Organometallic Chemistry 11: 305–311.
Hasegawa H, Matsui M, Okamura S, Hojo M, Iwasaki N, and Sohrin Y (1999) Arsenicspeciation including ’hidden’ arsenic in natural waters. Applied OrganometallicChemistry 13: 113–119.
Hashimoto Y and Winchester JW (1967) Selenium in the atmosphere. EnvironmentalScience & Technology 1: 338–340.
Haygarth PM (1994) Global importance and cycling of selenium. In: Frankenberger WTand Benson S (eds.) Selenium in the Environment, ch. 1, pp. 1–28. New York:Marcel Dekker.
Heinrichs G and Udluft P (1999) Natural arsenic in Triassic rocks: A source ofdrinking-water contamination in Bavaria, Germany. Hydrogeology Journal7: 468–476.
Helz GR, Tossell JA, Charnock JM, Pattrick RAD, Vaughan DJ, and Garner CD (1995)Oligomerization in As(III) sulfide solutions – Theoretical constraints andspectroscopic evidence. Geochimica et Cosmochimica Acta 59: 4591–4604.
Hem J (1992) Study and Interpretation of Chemical Characteristics of Natural Water,3rd edn. Menlo Park, CA: US Geological Survey.
Herbel MJ, Blum JS, Hoeft SE, et al. (2002a) Dissimilatory arsenate reductase activityand arsenate-respiring bacteria in bovine rumen fluid, hamster feces, and the termitehindgut. FEMS Microbiology Ecology 41: 59–67.
Herbel MJ, Johnson TM, Tanji KK, Gao SD, and Bullen TD (2002b) Selenium stableisotope ratios in California agricultural drainage water management systems.Journal of Environmental Quality 31: 1146–1156.
Hering J and Kneebone PE (2002) Biogeochemical controls on arsenic occurrence andmobility in water supplies. In: Frankenberger W (ed.) Environmental Chemistry ofArsenic, ch. 7, pp. 155–181. New York: Marcel Dekker.
Hiemstra T and van Riemsdijk WH (1999) Surface structural ion adsorption modeling ofcompetitive binding of oxyanions by metal (hydr)oxides. Journal of Colloid andInterface Science 210: 182–193.
Hinkle S and Polette D (1999) Arsenic in groundwater of the Willamette Basin, Oregon.US Geological Survey Water Resources Investigations Report 98-4205. Menlo Park,CA: US Geological Survey.
Hoang TH, Bang S, Kim K, Nguyen MH, and Dang DM (2010) Arsenic in groundwaterand sediment in the Mekong River delta, Vietnam. Environmental Pollution158(8): 2648–2658.
Hoeft SE, Lucas F, Hollibaugh JT, and Oremland RS (2002) Characterization ofmicrobial arsenate reduction in the anoxic bottom waters of Mono Lake, California.Geomicrobiology Journal 19: 23–40.
Hopenhayn-Rich C, Biggs ML, Fuchs A, et al. (1996) Bladder-cancer mortalityassociated with arsenic in drinking water in Argentina. Epidemiology 7: 117–124.
Horowitz A, Lum K, Garbarino J, Hall G, Lemieux C, and Demas C (1996) Problemsassociated with using filtration to define dissolved trace element concentrations innatural water samples. Environmental Science & Technology 30: 954–963.
Howard AG, Apte SC, Comber SDW, and Morris RJ (1988) Biogeochemical control ofthe summer distribution and speciation of arsenic in the Tamar estuary. Estuarine,Coastal and Shelf Science 27: 427–443.
Howard G, Bartram J, Pedley S, Schmoll O, Chorus I, and Berger P (2006) Groundwaterand public health. In: Schmoll O, Howard G, Chilton J, and Chorus I (eds.)Protecting Groundwater for Health: Managing the Quality of Drinking-WaterSources, pp. 3–19. London: IWA Publishing.
Howard AG, Hunt LE, and Salou C (1999) Evidence supporting the presence ofdissolved dimethylarsinate in the marine environment. Applied OrganometallicChemistry 13: 39–46.
ICRCL (Interdepartmental Committee on the Redevelopment of Contaminated Land)(1987) Guidance on the assessment and redevelopment of contaminated land.ICRCL Guidance Note 59/83. London: Department of the Environment.
Inskeep WP, McDermott T, and Fendorf S (2002) Arsenic(V)/(III) cycling in soils andnatural waters: Chemical and microbiological processes. In: Frankenberger W (ed.)Environmental Chemistry of Arsenic, ch. 8, pp. 183–215. New York: Marcel Dekker.
IOM (Institute of Medicine) (2001) Dietary Reference Intakes for Vitamin A, Vitamin K,Arsenic, Boron, Chromium, Copper, Iodine, Iron, Manganese, Molybdenum, Nickel,Silicon, Vanadium, and Zinc. Washington, DC: National Academy of Sciences.
Ipolyi I and Fodor P (2000) Development of analytical systems for the simultaneousdetermination of the speciation of arsenic As(III), methylarsonic acid,dimethylarsinic acid, As(V) and selenium Se(IV), Se(VI). Analytica Chimica Acta413: 13–23.
Irgolic K (1994) Determination of total arsenic and arsenic compounds in drinkingwater. In: Chappell WR, Abernathy CO, and Cothern CR (eds.) Arsenic: Exposureand Health, pp. 51–60. Northwood: Science and Technology Letters.
Islam FS, Gault AG, Boothman C, et al. (2004) Role of metal-reducing bacteria inarsenic release from Bengal delta sediments. Nature 430: 68–71.
Jacobs LW (1989) Selenium in Agriculture and the Environment. Madison, WI:Soil Science Society of America. SSSA Special Publication 23.
Jain A and Loeppert RH (2000) Effect of competing anions on the adsorption of arsenateand arsenite by ferrihydrite. Journal of Environmental Quality 29: 1422–1430.
Jayasekher T (2009) Aerosols near by a coal fired thermal power plant: Chemicalcomposition and toxic evaluation. Chemosphere 75: 1525–1530.
Johnson MS (1995) Environmental management in metalliferous mining: The past,present and future. In: Zak K (ed.) Mineral Deposits: From Their Origin to TheirEnvironmental Impact, pp. 655–658. Rotterdam: Balkema.
Johnson CC, Fordyce FM, and Rayman MP (2010) Factors controlling the distributionof selenium in the environment and their impact on health and nutrition.Proceedings of the Nutrition Society 69: 119–132.
Johnson CC, Ge X, Green KA, and Liu X (2000) Selenium distribution in the localenvironment of selected villages of the Keshan Disease belt, ZhangjiakouDistrict, Hebei Province, People’s Republic of China. Applied Geochemistry15: 385–401.
Johnson TM, Herbel MJ, Bullen TD, and Zawislanski PT (1999) Selenium isotope ratiosas indicators of selenium sources and oxyanion reduction. Geochimica etCosmochimica Acta 63: 2775–2783.
Jones CA, Anderson HW, McDermott K, and Inskeep TR (2000) Rates of microbiallymediated arsenate reduction and solubilization. Soil Science Society of AmericaJournal 64: 600–608.
Jung MC, Thornton I, and Chon HT (2002) Arsenic, Sb and Bi contamination of soils,plants, waters and sediments in the vicinity of the Dalsung Cu–W mine in Korea.The Science of the Total Environment 295: 81–89.
Kabata-Pendias A and Mukherjee AB (2007) Trace Elements from Soil to Human. Berlin:Springer.
Kapaj S, Peterson H, Liber K, and Bhattacharya P (2006) Human health effects fromchronic arsenic poisoning – A review. Journal of Environmental Science and Health,Part A 41: 2399–2428.
Kent DB, Davies JA, Anderson LCD, and Rea BA (1995) Transport of chromium andselenium in a pristine sand and gravel aquifer: Role of adsorption processes.Water Resources Research 31: 1041–1050.
Kile ML, Houseman EA, Breton CV, et al. (2007) Dietary arsenic exposure inBangladesh. Environmental Health Perspectives 115: 889–893.
Kim MJ, Nriagu J, and Haack S (2000) Carbonate ions and arsenic dissolution bygroundwater. Environmental Science & Technology 34: 3094–3100.
Kinniburgh DG and Kosmus W (2002) Arsenic contamination in groundwater: Someanalytical considerations. Talanta 58: 165–180.
Kinniburgh DG and Miles DL (1983) Extraction and chemical analysis ofinterstitial water from soils and rocks. Environmental Science & Technology17: 362–368.
Kinniburgh DG, Smedley PL, Davies J, et al. (2003) The scale and causes of the groundwater arsenic problem in Bangladesh. In: Welch AH and Stollenwerk KG (eds.)Arsenic in Groundwater: Occurrence and Geochemistry, pp. 211–257. Boston, MA:Kluwer Academic.
Knight AP and Walter RG (2001) A Guide to Plant Poisoning of Animals in NorthAmerica. Jackson, WY: Teton New Media.
Arsenic and Selenium 53
Korte N (1991) Naturally occurring arsenic in groundwaters of the midwestern UnitedStates. Environmental Geology and Water Sciences 18: 137–141.
Korte NE and Fernando Q (1991) A review of arsenic(III) in groundwater.Critical Reviews in Environmental Control 21: 1–39.
Kreidie N, Armiento G, Cibin G, et al. (2011) An integrated geochemical andmineralogical approach for the evaluation of arsenic mobility in mining soils.Journal of Soils and Sediments 11: 1–16.
Kuhlmeier PD (1997) Partitioning of arsenic species in fine-grained soils. Journal of theAir & Waste Management Association 47: 481–490.
Kuhn A and Sigg L (1993) Arsenic cycling in eutrophic Lake Greifen, Switzerland –Influence of seasonal redox processes. Limnology and Oceanography 38: 1052–1059.
Kumar AR and Riyazuddin P (2010) Preservation of inorganic arsenic species inenvironmental water samples for reliable speciation analysis. Trends in AnalyticalChemistry 29(10): 1212–1223.
Kuyucak N (1998) Mining, the environment and the treatment of mine effluents.International Journal of Environment and Pollution 10: 315–325.
La Force MJ, Hansel CM, and Fendorf S (2000) Arsenic speciation, seasonaltransformations, and co-distribution with iron in a mine waste-influence palustrineemergent wetland. Environmental Science & Technology 34: 3937–3943.
Lange B and van den Berg CMG (2000) Determination of selenium by catalytic cathodicstripping voltammetry. Analytica Chimica Acta 418: 33–42.
Langner HW and Inskeep WP (2000) Microbial reduction of arsenate in the presence offerrihydrite. Environmental Science & Technology 34: 3131–3136.
Leblanc M, Achard B, Othman DB, Luck JM, Bertrand-Sarfati J, and Personne JC (1996)Accumulation of arsenic from acidic mine waters by ferruginous bacterial accretions(stromatolites). Applied Geochemistry 11: 541–554.
Lemly AD (2002) Selenium Assessment in Aquatic Ecosystems: A Guide for HazardEvaluation and Water Quality Criteria. New York: Springer.
Lenvik K, Steinnes E, and Pappas AC (1978) Contents of some heavy metals inNorwegian rivers. Nordic Hydrology 9: 197–206.
Lerda DE and Prosperi CH (1996) Water mutagenicity and toxicology in Rio Tercero(Cordoba, Argentina). Water Research 30: 819–824.
Levander OA (1986) Selenium. In: Mertz W (ed.) Trace Elements in Human and AnimalNutrition, pp. 209–266. New York: Academic Press.
Li L, Huang Y, Wang Y, and Wang W (2009a) Hemimicelle capped functionalizedcarbon nanotubes-based nanosized solid-phase extraction of arsenic fromenvironmental water samples. Analytica Chimica Acta 631: 182–188. http://dx.doi.org/10.1016/j.aca.2008.10.043.
Li S, Li W, Hu X, Yang L, and Xirao R (2009b) Soil selenium concentration andKashin–Beck disease prevalence in Tibet, China. Frontiers of Environmental Science& Engineering in China 3(1): 62–68.
Li Y, Peng T, Yang Y, Niu C, Archard LC, and Zhang H (2000) High prevalence ofenteroviral genomic sequences in myocardium from cases of endemiccardiomyopathy (Keshan disease) in China. Heart 83: 696–701.
Lima HM and Wathern P (1999) Mine closure: A conceptual review.Mining Engineering51: 41–45.
Lindemann T, Prange A, Dannecker W, and Neidhart B (2000) Stability studies ofarsenic, selenium, antimony and tellurium species in water, urine, fish and soilextracts using HPLC/ICP- MS. Fresenius’ Journal of Analytical Chemistry368: 214–220.
Litaor MI and Keigley RB (1991) Geochemical equilibria of iron in sediments of theRoaring river alluvial fan, Rocky Mountain National Park, Colorado. Earth SurfaceProcesses and Landforms 16: 533–546.
Liu Y, Chiba M, Inaba Y, and Kondo M (2002) Keshan disease – A review from theaspect of history and etiology. Nippon Eiseigaku Zasshi 56(4): 641–648.
Liu G, Zhang Y, Qi C, Zheng L, Chen Y, and Peng Z (2007) Comparative on causes andaccumulation of selenium in the tree-rings ambient high-selenium coal combustionarea from Yutangba, Hubei, China. Environmental Monitoring and Assessment133(1): 99–103.
Lumsdon DG, Meeussen JCL, Paterson E, Garden LM, and Anderson P (2001)Use of solid phase characterisation and chemical modelling for assessingthe behaviour of arsenic in contaminated soils. Applied Geochemistry16: 571–581.
Luo ZD, Zhang YM, Ma L, et al. (1997) Chronic arsenicism and cancer in InnerMongolia – Consequences of well-water arsenic levels greater than 50 mg l�1.In: Abernathy CO, Calderon RL, and Chappell WR (eds.) Arsenic Exposure andHealth Effects, pp. 55–68. London: Chapman and Hall.
Macur RE, Wheeler JT, McDermott TR, and Inskeep WP (2001) Microbial populationsassociated with the reduction and enhanced mobilization of arsenic in mine tailings.Environmental Science & Technology 35: 3676–3682.
Maest AS, Pasilis SP, Miller LG, and Nordstrom DK (1992) Redox geochemistry ofarsenic and iron in Mono Lake, California, USA. In: Proceedings of the SeventhInternational Symposium on Water–Rock Interaction, pp. 507–511.
Manning BA, Fendorf SE, Bostick B, and Suarez DL (2002) Arsenic(III) oxidation andarsenic(V) adsorption reactions on synthetic birnessite. Environmental Science &Technology 36: 976–981.
Manning BA and Goldberg S (1997) Adsorption and stability of arsenic(III) at the claymineral–water interface. Environmental Science & Technology 31: 2005–2011.
Martinez-Bravo Y, Roig-Navarro AF, Lopez FJ, and Hernandez F (2001) Multielementaldetermination of arsenic, selenium and chromium(VI) species in water byhigh-performance liquid chromatography-inductively coupled plasma massspectrometry. Journal of Chromatography. A 926: 265–274.
Masscheleyn PH, DeLaune RD, and Patrick WH (1991) Effect of redox potential and pHon arsenic speciation and solubility in a contaminated soil. Environmental Science& Technology 25: 1414–1419.
May TW, Walther MJ, Petty JD, et al. (2001) An evaluation of selenium concentrationsin water, sediment, invertebrates, and fish from the Republican River Basin:1997–1999. Environmental Monitoring and Assessment 72: 179–206.
Mayland H (1994) Selenium in plant and animal nutrition. In: Frankenberger WT andBenson S (eds.) Selenium in the Environment, ch. 2, pp. 29–45. New York:Marcel Dekker.
McArthur JM, Ravenscroft P, Safiulla S, and Thirwall MF (2001) Arsenic ingroundwater: Testing pollution mechanisms for sedimentary aquifers inBangladesh. Water Resources Research 37: 109–117.
McCleskey RB, Nordstrom DK, and Maest AS (2004) Preservation of water samples forarsenic(III/V) determinations: An evaluation of the literature and new analyticalresults. Applied Geochemistry 19: 995–1009.
McCreadie H, Blowes DW, Ptacek CJ, and Jambor JL (2000) Influence of reductionreactions and solid phase composition on porewater concentrations of arsenic.Environmental Science & Technology 34: 3159–3166.
McGeehan SL, Fendorf SE, and Naylor DV (1998) Alteration of arsenic sorption inflooded-dried soils. Soil Science Society of America Journal 62: 828–833.
McLaren SJ and Kim ND (1995) Evidence for a seasonal fluctuation of arsenic inNew Zealand’s longest river and the effect of treatment on concentrations in drinkingwater. Environmental Pollution 90: 67–73.
Meharg AA, Williams PN, Adomako E, et al. (2009) Geographical variation in total andinorganic arsenic content of polished (white) rice. Environmental Science &Technology 43: 1612–1617.
Melamed D (2004) Monitoring Arsenic in the Environment: A Review of Science andTechnologies for Field Measurements and Sensors. US EPA Report 542-R-04-002.Washington, DC: US Environmental Protection Agency.
Melgar MJ, Alonso J, and Garcıa MA (2009) Selenium accumulation in wild ediblemushrooms: Uptake and toxicity. CyTA – Journal of Food 7(3): 217–223.
Meng XG, Korfiatis GP, Bang SB, and Bang KW (2002) Combined effects of anions onarsenic removal by iron hydroxides. Toxicology Letters 133: 103–111.
Meng XG, Korfiatis GP, Jing CY, and Christodoulatos C (2001) Redox transformationsof arsenic and iron in water treatment sludge during aging and TCLP extraction.Environmental Science & Technology 35: 3476–3481.
Mikkelsen RL, Page AL, and Bingham FT (1989) Factors affecting seleniumaccumulation by agricultural crops. In: Jacobs LW (ed.) Selenium in Agriculture andthe Environment, pp. 65–94. Madison, WI: Soil Science Society of America. SSSASpecial Publication 23.
Mok W and Wai CM (1990) Distribution and mobilization of arsenic and antimonyspecies in the Coeur D’Alene River, Idaho. Environmental Science & Technology24: 102–108.
Mondal D, Banerjee M, Kundu M, et al. (2010) Comparison of drinking water, raw riceand cooking of rice as arsenic exposure routes in three contrasting areas ofWest Bengal, India. Environmental Geochemistry and Health 32: 463–477.
Mondal D and Polya DA (2008) Rice is a major exposure route for arsenic in Chakdahablock, Nadia district, West Bengal, India: A probabilistic risk assessment. AppliedGeochemistry 23: 2987–2998.
Monhemius AJ and Swash PM (1999) Removing and stabilising arsenic from copperrefining circuits by hydrothermal processing. Journal of the Minerals, Metals &Materials Society 51(9): 30–33.
Moore JN, Ficklin WH, and Johns C (1988) Partitioning of arsenic and metals inreducing sulfidic sediments. Environmental Science & Technology 22: 432–437.
Moreno Rodriguez MJ, Cala Rivero V, and Jimenez Ballesta R (2005) Seleniumdistribution in topsoils and plants of a semi-arid Mediterranean environment.Environmental Geochemistry and Health 27: 513–519.
Moxon AL (1937) Alkali disease or selenium poisoning. South Dakota State CollegeBulletin 311: 99.
Moxon AL (1938) The effect of arsenic on the toxicity of seleniferous grains. Science88: 81.
Mukhopadhyay R, Rosen BP, Pung LT, and Silver S (2002) Microbial arsenic:From geocycles to genes and enzymes. FEMS Microbiology Reviews26: 311–325.
54 Arsenic and Selenium
Muth OH and Allaway WH (1963) The relationship of white muscle disease to thedistribution of naturally occurring selenium. Journal of the American VeterinaryMedical Association 142: 1379–1384.
Nag JK, Balaram V, Rubio R, Alberti J, and Das AK (1996) Inorganic arsenic species ingroundwater: A case study from Purbasthali (Burdwan), India. Journal of TraceElements in Medicine and Biology 10: 20–24.
NAS (1976) Selenium. USA: National Academy of Sciences.Nathanail CP and Bardos P (2004) Reclamation of Contaminated Land. Chichester: Wiley.National Research Council (1999) Arsenic in Drinking Water. Washington, DC: National
Academy Press.National Research Council (2001) Arsenic in Drinking Water: 2001 Update.
Washington, DC: National Academy Press.Neal RH (1995) Selenium. In: Alloway BJ (ed.) Heavy Metals in Soils, pp. 260–283.
London: Blackie Academic.Nelms S (2005) Inductively Coupled Plasma Mass Spectrometry Handbook. Oxford:
Blackwell.Newman DK, Ahmann D, and Morel FMM (1998) A brief review of microbial arsenate
respiration. Geomicrobiology Journal 15: 255–268.Newman DK, Beveridge TJ, and Morel FMM (1997a) Precipitation of arsenic trisulfide
by Desulfotomaculum auripigmentum. Applied and Environmental Microbiology63: 2022–2028.
Newman DK, Kennedy EK, Coates JD, et al. (1997b) Dissimilatory arsenate and sulfatereduction in Desulfotomaculum auripigmentum sp. nov. Archives of Microbiology168: 380–388.
Ng JC, Wang J, and Shraim A (2003) A global health problem caused by arsenic fromnatural sources. Chemosphere 52: 1353–1359.
Nickson R, McArthur J, Burgess W, Ahmed KM, Ravenscroft P, and Rahman M (1998)Arsenic poisoning of Bangladesh groundwater. Nature 395: 338.
Nickson RT, McArthur JM, Ravenscroft P, Burgess WG, and Ahmed KM (2000)Mechanism of arsenic release to groundwater, Bangladesh and West Bengal.Applied Geochemistry 15: 403–413.
Nicolli HB, Suriano JM, Peral MAG, Ferpozzi LH, and Baleani OA (1989) Groundwatercontamination with arsenic and other trace-elements in an area of the Pampa, provinceof Cordoba, Argentina. Environmental Geology and Water Sciences 14: 3–16.
Nicolli HB, Tineo A, Garcıa J, Falcon C, and Merino M (2001) Trace-element qualityproblems in groundwater from Tucuman, Argentina. In: Cidu R (ed.) Water-RockInteraction, pp. 993–996. Lisse: Balkema.
Nimick DA, Moore JN, Dalby CE, and Savka MW (1998) The fate of geothermal arsenicin the Madison and Missouri Rivers, Montana and Wyoming. Water ResourcesResearch 34: 3051–3067.
Nishri A, Brenner IB, Hall GEM, and Taylor HE (1999) Temporal variations in dissolvedselenium in Lake Kinneret (Israel). Aquatic Sciences 61: 215–233.
Noda K, Taniguchi H, Suzuki S, and Hirai S (1983) Comparison of the seleniumcontents of vegetables of the Genus Allium measured by fluorometry andneutron activation analysis. Agricultural and Biological Chemistry47: 613–615.
Nordstrom DK and Alpers CN (1999) Negative pH, efflorescent mineralogy, andconsequences for environmental restoration at the Iron Mountain superfund site,California. Proceedings of the National Academy of Sciences of the United States ofAmerica 96: 3455–3462.
Nordstrom DK, Alpers CN, Ptacek CJ, and Blowes DW (2000) Negative pH andextremely acidic mine waters from Iron Mountain, California. Environmental Science& Technology 34: 254–258.
Nordstrom DK and Archer DG (2003) Arsenic thermodynamic data and environmentalgeochemistry. In: Stollenwerk KG (ed.) Arsenic in Ground Water: Geochemistry andOccurrence, pp. 1–25. Boston, MA: Kluwer Academic.
Novoselov SV, Rao M, Onoshko NV, et al. (2002) Selenoproteins and selenocysteineinsertion system in the model plant cell system, Chlamydomonas reinhardtii.The EMBO Journal 21(14): 3681–3693.
Nyashanu R, Monhemius A, and Buchanan D (1999) The effect of ore mineralogy on thespeciation of arsenic in bacterial oxidation of refractory arsenical gold ores.Biohydrometallurgy and the Environment 431–441.
Oldfield JE (1999) Selenium World Atlas. Cavite, Philippines: Selenium-TelluriumDevelopment Association.
O’Reilly SE, Strawn DG, and Sparks DL (2001) Residence time effects on arsenateadsorption/desorption mechanisms on goethite. Soil Science Society of AmericaJournal 65(1): 67–77.
Oremland RS (1994) Biogeochemical transformations of selenium in anoxicenvironments. In: Frankenberger WT and Benson S (eds.) Selenium in theEnvironment, ch. 16, pp. 389–419. New York: Marcel Dekker.
Oremland RS, Dowdle PR, Hoeft S, et al. (2000) Bacterial dissimilatory reduction ofarsenate and sulphate in meromictic Mono Lake, California. Geochimica etCosmochimica Acta 64: 3073–3084.
Oremland R, Newman D, Kail B, and Stolz J (2002) Bacterial respiration of arsenateand its significance in the environment. In: Frankenberger W (ed.)Environmental Chemistry of Arsenic, ch. 11, pp. 273–295. New York:Marcel Dekker.
Oremland RS, Steinberg NA, Maest AS, Miller LG, and Hollibaugh JT (1990)Measurement of in situ rates of selenate removal by dissimilatory bacterial reductionin sediments. Environmental Science & Technology 24: 1157–1164.
Oremland RS and Stolz JF (2003) The ecology of arsenic. Science 300 (5621):939–944.
Oscarson DW, Huang PM, Liaw WK, and Hammer UT (1983) Kinetics of oxidation ofarsenite by various manganese dioxides. Soil Science Society of America Journal47: 644–648.
Palmer CA and Klizas SA (1997) The Chemical Analysis of Argonne Premium CoalSamples. US Geological Survey Bulletin 2144. Menlo Park, CA: US GeologicalSurvey.
Papp LV, Lu J, Holmgren A, and Khanna KK (2007) From selenium to selenoproteins:Synthesis, identity, and their role in human health. Antioxidants & Redox Signaling7: 775–806.
Parkhurst D and Appelo C (1999) User’s guide to PHREEQC (Version 2) – A computerprogram for speciation, batch-reaction, one-dimensional transport, and inversegeochemical calculations. US Geological Survey Water-Resources InvestigationsReport 99-4259. Menlo Park, CA: US Geological Survey.
Parsons MB, Hall GEM, Daniels C, et al. (2006) Speciation, transport, and fate ofarsenic in the Seal Harbour gold districts, Nova Scotia, Canada. Geological Societyof America Annual Meeting, Philadelphia, 22-25 October 2006.
Pendleton JA, Posey HH, and Long MB (1995) Characterizing Summitville and itsimpacts: Setting and scene. In: Posey HH, Pendleton JA, and Van Zyl D (eds.)Proceedings: Summitville Forum ’95. Colorado Geological Survey SpecialPublication 38, pp. 1–12. Denver, CO: US Geological Survey.
Peng A, Wang WH, Wang CX, et al. (1999) The role of humic substances in drinking waterin Kashin–Beck disease in China. Environmental Health Perspectives 107: 293–296.
Peters GM, Maher WA, Krikowa F, et al. (1999) Selenium in sediments, pore waters andbenthic infauna of Lake Macquarie, New South Wales, Australia. MarineEnvironmental Research 47: 491–508.
Petersen W, Wallmann K, Li PL, Schroeder F, and Knauth HD (1995) Exchange oftrace-elements at the sediment–water interface during early diagenesis processes.Marine and Freshwater Research 46: 19–26.
Peterson ML and Carpenter R (1983) Biogeochemical processes affecting total arsenicand arsenic species distributions in an intermittently anoxic fjord. Marine Chemistry12: 295–321.
Petrusevski B, Sharma S, Schippers JC, and Shordt K (2007) Arsenic in Drinking Water.Netherlands: IRC International Water and Sanitation Centre.
Pettine M, Camusso M, and Martinotti W (1992) Dissolved and particulate transport ofarsenic and chromium in the Po River (Italy). The Science of the TotalEnvironment 119: 253–280.
Pilon-Smits EAH and LeDuc DL (2009) Phytoremediation of selenium using transgenicplants. Current Opinion in Biotechnology 20(2): 207–212.
Plant JA, Jeffery K, Gill E, and Fage C (1975) The systematic determination of accuracyand precision in geochemical exploration data. Journal of GeochemicalExploration 4: 467–486.
Plant J, Smith DB, Smith B, and Reeder S (2003) Environmental geochemistry on aglobal scale. In: Skinner HCW and Berger AR (eds.) Geology and Health: Closingthe Gap, ch. 20. Oxford and New York: Oxford University Press.
Plumlee GS, Smith KS, Montour MR, Ficklin WH, and Mosier EL (1999) Geologiccontrols on the composition of natural waters and mine waters drainingdiverse mineral-deposit types. Environmental Geochemistry of Mineral Deposits.Part B: Case Studies. Reviews in Economic Geology, vol. 6B, ch. 19, pp. 373–432.Denver, CO: Society of Economic Geologists.
Pracheil BM, Snow DD, and Pegg MA (2010) Distribution of selenium, mercury, andmethylmercury in surficial Missouri River sediments. Bulletin of EnvironmentalContamination and Toxicology 84: 331–335.
Presser T (1994) Geologic origin and pathways of selenium from the California coast rangesto the West-Central San Joaquin Valley. In: Frankenberger WT and Benson S (eds.)Selenium in the Environment, ch. 6, pp. 139–155. New York: Marcel Dekker.
Randall SR, Sherman DM, and Ragnarsdottir KV (2001) Sorption of As(V) on green rust(Fe4(II)Fe2(III)(OH)12SO4�3H2O) and lepidocrocite (gamma-FeOOH): Surfacecomplexes from EXAFS spectroscopy. Geochimica et Cosmochimica Acta65: 1015–1023.
Rapant S, Vrana K, and Bodis D (1996) Geochemical Atlas of Slovakia. Part 1.Groundwater. Bratislava: Geological Survey of Slovak Republic.
Rasmussen L and Andersen K (2002) Environmental health and human exposureassessment (draft). United Nations Synthesis Report on Arsenic in Drinking Water,ch. 2. Geneva: World Health Organization.
Arsenic and Selenium 55
Rayman MP (2002) The argument for increasing selenium intake. Proceedings of theNutrition Society 61: 203–215.
Rayman MP (2008) Food-chain selenium and human health: Emphasis on intake.British Journal of Nutrition 100(2): 254–268.
Reimann C and Caritat P (1998) Chemical Elements in the Environment. Berlin:Springer.
Reimann C, Ayras M, and Chekushin V (1998) Environmental Geochemical Atlas of theCentral Barents Region. Trondheim: Geological Survey of Norway.
Reynolds JG, Naylor DV, and Fendorf SE (1999) Arsenic sorption inphosphate-amended soils during flooding and subsequent aeration. Soil ScienceSociety of America Journal 63: 1149–1156.
Rice KC (1999) Trace-element concentrations in streambed sediment acrossthe conterminous United States. Environmental Science & Technology33: 2499–2504.
Riedel GF (1993) The annual cycle of arsenic in a temperate estuary. Estuaries16: 533–540.
Robinson B, Outred H, Brooks R, and Kirkman J (1995) The distribution and fate ofarsenic in the Waikato River System, North Island, New Zealand. ChemicalSpeciation and Bioavailability 7: 89–96.
Rochette EA, Bostick BC, Li GC, and Fendorf S (2000) Kinetics of arsenate reduction bydissolved sulfide. Environmental Science & Technology 34: 4714–4720.
Rojas JC and Vandecasteele C (2007) Influence of mining activities in the north ofPotosi, Bolivia on the water quality of Chayanta River, and its consequences.Environmental Monitoring and Assessment 132: 321–330.
Rosen BP (2002) Biochemistry of arsenic detoxification. FEBS Letters 529: 86–92.Rosenboom JW, Ahmed KM, Pfaff A, and Madajewicz M (2004) Arsenic in 15 upazilas
of Bangladesh: Water supplies, health and behaviour. Report prepared for APSU.Rosenfield I and Beath OA (1964) Selenium; Geobotany, Biochemistry, Toxicity and
Nutrition. New York: Academic Press.Ross SM, Wood MD, Copplestone D, Warriner M, and Crook P (2007) Environmental
concentrations of heavy metals in UK soil and herbage. UK Soil and HerbagePollutant Survey UKSHS Report No. 7. Rotherham: Environment Agency.
Rotkin-Ellman M, Solomon G, Gonzales CR, Agwaramgbo L, and Mielke HW (2010)Arsenic contamination in New Orleans soil: Temporal changes associated withflooding. Environmental Research 110(1): 19–25.
Rotruck JT, Pope AL, Ganther HE, and Hoekstra WG (1972) Prevention of oxidativedamage to rat erythrocytes by dietary selenium. Journal of the American ChemicalSociety 79: 3292–3293.
Roussel C, Bril H, and Fernandez A (2000) Arsenic speciation: Involvement inevaluation of environmental impact caused by mine wastes. Journal ofEnvironmental Quality 29: 182–188.
Rowell DL (1994) Soil Science Methods and Applications. Harlow: Longman Scientificand Technical.
Ryker SJ (2001) Mapping arsenic in groundwater: A real need, but a hard problem –Why was the map created? Geotimes 46: 34–36.
Salminen R and Gregorauskiene V (2000) Considerations regarding the definition of ageochemical baseline of elements in the surficial materials in areas differing inbasic geology. Applied Geochemistry 15: 647–653.
Sancha AM and Castro M (2001) Arsenic in Latin America: Occurrence, exposure,health effects and remediation. In: Chappell WR, Abernathy CO, and Calderon RL(eds.) Arsenic Exposure and Health Effects, vol. IV, pp. 87–96. Amsterdam: Elsevier.
Santini JM, Vanden Hoven RN, and Macy JM (2002) Characteristics of newlydiscovered arsenite-oxidizing bacteria. In: Frankenberger W (ed.) EnvironmentalChemistry of Arsenic, ch. 14, pp. 329–342. New York: Marcel Dekker.
Savage KS, Bird DK, and Ashley RP (2000) Legacy of the California Gold Rush:Environmental geochemistry of arsenic in the southern Mother Lode Gold District.International Geology Review 42: 385–415.
Schreiber ME, Simo JA, and Freiberg PG (2000) Stratigraphic and geochemicalcontrols on naturally occurring arsenic in groundwater, eastern Wisconsin, USA.Hydrogeology Journal 8: 161–176.
Schroeder RA, Orem WH, and Kharaka YK (2002) Chemical evolution of the Salton Sea,California: Nutrient and selenium dynamics. Hydrobiologia 473: 23–45.
Schwedt G and Rieckhoff M (1996) Analysis of oxothio arsenic species in soil andwater. Journal Fur Praktische Chemie-Chemiker-Zeitung 338: 55–59.
Scott MJ and Morgan JJ (1995) Reactions at oxide surfaces. 1. Oxidation ofAs(III) by synthetic birnessite. Environmental Science & Technology29: 1898–1905.
Seyler P and Martin J-M (1989) Biogeochemical processes affecting arsenic speciesdistribution in a permanently stratified lake. Environmental Science & Technology23: 1258–1263.
Seyler P and Martin JM (1990) Distribution of arsenite and total dissolved arsenic inmajor French estuaries: Dependence on biogeochemical processes andanthropogenic inputs. Marine Chemistry 29: 277–294.
Seyler P and Martin JM (1991) Arsenic and selenium in a pristine river-estuarinesystem: The Krka (Yugoslavia). Marine Chemistry 34: 137–151.
Shamberger R and Frost D (1969) Possible inhibitory effect of selenium on humancancer. Canadian Medical Association Journal 100: 682.
Shand CA, Balsam M, Hillier SJ, et al. (2010) Aqua regia extractable seleniumconcentrations of some Scottish topsoils measured by ICP-MS and the relationshipwith mineral and organic soil components. Journal of the Science of Food andAgriculture 90: 972–980.
Shiller A and Taylor H (1996) Comment on ‘Problems associated with using filtration todefine dissolved trace element concentrations in natural water samples’.Environmental Science & Technology 30: 3397–3398.
Shotyk W (1996) Natural and anthropogenic enrichments of As, Cu, Pb, Sb, and Znin ombrotrophic versus minerotrophic peat bog profiles, Jura Mountains,Switzerland. Water, Air, and Soil Pollution 90: 375–405.
Sides AD (1995) Can gold mining at Mokrsko (Czech Republic) be environmentallyacceptable? In: Pasava J, Kribek B, and Zak K (eds.) Mineral Deposits: From TheirOrigin to Their Environmental Impact, pp. 701–703. Rotterdam: Balkema.
Simon G, Kesler SE, and Chryssoulis S (1999) Geochemistry and textures ofgold-bearing arsenian pyrite, Twin Creeks, Nevada: Implications for deposition ofgold in Carlin-type deposits. Economic Geology and the Bulletin of the Society ofEconomic Geologists 94: 405–421.
Sloth JJ and Larsen EH (2000) The application of inductively coupled plasma dynamicreaction cell mass spectrometry for measurement of selenium isotopes, isotoperatios and chromatographic detection of selenoamino acids. Journal of AnalyticalAtomic Spectrometry 15: 669–672.
Smedley PL (1996) Arsenic in rural groundwater in Ghana. Journal of African EarthSciences 22: 459–470.
Smedley PL (2003) Arsenic in groundwater – South and east Asia. In: Welch AH andStollenwerk KG (eds.) Arsenic in Ground Water: Geochemistry and Occurrence,pp. 179–209. Boston, MA: Kluwer Academic.
Smedley PL and Edmunds WM (2002) Redox patterns and trace-element behaviorin the East Midlands Triassic sandstone aquifer, UK. Ground Water 40: 44–58.
Smedley PL and Kinniburgh DG (2002) A review of the source, behaviourand distribution of arsenic in natural waters. Applied Geochemistry 17: 517–568.
Smedley PL, Kinniburgh DG, Huq I, Luo ZD, and Nicolli HB (2001a) Internationalperspective on arsenic problems in groundwater. In: Chappell WR, Abernathy CO,and Calderon RL (eds.) Arsenic Exposure and Health Effects, vol. IV, pp. 9–26.Amsterdam: Elsevier.
Smedley PL, Kinniburgh DG, Milne C, Trafford JM, Huq SI, and Ahmed KM (2001b)Hydrogeochemistry of three special study areas. In: Kinniburgh DG and Smedley PL(eds.) Arsenic Contamination of Groundwater in Bangladesh, Final Report, BGSReport WC/00/19, vol. 2, ch. 7, pp. 105–149. Keyworth: British Geological Survey.
Smedley PL, Nicolli HB, Macdonald DMJ, Barros AJ, and Tullio JO (2002)Hydrogeochemistry of arsenic and other inorganic constituents in groundwatersfrom La Pampa, Argentina. Applied Geochemistry 17: 259–284.
Smedley PL, Zhang M-Y, Zhang G-Y, and Luo Z-D (2003) Mobilisation of arsenic andother trace elements in fluviolacustrine aquifers of the Huhhot Basin, InnerMongolia. Applied Geochemistry 18(9): 1453–1477.
Smith AH, Lingas EO, and Rahman M (2000) Contamination of drinking-water byarsenic in Bangladesh: A public health emergency. Bulletin of the World HealthOrganization 78: 1093–1103.
Smith A, Lopipero P, Bates M, and Steinmaus C (2002) Arsenic epidemiology anddrinking water standards. Science 296: 2145–2146.
Spear JM (2006) Evaluation of arsenic field test: Kits for drinking water analysis.Journal of American Water Works Association 98(12): 97–105.
Steinhoff PJ, Smith BW, Warner DW, and Moller G (1999) Analysis of interlaboratoryperformance in the determination of total selenium in water. Journal of AOACInternational 82: 1466–1473.
Stolz JF and Oremland RS (1999) Bacterial respiration of arsenic and selenium.FEMS Microbiology Reviews 23: 615–627.
Suetens C, Moreno-Reyes R, Chasseur C, et al. (2001) Epidemiological support for amultifactorial aetiology of Kashin–Beck disease in Tibet. International Orthopaedics25: 180–187.
Sullivan KA and Aller RC (1996) Diagenetic cycling of arsenic in Amazon shelfsediments. Geochimica et Cosmochimica Acta 60: 1465–1477.
Sun G (2004) Arsenic Contamination and Arsenicosis in China. Toxicology and AppliedPharmacology 198(3): 268–271.
Swanson VE, Medlin JH, Hatch JR, Coleman SL, Woodruff SD, and Hildebrand RT(1976) Collection, chemical analysis and evaluation of 799 coal samples in 1975.US Geological Survey Open-File Report 76–468, pp. 503. Menlo Park, CA:US Geological Survey.
Swash PM and Monhemius AJ (1996) Characeristics of calcium arsenate compoundsrelevant to disposal of arsenic from industrial processes. Minerals, Metals and the
56 Arsenic and Selenium
Environment II, Prague, Czech Republic, 3–6 September 1996, IMM, London.pp. 353–361.
Tan J (1989) The Atlas of Endemic Diseases and Their Environments in the People’sRepublic of China. Beijing: Science Press.
Taniguchi T, Tao H, Tominaga M, and Miyazaki A (1999) Sensitive determination ofthree arsenic species in water by ion exclusion chromatography-hydride generationinductively coupled plasma mass spectrometry. Journal of Analytical AtomicSpectrometry 14: 651–655.
Thomas DJ, Styblo M, and Lin S (2001) The cellular metabolism and systemic toxicityof arsenic. Toxicology and Applied Pharmacology 176: 127–144.
Thomson J, Nixon S, Croudace IW, et al. (2001) Redox-sensitive element uptake innorth-east Atlantic Ocean sediments (Benthic Boundary Layer Experiment sites).Earth and Planetary Science Letters 184: 535–547.
Thornton I, Kinniburgh DG, Pullen G, and Smith CA (1983) Geochemical aspects ofselenium in British soils and implications to animal health. In: Hemphill DD (ed.)Trace Substances in Environmental Health, vol. XVII, pp. 391–398. Columbia, MO:University of Missouri.
Tokunaga T, Pickering I, and Brown G (1996) Selenium transformations in pondedsediments. Soil Science Society of America Journal 60: 781–790.
Tokunaga T, Zawislanski P, Johannis P, Lipton D, and Benson S (1994) Fieldinvestigations of selenium speciation, transformation, and transport in soils fromKesterson Reservoir and Lahontan valley. In: Frankenberger T and Benson S (eds.)Selenium in the Environment, ch. 5, pp. 119–138. New York: Marcel Dekker.
Tournassat C, Charlet L, Bosbach D, and Manceau A (2002) Arsenic(III) oxidation bybirnessite and precipitation of manganese(II) arsenate. Environmental Science &Technology 36: 493–500.
Tseng WP, Chu HM, How SW, Fong JM, Lin CS, and Yeh S (1968) Prevalence of skincancer in an endemic area of chronic arsenicism in Taiwan. Journal of the NationalCancer Institute 40: 453–463.
Umitsu M (1993) Late quaternary sedimentary environments and landforms in theGanges Delta. Sedimentary Geology 83: 177–186.
US EPA (1999) Waste leachability: The need for review of current agency procedures.US EPA Report EPA-SAB-EEC-COM-99-002. Washington, DC: US EnvironmentalProtection Agency.
US EPA (2006) Revised Reregistration Eligibility Decision for MSMA, DSMA, CAMAand Cacodylic Acid. Washington, DC: US Environmental Protection Agency.
US EPA (2011) Air Toxics Web-site: Selenium and Compounds. Washington, DC: USEnvironmental Protection Agency. http://www.epa.gov/ttn/atw/hlthef/selenium.html.
USGS (2005) Mineral Commodity Summaries. Washington, DC: US Geological Survey.Vagliasindi FGA and Benjamin MM (2001) Redox reactions of arsenic in As-spiked lake
water and their effects on As adsorption. Journal of Water Supply Research andTechnology – AQUA 50: 173–186.
Van der Veer, G. (2006) Geochemical Soil Survey of the Netherlands. Atlas of Major andTrace Elements in Topsoil and Parent Material: Assessment of Natural andAnthropogenic Enrichment Factors. PhD Thesis, Utrecht University.
Varsanyi I, Fodr Z, and Bartha A (1991) Arsenic in drinking water and mortality in thesouthern Great Plain, Hungary. Environmental Geochemistry and Health 13: 14–22.
Ventura MG, do Carmo Freitas M, Pacheco A, and Wolterbeek HT (2007) Seleniumcontent in selected Portuguese foodstuffs. European Food Research and Technology224: 395–401.
Vinceti M, Nacci G, Rocchi E, et al. (2000) Mortality in a population with long-termexposure to inorganic selenium via drinking water. Journal of Clinical Epidemiology53: 1062–1068.
Vinceti M, Rothman KJ, Bergomi M, Borciani N, Serra L, and Vivoli G (1998) Excessmelanoma incidence in a cohort exposed to high levels of environmentalselenium. Cancer Epidemiology, Biomarkers & Prevention 7: 853–856.
Voegelin A and Hug S (2003) Catalyzed oxidation of arsenic(III) by hydrogen peroxideon the surface of ferrihydrite: An in situ ATR-FTIR study. Environmental Science &Technology 37(5): 972–978.
Wainipee W, Weiss DJ, Sephton MA, Coles BJ, Unsworth C, and Court R (2010)The effect of crude oil on arsenate adsorption on goethite. Water Research 44(19):5673–5683. http://dx.doi.org/10.1016/j.watres.2010.05.056.
Waalkes MP, Liu J, and Diwan BA (2007) Transplacental arsenic carcinogenesis inmice. Toxicology and Applied Pharmacology 222: 271–280.
Wang ZJ and Gao YX (2001) Biogeochemical cycling of selenium in Chineseenvironments. Applied Geochemistry 16: 1345–1351.
Wang R, Hsu Y, Chang L, and Jiang S (2007) Speciation analysis of arsenic andselenium compounds in environmental and biological samples by ionchromatography–inductively coupled plasma dynamic reaction cell mass spectrometer.Analytica Chimica Acta 590: 239–244. http://dx.doi.org/10.1016/j.aca.2007.03.045.
Wang L and Huang J (1994) Chronic arsenism from drinking water in some areas ofXinjiang, China. In: Nriagu JO (ed.) Arsenic in the Environment, Part II: HumanHealth and Ecosystem Effects, pp. 159–172. New York: Wiley.
Wang HC, Wang PH, Peng CY, Liu SH, and Wang YW (2001) Speciation of As in theblackfoot disease endemic area. Journal of Synchrotron Radiation 8: 961–962.
Wang X, Yang H, Gong P, et al. (2010) One century sedimentary records of polycyclicaromatic hydrocarbons, mercury and trace elements in the Qinghai Lake, TibetanPlateau. Environmental Pollution 158: 3065–3070. http://dx.doi.org/10.1016/j.envpol.2010.06.034.
Watts MJ, O’Reilly J, Marcilla AL, Shaw RA, and Ward NI (2010) Field based speciationof arsenic in UK and Argentinean water samples. Environmental Geochemistry andHealth 32(6): 479–490.
Webb J (1978) The Wolfson Geochemical Atlas of England and Wales. Oxford:Clarendon Press.
Webster JG, Nordstrom DK, and Smith KS (1994) Transport and natural attenuation ofCu, Zn, As, and Fe in the acid mine drainage of Leviathan and Bryant creeks.ACS Symposium Series 550: 244–260.
Welch AH, Helsel DR, Focazio MJ, and Watkins SA (1999) Arsenic in groundwater supplies of the United States. In: Chappell WR, Abernathy CO, andCalderon RL (eds.) Arsenic Exposure and Health Effects, pp. 9–17. Amsterdam:Elsevier.
Welch AH and Lico MS (1998) Factors controlling As and U in shallow ground water,southern Carson Desert, Nevada. Applied Geochemistry 13: 521–539.
Welch AH, Lico MS, and Hughes JL (1988) Arsenic in ground-water of the WesternUnited States. Ground Water 26: 333–347.
Welch AH, Westjohn DB, Helsel DR, and Wanty RB (2000) Arsenic in groundwater of the United States: Occurrence and geochemistry. Ground Water38: 589–604.
White A and Dubrovsky N (1994) Chemical oxidation–reduction controls on seleniummobility in groundwater systems. In: Frankenberger WT and Benson S (eds.)Selenium in the Environment, ch. 8, pp. 185–221. New York: Marcel Dekker.
WHO (1986) Selenium – Environmental Aspects. Geneva: World Health Organization.vol. 58.
WHO (1987) Environmental Health Criterion – Selenium. Geneva: World HealthOrganization. vol. 58.
WHO (1993) Guidelines for Drinking-Water Quality. Geneva: World Health Organisation.WHO (1996) Trace Elements in Human Nutrition and Health. Geneva: World Health
Organization.WHO (2011) Guidelines for Drinking-Water Quality, 4th Edition. Geneva: World Health
Organization.Widerlund A and Ingri J (1995) Early diagenesis of arsenic in sediments of the Kalix
River estuary, Northern Sweden. Chemical Geology 125: 185–196.Wijnja H and Schulthess CP (2000) Interaction of carbonate and organic anions with
sulfate and selenate adsorption on an aluminum oxide. Soil Science Society ofAmerica Journal 64: 898–908.
Wilde F and Radtke D (2008) Field measurements. In: Handbooks for Water-ResourcesInvestigations. National Field Manual for the Collection of Water-Quality Data,ch. A6, Book 9. Menlo Park, CA: US Geological Survey.
Wilkie JA and Hering JG (1998) Rapid oxidation of geothermal arsenic(III) instreamwaters of the eastern Sierra Nevada. Environmental Science & Technology32: 657–662.
Williams M (2001) Arsenic in mine waters: An international study. EnvironmentalGeology 40: 267–279.
Williams M, Fordyce F, Paijitprapapon A, and Charoenchaisri P (1996) Arseniccontamination in surface drainage and groundwater in part of the southeast Asian tinbelt, Nakhon Si Thammarat Province, southern Thailand. Environmental Geology27: 16–33.
Wilson FH and Hawkins DB (1978) Arsenic in streams, stream sediments and groundwater, Fairbanks area, Alaska. Environmental Geology 2: 195–202.
Winkel LHE, Trang PKT, Lan VM, et al. (2011) Arsenic pollution of groundwater inVietnam exacerbated by deep aquifer exploitation for more than a century.Proceedings of the National Academy of Sciences of the United States of America108(4): 1246–1251.
Wolfe-Simon F, Blum JS, Kulp TR, et al. (2011) A bacterium that can grow by usingarsenic instead of phosphorus. Science 332(6034): 1163–1166.
Wu L (2004) Review of 15 years of research on ecotoxicology and remediation of landcontaminated by agricultural drainage sediment rich in selenium. Ecotoxicologyand Environmental Safety 57: 257–269.
Wu L, Banuelos G, and Guo X (2000) Changes of soil and plant tissue selenium statusin an upland grassland contaminated by selenium-rich agricultural drainagesediment after ten years transformed from a wetland habitat. Ecotoxicology andEnvironmental Safety 47: 201–209.
Xiao L, Wildgoose GG, and Compton RG (2008) Sensitive electrochemical detectionof arsenic (III) using gold nanoparticle modified carbon nanotubes via anodicstripping voltammetry. Analytica Chimica Acta 620: 44–49. http://dx.doi.org/10.1016/j.aca.2008.05.015.

Arsenic and Selenium 57
Xu G and Jiang Y (1986) Se and the prevalence of Keshan and Kaschin-Beck diseases inChina. In: Thornton I (ed.) Proceedings of the First International Symposium onGeochemistry and Health, pp. 192–205. Northampton: Science Reviews.
Xu Y, Tokar EJ, Sun Y, and Waalkes MP (2012) Arsenic-Transformed MalignantProstate Epithelia Can Convert Noncontiguous Normal Stem Cells into anOncogenic Phenotype. Environmental Health Perspectives. 120: 865–871.
Yalcin S and Le XC (1998) Low pressure chromatographic separation of inorganicarsenic species using solid phase extraction cartridges. Talanta 47: 787–796.
Yamamura S (2003) Drinking water guidelines and standards. In: Hashizume H andYamamura S (eds.) Arsenic, Water and Health: The State of the Art, ch. 5. Geneva:World Health Organization.
Yan XP, Kerrich R, and Hendry MJ (2000) Distribution of arsenic(III), arsenic(V) andtotal inorganic arsenic in porewaters from a thick till and clay-rich aquitardsequence, Saskatchewan, Canada. Geochimica et Cosmochimica Acta64: 2637–2648.
Yang G, Wang S, Zhou R, and Sun S (1983) Endemic selenium intoxication of humansin China. The American Journal of Clinical Nutrition 37: 872–881.
Yang G and Xia M (1995) Studies on human dietary requirements and saferange of dietary intakes of selenium in China and their application to the
prevention of related endemic diseases. Biomedical and Environmental Sciences8: 187–201.
Zawislanski PT, Chau S, Mountford H, Wong HC, and Sears TC (2001a) Accumulationof selenium and trace metals on plant litter in a tidal marsh. Estuarine, Coastal andShelf Science 52: 589–603.
Zawislanski PT, Mountford HS, Gabet EJ, McGrath AE, and Wong HC (2001b) Seleniumdistribution and fluxes in intertidal wetlands, San Francisco Bay, California. Journalof Environmental Quality 30: 1080–1091.
Zawislanski PT and Zavarin M (1996) Nature and rates of selenium transformations inKesterson Reservoir soils: A laboratory study. Soil Science Society of AmericaJournal 60: 791–800.
Zhang H, Davison W, Gadi R, and Kobayashi T (1998) In situ measurement of dissolvedphosphorus in natural waters using DGT. Analytica Chemica Acta 370: 29–38.
Zheng B, Yu X, Zhand J, Zhou D (1996) Environmental geochemistry of coal andendemic arsenism in southwest Guizhou, P.R. China, 30th International GeologicCongress, vol. 3, Abstracts p. 410.
Zobrist J, Dowdle PR, Davis JA, and Oremland RS (2000) Mobilization of arsenite bydissimilatory reduction of adsorbed arsenate. Environmental Science & Technology34: 4747–4753.