ars.els-cdn.com · web viewsupplementary materials for nanoparticle intercalation-induced...
TRANSCRIPT

Supplementary Materials for
Nanoparticle Intercalation-Induced Interlayer-Gap-Opened Graphene–Polyaniline Nanocomposite for Enhanced Supercapacitive Performances Sungjin Ima, Young Ran Parka, Sanghyuk Parka,b, Hyeong Jin Kimc, Ji Hoon Doha,d, Kyungjung
Kwonb, Won G. Hongd, Byungnam Kime, Woo Seok Yangf, TaeYoung Kimg, and Young Joon
Hongc,*
aGraphene Research Institute & Department of Chemistry, Sejong University, Seoul 05006, South
Korea bDepartment of Energy and Mineral Resources Engineering, Sejong University, Seoul 05006, South
Korea cDepartment of Nanotechnology and Advanced Materials Engineering, Sejong University, Seoul
05006, South Korea dDivision of Electron Microscopy Research, Korea Basic Science Institute (KBSI), Daejeon 34133,
South Korea eRadiation Equipment Research Division, Korea Atomic Energy Research Institute, Daejeon 34057,
South Korea fElectronic Material and Device Research Center, Korea Electronics Technology Institute, Seongnam,
Gyeonggi-do 13509, South Korea gDepartment of Bionanotechnology, Gachon University, Seongnam, Gyeonggi-do 13120, South Korea
*Corresponding author.
E-mail address: [email protected]
This file includes:
Supplementary Figs and Captions 1–9;
Supplementary Table and Caption 1;
Supplementary Descriptions;
Supplementary References
1
2
S1. Illustration of PANi–g–rGO with/without AgCl NP intercalation
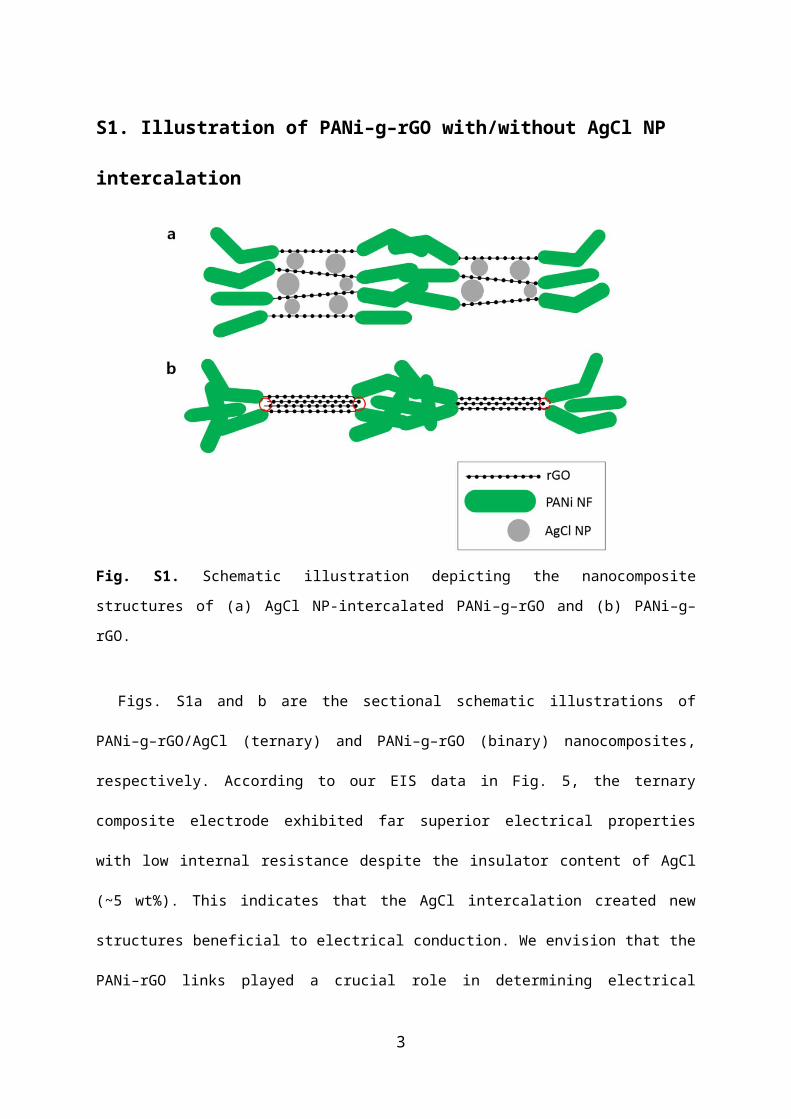
Fig. S1. Schematic illustration depicting the nanocomposite structures of (a) AgCl NP-intercalated
PANi–g–rGO and (b) PANi–g–rGO.
Figs. S1a and b are the sectional schematic illustrations of PANi–g–rGO/AgCl (ternary) and
PANi–g–rGO (binary) nanocomposites, respectively. According to our EIS data in Fig. 5, the ternary
composite electrode exhibited far superior electrical properties with low internal resistance despite the
insulator content of AgCl (~5 wt%). This indicates that the AgCl intercalation created new structures
beneficial to electrical conduction. We envision that the PANi–rGO links played a crucial role in
determining electrical properties in the ternary nanocomposite. It is well known that the edges of
thickly-stacked rGO flakes inhibit chemical binding with PANi NFs because of steric hindrance
effects (red circles in Fig. S1b), resulting in an increase of electrical resistance [S1]. As for the ternary
composite, the AgCl-intercalated rGO with well-developed edges has less steric hindrance effects
meaning that the PANi–g–rGO/AgCl exhibited higher electrical conductivity than the PANi–g–rGO
electrode.
3

S2. Thermogravimetric analysis for determining weight ratio of rGO and AgCl
Fig. S2. TGA curves of rGO, rGO/Ag, AgCl, and rGO/AgCl
The compositional content of rGO and AgCl was investigated using the TGA analyses (N 2 flow
rate of 40 mL min–1 & heating rate of 10 °C min–1). The TGA curve of rGO exhibits that the carbon
skeleton of rGO decomposed at the temperature range of 350–650°C, and the other composite showed
almost the same weight loss trend at the same temperature range due to rGO decomposition. The
weight loss below 350 is ascribed to H2O vaporization and decomposition of functional groups
formed on the rGO. It should be noted that the rGO soot was produced as a by-product residuum
above 650°C, as displayed in blue, orange, and red curves in Fig. S2. The weight ratio of rGO:residual
soot was typically 3.6:1 for our homogeneous rGO samples. Thus, taking account of the soot ratio, the
weight ratio of rGO:AgCl could be estimated to be ca. 6:4 for rGO/AgCl samples. As for the PANi–
g–rGO, the PANi NFs of 8–9 times weight of the rGO were put into the rGO solution for the ex-situ
grafting process. Thus, the mean weight of rGO, AgCl, and PANi was estimated to be 7, 5, 88 wt%
for the PANi–g–rGO/AgCl nanocomposite.
4

S3. Structural analysis of graphene oxide
Fig. S3. (a) Raman spectra and (b) XRD θ–2θ scan data of GO layer.
In Fig. S3a, the G band of GO was observed at 1601 cm–1, and the peak shifted to 1578 cm–1 after
the reduction process (Fig. 2a in main text). This validates the formation of rGO with sp2 carbon by
sufficient reduction via the reflux process [S2]. The XRD data also validates the reduction of GO for
rGO. In Fig. S3b, the (002) diffraction was observed at 2θ = 10.5°, which shifted to a higher angle of
2θ = 24.5°, indicating that the interplanar c-spacing of GO was substantially reduced when forming
rGO. More importantly, the peak associated with GO vanished in rGO samples, as shown in Fig. 2a,
which suggests the successful reduction of GO.
5

S4. EDX analysis of rGO/Ag after HCl treatment
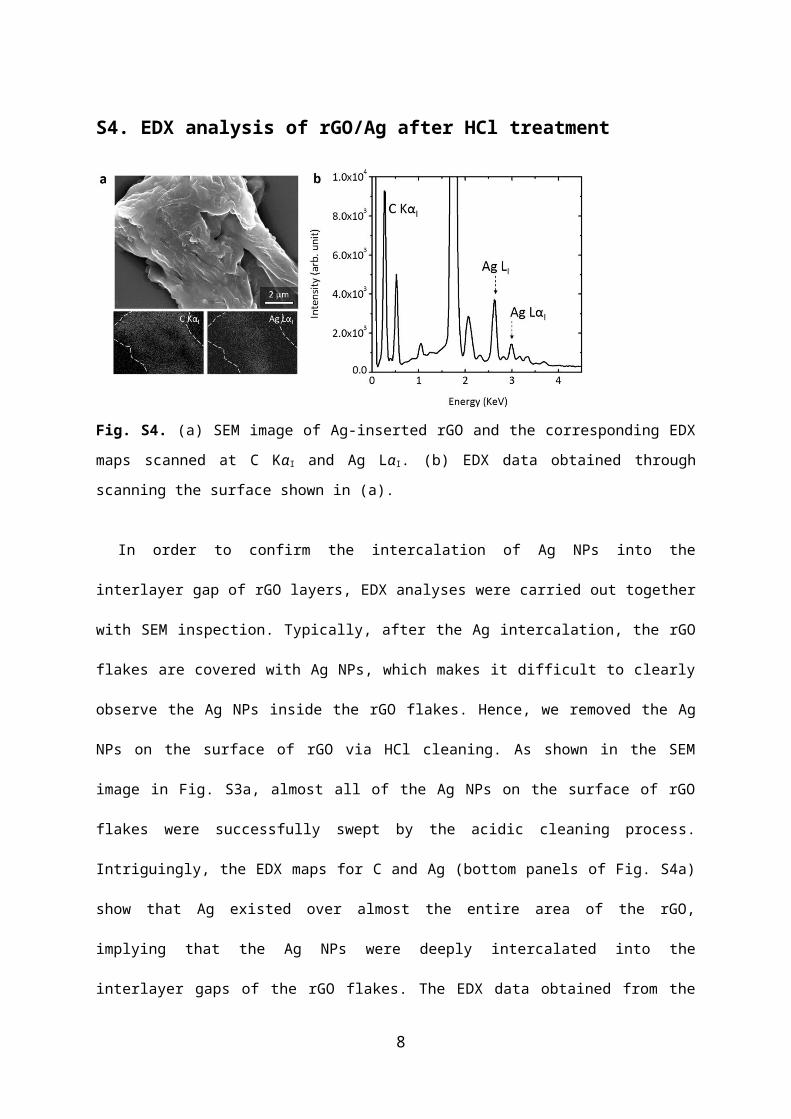
Fig. S4. (a) SEM image of Ag-inserted rGO and the corresponding EDX maps scanned at C KαI and Ag
LαI. (b) EDX data obtained through scanning the surface shown in (a).
In order to confirm the intercalation of Ag NPs into the interlayer gap of rGO layers, EDX
analyses were carried out together with SEM inspection. Typically, after the Ag intercalation, the rGO
flakes are covered with Ag NPs, which makes it difficult to clearly observe the Ag NPs inside the
rGO flakes. Hence, we removed the Ag NPs on the surface of rGO via HCl cleaning. As shown in the
SEM image in Fig. S3a, almost all of the Ag NPs on the surface of rGO flakes were successfully
swept by the acidic cleaning process. Intriguingly, the EDX maps for C and Ag (bottom panels of Fig.
S4a) show that Ag existed over almost the entire area of the rGO, implying that the Ag NPs were
deeply intercalated into the interlayer gaps of the rGO flakes. The EDX data obtained from the same
position of the sample displays that the Ag-related EDX peaks were observed at 2.63 and 2.99 KeV as
LI and LαI characteristic x-rays, respectively.
6

S5. XPS spectra of GO and rGO/Ag
Fig. S5. (a) C 1s XPS data of GO. (b) C 1s and (c) Ag 3d XPS data of Ag NP-intercalated rGO.
We investigated the chemical states of GO and Ag-intercalated rGO using XPS. In Fig. S5a, the C
1s XPS spectra of GO presents peaks of C–C (284.8 eV), C–O (285.6 eV), C–O–C (286.6 eV), C=O
(287.7 eV) and O–C=O (288.8 eV), representing the typical feature of GO [S3]. In contrast to GO,
Ag-intercalated rGO showed peaks associated with carbon–oxygen were substantially diminished in
the vicinity of C–C and C=C peaks (284.6 eV) after reduction (Fig. S5b). The Ag-intercalated rGO
exhibited Ag 3d3/2 and 3d5/2 orbital peaks centered at 368.3 and 374.3 eV, as shown in Fig. S5c. With
respect to bulk Ag crystals, the 3d peaks were observed to be blue-shifted by 0.4 eV in our Ag NPs,
suggesting the Ag crystals which formed between the rGO layers are nm-sized crystals [S4].
7
S6. CV curves of rGO and rGO/AgCl at high scan rates
Fig. S6. CV curves of rGO and rGO/AgCl at (a) 100 mV s–1 (b) 200 mV s–1.
S7. CV curves of PANi–g–rGO/AgCl and PANi–g–rGO at diverse scan rates
Fig. S7. CV curves of (a) PANi–g–rGO/AgCl and (b) PANi–g–rGO nanocomposites within potential
window of –0.2 to 1.0 V vs. Ag/AgCl at various scan rates of 10–200 mV s–1.
Fig. S7a and b shows CV hysteresis of PANi–g–rGO/AgCl and PANi–g–rGO nanocomposite
electrodes at diverse scan rates of 10, 20, 50, 100, and 200 mV s–1. The curves exhibit two pairs of
redox peaks, and intriguingly the AgCl NPs-inserted PANi–g–rGO presented the peaks at lower
potential values than those of binary electrodes at every scan rate. For instance, the binary composite
electrode showed Ox1 peaks at 0.245 and 0.425 V, while the ternary composite electrode showed
peaks at 0.155 and 0.295 V under scan rate conditions of 10 and 200 mV s–1, respectively. Such redox
peak shifts of ternary nanocomposites imply a reduced internal resistance, which is consistent with the
EIS analyses shown in Fig. 6 of the main text.
8

S8. Electrochemical characteristics rGO and rGO/AgCl
Fig. S8. (a) Specific capacitance and (b) Ragone plots for rGO and rGO/AgCl measured at various
current densities of 1, 2, 5, 10, 20, and 30 A g–1.
S9. Supercapacitive performance of PANi–g–rGO/AgCl as energy-storage device
Fig. S9. Ragone plot of PANi–g–rGO/AgCl nanocomposite for comparison with other energy-storage
devices.
9

S10. Supercapacitive performances of rGO-based hybridized electrodes
Table S1. Comparison of supercapacitive performances of rGO-based hybridized electrodes selected from other previous reports. Hybridized materials(morphology)<grafting method>
Current density range / electrolyte condition Supercapacitive performance
AgCl intercalated rGO–PANi(non-regular shape)
<ex-situ> [*]1–50 A g–1 / 0.1 M HCl
395 F g–1 at 1 A g–1
212 F g–1 at 50 A g–1
75 Wh kg–1 at 620 W kg–1
42.5 Wh kg–1 at 3.5×10⁴ W kg–1
GO–PANi(pillar shape)
<in-situ> (ref. S5)0.1–1 A g–1 /0.25 M H2SO4
160 F g–1 at 0.1 A g–1
110 F g–1 at 1 A g–1
N-doped rGO–PANi(layered structure)<in-situ> (ref. S6)
1–10 A g–1 / 1 M H2SO4
250 F g–1 at 1 A g–1
measurable below 10 A g–1
25 Wh kg–1 at 1000 W kg–1
rGO–PANi nanotube(layered structure)<in-situ> (ref. S7)
1–20 A g–1 / 1M H2SO4956 F g–1 at 1 A g–1
25 Wh kg–1 at 2000 W kg–1
[*] this study
Supplementary References
[S1] S. Lefrant, M. Baibarac, I. Baltog, J.Y. Mevellec, C. Godon, O. Chauvet, Functionalization of single-walled carbon nanotubes with conducting polymers evidenced by Raman and FTIR spectroscopy, Diam. Relat. Mater. 14 (2005) 867–872.[S2] S. Perumbilavil, P. Sankar, T.P. Rose, R. Philip, White light Z-scan measurements of ultrafast optical nonlinearity in reduced graphene oxide nanosheets in the 400-700 nm region, Appl. Phys. Lett. 107 (2015) 5.[S3] S. Dutta, C. Ray, S. Sarkar, M. Pradhan, Y. Negishi, T. Pal, Silver Nanoparticle Decorated Reduced Graphene Oxide (rGO) Nanosheet: A Platform for SERS Based Low-Level Detection of Uranyl Ion, ACS Appl. Mater. Interfaces 5 (2013) 8724–8732.[S4] S.K. Sengar, B.R. Mehta, Govind, Size and alloying induced shift in core and valence bands of Pd-Ag and Pd-Cu nanoparticles, Appl. Phys. Lett. 115 (2014) 051104.[S5] P. Bharathidasan, D.W. Kim, S. Devaraj, S.R. Sivakkumar, Supercapacitive characteristics of carbon-based graphene composites, Electrochim. Acta 204 (2016) 146–153.[S6] Q.L. Hao, X.F. Xia, W. Lei, W.J. Wang, J.S. Qiu, Facile synthesis of sandwich-like polyaniline/boron-doped graphene nano hybrid for supercapacitors, Carbon 81 (2015) 552-563.
10

[S7] C. Yang, L.L. Zhang, N.T. Hu, Z. Yang, Y.J. Su, S.S. Xu, M. Li, L. Yao, M. Hong, Y.F. Zhang, Rational design of sandwiched polyaniline nanotube/layered graphene/polyaniline nanotube papers for high-volumetric supercapacitors, Chem. Eng. J. 309 (2017) 89–97.
11