ars.els-cdn.com · web viewcompounds were not detected in blanks with the exception of caffeine,...
TRANSCRIPT

Supplemental Materials
Spatial Patterns of Pharmaceuticals and Wastewater Tracers in the Hudson River Estuary
Mark G. Cantwella*, David R. Katza, Julia C. Sullivanb, Daniel Shapleyc, John Lipscombc, Jennifer Epsteinc, Andrew R. Juhld, Carol Knudsond, Gregory D. O’Mullane
aU.S. Environmental Protection Agency, Office of Research and Development, 27 Tarzwell
Drive, Narragansett, RI 02882, USA bOak Ridge Associated Universities, Narragansett, RI 02882 USA cRiverkeeper Inc., 20 Secor Road, Ossining, NY 10562, USAdLamont Doherty Earth Observatory of Columbia University, 61 Route 9W, Palisades, NY
10964, USAeSchool of Earth and Environmental Sciences, Queens College, City University of New York,
65-30 Kissena Blvd., Flushing, NY 11367, USA
1

Table S1 River flows (m3/d) at USGS stations in tributaries along the Hudson River
Table S2 Locations of sampling sites and sample collection dates
Table S3 Compound specific analysis conditions and settings for detection of MRM transitions
Table S4 Pharmaceutical compound purities of native and isotopically labelled standards
Table S5 LC-MS/MS instrument operating conditions
Table S6 Quality control data for matrix and spiked sample recovery
Table S7 WWTP locations within study area and daily average flows
Table S8 Concentrations (ng/L) of all compounds at all sites during both sampling periods
Table S9 Class, Log KOW, Log Kd, and pKas of pharmaceutical compoundsTable S10 Comparison of detection frequencies and mean concentrations of select
pharmaceuticals from the present study to Batt et al., 2016.
Table S11 Regression values of caffeine and sucralose against study compounds
Figure S1 Water temperatures along the river transect for May and July
Figure S2 Salinity along the river transect for May and July
Figure S3 Caffeine-sucralose ratios along the river transect
2
Table S1. River flows (m3/d) at USGS stations in tributaries along the Hudson River
DateHudson River
at Green Islanda
Freshwater Inputs from Major Tributaries
Croton Esopus Kinderhook Wappinger Wallkill Rondout
19-May-16 2.1 E+07 5.7 E+05 5.0 E+05 7.4 E+05 4.7 E+05 1.3 E+05 7.6 E+0520-May-16 1.9 E+07 5.4 E+05 3.9 E+05 6.6 E+05 4.4 E+05 1.2 E+05 6.4 E+0521-May-16 1.5 E+07 4.8 E+05 3.5 E+05 6.4 E+05 4.1 E+05 1.2 E+05 6.2 E+0522-May-16 1.9 E+07 5.0 E+05 3.3 E+05 5.9 E+05 3.9 E+05 1.1 E+05 5.9 E+0523-May-16 2.1 E+07 4.6 E+05 3.1 E+05 5.6 E+05 3.7 E+05 1.0 E+05 5.7 E+0512-Jul-16 1.8 E+07 4.6 E+04 7.6 E+05 2.2 E+05 1.1 E+05 4.9 E+05 6.2 E+0513-Jul-16 1.1 E+07 4.2 E+04 5.5 E+05 1.9 E+05 9.1 E+04 3.3 E+05 4.5 E+0514-Jul-16 1.2 E+07 4.2 E+04 4.4 E+05 1.8 E+05 8.1 E+04 2.9 E+05 3.8 E+0515-Jul-16 1.4 E+07 4.2 E+04 4.4 E+05 1.9 E+05 7.6 E+04 2.6 E+05 4.1 E+0516-Jul-16 1.5 E+07 4.2 E+04 3.6 E+05 2.0 E+05 7.3 E+04 1.4 E+05 3.8 E+05
5-year average May 4.8E+07 1.9E+06 1.9E+06 1.3E+06b 7.3E+05 3.3E+06 1.8E+06
5-year average July 2.9E+07 8.1E+05 9.0E+05 8.2E+05b 6.5E+05 1.6E+06 1.1E+06
a Includes flow from Mohawk Riverb Only 4 years of data are available for the Kinderhook station
3

Table S2. Locations of sampling sites and sample collection dates
River Kilometer Site ID Site Name Sampling DatesHudson River Sites
249.6 155.1 Hudson above Mohawk River 23-May-16 16-Jul-16249.4 155W Mohawk River at Waterford 23-May-16 16-Jul-16245.4 152.5 Hudson River above Troy Lock 23-May-16 16-Jul-16243.8 151.5 Congress St. Bridge - Troy 23-May-16 16-Jul-16235.0 146W Albany Rowing Dock 23-May-16 16-Jul-16232.6 144.5 Dunn Memorial Bridge - Albany 23-May-16 16-Jul-16228.5 142W Island Creek/Normans Kill 23-May-16 16-Jul-16222.1 138W Bethlehem Launch Ramp 23-May-16 16-Jul-16220.5 137E Castleton 23-May-16 16-Jul-16214.0 133W Coeymans Landing 23-May-16 16-Jul-16199.6 124W Coxsackie Waterfront Park 23-May-16 16-Jul-16197.1 122.5 Gay's Point mid-channel 23-May-16 16-Jul-16188.3 117W Athens 23-May-16 16-Jul-16187.5 116.5E Hudson Landing Ramp 23-May-16 16-Jul-16182.0 113-CC2 Catskill Creek- East End 22-May-16 15-Jul-16181.9 113-CC1 Catskill Launch Ramp 22-May-16 15-Jul-16174.6 108.5 Inbocht Bay 22-May-16 15-Jul-16165.8 103W Malden Launch Ramp 22-May-16 15-Jul-16164.3 102-EC2 Esopus Creek West 22-May-16 15-Jul-16164.2 102-EC1 Esopus Creek Entrance 22-May-16 15-Jul-16159.3 99E Tivoli Landing 22-May-16 15-Jul-16156.1 97W Ulster Landing Beach 22-May-16 15-Jul-16148.4 92-RC2 Rondout- Kingston Public Dock 22-May-16 15-Jul-16148.2 92-RC1 Kingston STP Outfall 22-May-16* 15-Jul-16148.1 92W Kingston Point Beach 22-May-16 15-Jul-16141.6 88W Port Ewen Drinking Water Intake 22-May-16 15-Jul-16136.8 85E Norrie Point Yacht Basin 22-May-16 15-Jul-16136.0 84.5 Norrie Point mid-channel 22-May-16 15-Jul-16123.9 77 Poughkeepsie Drinking Water Intake 21-May-16 14-Jul-16120.7 75E Poughkeepsie Launch Ramp 21-May-16 14-Jul-16109.4 68W Marlboro Landing 21-May-16 14-Jul-16107.0 66.5E Wappingers Creek 21-May-16 14-Jul-1698.2 61E Beacon Harbor 21-May-16 14-Jul-1696.6 60W Newburgh Launch Ramp 21-May-16 14-Jul-1686.9 54E Little Stony Point 21-May-16 14-Jul-1686.1 53.5E Cold Spring Harbor 21-May-16 14-Jul-1684.5 52.5W West Point STP Outfall 21-May-16 14-Jul-1674.0 46W Fort Montgomery 21-May-16 14-Jul-1670.8 44E Annesville Creek 21-May-16 14-Jul-1669.2 43E Peekskill Riverfront Green Park 21-May-16 14-Jul-16
4

River Kilometer Site ID Site Name Sampling Dates65.2 40.5 Stony Point mid-channel 21-May-16 14-Jul-1664.5 40.1E Furnace Brook 21-May-16 14-Jul-1664.4 40W Cedar Pond Brook 21-May-16 14-Jul-1662.8 39 Haverstraw Bay mid-channel 21-May-16 14-Jul-1662.0 38.5W Emeline Beach- Haverstraw 21-May-16 14-Jul-1657.9 36E Croton Point Beach 21-May-16 14-Jul-1654.7 34E Ossining Beach 21-May-16 13-Jul-1645.2 28.1W Nyack Launch Ramp 20-May-16 13-Jul-1645.1 28E Kingsland Pt. Park- Pocantico River 20-May-16 13-Jul-1644.3 27.5 TZ Bridge mid-channel 20-May-16 13-Jul-1643.5 27E Tarrytown Marina 20-May-16 13-Jul-1642.0 26.1W Piermont Pier 20-May-16 13-Jul-1641.8 26W Orangetown STP Outfall 20-May-16 13-Jul-1641.7 25.9E Irvington Beach 20-May-16 13-Jul-1629.8 18.5 Yonkers mid-channel 19-May-16 12-Jul-1629.6 18.4E Saw Mill River 19-May-16 12-Jul-1628.2 17.5E Yonkers STP Outfall 19-May-16 12-Jul-1622.5 14E Dyckman Street Beach 19-May-16 12-Jul-1619.3 12 GW Bridge mid-channel 19-May-16 12-Jul-1612.9 8E North River STP at 145th 19-May-16 12-Jul-1612.7 7.9E 125th St. Pier 19-May-16 12-Jul-1611.3 7 79th St. mid-channel 19-May-16 12-Jul-169.7 6E Pier 96 Kayak Launch 19-May-16 12-Jul-167.6 4.7W Castle Point, NJ 19-May-16 12-Jul-160.2 0 The Battery mid-channel 19-May-16 12-Jul-16
New York Harbor SitesHA2 Harlem River- Washington Bridge 20-May-16 13-Jul-16HA1 Harlem River- Willis Ave. Bridge 20-May-16 13-Jul-16ER2 East River mid-channel at Roosevelt 20-May-16 12-Jul-16NT2 Newtown Creek- Metropolitan Ave.
Bridge20-May-16 13-Jul-16
NT1 Newtown Creek- Dutch Kills 20-May-16 13-Jul-16ER1 East River mid-channel at 23rd St. 20-May-16 13-Jul-16GO1 Gowanus Canal 19-May-16 12-Jul-16
*The sample at RK 148.2 in May was taken directly from the Kingston WWTP outfall pipe
5

Table S3. Compound specific analysis conditions and settings for detection of MRM transitions
Compound Parent Ion (Da)
Quantification Ion (Da)
Cone (V)
Collision (eV)
Confirmation Ion (Da)
Cone (V)
Collision (eV)
Ionization Method (ESI+/ESI-)
Quantification Reference
Native Compounds
Acebutolol 337.12 116.00 48 24 72.00 48 32 ESI+ Propranolol-d7
Acetaminophen 152.10 110.07 39 22 92.9 39 15 ESI+ Acetaminophen-d3
Atenolol 267.19 145.05 40 27 73.96 40 19 ESI+ Atenolol-d7
Caffeine 195.11 138.12 49 20 110.09 49 23 ESI+ Caffeine-d3
Carbamazepine 237.13 194.48 38 21 179.1 38 31 ESI+ Carbamazepine-d10
Diltiazem 415.26 178.02 50 25 ESI+ Diltiazem-d3
Furosemide 329.10 285.11 36 22 205.06 36 24 ESI- Furosemide-d5
Gemfibrozil 249.15 121.03 25 14 126.88 25 14 ESI- Gemfibrozil-d6
Labetalol 329.17 161.95 30 30 90.90 30 46 ESI+ Metoprolol-d7
Losartan 423.15 235.00 38 24 207.00 38 24 ESI+ Valsartan-d8
Metoprolol 268.22 116.11 32 19 74.43 32 19 ESI+ Metoprolol-d7
Propranolol 260.15 183.05 40 22 116.06 40 22 ESI+ Propranolol-d7
Ranitidine 315.11 176.02 33 20 129.97 33 23 ESI+ Ranitidine-d6
Sucralose 440.98 394.95 20 14 359.00 20 14 ESI- Sucralose-d6
Sulfamethoxazole 254.08 156.03 34 30 92.11 34 18 ESI+ Sulfamethoxazole-13C6
Trimethoprim 291.11 230.10 52 24 122.95 52 24 ESI+ Trimethoprim-d9
Valsartan 436.32 291.06 27 16 235.12 27 17 ESI+ Valsartan-d8
Verapamil 455.30 303.28 62 28 165.07 62 34 ESI+ Verapamil-d3
InternalStandards
Acetaminophen-d3 154.98 111.00 34 14 92.95 34 24 ESI+Atenolol-d7 274.25 145.02 40 26 105.06 40 25 ESI+Caffeine-d3 198.13 137.97 46 26 109.94 46 26 ESI+
Carbamazepine-d10 247.16 204.13 42 23 187.13 42 40 ESI+Diltiazem-d3 418.10 178.02 50 25 109.00 50 72 ESI+
Furosemide-d5 333.97 290.04 36 16 205.99 36 24 ESI-Gemfibrozil-d6 255.18 133.11 20 12 120.95 20 12 ESI-Metoprolol-d7 275.20 123.10 42 19 79.00 42 24 ESI+Propranolol-d7 267.18 189.12 40 22 116.06 40 22 ESI+Ranitidine-d6 321.07 176.02 28 20 129.97 28 28 ESI+Sucralose-d6 447.00 401.00 20 14 365.00 20 14 ESI-
Sulfamethoxazole-13C6 260.09 161.98 26 18 97.96 26 28 ESI+Trimethoprim-d9 300.20 234.20 55 28 264.20 55 28 ESI+
Valsartan-d8 444.16 291.09 27 22 235.02 26 24 ESI+Verapamil-d3 458.30 165.07 55 34 150.11 55 46 ESI+
6

Table S4. Pharmaceutical compound purities of native and isotopically labelled standards
Compound Purity (%) Based on Certificate of Analysis Vendor CAS #
Acebutolol 100 Fluka 37517-30-9Acetaminophen 99.9 Fluka 103-90-2
Acetaminophen-d3 99.0 CDN Isotopes 60902-28-5Atenolol 99.1 Sigma 29122-68-7
Atenolol-d7 98.9 CDN Isotopes 29122-68-7Caffeine 99.8 Fluka 58-8-2
Caffeine-d3 99.0 CDN Isotopes 26351-03-1Carbamazepine 99.9 Fluka 298-46-4
Carbamazepine-d10 99.0 CDN Isotopes 132183-78-9Diltiazem HCl 99.0 Sigma 33286-22-5
Diltiazem-d3 HCl 98.9 CDN Isotopes 1217860-13-3Furosemide 99.6 Fluka 54-31-9
Furosemide-d5 99.0 CDN Isotopes 1189482-35-6Gemfibrozil 100.0 Sigma 25812-30-0
Gemfibrozil-d6 99.0 CDN Isotopes 1184986-45-5Labetalol 99.1 Fluka 36894-69-6Losartan 99.9 Fluka 114798-26-4
Metoprolol Tartrate 99.2 Fluka 56392-17-7Metoprolol-d7 HCl 99.8 CDN Isotopes 1219798-61-4
Propranolol HCl 99.0 Sigma 4199-10-4Propranolol-d7 99.0 CDN Isotopes 344298-99-3Ranitidine HCl 99.4 Fluka 66357-59-3
Ranitidine-d6 HCl 96.6 CDN Isotopes 1185238-09-8Sucralose 99 SCB* 56038-13-2
Sucralose-d6 98.5 SCB* 56038-13-2Sulfamethoxazole 99.6 Fluka 723-46-6
Sulfamethoxazole-13C6 99.0 Sigma-Aldrich 1196157-90-0Trimethoprim 99.5 Fluka 738-70-5
Trimethoprim-d9 99.9 Sigma-Aldrich 1189460-62-5Valsartan 100.0 Sigma 137862-53-4
Valsartan-d8 99.0 CDN Isotopes 1089736-72-0Verapamil HCl 99.9 Fluka 152-11-4
Verapamil-d3 HCl 99.0 CDN Isotopes 1398112-33-8*Santa Cruz Biotechnology
7

Table S5. LC-MS/MS instrument operating conditions.
8
LC ConditionsInjection Volume 10 µLFlow rate (mL/min) 0.5Column Temperature (°C) 35Column Waters BEH-C18, 50 mm, 1.7 µmEluent A Water + 0.1% Formic AcidEluent B Acetonitrile + 0.1 % Formic AcidEluent C Methanol + 0.1 % Formic Acid
LC Gradient Program
t=0: %B = 6.7, %C = 3.3 t=1: %B = 6.7, %C = 3.3
t=5: %B = 23.7, %C = 11.3t=7.5: %B = 23.7, %C = 11.3
t=9.3: %B = 60, %C = 30t=13: %B = 60, %C = 30
t=13.1: %B = 6.7, %C = 3.3t=15.5: %B = 6.7, %C = 3.3
MS Conditions ESI + ESI -Capillary voltage (kV) 0.5 3.5Source Temperature (°C) 150 150Desolvation Gas Temperature (°C) 500 500Cone Gas Flow (L/h) 20 20Desolvation Gas Flow (L/h) 900 900

Table S6. Quality control data for matrix and spiked sample recovery
Compound MDL Spike Recoveries (%) Matrix Recoveries (%)Acebutolol 0.35 114 129
Acetaminophen 0.10 88.2 102Atenolol 0.01 109 108Caffeine 0.31 114 110
Carbamazepine 0.07 98.6 126Diltiazem 0.10 126 127
Furosemide 1.47 99.1 122Gemfibrozil 1.30 104 118
Labetalol 0.50 87.7 89.8Losartan 2.20 97.4 107
Metoprolol 0.20 94.9 97.0Propranolol 0.10 111 122Ranitidine 1.50 102 87.1Sucralose 10.0 108 78.5
Sulfamethoxazole 0.32 89.0 107Trimethoprim 0.35 112 96.7
Valsartan 1.04 119 112Verapamil 0.35 101 99.0
Compounds were not detected in blanks with the exception of caffeine, which ranged from <LOQ to 3 ng. Spiked and matrix sample recoveries ranged from 78.5% to 129%. Calibration verification standards run every ~10 samples were within 10% of the target concentrations, on average. Duplicate samples were within 14% RPD. Samples were extracted in the order of their collection, with an average hold time of <7 days.
9
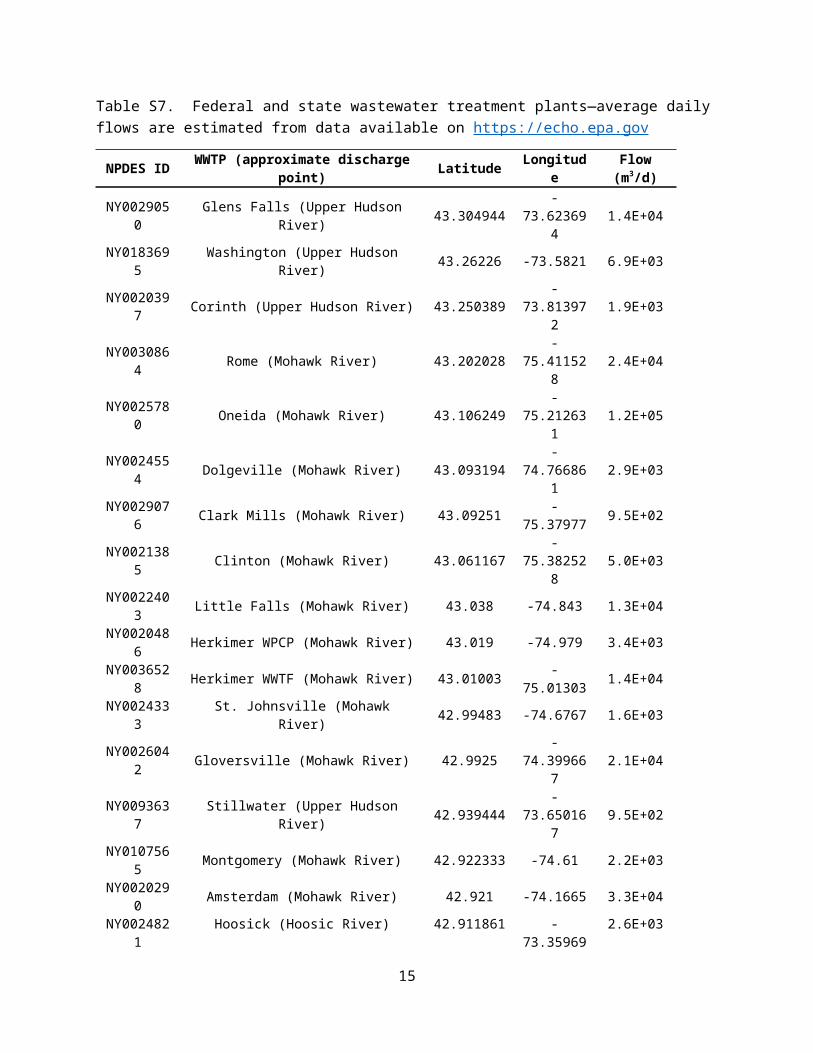
Table S7. Federal and state wastewater treatment plants—average daily flows are estimated from data available on https://echo.epa.gov
NPDES ID WWTP (approximate discharge point) Latitude Longitude Flow (m3/d)NY0029050 Glens Falls (Upper Hudson River) 43.304944 -73.623694 1.4E+04NY0183695 Washington (Upper Hudson River) 43.26226 -73.5821 6.9E+03NY0020397 Corinth (Upper Hudson River) 43.250389 -73.813972 1.9E+03NY0030864 Rome (Mohawk River) 43.202028 -75.411528 2.4E+04NY0025780 Oneida (Mohawk River) 43.106249 -75.212631 1.2E+05NY0024554 Dolgeville (Mohawk River) 43.093194 -74.766861 2.9E+03NY0029076 Clark Mills (Mohawk River) 43.09251 -75.37977 9.5E+02NY0021385 Clinton (Mohawk River) 43.061167 -75.382528 5.0E+03NY0022403 Little Falls (Mohawk River) 43.038 -74.843 1.3E+04NY0020486 Herkimer WPCP (Mohawk River) 43.019 -74.979 3.4E+03NY0036528 Herkimer WWTF (Mohawk River) 43.01003 -75.01303 1.4E+04NY0024333 St. Johnsville (Mohawk River) 42.99483 -74.6767 1.6E+03NY0026042 Gloversville (Mohawk River) 42.9925 -74.399667 2.1E+04NY0093637 Stillwater (Upper Hudson River) 42.939444 -73.650167 9.5E+02NY0107565 Montgomery (Mohawk River) 42.922333 -74.61 2.2E+03NY0020290 Amsterdam (Mohawk River) 42.921 -74.1665 3.3E+04NY0024821 Hoosick (Hoosic River) 42.911861 -73.359694 2.6E+03NY0028240 Saratoga (Upper Hudson River 42.882472 -73.682722 5.2E+04NY0023485 Canajoharie (Mohawk River) 42.85456 -74.59387 1.3E+03NY0020516 Schenectady (Mohawk River) 42.840167 -73.918222 4.7E+04NY0023973 Niskayuna (Mohawk River) 42.804111 -73.854944 6.6E+03NY0020141 Rotterdam (Mohawk River) 42.8039 -73.98894 3.0E+03NY0027758 Colonie (Mohawk River) 42.790944 -73.778972 1.3E+04NY0029173 Waterford (RK 249.4) 42.787833 -73.684583 3.1E+03NY0026875 Albany North (RK 239.4) 42.69 -73.724 7.3E+04NY0087971 Rensselaer (RK 239) 42.683083 -73.713028 7.1E+04NY0022225 Nott Rd (Norman’s Kill) 42.680278 -73.907778 6.7E+03NY0024201 Cobleskill (Mohawk River) 42.674861 -74.475722 2.0E+03NY0026867 Albany South (RK 231) 42.630306 -73.759667 8.1E+04NY0026034 Greenbush (RK 230.6) 42.626972 -73.753028 6.0E+03NY0025739 Cedar Hill (RK 221.7) 42.5434 -73.76432 1.3E+04NY0030970 Castleton (RK 221.6) 42.539778 -73.754972 5.3E+02NY0022772 Coeymans (RK 213) 42.46563 -73.7874 1.9E+03NY0033545 Coxsackie (RK 199.2) 42.349472 -73.792111 2.9E+03NY0262935 Windham (Mohawk River) 42.302929 -74.272844 7.2E+02NY0020869 Athens (RK 188.3) 42.2625 -73.803444 8.0E+02NY0022039 Hudson (RK 187.7) 42.258833 -73.792889 7.5E+03NY0030988 Greenport (Stockport Creek) 42.257611 -73.755639 2.4E+03NY0241075 Hunter (Mohawk River) 42.2164 -74.2408 4.9E+02NY0020389 Catskill (RK 181.9) 42.212111 -73.853556 3.0E+03NY0031208 Saugerties – Dublin (Esopus Creek) 42.07475 -73.944972 2.4E+03NY0145564 Saugerties – Glasco (RK 157.7) 42.03999 -73.94173 6.8E+02
10

NPDES ID WWTP (approximate discharge point) Latitude Longitude Flow (m3/d)NY0021563 Ulster (Esopus Creek) 41.96548 -74.00575 3.3E+03NY0029351 Kingston (RK 148.2) 41.92038 -73.97905 1.8E+04NY0025429 Millbrook (Wappinger Creek) 41.788292 -73.697413 5.3E+02NY0030082 New Paltz (Wallkill River) 41.753194 -74.090722 3.4E+03NY0024295 Lloyd Highland (RK 122.8) 41.71825 -73.95129 2.9E+03NY0026255 Poughkeepsie (RK 122.2) 41.713814 -73.937575 2.3E+04NY0264989 Titusville (Wappinger Creek) 41.685833 -73.867222 1.1E+03NY0026271 Arlington (RK 115.4) 41.6487 -73.94156 8.8E+03NY0021521 Shawangunk (Wallkill River) 41.632889 -74.189361 1.3E+03NY0149209 Tri-Municipal (RK 109.6) 41.606243 -73.936578 5.6E+03NY0109720 Marlboro (RK 109.4) 41.603556 -73.964806 4.2E+02NY0030490 Walden (Wallkill River) 41.528241 -74.242238 4.7E+03NY0025976 Beacon (RK 96) 41.495555 -73.981888 1.1E+04NY0026310 Newburgh (RK 95.6) 41.49435 -74.00794 2.8E+04NY0024422 Wallkill (Wallkill River) 41.46396 -74.36897 9.5E+03NY0022144 Cornwall (RK 91.8) 41.45296 -74.01998 2.7E+03NY0026328 Middletown (Wallkill River) 41.42703 -74.42216 1.7E+04NY0022721 Cold Spring (RK 86.5) 41.421278 -73.964028 8.4E+02NY0031356 Carmel (Croton River) 41.416083 -73.669778 2.7E+03NY0031518 Goshen (Wallkill River) 41.401833 -74.353083 4.3E+03NY0026581 Brewster (Croton River) 41.392194 -73.6185 4.9E+02NY0023761 West Point (RK 84.5) 41.377913 -73.9636 6.0E+03NY0022586 Highland Falls (RK 81) 41.37062 -73.96537 2.8E+03NY0100803 Peekskill (RK 70.8) 41.300056 -73.929583 2.5E+04NY0026743 Yorktown (Croton River) 41.282954 -73.774032 4.9E+03NY0029971 Buchanan (RK 67.9) 41.272528 -73.941556 1.0E+03NY0023680 Warwick (Wallkill River) 41.254722 -74.372639 2.6E+03NY0028851 Stony Point (RK 64.6) 41.22229 -73.96585 2.7E+03NY0028533 Haverstraw (RK 63.2) 41.2135 -73.963556 1.5E+04NY0108324 Ossining (RK 54.7) 41.1525 -73.873611 1.6E+04NJ0053350 Sussex (Wallkill River) 41.147056 -74.592111 5.2E+03NY0031895 Rockland (RK 42) 41.042306 -73.9425 6.1E+04NY0026051 Orangetown (RK 41.8) 41.038914 -73.946069 3.0E+04NY0026689 Yonkers (RK 28.2) 40.909806 -73.8915 2.9E+05NY0026247 North River (RK 12.9) 40.821337 -73.958008 4.2E+05NJ0020591 Bergen - Edgewater MUA (RK 12.2) 40.811667 -73.979159 1.3E+04NY0026191 Hunts Point (East River) 40.804748 -73.885309 4.7E+05NY0026239 Tallman Island (East River) 40.793776 -73.840309 2.2E+05NJ0029084 North Bergen MUA Woodcliff (RK 11.4) 40.791687 -73.998567 1.2E+04NJ0025321 North Hudson - River Road (RK 11.2) 40.787823 -73.999611 3.5E+04NY0026131 Wards Island (East River) 40.786884 -73.928196 7.7E+05NY0026158 Bowery Bay (East River) 40.778405 -73.89459 3.8E+05NJ0026085 North Hudson - Adams Street (RK 8.1) 40.753611 -74.020833 4.6E+04NY0026204 Newtown Creek (East River) 40.73143 -73.94639 8.0E+05
11

NPDES ID WWTP (approximate discharge point) Latitude Longitude Flow (m3/d)NY0027073 Red Hook (East River) 40.705722 -73.984389 1.0E+05NY0026166 Owls Head (NYH) 40.643639 -74.037639 3.5E+05NY0026107 Port Richmond (Kill Van Kull) 40.637241 -74.125445 1.0E+05NY0026174 Oakwood Beach (NYH) 40.548389 -74.11225 9.9E+04
12

Table S8. Concentrations (ng/L) of all compounds at all sites during both sampling periods
MayRK SUC CAF ACE CAR SUL PRO ATE MET TRI RAN LAB ACB DIL LOS VAL VER GEM FUR0.2 924 121 8.83 7.26 18.8 16.0 22.0 5.92 0.64 24.1 77.97.6 950 109 9.77 9.28 25.3 18.4 29.5 5.81 27.9 86.29.7 899 120 8.50 21.0 16.3 23.2 5.64 24.2 81.7 27.711.3 929 105 6.05 6.71 19.6 16.3 22.6 4.63 17.0 73.212.7 5990 124 6.75 16.5 19.1 26.7 6.89 3.97 30.3 79.7 21.612.9 862 118 4.84 5.64 22.3 16.7 26.1 6.13 38.9 84.8 15.419.3 4080 111 3.72 5.41 20.6 14.8 22.3 5.16 31.9 74.422.5 701 110 4.96 5.37 18.5 16.2 22.9 4.95 25.8 73.3 18.328.2 6120 102 73.2 81.6 8.93 265 195 83.1 60.6 90.2 6.52 1.30 386 939 9.69 252 13029.6 716 166 177 1.75 9.79 14.4 16.8 4.84 20.7 59.729.8 638 102 2.20 4.16 12.1 12.6 20.6 3.47 22.9 62.6 20.841.7 850 85.0 2.82 12.7 10.6 14.7 2.75 16.1 45.041.8 7600 2060 117 112 250 15.8 216 330 83.1 56.2 155 9.81 12.4 564 2030 7.74 159 16542 588 90.7 3.87 9.69 8.91 18.4 2.77 21.3 57.4 16.6
43.5 4200 276 328 1.28 9.26 12.7 16.2 2.47 17.5 39.844.3 675 71.0 1.71 12.6 7.84 17.4 2.47 16.8 35.8 19.345.1 758 63.8 3.85 8.70 5.82 10.8 1.16 12.8 25.445.2 685 65.0 4.24 12.8 6.69 16.2 2.09 6.74 32.854.7 824 66.5 2.61 14.6 7.59 15.7 2.41 14.9 34.557.9 913 60.6 4.01 12.5 5.95 14.9 1.25 12.9 25.962 775 52.3 3.13 13.2 5.99 15.3 1.37 12.9 23.0
62.8 760 54.8 2.80 14.2 4.69 12.4 1.48 11.6 21.164.4 744 52.0 3.52 13.1 5.37 13.7 1.61 11.1 21.2 15.764.5 791 57.2 3.97 13.9 7.39 15.5 1.65 14.4 28.165.2 915 55.8 2.67 13.5 6.03 14.1 1.50 11.0 20.4 20.569.2 870 48.5 2.26 13.4 4.88 11.3 0.76 12.8 12.270.8 804 49.0 2.82 10.3 3.52 11.6 0.85 11.4 14.274 754 53.8 1.73 11.4 5.06 12.9 1.10 11.2 12.7
13

MayRK SUC CAF ACE CAR SUL PRO ATE MET TRI RAN LAB ACB DIL LOS VAL VER GEM FUR84.5 882 82.0 7.16 119 4.05 41.6 87.7 96.7 5.58 2.78 38.6 79.6 1.67 87.9 27.586.1 789 52.8 2.08 11.4 4.16 12.0 1.31 8.35 13.786.9 1040 58.5 1.77 10.9 3.99 12.1 1.46 10.7 14.096.6 1080 62.5 2.28 9.77 5.86 14.5 1.48 9.74 15.598.2 1150 49.9 1.36 10.6 5.12 11.4 1.71 10.7 21.9107 1190 79.7 2.49 3.19 10.0 4.84 13.2 1.69 10.1 18.3
109.4 1530 62.7 1.40 9.84 6.50 13.9 1.75 11.7 20.6120.7 1730 60.0 1.71 1.54 10.7 5.21 12.7 2.28 11.4 21.2 15.7123.9 1050 58.3 2.08 10.9 5.62 11.2 1.65 12.8 20.1 16.8136 748 58.3 2.98 9.96 5.10 10.9 1.63 10.1 21.6 16.9
136.8 1030 53.9 2.14 2.92 10.3 5.47 9.40 1.90 12.3 20.5 13.8141.6 740 66.2 2.78 3.35 9.13 4.17 10.5 2.01 12.1 23.2148.1 723 72.3 4.12 9.90 4.14 9.57 1.52 11.4 22.2148.2 1620
0139 543 617 134 1070 2020 350 1000 305 22.0 73.5 1700 3810 51.4 1440 1230
148.4 840 46.9 3.33 10.1 1.50 8.05 4.18 11.4156.1 847 73.6 5.19 11.4 6.26 11.4 2.75 12.8 25.9159.3 847 83.1 6.81 7.43 15.8 7.20 13.2 3.13 13 30.5164.2 781 46.9 6.11 3.81 19.3 7.26 26.5 4.27 15 35.6164.3 625 23.5 2.00 12.0 3.87 19.6 2.56 10.5 26.7165.8 842 98.7 7.14 4.59 10.7 6.98 13.0 3.55 14.7 33.7174.6 857 109 11.2 7.53 13.9 9.22 16.1 3.19 15.9 34.2181.9 753 80.1 10.6 5.60 12.1 8.11 14.7 2.73 12.5 26.8182 779 80.3 6.81 3.87 8.79 8.11 15.9 2.60 13.7 25.6
187.5 978 70.3 5.74 8.48 8.19 18.0 3.19 15.6 28.0188.3 1040 65.5 6.19 5.74 10.0 9.49 20.1 3.95 13.8 28.8 18.9197.1 1050 57.8 8.05 4.77 10.6 13.1 24.8 4.44 16.6 33.0199.6 1150 61.4 9.28 5.06 14.7 11.7 24.8 4.18 17.2 39.3214 1100 72.8 7.96 3.72 10.5 14.1 27.1 5.90 0.23 21.8 40.9 24.5
220.5 1160 62.3 9.38 5.53 12.8 13.1 27.9 5.26 0.45 19.4 41.3 24.8222.1 1150 65.3 11.2 5.84 13.5 0.66 13.8 30.8 6.70 1.36 24 43.3 22.8 8.11
14
MayRK SUC CAF ACE CAR SUL PRO ATE MET TRI RAN LAB ACB DIL LOS VAL VER GEM FUR
228.5 1750 41.6 10.9 23.7 4.99 19.2 6.14 2.95 21.1 20.2232.6 1110 84.7 13.4 4.01 12.6 14.4 22.3 4.48 3.83 0.74 21.7 34.1235 940 84.5 24.1 5.12 13.3 10.7 22.4 5.28 0.80 20.1 32.4 20.3
243.8 727 72.1 9.32 2.24 6.56 10.5 15.1 2.43 0.25 14.1 24.2245.4 798 78.6 12.9 2.06 8.07 11.7 16.7 3.06 0.19 15.4 25.1249.4 1200 51.8 14.0 5.23 11.4 10.1 19.0 2.56 0.16 17.7 26.5 19.5249.6 700 82.8 0.95 8.95 14.5 17.1 3.17 0.51 14.8 23.6 19.1
NYH IDGO1 898 142 13.1 8.25 23.4 18.2 27.6 7.67 0.78 23.9 77.9 1.71 28.2ER1 708 128 12.1 6.07 22.3 0.29 17.1 25.9 6.23 23.2 75.1 2.41NT1 1250 248 47.1 6.40 15.6 0.51 16.6 24.4 4.29 0.56 36.1 60.2 1.91 28.8 8.83NT2 994 589 138 25.1 32.7 1.15 31.8 47.6 8.14 0.49 48.7 117 2.16 43.1ER2 887 212 17.0 12.6 27.7 20.2 36.7 10.4 2.41 39.0 91.4 25.6HA1 806 121 9.94 9.28 21.3 21.2 31.3 7.67 33.0 89.1 21.3HA2 783 112 4.94 3.64 16.1 14.7 25.0 4.97 1.75 26.4 75.6 14.3
JulyRK SUC CAF ACE CAR SUL PRO ATE MET TRI RAN LAB ACB DIL LOS VAL VER GEM FUR0.2 1010 91.6 4.32 16.9 28.9 7.4 1.65 34.5 78.0 17.87.6 1060 50.7 4.05 20.9 16.3 25.3 4.3 1.11 26.9 70.3 10.49.7 1240 56.7 4.53 31.3 16.3 24.2 3.7 1.05 30.1 65.3 16.911.3 1370 51.3 7.53 29.1 18.1 22.6 3.6 1.15 26.5 67.0 0.6412.7 1180 48.5 5.97 27.9 17.2 22.2 3.9 0.78 24.6 60.812.9 1110 53.8 5.60 21.8 16.1 20.9 2.8 0.64 23.9 59.019.3 1090 63.5 4.53 24.9 16.2 21.8 4.5 1.40 27.4 68.3 0.6222.5 1180 48.8 4.03 20.4 14.2 20.8 3.6 0.99 26.8 61.028.2 5730 93.3 49.0 314 12.5 269 330 101 11.9 69.7 7.72 55.9 485 999 10.3 269 13729.6 867 69.9 3.68 12.3 7.88 15.3 1.65 0.60 16.9 37.829.8 969 67.8 4.40 23.4 9.53 19.2 2.57 0.70 22.7 58.041.7 1230 52.0 3.50 16.9 10.7 15.5 1.83 19.9 39.341.8 7270 2270 171 60.6 337 16.5 189 323 63.7 29.1 137 5.14 66.4 585 1850 4.63 151 112
15

JulyRK SUC CAF ACE CAR SUL PRO ATE MET TRI RAN LAB ACB DIL LOS VAL VER GEM FUR42 1870 241 9.34 37.4 1.01 25.2 39.2 6.60 4.73 5.27 69.0 211 0.51 19.9
43.5 1190 82.2 24.5 2.76 14.9 11.6 13.1 1.46 17.3 34.544.3 1130 44.4 3.21 14.5 8.29 12.6 1.01 16.5 29.445.1 1180 47.6 2.63 18.1 9.36 13.6 1.30 16.9 31.745.2 1060 39.8 3.33 19.1 10.5 13.6 1.17 15.3 31.954.7 1150 56.1 2.80 17.5 8.54 13.7 1.09 16.6 30.857.9 1140 39.3 3.60 17.7 8.05 13.3 1.56 17.1 29.062 1020 38.7 4.12 19.0 6.83 13.7 14.7 25.1
62.8 1020 38.6 4.01 24.6 8.23 12.9 0.97 13.8 26.464.4 867 32.2 4.67 18.6 7.35 12.2 13.1 23.264.5 1060 38.3 6.32 25.6 9.59 16.5 0.45 17.4 28.2 0.7865.2 853 37.9 5.43 22.7 6.13 12.7 1.17 12.8 21.069.2 1240 86.9 5.64 22.8 3.58 14.5 13.8 22.470.8 954 36.6 4.73 17.3 4.18 10.9 9.59 16.474 949 38.2 6.05 21.2 6.17 11.4 9.75 14.3
84.5 1010 45.9 5.93 20.2 5.88 10.8 9.30 10.086.1 1000 41.2 5.72 18.6 2.72 10.6 10.2 10.186.9 807 40.4 5.23 22.0 2.55 11.0 9.67 8.5896.6 1220 49.1 4.28 19.6 2.72 8.81 8.68 4.6598.2 1110 38.1 4.57 18.1 1.17 9.94 9.42 5.41107 1040 41.2 4.01 16.6 3.60 8.17 8.62 4.59
109.4 1220 45.4 5.10 15.5 3.56 9.84 0.88 9.75 3.83120.7 996 41.9 5.12 14.0 2.20 8.74 0.97 8.89 2.74 0.82123.9 1130 44.2 4.40 15.2 2.94 9.57 8.33 3.17136 1320 47.0 5.84 15.9 3.44 10.7 0.99 10.5 5.23
136.8 1170 40.2 5.78 14.2 2.55 7.72 8.85 4.34141.6 1250 37.3 4.73 15.1 2.26 9.12 8.56 5.04148.1 1210 37.5 4.88 14.8 2.82 10.2 0.72 10.7 6.54148.2 1010
034.0 106 220 30.3 327 612 231 202 88.2 4.53 77.0 474 1180 18.8 457 291
148.4 1100 41.1 4.09 18.1 5.95 16.7 2.80 0.80 1.05 9.34 22.5 15.1
16

JulyRK SUC CAF ACE CAR SUL PRO ATE MET TRI RAN LAB ACB DIL LOS VAL VER GEM FUR
156.1 1400 41.8 6.36 17.3 4.18 12.1 1.09 11.5 6.01159.3 1310 47.9 8.72 19.8 3.62 12.6 1.13 13.5 6.09164.2 1400 51.6 7.22 17.4 5.08 14.1 1.89 13.1 9.67164.3 963 40.3 4.28 14.2 3.21 11.3 1.05 8.70 8.97165.8 1750 64.5 8.99 21.3 4.94 17.1 2.12 17.0 9.71174.6 1450 60.2 9.51 22.7 6.52 18.4 3.19 18.1 12.2181.9 1490 74.5 8.83 22.6 6.69 19.1 3.64 17.3 17.3182 1170 61.3 4.24 12.3 3.56 10.4 1.63 10.4 11.0
187.5 1560 92.7 10.3 27.0 10.0 24.5 4.57 0.72 18.6 21.8188.3 1570 87.8 10.2 21.2 8.09 22.6 4.90 0.74 21.0 21.0197.1 1600 104 12.6 6.93 21.4 8.97 23.2 5.02 1.15 19.7 21.9199.6 1400 107 7.18 15.6 7.94 23.2 4.49 1.11 20.7 20.2 12.0214 1600 94.3 7.74 22.5 0.43 10.4 27.9 5.12 1.58 24.9 22.5 12.6
220.5 1570 91.5 17.4 7.63 17.5 9.16 29.0 6.60 2.10 25.6 23.4 0.37 13.8222.1 1800 89.9 16.1 7.41 19.0 9.94 30.4 6.03 2.06 23.2 24.8 0.35 18.0228.5 1750 129 33.3 12.3 23.0 1.65 30.2 3.72 1.28 3.27 30.6 24.0 1.83232.6 1550 75.5 14.4 27.6 1.93 33.7 7.43 1.93 3.62 34.2 21.2 1.54235 1300 73.9 17.5 10.4 19.1 0.56 18.1 2.63 1.54 18.6 14.9 0.70
243.8 980 51.7 6.91 14.65 0.58 13.9 1.93 1.01 15.5 12.5 0.72245.4 766 33.7 7.10 16.89 0.58 13.9 3.02 1.23 11.7 9.92249.4 1980 79.2 16.8 27.6 0.25 4.67 18.0 2.14 0.86 23.2 24.8249.6 498 22.2 4.61 11.2 0.68 4.55 13.9 2.49 1.48 9.96 7.04
NYH IDGO1 1200 108 4.28 16.5 31.1 8.32 2.11 34.5 82.4 0.61ER1 1380 143 5.62 0.53 24.5 40.4 13.7 3.02 3.44 48.2 94.9 0.45 20.5NT1 1470 350 92.3 9.63 0.25 29.8 45.3 11.9 0.82 2.39 65.9 104 21.5NT2 1410 520 162 12.4 0.60 30.9 66.8 10.5 1.46 5.56 59.9 111 0.47 43.6ER2 1470 144 25.2 7.26 0.43 27.9 44.9 13.6 4.07 3.62 50.8 97.0 0.62 20.5HA1 1390 85.9 5.53 69.0 23.3 31.2 7.78 2.45 36.5 83.7 0.41 14.0HA2 1220 78.0 6.52 30.9 0.25 22.6 32.8 7.12 2.18 34.2 84.3 13.9
17
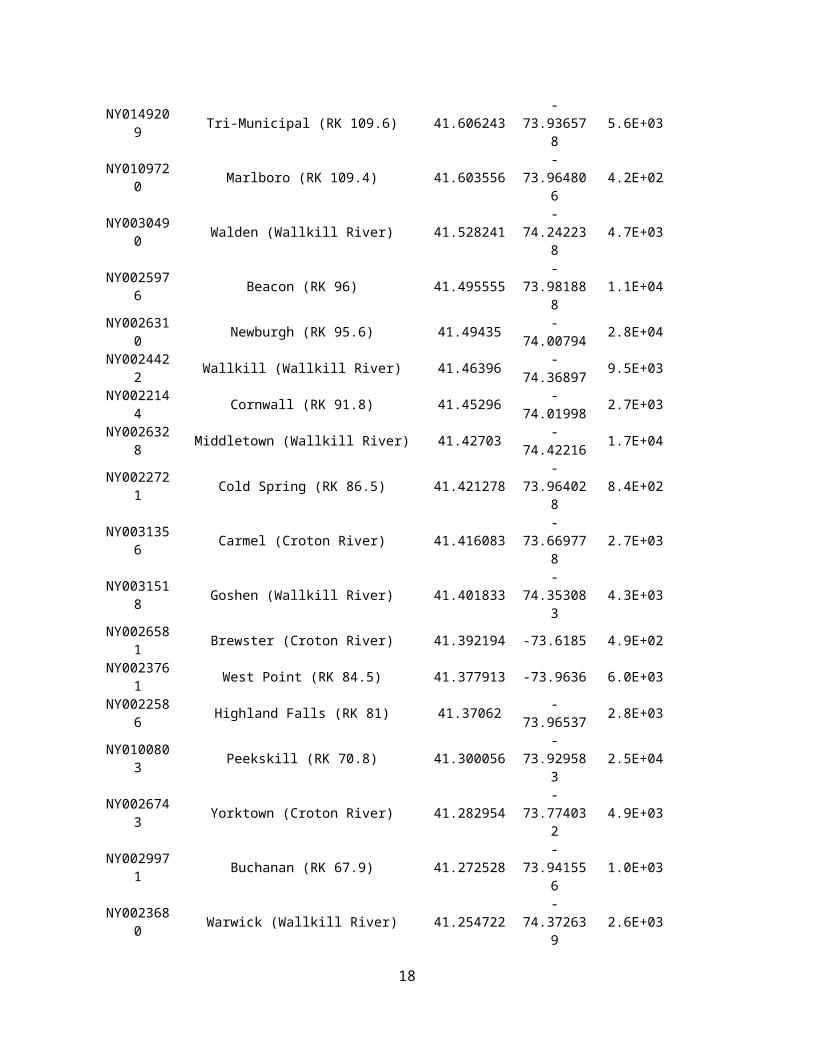
Table S9. Class, Log KOW, Log Kd, and pKas of pharmaceutical compounds
Class Compound Log Kd* Log KOW**pKa
(Strongest Acidic)***
pKa (Strongest Basic)***
Analgesic Acetaminophen 0.27 9.46 -4.4
Antibacterials Sulfamethoxazole 0.48 6.16 1.97Trimethoprim 1.78 0.73 17.33 7.16
Anticonvulsant Carbamazepine 1.61 2.25 15.96 -3.8
AntihypertensivesAngiotensin Losartan 4.01 7.4 4.12Receptor Antagonist Valsartan 3.65 4.37 -0.11
Beta blockers Acebutolol 1.19 13.91 9.57Atenolol 1.88 -0.03 14.08 9.67
Labetalol 2.41 8.05 9.8Metoprolol 1.99 1.69 14.09 9.67Propranolol 3.21 2.60 14.09 9.67
Calcium channel Diltiazem 2.45 2.79 12.86 8.18blockers Verapamil 3.81 4.80 9.68
Antilipemic Gemfibrozil 4.77 4.42 -4.8
Antiulcerative Ranitidine 2.26 0.29 8.08
Diuretic Furosemide 2.32 4.25 -1.5*Log Kds from Cantwell et al., 2016**Log KOWs from EPI Suite™ (U.S. Environmental Protection Agency)***pKas calculated by ChemAxon, as reported by DrugBank
18

Table S10. Comparison of detection frequencies and mean concentrations of select pharmaceuticals from the present study to Batt et al., 2016.
Compound
Batt et al., 2016 This study
Frequency of
Occurrence
Mean Concentration
(ng/L)
Frequency of
Occurrence
Mean Concentration
(ng/L)
Acetaminophen 6.0 3.3 34.0 11.6
Atenolol 48.4 9.2 96.5 25.7
Carbamazepine 40.7 12 100 11.8
Diltiazem 33.0 1.6 34.7 2.5
Furosemide 2.7 12.1 6.3 16.1
Gemfibrozil 14.8 3.2 33.3 26.1
Metoprolol 40.1 11.8 100 45.1
Propranolol 5.5 1.5 17.4 1.7
Ranitidine 3.8 3.5 6.9 10.9
Sulfamethoxazole 77.5 28.2 95.1 29.3
Trimethoprim 36.8 1.8 88.9 10.2
Valsartan 39.0 15.3 100 111
Verapamil 21.4 1.4 18.8 1.1
*for calculation of the mean, nondetects were replaced with MDLs
19

Table S11. Regressions of caffeine and sucralose against select pharmaceuticals.
Compound Caffeine SucraloseMay July May July
Valsartan 0.22 0.59 0.85 0.83Losartan 0.01 0.42 0.85 0.89Atenolol 0.04 0.15 0.82 0.90Sulfamethoxazole 0.14 0.43 0.80 0.79Carbamazepine 0.04 0.19 0.79 0.97Metoprolol 0.03 0.16 0.77 0.96Trimethoprim 0.05 0.05 0.77 0.89Average 0.08 0.28 0.81 0.89
20
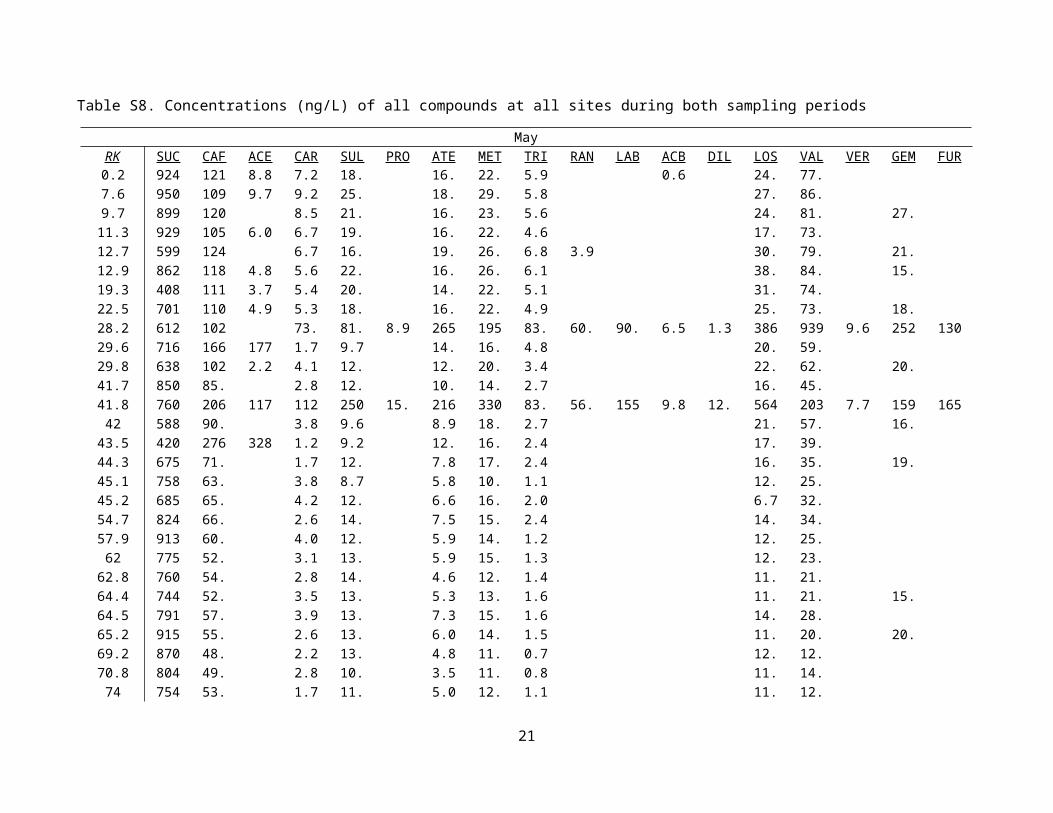
Figure S1. Water temperatures along the river transect for May and July
21

Figure S2. Salinity along the river transect for May and July
22

Figure S3. Caffeine-sucralose ratios along the river transect
23