arra’s experience in the identification of top research teams: ©arra, october 2011 ivan...
TRANSCRIPT

ARRAARRA’’s experience s experience in the identification in the identification
of top research teams:of top research teams:
©ARRA, October 2011©ARRA, October 2011
Ivan OstrovskIvan Ostrovský, Miroslav Medveď,ý, Miroslav Medveď, Ferdinand Devínsky, Juraj BartaFerdinand Devínsky, Juraj Barta
the the case study of case study of the the Slovak Academy of SciencesSlovak Academy of Sciences
IREG-5 ForumThe National Rankings on the Rise
Bratislava 10-11 October 2011Hosted by the Comenius University in Bratislava
CONCEPT:Fénix 2CONCEPT:Fénix 2
2
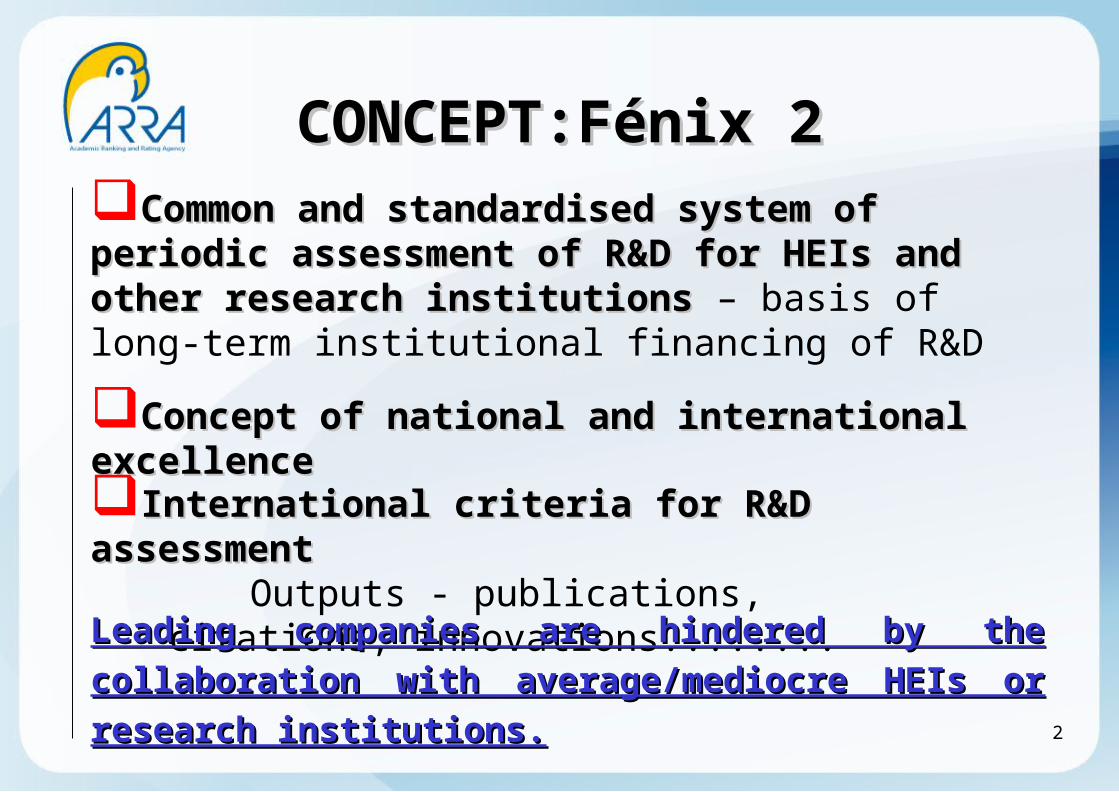
Common and standardised system of periodic Common and standardised system of periodic assessment of R&D for HEIs and other research assessment of R&D for HEIs and other research institutionsinstitutions – basis of long-term institutional financing of R&D
CConcept oncept of national and international excellenceof national and international excellence
International criteria for R&D assessmentInternational criteria for R&D assessment Outputs - publications, citations, innovations........
Leading companies are hindered by the collaboration Leading companies are hindered by the collaboration
with average/mediocre HEIs or research institutions.with average/mediocre HEIs or research institutions.

Main Goals of the ProjectMain Goals of the Project
SAS SAS asked for asked for the the identifiidentification ofcation of
top and at the same time top and at the same time prospective prospective research teamsresearch teams
3
3 critical questions to achieve the goal:3 critical questions to achieve the goal:
HowHow is is a a “research team”“research team” defined?defined?
When is the team classified as “top”?When is the team classified as “top”?
When When the the team team has has “good prospects”?“good prospects”?

PrinciplesPrinciples
TTeaeam m and Teamand Team LeaderLeader Top team should be led by a top leader (leaders); however, a top
researcher is not necessarily the leader of the top team
ComparisonComparison is correct and accurate among the SAS teams, but only in the same discipline/set of fields
NNoo K.O. K.O. criteria appliedcriteria applied, but complex assessment (not “blind” scientometry), with needs for: identifying the team’s main scientific field deciding whether a particular researcher is a member of the team or
not assessing criteria in the context
4

Number of Articles (author)
> 10% of co-operative articlesFyzio-VascDisOrd Kristek Cacanyiova Torok Cebova Zemancikova Malekova
František Kristek 27 15/56 4/15 10/37
Soňa Čačányiová (Kyselá) 15/94 16 3/19
Jozef Török 4/40 10 4/40 3/30
Martina Cebová 10/77 3/23 4/31 13
Anna Zemančíková 3/100 3
Magdaléna Maleková 5
Teams’ identificationTeams’ identification
Fyzio-VascDisOrd Kristek Cacanyiova Torok Cebova Zemancikova Malekova
František Kristek
Soňa Čačányiová (Kyselá)
Jozef Török
Martina Cebová
Anna Zemančíková
Magdaléna Maleková
Fyzio-VascDisOrd Kristek Cacanyiova Torok Cebova Zemancikova Malekova
František Kristek 27 15/56 4/15 10/37
Soňa Čačányiová (Kyselá) 15/94 16 3/19
Jozef Török 4/40 10 4/40 3/30
Martina Cebová 10/77 3/23 4/31 13
Anna Zemančíková 3/100 3
Magdaléna Maleková
Primary listPrimary list: : SAS’s formal division (institutes/departments) SAS’s formal division (institutes/departments)
> 30% of co-operative articles
> 60% of co-operative articles
Level and degree of mutual collaboration Level and degree of mutual collaboration AutAuthhor(or(ss), ), with whomwith whom the other team membersthe other team members have the highesthave the highest % % of collaboration, are considered as team leadersof collaboration, are considered as team leaders Team Team ‘Core’ a‘Core’ andnd ‘ ‘NNon-core’on-core’ members members Collaboration outside the institute/department, or outside Collaboration outside the institute/department, or outside SASASS
ABCDEFGH
IJKL
AB CD EF GH IJ KLPHYSIOLOGY

SAS structureSAS structure
6
SLOVAK ACADEMY OF SCIENCESSLOVAK ACADEMY OF SCIENCES
PHYSICAL, SPACE, EARTH, AND
ENGINEERING SCIENCES
LIFE, CHEMICAL,MEDICAL,
AND ENVIRONMENTAL SCIENCES
SOCIAL SCIENCES, HUMANITIES, ARTS
AND CULTURE
SECTION 1 SECTION 2 SECTION 3

FirstFirst ““filterfilter””
In Sections 1 and 2 - more than 200 teams were identifiedIn Sections 1 and 2 - more than 200 teams were identified
First selection criteria: (First selection criteria: (who is definitely who is definitely NOT in the TOPNOT in the TOP))
Team leader has less than 10 WoK Articles since 2006Team leader has less than 10 WoK Articles since 2006
Team leader/most members have at most a part-time (no more Team leader/most members have at most a part-time (no more
than 50%) contract with SASthan 50%) contract with SAS
Modified H-index for particular scientific field (ModH) is lower Modified H-index for particular scientific field (ModH) is lower
than 15than 15
Borderline cases were also evaluatedBorderline cases were also evaluated
63 teams matched these criteria63 teams matched these criteria 7

BasicBasic PPrincrinciplesiples Time scaleTime scale – 2001 – 2001 to 2010 to 2010 9 9 stepssteps to teams assessmentto teams assessment – n – noo K.O. K.O. criteriacriteria Steps Steps 1-2 1-2 focus on individual team membersfocus on individual team members – – their overall their overall
performanceperformance a andnd the the contribution to the quality of the teamcontribution to the quality of the team Steps Steps 3-5 3-5 focus on the team’s focus on the team’s performanceperformance – quantity, quality – quantity, quality
aandnd the the efeffectiveness of published papersfectiveness of published papers Steps 6-8 assess team’s exceptional articles and their relative Steps 6-8 assess team’s exceptional articles and their relative
impact impact Step 9 describes the progress of the team during Step 9 describes the progress of the team during the the
evaluated periodevaluated period All comparisons were done against international benchmarks All comparisons were done against international benchmarks ‘ ‘Avg citation per article’ was also compared with the world’s Avg citation per article’ was also compared with the world’s
best 35 universities (top 25 from: ARWU, best 35 universities (top 25 from: ARWU, QSQS, TimesHE), TimesHE) 8

AnorChem-TeoChem Art Cit Cit/Art H-index DoB Age PhD 1st Art ActiveResm-quotientFTEM OL [100] 70 3663 52,33 28 1956 55 1998 1990 27 1,04 100MVG [100] 73 3526 48,30 28 1956 55 1990 1979 21 1,33 100N J [53] 88 4856 55,18 30 1955 56 1995 1980 16 1,88 67,1KO S [100] 8 53 6,63 4 1982 29 2009 2006 2 2,00 53,3KE S [100] 8 144 18,00 6 1981 30 2009 2003 2 3,00 63,3RE M [0] 10 74 7,40 5 1981 30 2009 2004 2 2,50 55,8HO P [0] 16 160 10,00 9 1981 30 2008 2001 3 3,00 43,3 PA A [100] 1 1 1,00 1 1985 26 2010 1 1,00 13,3MA E [outside SAV] 3 15 5,00 2 2006 5 0,40 KA M [outside SAV] 188 4941 26,28 36 1990 21 1,71
H-index 01-11 (Lead) 21
Art 01-10 Cit 01-10 Cit/Art 01-10W Avg Cit/ArtT/World BestUni ACAT/BestUniAvgCoAuthUnCit H-index 01-11 (Rest w/Lead) 9
63 1088 17,27 10,74 1,61 19,41 0,89 4,5 8 H-index 01-11 (Rest w/o Lead) 2
.1st Percentile 1st Percentile1st Decile2nd DecileAvg% 03-10H-index 01-10ModH 2 Angew. Chem. Int. Edit. 0 0 18 14 30,9 21 17 2 J. Am. Chem. Soc.
Art% Proc% Rev% 17 J. Chem. Phys. 33,17 26,46 12,59 1 J. Chem. Theor. Comput.
4Art Cit Cit/Art W Avg Cit/ArtT/World
2001 7 175 25,00 17,62 1,422002 8 251 31,38 17,61 1,782003 7 122 17,43 16,07 1,082004 4 71 17,75 14,88 1,192005 10 178 17,80 13,09 1,362006 6 100 16,67 10,57 1,582007 6 54 9,00 8,35 1,082008 4 97 24,25 5,79 4,192009 5 31 6,20 2,98 2,082010 6 9 1,50 0,44 3,412011 3 0,002001-2010 63 1088 17,27 10,74 1,61
Phys. Chem. Chem. Phys.
26Top 5 Journals
0,00
0,50
1,00
1,50
2,00
2,50
3,00
3,50
4,00
4,50
2001
2002
2003
2004
2005
2006
2007
2008
2009
2010

Collected data were assessed according to four main
criteria: publication productivity (quantity of outputs)publication productivity (quantity of outputs), , total influence (no. of citations, H-index)total influence (no. of citations, H-index), , efeffectiveness (avg cit/art, uncited articles)fectiveness (avg cit/art, uncited articles),, relatrelatiivvee impa impacctt (top papers, 1 (top papers, 1stst percentile/decile) percentile/decile)
Each of the abovementioned information is important for Each of the abovementioned information is important for different aspect of the research evaluationdifferent aspect of the research evaluation
Data evaluationData evaluation
10

22 top teams were identified
Only Sections Only Sections 1 a1 andnd 2 2 are presented here are presented here
Section 3 (SSH) has different publication patterns (more on Section 3 (SSH) has different publication patterns (more on
Slide 13)Slide 13)
17 above-average teams were detected
Several “top-teams” criteria were not metSeveral “top-teams” criteria were not met
SumSummary 1mary 1
11

SumSummary 2mary 2
from from 118800 00 assessed researchers in Sections assessed researchers in Sections 1 a1 andnd 2 2, , ~ 1000 are~ 1000 are members of some teammembers of some team
questionnairequestionnaire sent tosent to 63 t 63 teams,eams, covering some covering some ~ 400 researchers
870 researchers do not belong to any team
580 researchers do not belong to top or above-average teams

The majority are individual researchers (occasional pairs)The majority are individual researchers (occasional pairs)
eveneven the the review of mutual citationsreview of mutual citations hashas led to the same data led to the same data
PProblroblemsems with the performance evaluation usingwith the performance evaluation using WoK, WoK,
InCites, ESI – InCites, ESI – due to the due to the lack of datalack of data regarding regarding SASAS SSH S SSH
fields fields ((exceptexcept for for several individuals within Psychology and several individuals within Psychology and
Economics,Economics, none with H>none with H>2)2)
Additional sources from SAS LibraryAdditional sources from SAS Library
Lack ofLack of proper proper scientometricscientometric data data ( (averageaverage percentile, etc.) percentile, etc.)
NNon-on-existexistinging benchmark benchmarkss ( (no systematic information about no systematic information about
works and citations outside main databasesworks and citations outside main databases))
Section 3 (SSH)Section 3 (SSH)
13

Social SciencesSocial Sciences in the world in the world,, regionregion a andnd Sl Slovovakiaakia
1994 SVK CZE HUN
2011 Art Cit top1
top10
Art Cit top1
top10
Art Cit top1
top10
Econ 1264 770 22 9 2927 2665 123 30 1033 2682 230 45
Psy 836 1608 41 23 1686 5941 383 72 1447 12442 466 132
2001-2010 World The most cited Article
100th most cited Article
Economics 883 239
Social Sciences 620 214
Psychology/Psychiatry 2037 399
Matematics 2280 144
Technical Sciences 1822 288
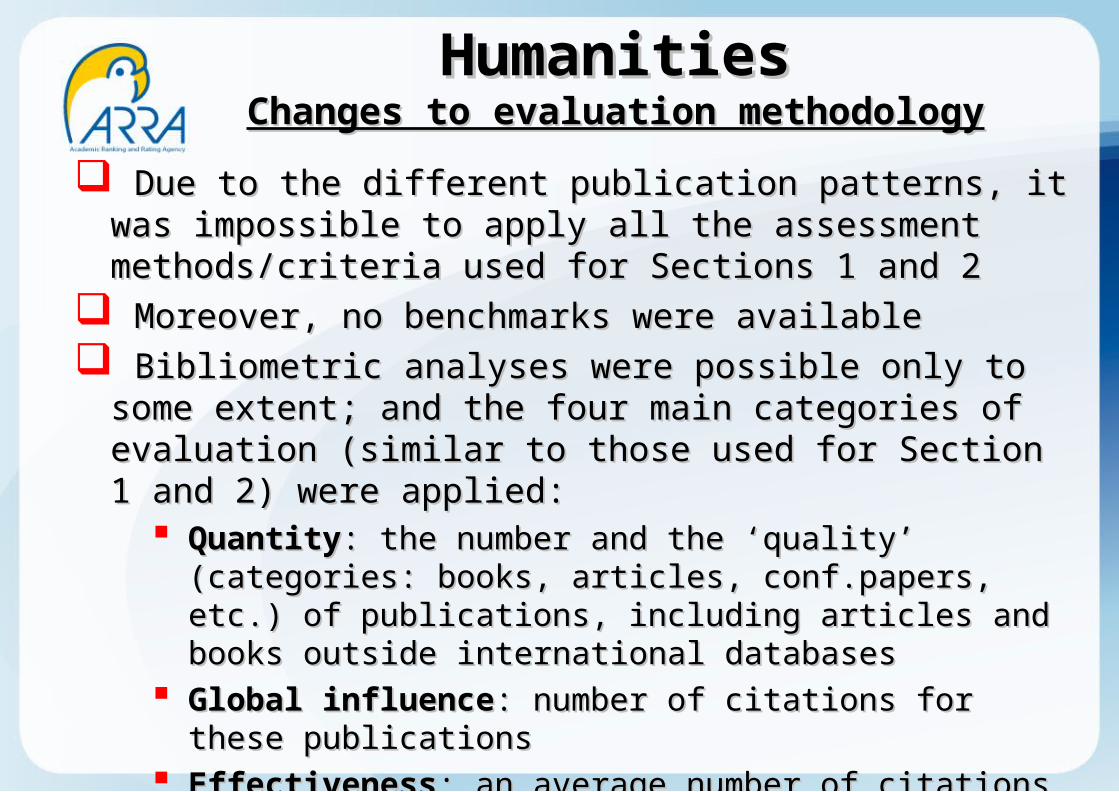
Due to the different publication patterns, it was impossible to Due to the different publication patterns, it was impossible to apply all the assessmentapply all the assessment methods/criteria used for Sections 1 methods/criteria used for Sections 1 and 2and 2
Moreover, no benchmarks were availableMoreover, no benchmarks were available BBibliometric analibliometric analysesyses were possible only to some extent; and were possible only to some extent; and
the four main categories of evaluation (similar to those used for the four main categories of evaluation (similar to those used for Section 1 and 2) were applied:Section 1 and 2) were applied:
QuantityQuantity: : the the number andnumber and the the ‘‘qualityquality’ (’ (categories: books, categories: books, articles, conf.papers, etc.articles, conf.papers, etc.)) of publications, of publications, includingincluding articles and articles and books outside international databasesbooks outside international databases
Global influenceGlobal influence: : number of citationsnumber of citations for these publicationsfor these publications EfEffectivenessfectiveness: : an average number of citations per publicationan average number of citations per publication RelatRelatiivvee impa impacctt: : publicationspublications ci cited more thanted more than 110/20/50/100 0/20/50/100
timestimes ( (roughrough e equiquivalent valent of papers inof papers in 20/10/1/0.1/.01 percentile) 20/10/1/0.1/.01 percentile)
HumaHumanitiesnitiesChanges to evaluation methodologyChanges to evaluation methodology
16
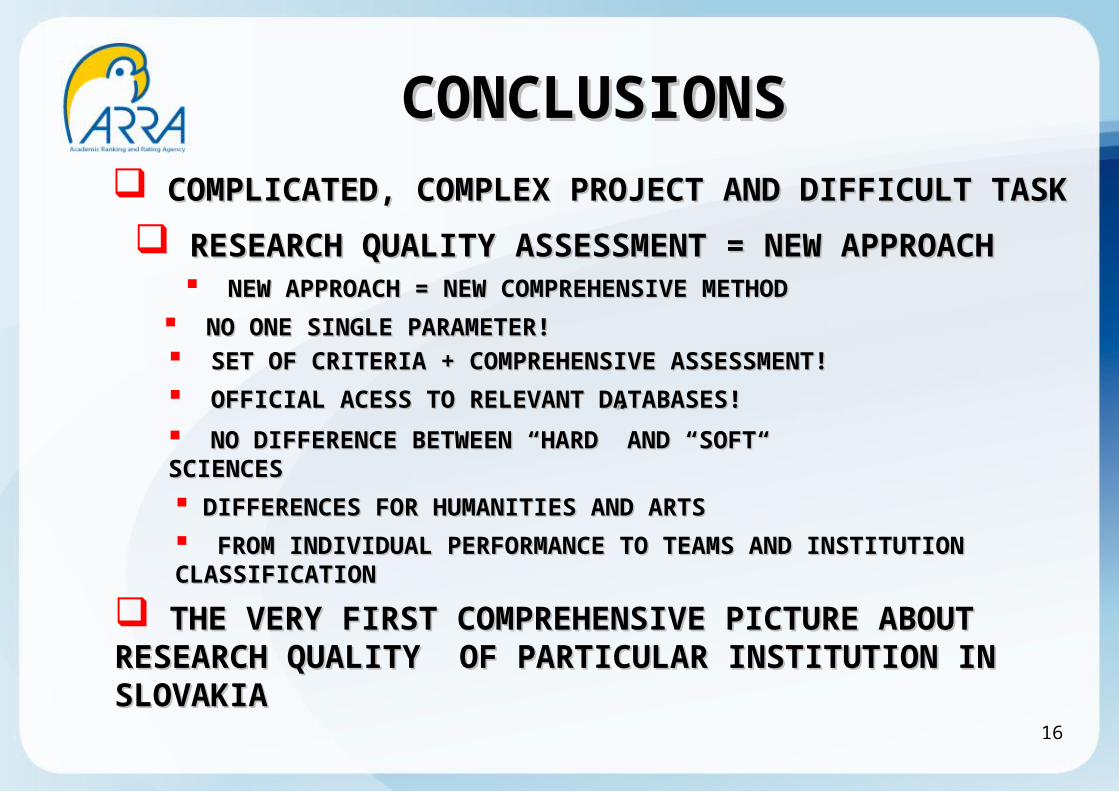
CONCLUSIONSCONCLUSIONS COMPLICATED, COMPLEX PROJECT AND DIFFICULT TASK COMPLICATED, COMPLEX PROJECT AND DIFFICULT TASK
NO ONE SINGLE PARAMETER! NO ONE SINGLE PARAMETER! SET OF CRITERIA + COMPREHENSIVE ASSESSMENT! SET OF CRITERIA + COMPREHENSIVE ASSESSMENT!
NO DIFFERENCE BETWEEN “HARD” AND “SOFT“ NO DIFFERENCE BETWEEN “HARD” AND “SOFT“ SCIENCESSCIENCES
RESEARCH QUALITY ASSESSMENTRESEARCH QUALITY ASSESSMENT = NEW APPROACH = NEW APPROACH
OFFICIAL ACESS TO RELEVANT DATABASES! OFFICIAL ACESS TO RELEVANT DATABASES!
DIFFERENCES FOR HUMANITIES AND ARTSDIFFERENCES FOR HUMANITIES AND ARTS
THE VERY FIRST COMPREHENSIVE PICTURE ABOUT THE VERY FIRST COMPREHENSIVE PICTURE ABOUT RESEARCH QUALITY OF PARTICULAR INSTITUTION IN RESEARCH QUALITY OF PARTICULAR INSTITUTION IN SLOVAKIA SLOVAKIA
NNEW APPROACH = NEW COMPREHENSIVE METHODEW APPROACH = NEW COMPREHENSIVE METHOD
FROM INDIVIDUAL PERFORMANCE TO TEAMS AND INSTITUTION FROM INDIVIDUAL PERFORMANCE TO TEAMS AND INSTITUTION CLASSIFICATIONCLASSIFICATION

17
CONCLUSIONSCONCLUSIONS
“ “THAT IS ONLY A FIRST AND THAT IS ONLY A FIRST AND
SMALL STEP FOR ONE SLOVAK SMALL STEP FOR ONE SLOVAK
RESEARCH INSTITUTION BUT A RESEARCH INSTITUTION BUT A
HUGE LEAP FOR MEASURING HUGE LEAP FOR MEASURING
THE RESEARCH PERFORMANCE THE RESEARCH PERFORMANCE
OF THE SLOVAK RESEARCH!”OF THE SLOVAK RESEARCH!”


Final list of teamsFinal list of teams
The fThe fininalal list of teamslist of teams contains following contains following informinformation:ation:
Name of the instituteName of the institute//departmentdepartment, , where the majority of where the majority of team membersteam members are basedare based
Team collaboration within Team collaboration within SASASS ( (with with other other departmentsdepartments))
FTE of each team memberFTE of each team member Team Leader(s) Team Leader(s) ((including their including their H-index)H-index) ‘‘CCore’/ ‘ore’/ ‘NNon-core’ ton-core’ teaeamm members members Team members outside Team members outside SASASS ( (if if such such existexist))
19
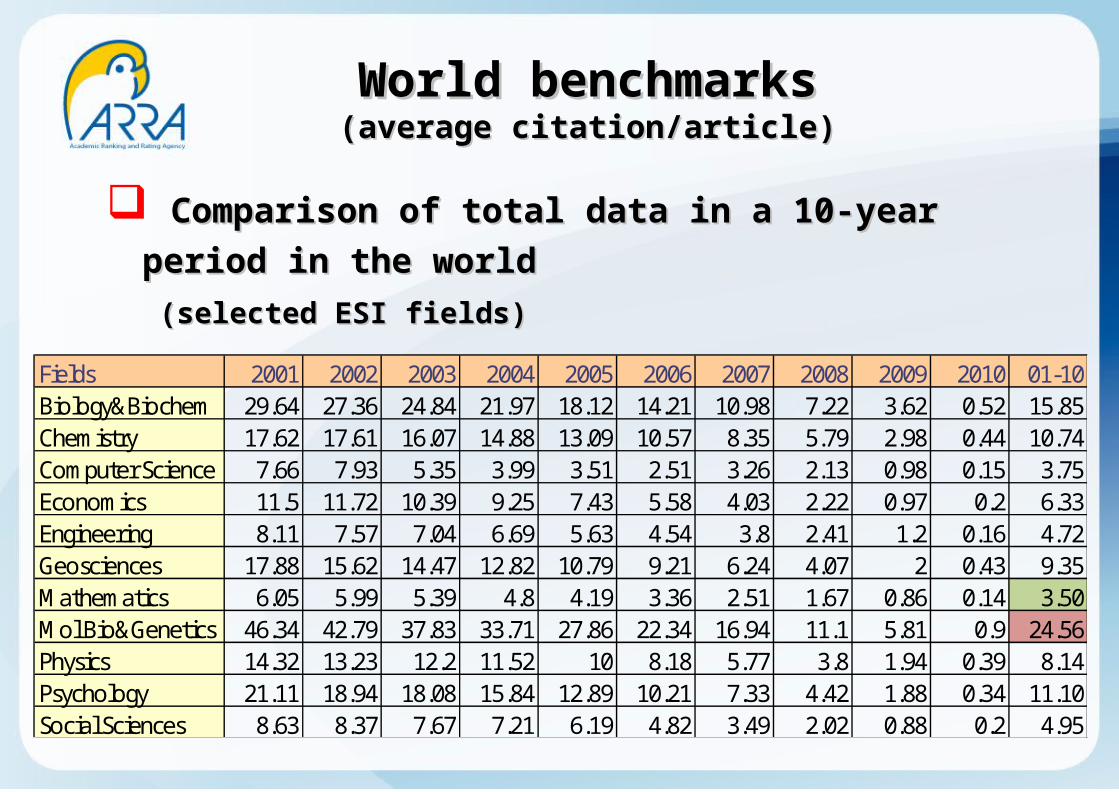
Comparison of total dataComparison of total data in a in a 1010--year periodyear period in the in the
world world
((selectedselected ESI ESI fieldsfields))
WorldWorld benchmark benchmarkss((averageaverage cit citation/articleation/article))
Fields 2001 2002 2003 2004 2005 2006 2007 2008 2009 2010 01-10Biology&Biochem 29.64 27.36 24.84 21.97 18.12 14.21 10.98 7.22 3.62 0.52 15.85Chemistry 17.62 17.61 16.07 14.88 13.09 10.57 8.35 5.79 2.98 0.44 10.74Computer Science 7.66 7.93 5.35 3.99 3.51 2.51 3.26 2.13 0.98 0.15 3.75Economics 11.5 11.72 10.39 9.25 7.43 5.58 4.03 2.22 0.97 0.2 6.33Engineering 8.11 7.57 7.04 6.69 5.63 4.54 3.8 2.41 1.2 0.16 4.72Geosciences 17.88 15.62 14.47 12.82 10.79 9.21 6.24 4.07 2 0.43 9.35Mathematics 6.05 5.99 5.39 4.8 4.19 3.36 2.51 1.67 0.86 0.14 3.50Mol Bio&Genetics 46.34 42.79 37.83 33.71 27.86 22.34 16.94 11.1 5.81 0.9 24.56Physics 14.32 13.23 12.2 11.52 10 8.18 5.77 3.8 1.94 0.39 8.14Psychology 21.11 18.94 18.08 15.84 12.89 10.21 7.33 4.42 1.88 0.34 11.10Social Sciences 8.63 8.37 7.67 7.21 6.19 4.82 3.49 2.02 0.88 0.2 4.95

No. of articles with the top citation rates in No. of articles with the top citation rates in a particular field,a particular field, in the last in the last 1010 years years
((ESI ESI classifications)classifications)
WorldWorld benchmark benchmarkss(top percentile)(top percentile)
Physics 2000 2001 2002 2003 2004 2005 2006 2007 2008 2009 20100.01% 1427 1377 1041 966 671 717 630 336 348 244 370.10% 517 462 395 348 313 248 192 143 103 70 151.00% 148 139 121 109 100 82 66 51 36 19 6
10.00% 36 33 31 29 27 24 20 14 10 5 220.00% 20 19 18 17 16 14 12 9 6 3 150.00% 6 6 6 5 5 5 4 3 2 1 0

SumSummary 2 (chart) mary 2 (chart)
from from 119900 00 assessed researchers in Sections assessed researchers in Sections 1 a1 andnd 2 2, , ~ 1000 are~ 1000 are members of some teammembers of some team
questionnairequestionnaire sent tosent to 63 t 63 teamseams ~ 400 researchers
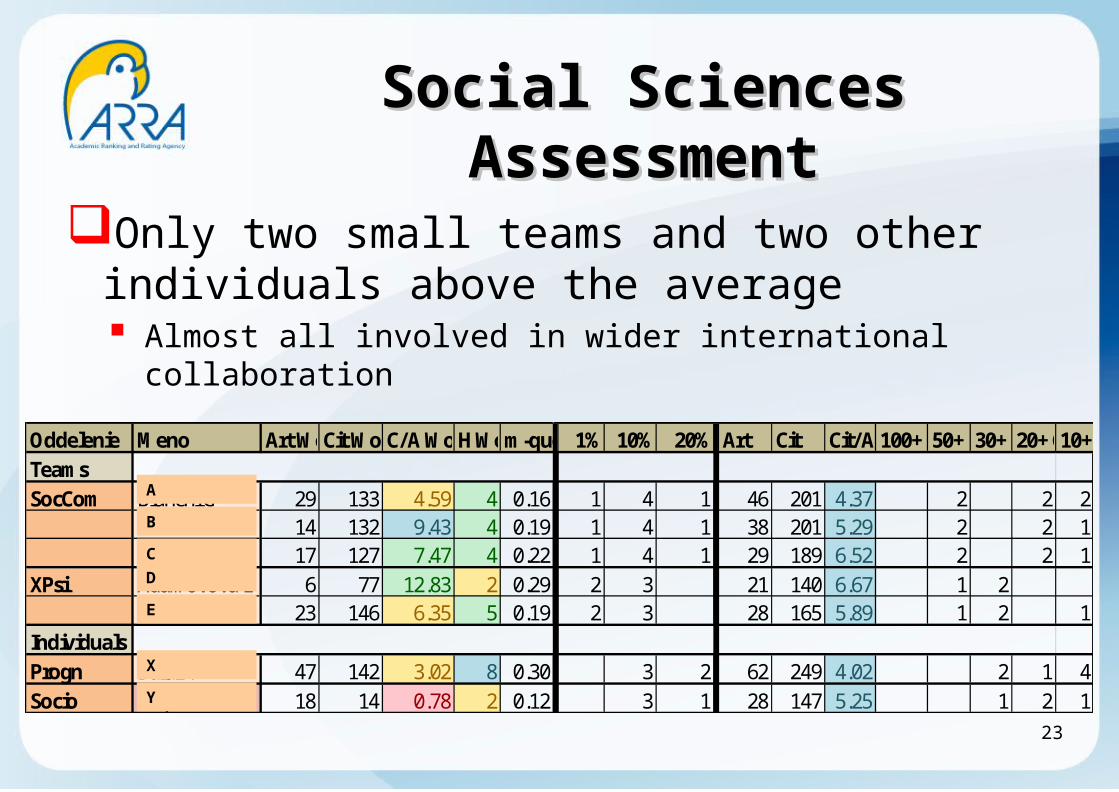
Social Sciences AssessmentSocial Sciences Assessment
Oddelenie Meno Art WoSCit WoSC/A WoSH WoSm-quotient1% 10% 20% Art Cit Cit/Art100+ Cit50+ Cit30+ Cit20+ Cit10+ CitTeamsSocCom Bianchi G 29 133 4.59 4 0.16 1 4 1 46 201 4.37 2 2 2
Luksik I 14 132 9.43 4 0.19 1 4 1 38 201 5.29 2 2 1Popper M 17 127 7.47 4 0.22 1 4 1 29 189 6.52 2 2 1
XPsi Adamovova L 6 77 12.83 2 0.29 2 3 21 140 6.67 1 2Fickova E 23 146 6.35 5 0.19 2 3 28 165 5.89 1 2 1
IndividualsProgn Balaz V 47 142 3.02 8 0.30 3 2 62 249 4.02 2 1 4Socio Gajdos P 18 14 0.78 2 0.12 3 1 28 147 5.25 1 2 1
23
Only two small teams and two other individuals above the average Almost all involved in wider international collaboration
A
B
C
D
E
X
Y