arr essentials - australian water school
TRANSCRIPT

ARR Essentials Mark Babister, Monique Retallick

Acknowledgements
• Bill Weeks
• Rory Nathan
• Peter Coombes
• Steve Rosso

Outline
• Introduction, course layout
• Fundamental issues
• Approaches
• Data
• Risk based design
• Climate Change
• Questions

Course Outline

What to expect from the 8 sessions
• Practical advice
• How to guide to ARR
• Worked examples


Rainfall Design Inputs• Pre-burst • how to select which
temporal pattern to use• Areal reduction factors • Spatially distributing
rainfall

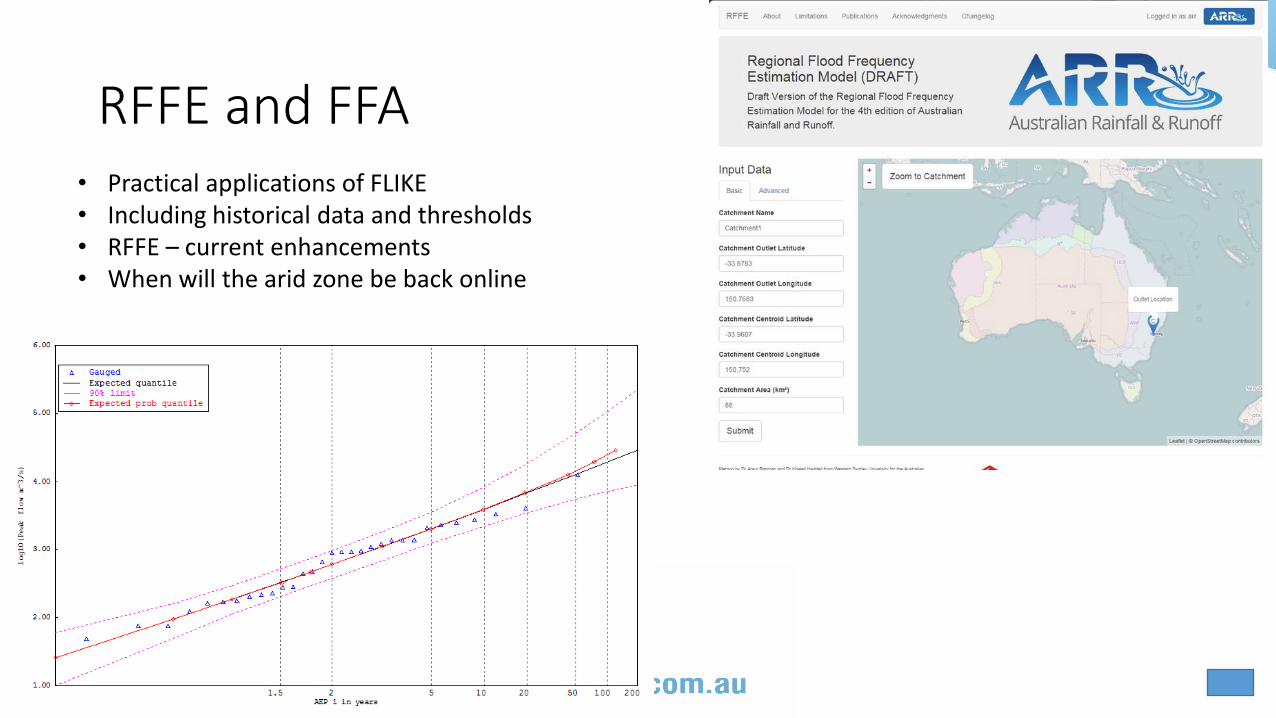
RFFE and FFA • Practical applications of FLIKE• Including historical data and thresholds • RFFE – current enhancements • When will the arid zone be back online


Hydrologic modelling applications• Worked example from design inputs to design flows


Flood Hydraulics
• A practical blockage example and its application • Hazard• Bridges

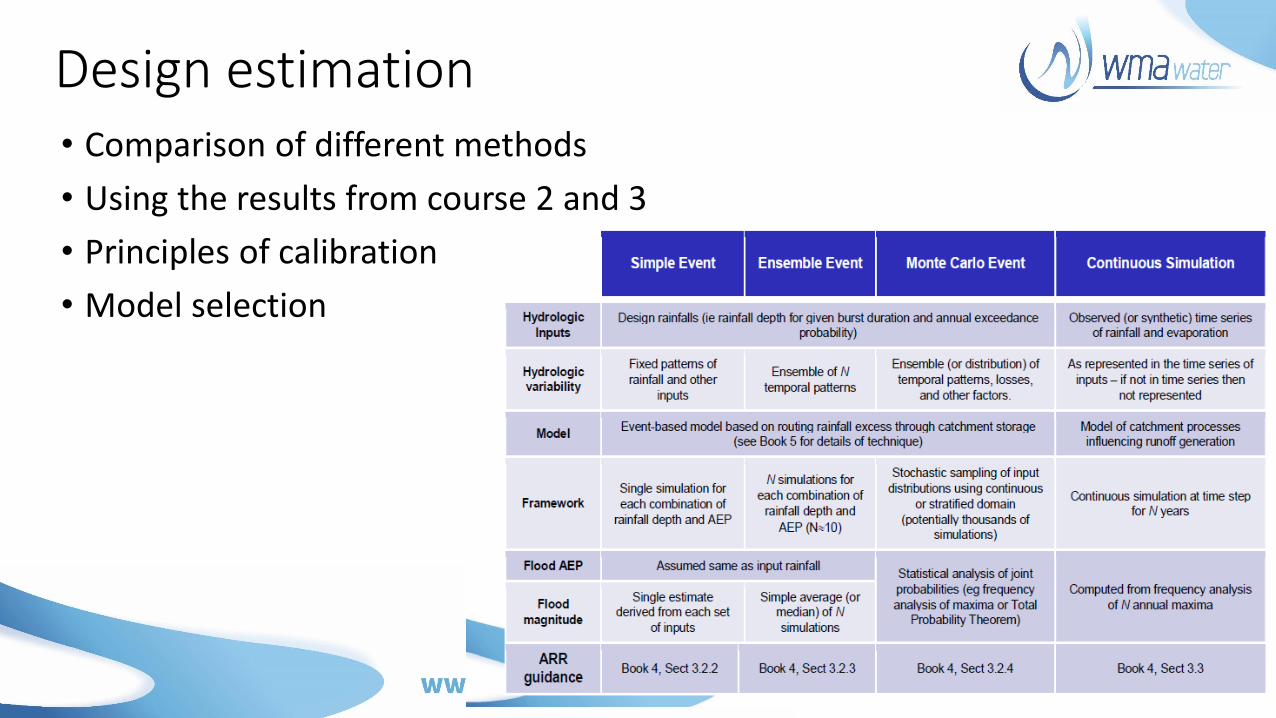
Design estimation• Comparison of different methods
• Using the results from course 2 and 3
• Principles of calibration
• Model selection

Extreme Events• understanding of how extreme rainfalls are derived• how to derive extreme rainfall forapplications including the sizing of spillways for large dams and design of major structures in flood risk areas• what temporal patterns to use with rare rainfall• Correct PMF Terminology


Urban approaches
• Urban theory


Urban Flood Modelling • Hands on worked example
• Direct rainfall

Those dates again…

• 1958 (version 1)
• 1977 (version 2)
• 1987 (version 3)
• 1999 (version 3.1 update for extreme floods)
• 2016/2019 (version 4)
History
23

Big Changes In Practice
• Ensemble and Monte Carlo approaches to better capture variability
• Move away from simple burst approaches
• Less reliance on the rational method
• RFFE method
• Incorporation of Climate change
• Incorporation of blockage of hydraulic structures
24

Key changes in ARR design inputs
25

• How we use probability terms.
• Difference between design and actual events.
• Uncertainty.
ARR 2019 Changes to Terminology

• Probability concepts are fundamental to the flood estimation
problem.
• Effective communication of the concepts is essential for
understanding and acceptance.
• Concerns with terminology cover.
• Clarity of meaning.
• Technical correctness.
• Practicality and acceptability.
Terminology
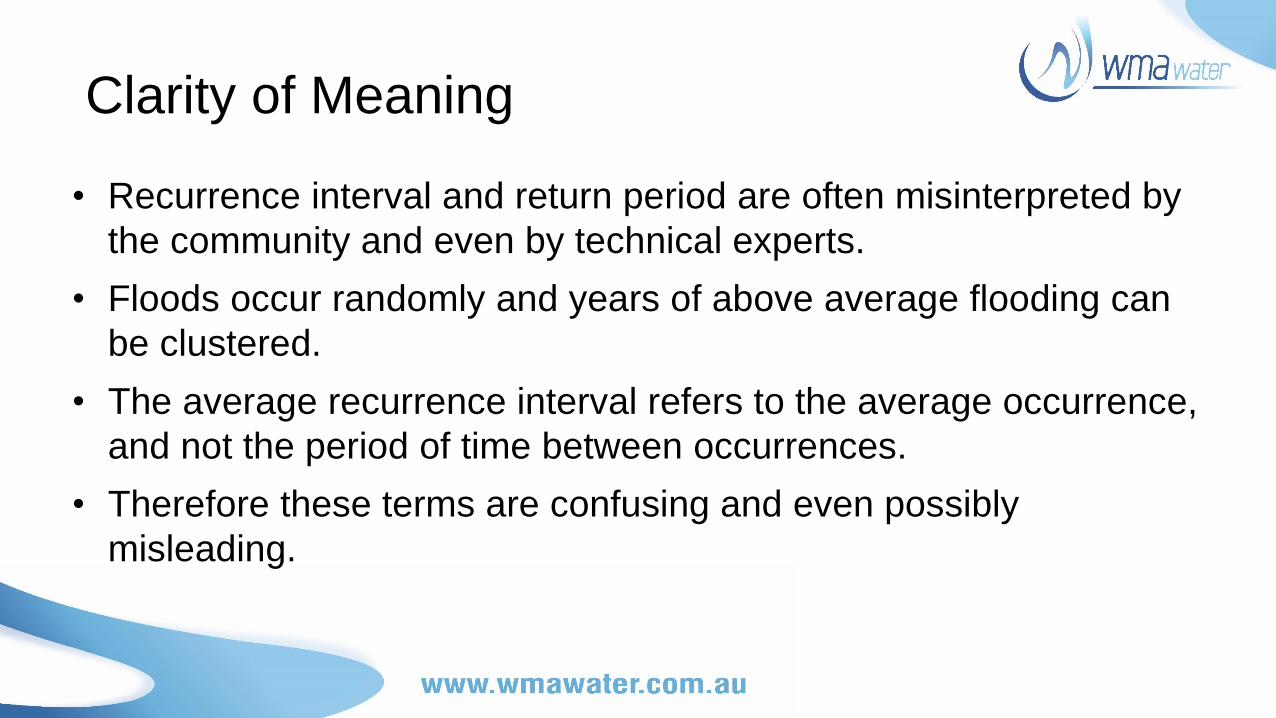
• Recurrence interval and return period are often misinterpreted by
the community and even by technical experts.
• Floods occur randomly and years of above average flooding can
be clustered.
• The average recurrence interval refers to the average occurrence,
and not the period of time between occurrences.
• Therefore these terms are confusing and even possibly
misleading.
Clarity of Meaning

• Average Recurrence Interval (ARI) no longer recommended.
• Use Annual Exceedance Probability (AEP).
• Exceedances per Year (EY) for frequent events to deal with seasonality.
• Correct 1 in X AEP not 1 in X years AEP
Terminology
Use of more recent methods and information
• In development of this guidance, it was recognised that knowledge and information availability is not fixed and that future research and applications will develop new techniques and information. This is particularly relevant in applications where techniques have been extrapolated from the region of their development to other regions and where efforts should be made to reduce large uncertainties in current estimates of design flood characteristics.
• Therefore, where circumstances warrant, designers have a duty to use other procedures and design information more appropriate for their design flood problem. The authorship team of this edition of Australian Rainfall and Runoff believe that the use of new or improved procedures should be encouraged, especially where these are more appropriate than the methods described in this publication.

Frequency Descriptors & Uncertainty
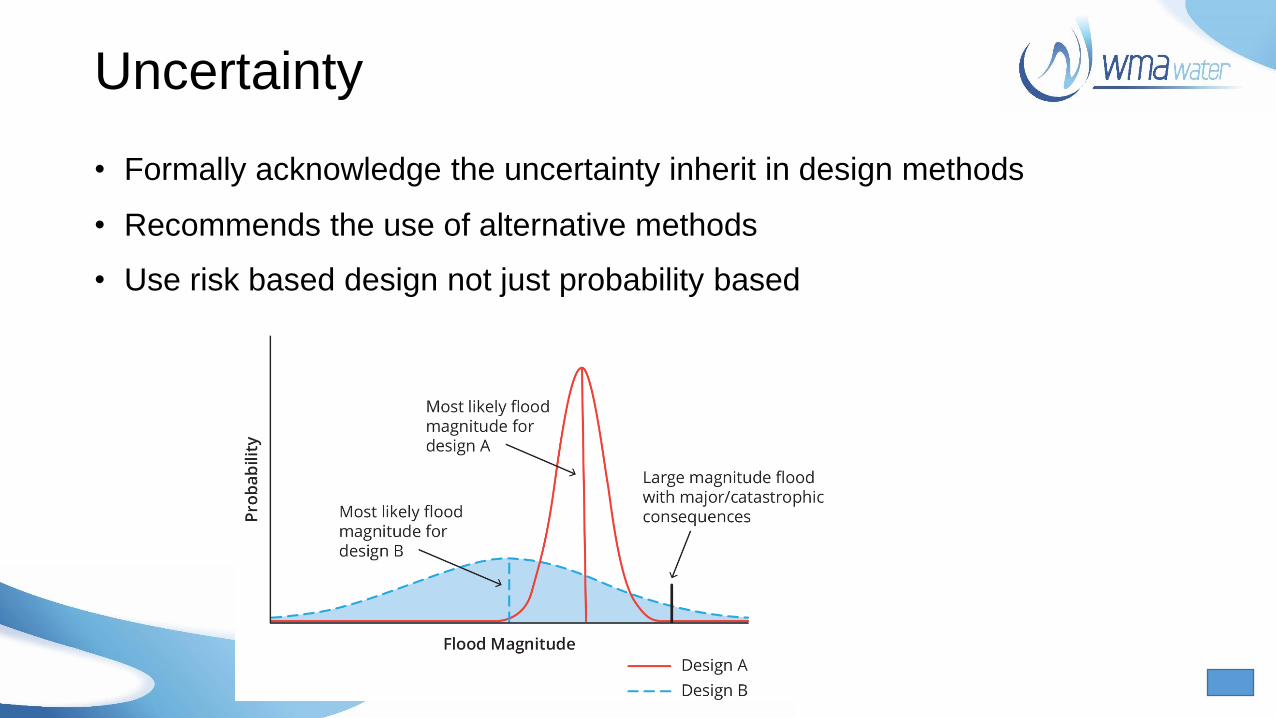
• Formally acknowledge the uncertainty inherit in design methods
• Recommends the use of alternative methods
• Use risk based design not just probability based
Uncertainty

Update Of Existing Studies
• With the publication of ARR 2019, do existing studies need to be
updated (immediately)?
• Not necessarily.
• This is particularly the case where flood frequency analysis has
been used and where there is adequate calibration data.
• Results from ARR 2019 should be more reliable and defensible
than those that have used ARR 1987.
• Each case should be reviewed however to confirm the expected
changes.

Approaches • Two main classes of estimation
methods:
• Flood-data based
• Rainfall based
• Each class of methods has variety of approaches
• ARR Book 1 Ch 3 describes which method is best suited for which purpose

The Nature Of The Problem
Possible flood peaks resulting from rainfall of a given AEP

• Possible flood peaks resulting from rainfall of a given AEP
• Wide range due to variation in antecedent conditions, losses, temporal patterns, spatial patterns
1% rainfall could yield a flood between 400 and 2000 m³/s
The Nature Of The Problem

• Possible flood peaks resulting from rainfall of a given AEP
• Wide range due to variation in antecedent conditions, losses, temporal patterns, spatial patterns
1% rainfall could yield a flood between 400 and 2000 m³/s
1000 m³/s flood could result from an rainfall AEP that ranges between
1 in 5 to 1 in 1000
The Nature Of The Problem

• Possible flood peaks resulting from rainfall of a given AEP
• Wide range due to variation in antecedent conditions, losses, temporal patterns, spatial patterns
• Annual flood maxima from gauged record
The Nature Of The Problem

• Possible flood peaks resulting from rainfall of a given AEP
• Wide range due to variation in antecedent conditions, losses, temporal patterns, spatial patterns
• Annual flood maximafrom gauged record
• Best estimate of probability model fitted to annual maxima .. with confidence limits
The Nature Of The Problem

Basic Approaches
• Flood data based procedures (Book 3)
• Partial series analysis (Book 3, Ch 2)
• At-site frequency analysis (Book 3, Ch 2)
• Regional flood procedures (Book 3, Ch 3)
• Rainfall based procedures (Books 4, 5)
• Event-based simulation (Book 4, Ch 3)
• Simple design event, ensemble, Monte Carlo
• Continuous simulation (Book 4, Ch 3.3)

Sampling of Maxima

AEP
Flood
Peak
(typically a
log scale)
Selected maxima
(PoT or AnnMax)
Fitting A Distribution

Fitted 2-param distribution
(log-Normal, Gumbel)
Quantile
Exceedance
Probability (eg 1% AEP)
Fitting A Distribution
Flood
Peak
(typically a
log scale)
AEP
Selected maxima
(PoT or AnnMax)

Fitted 3-param distribution(GEV, LPIII)
Fitting A Distribution
Flood
Peak
(typically a
log scale)
Quantile
AEP
Selected maxima
(PoT or AnnMax)
Fitted 2-param distribution
(log-Normal, Gumbel)
Exceedance
Probability (eg 1% AEP)
Extrapolation rule of
thumb: limit extrapolation
to twice record length

Rainfall-based Methods
Rainfall (infilled and distributed in time and space over whole catchment) – historic or “design”

Rainfall-based Methods
Rainfall (infilled and distributed in time and space over whole catchment) – historic or “design”
Flood Event Model
Fit (or adopt) parameters of a suitable flood event model

Rainfall-based Methods
Rainfall (infilled and distributed in time and space over whole catchment) – historic or “design”
Flood Event Model
Flo
w
Fit (or adopt) parameters of a suitable flood event model
Calibration: obtain match between historical and simulated flood hydrographs
Design: simulate hydrographs for different AEPs
Time

Rainfalldepth
AEP
LossParameters
AEP
TemporalPattern
AEP
Spatial
Pattern
AEP
Flood Event Model
1:Y AEP
Rainfall
FloodPeak
AEP
1:Y AEPFlood
Inputs Model Outputs
Fixed values
selected so that
1:Y rainfall gives
1:Y flood
Single
hydrograph
output
Time
Flo
w
“Probability-neutral”value
“Probability-neutral”value
“Probability-neutral”value
Simple Event Approach

Rainfalldepth
AEP
LossParameters
AEP
TemporalPattern
AEP
Spatial
Pattern
AEP
“Probability-neutral”value
“Probability-neutral”value
“Probability-neutral”value
Flood Event Model
1:Y AEPRainfall
FloodPeak
AEP
1:Y AEPFlood
Inputs Model Outputs
Estimate calculated
from simple arithmetic
mean of peak
Time
Flo
w
A sample of
patterns
Ensemble Event Approach

Rainfalldepth
AEP
LossParameters
AEP
TemporalPattern
AEP
Spatial
Pattern
AEP
“Probability-neutral”value
“Probability-neutral”value
“Probability-neutral”value
Flood Event Model
1:Y AEPRainfall
FloodPeak
AEP
1:Y AEPFlood
Inputs Model Outputs
Time
Flo
w
Stochastically
sample all
key inputs
Estimate calculated
from frequency
analysis of derived
maxima
Monte Carlo Event Approach

Rainfall-based Procedures
Simple Event Ensemble Event Monte Carlo Event Continuous Simulation
Hydrologic Inputs
Design rainfalls (ie rainfall depth for given burst duration and annual exceedance probability)
Observed (or synthetic) time series of rainfall and evaporation
Hydrologic variability
Fixed patterns of rainfall and other
inputs
Ensemble of N temporal patterns
Ensemble (or distribution) of temporal patterns, losses,
and other factors.
As represented in the time series of inputs – if not in time series then
not represented
Model Event-based model based on routing rainfall excess through catchment storage
(see Book 5 for details of technique) Model of catchment processes influencing runoff generation
Framework Single simulation for each combination of
rainfall depth and AEP
N simulations for each combination of
rainfall depth and
AEP (N10)
Stochastic sampling of input distributions using continuous
or stratified domain (potentially thousands of
simulations)
Continuous simulation at time step for N years
Flood AEP Assumed same as input rainfall Statistical analysis of joint probabilities (eg frequency analysis of maxima or Total
Probability Theorem)
Computed from frequency analysis of N annual maxima Flood
magnitude
Single estimate derived from each set
of inputs
Simple average (or median) of N simulations
ARR guidance
Book 4, Sect 3.2.2 Book 4, Sect 3.2.3 Book 4, Sect 3.2.4 Book 4, Sect 3.3

Summary Of Applicability Of
Rainfall-based ProceduresMethod Advantages Limitations Comments on Applicability
Continuous simulation
• Well suited to assessing flood risk in complex systems that are sensitive to flood volume
• Most applicable to range of very frequent to frequent events
• Difficult to parameterise model to correctly reproduce the frequency of flood exceedance in manner that adequately captures shape of observed hydrographs
• Useful for hindcasting streamflows for sites with short periods of record
• Model parameters not easily transposed to ungauged locations
Design event
• Long tradition of use thus familiar to most practitioners
• Difficult to demonstrate that probability-neutrality is achieved
• Little justification to use this simplistic method with currently available computing resources, but suited to derivation of preliminary estimates.
Ensemble event
• Simple means of minimising probability bias for modest level of effort
• Well suited to accommodating single source of hydrologic variability in simple catchments
• Not suited to considering multiple sources of hydrologic variability or other joint-probability influences
• Difficult to determine if probability bias remains in the estimates
• Provides easy transition for practitioners familiar with design event method
• The required sets of ensemble temporal patterns are now available
Monte Carlo event
• Rigorous means of deriving expected probability estimates for range of factors considered
• Readily extended to consider multiple sources of variability and additional joint-probability factors (both anthropogenic and natural)
• Requires specialist skills to develop bespoke solutions and thus dependent on availability of software
• For more complex applications care needs to be taken to ensure correlations between dependent factors are appropriately considered
• Non-dimensional loss distributions and temporal pattern ensembles are now available
• The expected probability estimates account for hydrologic variability not parameter uncertainty as the necessary information on governing distributions is generally not available.
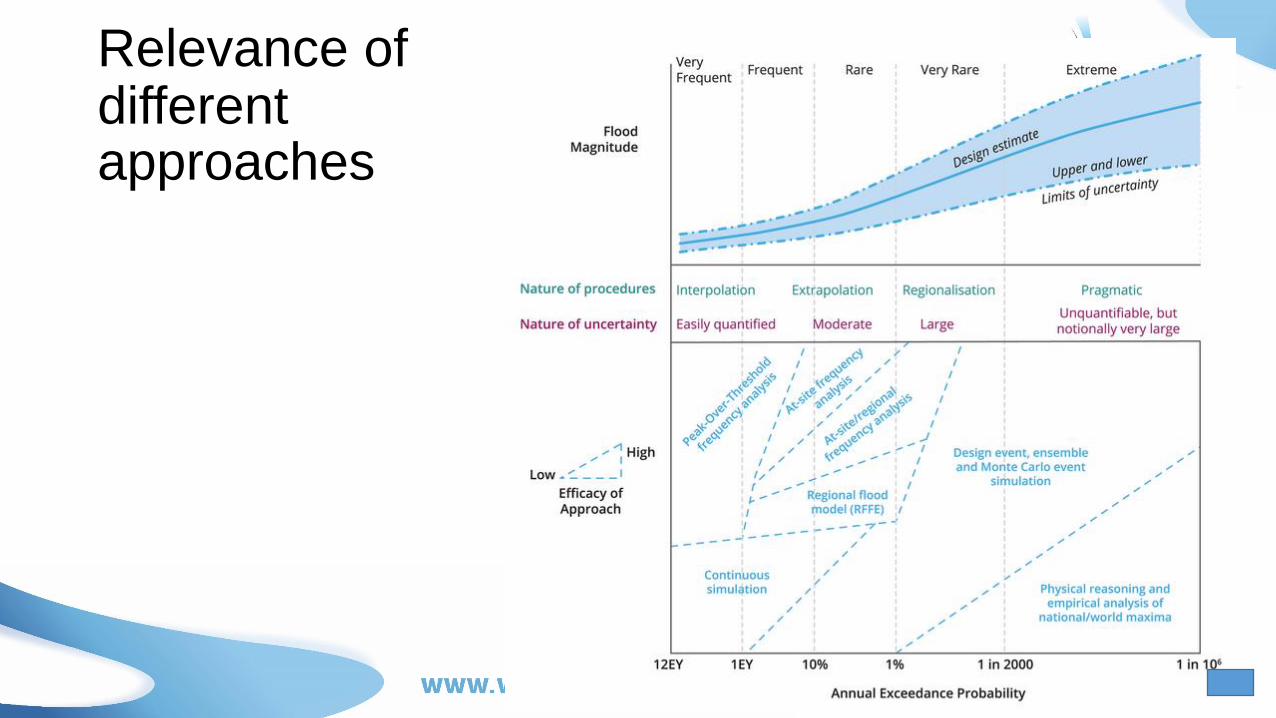
Relevance of different approaches
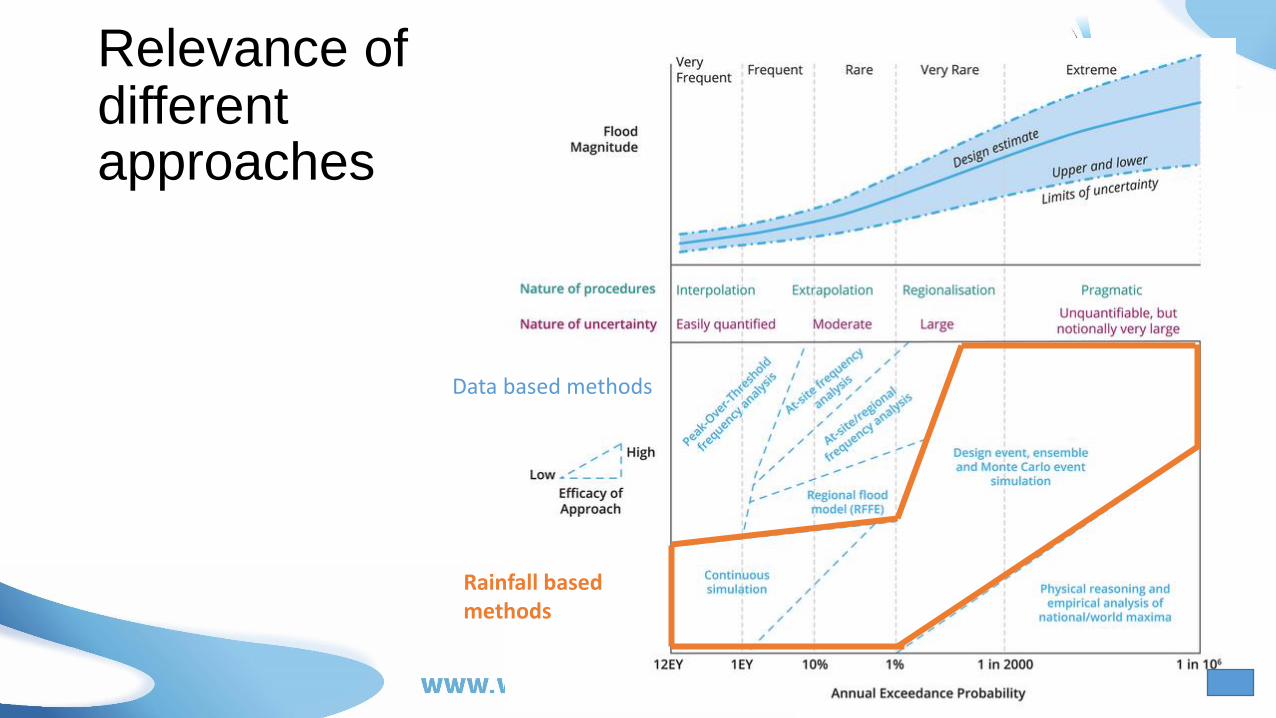
Relevance of different approaches
Rainfall based methods
Data based methods
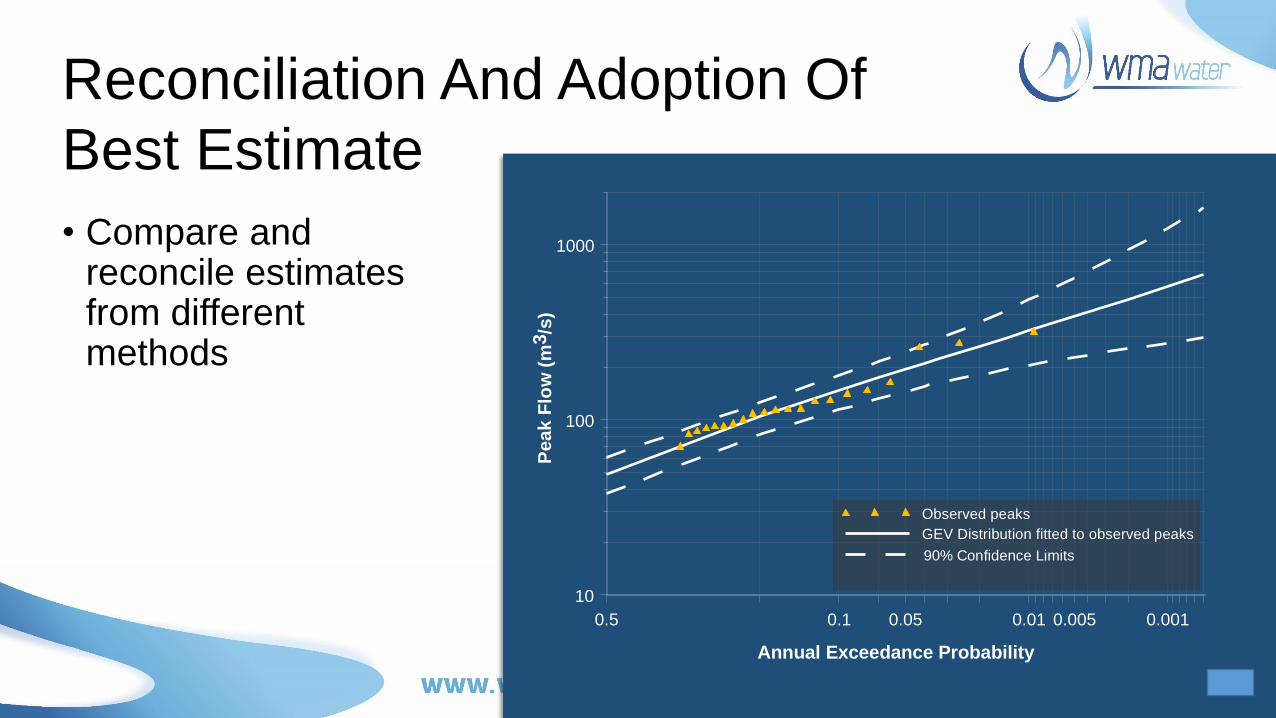
• Compare and reconcile estimates from different methods
0.5 0.1 0.05 0.01 0.005 0.001
Annual Exceedance Probability
10
100
1000
Peak
Flo
w(m
3/s
)
Observed peaks
GEV Distribution fitted to observed peaks
90% Confidence Limits
Reconciliation And Adoption Of
Best Estimate

0.5 0.1 0.05 0.01 0.005 0.001
Annual Exceedance Probability
10
100
1000
Peak
Flo
w(m
3/s
)
Observed peaks
GEV Distribution fitted to observed peaks
90% Confidence Limits
Quantiles from rainfall-based modelling
Reconciliation And Adoption Of
Best Estimate
• Compare and reconcile estimates from different methods

Data
• ARR 2019 places renewed emphasis on data
• “Practitioners need to utilise as much local information, even if this is anecdotal and limited, as possible to reduce this risk”

Risk-based Design• Industry is moving to risk based design
and away from probability based design
• Flood risk results from human use of the floodplain
• Flood risk affects
• Life safety
• Assets and the economy
• Community
• Environment
See Book 1, Chapter 5
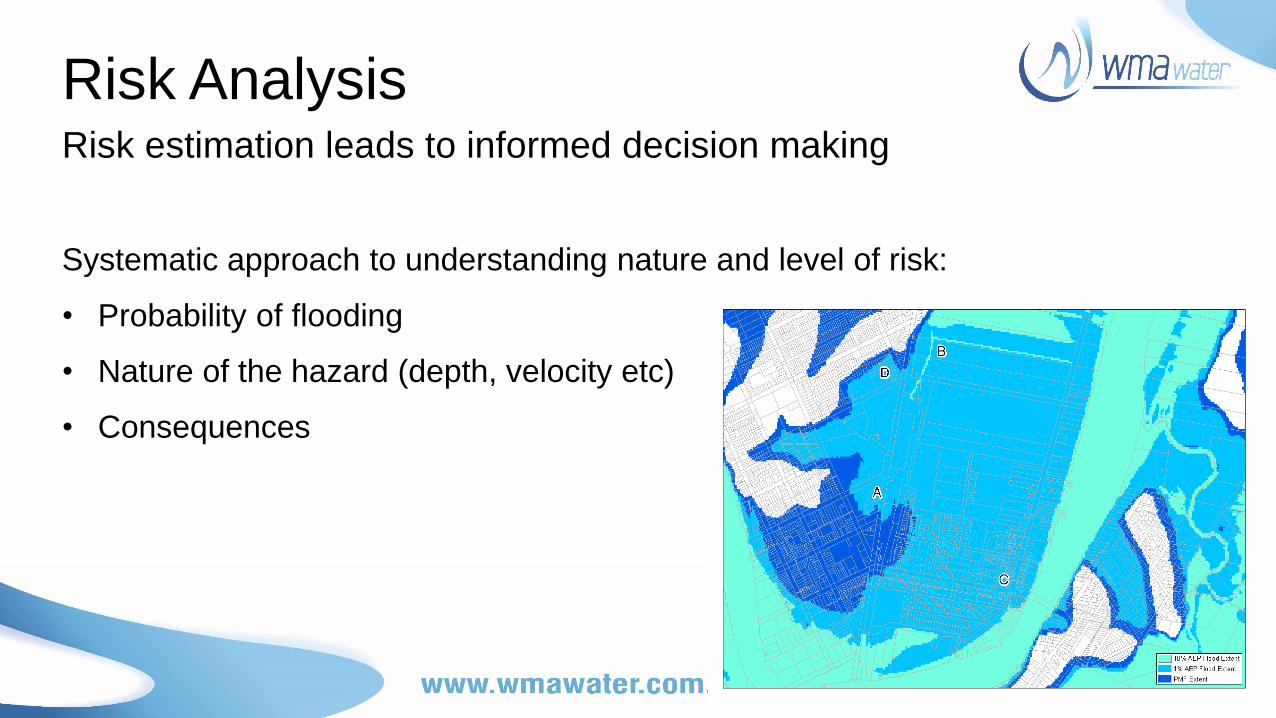
Risk AnalysisRisk estimation leads to informed decision making
Systematic approach to understanding nature and level of risk:
• Probability of flooding
• Nature of the hazard (depth, velocity etc)
• Consequences

Standards Based Design
Managing risk by probability and restricting consequences
• 1% (1 in 100) floor and planning levels – most state and local authorities
• 0.05% (1 in 2000) bridge service life – Austroads
• Level of service – eg. Design of a road so that each crossing is open in a 1 in 50 AEP event

Problems With Design Standards
• Clusters consequences just above the standard – floor levels
• Does not consider residual risk
• Blunt tool – no consideration of costs or consequences

Risk Based Decision Making• Examples of guidelines transitioning to risk based design:
• Dams – ANCOLD
• Short term structures
• Critical infrastructure
Climate Change
• ARR 1987 acknowledged the emerging understanding of climate change and associated risks
• National guidance provided based on advice from an expert group including CSIRO, BOM and various academic experts.

The major areas where climate change will impact flooding are:
• Design rainfall intensity-frequency-duration.
• Storm type, frequency and depth.
• Rainfall spatial and temporal patterns.
• Antecedent conditions.
• Changes in sea level.
• The joint probability of storm surge and flood producing rainfall.
Climate change – Impacts on flooding

• A warming climate leads to an increase in the water holding capacity of the air, which causes an increase in the atmospheric water vapour that supplies storms, resulting in more intense precipitation.
• Climate change is likely to increase the intense part of storms
Rainfall changes

• Changes in the patterns of precipitation and evaporation will lead to changes in antecedent conditions prior to flood events, affecting soil moisture and thus loss rates in the catchment.
• Potential evaporation is projected to increase almost everywhere on a global scale due to an increase in the water-holding capacity of the atmosphere with higher temperatures combined with little projected change in relative humidity.
Antecedent conditions


NRM clusters

Climate change rainfall increases from the ARR data hub
• Increase the rainfall not flow
• Currently no advice on PMP

Guide to arr-software.org

Key LinksDocument
http://arr.ga.gov.au/
IFD
http://www.bom.gov.au/water/designRainfalls/revised-ifd/
Data Hub
http://data.arr-software.org/
RFFE
http://rffe.arr-software.org/
Interaction of coastal and ocean flooding
http://p18.arr-software.org/

Questions ?