arr and tariff proposal for the retail supply business for ... · arr proposal for the retail...
TRANSCRIPT

EASTERN POWER DISTRIBUTION COMPANY
OF ANDHRA PRADESH LIMITED
Retail Supply Business True-up forFY: 2014-15 &FY:2015-16
&ARR Proposal
for the Retail Supply Businessfor FY: 2016-17
Retail Supply Business True-up
1. Retail Supply Business True-up for FY 2014-15 and FY 2015-16
1.1. Filing for True-up by the Distribution Licensee
This filing is made by the Distribution Licensee, EASTERN POWER DISTRIBUTIONCOMPANY OF ANDHRA PRADESH LIMITED (APEPDCL) under Clause 19, Pg 11 of theAndhra Pradesh Electricity Regulatory Commission ‘(Terms and Conditions for DeterminationOf Tariff For Wheeling and Retail Sale of Electricity)’ Regulation No. 4 of 2005 and Clause 2, Pg2 of the Andhra Pradesh Electricity Regulatory Commission ‘First Amendment to (Terms andConditions for Determination of Tariff for Wheeling and Retail Sale of Electricity) RegulationNo. 1 of 2014, for corrections for “uncontrollable” and “controllable” items and as well as sharingof gains/losses for FY 2014-15 and FY 2015-16.
1.2. As per Andhra Pradesh Electricity Regulatory Commission (APERC) Regulation No. 4 of2005, ‘Terms and Conditions for Determination of Tariff for Wheeling and Retail Sale ofElectricity’ –
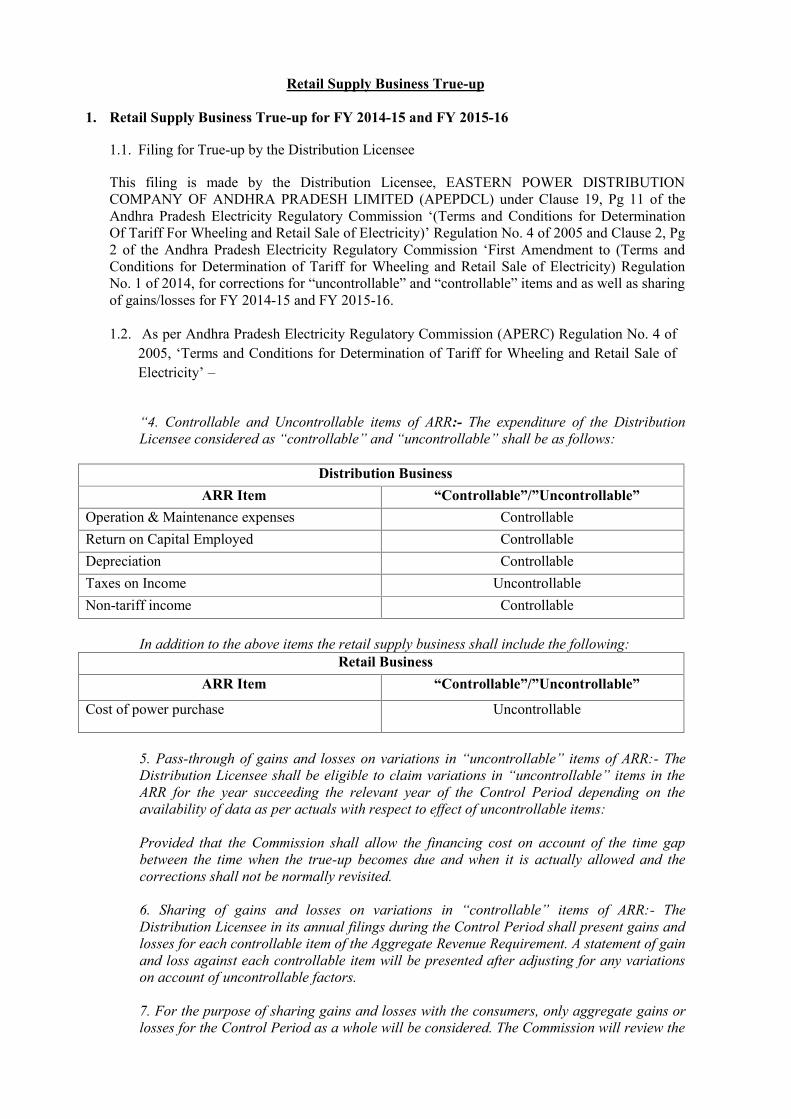
“4. Controllable and Uncontrollable items of ARR:- The expenditure of the DistributionLicensee considered as “controllable” and “uncontrollable” shall be as follows:
Distribution BusinessARR Item “Controllable”/”Uncontrollable”
Operation & Maintenance expenses ControllableReturn on Capital Employed ControllableDepreciation ControllableTaxes on Income UncontrollableNon-tariff income Controllable
In addition to the above items the retail supply business shall include the following:Retail Business
ARR Item “Controllable”/”Uncontrollable”
Cost of power purchase Uncontrollable
5. Pass-through of gains and losses on variations in “uncontrollable” items of ARR:- TheDistribution Licensee shall be eligible to claim variations in “uncontrollable” items in theARR for the year succeeding the relevant year of the Control Period depending on theavailability of data as per actuals with respect to effect of uncontrollable items:
Provided that the Commission shall allow the financing cost on account of the time gapbetween the time when the true-up becomes due and when it is actually allowed and thecorrections shall not be normally revisited.
6. Sharing of gains and losses on variations in “controllable” items of ARR:- TheDistribution Licensee in its annual filings during the Control Period shall present gains andlosses for each controllable item of the Aggregate Revenue Requirement. A statement of gainand loss against each controllable item will be presented after adjusting for any variationson account of uncontrollable factors.
7. For the purpose of sharing gains and losses with the consumers, only aggregate gains orlosses for the Control Period as a whole will be considered. The Commission will review the

gains and losses for each item of the ARR and make appropriate adjustments whereverrequired:
Provided that for the first Control Period, insofar as the gains and losses from the RetailSupply Business of the Distribution Licensee are concerned, these will be shared with theconsumers on yearly basis.”
“MAIN ITEMS OF ARRThe Aggregate Revenue Requirement of the Distribution Licensee, for each year of theControl Period, shall contain the following items:1. Cost of power for (Retail Supply Business alone)2. Transmission charges (for Retail Supply Business alone)3. Load dispatch charges;4. Operation and maintenance expenses;5. Return on capital employed;6. Depreciation;7. Taxes on Income;8. Corrections for “uncontrollable” items and “controllable” items (indexed to externalparameters);
9. Any other relevant expenditure”
“4. The Distribution Licensee shall be entitled to recover or shall refund, as the case maybe, the charges on account of Fuel Surcharge Adjustment as approved by the Commissionfrom time to time, suo-motu or based on the filing made by the Distribution Licensee, as theCommission may deem fit.”
“1. The Distribution Licensee shall be allowed to recover transmission and load despatchcharges payable to the Transmission Licensees (Central Transmission Utility, StateTransmission Utility etc.) and System Operators (Regional Load Despatch Centre, StateLoad Despatch Centre etc.) for access to and use of the inter-state transmission system,intra-state transmission system and availing load dispatch services on long-term basis inaccordance with the tariffs approved from time to time by CERC and this Commission, asthe case may be.
2. The Distribution Licensee shall also be allowed to recover the expenses, at the approvedlevel, pertaining to (a) use of transmission and load dispatch facilities under short-termprocurement of power for the Retail Supply Business; and (b) wheeling charges for use ofthe distribution system of other Distribution Licensee for procurement of power for theRetail Supply Business.”
1.3. As per Andhra Pradesh Electricity Regulatory Commission (APERC) Regulation No. 1 of2014, ‘First Amendment to (Terms and Conditions for Determination of Tariff for Wheelingand Retail Sale of Electricity)Regulation No. 4 of 2005’ –
“12.5 True-up for Retail Supply Businessa. The Distribution Licensee shall include the power purchase cost variation over
the previous year Power Purchase cost in the Tariff Order as expense (in theevent of incurring excess cost)/rebate (in case of cost saving) in the ARR asspecial item with relevant details. To arrive the power purchase cost variation,the least of the following power purchase quantity is to be considered:i) Actual power purchase quantity procured by the Discoms for its
consumers.ii) Power purchase quantity computed based on actual sales except LT
Agriculture sales. LT Agriculture sales will be limited to Tariff Order
quantity. These aggregated sales will be grossed up with approved lossesfor the relevant year in the MYT orders.
b. Since the complete information of cost actually incurred relating to previous yearwill not be available at the time of filing of ARR for a particular tariff year, theLicensee may include provisional cost variation for the previous year in ARRfilings which will be subject to final correction by the Commission as and whenfinal accounts for that year become available.
c. The Licensees shall also include in the ARR the amounts to be collected on finalbasis being the difference between the cost incurred based on audited annualaccounts report and costs provisionally approved by the Commission in theTariff Order for the year immediately preceding the previous year.
The Amendment Regulation mentions about power purchase cost variation.However, deviation in actual and approved ARR and revenue arises because ofvariation in approved and actual agriculture sales, losses and average realizationbesides variation in power purchase cost. If this is not accounted for, it will resultin the requirement of another Financial Restructuring Plan on account ofaccumulation of losses.
Hence, this write-up explains the total truing up gap arising out of the deviations in AggregateRevenue Requirement components and revenue for the Retail Supply Business for FY 2014-15and FY 2015-16..
1.4. True-up of Aggregate Revenue Requirements components & Gap from RetailBusiness for FY 2014-15.
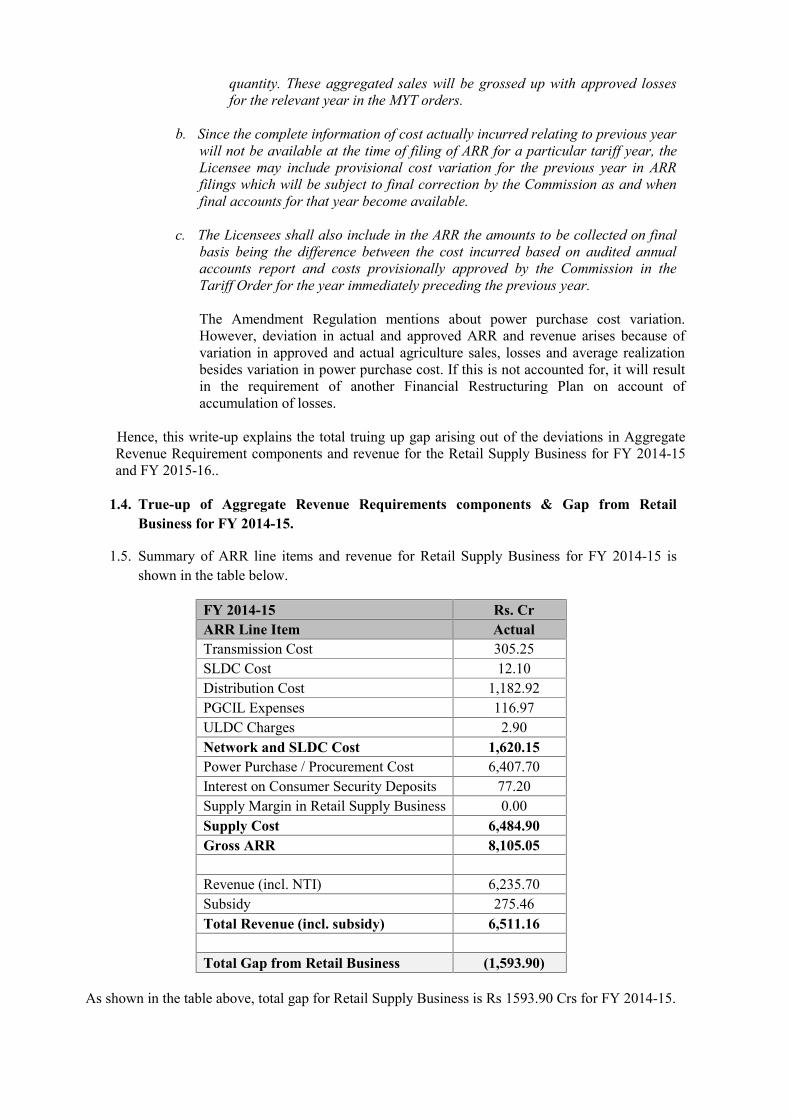
1.5. Summary of ARR line items and revenue for Retail Supply Business for FY 2014-15 isshown in the table below.
FY 2014-15 Rs. CrARR Line Item ActualTransmission Cost 305.25SLDC Cost 12.10Distribution Cost 1,182.92PGCIL Expenses 116.97ULDC Charges 2.90Network and SLDC Cost 1,620.15Power Purchase / Procurement Cost 6,407.70Interest on Consumer Security Deposits 77.20Supply Margin in Retail Supply Business 0.00Supply Cost 6,484.90Gross ARR 8,105.05
Revenue (incl. NTI) 6,235.70Subsidy 275.46Total Revenue (incl. subsidy) 6,511.16
Total Gap from Retail Business (1,593.90)
As shown in the table above, total gap for Retail Supply Business is Rs 1593.90 Crs for FY 2014-15.
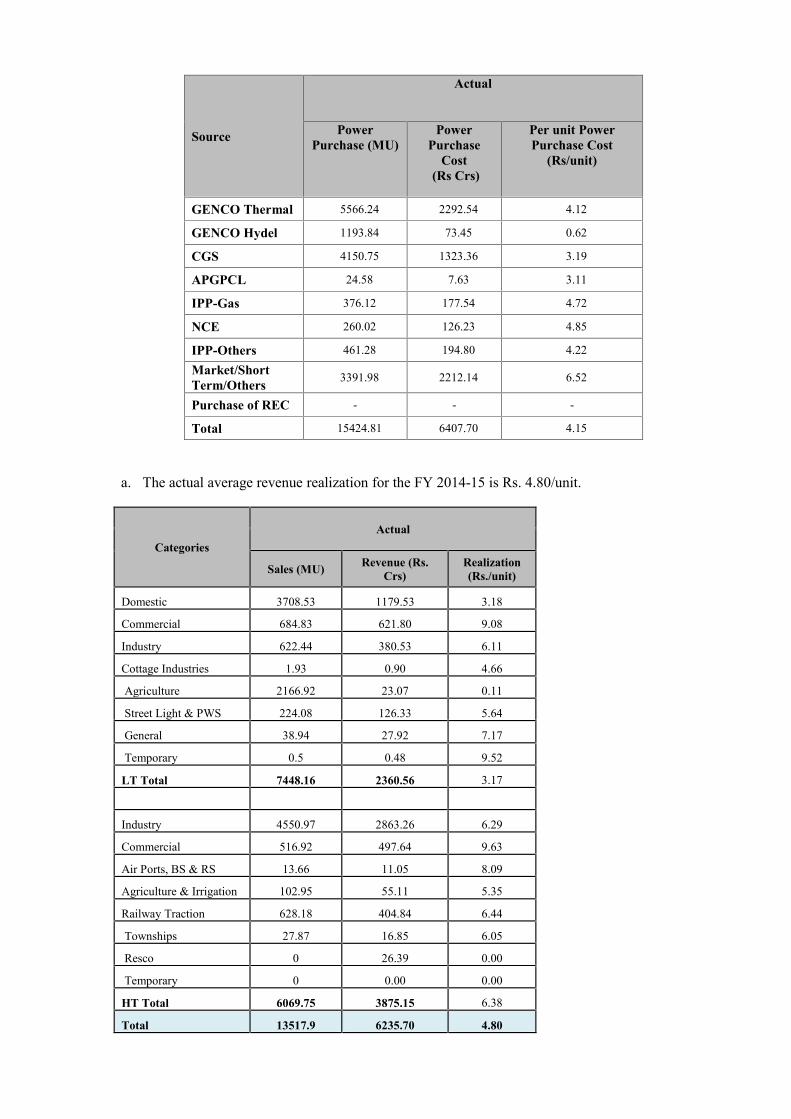
Source
Actual
PowerPurchase (MU)
PowerPurchase
Cost(Rs Crs)
Per unit PowerPurchase Cost
(Rs/unit)
GENCO Thermal 5566.24 2292.54 4.12
GENCO Hydel 1193.84 73.45 0.62
CGS 4150.75 1323.36 3.19
APGPCL 24.58 7.63 3.11
IPP-Gas 376.12 177.54 4.72
NCE 260.02 126.23 4.85
IPP-Others 461.28 194.80 4.22
Market/ShortTerm/Others 3391.98 2212.14 6.52
Purchase of REC - - -
Total 15424.81 6407.70 4.15
a. The actual average revenue realization for the FY 2014-15 is Rs. 4.80/unit.
CategoriesActual
Sales (MU) Revenue (Rs.Crs)
Realization(Rs./unit)
Domestic 3708.53 1179.53 3.18
Commercial 684.83 621.80 9.08
Industry 622.44 380.53 6.11
Cottage Industries 1.93 0.90 4.66
Agriculture 2166.92 23.07 0.11
Street Light & PWS 224.08 126.33 5.64
General 38.94 27.92 7.17
Temporary 0.5 0.48 9.52
LT Total 7448.16 2360.56 3.17
Industry 4550.97 2863.26 6.29
Commercial 516.92 497.64 9.63
Air Ports, BS & RS 13.66 11.05 8.09
Agriculture & Irrigation 102.95 55.11 5.35
Railway Traction 628.18 404.84 6.44
Townships 27.87 16.85 6.05
Resco 0 26.39 0.00
Temporary 0 0.00 0.00
HT Total 6069.75 3875.15 6.38
Total 13517.9 6235.70 4.80
Total actual revenue is Rs. 6154.49 Crs. and Non-Tariff Income (NTI) is Rs. 81.21 Crs.
Hence total actual Revenue including Non Tariff income is Rs. 6235.70 Crs.
True-up of Aggregate Revenue Requirements components & Gap from Retail
Business for FY 2015-16
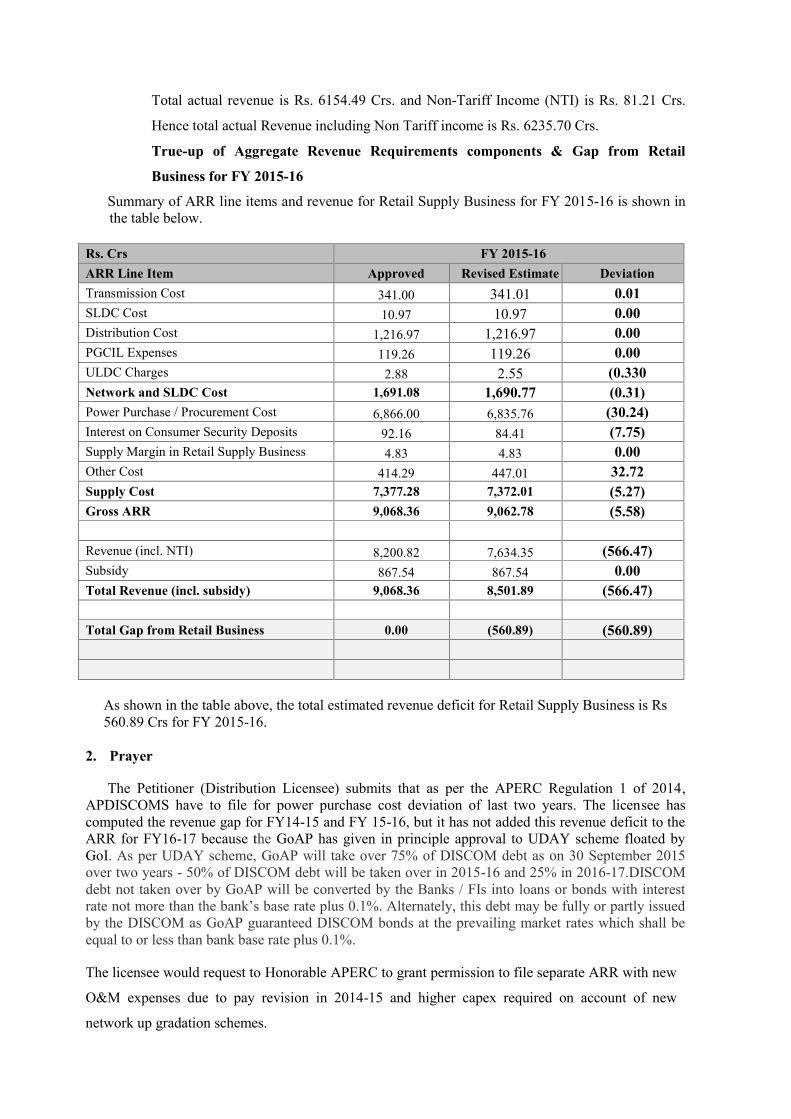
Summary of ARR line items and revenue for Retail Supply Business for FY 2015-16 is shown inthe table below.
Rs. Crs FY 2015-16ARR Line Item Approved Revised Estimate DeviationTransmission Cost 341.00 341.01 0.01SLDC Cost 10.97 10.97 0.00Distribution Cost 1,216.97 1,216.97 0.00PGCIL Expenses 119.26 119.26 0.00ULDC Charges 2.88 2.55 (0.330Network and SLDC Cost 1,691.08 1,690.77 (0.31)Power Purchase / Procurement Cost 6,866.00 6,835.76 (30.24)Interest on Consumer Security Deposits 92.16 84.41 (7.75)Supply Margin in Retail Supply Business 4.83 4.83 0.00Other Cost 414.29 447.01 32.72Supply Cost 7,377.28 7,372.01 (5.27)Gross ARR 9,068.36 9,062.78 (5.58)
Revenue (incl. NTI) 8,200.82 7,634.35 (566.47)Subsidy 867.54 867.54 0.00Total Revenue (incl. subsidy) 9,068.36 8,501.89 (566.47)
Total Gap from Retail Business 0.00 (560.89) (560.89)
As shown in the table above, the total estimated revenue deficit for Retail Supply Business is Rs560.89 Crs for FY 2015-16.
2. Prayer
The Petitioner (Distribution Licensee) submits that as per the APERC Regulation 1 of 2014,APDISCOMS have to file for power purchase cost deviation of last two years. The licensee hascomputed the revenue gap for FY14-15 and FY 15-16, but it has not added this revenue deficit to theARR for FY16-17 because the GoAP has given in principle approval to UDAY scheme floated byGoI. As per UDAY scheme, GoAP will take over 75% of DISCOM debt as on 30 September 2015over two years - 50% of DISCOM debt will be taken over in 2015-16 and 25% in 2016-17.DISCOMdebt not taken over by GoAP will be converted by the Banks / FIs into loans or bonds with interestrate not more than the bank’s base rate plus 0.1%. Alternately, this debt may be fully or partly issuedby the DISCOM as GoAP guaranteed DISCOM bonds at the prevailing market rates which shall beequal to or less than bank base rate plus 0.1%.
The licensee would request to Honorable APERC to grant permission to file separate ARR with new
O&M expenses due to pay revision in 2014-15 and higher capex required on account of new
network up gradation schemes.

EASTERN POWERDISTRIBUTION COMPANY
OF ANDHRA PRADESHLIMITED
ARR Proposalfor the Retail Supply Business
for the FY: 2016-17
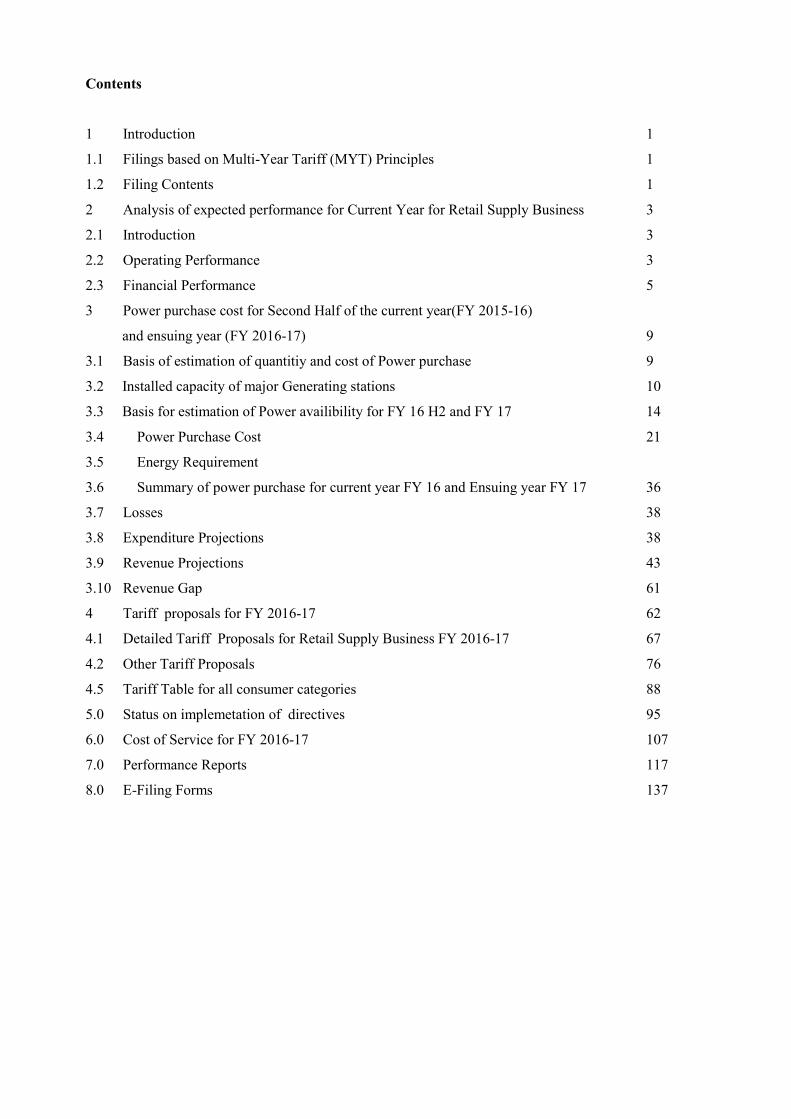
Contents
1 Introduction 1
1.1 Filings based on Multi-Year Tariff (MYT) Principles 1
1.2 Filing Contents 1
2 Analysis of expected performance for Current Year for Retail Supply Business 3
2.1 Introduction 3
2.2 Operating Performance 3
2.3 Financial Performance 5
3 Power purchase cost for Second Half of the current year(FY 2015-16)
and ensuing year (FY 2016-17) 9
3.1 Basis of estimation of quantitiy and cost of Power purchase 9
3.2 Installed capacity of major Generating stations 10
3.3 Basis for estimation of Power availibility for FY 16 H2 and FY 17 14
3.4 Power Purchase Cost 21
3.5 Energy Requirement
3.6 Summary of power purchase for current year FY 16 and Ensuing year FY 17 36
3.7 Losses 38
3.8 Expenditure Projections 38
3.9 Revenue Projections 43
3.10 Revenue Gap 61
4 Tariff proposals for FY 2016-17 62
4.1 Detailed Tariff Proposals for Retail Supply Business FY 2016-17 67
4.2 Other Tariff Proposals 76
4.5 Tariff Table for all consumer categories 88
5.0 Status on implemetation of directives 95
6.0 Cost of Service for FY 2016-17 107
7.0 Performance Reports 117
8.0 E-Filing Forms 137

1. Introduction
1.1 Filings based on Multi-Year Tariff (MYT) Principles
The Andhra Pradesh Electricity Regulatory Commission framed the “Terms and Conditions for
determination of Tariff for Wheeling and retail supply of electricity” - Regulation 4 of 2005
(“Regulation”), which lays the principles for determination of Aggregate Revenue Requirement
(ARR) for a) Distribution Business and b) Retail Supply Business of the licensees. The ARR so
determined for each of the businesses will form the basis for fixation of wheeling tariff / charges and
charges for retail sale of electricity.
In the Regulation, the Commission has also laid down the procedures for filing under multi-year tariff
principles. The current filing pertains to the Third Control Period. The Commission has specified the
following procedure in Para 6.2 of the Regulation 4 of 2005 for ARR filing for the distribution and
retail supply business:
“The ARR filing for the Distribution business shall be for the entire Control Period. For the Retail
Supply business the ARR filing will be on annual basis for the first Control Period and the entire
Control Period for the subsequent Control Periods”.
The APDISCOMS have sought permission from Hon’ble APERC to file ARR for Retail Supply
Business for FY 2016-17 on annual basis in view of the difficulties in projection of power purchase
cost estimation for the entire control period and Tariff uncertainty. The Hon’ble APERC has granted
permission for APDISCOMS to file ARR for Retail Supply Business on annual basis for FY 2016-17.
The current filing follows the principles laid down under this Regulation for determination of the
ARR for the retail supply business for the year 2016-17, which is the third year of the Third Control
Period.
1.2 Filing Contents
The filing is structured in the following way:
Section 2 provides analysis of expected performance for current year for Retail supply Business
comprising
- Operating Performance
- Financial Performance
A brief analysis of the financial and operational performance of the licensee during the previous year
(2014-15) and the current year (2015-16) is given.
Section 3 provides the ARR for Retail Supply Business for third year of the Third Control Period and
the basis of projections of the expense and revenue items comprising:
Expenditure Projections
- Power Purchase Cost
- Transmission and PGCIL Charges
- SLDC Charges
- Distribution Cost
- Interest on Consumer Security Deposits
- Supply Margin
- Other Costs
- Aggregate Revenue Requirement for Retail Supply Business
Revenue Projections
- Sales Forecast
- Revenue from Current Tariffs
- Non-tariff Income at Current Charges
- Revenue at Current Tariffs and Charges
Revenue Gap
- Revenue Deficit / Surplus at Current Tariff and Charges
- Proposals to handle the Deficit / Surplus
The sales forecast is used to determine the revenue from tariff from retail sale of electricity for the
third year of the third control period and the energy input required for meeting the demand. The
power procurement plan is based on the availability of the generation sources during the ensuing year,
the cost (fixed, variable and others) and the merit order dispatch of various sources to meet the
demand expected during various months.
Section 4 provides the Tariff proposals comprising of Tariffs for ensuing year.

2. Analysis of expected performance for Current Year 2015-16 for Retail SupplyBusiness
2.1 Introduction
This chapter analyses the performance of the licensee during the Current Year as compared to the
previous year & also with the Tariff Order 2013-14. Only the key operating and financial parameters
have been considered for this analysis.
2.2 Operating Performance
2.2.1 Energy Balance
Particulars
2014-15 2015-16
Actuals Present Estimate
MU % MU %
I) Total Metered Sales 11350.98 76.87% 12913.67 79.63%a) EHT Sales 3144.66 21.30% 3435.47 20.80%b) HT Sales 2925.09 19.81% 3458.75 20.94%c) LT Metered Sales 5281.24 35.76% 6019.45 36.44%II) LT Agricultural Sales 2166.92 14.67% 2281.16 13.81%III) Total Sales 13517.9 91.54% 15194.83 91.98%IV) ADD: Distribution Losses
a) Discom Losses (Incl EHT sales) 1248.76 8.46% 1325.53 8.02%
b) Discom Losses (excl EHT sales)1248.76 10.74% 1325.53 10.13%
V) Discom Power Purchasea) Discom Input (Excl EHT sales) 11622.01 13084.89
b) Discom Input (Incl EHT sales)and excluding Transmission losses 14766.66 100% 16520.37 100%

2.2.1.1 Distribution Loss:
Year
Loss Target as perAPERC Actual
No. of 11 KVT&MHQ
feeders forwhich energy
audit done
Additional33/11 KV
sub-stationscharged
Excl.EHT Incl. EHT Excl. EHT Incl. EHT
2009-10 11.14% 8.82% 10.43% 8.45% 640 59
2010-11 10.80% 8.81% 8.75% 6.96% 650 27
2011-12 10.54% 8.55% 10.37% 8.40% 655 15
2012-13 10.41% 8.42% 12.17% 9.38% 697 52
2013-14 10.21% 8.26% 11.72 % 9.18% 718 19
2014-15 10.21% 8.26% 10.74% 8.46% 742 9
2015-16 9.91 7.48% 10.14 % (upto Sept-15)
8.11 % (up toSept-15) 778 (up to Sept-15) 31 Nos. (up to
September-15)
It is expected to reduce the losses further with the implementation of the following measures.
i) Strict implementation of number of hours of supply to agricultural sector.
ii) Reduction of both technical and commercial losses by vigorously conducting 11KV feeder wise energy audits around 2783 Nos. feeders in the company.
iii) During the year 2014-15, only 742 Nos. 11 KV Town, MHQ & industrial feederswere considered for energy audit where as during the year 2015-16, 778 Nos.feeders are available for which energy audit is done on regular basis at corporateoffice level.
For the year 2014-15, 9 Nos. additional 33/11 KV sub-stations were charged and For the
year 2015-16, 62 Nos. additional 33/11 KV sub-stations are proposed out of this 31 Nos. were
already charged to reduce over loaded 33 KV & 11 KV lines and to maintain good voltage
profiles up to the consumers end.
2.2.1.2 Metered Sales –
As can be seen from the table above, in 2014-15, the percentage of metered sales is
lower than the Tariff Order level by 2.16 %. The reduction is mainly due to reduction in EHT
Ferro alloys consumption nearly 100 MU.
In 2015-16, the metered sales are expected to increase by about 1562 MU over 2014-15
levels.
Agricultural Sales –
In the previous year 2014-15 the actual Agriculture Consumption is 2166.92 MU as
against the approved In the current year 2015-16 during the first half of the year the agriculture
consumption is 1060.07 MU and The sales projection for second half of FY 2015-16 for this
category are 1221.09MU.

2.3 Financial Performance
Previous Year FY 2014-15:
For the period 2014-15, the Licensee incurred a loss of Rs.722.23 Crs, due to Increase in employee
cost (pay revision) for Rs.489.01 Crs, Hud-Hud cyclone expenses for Rs.156.10Crs and Interest on
Loans for Rs.165 Crs.
Financial Performance:The financial performance on the actual for the FY: 2014-15 are as under.
Particulars (Rs. Crs) Actuals audited(2014-15)
Network and SLDC Cost 2195.83Transmission Cost 305.25SLDC Cost 12.1Distribution Cost 1758.61PGCIL Expenses 116.97ULDC Charges 2.9Supply Cost 6484.9Power Purchase / Procurement Cost 6407.7Interest on Consumer Security Deposits 77.2
Supply Margin in Retail Supply Business 0
Other Costs, if any(incl. misc. losses &write-offs)
0
Provision for Govt. receivablesAggregate Revenue Requirement 8680.73Total Revenue 7,960.71Revenue from Current Tariffs 6154.49(Net of incentives & incl. CMC)Other income 849.55Revenue subsidies and grants 275.46Non-tariff income 81.21Revenue Deficit (-) / Surplus(+) atCurrent Tariffs (1320.02)
Revenue - Cost Coverage (%) 84.79%
# Note: Other income includes Amortisation of consumer contribution Rs. 131.36 Crs, Delayed
payment surcharge Rs. 153.35 Crs, U.I. Charges revenue Rs. 5.906Cr.s, Interest from bank and
investments Rs.1.74 Crs., Income from trading Rs. 4.263 Crs. Misc. Receipts Rs. 240.471 Crs.
Interstate sales and DD sales Rs.297.19 Crs. Interest on ED Rs.1.48 Crs. Misc charges Rs. 4.79
Crs. Recoveries from theft of Energy Rs.9.00 Crs.
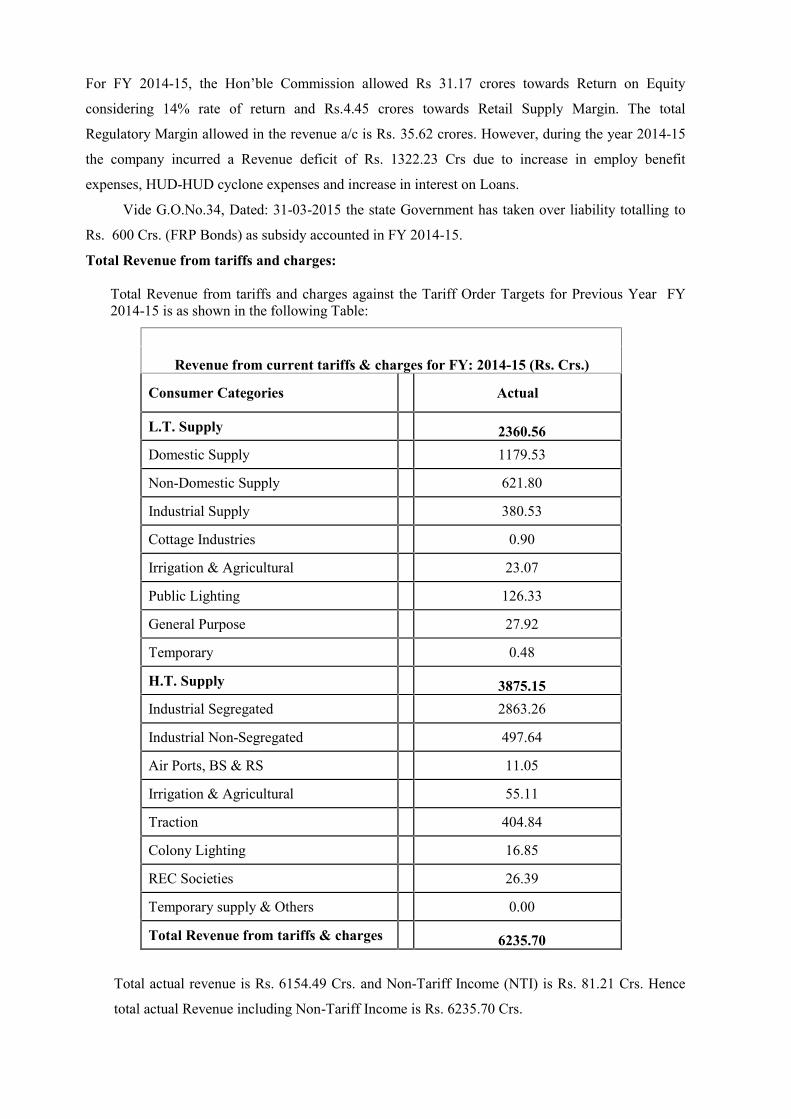
For FY 2014-15, the Hon’ble Commission allowed Rs 31.17 crores towards Return on Equity
considering 14% rate of return and Rs.4.45 crores towards Retail Supply Margin. The total
Regulatory Margin allowed in the revenue a/c is Rs. 35.62 crores. However, during the year 2014-15
the company incurred a Revenue deficit of Rs. 1322.23 Crs due to increase in employ benefit
expenses, HUD-HUD cyclone expenses and increase in interest on Loans.
Vide G.O.No.34, Dated: 31-03-2015 the state Government has taken over liability totalling to
Rs. 600 Crs. (FRP Bonds) as subsidy accounted in FY 2014-15.
Total Revenue from tariffs and charges:
Total Revenue from tariffs and charges against the Tariff Order Targets for Previous Year FY2014-15 is as shown in the following Table:
Revenue from current tariffs & charges for FY: 2014-15 (Rs. Crs.)
Consumer Categories Actual
L.T. Supply 2360.56Domestic Supply 1179.53
Non-Domestic Supply 621.80
Industrial Supply 380.53
Cottage Industries 0.90
Irrigation & Agricultural 23.07
Public Lighting 126.33
General Purpose 27.92
Temporary 0.48
H.T. Supply 3875.15Industrial Segregated 2863.26
Industrial Non-Segregated 497.64
Air Ports, BS & RS 11.05
Irrigation & Agricultural 55.11
Traction 404.84
Colony Lighting 16.85
REC Societies 26.39
Temporary supply & Others 0.00
Total Revenue from tariffs & charges 6235.70
Total actual revenue is Rs. 6154.49 Crs. and Non-Tariff Income (NTI) is Rs. 81.21 Crs. Hence
total actual Revenue including Non-Tariff Income is Rs. 6235.70 Crs.
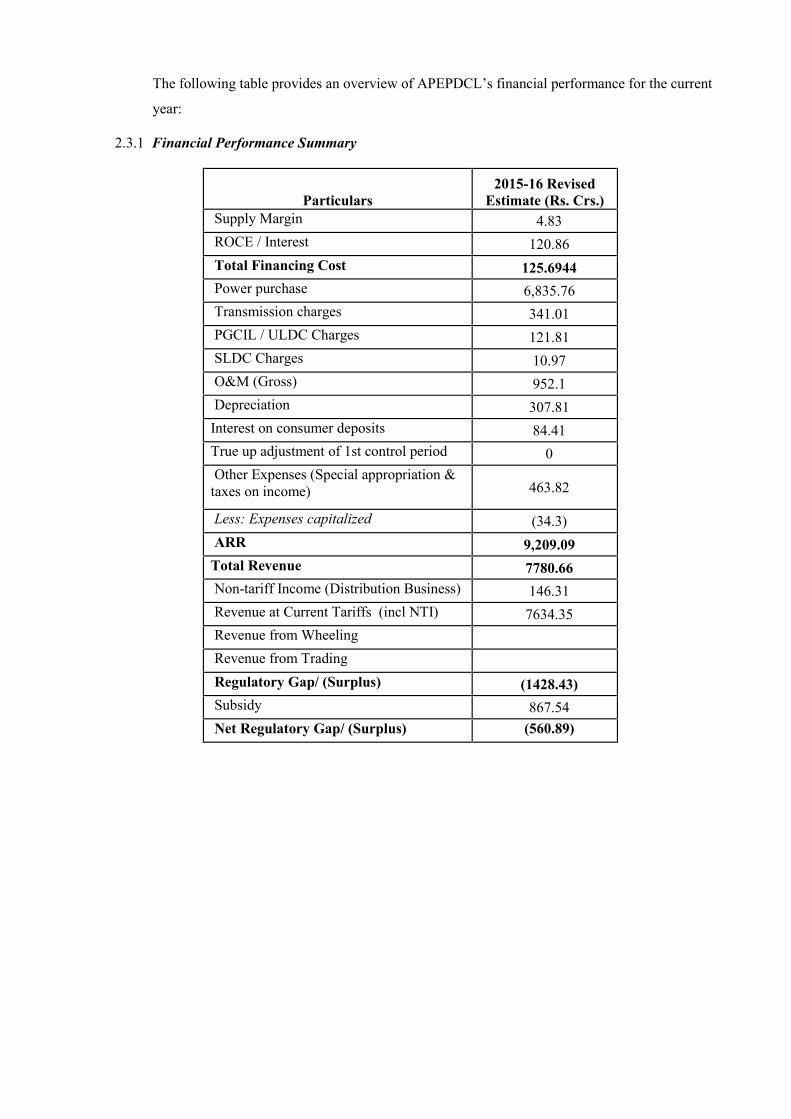
The following table provides an overview of APEPDCL’s financial performance for the current
year:
2.3.1 Financial Performance Summary
Particulars2015-16 Revised
Estimate (Rs. Crs.)Supply Margin 4.83ROCE / Interest 120.86Total Financing Cost 125.6944Power purchase 6,835.76Transmission charges 341.01PGCIL / ULDC Charges 121.81SLDC Charges 10.97O&M (Gross) 952.1Depreciation 307.81Interest on consumer deposits 84.41True up adjustment of 1st control period 0Other Expenses (Special appropriation &taxes on income) 463.82
Less: Expenses capitalized (34.3)ARR 9,209.09Total Revenue 7780.66Non-tariff Income (Distribution Business) 146.31Revenue at Current Tariffs (incl NTI) 7634.35Revenue from WheelingRevenue from TradingRegulatory Gap/ (Surplus) (1428.43)Subsidy 867.54Net Regulatory Gap/ (Surplus) (560.89)

2.3.1.1 Revenues from sale of electricity:
The actual revenue for FY 2014-15 excluding NTI is Rs.6154.49 Crs. and for FY: 2015-16 it is
estimated to be Rs.7549.37 Crs.
For the key categories, the licensee has estimated the revenue as below:
Consumer Categories
FY 2014-15 FY 2015-16
Actual (excl.NTI)
(RevisedEstimate )Excl NTI
L.T. Supply 2329.81 2781.93Domestic Supply 1164.16 1388.69
Non-Domestic Supply 613.70 729.82
Industrial Supply 375.57 462.41
Cottage Industry 0.89 0.97
Irrigation & Agricultural 22.77 27.67
Public Lighting 124.69 134.24
General Purpose 27.56 37.00
Temporary 0.47 1.13
H.T. Supply 3824.68 4767.45Indl Segregated 2825.97 3565.21
Indl Non-Segregated 491.16 662.19
Air Ports, BS & RS 10.91 12.99
Irrigation & Agricultural 54.39 64.03
Traction 399.57 433.28
Colony Lighting 16.64 18.97
REC Societies 26.04 10.77Temporary supply &Others 0.00
0.00
Total 6154.49 7549.37

3 POWER PURCHASE COST FOR CURRENT YEAR (FY 2015-16) SECOND HALF ANDENSUING YEAR (FY 2016-17)
3.1 BASIS OF ESTIMATION OF QUANTITY AND COST OF POWER PURCHASE
This section discusses the methodology and assumptions considered for estimating the quantum and
corresponding cost of power purchase of the Licensee for the second half of the Financial Year ending
March 31, 2016 and for the Financial Year ending March 31, 2017.
As per section 92 read with the Twelfth Schedule of the Andhra Pradesh Reorganization Act, 2014 for
bifurcation of united Andhra Pradesh (Central Act No. 6 of 2014, dated 01.03.2014), the districts of
Anantapur and Kurnool which was within the jurisdiction of the erstwhile Andhra Pradesh Central
Power Distribution Company Ltd. (APCPDCL, now Southern Power Distribution Company of
Telangana Limited (TSSPDCL)) was reassigned to the Andhra Pradesh Southern Power Distribution
Company Ltd. (APSPDCL). The proportionate share of power was transferred from the allocated
share of the erstwhile APCPDCL to APSPDCL.
Before the bifurcation of united Andhra Pradesh, with the implementation of Multi-Buyer Model
(MBM) in the state from June 9, 2005, each of the four Discoms of united Andhra Pradesh had been
allocated a certain share of the generating stations contracted by APTRANSCO. According to
G.O.Ms. No.20 (dated 08.05.2014), based on the last 5 years’ average consumption of Anantapur and
Kurnool districts, 17.45% of power earlier allocated to the erstwhile APCPDCL has to be transferred
to APSPDCL. Power allocation percentages for Andhra Pradesh Discoms and Telangana Discoms
have been modified accordingly. Andhra Pradesh has been allocated a percentage of 46.11% of the
erstwhile Andhra Pradesh share. The revised power allocation percentages for the two Discoms of
Andhra Pradesh (APEPDCL and APSPDCL) are mentioned below.
PP allocation:
Energy availability for upcoming GENCO (APGENCO and TSGENCO) stations - KTPP Stage
II, DSTPP Stages I & II has been considered as per geographical location.
Power from GENCO (APGENCO and TSGENCO) hydel stations have been allocated based on
their geographical location.
Non-conventional Energy sources have been allocated to the DISCOMs based on their
geographical presence/location.
The two mini-power plants LVS and Srivathsa have been allocated to APEPDCL.
Entire energy available from Hinduja thermal power plant has been allocated to Andhra Pradesh.

Allocation percentage for existing APGENCO thermal stations, CGS stations and Gas IPPs is
46.11% of united AP share (based on the last 5 years’ average consumption of Anantapur and
Kurnool districts).
The allocation percentages (as on 02.06.2014 as per G.O. Ms. No. 20) for the two Discoms of
Andhra Pradesh (among all the 4 Discoms of erstwhile Andhra Pradesh) for GENCO thermal
stations and all the other sources(Excluding Bilateral Purchases) has been doneas follows:
S. No. Name of the Distribution Company Allocation Percentage
1 APEPDCL 15.80 %
2 APSPDCL 30.31 %
The energy deficit in each Discom if any is then met through procurement through bilateral
sources
Month-wise surplus has been estimated based on the availability and requirement. A part of this
surplus is assumed to be sold through bilateral contracts and a part through open market.
In the following paragraphs, the capacities and availabilities of all the generating sources have been
described. The actual energy availability in MU for each Discom has been projected based on the
above allocation principles.
3.2 INSTALLED CAPACITY OF MAJOR GENERATING STATIONS
3.2.1 GENCO (ANDHRA PRADESH GENCO & TELENGANA STATE GENCO)
The table below shows the projected capacities of the Thermal and Hydel generating stations of
GENCO including the share in the interstate projects.
APGENCO
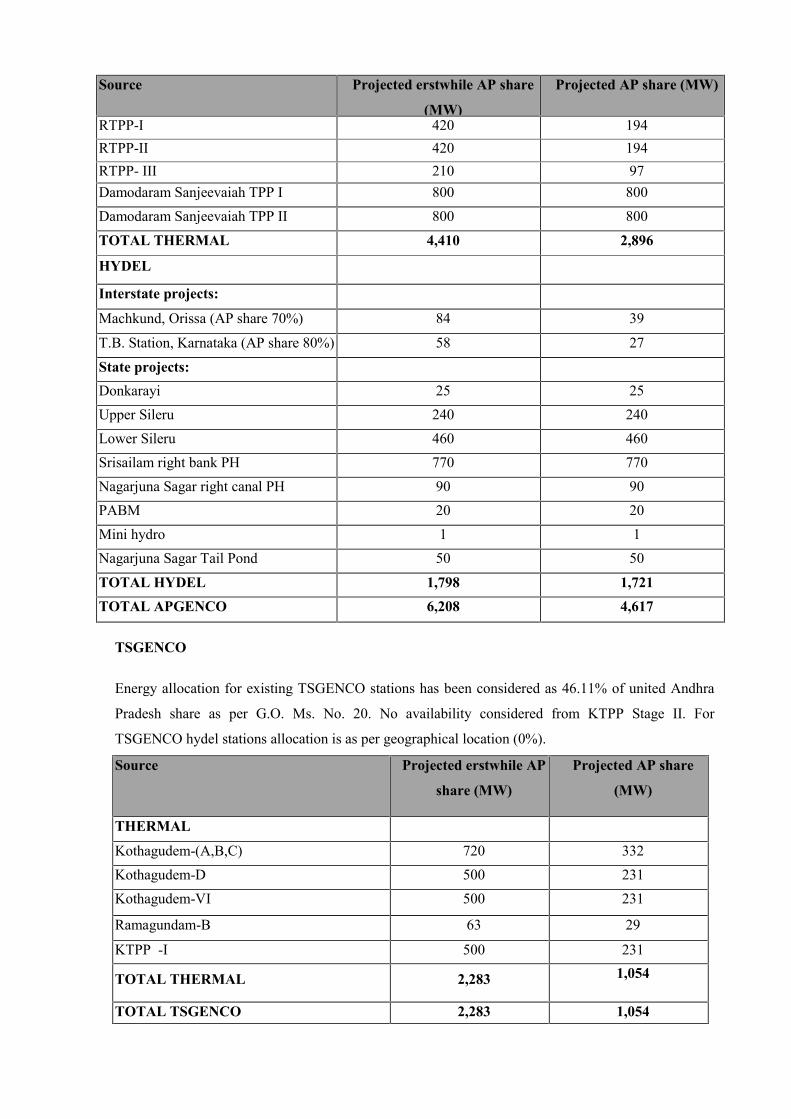
Energy allocation for existing APGENCO thermal stations has been considered as 46.11% of united
Andhra Pradesh share as per G.O. Ms. No. 20.while 100% has been considered from Damodaram
Sanjeevaiah TPP I & II. For APGENCO Hydel stations allocation is as per geographical location
(100%). Allocation for interstate hydel projects have been taken as per G.O.Ms. No. 20.
Source Projected erstwhile AP share
(MW)
Projected AP share (MW)
THERMAL
Dr. NTTPS ( I, II, III) 1,260 581Dr. NTTPS – IV 500 231
Source Projected erstwhile AP share
(MW)
Projected AP share (MW)
RTPP-I 420 194RTPP-II 420 194RTPP- III 210 97Damodaram Sanjeevaiah TPP I 800 800Damodaram Sanjeevaiah TPP II 800 800
TOTAL THERMAL 4,410 2,896
HYDEL
Interstate projects:
Machkund, Orissa (AP share 70%) 84 39
T.B. Station, Karnataka (AP share 80%) 58 27
State projects:Donkarayi 25 25Upper Sileru 240 240Lower Sileru 460 460Srisailam right bank PH 770 770Nagarjuna Sagar right canal PH 90 90PABM 20 20Mini hydro 1 1Nagarjuna Sagar Tail Pond 50 50
TOTAL HYDEL 1,798 1,721TOTAL APGENCO 6,208 4,617
TSGENCO
Energy allocation for existing TSGENCO stations has been considered as 46.11% of united Andhra
Pradesh share as per G.O. Ms. No. 20. No availability considered from KTPP Stage II. For
TSGENCO hydel stations allocation is as per geographical location (0%).
Source Projected erstwhile AP
share (MW)
Projected AP share
(MW)
THERMAL
Kothagudem-(A,B,C) 720 332Kothagudem-D 500 231Kothagudem-VI 500 231
Ramagundam-B 63 29
KTPP -I 500 231
TOTAL THERMAL 2,283 1,054
TOTAL TSGENCO 2,283 1,054
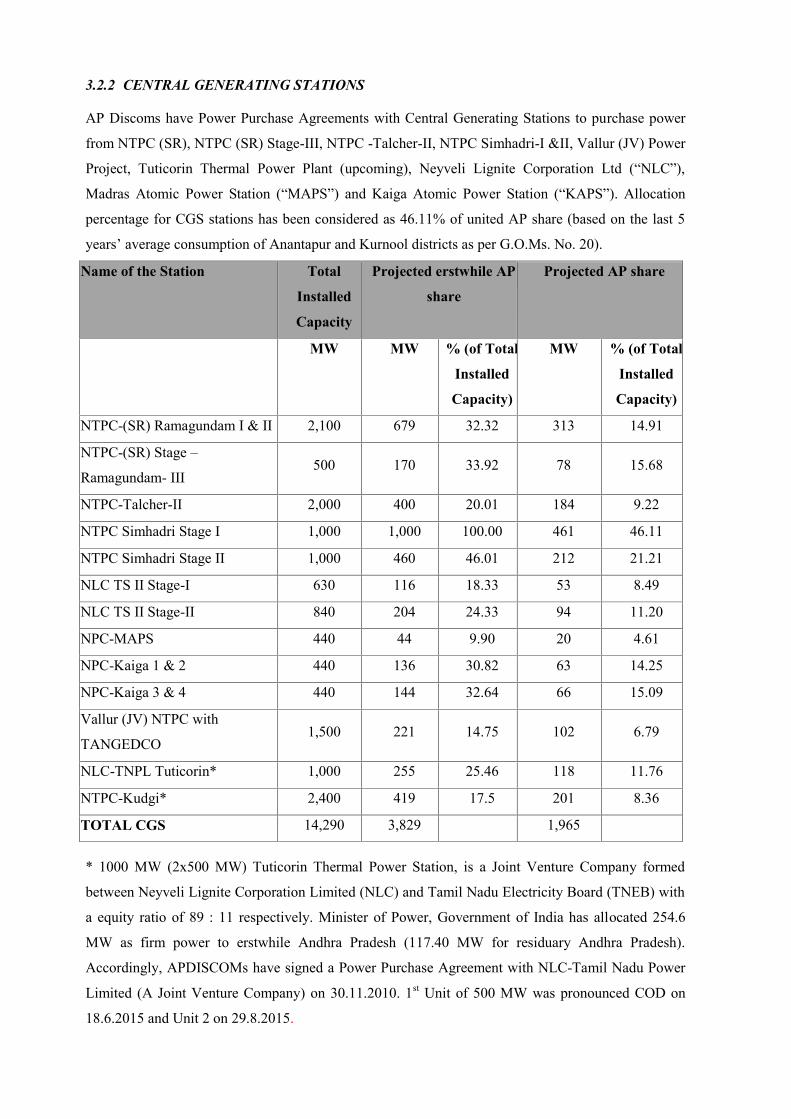
3.2.2 CENTRAL GENERATING STATIONS
AP Discoms have Power Purchase Agreements with Central Generating Stations to purchase power
from NTPC (SR), NTPC (SR) Stage-III, NTPC -Talcher-II, NTPC Simhadri-I &II, Vallur (JV) Power
Project, Tuticorin Thermal Power Plant (upcoming), Neyveli Lignite Corporation Ltd (“NLC”),
Madras Atomic Power Station (“MAPS”) and Kaiga Atomic Power Station (“KAPS”). Allocation
percentage for CGS stations has been considered as 46.11% of united AP share (based on the last 5
years’ average consumption of Anantapur and Kurnool districts as per G.O.Ms. No. 20).
Name of the Station Total
Installed
Capacity
Projected erstwhile AP
share
Projected AP share
MW MW % (of Total
Installed
Capacity)
MW % (of Total
Installed
Capacity)
NTPC-(SR) Ramagundam I & II 2,100 679 32.32 313 14.91
NTPC-(SR) Stage –
Ramagundam- III500 170 33.92 78 15.68
NTPC-Talcher-II 2,000 400 20.01 184 9.22
NTPC Simhadri Stage I 1,000 1,000 100.00 461 46.11
NTPC Simhadri Stage II 1,000 460 46.01 212 21.21
NLC TS II Stage-I 630 116 18.33 53 8.49
NLC TS II Stage-II 840 204 24.33 94 11.20
NPC-MAPS 440 44 9.90 20 4.61
NPC-Kaiga 1 & 2 440 136 30.82 63 14.25
NPC-Kaiga 3 & 4 440 144 32.64 66 15.09
Vallur (JV) NTPC with
TANGEDCO1,500 221 14.75 102 6.79
NLC-TNPL Tuticorin* 1,000 255 25.46 118 11.76
NTPC-Kudgi* 2,400 419 17.5 201 8.36
TOTAL CGS 14,290 3,829 1,965
* 1000 MW (2x500 MW) Tuticorin Thermal Power Station, is a Joint Venture Company formed
between Neyveli Lignite Corporation Limited (NLC) and Tamil Nadu Electricity Board (TNEB) with
a equity ratio of 89 : 11 respectively. Minister of Power, Government of India has allocated 254.6
MW as firm power to erstwhile Andhra Pradesh (117.40 MW for residuary Andhra Pradesh).
Accordingly, APDISCOMs have signed a Power Purchase Agreement with NLC-Tamil Nadu Power
Limited (A Joint Venture Company) on 30.11.2010. 1st Unit of 500 MW was pronounced COD on
18.6.2015 and Unit 2 on 29.8.2015.

** 2400 MW (3x800 MW) Thermal Power Project is being setting up by M/s. NTPC Ltd at Kudgi,
Karnataka. The then APDiscoms have signed a PPA with NTPC on 23.09.2010. Power shall be
allocated as per the Gadgil formula. However, the same is yet to allocate by MoP, GoI. Tentatively, as
per the Gadgil formula, the residuary A.P may get 8.36% power i.e. 200.62 MW from the said Power
Project. As informed by NTPC, the scheduled COD of 1st unit (800 MW) in September 2016 and the
scheduled COD of 2nd (800 MW) in March 2017.
3.2.3 INDEPENDENT POWER PRODUCERS (IPPs)
The following IPPs are under commercial operation in the Andhra Pradesh:
a) 216.82 MW gas-based plant at Jegurupadu by GVK Industries (“GVK”); Up on the expiry of
PPA on 20.06.2015, APDISCOMs have issued Buyout notice to M/s GVK-I and M/s GVK-I is
scheduling entire power only to APDISCOMs w.e.f. 20.06.2015.
b) 208.31 MW gas-based plant at Kakinada by Spectrum Power Generation Ltd.,
c) 355 MW (ISO) gas-based plant at Vijayawada by Lanco Kondapalli Power Ltd (“Lanco
Kondapalli”); the present PPA gets expired by 01.01.2016 and the negotiations for renewal of
PPA is under progress.
d) 220 MW gas based plant at Samalkota, East Godavari District by M/s. Reliance Power Ltd.
(formerly M/s. BSES).
The Plant Load Factor (PLF) of above four IPPs has been considered at 40% for the second half of
FY 15-16 and FY16-17
Energy allocation for gas-based IPPs has been taken as 46.11% of united Andhra Pradesh share as per
G.O. Ms. No. 20. Projected erstwhile Andhra Pradesh share and residuary Andhra Pradesh share are
as mentioned below.
Source Projected erstwhile AP share
(MW)
Projected AP share (MW)
GVK 216 216Spectrum 208 96Lanco Kondapalli (Gas) 355 164Reliance BSES 220 101TOTAL GAS-BASED IPPs 999 577
GVK Extension (220 MW), GMR Vemagiri (370 MW), Gowthami (464 MW), and Konaseema
(444.08 MW) are the new IPPs which have been commissioned in XIth Five Year Plan.

Project Name
Installed
Capacity
(MW)
Capacity
corresponding
to 50% PLF
(MW)
AP share under
e-bid RLNG
scheme for FY
2015-16(H2)
AP share
under e-bid
RLNG scheme
for FY 2016-17
Remarks
GVK Extension (IPP) 220.00 110 50.72 50.7246.11% as per
G.O.Ms.No 20
GMR Vemagiri (IPP) 370.00 185 85.30 85.30 -do-
Gautami (IPP) 464.00 232 0 106.98 -do-
Konaseema (IPP) 444.08 222 102.38 102.38 -do-
LKPL (MPP)* 1108.00 554 277 277 ---
GREL (MPP)** 768.00 384 384 384 ----
* M/s LKPL offered 50 % of capacity under e-bid RLNG to AP during the period from 01.10.2015 to
31.03.2016. It is assumed that M/s LKPL will offer 50 % of capacity under e-bid RLNG to AP during
the period from 01.04.2016 to 31.03.2017 also.
** M/s GREL offered 100 % of capacity under e-bid RLNG to AP during the period from 01.10.2015
to 31.03.2016. It is assumed that M/s GREL will offer 100 % of capacity under e-bid RLNG to AP
during the period from 01.04.2016 to 31.03.2017 also.
The Natural gas supplies from RIL KG D-6 fields to the aforesaid IPPs became zero from 01.03.2013
onwards hence there is no generation under long term PPA. The availability is subject to natural gas
supply from M/s RIL.
Energy availability has not been considered from these IPPs in the absence of RIL D-6 gas supplies.
3.2.4 AP Gas Power Corporation Ltd (“APGPCL”): Joint Sector
APGPCL is a joint sector gas-based power project. The allocation of power from this project is in
proportion to the equity share capital of participating industries. The total installed capacity of the
project along with the DISCOMs share is as given below:

Source Installed
Capacity (MW)
Projected
erstwhile AP
Share (MW)
Erstwhile AP
Share (%)
Projected AP
Share (MW)
AP Share (%)
Stage I 100 16 16% 7 7%
Stage II 172 43 25% 20 12%
Total 272 59 22% 27 10%
3.2.5 Non-Conventional Energy (NCE) Sources
The installed capacities of NCE projects in Andhra Pradesh projected for FY 2015-16 2nd half and FY
2016-17 are as given below. NCE based projects have been allocated to the AP Discoms based on
their geographical presence/location (NCE projects have signed PPAs with Discoms where they are
located. Hence the entire power is allocated to that Discom.)
Type of Project
Projected AP Share
(MW) -
FY 2015-16
Projected AP Share
(MW) -
FY 2016-17
Bio Mass Power Projects including Co-gen 143.75 141
Bagasse Cogeneration Projects. 105.20 105.20
Wind Power Projects 914.25 1414.25
Mini Hydel Power Projects 48.50 62.50
Industrial Waste Based Power Projects 21.66 21.66
Municipal Waste Based Power Projects 6.14 6.14
NCL Energy Ltd. (TB Dam) 16.5 16.5
Solar Power Projects 135 635
Solar Parks 0 250
Total 1391 2652.25
3.2.6 Mini-Power Plants
APTRANSCO had entered into a Power Purchase Agreement with LVS (36.8 MW) on 3rd January,
2009 for purchase of power in compliance with the Orders issued by Hon’ble Supreme Court and had
entered into another Power Purchase Agreement with Srivathsa (17.20 MW) power
plant. These projects have been allocated completely to APEPDCL.
3.2.7 HNPCL
GoAP directed the then APDiscoms as the successor entities of erstwhile APSEB to enter into a
continuation agreement to the PPA dated 15.04.1998 which was entered by erstwhile APSEB with
HNPCL. As such, a memorandum of agreement (MoA) was entered between the then APDiscoms and
HNPCL on 17.05.2013. As per the directions of GoAP and MoA dated 17.05.2013, the preparation of
amendments to the PPA dated 15.04.1998 is under finalization and it would be signed, shortly, by two
DISCOMs of residuary A.P. 1st unit (520 MW) was synchronized on 06.12.2015 and the 2nd unit (520
MW) may be synchronized in June 2016. As per the projections in ARR for FY 2015-16 filed by
APDiscoms and the same was approved by APERC in its Retail Tariff Order for FY 2015-16, the
entire energy available from HNPCL Thermal Power Plant has been considered for Andhra Pradesh.
3.2.8 Long Term and Medium Term Purchases
3.2.8.1 Long Term – Thermal Power Tech Corporation India Limited
APDiscoms and Telangana Discoms have signed a Power Purchase Agreement with M/s. Thermal
PowerTech Corporation India Limited (TPCIL) for a contracted capacity of 500 MW under long term
basis through Case-I bidding route for a period of 25 years. APDiscoms have been allocated a share of
46.11% (as per G.O. Ms. No. 20) i.e. 231 MW out of the total contracted capacity of 500 MW.
Variable cost per unit of Rs.1.76/kWh and fixed cost of Rs. 289.30 Crs have been considered for FY
2015-16. Variable Cost of Rs.1.81/kWh and fixed cost of Rs.302.82 Crs have been considered for FY
16-17. As per the PPA, the scheduled date of delivery for supply of 500 MW to APDiscoms and
Telangana Discoms is 01.04.2017. However, TPCIL has requested for preponement of schedule
delivery date from 01.04.2017 to 01.04.2015 since early commission of their units (2x660 MW) and
the same is under consideration by AP Discoms.
3.2.8.2 Long Term – 1000MW DBFOO Bidding
AP DISCOMS are planning to procure electricity of 1000MW on long term basis from Power
Stations on BDFOO basis and the bidding process is under progress. The energy from these sources is
considered from June 2016 at an energy availability of 90% PLF.
3.2.8.3 Medium Term – KSK Mahanadi
In the recently concluded medium term bidding for 3 years i.e. up to 15th June 2016, the AP &
Telangana Discoms have signed the Power Purchase Agreement with KSK Mahanadi for 400 MW
and are availing power since 14.08.2013. APDiscoms have been allocated a share of 46.11% (as per
G.O. Ms. No. 20) i.e. 184 MW out of the total contracted capacity of 400 MW.
AP DISCOMS have signed the Power Purchase Agreement with KSK Mahanadi for 400MW for
100% of its share from 15th June 2016 to March 31st 2017. APERC has accorded approval for the plan
under Agreement with M/s KSK Mahanadi vide O.P. No.03 of 2015 on 19.08.2015.
The licensees had also signed a PPA with Corporate Power for 150 MW, but the energy would not be
available from the source due to non-allocation of transmission capacity by PGCIL.

3.2.9 Short Term and Bilateral/ Inter-State purchases
3.2.9.1 Bilateral Purchases
The licensee has placed order of an average of 800MW to procure short term power from June 2015
to May 2016 to bridge the power deficit.
3.3 BASIS OF ESTIMATION OF POWER AVAILABILITY FOR H2 FY 2015-16 AND FY2016-17
3.3.1 GENCO (ANDHRA PRADESH GENCO & TELENGANA STATE GENCO)
3.3.1.1 Thermal Energy:
The Energy availability for H2 of FY 2015-16 has been projected based on the actual performance of
the plants up to September 2015 and projected performance estimated by GENCO from October 2015
to March 2016. For FY 2016-17, the energy availability has been projected based on the projected
performance estimated by GENCO and maintenance schedules of the plants.
The following GENCO plants have been commissioned/ assumed to be commissioned in FY 2015-16
and FY 2016-17:
1. The COD of Damodaram Sanjeevaiah Thermal power plant unit I (APGENCO, 800
MW) was declared on 05.02.2015.
2. The COD of Damodaram Sanjeevaiah Thermal power plant unit II (APGENCO, 800
MW) is was declared on 24.08.2015.
3. KTPP Stage-II (TSGENCO, 600 MW) is expected to be commissioned in December
2015.
GENCO Thermal (Net Energy Availability- MUs)
S. No. Station Name H2 FY 2015-16 FY 20156-167
APGENCO
1 Dr NTTPS-I,II,III 1857.64 3709.03
2 Dr NTTPS-IV 658.97 1494.52
3 RTPP-I 617.52 1235.04
4 RTPP-II 617.52 1235.04
5 RTPP-III 308.76 617.52
6Damodaram Sanjeevaiah
Thermal Station-I2614.48 5242.66
7 Damodaram Sanjeevaiah 2614.48 5242.66

GENCO Thermal (Net Energy Availability- MUs)
S. No. Station Name H2 FY 2015-16 FY 20156-167
Thermal Station-II
Total APGENCO 9289.38 18776.45
TSGENCO
1 KTPS-(A,B,C) 1024.37 2084.55
2 KTPS-D 735.14 1470.28
3 KTPS-VI 747.26 1494.52
4 RTS-B 91.89 183.79
5 KTPP-I 739.30 1494.52
Total TSGENCO 3337.97 6727.65
Total 12627.35 25504.11
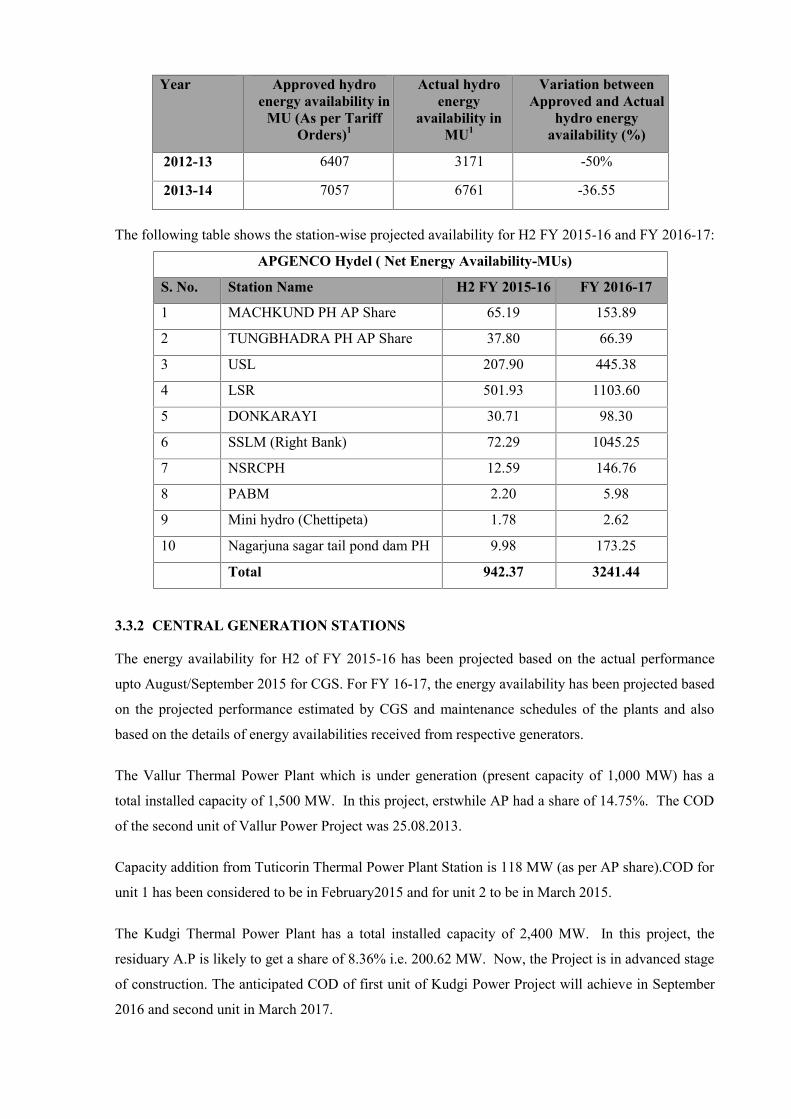
3.3.1.2 Hydro Energy:
The hydro energy availability for H2 FY 2015-16 is expected to be 942.37MU and 3241.44 MU for
FY 2016-17. Energy allocation for hydel stations is based on geographical location and therefore,
energy availability from TS GENCO stations has not been considered.
It has been observed over the past few years that the actual availability from hydel stations has been
consistently lower than the value approved in the Tariff Orders issued by APERC. The table below
shows the actual hydro energy availability from FY 2002-03 to FY 2014-15 (for erstwhile AP). In this
regard, the hydel projections have been considered to be similar to the 10 year average availability.
Year Approved hydroenergy availability in
MU (As per TariffOrders)1
Actual hydroenergy
availability inMU1
Variation betweenApproved and Actual
hydro energyavailability (%)
2002-03 6,999 3,337 -52%
2003-04 6,757 2,959 -56%
2004-05 6,423 5,267 -18%
2005-06 5,979 7,873 32%
2006-07 7,586 9,328 23%
2007-08 8,592 9,566 11%
2008-09 9,046 7,729 -15%
2009-10 8,969 5,499 -39%
2010-11 7,662 6,751 -12%
2011-12 8238 6221 -24%
1For erstwhile AP
Year Approved hydroenergy availability in
MU (As per TariffOrders)1
Actual hydroenergy
availability inMU1
Variation betweenApproved and Actual
hydro energyavailability (%)
2012-13 6407 3171 -50%
2013-14 7057 6761 -36.55
The following table shows the station-wise projected availability for H2 FY 2015-16 and FY 2016-17:
APGENCO Hydel ( Net Energy Availability-MUs)
S. No. Station Name H2 FY 2015-16 FY 2016-17
1 MACHKUND PH AP Share 65.19 153.89
2 TUNGBHADRA PH AP Share 37.80 66.39
3 USL 207.90 445.38
4 LSR 501.93 1103.60
5 DONKARAYI 30.71 98.30
6 SSLM (Right Bank) 72.29 1045.25
7 NSRCPH 12.59 146.76
8 PABM 2.20 5.98
9 Mini hydro (Chettipeta) 1.78 2.62
10 Nagarjuna sagar tail pond dam PH 9.98 173.25
Total 942.37 3241.44
3.3.2 CENTRAL GENERATION STATIONS
The energy availability for H2 of FY 2015-16 has been projected based on the actual performance
upto August/September 2015 for CGS. For FY 16-17, the energy availability has been projected based
on the projected performance estimated by CGS and maintenance schedules of the plants and also
based on the details of energy availabilities received from respective generators.
The Vallur Thermal Power Plant which is under generation (present capacity of 1,000 MW) has a
total installed capacity of 1,500 MW. In this project, erstwhile AP had a share of 14.75%. The COD
of the second unit of Vallur Power Project was 25.08.2013.
Capacity addition from Tuticorin Thermal Power Plant Station is 118 MW (as per AP share).COD for
unit 1 has been considered to be in February2015 and for unit 2 to be in March 2015.
The Kudgi Thermal Power Plant has a total installed capacity of 2,400 MW. In this project, the
residuary A.P is likely to get a share of 8.36% i.e. 200.62 MW. Now, the Project is in advanced stage
of construction. The anticipated COD of first unit of Kudgi Power Project will achieve in September
2016 and second unit in March 2017.
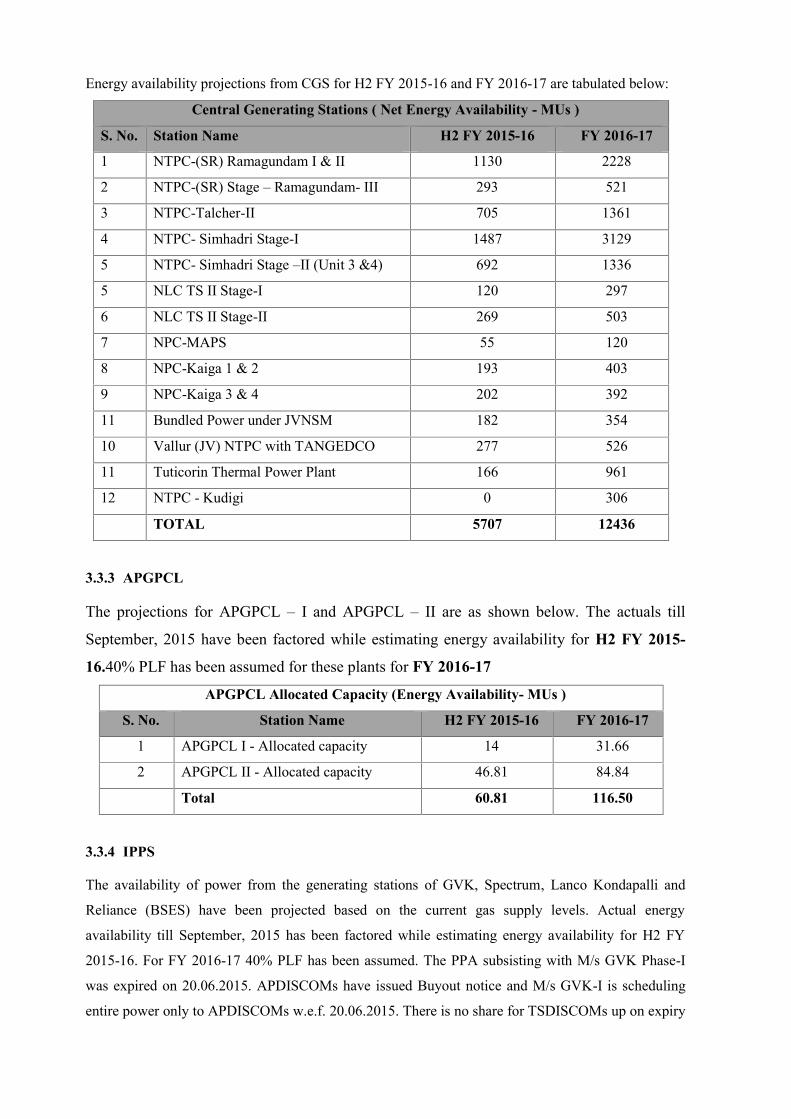
Energy availability projections from CGS for H2 FY 2015-16 and FY 2016-17 are tabulated below:
Central Generating Stations ( Net Energy Availability - MUs )
S. No. Station Name H2 FY 2015-16 FY 2016-17
1 NTPC-(SR) Ramagundam I & II 1130 2228
2 NTPC-(SR) Stage – Ramagundam- III 293 521
3 NTPC-Talcher-II 705 1361
4 NTPC- Simhadri Stage-I 1487 3129
5 NTPC- Simhadri Stage –II (Unit 3 &4) 692 1336
5 NLC TS II Stage-I 120 297
6 NLC TS II Stage-II 269 503
7 NPC-MAPS 55 120
8 NPC-Kaiga 1 & 2 193 403
9 NPC-Kaiga 3 & 4 202 392
11 Bundled Power under JVNSM 182 354
10 Vallur (JV) NTPC with TANGEDCO 277 526
11 Tuticorin Thermal Power Plant 166 961
12 NTPC - Kudigi 0 306
TOTAL 5707 12436
3.3.3 APGPCL
The projections for APGPCL – I and APGPCL – II are as shown below. The actuals till
September, 2015 have been factored while estimating energy availability for H2 FY 2015-
16.40% PLF has been assumed for these plants for FY 2016-17
APGPCL Allocated Capacity (Energy Availability- MUs )
S. No. Station Name H2 FY 2015-16 FY 2016-17
1 APGPCL I - Allocated capacity 14 31.66
2 APGPCL II - Allocated capacity 46.81 84.84
Total 60.81 116.50
3.3.4 IPPS
The availability of power from the generating stations of GVK, Spectrum, Lanco Kondapalli and
Reliance (BSES) have been projected based on the current gas supply levels. Actual energy
availability till September, 2015 has been factored while estimating energy availability for H2 FY
2015-16. For FY 2016-17 40% PLF has been assumed. The PPA subsisting with M/s GVK Phase-I
was expired on 20.06.2015. APDISCOMs have issued Buyout notice and M/s GVK-I is scheduling
entire power only to APDISCOMs w.e.f. 20.06.2015. There is no share for TSDISCOMs up on expiry
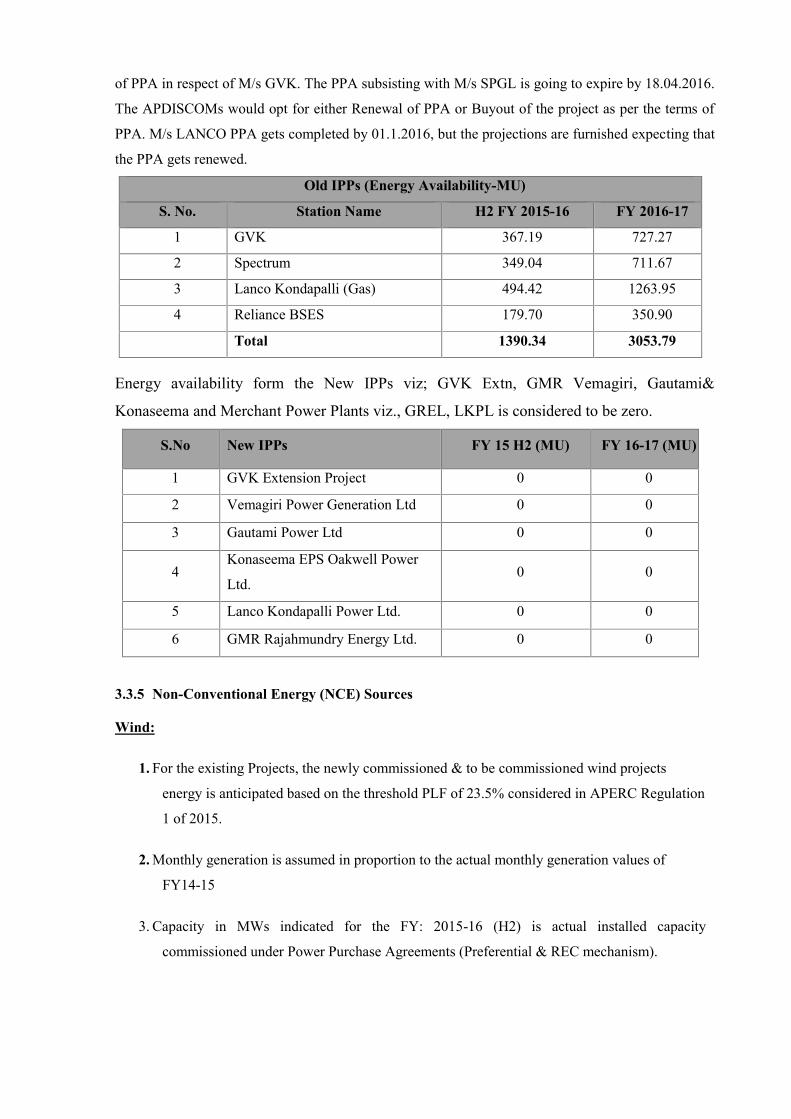
of PPA in respect of M/s GVK. The PPA subsisting with M/s SPGL is going to expire by 18.04.2016.
The APDISCOMs would opt for either Renewal of PPA or Buyout of the project as per the terms of
PPA. M/s LANCO PPA gets completed by 01.1.2016, but the projections are furnished expecting that
the PPA gets renewed.
Energy availability form the New IPPs viz; GVK Extn, GMR Vemagiri, Gautami&
Konaseema and Merchant Power Plants viz., GREL, LKPL is considered to be zero.
S.No New IPPs FY 15 H2 (MU) FY 16-17 (MU)
1 GVK Extension Project 0 0
2 Vemagiri Power Generation Ltd 0 0
3 Gautami Power Ltd 0 0
4Konaseema EPS Oakwell Power
Ltd.0 0
5 Lanco Kondapalli Power Ltd. 0 0
6 GMR Rajahmundry Energy Ltd. 0 0
3.3.5 Non-Conventional Energy (NCE) Sources
Wind:
1. For the existing Projects, the newly commissioned & to be commissioned wind projects
energy is anticipated based on the threshold PLF of 23.5% considered in APERC Regulation
1 of 2015.
2. Monthly generation is assumed in proportion to the actual monthly generation values of
FY14-15
3. Capacity in MWs indicated for the FY: 2015-16 (H2) is actual installed capacity
commissioned under Power Purchase Agreements (Preferential & REC mechanism).
Old IPPs (Energy Availability-MU)
S. No. Station Name H2 FY 2015-16 FY 2016-17
1 GVK 367.19 727.27
2 Spectrum 349.04 711.67
3 Lanco Kondapalli (Gas) 494.42 1263.95
4 Reliance BSES 179.70 350.90
Total 1390.34 3053.79
4. Capacity in MWs indicated for the FY: 16 -17 is actual installed capacity commissioned under
Power Purchase Agreements upto 15-16 plus anticipated capacity of 500MW of the
proposed 1016.4 MW by NREDCAP .
5. Tariff for the upcoming wind projects is assumed @ Rs.4.83/unit as per APERC orders dt:
01.08.2015. Further, Income Tax/MAT and ED are pass through and same are to be paid by
DISCOMs to the developers over and above the tariff.
Solar:
1. For the existing projects the newly commissioned & to be commissioned solar projects energy
is anticipated based on the threshold PLF of 19%.
2. Capacity in MWs indicated for the FY: 2015-16 (H2) is actual installed capacity
commissioned under Power Purchase Agreements and anticipated capacity considered based
on the target time lines envisaged in the Power Purchase agreements entered by the solar
developers with DISCOMs.
3. Monthly generation for FY 16-17 is assumed in proportion to the actual monthly generation
values of FY14-15
4. Capacity in MWs indicated for the FY: 16 -17 is anticipated capacity considered based on the
target time lines envisaged in the Power Purchase agreements entered by the solar
developers with DISCOMs.
5. Tariff for solar projects taken as per the PPA and the same was adopted by APERC.
6. GoAP issued the G.O. Ms No. 46, dated: 27.11.2012 for purchasing solar power of 1000MW
through competitive bidding route. Accordingly AP Discoms had initiated the bidding
process for procurement of 1000 MW of solar power during 2012-13 and PPA’s were
entered with solar power developers for a capacity of 33 MW at the tariff of Rs. 6.49/kWh
for 20 years. Out of the PPA capacity of 33 MW, 8 MW was commissioned so far.
7. Further, GoAP issued the G.O Ms. No.8, dated: 12.02.2015 and directed APDISCOMs for
procurement of 1000 MW Solar Power through competitive bidding process. Accordingly
bidding process conducted by APPCC/APSPDCL for procurement of 500 MW solar power
in phase-1, the minimum first year tariff obtained was Rs. 5.25/unit and the cut-off first year
tariff considered was Rs.5.999/unit. This tariff will be escalated at the rate of 3% per year
till 10th year and the 10th year tariff will be continued for the remaining 15 years. The
corresponding minimum levelized tariff is Rs. 6.17/unit and maximum Rs. 7.05/unit. And
APDISCOMs entered PPAs for a capacity of 619 MW with consent of APERC. Out of 619

MW, 15MW has been commissioned; 500MW of the balance capacity is expected to be
commissioned by March 31, 2016.
8. Further, GoAP also targeted to set up 3500 MW solar capacity through Solar Parks in Kurnool
and Anantapur districts with the support of Govt. of India. As a part of this, GoAP has
entered MoU with NTPC on 16.09.2014 for setting up of 1000MW solar park in Anantapur
dist. Subsequently as per the directions of GoAP, APDISCOMs had entered PPAs with M/s
NTPC for purchase of solar power from the proposed 250 MW (Phase-1) solar park at NP
Kunta, Anantapur Dist on 24.04.2015 and the 250 MW (Phase-1) will be commissioned by
April-2016.
Mini Hydel:
1. For the existing Projects anticipated energy for the FY 2015-16 (H2) & FY: 2016-17 has
been arrived based on the PLFs for the actual energy supplied for the FY 2014-15 & FY
2015-16 (H1).
2. For upcoming Mini hydel projects energy is anticipated @ 32% PLF.
3. Capacity in MWs indicated for the FY: 2015-16 (H2) and FY: 2016-17 is actual installed
capacity commissioned under Power Purchase Agreements and anticipated capacity as per
the information given by the NREDCAP.
4. Tariff for the upcoming projects is assumed as Rs. 4/unit since the APERC yet to determine
the tariff for new Mini Hydel projects.
5. Presently, Mini hydel developers are being paid APERC tariff which is exclusive of
Electricity Duty, Royalty charges and MAT/Income Tax. As and when claimed by the
developers, the same needs to be reimbursed.
Biomass, Bagasse, Industrial Waste & Municipal Solid Waste:
1. For the all existing Projects anticipated energy for the FY 2015-16 (H2) & FY: 2016-17 has
been arrived based on the PLFs for the actual energy supplied for the FY 2014-15 & FY
2015-16 (H1).
2. Capacity in MWs indicated for the FY: 2015-16 (H2) and FY: 2016-17 is actual installed
capacity commissioned under Power Purchase Agreements.
3. Upcoming projects in these categories are nil.
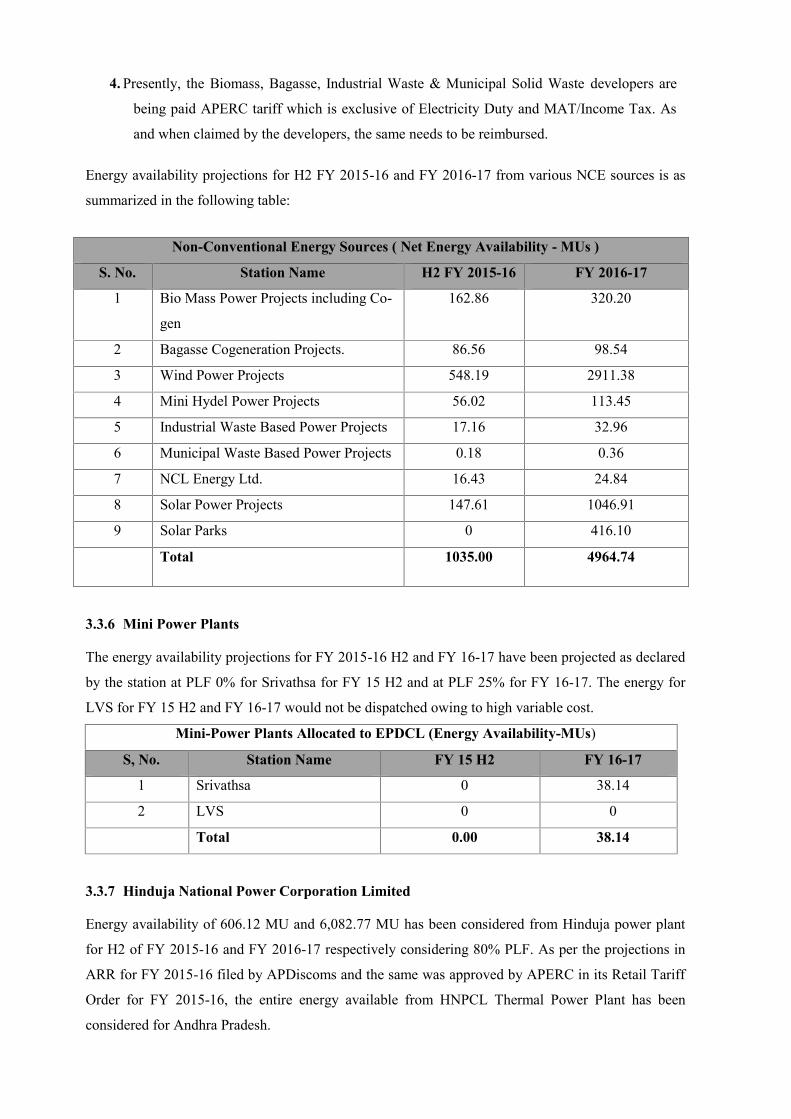
4. Presently, the Biomass, Bagasse, Industrial Waste & Municipal Solid Waste developers are
being paid APERC tariff which is exclusive of Electricity Duty and MAT/Income Tax. As
and when claimed by the developers, the same needs to be reimbursed.
Energy availability projections for H2 FY 2015-16 and FY 2016-17 from various NCE sources is as
summarized in the following table:
3.3.6 Mini Power Plants
The energy availability projections for FY 2015-16 H2 and FY 16-17 have been projected as declared
by the station at PLF 0% for Srivathsa for FY 15 H2 and at PLF 25% for FY 16-17. The energy for
LVS for FY 15 H2 and FY 16-17 would not be dispatched owing to high variable cost.
Mini-Power Plants Allocated to EPDCL (Energy Availability-MUs)
S, No. Station Name FY 15 H2 FY 16-17
1 Srivathsa 0 38.14
2 LVS 0 0
Total 0.00 38.14
3.3.7 Hinduja National Power Corporation Limited
Energy availability of 606.12 MU and 6,082.77 MU has been considered from Hinduja power plant
for H2 of FY 2015-16 and FY 2016-17 respectively considering 80% PLF. As per the projections in
ARR for FY 2015-16 filed by APDiscoms and the same was approved by APERC in its Retail Tariff
Order for FY 2015-16, the entire energy available from HNPCL Thermal Power Plant has been
considered for Andhra Pradesh.
Non-Conventional Energy Sources ( Net Energy Availability - MUs )
S. No. Station Name H2 FY 2015-16 FY 2016-17
1 Bio Mass Power Projects including Co-
gen
162.86 320.20
2 Bagasse Cogeneration Projects. 86.56 98.54
3 Wind Power Projects 548.19 2911.38
4 Mini Hydel Power Projects 56.02 113.45
5 Industrial Waste Based Power Projects 17.16 32.96
6 Municipal Waste Based Power Projects 0.18 0.36
7 NCL Energy Ltd. 16.43 24.84
8 Solar Power Projects 147.61 1046.91
9 Solar Parks 0 416.10
Total 1035.00 4964.74
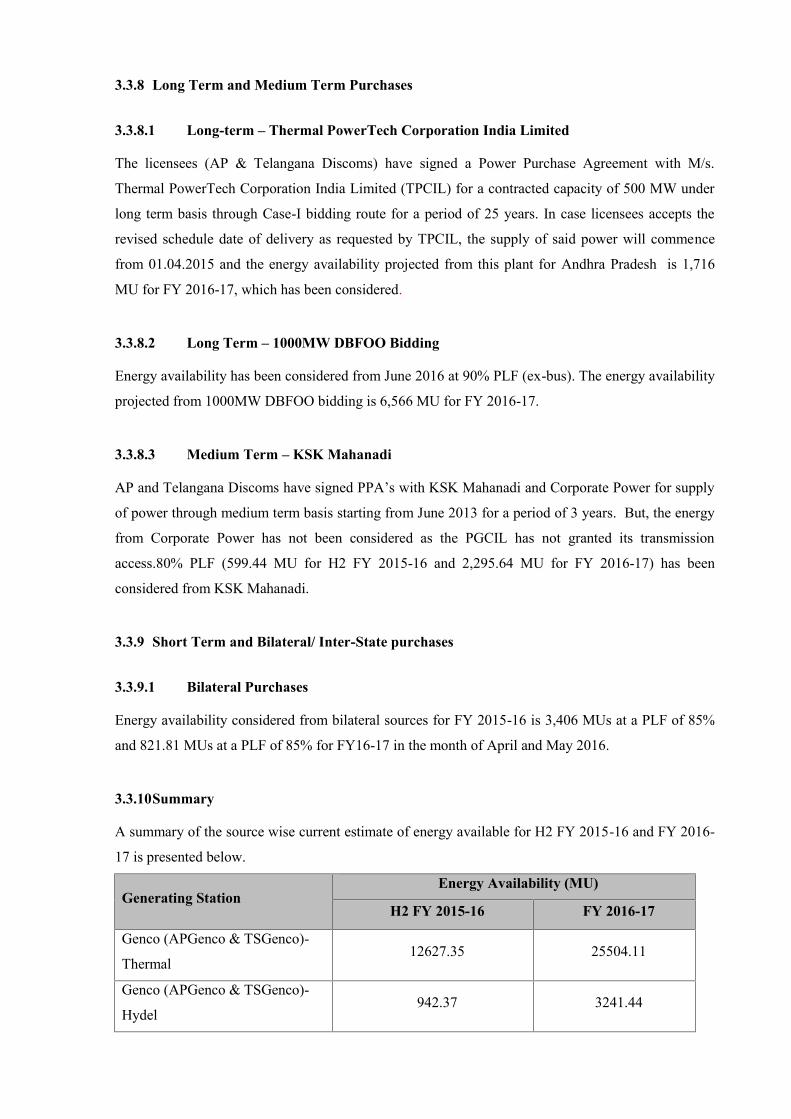
3.3.8 Long Term and Medium Term Purchases
3.3.8.1 Long-term – Thermal PowerTech Corporation India Limited
The licensees (AP & Telangana Discoms) have signed a Power Purchase Agreement with M/s.
Thermal PowerTech Corporation India Limited (TPCIL) for a contracted capacity of 500 MW under
long term basis through Case-I bidding route for a period of 25 years. In case licensees accepts the
revised schedule date of delivery as requested by TPCIL, the supply of said power will commence
from 01.04.2015 and the energy availability projected from this plant for Andhra Pradesh is 1,716
MU for FY 2016-17, which has been considered.
3.3.8.2 Long Term – 1000MW DBFOO Bidding
Energy availability has been considered from June 2016 at 90% PLF (ex-bus). The energy availability
projected from 1000MW DBFOO bidding is 6,566 MU for FY 2016-17.
3.3.8.3 Medium Term – KSK Mahanadi
AP and Telangana Discoms have signed PPA’s with KSK Mahanadi and Corporate Power for supply
of power through medium term basis starting from June 2013 for a period of 3 years. But, the energy
from Corporate Power has not been considered as the PGCIL has not granted its transmission
access.80% PLF (599.44 MU for H2 FY 2015-16 and 2,295.64 MU for FY 2016-17) has been
considered from KSK Mahanadi.
3.3.9 Short Term and Bilateral/ Inter-State purchases
3.3.9.1 Bilateral Purchases
Energy availability considered from bilateral sources for FY 2015-16 is 3,406 MUs at a PLF of 85%
and 821.81 MUs at a PLF of 85% for FY16-17 in the month of April and May 2016.
3.3.10Summary
A summary of the source wise current estimate of energy available for H2 FY 2015-16 and FY 2016-
17 is presented below.
Generating StationEnergy Availability (MU)
H2 FY 2015-16 FY 2016-17
Genco (APGenco & TSGenco)-
Thermal12627.35 25504.11
Genco (APGenco & TSGenco)-
Hydel942.37 3241.44

Generating StationEnergy Availability (MU)
H2 FY 2015-16 FY 2016-17
CGS 5707.51 12436.63
APGPCL 60.81 116.50
IPPS 1390.34 3053.79
NCEs 1035.00 4964.74
Mini Power Plants 0.00 38.14
HNPCL 606.12 6,082.77
Long Term & Medium Term 1484.03 10,578.73
Short Term & Bilateral Purchases 3,406 821.81
Total 27,323 66,839
3.4 POWER PURCHASE COST
3.4.1 GENCO (ANDHRA PRADESH GENCO & TELENGANA STATE GENCO)
The annual fixed costs for all APGENCO stations for FY 2015-16 have been considered as approved
by APERC in its order dated 31.05.2014 in OP No.15/2009 filed by APGENCO for determination of
tariff for FY 2009-14 which includes the year 2013-14. The fixed cost for FY 2014-15 was admitted
as per approved tariff order for FY 2013-14 and subsequently, truing up of fixed cost for FY 2014-15
was done as per orders of APERC dt 31.05.2014 in OP No.15/2009.The fixed costs have been
considered as per the projections of APGENCO for FY 2016-17.
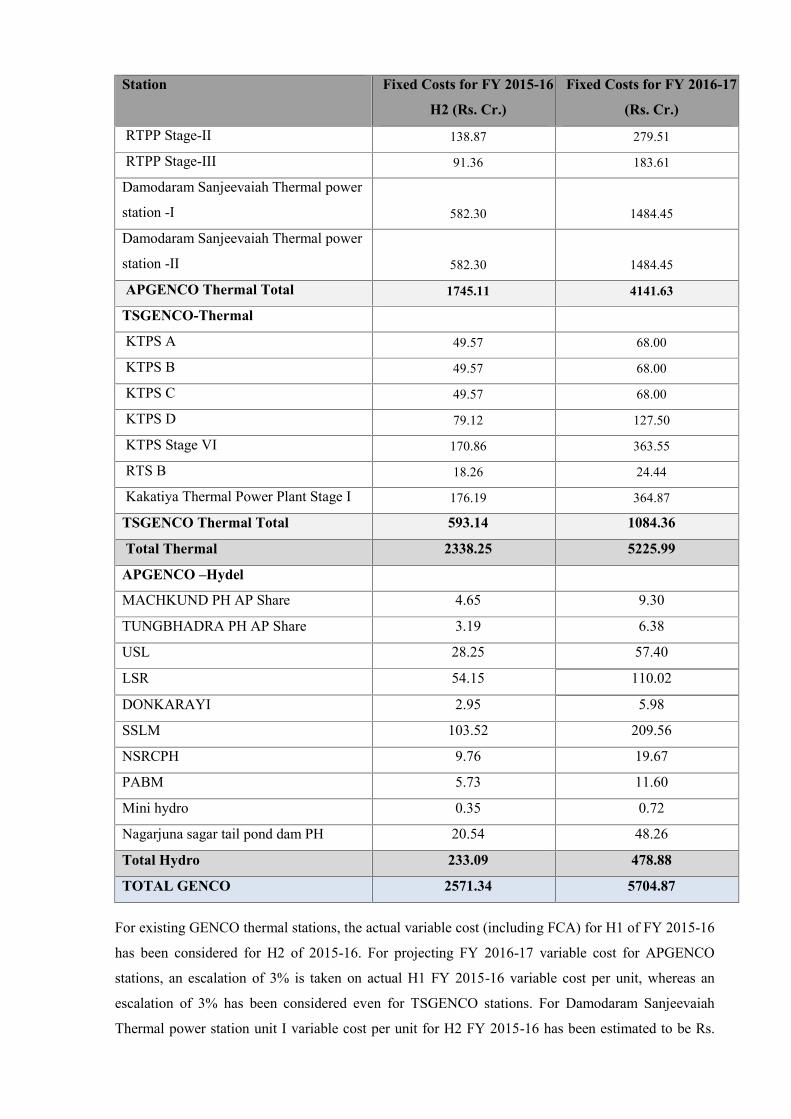
The total fixed costs for all the GENCO thermal and hydel stations2 including both existing and new
stations is Rs. 2,571.34 Crs for H2 of FY 2015- 16 and Rs. 5,704.87 Crs for FY 2016-17. The fixed
costs for GENCO Thermal and Hydel stations have been tabulated below:
Station Fixed Costs for FY 2015-16
H2 (Rs. Cr.)
Fixed Costs for FY 2016-17
(Rs. Cr.)
APGENCO-Thermal
VTPS I 45.01 91.71
VTPS II 45.01 91.71
VTPS III 45.01 91.71
VTPS IV 146.86 295.62
RTPP I 68.38 138.86
2The fixed costs for TSGENCO stations have not been mentioned because energy availability from only APGENCO hydel
stations have been considered (allocation based on geographical location).
Station Fixed Costs for FY 2015-16
H2 (Rs. Cr.)
Fixed Costs for FY 2016-17
(Rs. Cr.)
RTPP Stage-II 138.87 279.51
RTPP Stage-III 91.36 183.61
Damodaram Sanjeevaiah Thermal power
station -I 582.30 1484.45
Damodaram Sanjeevaiah Thermal power
station -II 582.30 1484.45
APGENCO Thermal Total 1745.11 4141.63
TSGENCO-Thermal
KTPS A 49.57 68.00
KTPS B 49.57 68.00
KTPS C 49.57 68.00
KTPS D 79.12 127.50
KTPS Stage VI 170.86 363.55
RTS B 18.26 24.44
Kakatiya Thermal Power Plant Stage I 176.19 364.87
TSGENCO Thermal Total 593.14 1084.36
Total Thermal 2338.25 5225.99
APGENCO –Hydel
MACHKUND PH AP Share 4.65 9.30
TUNGBHADRA PH AP Share 3.19 6.38
USL 28.25 57.40
LSR 54.15 110.02
DONKARAYI 2.95 5.98
SSLM 103.52 209.56
NSRCPH 9.76 19.67
PABM 5.73 11.60
Mini hydro 0.35 0.72
Nagarjuna sagar tail pond dam PH 20.54 48.26
Total Hydro 233.09 478.88
TOTAL GENCO 2571.34 5704.87
For existing GENCO thermal stations, the actual variable cost (including FCA) for H1 of FY 2015-16
has been considered for H2 of 2015-16. For projecting FY 2016-17 variable cost for APGENCO
stations, an escalation of 3% is taken on actual H1 FY 2015-16 variable cost per unit, whereas an
escalation of 3% has been considered even for TSGENCO stations. For Damodaram Sanjeevaiah
Thermal power station unit I variable cost per unit for H2 FY 2015-16 has been estimated to be Rs.

2.52/unit considering that 30% imported coal, 30% MCL washed coal and 40% domestic coal to be
used. Rs. 2.20/unit for FY16-17 variable cost has been assumed as the units will be running at
85%PLFfor FY 2016-17.Same variable cost per unit has been considered for Damodaram Sanjeevaiah
Thermal power station unit II for FY 2016-17
It has been observed over the past few years that usage of imported coal has become necessary to
bridge fuel shortfall, leading to a steady increase in the variable cost over the past few years. The
station-wise variable rates that have been projected for APGENCO thermal plants & TSGENCO
thermal Plants for H2 FY 2015-16 H2 and for FY 2016-17are as follows:
Station Variable rate (Rs./kWh)
H2 FY 2015-16
Variable rate (Rs./kWh)
FY 2016-17
APGENCO Stations
VTPS (I, II, III) 3.30 3.34
VTPS-IV 3.21 3.3
RTPP-I 3.76 3.87
RTPP-II 3.76 3.87
RTPP-III 3.76 3.87
Damodaram
Sanjeeviah TPS-I2.52
2.20
Damodaram
Sanjeeviah TPS-II2.52
2.20
TSGENCO Stations
KTPS (A, B, C) 1.64 1.69
KTPS- D 1.50 1.55
KTPS-VI 2.74 2.82
RTS- B 3.01 3.10
KTPP-I 2.42 2.50
The incentives for GENCO thermal stations are calculated based on APERC Regulation No 1 of
2008, at a flat rate of 25 paisa/kWh for ex-bus scheduled energy corresponding to scheduled
generation in excess of ex-bus energy corresponding to target Plant Load Factor.
CGS:
3.4.1.1.1 NTPC (SR) (2100 MW)
CERC had notified the terms & conditions of tariff regulations for the control period FY 2014-19 i.e.,
for a period of 5 years and the regulations, 2014 was published by CERC by end of February 2014.
CERC had modified the terms & conditions for determination of fixed charges as well as energy

charges to the ensuing control period for inter-state generating stations. CERC provided the revised
regulations stating that beneficiaries would pay the fixed charges for FY 2016-17 and energy charges
to the Inter-State Generating stations based on the approved charges for FY 2013-14 and energy
charges norms as per the regulations, 2009 till the finalization of orders for the respective inter-state
generating station i.e., NTPC & NLC, JV. Due to non-availability of orders of CERC, the fixed
charges were considered based on the CERC approved charges for FY 2013-14. The incentives
payable had been considered as 50 paise per unit based on the actual PLF above threshold level of
85% as per the prevailing regulations of CERC, 2014. In the orders of CERC for FY 2013-14, the
income tax was grossed up in ROE component as per the regulations, 2009 and hence, the fixed
charges determined for H2 FY 2015-16 and FY 2016-17 are inclusive of income tax. Based on the
availability projections, the fixed charges along with payable incentives are computed for H2 FY
2015-16 and FY 2016-17 for Ramagundam I & II. AP has a share of 14.91% from Ramagundam I &
II. Variable cost per unit for H2 FY 2015-16 has been considered same as actual per unit variable
cost as H1 FY 2015-16. FY 2016-17 per unit variable cost has been projected by considering 3%
escalation on the VC of H1 FY 2015-16. The recoverable PLF of fixed charges are 83% only based
on the availability of generating station subject to any coal shortages occur, as per new regulations,
2014. Due to non-finalization of fixed charges in every year of the control period FY 2014-19, the
prevailing fixed charges for FY 2013-14 had been recovered by NTPC by considering 83% PLF on
availability. NTPC had submitted the tariff petition of Ramagundam I & II as per Regulations, 2014
before Hon’ble CERC for determination of fixed charges to the control period 2014-19.
3.4.1.1.2 NTPC (SR) STAGE-III (500 MW)
CERC had notified the terms & conditions of tariff regulations for the control period FY 2014-19 i.e.,
for a period of 5 years and the regulations, 2014 was published by CERC by end of February 2014.
CERC had modified the terms & conditions for determination of fixed charges as well as energy
charges to the ensuing control period for inter-state generating stations. CERC provided the revised
regulations stating that beneficiaries would pay the fixed charges for FY 2016-17 and energy charges
to the inter-state generating stations based on the approved charges for FY 2013-14 and energy
charges norms as per the regulations, 2009 till the finalization of orders for the respective inter-state
generating stations i.e., NTPC & NLC, JV. Due to non-availability of orders of CERC, the fixed
charges were considered based on the CERC approved charges for FY 2013-14. The incentives
payable had been considered as 50 paise per unit based on the actual PLF above threshold level of
85% as per the prevailing regulations of CERC, 2014. In the orders of CERC for FY 2013-14, the
income tax was grossed up in ROE component as per the regulations, 2009 and hence, the fixed
charges determined for H2 FY 2015-16 and FY 2016-17 are inclusive of income tax. Based on the
availability projections, the fixed charges along with payable incentives are computed for H2 FY
2015-16 and FY 2016-17 in case of Ramagundam III. AP has a share of 15.68% from Ramagundam
III. Variable cost per unit for H2 FY 2015-16 has been considered same as actual per unit variable

cost as H1 FY 2015-16. FY 2016-17 per unit variable cost has been projected by considering 3%
escalation on the VC of H1 FY 2015-16. The recoverable PLF of fixed charges are 83% only based
on availability of generating station subject to any coal shortages occur, as per new regulations, 2014.
Due to non-finalization of fixed charges in every year to the control period 2014-19, the prevailing
fixed charges for FY 13-14 had been recovered by NTPC by considering 83% PLF on availability.
NTPC had submitted the tariff petition of Ramagundam III as per Regulations, 2014 before Hon’ble
CERC for determination of fixed charges to the control period 2014-19.
3.4.1.1.3 NTPC-TALCHER -II (2000 MW)
CERC had notified the terms & conditions of tariff regulations for the control period FY 2014-19 i.e.,
for a period of 5 years and the regulations, 2014 was published by CERC by end of February 2014.
CERC had modified the terms & conditions for determination of fixed charges as well as energy
charges for the ensuing control period for inter-state generating stations. CERC provided the revised
regulations stating that beneficiaries would pay the fixed charges for FY 2016-17 and energy charges
to the inter-state generating stations based on the approved charges for FY 2013-14 and energy
charges as per the regulations, 2009 till the finalization of orders for the respective inter-state
generating station i.e., NTPC & NLC, JV. Due to non-availability of orders of CERC, the fixed
charges were considered based on the CERC approved charges for FY 2013-14. The incentives
payable had been considered as 50 paise per unit based on the actual PLF above threshold level of
85% as per the prevailing regulations of CERC, 2014. In the orders of CERC for FY 2013-14, the
income tax was grossed up in ROE component as per the regulations, 2009 and hence, the fixed
charges determined for H2 FY 2015-16 and FY 2016-17 are inclusive of income tax. Based on the
availability projections, the fixed charges along with payable incentives are computed for H2 FY
2015-16 and FY 2016-17 for Talcher-II. AP has a share of 9.22% from Talcher-II. Variable cost per
unit for H2 FY 2015-16 has been considered same as actual per unit variable cost as H1 FY 2015-16.
FY 2016-17 per unit variable cost has been projected by considering 3% escalation on the VC of H1
FY 2015-16. The recoverable PLF of fixed charges are 83% only based on availability of generating
station subject to any coal shortages occur, as per new regulations, 2014. Due to non-finalization of
fixed charges in every year of the control period FY 2014-19, the prevailing fixed charges for FY
2013-14 had been recovered by NTPC by considering 83% PLF on availability. NTPC had submitted
the tariff petition of Talcher II as per Regulations, 2014 before Hon’ble CERC for determination of
fixed charges to the control period 2014-19.
3.4.1.1.4 NTPC SIMHADRI STAGE-I (1000 MW)
CERC had notified the terms & conditions of tariff regulations for the control period FY 2014-19 i.e.,
for a period of 5 years and the regulations, 2014 was published by CERC by end of February 2014.
CERC had modified the terms & conditions for determination of fixed charges as well as energy

charges to the ensuing control period for inter-state generating stations. CERC provided the revised
regulations stating that beneficiaries would pay the fixed charges for FY 2016-17 and energy charges
to the inter-state generating stations based on the approved charges for FY 2013-14 and energy
charges norms as per the regulations, 2009 till the finalization of orders for the respective inter-state
generating station i.e., NTPC & NLC, JV. Due to non-availability of orders of CERC, the fixed
charges were considered based on the CERC approved charges for FY 2013-14. The incentives
payable had been considered as 50 paise per unit based on the actual PLF above threshold level of
85% as per the prevailing regulations of CERC, 2014. In the orders of CERC for FY 2013-14, the
income tax was grossed up in ROE component as per the regulations, 2009 and hence, the fixed
charges determined for H2 FY 2015-16 and FY 2016-17 are inclusive of income tax. Based on the
availability projections, the fixed charges along with payable incentives are computed for H2 FY
2015-16 and FY 2016-17 in case of Simhadri Stage-I. AP has a share of 46.11% from Simhadri
Stage-I. Variable cost per unit for H2 FY 2015-16 has been considered same as actual per unit
variable cost as H1 FY 2015-16. FY 2016-17 per unit variable cost has been projected by
considering 3% escalation on the VC of H1 FY 2015-16. The recoverable PLF of fixed charges are
83% only based on availability of generating station subject to any coal shortages occur, as per new
regulations, 2014. Due to non-finalization of fixed charges in every year of the control period FY
2014-19, the prevailing fixed charges for FY 2013-14 had been recovered by NTPC by considering
83% PLF on availability. NTPC had submitted the tariff petition of Simhadri Stage I as per
Regulations, 2014 before Hon’ble CERC for determination of fixed charges to the control period
2014-19.
3.4.1.1.5 NTPC- SIMHADRI II (1000 MW)
CERC had notified the terms & conditions of tariff regulations for the control period FY 2014-19 i.e.,
for a period of 5 years and the regulations, 2014 was published by CERC by end of February 2014.
CERC had modified the terms & conditions for determination of fixed charges as well as energy
charges for the ensuing control period for inter-state generating stations. CERC provided the revised
regulations stating that beneficiaries would pay the fixed charges for FY 2016-17 and energy charges
to the inter-state generating stations based on the approved charges for FY 2013-14 and energy
charges as per the regulations, 2009 till the finalization of orders for the respective inter-state
generating station i.e., NTPC & NLC, JV. Due to non-availability of orders of CERC, the fixed
charges were considered based on the CERC approved charges for FY 2013-14. The incentives
payable had been considered as 50 paise per unit based on the actual PLF above threshold level of
85% as per the prevailing regulations of CERC, 2014. In the orders of CERC for FY 2013-14, the
income tax was grossed up in ROE component as per the regulations, 2009 and hence, the fixed
charges determined for H2 FY 2015-16 and FY 2016-17 are inclusive of income tax. Based on the
availability projections, the fixed charges along with payable incentives are computed for H2 FY
2015-16 and FY 2016-17 in case of Simhadri Stage-II. AP has a share of 21.11% from Simhadri
Stage-II. Variable cost per unit for H2 FY 2015-16 has been considered same as actual per unit
variable cost as H1 FY 2015-16. FY 2016-17 per unit variable cost has been projected by
considering 3% escalation on the VC of H1 FY 2015-16. The recoverable PLF of fixed charges are
83% only based on availability of generating station subject to any coal shortages occur, as per new
regulations, 2014. Due to non-finalization of fixed charges in every year of the control period FY
2014-19, the prevailing fixed charges for FY 2013-14 had been recovered by NTPC by considering
83% PLF on availability.
3.4.1.1.6 NLC Stage –I (630 MW)
For the APDISCOMs share of 8.49 % of 630 MW, the payable fixed charges and lignite cost for the
Control Period of FY 2009-14 was determined by CERC in its final orders of NLC TPS-II (Stage-I).
The lignite costs for the Control Period of FY 2014-19 is yet to be determined by Ministry of Coal,
GOI. Variable cost per unit for H2 FY 2015-16 has been considered same as actual per unit variable
cost as H1 FY 2015-16. FY 2016-17 per unit variable cost has been projected by considering 3%
escalation on the VC of H1 FY 2015-16.
3.4.1.1.7 NLC Stage –II (840 MW)
For the APDISCOMs share of 11.20 % of 840 MW, the payable fixed charges and lignite cost for the
Control Period of FY 2009-14 was determined by CERC in its final orders of NLC TPS-II. (Stage-II).
The lignite cost for the Control Period FY 2014-19 is yet to be determined by Ministry of Coal, GOI.
Variable cost per unit for H2 FY 2015-16 has been considered same as actual per unit variable cost as
H1 FY 2015-16. FY 2016-17 per unit variable cost has been projected by considering 3% escalation
on the VC of H1 FY 2015-16.
3.4.1.1.8 KAIGA ATOMIC POWER STATION 1 & 2 (440 MW) and 3 & 4 (440MW):
The AP share from Kaiga 1 & 2 is 14.25% and from Kaiga 3 &4 is 15.09%. The tariff for Kaiga 1&2
and Kaiga 3&4 for H2 FY 2015-16 has been considered same as the tariff in H1 FY 2015-16. FY
2016-17 per unit variable cost has been projected by considering 3% escalation on the VC of H1 FY
2015-16.
3.4.1.1.9 Vallur Thermal JV Power Project (NTPC & TANGEDCO):
Ministry of Power, GOI had allocated firm share of 11.87% from total capacity of 1500 MW to
erstwhile AP and 12.25% was considered for erstwhile AP inclusive unallocated power. Presently,
Units 1, 2 & 3 are under generation and 93 MW is being availed by AP Discoms from this power
project. NTECL had made filings before CERC for determination of tariff for the control period 2014-
19 for this JV Project and provisional orders were yet to be issued by CERC for payment of fixed
charges. The fixed charges for H2 FY 2015-16 and FY 2016-17 are computed based on the 85% of
AFC (for units 1,2&3) as approved by CEO(NTECL) pending tariff order from Hon'ble CERC for
FY 2014-15 for Vallur power project. Variable cost per unit for H2 FY 2015-16 has been considered
same as actual per unit variable cost as H1 FY 2015-16. FY 2016-17 per unit variable cost has been
projected by considering 3% escalation on the VC of H1 FY 2015-16.The incentives payable have
been factored into the fixed charges. In the orders of CERC, the income tax was grossed up in ROE
component as per the regulations, 2009 and hence, the fixed charges determined for H2 FY 2015-16
and FY 2016-17 are inclusive of income tax. As per the Central Electricity Regulatory Commission
(Terms and Conditions of Tariff) Regulations, 2009, incentives are also part of fixed charges which
are to be computed every month based on the formulae provided in the Regulations. Based on the
availability projections, the fixed charges along with payable incentives are considered for H2 FY
2015-16 and FY 2016-17.
3.4.1.1.10 NLC-TNPL Tuticorin
A joint venture power project of NLC and TNEB had implemented at Tuticorin with an installed
capacity of 1000MWs. Both the units were declared the COD and presently, AP is availing 132 MWs
from this power project. M/s. NTPL had filed the tariff petition before Hon’ble CERC for
determination of fixed charges to the control period 2014-19. Based on these filings, CERC had
issued the provisional orders. The fixed charges are computed based on the availability projections
duly considering the 30% PLF for H2 FY 15-16 and with 100% PLF for FY 16-17, as submitted by
NTPL. Variable cost per unit for H2 FY 2015-16 has been considered same as actual per unit
variable cost as H1 FY 2015-16. FY 2016-17 per unit variable cost has been projected by
considering 3% escalation on the VC of H1 FY 2015-16. The payable incentives were computed by
considering the regulations, 2014 i.e., 50 paise per unit above the threshold PLF of 85%.
3.4.1.1.11 NTPC-Kudgi
As informed by NTPC, the estimated total cost per unit is Rs. 4.20 (Fixed Cost of Rs. 2.31 and
Variable Cost of Rs. 1.89) during the first year. A petition will be filed before Hon’ble CERC for
determination of tariff based on the capital cost before synchronization of the first unit i.e. in March
2016. For the period between the achievement of CoD and determination of tariff by CERC, the
Company will raise bills based on the provisional tariff and reconciliation will be done after
finalization of tariff by CERC.
3.4.2 APGPCL
The power purchase cost incurred by APDISCOMs for procurement from APGPCL for H2 FY 2015-
16 and FY 2016-17 are as per the projections given by APGPCL.
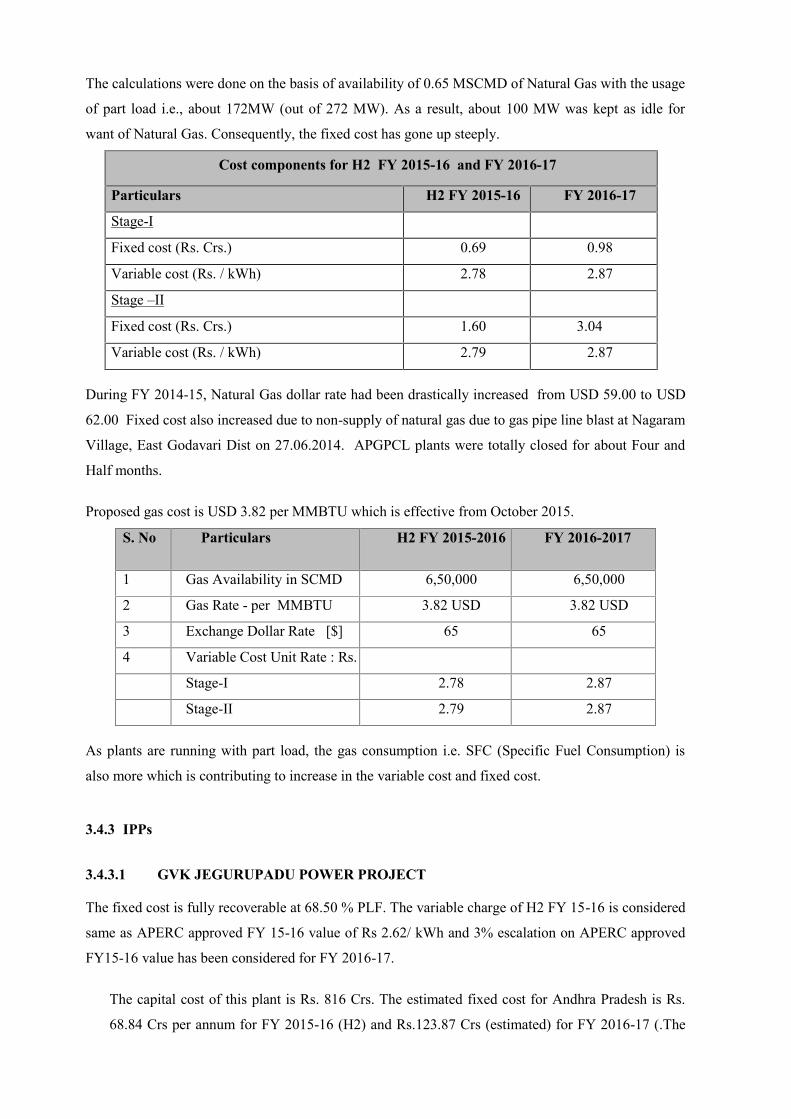
The calculations were done on the basis of availability of 0.65 MSCMD of Natural Gas with the usage
of part load i.e., about 172MW (out of 272 MW). As a result, about 100 MW was kept as idle for
want of Natural Gas. Consequently, the fixed cost has gone up steeply.
Cost components for H2 FY 2015-16 and FY 2016-17
Particulars H2 FY 2015-16 FY 2016-17
Stage-I
Fixed cost (Rs. Crs.) 0.69 0.98
Variable cost (Rs. / kWh) 2.78 2.87
Stage –II
Fixed cost (Rs. Crs.) 1.60 3.04
Variable cost (Rs. / kWh) 2.79 2.87
During FY 2014-15, Natural Gas dollar rate had been drastically increased from USD 59.00 to USD
62.00 Fixed cost also increased due to non-supply of natural gas due to gas pipe line blast at Nagaram
Village, East Godavari Dist on 27.06.2014. APGPCL plants were totally closed for about Four and
Half months.
Proposed gas cost is USD 3.82 per MMBTU which is effective from October 2015.
S. No Particulars H2 FY 2015-2016 FY 2016-2017
1 Gas Availability in SCMD 6,50,000 6,50,000
2 Gas Rate - per MMBTU 3.82 USD 3.82 USD
3 Exchange Dollar Rate [$] 65 65
4 Variable Cost Unit Rate : Rs.
Stage-I 2.78 2.87
Stage-II 2.79 2.87
As plants are running with part load, the gas consumption i.e. SFC (Specific Fuel Consumption) is
also more which is contributing to increase in the variable cost and fixed cost.
3.4.3 IPPs
3.4.3.1 GVK JEGURUPADU POWER PROJECT
The fixed cost is fully recoverable at 68.50 % PLF. The variable charge of H2 FY 15-16 is considered
same as APERC approved FY 15-16 value of Rs 2.62/ kWh and 3% escalation on APERC approved
FY15-16 value has been considered for FY 2016-17.
The capital cost of this plant is Rs. 816 Crs. The estimated fixed cost for Andhra Pradesh is Rs.
68.84 Crs per annum for FY 2015-16 (H2) and Rs.123.87 Crs (estimated) for FY 2016-17 (.The

PPA subsisting with M/s.GVK was expired on 20.06.2015. APDISCOMs had issued Buyout
notice and M/s.GVK is scheduling entire power only to APDISCOMs w.e.f. 20.06.2015. There is
no share for TSDISCOMs upon expiry of PPA in respect of M/s.GVK). The fixed cost includes
foreign exchange variations payable by APDISCOMs to the generator as per the provisions of
Power Purchase Agreement. The actual fixed cost as settled by the licensee may be different from
the estimates as presented above on account of the monthly Foreign Exchange Rate Variation
(FERV). The licensee submits to the Hon’ble Commission to allow the licensee to subsequently
claim the change in fixed cost on account of FERV.
Deemed / Notional generation claims will be payable to the generator up to 85 % PLF as per the
incentive formulae provided in the PPA.
Computation of incentive has been carried out based on the formula provided in the PPA. As there is
gas deficit the expected PLF for H2 FY 2015-16 and for FY 2016-17 is 40%. Hence incentive may
not be applicable for H2 FY 2014-15 and FY 2015-16.
Incentive payment = Equity x (PLF - 68.50) x 0.00525;
Equity = Rs. 244.80 Crs;
Projected incentive for H2 FY 2015-16 is Rs. 0.00 Crs and for FY 2016-17 is Rs. 0.00 Crs (as there is
deficit of gas).
3.4.3.2 SPECTRUM
The fixed cost is fully recoverable at 68.50 % PLF. The variable charge of H2 FY 15-16 is considered
same as APERC approved FY 15-16 value of Rs 2.76/ kWh and 3% escalation on APERC approved
FY15-16 value has been considered for FY 2016-17.
The estimated fixed cost for Andhra Pradesh is Rs. 63.12 Crs per annum for FY 2015-16 and Rs.5.60
Crs for FY 2016-17 (In respect of M/s. SPGL power is sharing by AP & TS DISCOMs as per
G.O.Ms.No.20 Dt.08.05.2014 but Projections are made considering full capacity of the plant (not AP
share). Further, the PPA subsiding with M/s. SPGL is going to expire by 18.04.2016. The
APDISCOMs yet to decide for choosing the options either Renewal of PPA or Buyout of the project.
Hence the projections are shown only up to 18.04.2016). The fixed cost is inclusive of foreign
exchange variations payable by APDISCOMs to the generator as per the provisions of Power
Purchase Agreement.
The actual fixed cost as settled by the licensee may be different from the estimates as presented above
on account of the monthly Foreign Exchange Rate Variation (FERV). The licensee submits to the
Hon’ble Commission to allow the licensee to subsequently claim the change in fixed cost on account

of FERV.
Deemed / Notional generation claims will be payable to the generator up to 85% PLF as per the
incentive formulae provided in the PPA.
Computation of incentive has been carried out based on the formula provided in the PPA. As there is
gas deficit the expected PLF for H2 FY 2015-16 and for FY 2016-17 is 40% (The projections are
taken only up to 18.04.2016). Hence incentive may not be applicable for H2 FY 2014-15 and FY
2015-16.
Incentive payment = Equity x (PLF - 68.50) x 0.004 (if PLF > 68.50 < 80.50);
Incentive payment = Equity x (PLF - 68.50) x 0.005 (if PLF > 80.50 < 85.50);
Incentive payment = Equity x (PLF - 68.50) x 0.006 (if PLF > 85.50);
Equity (considered provisionally) = Rs. 117.92 Crs;
Projected incentive for H2 FY 2015-16 is Rs. 0.00 Crs and for FY 2016-17 is Rs. 0.00 Crs (as there is
deficit of gas).
3.4.3.3 LANCO KONDAPALLI
The fixed charges are fully recoverable at 80% PLF. The variable charge of H2 FY 15-16 is
considered same as APERC approved FY 15-16 value of Rs 2.28/ kWh and 3% escalation on APERC
approved FY15-16 value has been considered for FY 2016-17.
Estimated fixed costs for Andhra Pradesh for FY 2015-16 upto 01.01.2016 is Rs.43.62 Cr. The
subsisting PPA with LANCO expires by 01.01.2016.
As per the existing PPA of Lanco Kondapalli with APDiscoms, the FDSC component of the fixed
charge will not be payable by APDiscoms after completion of 12 years from the date of
commencement of supply of power. This 12 year duration was completed by December 2012. Hence,
no FDSC component are payable.
In case the plant achieves a PLF (I) greater than 80% for a tariff year, then the Board shall pay to the
generator incentive (as a percentage of the other fixed charges) for any additional unit generated
beyond the actual generation in excess of a PLF (I) of 80%. The incentive structure is as shown
below:

PLF (I) % Incentive (%)
Up to 80 % Nil
Above 80 % and up to 85
%
2 % for every 1 % increase in PLF(I) (i.e. for a PLF(I) of 85 %,
the incentive will be 10 % of the Other Fixed Charge)
Above 85 % and up to 90
%
3 % for every 1 % increase in PLF(I) (i.e. for a PLF(I) of 90 %,
the Incentive will be 10 % + 15 % = 25 % of the Other Fixed
Charge)
Above 90 % Same as for 90% i.e. 25% of the Other Fixed Charge.
Projected incentive for H2 FY 2014-15 is Rs. 0.00 Crs and for FY 2015-16 is Rs. 0.00 Crs.
3.4.3.4 RELIANCE INFRASTRUCTURE LTD. (BSES)
The fixed charge is fully recoverable at 85 % PLF. The variable charge of H2 FY 15-16 is considered
same as APERC approved FY 15-16 value of Rs 2.93/ kWh and 3% escalation on APERC approved
FY15-16 value has been considered for FY 2016-17.
Based on the formula provided in the PPA and considering 46.11% of the fixed cost for erstwhile
Andhra Pradesh (as per G.O. Ms. No. 20), the fixed costs for Andhra Pradesh for FY 2015-16 and FY
2016-17 are Rs. 3.41 Crs and Rs. 6.82 Crs respectively. Since payment of FDSC component got over
by December 2013 and only OFC is payable, fixed charges are being paid as per the actual PLF
achieved during the month as there is no alternate fuel facility.
In case the plant achieves a PLF (I) greater than 85% for a tariff year, then the incentive (as a
percentage of the other fixed charges) payable for any additional unit of actual generation in excess of
a PLF (I) of 85 %. The incentive structure is as shown below:
PLF (I) % Incentive (%)
Up to 85 % Nil
Above 85 % and up to
90 %
2 % for every 1 % increase in PLF(I) (i.e. for a PLF(I) of 90 %,
the Incentive will be 10 % of the Other Fixed Charge
Above 90 % Same as for 90% i.e. 10 % of the Other Fixed Charge.
Projected incentive for H2 FY 2015-16 is Rs. 0.00 Crs and for FY 2016-17 is Rs. 0.00 Crs. The
licensee shall not bear the tax on incentives payable to the generator.
3.4.3.5 New IPPs & Merchant Plants
No fixed and variable charges are considered from the new IPP plants.

3.4.4 NON CONVENTIONAL ENERGY (NCE) SOURCES:
The Commission issued orders on 20.03.2004, fixing power purchase price applicable for NCE
Projects (Biomass/Industrial Waste, Bagasse & Mini Hydel) from 01.04.2004 to 31.03.2009. The
NCE Project Developers filed cases before the Appellate Tribunal against the APERC orders. The
Appellate tribunal set aside APERC Orders dated. 20.03.2004. APTRANSCO and APDISCOMs filed
Appeals before Supreme Court against ATE Orders. The Hon’ble Supreme Court passed Orders
dated. 08.07.2010 setting aside ATE Orders. The Supreme Court remanded the matter to APERC with
a direction to hear NCE Project developers afresh and determine /fix tariff/power purchase price.
APERC has initiated the public hearing in this matter from 28.09.2010 and passed three divergent
orders vide its order dt:12.09.2011. The APERC orders are challenged before Appellate Tribunal for
Electricity by NCE developers & APDISCOMs.
The Appellate Tribunal in its order dt:20.12.2012, while fixing the parameters, directed APERC to fix
the tariff accordingly to be payable to Non-conventional Energy Developers for the period 2004-2009.
Aggrieved by the APTEL order dt:20.12.2012, APDISCOMs filed Civil Appeals No’s 1376-1385 of
2013 before Hon’ble Supreme Court. The apex court admitted the appeals and are pending for
disposal.
The APDISCOMs filed an application I.A. No.22 of 2013 in O.P. No.1075 of 2000 praying the
APERC to defer the hearing of the remand proceedings on NCE tariff cases as ordered by the
Appellate Tribunal for Electricity in order dt:20.12.2012 till the final disposal of civil appeals (1376
to 1385) filed before Hon’ble Supreme Court. The APERC dismissed the I.A. No.22 of 2013 with the
opinion that DISCOMs cannot ask for deferment of the tariff order to give effect to the APTEL order
on the plea that the petition has been filed before Hon’ble Supreme Court and the same is admitted for
hearing. The APERC issued order dt: 22.06.2013, pursuant to APTEL order dt: 20.12.2012,
determining the tariff payable to NCE developers for the period 01.04.2004 to 31.03.2009. The
DISCOMs filed Special Leave Petition in the Hon'ble Supreme Court against the order dated
22.6.2013 passed by the APERC vide SLP (Civil) No. 30416 to 30428 of 2013.
APERC issued suo-moto order dt:6.8.13 determining variable cost tariff in respect of Bagasse &
Biomass (including Industrial Waste) projects giving consequential effect to the order dated
31.03.2009 in O.P No.5 of 2009 based on Hon’ble APTEL order dated 20.12.2012 & 30.04.2013.
DISCOMs filed SLP against APERC order dated 06.08.2013 in the Hon'ble Supreme Court vide SLP
(Civil) No. 19508 of 2013.
The Special Leave Petitions (Civil) 30416-28 filed against APERC order dt:22.6.13 & 19508 filed
against APERC order dt:06.08.13 came up for admission on 28.10.2013 and the Lordships were not
inclined to grant permission to file Special Leave Petitions directly against the orders of APERC and
directed to withdraw the Special Leave Petitions. Accordingly, the Special Leave Petitions were

withdrawn.
As such, IAs were filed in C.A 1376-85 of 2013 before Hon’ble Supreme Court requesting for grant
of stay of APERC orders dt:22.06.2013 & 06.08.2013 and Appeal Nos. 83 & 84 of 2014 were filed
before APTEL against APERC orders dt:22.06.2013 & 06.08.2013. The same were dismissed by
APTEL vide order dt: 21.07.2014 as not maintainable. Subsequently, appeals 10448 & 10499 are filed
before Hon’ble Supreme Court against the orders of APTEL dt: 21.07.2014. The appeals are tagged
with CA 1376-85 of 2013 and are likely to be listed on 20.01.2016.
About Rs. 406 Crs was already paid to the NCE developers in accordance with the various court
orders (in the united Andhra Pradesh state).
However, upon the directions of Hon’ble Supreme Court dt: 16.12.2013, APDISCOMs are
implementing tariff to the NCE developers as per APERC order dt: 22.06.2013 from the date of order,
viz., 22.06.2013.
Further, vide orders dt:11.03.2014 & 13.03.2014, Hon’ble Supreme Court of India directed to release
50% amount due to the NCE developers. Accordingly, the NCE developers were paid Rs.214.96 Crs
in erstwhile Andhra Pradesh.
APERC determined the variable cost for the control period FY 2014-19 vide APERC order dt:
16.05.2014. Further, APERC determined the fixed cost tariff for the Biomass, Bagasse, Mini Hydel &
Industrial Waste projects for beyond 10 years of operation vide APERC orders dt:19.07.2014,
05.08.2014, 23.08.2014 & 01.09.2014 respectively. The fixed cost & variable cost are adopted as per
the above orders for cost projections for H2 FY 2015-16 and FY 2016-17. However, review petitions
have been filed by APDiscoms on APERC orders dt: 19.07.2014, 05.08.2014, 23.08.2014&
01.09.2014. The Hon’ble Commission dismissed/rejected these review petitions. Hence, appeals DFR
Nos. 645 &646 of 2015 were filed before APTEL.
Further, the Biomass developers filed appeals before APTEL on APERC order dt: 16.05.2014&
19.07.2014 wherein APERC determined variable cost tariff for FY 2014-19 & fixed cost tariff for
biomass projects beyond 10 years of operation respectively. Also, bagasse developers preferred
appeal before APTEL against APERC order dt: 16.05.2014. The Mini Hydel developers also
preferred appeal before APTEL against APERC order dt: 23.08.2014.
The Commission vide its order dt: 31.03.2009 fixed single part tariff for existing Wind and Municipal
waste projects for the period from 1.4.2009 to 31.3.2014. Further APERC issued orders dt:
15.11.2012 duly fixing new tariff @Rs 4.70/unit for upcoming wind power projects upto 31.03.2015.
The said tariff order was extended till 31.07.2015. Vide order dt:01.08.2015, APERC determined the
tariff for the upcoming wind projects for FY2015-16 @ Rs.4.83/unit without AD and @Rs.4.25/unit
with AD based on the regulation no 1 of 2015 pertaining to terms and conditions for tariff
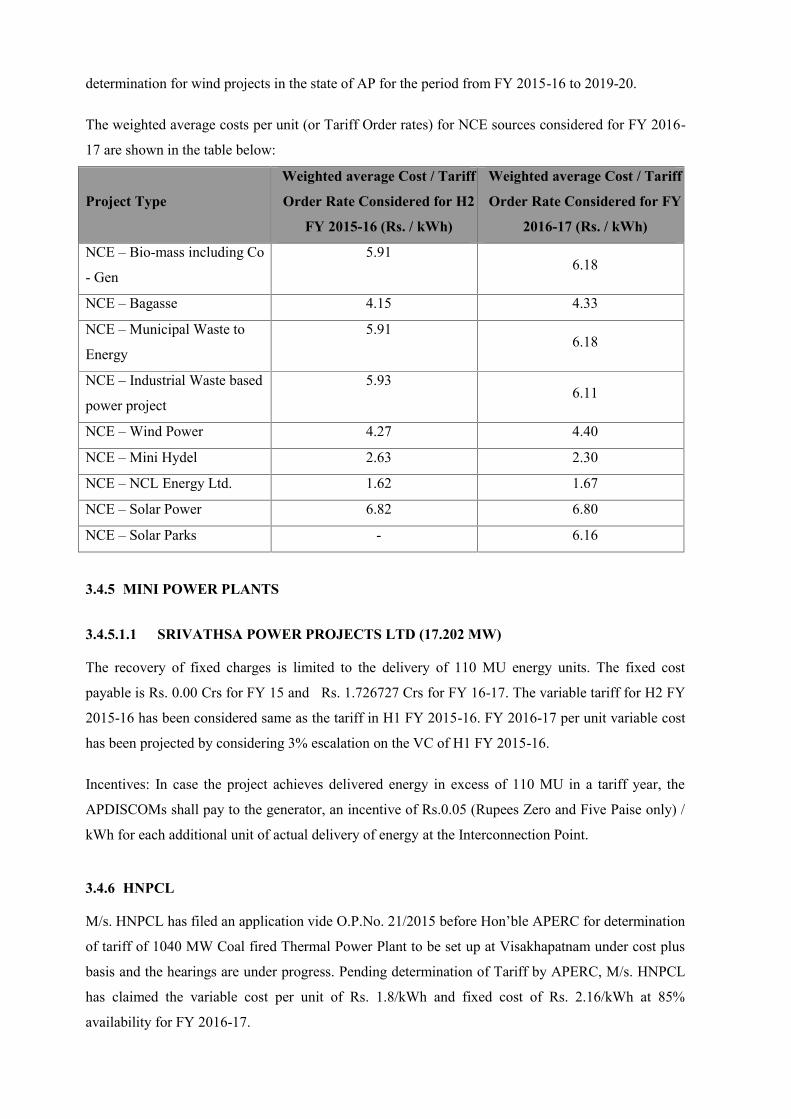
determination for wind projects in the state of AP for the period from FY 2015-16 to 2019-20.
The weighted average costs per unit (or Tariff Order rates) for NCE sources considered for FY 2016-
17 are shown in the table below:
Project Type
Weighted average Cost / Tariff
Order Rate Considered for H2
FY 2015-16 (Rs. / kWh)
Weighted average Cost / Tariff
Order Rate Considered for FY
2016-17 (Rs. / kWh)
NCE – Bio-mass including Co
- Gen
5.916.18
NCE – Bagasse 4.15 4.33
NCE – Municipal Waste to
Energy
5.916.18
NCE – Industrial Waste based
power project
5.936.11
NCE – Wind Power 4.27 4.40
NCE – Mini Hydel 2.63 2.30
NCE – NCL Energy Ltd. 1.62 1.67
NCE – Solar Power 6.82 6.80
NCE – Solar Parks - 6.16
3.4.5 MINI POWER PLANTS
3.4.5.1.1 SRIVATHSA POWER PROJECTS LTD (17.202 MW)
The recovery of fixed charges is limited to the delivery of 110 MU energy units. The fixed cost
payable is Rs. 0.00 Crs for FY 15 and Rs. 1.726727 Crs for FY 16-17. The variable tariff for H2 FY
2015-16 has been considered same as the tariff in H1 FY 2015-16. FY 2016-17 per unit variable cost
has been projected by considering 3% escalation on the VC of H1 FY 2015-16.
Incentives: In case the project achieves delivered energy in excess of 110 MU in a tariff year, the
APDISCOMs shall pay to the generator, an incentive of Rs.0.05 (Rupees Zero and Five Paise only) /
kWh for each additional unit of actual delivery of energy at the Interconnection Point.
3.4.6 HNPCL
M/s. HNPCL has filed an application vide O.P.No. 21/2015 before Hon’ble APERC for determination
of tariff of 1040 MW Coal fired Thermal Power Plant to be set up at Visakhapatnam under cost plus
basis and the hearings are under progress. Pending determination of Tariff by APERC, M/s. HNPCL
has claimed the variable cost per unit of Rs. 1.8/kWh and fixed cost of Rs. 2.16/kWh at 85%
availability for FY 2016-17.

3.4.7 Long Term & Medium Term
3.4.8 Long Term – Thermal Power Tech Corporation India Limited
Variable cost per unit of Rs.1.76/kWh have been considered for H2 FY 2015-16. And 3% escalation
for FY 16-17. Fixed cost per unit of Rs.1.76/kWh have been considered for FY 16-17.
Long Term – 1000MW DBFOO Bidding
Total cost per unit considered for FY 16-17 is Rs.3.87/kWh. With variable cost of Rs.1.41/kWh
Medium Term – KSK Mahanadi
Total cost per unit considered for FY 2016-17 is Rs. 3.79/kWh.
Short Term and Bilateral/ Inter-State purchases
Month-wise shortfall has been estimated based on the availability and requirement. A part of this
deficit would be met from external sources such as power traders and power exchange. The cost of
power purchase is considered at Rs.5.17/kWh same as of H1 FY 15-16
Bilateral Purchases/Sale of Surplus Power
Month-wise surplus has been estimated based on the availability and requirement. A part of this
surplus is assumed to be sold through bilateral contracts at a price of Rs.4.89/kWh. The estimated sale
of such surplus power is 4,334 MUs and the remaining will be sold in the open market provided the
variable cost is lower than market price. (Monthly Market Price for FY16-17 is assumed to remain
same as S2 grid market price of FY 2015-16.The estimated sale from such external sources are
estimated to be 2,808 MUs for FY 2016-17.
3.4.9 D-D Purchases
Month-wise availability of each APDiscom has been calculated based on PPA allocation. The
requirement of each Discom at APTRANSCO periphery has been calculated, by grossing up the sales
with losses. The D-D purchases / sales for each Discom have been estimated after taking into account
the respective allocations to each Discom as per the Final Transfer Scheme. The D-D pool price has
been considered at Rs. 5.17/kWh for FY 2016-17 (price of energy from bilateral purchases).
3.5 ENERGY REQUIREMENT
Based on the availability shown above and the energy requirement from all the Discoms, the actual
energy to be purchased Discom-wise has been projected as follows:

DISCOMSH2 FY 2015-16 FY 2016-17
MU MU
APEPDCL 8,407 19,083
APSPDCL 17,878 38,481
Total 26,286 57,565
The above energy requirement of the licensees has been arrived at by grossing up the sales of the
licensee sales with appropriate transmission and distribution losses. The external loss on the power
purchased from CGS and KSK Mahanadi only has also been factored in the above energy
requirement.
3.6 SUMMARY OF POWER PURCHASE FOR CURRENT YEAR H2 FY 2015-16 ANDENSUING YEAR FY 2016-17
Based on the availability, requirement and costs for each source, the summary of power purchase cost
for Andhra Pradesh for H2 FY 2015-16 is projected as follows:
Source
2015 -16 H2 Projection
Power Purchase
(MU) Available
Power Purchase
(MU) Despatch
CostsPP Cost
(INR/kWh)(INR Crs)
APGENCO Thermal 9,289 9,289 4,467 4.81
TSGENCO Thermal 3,338 3,338 1,287 3.86
APGENCO Hydel 942 942 233 2.47
TSGENCO Hydel - - - -
CGS 5,771 5,771 1,966 3.41
APGPCL 61 61 19 3.16
IPPs - Gas 1,390 1,390 482 3.46
NCE 1,035 1,035 492 4.76
Others* 2,090 2,090 700 3.35
Market 3,406 2,335 1,207 5.17
Total 27,323 26,252 10,853 4.13
*Others include Srivathsa, Long term and Medium term purchases, Hinduja
Based on the availability, requirement and costs for each source, the summary of power purchase cost
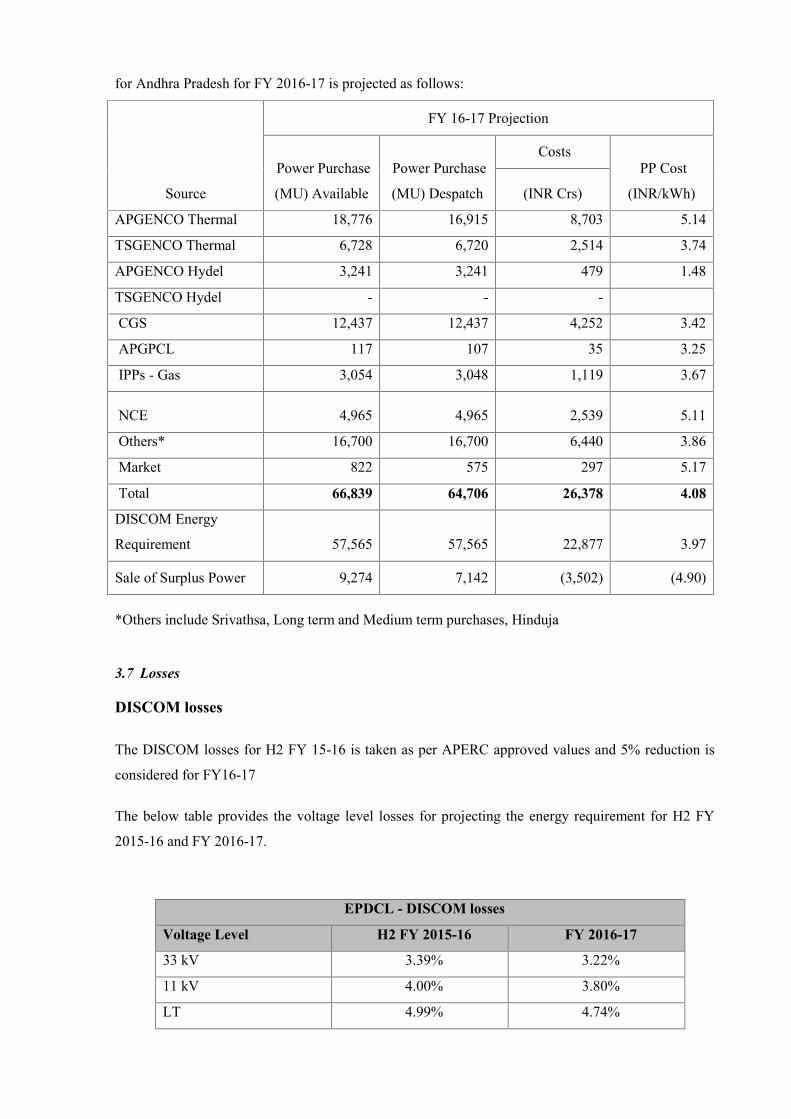
for Andhra Pradesh for FY 2016-17 is projected as follows:
Source
FY 16-17 Projection
Power Purchase
(MU) Available
Power Purchase
(MU) Despatch
CostsPP Cost
(INR/kWh)(INR Crs)
APGENCO Thermal 18,776 16,915 8,703 5.14
TSGENCO Thermal 6,728 6,720 2,514 3.74
APGENCO Hydel 3,241 3,241 479 1.48
TSGENCO Hydel - - -
CGS 12,437 12,437 4,252 3.42
APGPCL 117 107 35 3.25
IPPs - Gas 3,054 3,048 1,119 3.67
NCE 4,965 4,965 2,539 5.11
Others* 16,700 16,700 6,440 3.86
Market 822 575 297 5.17
Total 66,839 64,706 26,378 4.08
DISCOM Energy
Requirement 57,565 57,565 22,877 3.97
Sale of Surplus Power 9,274 7,142 (3,502) (4.90)
*Others include Srivathsa, Long term and Medium term purchases, Hinduja
3.7 Losses
DISCOM losses
The DISCOM losses for H2 FY 15-16 is taken as per APERC approved values and 5% reduction is
considered for FY16-17
The below table provides the voltage level losses for projecting the energy requirement for H2 FY
2015-16 and FY 2016-17.
EPDCL - DISCOM losses
Voltage Level H2 FY 2015-16 FY 2016-17
33 kV 3.39% 3.22%
11 kV 4.00% 3.80%
LT 4.99% 4.74%

TRANSCO losses
The Transco losses for H2 FY 2015-16have been taken as per approved. And for FY 16-17
Transco losses for FY 15-16 H1 actuals are considered
Transmission Losses
H2 FY 2015-16
Transmission Losses
FY 2016-17
3.95% 3.34%
Losses external to APTRANSCO system
The losses external to the APTRANSCO system are considered to be 3.57 % for H2 FY 15-16 and
also for FY16-17 APERC approved values for FY15-16. This is applicable for procurement of power
from Central Generating Stations and other medium and short term purchases. However, external
losses have not been considered for bilateral / inter-state purchases due to considering average landed
power purchase cost at APTransco periphery.
3.8 Expenditure Projections
3.8.1 Power Purchase and Procurement Cost
The Energy dispatch from various generating stations is estimated to be 17026.49 MU for FY2015-16 and 19083.51 MU for 2016-17 and the cost of this energy would be Rs. 6835.76 Cr.and Rs. 7495.72 Cr. respectively.
EPDCL
2015-16 2016-17Power Purchase fromGenerators (in MUs) 17026.49 19083.51
Power Purchase fromGenerators
(in Rs.Crores) 6835.76 7495.72
3.8.2 AP Transco Transmission Charges
The actual Transmission charges for FY 2014-15 are Rs. 305.25 Crs. and for FYs 2015-16 & 2016-17 it is estimated at Rs. 367.96 Crs. and Rs. 469.28 Crs. based on the approved MYTTransmission Tariff Order for FYs 2014-15 to 2018-19.

FY 2015-16
Name of theTransmission
Service Provider
Load not eligible for Open Access Load Eligible for Open AccessTotal Cost(Rs. Crs.)MW
Tariff(Rs./kW/month
)
Cost (Rs.Crs.) MW Tariff
Rs./kW/monthCost (Rs.
Crs.)
APTransco 3087.92 76.66 284.06 619.08 76.66 56.95 341.01
Total 341.01
FY 2016-17
Name of theTransmission
Service Provider
Load not eligible for Open Access Load Eligible for Open AccessTotal Cost(Rs. Crs.)MW
Tariff(Rs./kW/mon
th)
Cost (Rs.Crs.) MW Tariff
Rs./kW/monthCost (Rs.
Crs.)
APTransco 3250.01 91.36 356.31 680.99 91.36 74.66 430.96
APERC approvedTrue down amount to
APTransco-92.98
Total 263.33 74.66 337.98
3.8.3 SLDC Charges
The actual SLDC charges for 2014-15 are Rs. 12.10 Crs. and for FYs: 2015-16 and2016-17 it is estimated at Rs.11.84 Crs. and Rs.13.06 Crs. based on the approved SLDC Order forFYs: 2014-15 to 2018-19.
2015-16
Annual Fee Charges TotalCost(Rs.Crs.)
MWTariff
(Rs./MW/year)
Cost(Rs.Crs.)
MWTariff
(Rs./MW/month)
Cost(Rs.Crs.)
Load not eligible forOpen Access 3087.92
3092.78
0.96 3087.92
2209.34
8.19 10.1
Load Eligible forOpen Access
619.08 0.19 619.08 1.64 2.02
Total 3707.0 1.15 3707 9.83 12.12

2016-17
Annual Fee ChargesTotal
Cost (Rs.Crs.)MW
Tariff(Rs./MW/
year)
Cost(Rs.Crs.)
MWTariff
(Rs./MW/month)
Cost(Rs.Crs.)
Load not eligible forOpen Access 3250.01
3533.18
1.15 3250.01
2247.62
8.77 9.91
Load Eligible for OpenAccess 680.99 0.24 680.99 1.84 2.08
TOTAL 3931 1.39 3931 10.6 11.99
3.8.4 PGCIL & ULDC Charges:
The PGCIL and ULDC charges have been computed based on the information
sought by the licensee from APTransco. The licensee has projected the PGCIL & ULDC charges
for FY 16-17 based on the actual of FY: 2014-15 and first half of FY 2015-16.
Particulars (Rs. Crs.) 2015-16 2016-17PGCIL Expenses 119.26 131.19ULDC Charges 2.55 2.81Total 121.81 133.99
3.8.1 Distribution Costs
The licensee has adopted the Distribution cost for FY 2015-16 & 2016-17 as approved in theWheeling Tariff Order (Distribution Business Tariff Order) for 3rd MYT control period (FY 2014-15 to 2018-19).
The distribution costs for FY: 2015-16 and FY: 2016-17 are Rs. 1,216.97 Crores and Rs. 1,382.3Crores respectively as approved in the Wheeling Tariff Order.
FY 2015-16
Name of theDistribution
ServiceProvider
Cost for Load noteligible for OpenAccess Rs. Crs
Cost for Load Eligiblefor Open Access
Total Cost (Rs.Crs.)
APEPDCL 1180.06 36.91 1216.97
Total 1180.06 36.91 1216.97
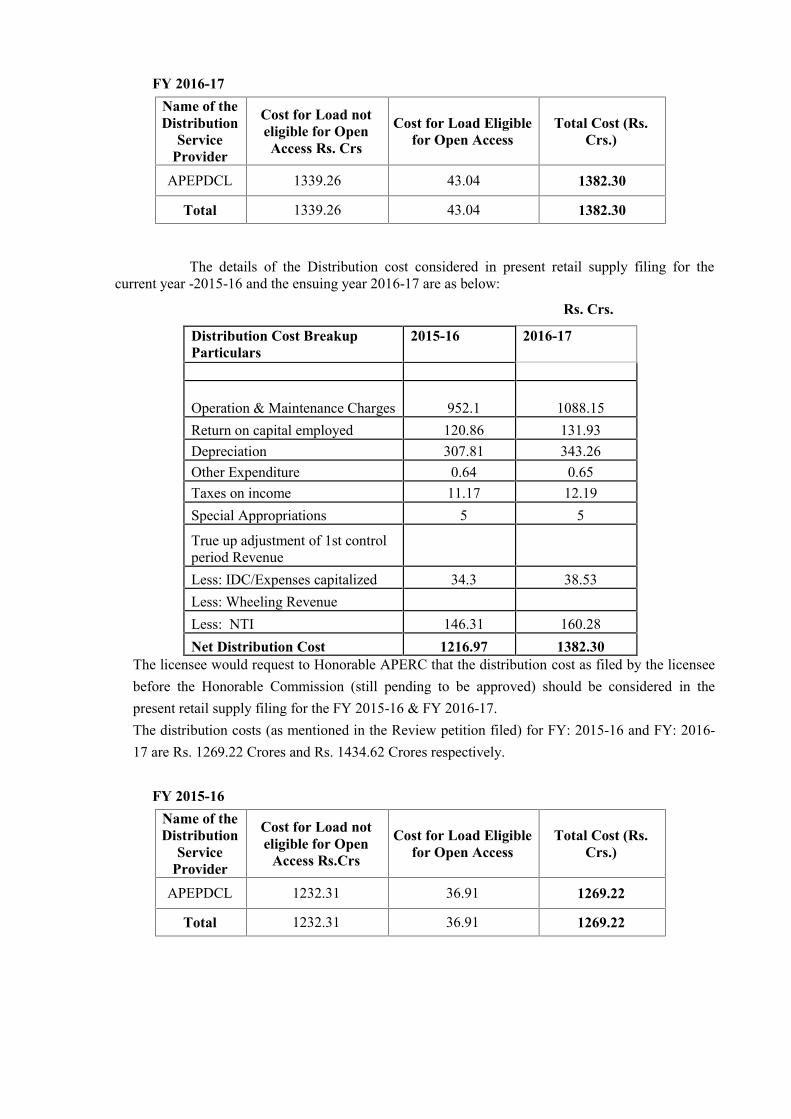
FY 2016-17Name of theDistribution
ServiceProvider
Cost for Load noteligible for OpenAccess Rs. Crs
Cost for Load Eligiblefor Open Access
Total Cost (Rs.Crs.)
APEPDCL 1339.26 43.04 1382.30
Total 1339.26 43.04 1382.30
The details of the Distribution cost considered in present retail supply filing for thecurrent year -2015-16 and the ensuing year 2016-17 are as below:
Rs. Crs.
Distribution Cost BreakupParticulars
2015-16 2016-17
Operation & Maintenance Charges 952.1 1088.15Return on capital employed 120.86 131.93Depreciation 307.81 343.26Other Expenditure 0.64 0.65Taxes on income 11.17 12.19Special Appropriations 5 5
True up adjustment of 1st controlperiod RevenueLess: IDC/Expenses capitalized 34.3 38.53Less: Wheeling RevenueLess: NTI 146.31 160.28Net Distribution Cost 1216.97 1382.30
The licensee would request to Honorable APERC that the distribution cost as filed by the licenseebefore the Honorable Commission (still pending to be approved) should be considered in thepresent retail supply filing for the FY 2015-16 & FY 2016-17.The distribution costs (as mentioned in the Review petition filed) for FY: 2015-16 and FY: 2016-17 are Rs. 1269.22 Crores and Rs. 1434.62 Crores respectively.
FY 2015-16Name of theDistribution
ServiceProvider
Cost for Load noteligible for Open
Access Rs.Crs
Cost for Load Eligiblefor Open Access
Total Cost (Rs.Crs.)
APEPDCL 1232.31 36.91 1269.22
Total 1232.31 36.91 1269.22
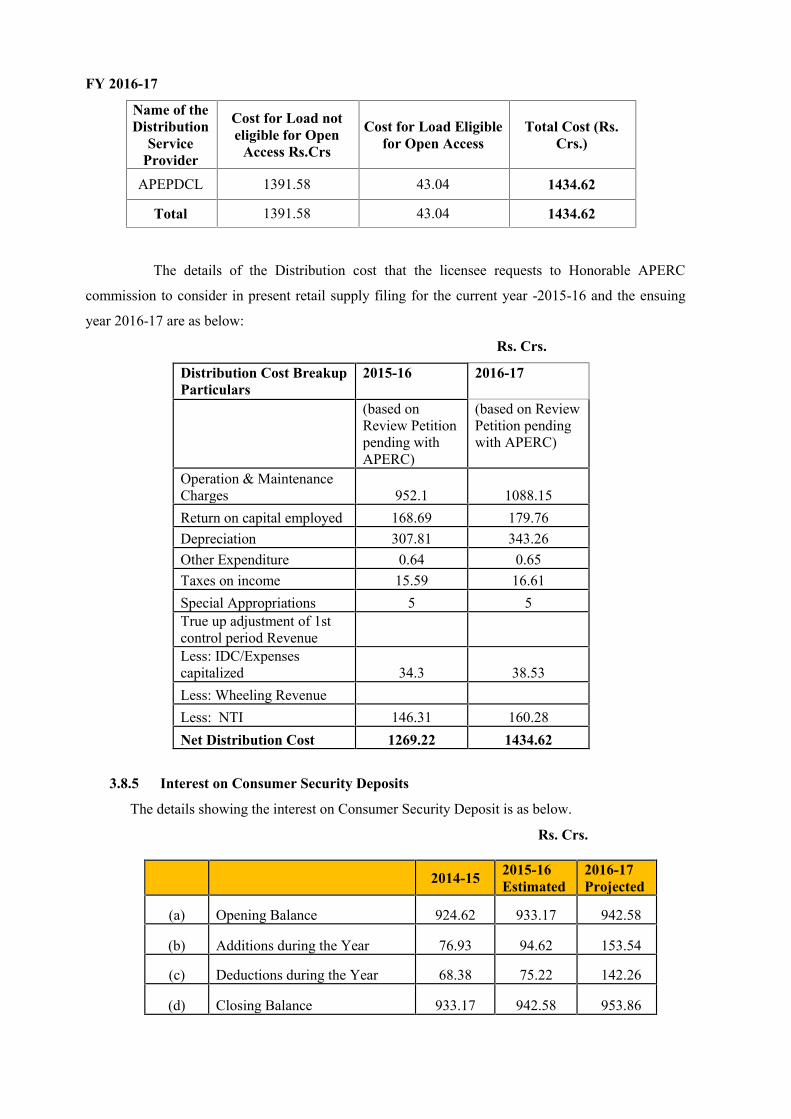
FY 2016-17
Name of theDistribution
ServiceProvider
Cost for Load noteligible for Open
Access Rs.Crs
Cost for Load Eligiblefor Open Access
Total Cost (Rs.Crs.)
APEPDCL 1391.58 43.04 1434.62
Total 1391.58 43.04 1434.62
The details of the Distribution cost that the licensee requests to Honorable APERC
commission to consider in present retail supply filing for the current year -2015-16 and the ensuing
year 2016-17 are as below:
Rs. Crs.
Distribution Cost BreakupParticulars
2015-16 2016-17
(based onReview Petitionpending withAPERC)
(based on ReviewPetition pendingwith APERC)
Operation & MaintenanceCharges 952.1 1088.15Return on capital employed 168.69 179.76Depreciation 307.81 343.26Other Expenditure 0.64 0.65Taxes on income 15.59 16.61Special Appropriations 5 5True up adjustment of 1stcontrol period RevenueLess: IDC/Expensescapitalized 34.3 38.53Less: Wheeling RevenueLess: NTI 146.31 160.28Net Distribution Cost 1269.22 1434.62
3.8.5 Interest on Consumer Security Deposits
The details showing the interest on Consumer Security Deposit is as below.
Rs. Crs.
2014-15 2015-16Estimated
2016-17Projected
(a) Opening Balance 924.62 933.17 942.58
(b) Additions during the Year 76.93 94.62 153.54
(c) Deductions during the Year 68.38 75.22 142.26
(d) Closing Balance 933.17 942.58 953.86
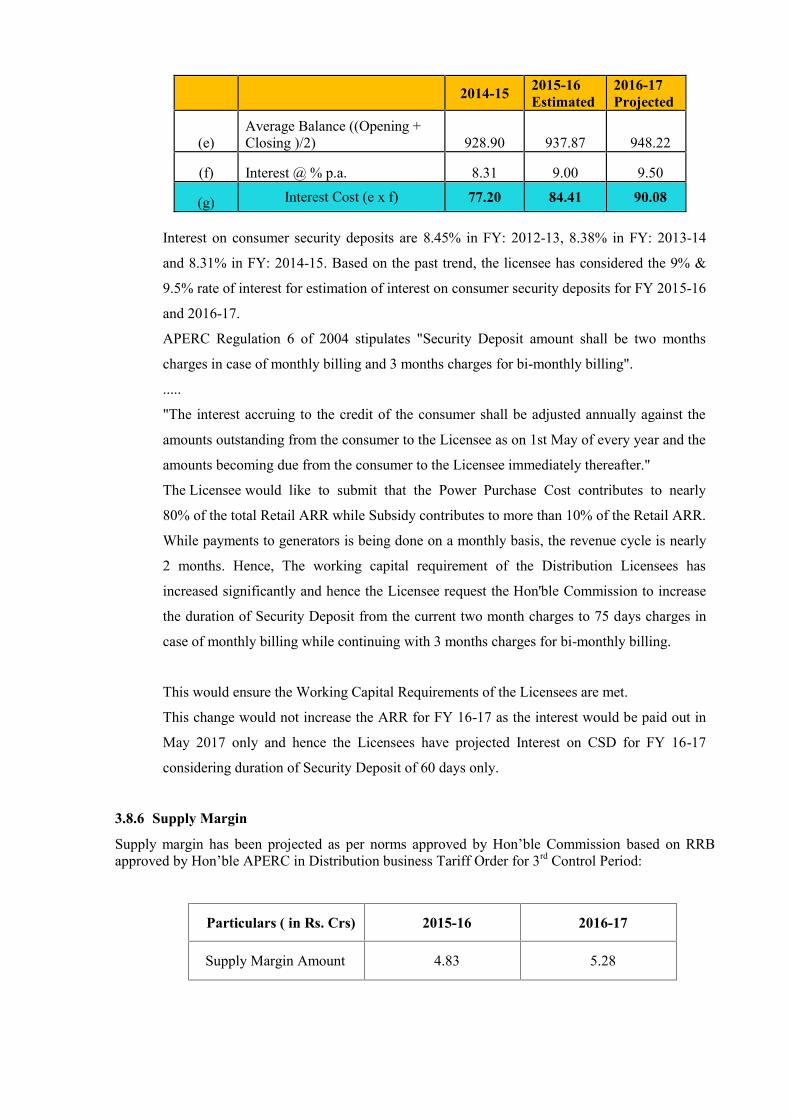
2014-15 2015-16Estimated
2016-17Projected
(e)Average Balance ((Opening +Closing )/2) 928.90 937.87 948.22
(f) Interest @ % p.a. 8.31 9.00 9.50
(g) Interest Cost (e x f) 77.20 84.41 90.08
Interest on consumer security deposits are 8.45% in FY: 2012-13, 8.38% in FY: 2013-14
and 8.31% in FY: 2014-15. Based on the past trend, the licensee has considered the 9% &
9.5% rate of interest for estimation of interest on consumer security deposits for FY 2015-16
and 2016-17.
APERC Regulation 6 of 2004 stipulates "Security Deposit amount shall be two months
charges in case of monthly billing and 3 months charges for bi-monthly billing".
.....
"The interest accruing to the credit of the consumer shall be adjusted annually against the
amounts outstanding from the consumer to the Licensee as on 1st May of every year and the
amounts becoming due from the consumer to the Licensee immediately thereafter."
The Licensee would like to submit that the Power Purchase Cost contributes to nearly
80% of the total Retail ARR while Subsidy contributes to more than 10% of the Retail ARR.
While payments to generators is being done on a monthly basis, the revenue cycle is nearly
2 months. Hence, The working capital requirement of the Distribution Licensees has
increased significantly and hence the Licensee request the Hon'ble Commission to increase
the duration of Security Deposit from the current two month charges to 75 days charges in
case of monthly billing while continuing with 3 months charges for bi-monthly billing.
This would ensure the Working Capital Requirements of the Licensees are met.
This change would not increase the ARR for FY 16-17 as the interest would be paid out in
May 2017 only and hence the Licensees have projected Interest on CSD for FY 16-17
considering duration of Security Deposit of 60 days only.
3.8.6 Supply Margin
Supply margin has been projected as per norms approved by Hon’ble Commission based on RRBapproved by Hon’ble APERC in Distribution business Tariff Order for 3rd Control Period:
Particulars ( in Rs. Crs) 2015-16 2016-17
Supply Margin Amount 4.83 5.28
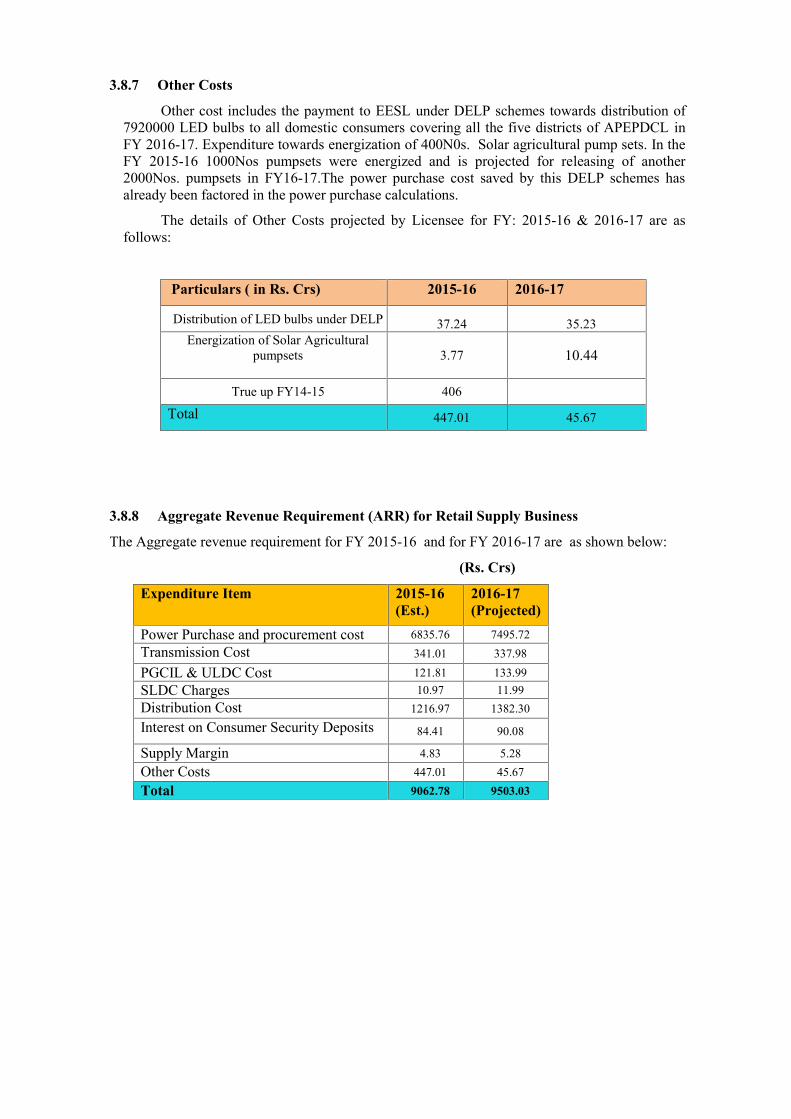
3.8.7 Other Costs
Other cost includes the payment to EESL under DELP schemes towards distribution of7920000 LED bulbs to all domestic consumers covering all the five districts of APEPDCL inFY 2016-17. Expenditure towards energization of 400N0s. Solar agricultural pump sets. In theFY 2015-16 1000Nos pumpsets were energized and is projected for releasing of another2000Nos. pumpsets in FY16-17.The power purchase cost saved by this DELP schemes hasalready been factored in the power purchase calculations.
The details of Other Costs projected by Licensee for FY: 2015-16 & 2016-17 are asfollows:
Particulars ( in Rs. Crs) 2015-16 2016-17
Distribution of LED bulbs under DELP 37.24 35.23Energization of Solar Agricultural
pumpsets 3.77 10.44
True up FY14-15 406
Total 447.01 45.67
3.8.8 Aggregate Revenue Requirement (ARR) for Retail Supply Business
The Aggregate revenue requirement for FY 2015-16 and for FY 2016-17 are as shown below:
(Rs. Crs)
Expenditure Item 2015-16(Est.)
2016-17(Projected)
Power Purchase and procurement cost 6835.76 7495.72Transmission Cost 341.01 337.98
PGCIL & ULDC Cost 121.81 133.99SLDC Charges 10.97 11.99Distribution Cost 1216.97 1382.30Interest on Consumer Security Deposits 84.41 90.08
Supply Margin 4.83 5.28Other Costs 447.01 45.67Total 9062.78 9503.03
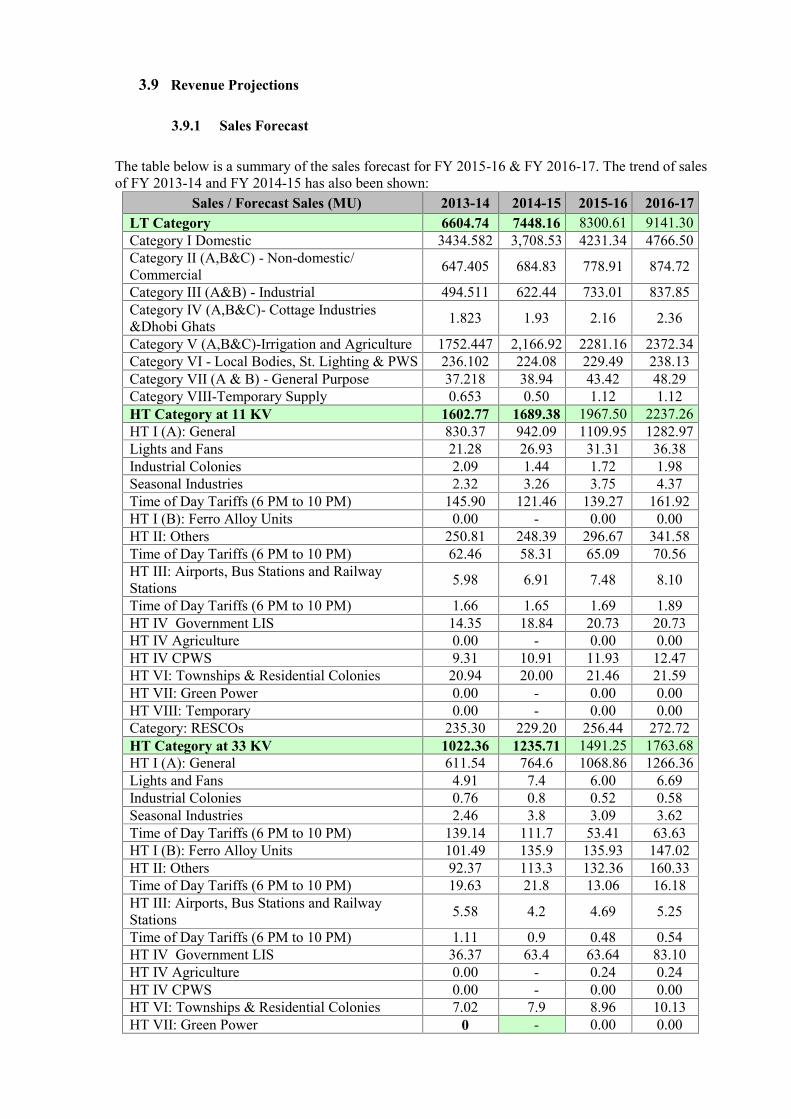
3.9 Revenue Projections
3.9.1 Sales Forecast
The table below is a summary of the sales forecast for FY 2015-16 & FY 2016-17. The trend of salesof FY 2013-14 and FY 2014-15 has also been shown:
Sales / Forecast Sales (MU) 2013-14 2014-15 2015-16 2016-17LT Category 6604.74 7448.16 8300.61 9141.30Category I Domestic 3434.582 3,708.53 4231.34 4766.50Category II (A,B&C) - Non-domestic/Commercial 647.405 684.83 778.91 874.72
Category III (A&B) - Industrial 494.511 622.44 733.01 837.85Category IV (A,B&C)- Cottage Industries&Dhobi Ghats 1.823 1.93 2.16 2.36
Category V (A,B&C)-Irrigation and Agriculture 1752.447 2,166.92 2281.16 2372.34Category VI - Local Bodies, St. Lighting & PWS 236.102 224.08 229.49 238.13Category VII (A & B) - General Purpose 37.218 38.94 43.42 48.29Category VIII-Temporary Supply 0.653 0.50 1.12 1.12HT Category at 11 KV 1602.77 1689.38 1967.50 2237.26HT I (A): General 830.37 942.09 1109.95 1282.97Lights and Fans 21.28 26.93 31.31 36.38Industrial Colonies 2.09 1.44 1.72 1.98Seasonal Industries 2.32 3.26 3.75 4.37Time of Day Tariffs (6 PM to 10 PM) 145.90 121.46 139.27 161.92HT I (B): Ferro Alloy Units 0.00 - 0.00 0.00HT II: Others 250.81 248.39 296.67 341.58Time of Day Tariffs (6 PM to 10 PM) 62.46 58.31 65.09 70.56HT III: Airports, Bus Stations and RailwayStations 5.98 6.91 7.48 8.10
Time of Day Tariffs (6 PM to 10 PM) 1.66 1.65 1.69 1.89HT IV Government LIS 14.35 18.84 20.73 20.73HT IV Agriculture 0.00 - 0.00 0.00HT IV CPWS 9.31 10.91 11.93 12.47HT VI: Townships & Residential Colonies 20.94 20.00 21.46 21.59HT VII: Green Power 0.00 - 0.00 0.00HT VIII: Temporary 0.00 - 0.00 0.00Category: RESCOs 235.30 229.20 256.44 272.72HT Category at 33 KV 1022.36 1235.71 1491.25 1763.68HT I (A): General 611.54 764.6 1068.86 1266.36Lights and Fans 4.91 7.4 6.00 6.69Industrial Colonies 0.76 0.8 0.52 0.58Seasonal Industries 2.46 3.8 3.09 3.62Time of Day Tariffs (6 PM to 10 PM) 139.14 111.7 53.41 63.63HT I (B): Ferro Alloy Units 101.49 135.9 135.93 147.02HT II: Others 92.37 113.3 132.36 160.33Time of Day Tariffs (6 PM to 10 PM) 19.63 21.8 13.06 16.18HT III: Airports, Bus Stations and RailwayStations 5.58 4.2 4.69 5.25
Time of Day Tariffs (6 PM to 10 PM) 1.11 0.9 0.48 0.54HT IV Government LIS 36.37 63.4 63.64 83.10HT IV Agriculture 0.00 - 0.24 0.24HT IV CPWS 0.00 - 0.00 0.00HT VI: Townships & Residential Colonies 7.02 7.9 8.96 10.13HT VII: Green Power 0 - 0.00 0.00
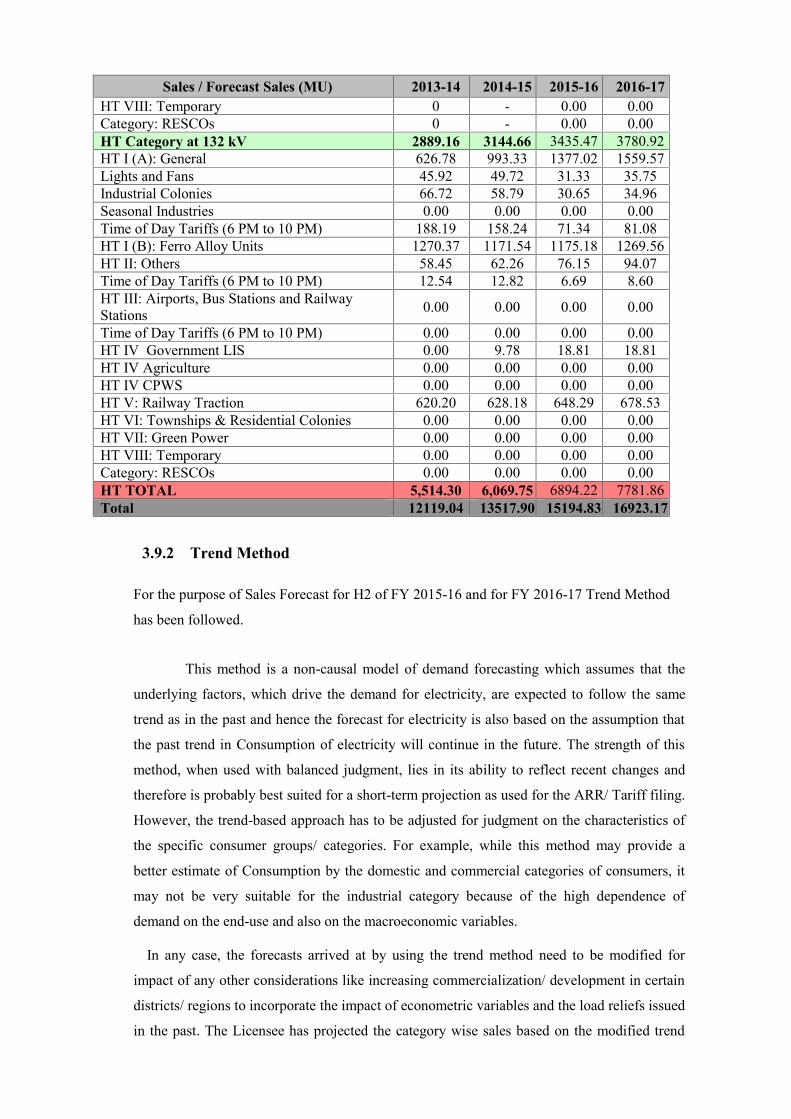
Sales / Forecast Sales (MU) 2013-14 2014-15 2015-16 2016-17HT VIII: Temporary 0 - 0.00 0.00Category: RESCOs 0 - 0.00 0.00HT Category at 132 kV 2889.16 3144.66 3435.47 3780.92HT I (A): General 626.78 993.33 1377.02 1559.57Lights and Fans 45.92 49.72 31.33 35.75Industrial Colonies 66.72 58.79 30.65 34.96Seasonal Industries 0.00 0.00 0.00 0.00Time of Day Tariffs (6 PM to 10 PM) 188.19 158.24 71.34 81.08HT I (B): Ferro Alloy Units 1270.37 1171.54 1175.18 1269.56HT II: Others 58.45 62.26 76.15 94.07Time of Day Tariffs (6 PM to 10 PM) 12.54 12.82 6.69 8.60HT III: Airports, Bus Stations and RailwayStations 0.00 0.00 0.00 0.00
Time of Day Tariffs (6 PM to 10 PM) 0.00 0.00 0.00 0.00HT IV Government LIS 0.00 9.78 18.81 18.81HT IV Agriculture 0.00 0.00 0.00 0.00HT IV CPWS 0.00 0.00 0.00 0.00HT V: Railway Traction 620.20 628.18 648.29 678.53HT VI: Townships & Residential Colonies 0.00 0.00 0.00 0.00HT VII: Green Power 0.00 0.00 0.00 0.00HT VIII: Temporary 0.00 0.00 0.00 0.00Category: RESCOs 0.00 0.00 0.00 0.00HT TOTAL 5,514.30 6,069.75 6894.22 7781.86Total 12119.04 13517.90 15194.83 16923.17
3.9.2 Trend Method
For the purpose of Sales Forecast for H2 of FY 2015-16 and for FY 2016-17 Trend Method
has been followed.
This method is a non-causal model of demand forecasting which assumes that the
underlying factors, which drive the demand for electricity, are expected to follow the same
trend as in the past and hence the forecast for electricity is also based on the assumption that
the past trend in Consumption of electricity will continue in the future. The strength of this
method, when used with balanced judgment, lies in its ability to reflect recent changes and
therefore is probably best suited for a short-term projection as used for the ARR/ Tariff filing.
However, the trend-based approach has to be adjusted for judgment on the characteristics of
the specific consumer groups/ categories. For example, while this method may provide a
better estimate of Consumption by the domestic and commercial categories of consumers, it
may not be very suitable for the industrial category because of the high dependence of
demand on the end-use and also on the macroeconomic variables.
In any case, the forecasts arrived at by using the trend method need to be modified for
impact of any other considerations like increasing commercialization/ development in certain
districts/ regions to incorporate the impact of econometric variables and the load reliefs issued
in the past. The Licensee has projected the category wise sales based on the modified trend
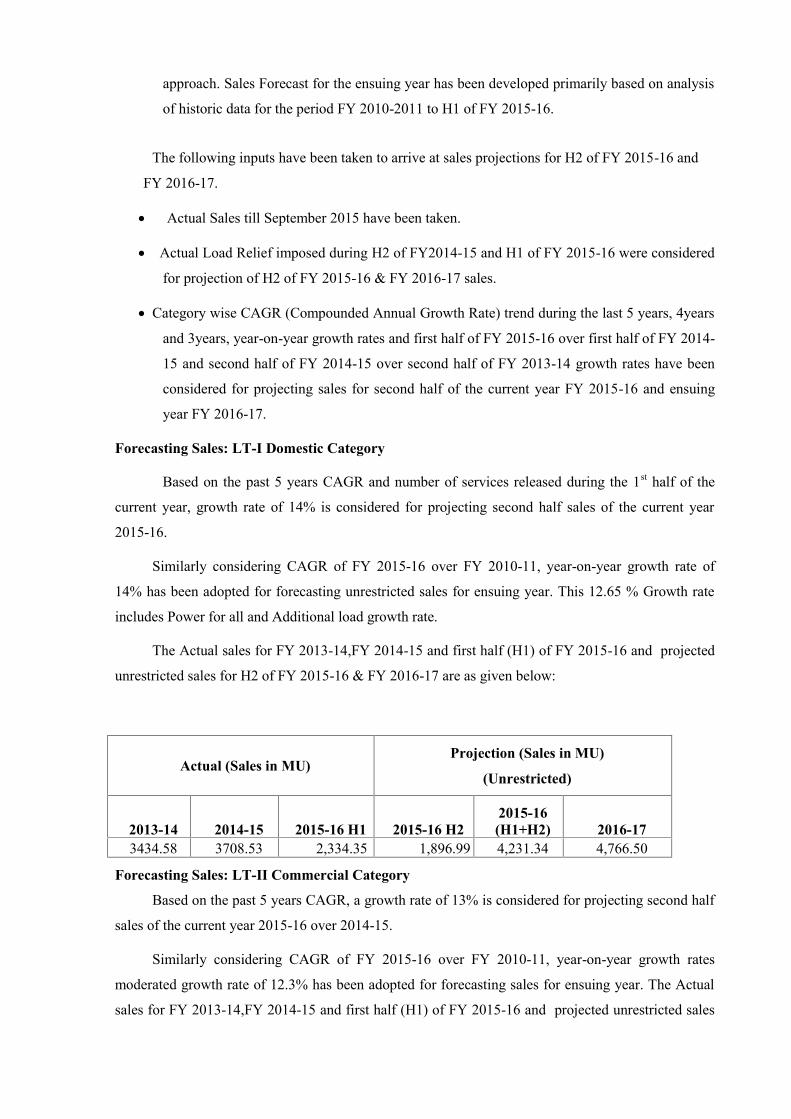
approach. Sales Forecast for the ensuing year has been developed primarily based on analysis
of historic data for the period FY 2010-2011 to H1 of FY 2015-16.
The following inputs have been taken to arrive at sales projections for H2 of FY 2015-16 and
FY 2016-17.
Actual Sales till September 2015 have been taken.
Actual Load Relief imposed during H2 of FY2014-15 and H1 of FY 2015-16 were considered
for projection of H2 of FY 2015-16 & FY 2016-17 sales.
Category wise CAGR (Compounded Annual Growth Rate) trend during the last 5 years, 4years
and 3years, year-on-year growth rates and first half of FY 2015-16 over first half of FY 2014-
15 and second half of FY 2014-15 over second half of FY 2013-14 growth rates have been
considered for projecting sales for second half of the current year FY 2015-16 and ensuing
year FY 2016-17.
Forecasting Sales: LT-I Domestic Category
Based on the past 5 years CAGR and number of services released during the 1st half of the
current year, growth rate of 14% is considered for projecting second half sales of the current year
2015-16.
Similarly considering CAGR of FY 2015-16 over FY 2010-11, year-on-year growth rate of
14% has been adopted for forecasting unrestricted sales for ensuing year. This 12.65 % Growth rate
includes Power for all and Additional load growth rate.
The Actual sales for FY 2013-14,FY 2014-15 and first half (H1) of FY 2015-16 and projected
unrestricted sales for H2 of FY 2015-16 & FY 2016-17 are as given below:
Actual (Sales in MU)Projection (Sales in MU)
(Unrestricted)
2013-14 2014-15 2015-16 H1 2015-16 H22015-16(H1+H2) 2016-17
3434.58 3708.53 2,334.35 1,896.99 4,231.34 4,766.50
Forecasting Sales: LT-II Commercial Category
Based on the past 5 years CAGR, a growth rate of 13% is considered for projecting second half
sales of the current year 2015-16 over 2014-15.
Similarly considering CAGR of FY 2015-16 over FY 2010-11, year-on-year growth rates
moderated growth rate of 12.3% has been adopted for forecasting sales for ensuing year. The Actual
sales for FY 2013-14,FY 2014-15 and first half (H1) of FY 2015-16 and projected unrestricted sales

for H2 of FY 2015-16 & FY 2016-17 are as given below:
Actual (Sales in MU)Projection (Sales in MU)
(Unrestricted)
2013-14 2014-15 2015-16 H1 2015-16 H2 2015-16(H1+H2) 2016-17
647.41 684.83 420.88 358.03 778.91 874.72
Forecasting Sales: LT III – Industrial
Based on the past 5 years CAGR, a moderated growth rate of 13% is considered for projecting
second half sales of the current year 2015-16.
Similarly considering CAGR of FY 2015-16 over FY 2010-11, year-on-year growth rates
moderated growth rate of 14.3% has been adopted for forecasting sales for ensuing year.
The Actual sales for FY 2013-14,FY 2014-15 and first half (H1) of FY 2015-16 and projected
unrestricted sales for H2 of FY 2015-16 & FY 2016-17 are as given below:
Actual (Sales in MU)Projection (Sales in MU)
(Unrestricted)
2013-14 2014-15 2015-16 H1 2015-16 H2 2015-16(H1+H2) 2016-17
494.51 622.44 363.55 369.46 733.01 837.85
Forecasting Sales: LT IV – Cottage Industries
Based on the past 5 years CAGR, a moderated growth rate of 6% is considered for
projecting second half sales of the current year 2015-16.
Similarly considering CAGR of FY 2015-16 over FY 2010-11, year-on-year growth rates
moderated growth rate of 9.2% has been adopted for forecasting sales for ensuing year.
The Actual sales for FY 2013-14,FY 2014-15 and first half (H1) of FY 2015-16 and projected
unrestricted sales for H2 of FY 2015-16 & FY 2016-17 are as given below:
Actual (Sales in MU) Projection (Sales in MU) (Unrestricted)
2013-14 2014-15 2015-16 H1 2015-16 H2 2015-16 (H1+H2) 2016-17
1.82 1.93 1.13 1.04 2.16 2.36

Forecasting Sales: LT V (Agriculture)
The Energy demand has been growing consistently over the past years. As per the present year
experience the usage of power for agriculture purpose is substantially increasing when compared to
the previous years.
Most of the pump sets under usage are not as per standard specification and therefore the pump
sets draw more Energy. The farmers are replacing the old pump sets with higher capacity pump sets,
with the hope that more water can be pumped out.
The Government of Andhra Pradesh declared a modified agriculture policy in January 2005
aimed towards incentivizing Demand side management in the agriculture sector. One of the key
features of the policy is to install Capacitors for all the existing pump sets.
So far, 90% of the existing pump sets as on 30-09-2015 are provided with Capacitors. The
licensee is taking all steps necessary to provide Capacitors for the balance pump sets also.
EPDCL is taking the following measures for Loss reduction in agricultural sector
Strict implementation of Restriction and Control measures to assure the assumed
number of hrs. of supply to agricultural sector.
Notices are issued to all farmers in EPDCL to adopt DSM measures along with
pamphlets. Posters got prepared and displayed in all prominent places. Substation wise
Meetings are conducted in all Circles and conservation of Energy by fixing the capacitors at
Motor terminals demonstrated. Farmers are explained on the importance of DSM measures
during weekly Vidyut Adalats also.
Process of Estimation:
In compliance to the directive of the Hon’ble APERC with regard to estimation
of Agriculture consumption in the service area of APEPDCL, the Agriculture consumption
in all the 5 circles are being worked out. Meters were fixed on L.V. side of sampled DTRs
feeding exclusively agricultural services in each Mandal. In EPDCL, there are about
2,11,445 number of Agricultural services existing at the end of September’2014. There are
3856 Meters existing at the LV side of the DTRs to gauge the agricultural consumption as
shown in the following table.

Name of theCircle
No. of Mandalshaving agricultural
services
The mandals havingsampled DTRs as per
TF-2.10 DTRsmetered
Srikakulam 38 30 180
Vizianagaram 34 30 307
Visakhapatnam 43 25 299
Rajahmundry 59 36 1290
Eluru 46 29 1780
Total 220 150 3856
The monthly meter readings of all the agricultural DTRs are collected from the five
circles and the consumptions are arrived. The consumptions recorded at LV side of the DTRs
will be netted off by a pre specified percentage to take care of LT network losses. The
instruction of the Commission in qualifying a particular type of LT feeder based on Line
Length, Loading pattern to a certain percentage pre specified losses is followed. The
specific Agriculture consumption per HP is estimated for all the DTRs existing in that
mandal and the same is extrapolated to all other Agriculture Pump sets spread across the
mandal to arrive at mandal wise estimated consumption.
The Distribution Licensee humbly request the Hon’ble Commission to accept the actual
agriculture sales filed by the Licensee based on the old methodology. The Licensee will adopt
the ISI methodology to measure actual agriculture sales in the future.
According to GoAP policy of releasing new agriculture connections in the year 2016-17, the
target for EPDCL during the year is to release 13,300 new connections. The consumption
from these new connections (addition in agriculture pumpsets) has also been taken into
consideration while projecting the sales.
The actual growth rate for H1 of 2015-16 over H1 of 2014-15 is 7 %. For the year
2015-16, APEPDCL has estimated the power consumption by the Agricultural category at
2,282.68 MU, taking into account actual sales till September 2015. The sales for second half
of FY 2015-16 for this category are 1,222.61 MU.
The licensee has assumed 7 hours of supply to agricultural consumers, in its
projections, considering the present power supply situation in the state. The deficit situation
is expected to continue in all months of FY 2015-16 as per current estimates. EPDCL has
considered a growth-rate of 4% for projecting the sales for FY 2016-17.The sales of FY
2016-17 for this category are 1949.627 MU.
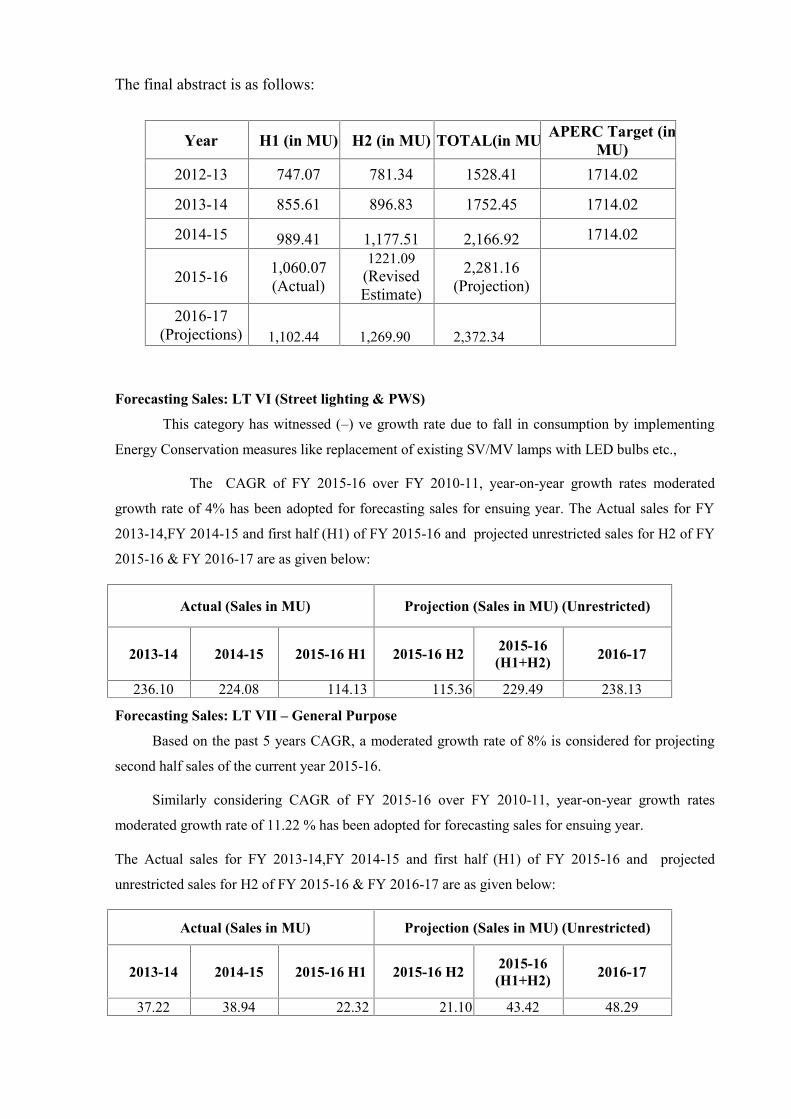
The final abstract is as follows:
Year H1 (in MU) H2 (in MU) TOTAL(in MU)APERC Target (inMU)
2012-13 747.07 781.34 1528.41 1714.02
2013-14 855.61 896.83 1752.45 1714.02
2014-15 989.41 1,177.51 2,166.92 1714.02
2015-16 1,060.07(Actual)
1221.09(RevisedEstimate)
2,281.16(Projection)
2016-17(Projections) 1,102.44 1,269.90 2,372.34
Forecasting Sales: LT VI (Street lighting & PWS)
This category has witnessed (–) ve growth rate due to fall in consumption by implementing
Energy Conservation measures like replacement of existing SV/MV lamps with LED bulbs etc.,
The CAGR of FY 2015-16 over FY 2010-11, year-on-year growth rates moderated
growth rate of 4% has been adopted for forecasting sales for ensuing year. The Actual sales for FY
2013-14,FY 2014-15 and first half (H1) of FY 2015-16 and projected unrestricted sales for H2 of FY
2015-16 & FY 2016-17 are as given below:
Actual (Sales in MU) Projection (Sales in MU) (Unrestricted)
2013-14 2014-15 2015-16 H1 2015-16 H2 2015-16(H1+H2) 2016-17
236.10 224.08 114.13 115.36 229.49 238.13
Forecasting Sales: LT VII – General Purpose
Based on the past 5 years CAGR, a moderated growth rate of 8% is considered for projecting
second half sales of the current year 2015-16.
Similarly considering CAGR of FY 2015-16 over FY 2010-11, year-on-year growth rates
moderated growth rate of 11.22 % has been adopted for forecasting sales for ensuing year.
The Actual sales for FY 2013-14,FY 2014-15 and first half (H1) of FY 2015-16 and projected
unrestricted sales for H2 of FY 2015-16 & FY 2016-17 are as given below:
Actual (Sales in MU) Projection (Sales in MU) (Unrestricted)
2013-14 2014-15 2015-16 H1 2015-16 H2 2015-16(H1+H2) 2016-17
37.22 38.94 22.32 21.10 43.42 48.29

HT – Sales ForecastHT IA - Industrial Segregated:
Keeping in view of the additional loads sanctioned, the prevailing growth rates, economic
factors and the CAGR, a moderated growth rate of 16%, 15%, 16% for 11 KV, 33 KV, and 132 KV
respectively is considered for projecting second half sales of the current year 2015-16.
Similarly considering CAGR of FY 2015-16 over FY 2010-11, year-on-year growth rates of 16%,
18%, 13% for 11 KV, 33 KV and 132 KV respectively has been adopted for forecasting sales for
ensuing year.
The voltage wise actual sales for FY 2013-14,FY 2014-15 and first half (H1) of FY 2015-16
and projected unrestricted sales for H2 of FY 2015-16 & FY 2016-17 are as given below:
Voltage
Actual (Sales in MU) Projection (Sales in MU) (Unrestricted)
2013-14 2014-15 2015-16H1 2015-16 H2 2015-16
(H1+H2) 2016-17
11 KV 1001.95 1095.18 646.82 639.19 1,286.01 1,487.62
33 KV 758.81 888.26 608.87 523.02 1,131.89 1,340.88
132 KV 927.61 1260.08 745.77 764.57 1,510.34 1,711.36
Forecasting Sales: HT IB (Ferro Alloys)
Based on past 5 years CAGR, a moderated growth rate of 11%, 11% for 33 KV, 132 KV
respectively is considered for projecting second half sales of the current year 2015-16.
Similarly considering CAGR of FY 2015-16 over FY 2010-11, year-on-year growth rates of
8% and 8% for 33 KV and 132 KV has been adopted for forecasting sales for the ensuing year.
The voltage wise actual sales for FY 2013-14,FY 2014-15 and first half (H1) of FY 2015-16
and projected unrestricted sales for H2 of FY 2015-16 & FY 2016-17 are as given below:
Voltage
Actual (Sales in MU) Projection (Sales in MU) (Unrestricted)
2013-14 2014-15 2015-16 H1 2015-16 H2 2015-16(H1+H2) 2016-17
33 KV 101.49 135.91 48.30 87.63 135.93 147.02
132 KV 1270.37 1171.54 571.90 603.29 1,175.18 1269.56

Forecasting Sales: HT II (Others):
Based on past 5 years CAGR, a moderated growth rate of 15%, 14%, 13% for 11 KV, 33 KV,
and 132 KV respectively is considered for projecting second half sales of the current year 2015-16.
Similarly considering CAGR of FY 2015-16 over FY 2010-11, year-on-year growth rates of
14%, 21%, 24% for 11 KV, 33 KV, and 132 KV respectively has been adopted for forecasting sales
for the ensuing year.
The voltage wise actual sales for FY 2013-14,FY 2014-15 and first half (H1) of FY 2015-16 and
projected unrestricted sales for H2 of FY 2015-16 & FY 2016-17 are as given below:
Voltage
Actual (Sales in MU) Projection (Sales in MU)(Unrestricted)
2013-14 2014-15 2015-16 H1 2015-16 H2 2015-16(H1+H2) 2016-17
11 KV 313.27 306.70 205.08 156.67 361.75 412.14
33 KV 112.00 135.14 69.69 75.73 145.42 176.50
132 KV 70.99 75.08 44.16 38.69 82.85 102.66
Forecasting Sales: HT III (Aviation activity at airport)
The Actual sales from 2014-15 to H1 of 2015-16 and projections for H2 of 2015-
16 and FY 2016-17 are as given below:
Projection (Sales in MU)
Voltage 2013-14 2014-152015-16
H12015-16
H22015-16(H1+H2) 2016-17
11KV 7.65 8.56 4.42 4.75 9.17 9.99
33 KV 6.69 5.10 2.88 2.29 5.17 5.79
Forecasting Sales: HT IVA (Govt. Lift Irrigation Schemes)
The applications pertaining to various upcoming lift irrigation schemes received from irrigation
department, APSIDC and other various societies are considered for projecting consumption for the
ensuing year FY 2016-17.
After evaluating the existing running schemes, progress of the new schemes and estimates
sanctioned, additional loads of around 10MVA has been considered for the FY 2016-17.
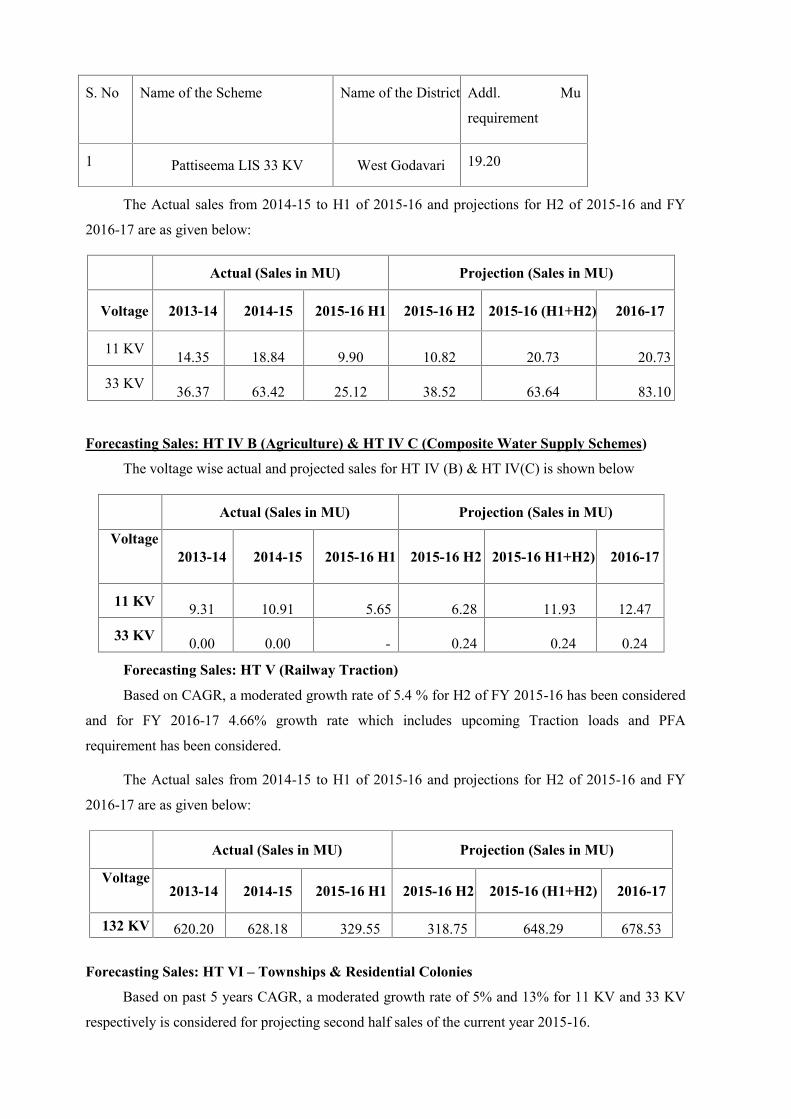
S. No Name of the Scheme Name of the District Addl. Mu
requirement
1 Pattiseema LIS 33 KV West Godavari 19.20
The Actual sales from 2014-15 to H1 of 2015-16 and projections for H2 of 2015-16 and FY
2016-17 are as given below:
Actual (Sales in MU) Projection (Sales in MU)
Voltage 2013-14 2014-15 2015-16 H1 2015-16 H2 2015-16 (H1+H2) 2016-17
11 KV 14.35 18.84 9.90 10.82 20.73 20.73
33 KV 36.37 63.42 25.12 38.52 63.64 83.10
Forecasting Sales: HT IV B (Agriculture) & HT IV C (Composite Water Supply Schemes)
The voltage wise actual and projected sales for HT IV (B) & HT IV(C) is shown below
Actual (Sales in MU) Projection (Sales in MU)
Voltage2013-14 2014-15 2015-16 H1 2015-16 H2 2015-16 H1+H2) 2016-17
11 KV 9.31 10.91 5.65 6.28 11.93 12.47
33 KV 0.00 0.00 - 0.24 0.24 0.24
Forecasting Sales: HT V (Railway Traction)
Based on CAGR, a moderated growth rate of 5.4 % for H2 of FY 2015-16 has been considered
and for FY 2016-17 4.66% growth rate which includes upcoming Traction loads and PFA
requirement has been considered.
The Actual sales from 2014-15 to H1 of 2015-16 and projections for H2 of 2015-16 and FY
2016-17 are as given below:
Actual (Sales in MU) Projection (Sales in MU)
Voltage2013-14 2014-15 2015-16 H1 2015-16 H2 2015-16 (H1+H2) 2016-17
132 KV 620.20 628.18 329.55 318.75 648.29 678.53
Forecasting Sales: HT VI – Townships & Residential Colonies
Based on past 5 years CAGR, a moderated growth rate of 5% and 13% for 11 KV and 33 KV
respectively is considered for projecting second half sales of the current year 2015-16.

Similarly considering CAGR for the period FY 2010-11 to FY 2015-16, year-on-year growth
rates moderated growth rate 1% and 13% for 11 KV and 33 KV respectively has been adopted for
forecasting sales for the ensuing year.
The voltage wise actual sales for FY 2013-14,FY 2014-15 and first half (H1) of FY 2015-16 and
projected unrestricted sales for H2 of FY 2015-16 & FY 2016-17 are as given below:
Voltage
Actual (Sales in MU) Projection (Sales in MU) (Unrestricted)
2013-14 2014-15 2015-16 H1 2015-16 H2 2015-16(H1+H2) 2016-17
11 KV 20.94 20.00 12.40 9.06 21.46 21.5933 KV 7.02 7.87 5.20 3.76 8.96 10.13
HT- RESCOS:There are two RESCOs in EPDCL area, one at Anakapalli (Visakhapatnam circle), and another
at Cheepurupalli (Vizianagram circle). The actual growth rate for H1 of 2015-16 over H1 of 2014-15
is 6.68 %. For the year 2015-16, APEPDCL has estimated the power consumption by this category at
220.16 MU, taking into account actual sales till September 2015.
The licensee has considered an appropriate 6.35% growth-rate for projecting the unrestricted
sales for ensuing year 2016-17
The Actual sales from 2013-14 to H1 of 2015-16 and projections for H2 of 2015-16 and FY
2016-17 are as given below:
VoltageActual (Sales in MU) Projection (Sales in MU) (Unrestricted)
2013-14 2014-15 2015-16 H1 2015-16 H2 2015-16 (H1+H2) 2016-17
11 KV 235.30 229.20 146.36 110.08 256.44 272.72
3.9.3 ross Revenue from Current Tariffs
The gross revenue from current tariffs (excl. NTI) estimated for FY 2015-16 & FY 2016-17are
tabulated below:
Revenue from Current Tariffs(excl. NTI) (Rs. Crs.)
2015-16
estimated
2016-17
projected
LT Category 2781.93 3380.73Domestic 1388.69 1825.94
Non – Domestic 729.82 817.07
Industrial 462.41 525.31
Cottage Industries 0.97 1.05
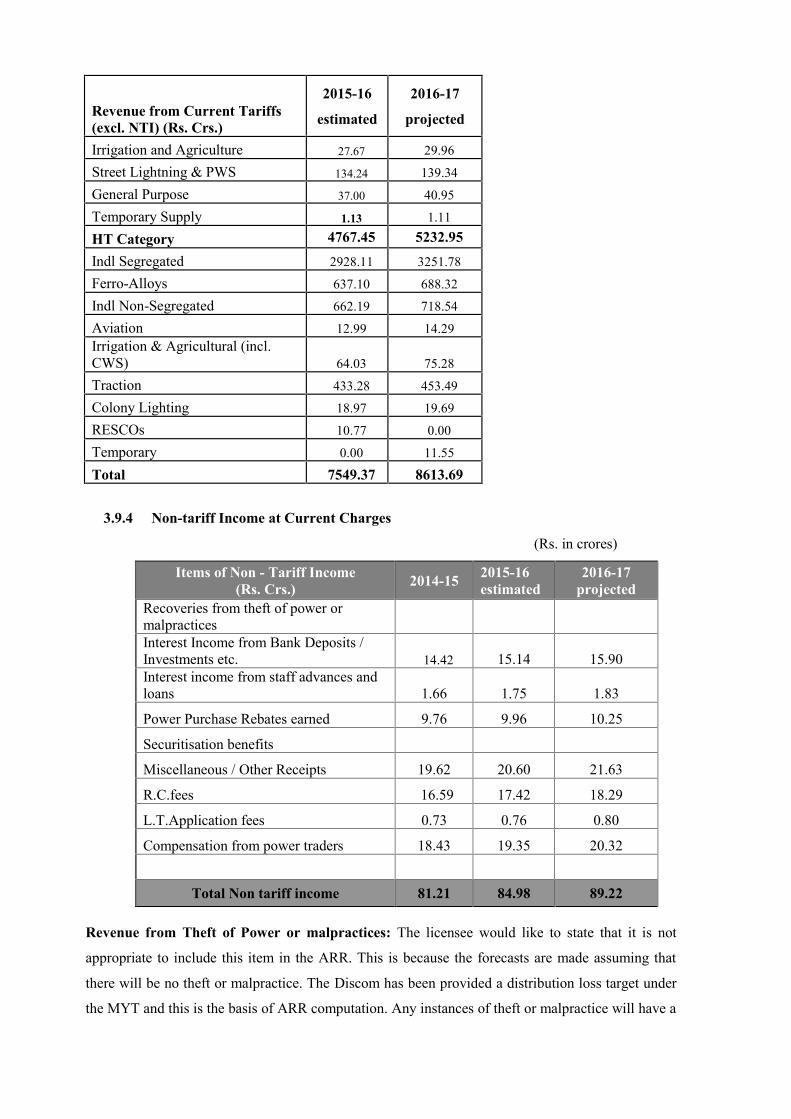
Revenue from Current Tariffs(excl. NTI) (Rs. Crs.)
2015-16
estimated
2016-17
projected
Irrigation and Agriculture 27.67 29.96
Street Lightning & PWS 134.24 139.34
General Purpose 37.00 40.95
Temporary Supply 1.13 1.11
HT Category 4767.45 5232.95Indl Segregated 2928.11 3251.78
Ferro-Alloys 637.10 688.32
Indl Non-Segregated 662.19 718.54
Aviation 12.99 14.29Irrigation & Agricultural (incl.CWS) 64.03 75.28
Traction 433.28 453.49
Colony Lighting 18.97 19.69
RESCOs 10.77 0.00
Temporary 0.00 11.55
Total 7549.37 8613.69
3.9.4 Non-tariff Income at Current Charges
(Rs. in crores)
Items of Non - Tariff Income(Rs. Crs.) 2014-15 2015-16
estimated2016-17
projectedRecoveries from theft of power ormalpracticesInterest Income from Bank Deposits /Investments etc. 14.42 15.14 15.90Interest income from staff advances andloans 1.66 1.75 1.83
Power Purchase Rebates earned 9.76 9.96 10.25
Securitisation benefits
Miscellaneous / Other Receipts 19.62 20.60 21.63
R.C.fees 16.59 17.42 18.29
L.T.Application fees 0.73 0.76 0.80
Compensation from power traders 18.43 19.35 20.32
Total Non tariff income 81.21 84.98 89.22
Revenue from Theft of Power or malpractices: The licensee would like to state that it is not
appropriate to include this item in the ARR. This is because the forecasts are made assuming that
there will be no theft or malpractice. The Discom has been provided a distribution loss target under
the MYT and this is the basis of ARR computation. Any instances of theft or malpractice will have a
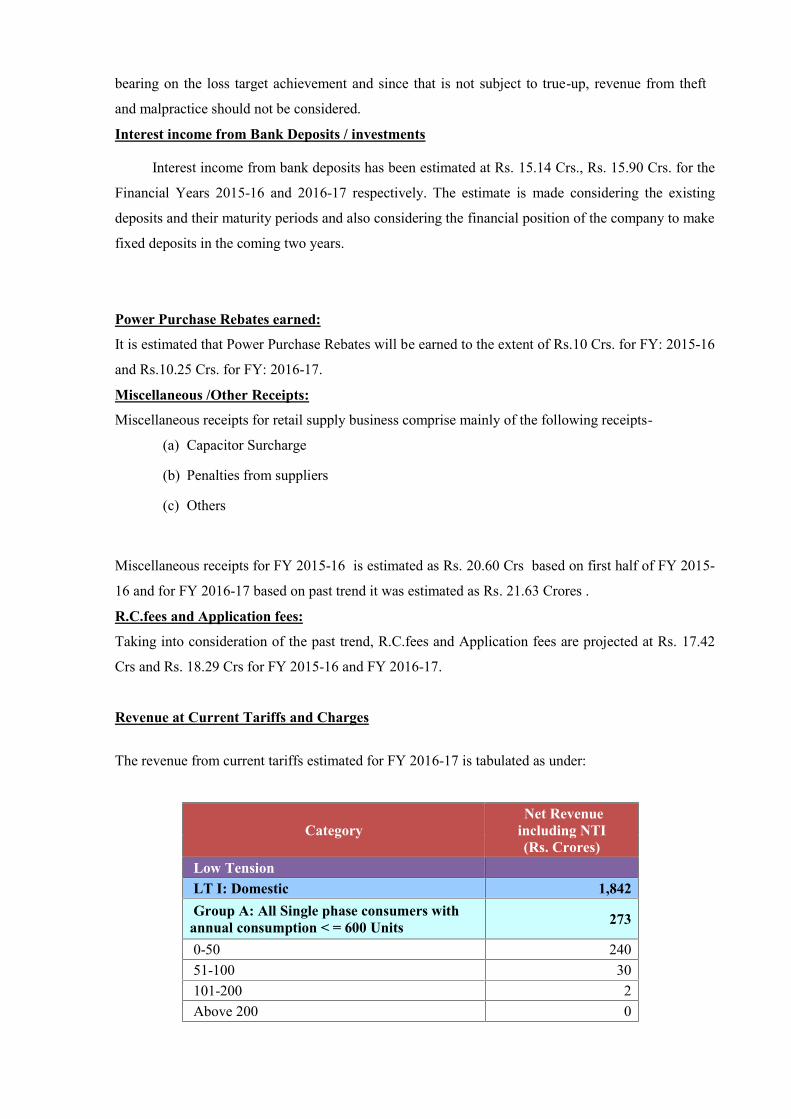
bearing on the loss target achievement and since that is not subject to true-up, revenue from theft
and malpractice should not be considered.
Interest income from Bank Deposits / investments
Interest income from bank deposits has been estimated at Rs. 15.14 Crs., Rs. 15.90 Crs. for the
Financial Years 2015-16 and 2016-17 respectively. The estimate is made considering the existing
deposits and their maturity periods and also considering the financial position of the company to make
fixed deposits in the coming two years.
Power Purchase Rebates earned:
It is estimated that Power Purchase Rebates will be earned to the extent of Rs.10 Crs. for FY: 2015-16
and Rs.10.25 Crs. for FY: 2016-17.
Miscellaneous /Other Receipts:
Miscellaneous receipts for retail supply business comprise mainly of the following receipts-
(a) Capacitor Surcharge
(b) Penalties from suppliers
(c) Others
Miscellaneous receipts for FY 2015-16 is estimated as Rs. 20.60 Crs based on first half of FY 2015-
16 and for FY 2016-17 based on past trend it was estimated as Rs. 21.63 Crores .
R.C.fees and Application fees:
Taking into consideration of the past trend, R.C.fees and Application fees are projected at Rs. 17.42
Crs and Rs. 18.29 Crs for FY 2015-16 and FY 2016-17.
Revenue at Current Tariffs and Charges
The revenue from current tariffs estimated for FY 2016-17 is tabulated as under:
CategoryNet Revenue
including NTI(Rs. Crores)
Low TensionLT I: Domestic 1,842Group A: All Single phase consumers withannual consumption < = 600 Units 273
0-50 24051-100 30101-200 2Above 200 0

CategoryNet Revenue
including NTI(Rs. Crores)
Group B: All single phase consumers withconsumption ( < =2400 and > 600 units) 942
0-50 41051-100 302101-200 157201-300 52Above 300 21Group C: All single phase consumers withannual consumption >2400 units and all threephase consumers
628
0-50 7051-100 81101-200 109201-300 116301-400 111401-500 57Above 500 units 84
LT II: Non-Domestic/Commercial 826LT II (A): Upto 50 Units/Month 820-50 82LT II (B): Above 50 Units/Month 7430-50 8251-100 83101-300 153301-500 78Above 500 347LT II (C): Advertisement Hoardings 1LT III: Industry 531Industries 413Seasonal Industries (off season) -Pisciculture/Prawn culture 107Sugarcane crushing 1Poultry farms 10Mushroom and Rabbit farms -Floriculture in Green House -LT IV: Cottage Industries 1Cottage Industries 1Agro Based Activities 0LT V: Agriculture 30LT V (A): Agriculture with DSM Measures 19Corporate Farmers & IT Assesses 6Wet Land Farmers (Holdings >2.5 acre) 3Dry Land Farmers (Connections > 3 nos.) 1

CategoryNet Revenue
including NTI(Rs. Crores)
Wet Land Farmers (Holdings <= 2.5 acre) 1Dry Land Farmers (Connections <= 3 nos.) 8LT V (B): Agriculture without DSMMeasures 11
Corporate Farmers & IT Assesses 3Wet Land Farmers (Holdings >2.5 acre) 5Dry Land Farmers (Connections > 3 nos.) 2Wet Land Farmers (Holdings <= 2.5 acre) 1Dry Land Farmers (Connections <= 3 nos.) 1LT V (C): Others 0Salt farming units with CL upto 15HP 0Rural Horticulture Nurseries 0LT VI: Street Lighitng & PWS 141LT VI (A): Street Lighting 88Panchayats 51Municipalities 11Municipal Corporations 26LT VI (B): PWS Schemes 53Panchayats 45Municipalities 4Municipal Corporations 4LT-VI (C): NTR Sujala Padhakam 0.13LT VII: General 41LT VII (A): General Purpose 34LT VII (B): Religious Places 8LT VII: Temporary Supply 1
Total LT 3,414
High TensionHT Category at 11 kv 1,717HT I (A): General 1,074Lights and Fans 22Industrial Colonies 1Seasonal Industries 6Time of Day Tariffs (6 PM to 10 PM) 116HT I (B): Ferro Alloy Units -HT II: Others 386Time of Day Tariffs (6 PM to 10 PM) 59HT III: Airports, Bus Stations and RailwayStations 8
Time of Day Tariffs (6 PM to 10 PM) 2HT IV Government LIS 12HT IV Agriculture -

CategoryNet Revenue
including NTI(Rs. Crores)
HT IV CPWS 6HT VI: Townships & Residential Colonies 14HT VII: Green Power -HT VIII: Temporary -Category: RESCOs 12
HT Category at 33 kv 1,238.57HT I (A): General 885Lights and Fans 4Industrial Colonies 0Seasonal Industries 4Time of Day Tariffs (6 PM to 10 PM) 43HT I (B): Ferro Alloy Units 78HT II: Others 155Time of Day Tariffs (6 PM to 10 PM) 12HT III: Airports, Bus Stations and RailwayStations 4
Time of Day Tariffs (6 PM to 10 PM) 0HT IV Government LIS 47HT IV Agriculture 0HT IV CPWS -HT VI: Townships & Residential Colonies 6HT VII: Green Power -HT VIII: Temporary -Category: RESCOs -
HT Category at 132 kv 2,334HT I (A): General 1,036Lights and Fans 19Industrial Colonies 21Seasonal Industries -Time of Day Tariffs (6 PM to 10 PM) 51HT I (B): Ferro Alloy Units 618HT II: Others 114Time of Day Tariffs (6 PM to 10 PM) 6HT III: Airports, Bus Stations and RailwayStations -
Time of Day Tariffs (6 PM to 10 PM) -HT IV Government LIS 11HT IV Agriculture -HT IV CPWS -HT V: Railway Traction 458HT VI: Townships & Residential Colonies -HT VII: Green Power -
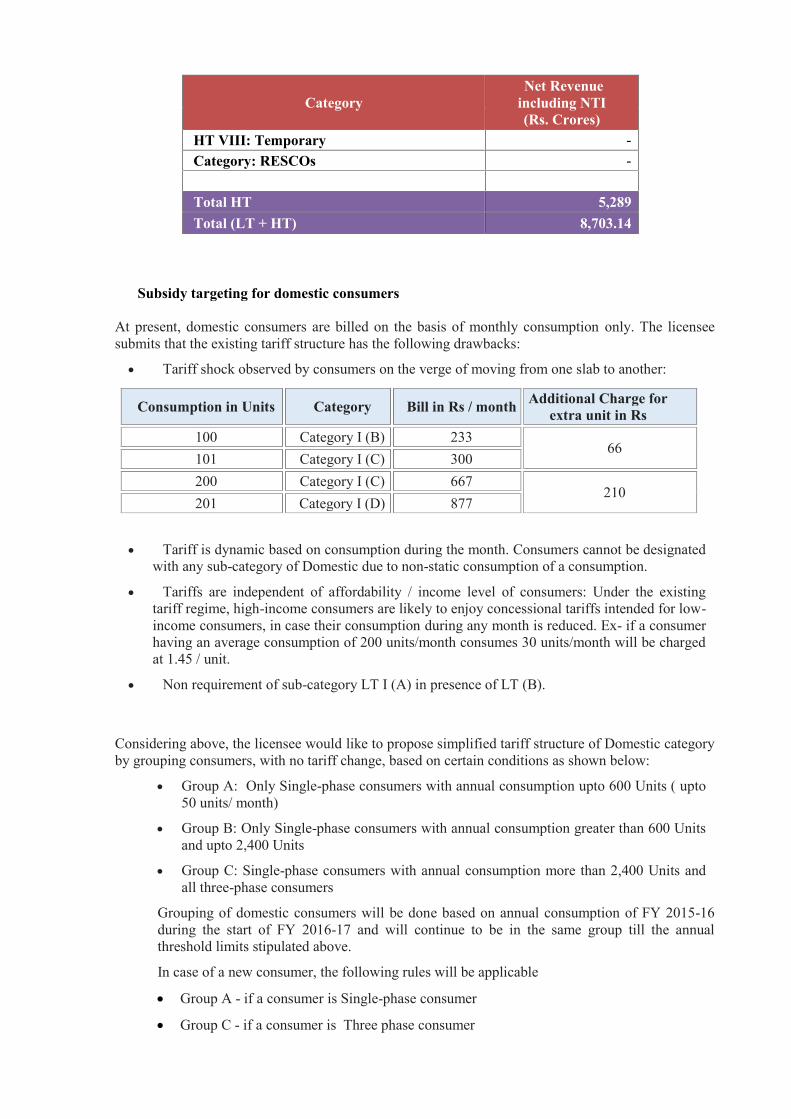
CategoryNet Revenue
including NTI(Rs. Crores)
HT VIII: Temporary -Category: RESCOs -
Total HT 5,289Total (LT + HT) 8,703.14
Subsidy targeting for domestic consumers
At present, domestic consumers are billed on the basis of monthly consumption only. The licenseesubmits that the existing tariff structure has the following drawbacks:
Tariff shock observed by consumers on the verge of moving from one slab to another:
Consumption in Units Category Bill in Rs / month Additional Charge forextra unit in Rs
100 Category I (B) 23366
101 Category I (C) 300200 Category I (C) 667
210201 Category I (D) 877
Tariff is dynamic based on consumption during the month. Consumers cannot be designatedwith any sub-category of Domestic due to non-static consumption of a consumption.
Tariffs are independent of affordability / income level of consumers: Under the existingtariff regime, high-income consumers are likely to enjoy concessional tariffs intended for low-income consumers, in case their consumption during any month is reduced. Ex- if a consumerhaving an average consumption of 200 units/month consumes 30 units/month will be chargedat 1.45 / unit.
Non requirement of sub-category LT I (A) in presence of LT (B).
Considering above, the licensee would like to propose simplified tariff structure of Domestic categoryby grouping consumers, with no tariff change, based on certain conditions as shown below:
Group A: Only Single-phase consumers with annual consumption upto 600 Units ( upto50 units/ month)
Group B: Only Single-phase consumers with annual consumption greater than 600 Unitsand upto 2,400 Units
Group C: Single-phase consumers with annual consumption more than 2,400 Units andall three-phase consumers
Grouping of domestic consumers will be done based on annual consumption of FY 2015-16during the start of FY 2016-17 and will continue to be in the same group till the annualthreshold limits stipulated above.
In case of a new consumer, the following rules will be applicable
Group A - if a consumer is Single-phase consumer
Group C - if a consumer is Three phase consumer

.The existing tariff structure is as under:
Existing Category / Slab Structure(Units) Energy charge (Rs./Unit)
LT I (A): Upto 50 Units/Month 1.45LT I (B): Above 50 Units/Month and Up to 100 Units/Month
<50 1.4551-100 2.60
LT I (C): Above 100 Units/Month and Up to 200 Units/Month<50 2.60
51-100 2.60101-150 3.60151-200 3.60
LT I (D): Above 200 Units/Month<50 2.60
51-100 3.25101-150 4.88151-200 5.63201-250 6.70251-300 7.22301-400 7.75401-500 8.27
>500 8.80
The licensee proposes a simplified tariff structure with grouping, with no change in in tariff, asunder:
Proposed Category / Slab Structure(Units)
Energy charge(Rs./Unit)
Group A: All Single phase consumers with annualconsumption < = 600 Units
0-50 1.4551-100 2.60
101-200 3.60
Above 200# 6.90
Group B: All single phase consumers with consumption ( <=2400 and > 600 units)
0-50 2.60
51-100 2.60
101-200 3.60
201-300 6.90
Above 300 7.75
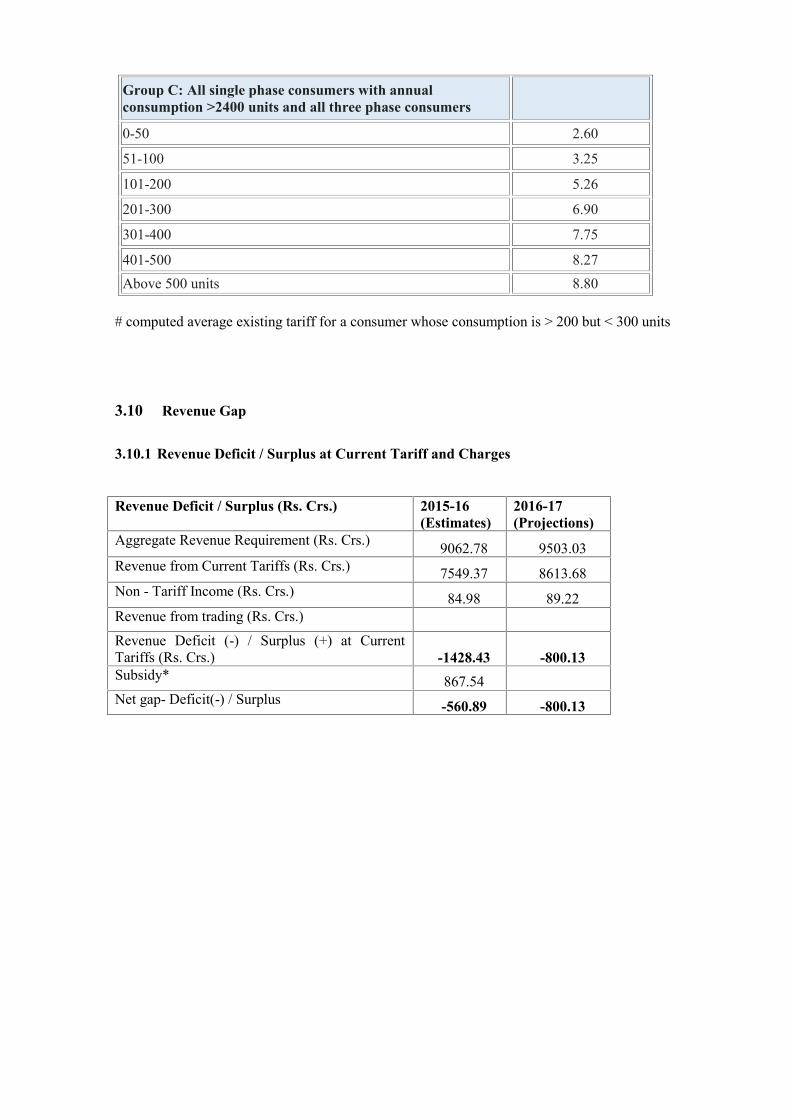
Group C: All single phase consumers with annualconsumption >2400 units and all three phase consumers
0-50 2.60
51-100 3.25
101-200 5.26
201-300 6.90
301-400 7.75
401-500 8.27Above 500 units 8.80
# computed average existing tariff for a consumer whose consumption is > 200 but < 300 units
3.10 Revenue Gap
3.10.1 Revenue Deficit / Surplus at Current Tariff and Charges
Revenue Deficit / Surplus (Rs. Crs.) 2015-16(Estimates)
2016-17(Projections)
Aggregate Revenue Requirement (Rs. Crs.) 9062.78 9503.03Revenue from Current Tariffs (Rs. Crs.) 7549.37 8613.68Non - Tariff Income (Rs. Crs.) 84.98 89.22Revenue from trading (Rs. Crs.)
Revenue Deficit (-) / Surplus (+) at CurrentTariffs (Rs. Crs.) -1428.43 -800.13Subsidy* 867.54Net gap- Deficit(-) / Surplus -560.89 -800.13

5. Status on implementation of Directives
Compliance with directives issued by the Hon’ble Commission in the Tariff Order for FY: 2015-16Dir.No. Directive Remarks
1 “report to the Commission by or before 30-06-2015,their readiness to measure agricultural consumptionbased on method-II within the respective areas of theiroperation comprehensively and completely andthereafter deliver the progress report at the office of theCommission on measurement of agriculturalconsumption based on method-II before the lastworking day of every month for the previous monthwithout fail until further orders of the Commission onthis subject. The Commission may cause such reportsmade by the Licensees to be posted on the websites ofthe Commission and theLicensees for the information of all the stakeholders. Indefault of either licensee reporting such readiness by30-06-2015, it shall submit its explanation and reasonsfor the default to enable the Commission to considertaking necessary corrective action forenforcement of this direction”.
For projecting Agriculturalconsumption in EPDCL newRobust methodology is beingimplemented file is underprocess and soon afterfinalization rate contract willbe issued to the local sectioncontractors. .
2 “The licensees shall, as far as possible, adhere to thesales volumes approved in this Order with an overallintent of avoiding under recovery of revenue. In case,there is any abnormal variation in actual salescompared with the approved sales, the licensees mayapproach the Commission for remedial measures inaccordance with the applicable statutory and regulatoryprovisions. If the Commission finds any such deviation/variation/ contravention to be unjustified, theCommission may be compelled to invoke the penalprovisions provided by law”.
Directive complied videDNO.2570/15dt.26.10.2015
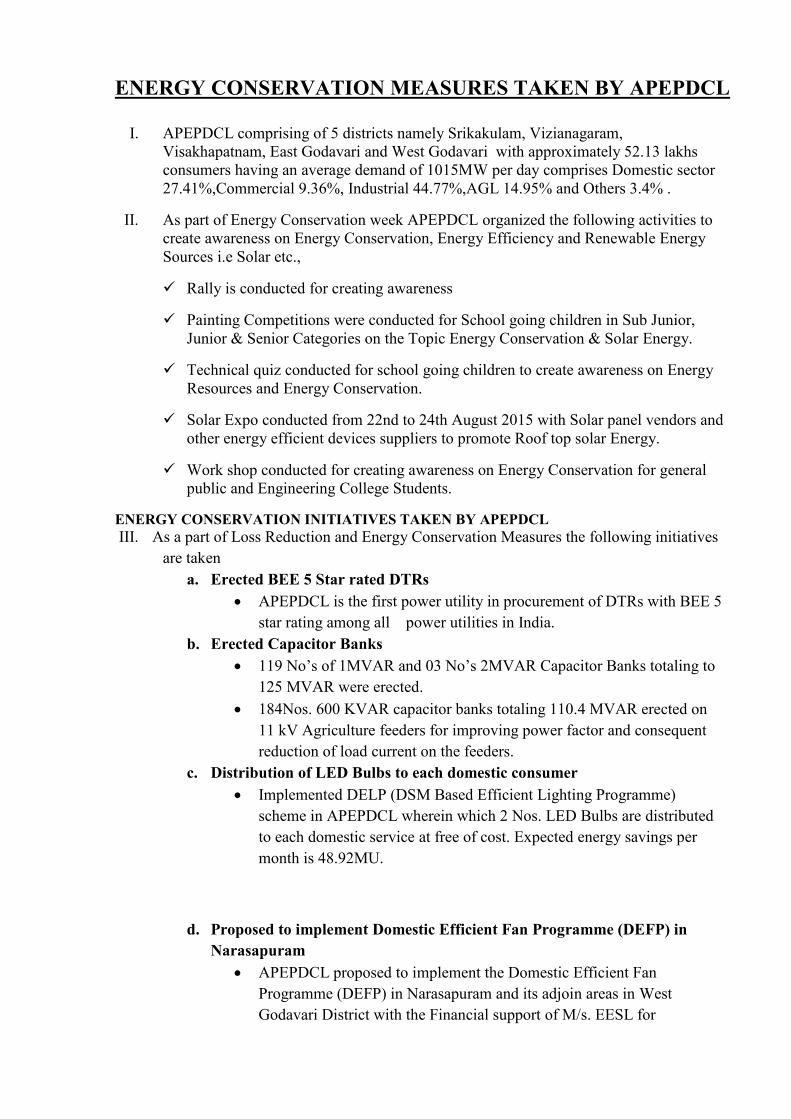
ENERGY CONSERVATION MEASURES TAKEN BY APEPDCL
I. APEPDCL comprising of 5 districts namely Srikakulam, Vizianagaram,Visakhapatnam, East Godavari and West Godavari with approximately 52.13 lakhsconsumers having an average demand of 1015MW per day comprises Domestic sector27.41%,Commercial 9.36%, Industrial 44.77%,AGL 14.95% and Others 3.4% .
II. As part of Energy Conservation week APEPDCL organized the following activities tocreate awareness on Energy Conservation, Energy Efficiency and Renewable EnergySources i.e Solar etc.,
Rally is conducted for creating awareness
Painting Competitions were conducted for School going children in Sub Junior,Junior & Senior Categories on the Topic Energy Conservation & Solar Energy.
Technical quiz conducted for school going children to create awareness on EnergyResources and Energy Conservation.
Solar Expo conducted from 22nd to 24th August 2015 with Solar panel vendors andother energy efficient devices suppliers to promote Roof top solar Energy.
Work shop conducted for creating awareness on Energy Conservation for generalpublic and Engineering College Students.
ENERGY CONSERVATION INITIATIVES TAKEN BY APEPDCLIII. As a part of Loss Reduction and Energy Conservation Measures the following initiatives
are takena. Erected BEE 5 Star rated DTRs
APEPDCL is the first power utility in procurement of DTRs with BEE 5star rating among all power utilities in India.
b. Erected Capacitor Banks 119 No’s of 1MVAR and 03 No’s 2MVAR Capacitor Banks totaling to
125 MVAR were erected. 184Nos. 600 KVAR capacitor banks totaling 110.4 MVAR erected on
11 kV Agriculture feeders for improving power factor and consequentreduction of load current on the feeders.
c. Distribution of LED Bulbs to each domestic consumer Implemented DELP (DSM Based Efficient Lighting Programme)
scheme in APEPDCL wherein which 2 Nos. LED Bulbs are distributedto each domestic service at free of cost. Expected energy savings permonth is 48.92MU.
d. Proposed to implement Domestic Efficient Fan Programme (DEFP) inNarasapuram APEPDCL proposed to implement the Domestic Efficient Fan
Programme (DEFP) in Narasapuram and its adjoin areas in WestGodavari District with the Financial support of M/s. EESL for

distribution of 1,00,000 Nos. BEE 5 star rated fans to 50,000 Nos.domestic consumer with a cost of Rs.15.55 Crs. The estimated energysavings per annum is 14.70 MU.
e. Installed Ag DSM Project APEPDCL has initiated implementation of Ag DSM based project at
Rajanagaram Mandal in East Godavari District on ESCROW modelwith M/s EESL. Under this project 2496 inefficient agricultural Pumpsets are being replaced with energy efficient pumps (EEPS) and the totalestimated energy savings per annum is about 21.37 MU.
IV. Due to the above and various other activities the Energy loss of APEPDCL has gotreduced to 6.32%. If it is further reduced by 1%, Approx 168MU of power can besaved annually cost of which is Rs/- 70crores and hence loss reduction activities arebeing continuously monitored.
V. Solar Roof Top Project 10KW Roof top Solar Project were installed at ATC building and circuit
house / Visakhapatnam during the year 2012. Encouraging consumers for Solar Power generation and net metering by
installing grid connected roof top Solar PV system by individualconsumer with 30% subsidy on the project cost. 44 No’s Solar Roof topunits commissioned with a total capacity of 622 KW in APEPDCL.
VI. Installed Solar Agriculture Pump sets As a measure to reduce power purchase cost especially in Agriculture
which is the highest loss potential pocket ,995 Nos. solar AgriculturePump sets were installed and 49 Nos. Agreements given to the channelpartners covering 1000 Nos. beneficiaries and the 5 No’s works areunder progress. Agreements are concluded for additional 1000Nos.Pump sets.
VII. NEW IT INITIATIVES IN APEPDCL Implementation of ON LINE NSC in Call Centers.
Implemented Centralized Payment System where system of decentralizedpayments to the suppliers and contractors was centralized as a part ofrationalization of payment system in APEPDCL.
Implemented E-Stores: E-stores is developed in SAP to resolve the problems
faced by the sections officers and to save time and manpower where in the
material is directly sent to respective section officers by district stores.
IMPLEMENTED LMC Module for tracking no. of interruptions and
duration of interruptions on the feeders online.
6. CoS Report
1 Introduction
This report presents the estimated cost of service for various consumer categories of the EasternPower Distribution Company Limited (APEPDCL), for the year starting on April 1, 2016 andending on March 31, 2017. The objective of this report is to classify the costs into demand;energy and customer related components and then apportion the same to various customercategories.The steps involved in the analysis are:
Forecasting the energy and peak demand requirements for the power system in the yearunder consideration;
Forecasting the energy and peak demand requirements at the transmission-distributioninterface in that year;
Estimating the energy and peak demand requirements for each customer category for thatyear;
Estimating the costs of providing the energy and peak demand required for each customercategory; and
Classifying and allocating the above costs to various consumer categories of APEPDCL atthe retail level.
(This space is intentionally left blank)
2 COST OF SERVICE MODEL FOR APEPDCL
The cost of service calculations are based on the cost of service model developed for EPDCL.The model, as currently used, calculates the cost of serving all customers categories ofAPEPDCL.All financial input into the model is as per the ARR for the year 2016-17, including revenue, andexpenditure data.The following section gives a brief overview of the Cost of Service model developed for APEPDCL
(This space is intentionally left blank)

Financial InputCost Elements as per the ARR1. Power Purchase Cost2. Network & Other cost
Technical Input
Energy Sales ( MU)
Coincident Demand (MW)
Non- Coincident Demand(MW)/ Contracted Demand(MW)
Expenditure ClassificationClassification of the costelements –
Demand Related
Energy Related
Customer Related
Expenditure AllocationAllocation of classified coststo Consumer Categories
Model Outputs
Category-wise PP Cost allocation
Category-wise Transmission Costallocation
Category-wise Distribution Costallocation
Category-wise Consolidated CostSummary
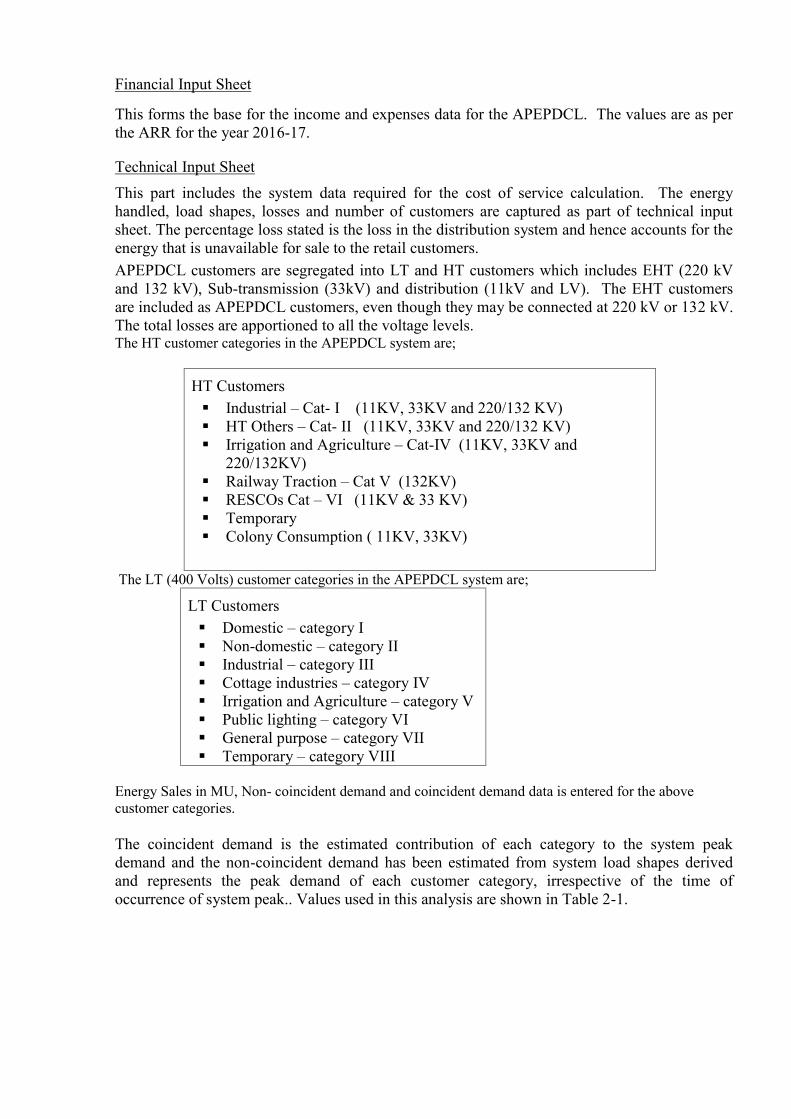
Financial Input Sheet
This forms the base for the income and expenses data for the APEPDCL. The values are as perthe ARR for the year 2016-17.
Technical Input SheetThis part includes the system data required for the cost of service calculation. The energyhandled, load shapes, losses and number of customers are captured as part of technical inputsheet. The percentage loss stated is the loss in the distribution system and hence accounts for theenergy that is unavailable for sale to the retail customers.APEPDCL customers are segregated into LT and HT customers which includes EHT (220 kVand 132 kV), Sub-transmission (33kV) and distribution (11kV and LV). The EHT customersare included as APEPDCL customers, even though they may be connected at 220 kV or 132 kV.The total losses are apportioned to all the voltage levels.The HT customer categories in the APEPDCL system are;
HT Customers Industrial – Cat- I (11KV, 33KV and 220/132 KV) HT Others – Cat- II (11KV, 33KV and 220/132 KV) Irrigation and Agriculture – Cat-IV (11KV, 33KV and
220/132KV) Railway Traction – Cat V (132KV) RESCOs Cat – VI (11KV & 33 KV) Temporary Colony Consumption ( 11KV, 33KV)
The LT (400 Volts) customer categories in the APEPDCL system are;
LT Customers Domestic – category I Non-domestic – category II Industrial – category III Cottage industries – category IV Irrigation and Agriculture – category V Public lighting – category VI General purpose – category VII Temporary – category VIII
Energy Sales in MU, Non- coincident demand and coincident demand data is entered for the abovecustomer categories.
The coincident demand is the estimated contribution of each category to the system peakdemand and the non-coincident demand has been estimated from system load shapes derivedand represents the peak demand of each customer category, irrespective of the time ofoccurrence of system peak.. Values used in this analysis are shown in Table 2-1.
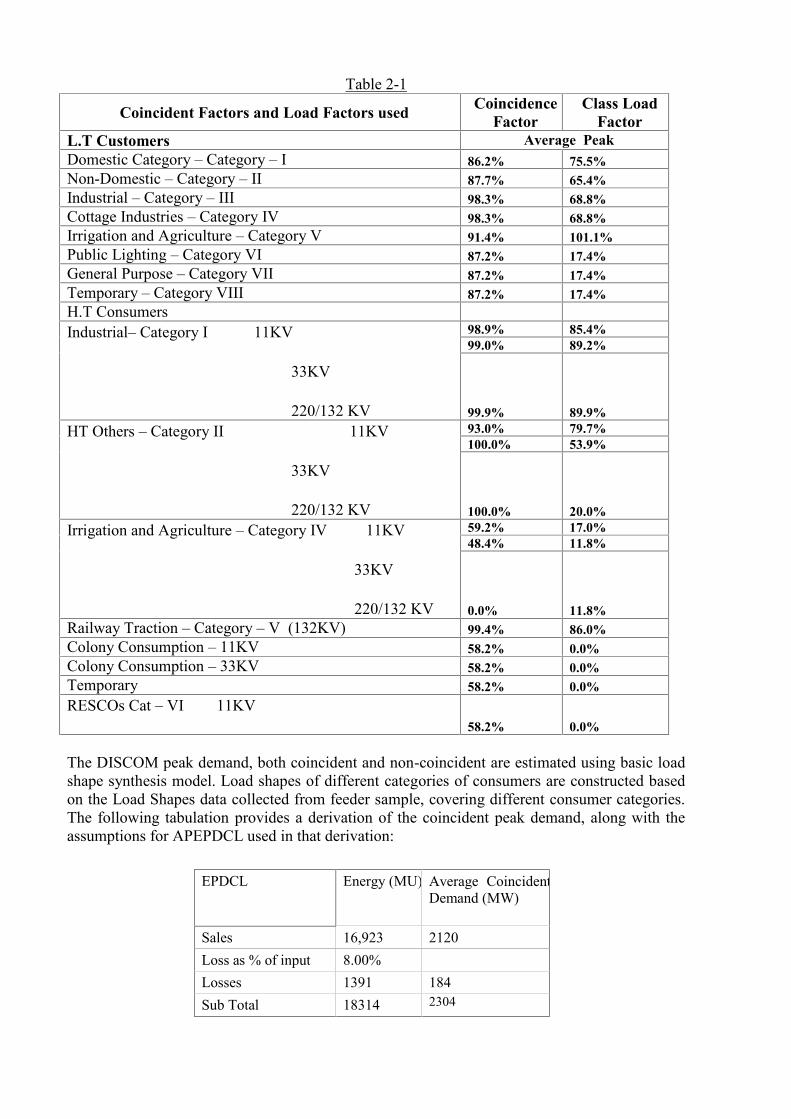
Table 2-1
Coincident Factors and Load Factors used CoincidenceFactor
Class LoadFactor
L.T Customers Average PeakDomestic Category – Category – I 86.2% 75.5%Non-Domestic – Category – II 87.7% 65.4%Industrial – Category – III 98.3% 68.8%Cottage Industries – Category IV 98.3% 68.8%Irrigation and Agriculture – Category V 91.4% 101.1%Public Lighting – Category VI 87.2% 17.4%General Purpose – Category VII 87.2% 17.4%Temporary – Category VIII 87.2% 17.4%H.T ConsumersIndustrial– Category I 11KV
33KV
220/132 KV
98.9% 85.4%99.0% 89.2%
99.9% 89.9%HT Others – Category II 11KV
33KV
220/132 KV
93.0% 79.7%100.0% 53.9%
100.0% 20.0%Irrigation and Agriculture – Category IV 11KV
33KV
220/132 KV
59.2% 17.0%48.4% 11.8%
0.0% 11.8%Railway Traction – Category – V (132KV) 99.4% 86.0%Colony Consumption – 11KV 58.2% 0.0%Colony Consumption – 33KV 58.2% 0.0%Temporary 58.2% 0.0%RESCOs Cat – VI 11KV
58.2% 0.0%
The DISCOM peak demand, both coincident and non-coincident are estimated using basic loadshape synthesis model. Load shapes of different categories of consumers are constructed basedon the Load Shapes data collected from feeder sample, covering different consumer categories.The following tabulation provides a derivation of the coincident peak demand, along with theassumptions for APEPDCL used in that derivation:
EPDCL Energy (MU) Average CoincidentDemand (MW)
Sales 16,923 2120Loss as % of input 8.00%Losses 1391 184Sub Total 18314 2304

The load factor and coincidence factor included in the Model for each category are assumedbased on a review of the characteristics of the loads and load mix in APEPDCL. One of the keyassumptions is on the assessment of the timing of the system peak in the test year and this has asignificant bearing on the coincidence factor for each of the customers. Recent data indicatethat:
The system peak demand of APEPDCL is occurring during Morning hours due toAgricultural loads.
During the morning peak occurrence , the coincidence factor of agriculture is 100% and thesame is reduced to zero at the time of evening peak
Based on above considerations, it is felt that average demand method would be suitable for
allocation of costs to consumer categories since it allocates the cost equitably on all consumer
categories based on morning and evening peak loads. In the average demand method, as the
name suggests, average of coincident morning peak and coincident evening peak is taken. In the
model there is provision to calculate the cost based on the coincident morning peak, evening
peak and average. The current option selected in the model is the average method.
Expenditure Functionalization
The new model is developed keeping in view the unbundled nature of the power sector in A.P,hence the expenditure pertaining to EPDCL is taken as per the ARR in the financial input sheet.
Power Purchase Cost Transmission & SLDC Charges Repairs and maintenance Employee costs Administration and general expenses Depreciation Interest and financial charges Other expenses
Expenditure Classification
This section classifies the expenditure into demand, energy and customer related items. Theoptions with respect to classification are;
Demand Energy 80% Demand , 20% Customer Customer Manual entry
The fixed costs in the power purchase are treated as demand related expense and the variable cost ofpower purchase is treated as energy related expense.
Entire transmission cost is considered to be a demand related expense. The O & M expenditure indistribution is classified into demand and customer related in the ratio of 80:20. The same has beenarrived at based on subjective judgment, as it is felt that some portion of the assets and employeeexpenses are used for catering to the needs of the customer such as customer service/call centers. Theother cost elements in distribution viz ROCE, depreciation and other costs have been fully considered
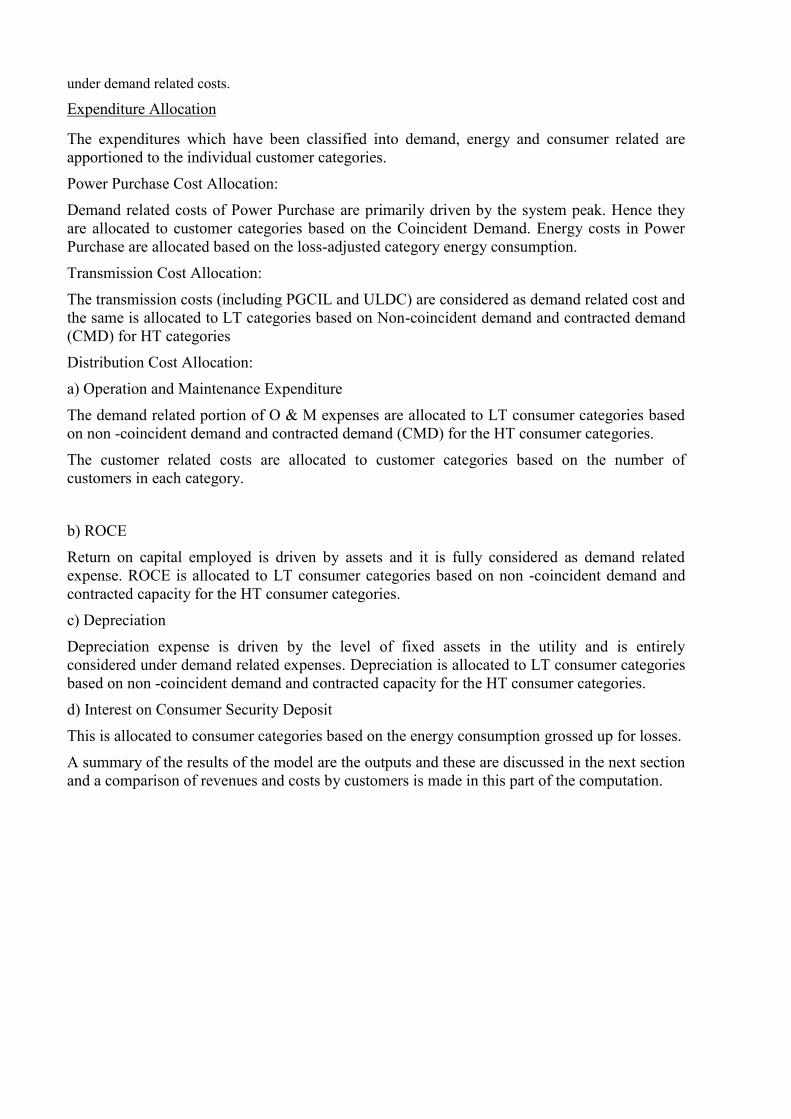
under demand related costs.
Expenditure Allocation
The expenditures which have been classified into demand, energy and consumer related areapportioned to the individual customer categories.
Power Purchase Cost Allocation:
Demand related costs of Power Purchase are primarily driven by the system peak. Hence theyare allocated to customer categories based on the Coincident Demand. Energy costs in PowerPurchase are allocated based on the loss-adjusted category energy consumption.
Transmission Cost Allocation:
The transmission costs (including PGCIL and ULDC) are considered as demand related cost andthe same is allocated to LT categories based on Non-coincident demand and contracted demand(CMD) for HT categories
Distribution Cost Allocation:
a) Operation and Maintenance Expenditure
The demand related portion of O & M expenses are allocated to LT consumer categories basedon non -coincident demand and contracted demand (CMD) for the HT consumer categories.
The customer related costs are allocated to customer categories based on the number ofcustomers in each category.
b) ROCE
Return on capital employed is driven by assets and it is fully considered as demand relatedexpense. ROCE is allocated to LT consumer categories based on non -coincident demand andcontracted capacity for the HT consumer categories.
c) Depreciation
Depreciation expense is driven by the level of fixed assets in the utility and is entirelyconsidered under demand related expenses. Depreciation is allocated to LT consumer categoriesbased on non -coincident demand and contracted capacity for the HT consumer categories.
d) Interest on Consumer Security Deposit
This is allocated to consumer categories based on the energy consumption grossed up for losses.
A summary of the results of the model are the outputs and these are discussed in the next sectionand a comparison of revenues and costs by customers is made in this part of the computation.

3 Results
The following tabulation summarizes the results of the process:
APEPDCL needs to handle 18,314 MU, which consist of sale of 16,923 MU to itscustomers and losses of 1,391 MU.
Average Peak demand required by APEPDCL is 2,304 MW, which consist of 2,120 MW toserve the customers, and 184 MW of losses in the system.
The average unit cost of supplying the customers of APEPDCL is estimated at Rs.5.62/kWh.
Cost of Service Model - Eastern Power Distribution Company LimitedFinancial Year 2016-17 Nature of expected Peak Demand Average
Revenue from Sale of Power Cost of ServiceR
even
ue fr
om S
ale
of P
ower
Ave
rage
real
isat
ion
per u
nit
(pai
se/k
Wh)
Allo
cate
dE
xped
nitu
re(R
s/C
rs)
Cos
t of S
ervi
ce
Low Tension SupplyDomestic - Category I 1,842.4 3.87 - 2,981.9 6.26Non-domestic Supply - Category II 825.8 9.44 - 563.2 6.44Industrial Supply - Category III 530.9 6.34 - 529.1 6.31Cottage Industries - Category IV 1.1 4.49 - 1.6 6.64Irrigation and Agriculture - Category V 30.3 0.13 - 1,213.9 5.12Public Lighting - Category VI 140.8 5.91 - 180.2 7.57General Purpose - Category VII 41.4 8.57 - 38.7 8.01Temporary - Category VIII 1.1 10.11 - 0.8 7.47Total Low Tension Supply 3,413.8 3.73 - 5,509 6.03
High Tension SupplyIndustrial - Cat- I 1,219.0 8.19 - 825.7 5.55Industrial Segregated - Cat- I (33KV) 1,012.7 6.81 - 747.2 5.02Indusl. Segregated - Cat-I (220/132KV) 1,744.1 5.85 - 1,443.4 4.84HT Others - Cat-II 454.6 10.77 - 259.9 6.16Indusl. Non-Segregated - Cat- II (33KV) 172.0 9.43 - 102.4 5.62Indusl. Non-Segre - Cat-II (220/132KV) 120.5 11.74 - 63.0 6.14Irrigation and Agriculture - Cat-IV 17.8 5.37 - 17.4 5.23Irrigation and Agriculture - Cat-IV (33KV) 47.5 5.70 - 48.2 5.78Irrigation and Agriculture - Cat-IV (132KV) 10.7 5.70 - 10.5 5.56Railway Traction - Cat V (132KV) 458.3 6.75 - 343.4 5.06Colony Consumption (11KV) 13.6 6.32 - 12.3 5.70Colony Consumption (33KV) 6.3 6.19 - 5.2 5.11Temporary - - -RESCOS Cat VI 11.7 0.43 - 115.2 4.22Total High Tension Supply 5,288.9 6.80 - 3,994 5.13
TOTAL 8,702.8 5.14 - 9,503 5.62
CONSUMER CATEGORIES
Non
- Tar
iff In
com
e
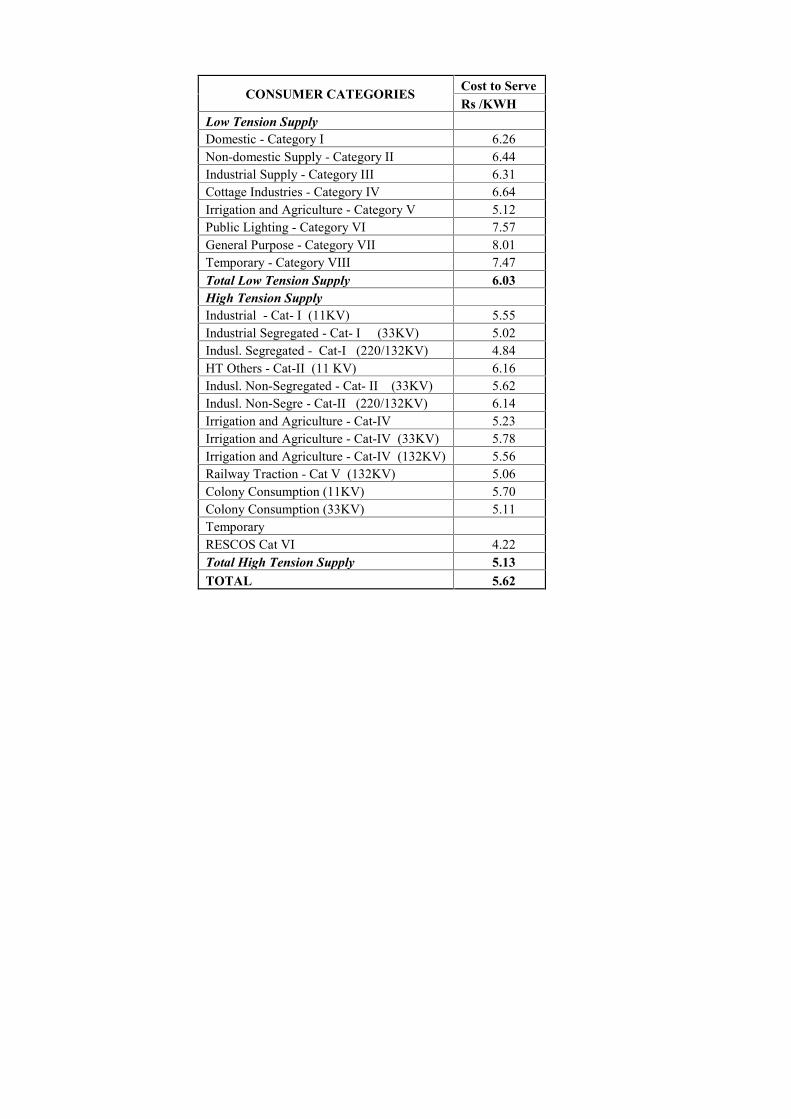
CONSUMER CATEGORIES Cost to ServeRs /KWH
Low Tension SupplyDomestic - Category I 6.26Non-domestic Supply - Category II 6.44Industrial Supply - Category III 6.31Cottage Industries - Category IV 6.64Irrigation and Agriculture - Category V 5.12Public Lighting - Category VI 7.57General Purpose - Category VII 8.01Temporary - Category VIII 7.47Total Low Tension Supply 6.03High Tension SupplyIndustrial - Cat- I (11KV) 5.55Industrial Segregated - Cat- I (33KV) 5.02Indusl. Segregated - Cat-I (220/132KV) 4.84HT Others - Cat-II (11 KV) 6.16Indusl. Non-Segregated - Cat- II (33KV) 5.62Indusl. Non-Segre - Cat-II (220/132KV) 6.14Irrigation and Agriculture - Cat-IV 5.23Irrigation and Agriculture - Cat-IV (33KV) 5.78Irrigation and Agriculture - Cat-IV (132KV) 5.56Railway Traction - Cat V (132KV) 5.06Colony Consumption (11KV) 5.70Colony Consumption (33KV) 5.11TemporaryRESCOS Cat VI 4.22Total High Tension Supply 5.13TOTAL 5.62

7. Performance Reports
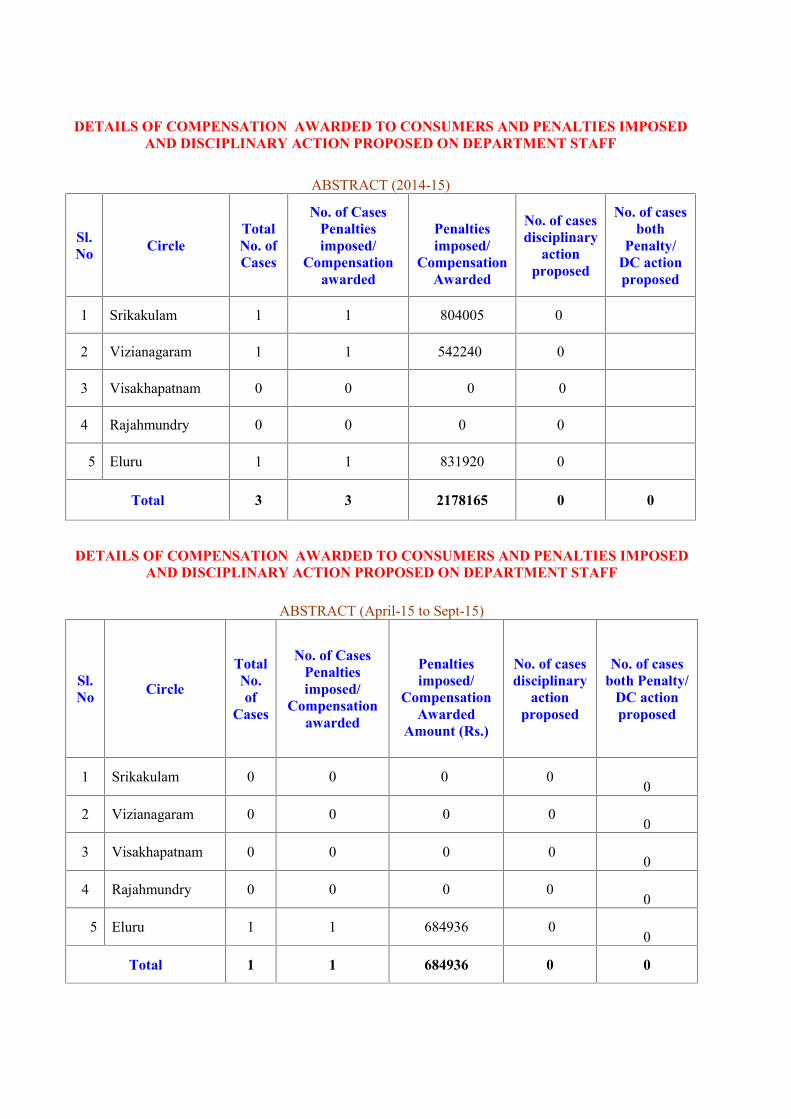
DETAILS OF COMPENSATION AWARDED TO CONSUMERS AND PENALTIES IMPOSEDAND DISCIPLINARY ACTION PROPOSED ON DEPARTMENT STAFF
ABSTRACT (2014-15)
Sl.No Circle
TotalNo. ofCases
No. of CasesPenaltiesimposed/
Compensationawarded
Penaltiesimposed/
CompensationAwarded
No. of casesdisciplinary
actionproposed
No. of casesboth
Penalty/DC actionproposed
1 Srikakulam 1 1 804005 0
2 Vizianagaram 1 1 542240 0
3 Visakhapatnam 0 0 0 0
4 Rajahmundry 0 0 0 0
5 Eluru 1 1 831920 0
Total 3 3 2178165 0 0
DETAILS OF COMPENSATION AWARDED TO CONSUMERS AND PENALTIES IMPOSEDAND DISCIPLINARY ACTION PROPOSED ON DEPARTMENT STAFF
ABSTRACT (April-15 to Sept-15)
Sl.No Circle
TotalNo.of
Cases
No. of CasesPenaltiesimposed/
Compensationawarded
Penaltiesimposed/
CompensationAwarded
Amount (Rs.)
No. of casesdisciplinary
actionproposed
No. of casesboth Penalty/
DC actionproposed
1 Srikakulam 0 0 0 00
2 Vizianagaram 0 0 0 00
3 Visakhapatnam 0 0 0 00
4 Rajahmundry 0 0 0 00
5 Eluru 1 1 684936 00
Total 1 1 684936 0 0

No. of DTRs failed & erected during 2014-15 and 2015-16 (upto 30.09.15)
Sl.No.
Nameof theCircle
No. ofDTRs
existingas on31-03-2014
No. ofDTRs
erectedduring2014-15
No. ofDTRsfailedduring2014-15
No. ofDTRs
existingas on31-03-2015
No. ofDTRs
erectedduring2015-16
(upto30.09.15)
No. ofDTRsfailedduring2015-16
(upto30.09.15)
No. ofDTRs
existingas on
30-09-15
1 SKLM 12249 12585 905 12585 1703 562 14288
2 VZM 11496 12036 974 12036 1321 556 13357
3 VSP 22266 23493 685 23493 771 640 24264
4 RJY 39704 41232 2139 41232 1733 1477 42965
5 ELR 59249 62101 4122 62101 1770 1887 63871
EPDCL 136862 151447 8825 144964 7298 5122 158745
Non-departmental Fatal Electrical Accidents (Human) occurred during 2014-15 and amount of Ex-gratia paid
Sl.No. District
No. of accidents occurredNo. of cases forwhich ex-gratia
paid
Due to Dept. Faults(Snapping of conductor,defective appliances etc.,)
Not due to Dept.Faults (unauthorized
work etc.,)Total No. of
cases
Amountin RsLakhs
1 Srikakulam 9 13 22 10 22
2 Vizianagaram 15 8 23 5 15
3 Visakhapatnam 14 16 30 11 254 East Godavari 13 30 43 21 37.25 West Godavari 7 27 34 11 17
EPDCL 58 94 152 58 116.2
Note: Payment of ex-gratia for the balance cases could not be made due to non-receipt of necessarydocuments required for payment viz., Death & Legal Heir Certificates
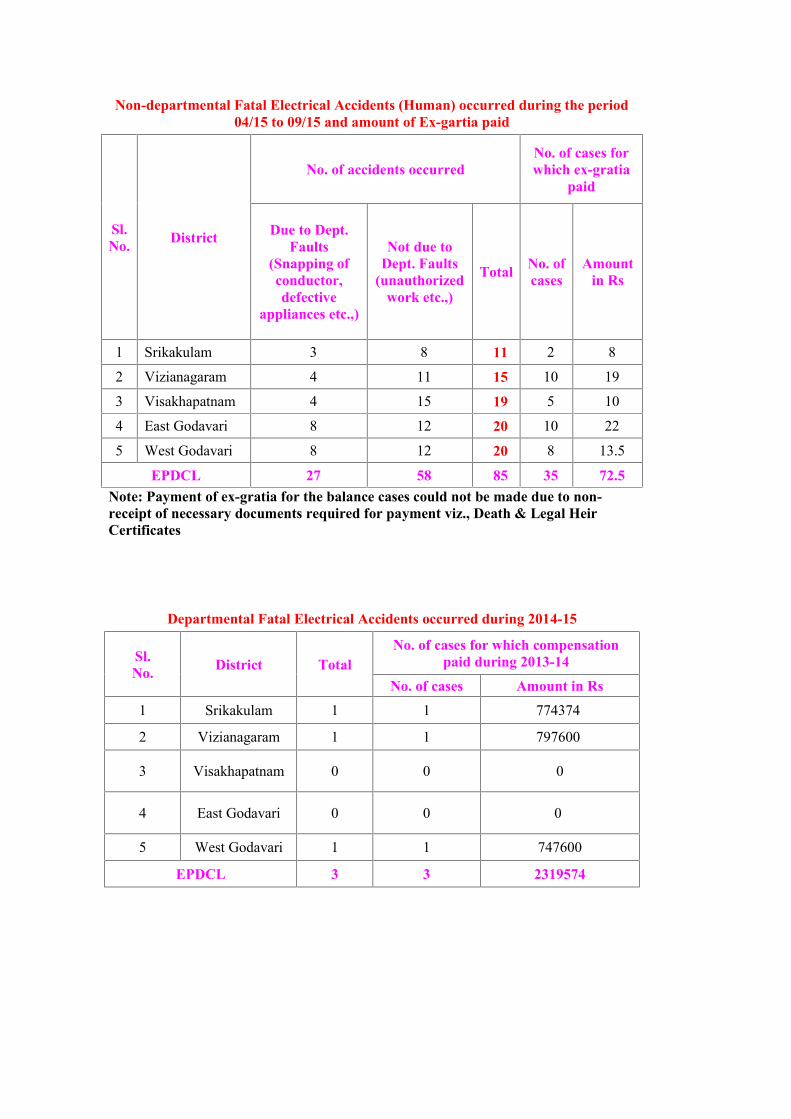
Non-departmental Fatal Electrical Accidents (Human) occurred during the period04/15 to 09/15 and amount of Ex-gartia paid
Sl.No. District
No. of accidents occurredNo. of cases forwhich ex-gratia
paid
Due to Dept.Faults
(Snapping ofconductor,defective
appliances etc.,)
Not due toDept. Faults
(unauthorizedwork etc.,)
Total No. ofcases
Amountin Rs
1 Srikakulam 3 8 11 2 8
2 Vizianagaram 4 11 15 10 19
3 Visakhapatnam 4 15 19 5 10
4 East Godavari 8 12 20 10 22
5 West Godavari 8 12 20 8 13.5
EPDCL 27 58 85 35 72.5Note: Payment of ex-gratia for the balance cases could not be made due to non-receipt of necessary documents required for payment viz., Death & Legal HeirCertificates
Departmental Fatal Electrical Accidents occurred during 2014-15
Sl.No. District Total
No. of cases for which compensationpaid during 2013-14
No. of cases Amount in Rs1 Srikakulam 1 1 774374
2 Vizianagaram 1 1 797600
3 Visakhapatnam 0 0 0
4 East Godavari 0 0 0
5 West Godavari 1 1 747600
EPDCL 3 3 2319574

Departmental Fatal Electrical Accidents occurred during 04/14 to 09/15
Sl.No. District Total
No. of cases for which compensation paid 2014-15(Upto Sep.)
No. of cases Amount in Rs
1 Srikakulam 1 1 747600
2 Vizianagaram 1 1 759091
3 Visakhapatnam 2 2 1513720
4 East Godavari 0 0 0
5 West Godavari 2 2 1575080
EPDCL 6 6 4595491
DTR COMPLAINTS RECEIVED DURING FY: 2014-15, ATTENDEDAND BALANCE AT CALL CENTERS AS ON 31-03-15
S. No. Circle
No. Of DTRComplaints
to beattended ason 01-04-14
No. of DTRComplaints
Receivedduring FY:
2014-15
No. of DTRComplaints
attendedduring FY:
2014-15
No. ofComplaints
Rejected
Balance No.of DTR
complaintsto be
attended ason 31-03-15
WRT BRT WRT BRT WRT BRT
1 SRIKAKULAM 0 5 1915 1387 526 1 6 0
2 VIZIANAGARAM 1 0 1680 1488 182 4 6 1
3 VISAKHAPATNAM 7 0 876 772 84 15 3 9
4 RAJAHMUNDRY 2 2 2597 2112 471 10 6 2
5 ELURU 30 18 4845 4328 515 16 26 8
Total 40 25 11913 10087 1778 46 47 20
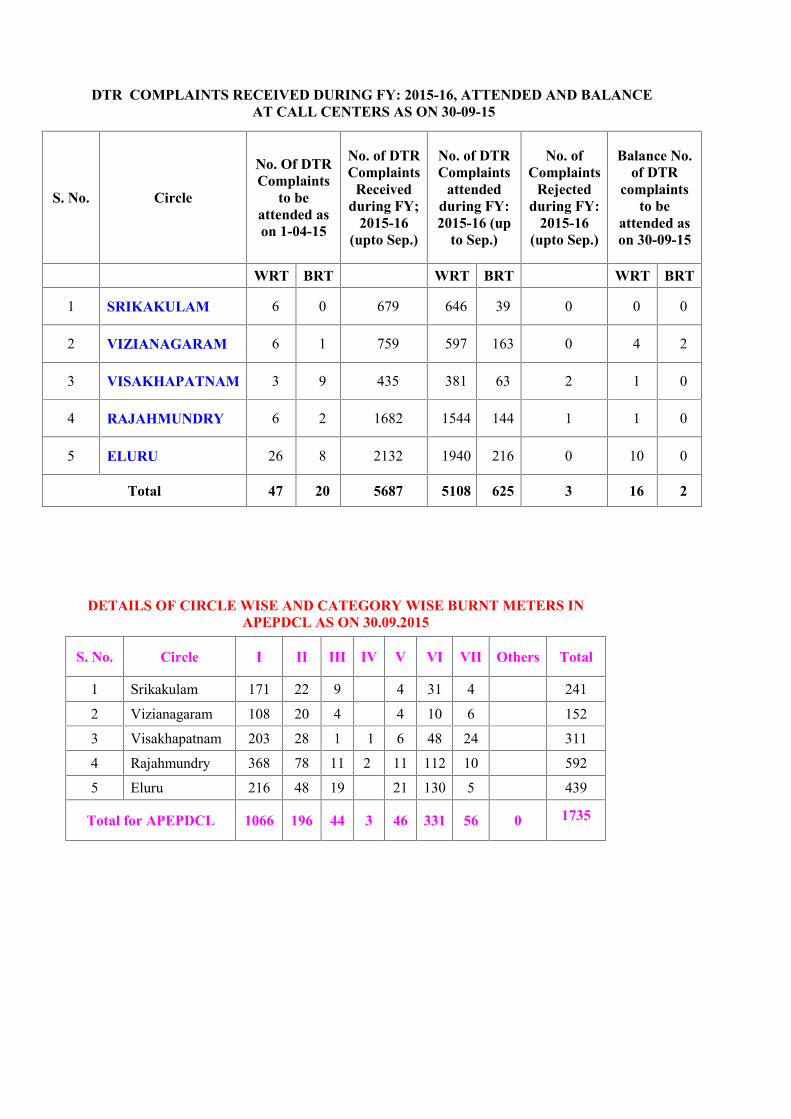
DTR COMPLAINTS RECEIVED DURING FY: 2015-16, ATTENDED AND BALANCEAT CALL CENTERS AS ON 30-09-15
S. No. Circle
No. Of DTRComplaints
to beattended ason 1-04-15
No. of DTRComplaints
Receivedduring FY;
2015-16(upto Sep.)
No. of DTRComplaints
attendedduring FY:2015-16 (up
to Sep.)
No. ofComplaints
Rejectedduring FY:
2015-16(upto Sep.)
Balance No.of DTR
complaintsto be
attended ason 30-09-15
WRT BRT WRT BRT WRT BRT
1 SRIKAKULAM 6 0 679 646 39 0 0 0
2 VIZIANAGARAM 6 1 759 597 163 0 4 2
3 VISAKHAPATNAM 3 9 435 381 63 2 1 0
4 RAJAHMUNDRY 6 2 1682 1544 144 1 1 0
5 ELURU 26 8 2132 1940 216 0 10 0
Total 47 20 5687 5108 625 3 16 2
DETAILS OF CIRCLE WISE AND CATEGORY WISE BURNT METERS INAPEPDCL AS ON 30.09.2015
S. No. Circle I II III IV V VI VII Others Total
1 Srikakulam 171 22 9 4 31 4 241
2 Vizianagaram 108 20 4 4 10 6 152
3 Visakhapatnam 203 28 1 1 6 48 24 311
4 Rajahmundry 368 78 11 2 11 112 10 592
5 Eluru 216 48 19 21 130 5 439
Total for APEPDCL 1066 196 44 3 46 331 56 0 1735
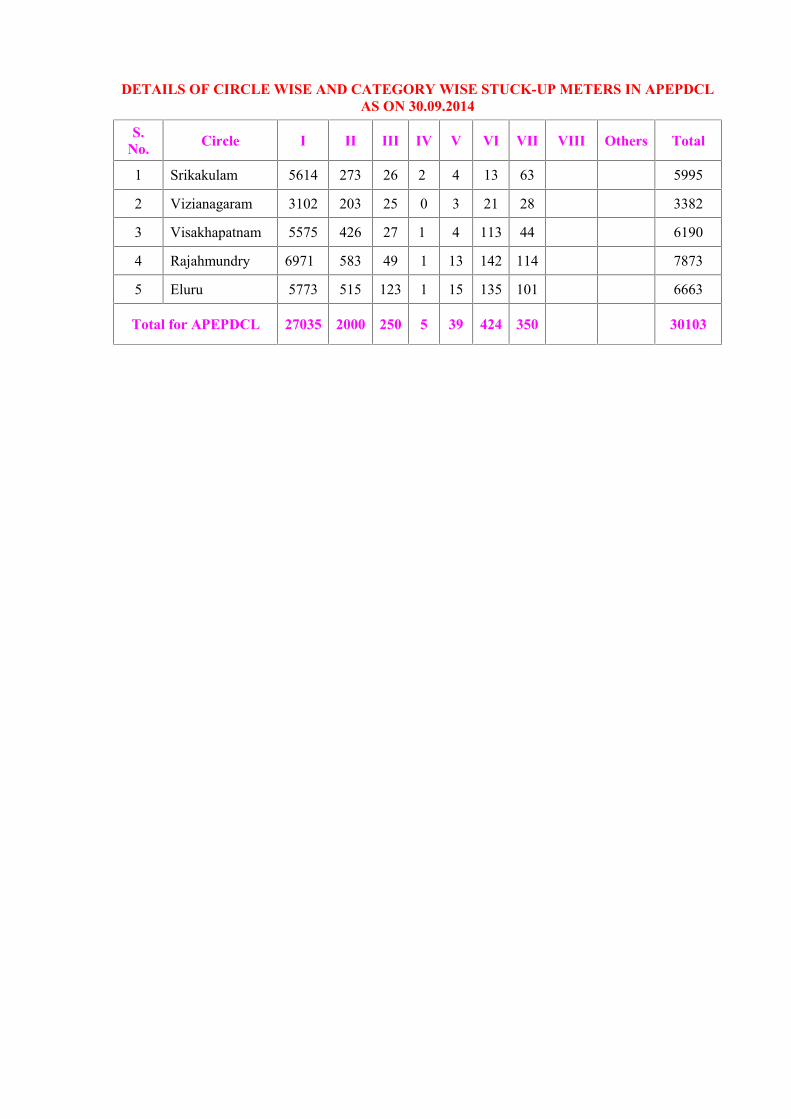
DETAILS OF CIRCLE WISE AND CATEGORY WISE STUCK-UP METERS IN APEPDCLAS ON 30.09.2014
S.No. Circle I II III IV V VI VII VIII Others Total
1 Srikakulam 5614 273 26 2 4 13 63 5995
2 Vizianagaram 3102 203 25 0 3 21 28 3382
3 Visakhapatnam 5575 426 27 1 4 113 44 6190
4 Rajahmundry 6971 583 49 1 13 142 114 7873
5 Eluru 5773 515 123 1 15 135 101 6663
Total for APEPDCL 27035 2000 250 5 39 424 350 30103
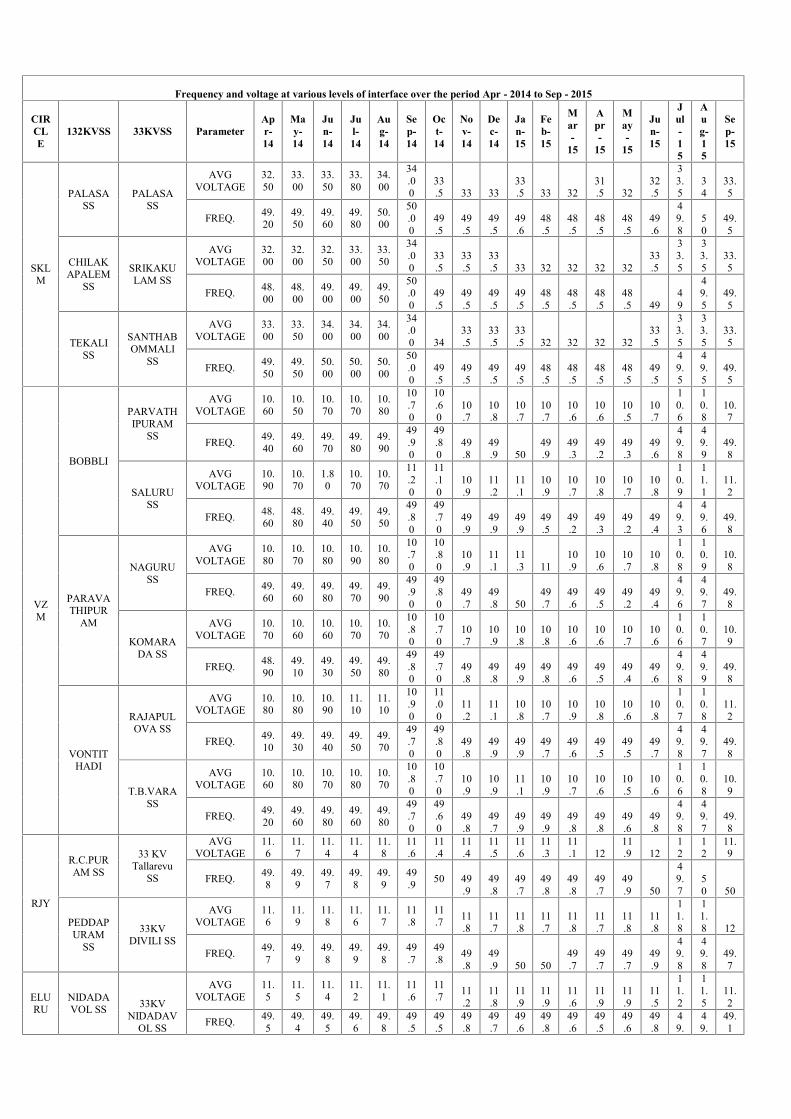
Frequency and voltage at various levels of interface over the period Apr - 2014 to Sep - 2015
CIRCLE
132KVSS 33KVSS ParameterApr-14
May-14
Jun-14
Jul-14
Aug-14
Sep-14
Oct-14
Nov-14
Dec-14
Jan-15
Feb-15
Mar-
15
Apr-
15
May-
15
Jun-15
Jul-15
Aug-15
Sep-15
SKLM
PALASASS
PALASASS
AVGVOLTAGE
32.50
33.00
33.50
33.80
34.00
34.00
33.5 33 33
33.5 33 32
31.5 32
32.5
33.5
34
33.5
FREQ. 49.20
49.50
49.60
49.80
50.00
50.00
49.5
49.5
49.5
49.6
48.5
48.5
48.5
48.5
49.6
49.8
50
49.5
CHILAKAPALEM
SS
SRIKAKULAM SS
AVGVOLTAGE
32.00
32.00
32.50
33.00
33.50
34.00
33.5
33.5
33.5 33 32 32 32 32
33.5
33.5
33.5
33.5
FREQ. 48.00
48.00
49.00
49.00
49.50
50.00
49.5
49.5
49.5
49.5
48.5
48.5
48.5
48.5 49
49
49.5
49.5
TEKALISS
SANTHABOMMALI
SS
AVGVOLTAGE
33.00
33.50
34.00
34.00
34.00
34.00 34
33.5
33.5
33.5 32 32 32 32
33.5
33.5
33.5
33.5
FREQ. 49.50
49.50
50.00
50.00
50.00
50.00
49.5
49.5
49.5
49.5
48.5
48.5
48.5
48.5
49.5
49.5
49.5
49.5
VZM
BOBBLI
PARVATHIPURAM
SS
AVGVOLTAGE
10.60
10.50
10.70
10.70
10.80
10.70
10.60
10.7
10.8
10.7
10.7
10.6
10.6
10.5
10.7
10.6
10.8
10.7
FREQ. 49.40
49.60
49.70
49.80
49.90
49.90
49.80
49.8
49.9 50
49.9
49.3
49.2
49.3
49.6
49.8
49.9
49.8
SALURUSS
AVGVOLTAGE
10.90
10.70
1.80
10.70
10.70
11.20
11.10
10.9
11.2
11.1
10.9
10.7
10.8
10.7
10.8
10.9
11.1
11.2
FREQ. 48.60
48.80
49.40
49.50
49.50
49.80
49.70
49.9
49.9
49.9
49.5
49.2
49.3
49.2
49.4
49.3
49.6
49.8
PARAVATHIPUR
AM
NAGURUSS
AVGVOLTAGE
10.80
10.70
10.80
10.90
10.80
10.70
10.80
10.9
11.1
11.3 11
10.9
10.6
10.7
10.8
10.8
10.9
10.8
FREQ. 49.60
49.60
49.80
49.70
49.90
49.90
49.80
49.7
49.8 50
49.7
49.6
49.5
49.2
49.4
49.6
49.7
49.8
KOMARADA SS
AVGVOLTAGE
10.70
10.60
10.60
10.70
10.70
10.80
10.70
10.7
10.9
10.8
10.8
10.6
10.6
10.7
10.6
10.6
10.7
10.9
FREQ. 48.90
49.10
49.30
49.50
49.80
49.80
49.70
49.8
49.8
49.9
49.8
49.6
49.5
49.4
49.6
49.8
49.9
49.8
VONTITHADI
RAJAPULOVA SS
AVGVOLTAGE
10.80
10.80
10.90
11.10
11.10
10.90
11.00
11.2
11.1
10.8
10.7
10.9
10.8
10.6
10.8
10.7
10.8
11.2
FREQ. 49.10
49.30
49.40
49.50
49.70
49.70
49.80
49.8
49.9
49.9
49.7
49.6
49.5
49.5
49.7
49.8
49.7
49.8
T.B.VARASS
AVGVOLTAGE
10.60
10.80
10.70
10.80
10.70
10.80
10.70
10.9
10.9
11.1
10.9
10.7
10.6
10.5
10.6
10.6
10.8
10.9
FREQ. 49.20
49.60
49.80
49.60
49.80
49.70
49.60
49.8
49.7
49.9
49.9
49.8
49.8
49.6
49.8
49.8
49.7
49.8
RJY
R.C.PURAM SS
33 KVTallarevu
SS
AVGVOLTAGE
11.6
11.7
11.4
11.4
11.8
11.6
11.4
11.4
11.5
11.6
11.3
11.1 12
11.9 12
12
12
11.9
FREQ. 49.8
49.9
49.7
49.8
49.9
49.9 50 49
.949.8
49.7
49.8
49.8
49.7
49.9 50
49.7
50 50
PEDDAPURAM
SS
33KVDIVILI SS
AVGVOLTAGE
11.6
11.9
11.8
11.6
11.7
11.8
11.7 11
.811.7
11.8
11.7
11.8
11.7
11.8
11.8
11.8
11.8 12
FREQ. 49.7
49.9
49.8
49.9
49.8
49.7
49.8 49
.849.9 50 50
49.7
49.7
49.7
49.9
49.8
49.8
49.7
ELURU
NIDADAVOL SS 33KV
NIDADAVOL SS
AVGVOLTAGE
11.5
11.5
11.4
11.2
11.1
11.6
11.7 11
.211.8
11.9
11.9
11.6
11.9
11.9
11.5
11.2
11.5
11.2
FREQ. 49.5
49.4
49.5
49.6
49.8
49.5
49.5
49.8
49.7
49.6
49.8
49.6
49.5
49.6
49.8
49.
49.
49.1
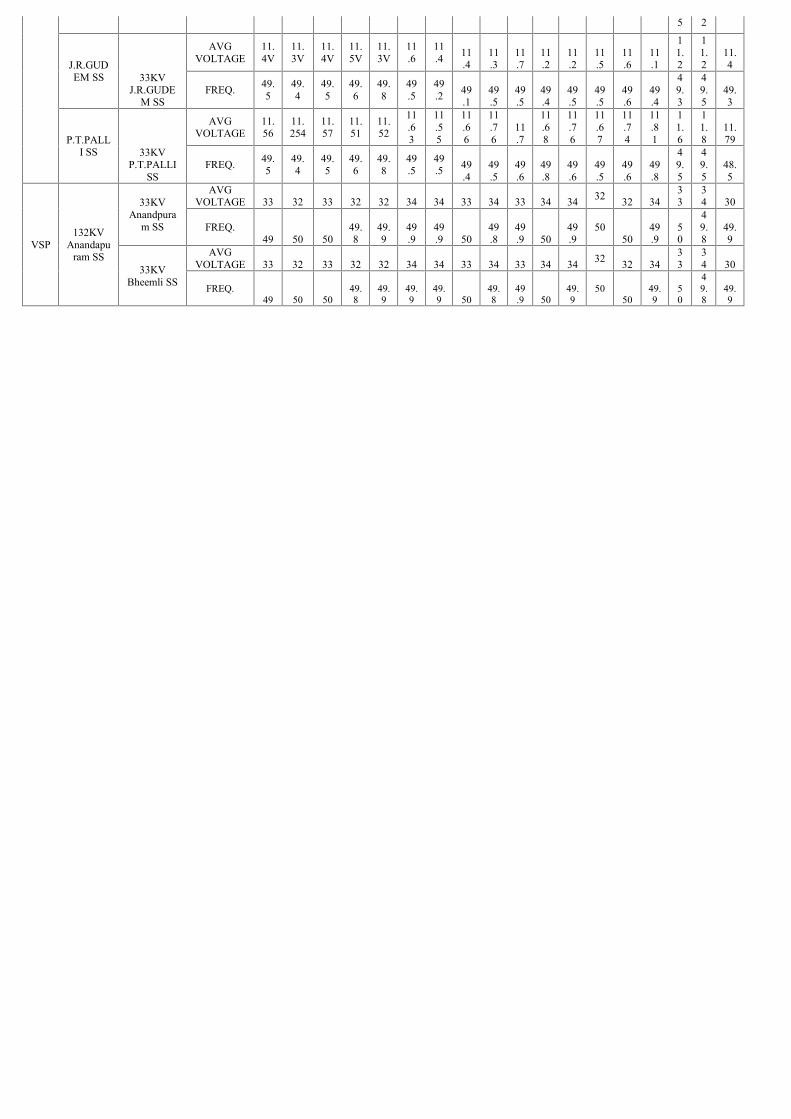
5 2
J.R.GUDEM SS 33KV
J.R.GUDEM SS
AVGVOLTAGE
11.4V
11.3V
11.4V
11.5V
11.3V
11.6
11.4 11
.411.3
11.7
11.2
11.2
11.5
11.6
11.1
11.2
11.2
11.4
FREQ. 49.5
49.4
49.5
49.6
49.8
49.5
49.2 49
.149.5
49.5
49.4
49.5
49.5
49.6
49.4
49.3
49.5
49.3
P.T.PALLI SS 33KV
P.T.PALLISS
AVGVOLTAGE
11.56
11.254
11.57
11.51
11.52
11.63
11.55
11.66
11.76
11.7
11.68
11.76
11.67
11.74
11.81
11.6
11.8
11.79
FREQ. 49.5
49.4
49.5
49.6
49.8
49.5
49.5 49
.449.5
49.6
49.8
49.6
49.5
49.6
49.8
49.5
49.5
48.5
VSP132KV
Anandapuram SS
33KVAnandpura
m SS
AVGVOLTAGE 33 32 33 32 32 34 34 33 34 33 34 34 32 32 34
33
34 30
FREQ.49 50 50
49.8
49.9
49.9
49.9 50
49.8
49.9 50
49.9
5050
49.9
50
49.8
49.9
33KVBheemli SS
AVGVOLTAGE 33 32 33 32 32 34 34 33 34 33 34 34 32 32 34
33
34 30
FREQ.49 50 50
49.8
49.9
49.9
49.9 50
49.8
49.9 50
49.9
5050
49.9
50
49.8
49.9

Services released from 1-APR-2014 TO 31-MAR-2015 in APEPDCL
CATEGORYOPENINGBALANCE REGISTER
EDRELEASED
REJECTED BALANCE CB_WRT CB_BRTWRT BRT WRT BRT
Agriculture 2242 2048 9825 2734 4711 1484 5186 2645 2541
Commercial 1780 582 25620 16436 7587 1306 2653 1453 1200CottageIndustries 11 5 90 37 32 15 22 16 6
Domestic 6679 2794 126202 82679 38787 4286 9923 7591 2332GeneralPurpose 51 20 774 540 210 25 70 44 26IndustrialNormal 653 132 2141 1268 824 388 446 364 82
IndustrialOptional 77 29 312 166 95 31 126 84 42
PWS Schemes 309 210 994 443 416 205 449 223 226
Street Lights 88 124 411 179 194 96 154 70 84
Temporary 28 16 127 80 23 17 51 16 35
TOTAL 11918 5960 166496 104562 52879 7853 19080 12506 6574
Services released from 1-APR-2015 TO 30-SEP-2015 in APEPDCL
CATEGORY
OPENINGBALANCE REGISTE
RED
RELEASEDREJECTED BALANCE CB_WRT CB_BRT
WRT BRT WRT BRT
Agriculture 2645 2541 2792 2007 2333 199 199 742 2697
Commercial 1453 1200 15689 11570 2481 415 415 1115 2761CottageIndustries 16 6 52 26 21 2 2 11 14
Domestic 7591 2332 90107 68674 13981 2024 2024 6782 8569GeneralPurpose 44 26 421 300 77 6 6 32 76
IndustrialNormal 364 82 400 371 170 31 31 88 186
IndustrialOptional 84 42 462 260 177 19 19 72 60
PWSSchemes 223 226 482 193 277 30 30 52 379
Street Lights 70 84 509 209 148 26 26 21 259
Temporary 16 35 266 117 12 16 16 16 156
TOTAL 12506 6574 111180 83727 19677 2768 24088 8931 15157

Amounts realized through intensive inspections by field staff
Sl.No.
Name of thecircle
FY 2014-15 FY 2015-16 (upto Sep-15)
No. ofservices
inspected
No. ofcases
booked
Amountrealized inRs. Lakhs
No. ofservices
inspected
No. ofcases
booked
Amountrealized inRs. Lakhs
1 Srikakulam 13,727 119 2.78 1035 29 0.30
2 Vizianagaram 27,151 35 1.18 4987 8 0.57
3 Visakhapatnam 109,860 307 15.83 18127 102 6.12
4 Rajahmundry 118,393 630 45.52 27668 99 9.19
5 Eluru 156,696 461 33..80 39419 111 11.68
6 DPE/ VSP 57,253 2,003 1528.63 23993 929 625.92
EPDCL 483,080 3,555 1,593.95 115,229 1,278 653.78
Court cases involving the Licenseeas on 30-09-2015
S.No. Name of the Circle No. of Cases
Amountinvolved in Rs.
Lakhs.
1 Srikakulam 60 638.81
2 Vizianagaram 84 5095.65
3 Visakhapatnam 190 21089.7
4 Rajahmundry 54 4741.41
5 Eluru 186 13196.3
APEPDCL 574 44761.9

No. of cases filed in respect of pilferage of power by DPE wing
S.No Circle
Amounts Assessed in Rs. Lakhs
2014-15 2015-16 (upto 9/15)
No. ofservices
inspected
No. ofpilferage
casesbooked
Amountrealizedin Rs.Lakhs
No. ofservices
inspected
No. ofpilferage
casesbooked
Amountrealizedin Rs.Lakhs
1 Srikakulam 11389 322 55.33 3694 148 49.38
2 Vizianagaram 11000 371 90.15 5563 186 84.14
3 Visakhapatnam 13505 232 338.96 5024 227 104.21
4 Rajahmundry 9811 536 333.90 3917 173 148.23
5 Eluru 10518 542 222.83 5367 195 108.22
6 HT-DPE 1030 0 487.46 428 0 131.75
TOTAL 57253 2003 1528.63 23993 929 625.92
Details of Arrears of consumers over Rs. 50000 pending for over 6 months
Sl.No Particulars
SKLM VZM VSP RJY ELR TOTAL
SCsAmount(Rs.inlakhs)
SCsAmount(Rs.inlakhs)
SCsAmount(Rs.inlakhs)
SCsAmount (Rs.inlakhs)
SCsAmount(Rs.inlakhs)
SCsAmount (Rs.inlakhs)
1Court
Cases/Disputed /BIFR
36 4463 36 4451 118 19580 116 4369 186 13196 492 46058
2 Govt./ Localbodies 3498 4292 940 1540 4047 6442 4720 11066 4850 12168 18055 35507
3 UDC Services 17 369 6 96 17 36 43 79 35 73 118 653
4 Dismantled /Bill Stopped 37 201 56 1261 60 821 93 760 62 180 308 3224
5 Instalments/Others 1 4 5 1496 5 1444 0 0 0 0 11 2943
TOTAL 3589 9328 1043 8844 4247 28322 4972 16273 5133 25617 18984 88385
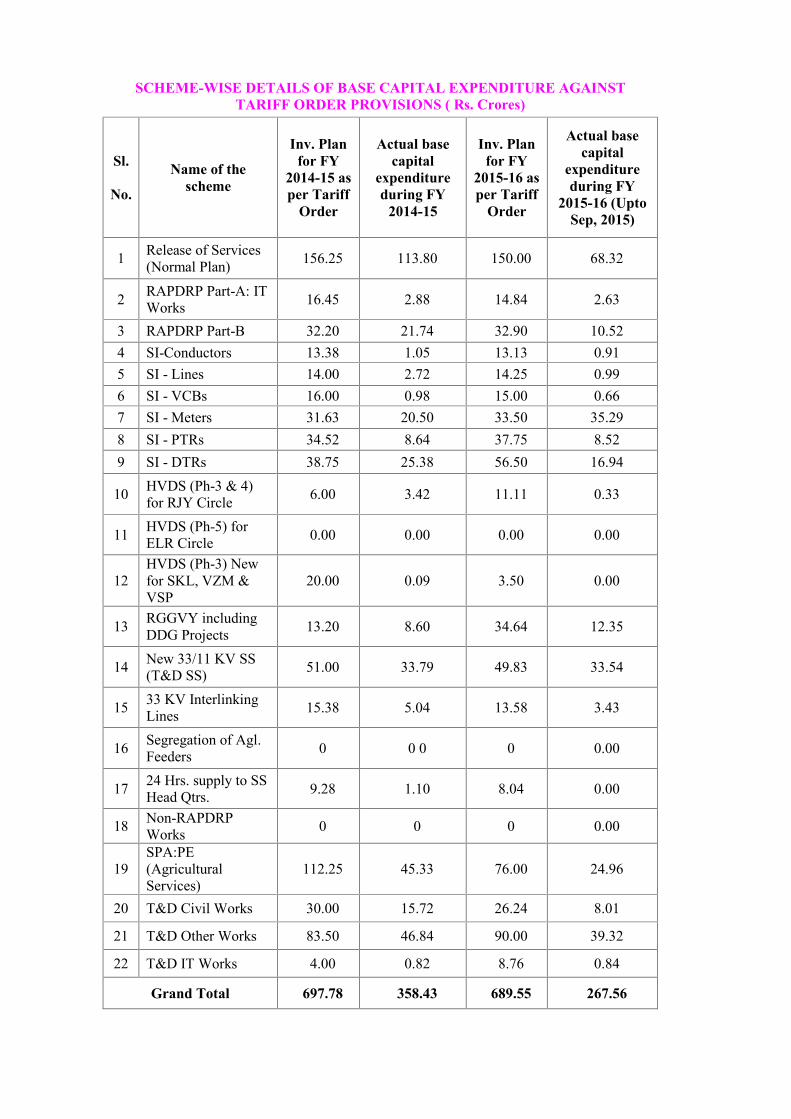
SCHEME-WISE DETAILS OF BASE CAPITAL EXPENDITURE AGAINSTTARIFF ORDER PROVISIONS ( Rs. Crores)
Sl.
No.
Name of thescheme
Inv. Planfor FY
2014-15 asper Tariff
Order
Actual basecapital
expenditureduring FY
2014-15
Inv. Planfor FY
2015-16 asper Tariff
Order
Actual basecapital
expenditureduring FY
2015-16 (UptoSep, 2015)
1 Release of Services(Normal Plan) 156.25 113.80 150.00 68.32
2 RAPDRP Part-A: ITWorks 16.45 2.88 14.84 2.63
3 RAPDRP Part-B 32.20 21.74 32.90 10.524 SI-Conductors 13.38 1.05 13.13 0.915 SI - Lines 14.00 2.72 14.25 0.996 SI - VCBs 16.00 0.98 15.00 0.667 SI - Meters 31.63 20.50 33.50 35.298 SI - PTRs 34.52 8.64 37.75 8.529 SI - DTRs 38.75 25.38 56.50 16.94
10 HVDS (Ph-3 & 4)for RJY Circle 6.00 3.42 11.11 0.33
11 HVDS (Ph-5) forELR Circle 0.00 0.00 0.00 0.00
12HVDS (Ph-3) Newfor SKL, VZM &VSP
20.00 0.09 3.50 0.00
13 RGGVY includingDDG Projects 13.20 8.60 34.64 12.35
14 New 33/11 KV SS(T&D SS) 51.00 33.79 49.83 33.54
15 33 KV InterlinkingLines 15.38 5.04 13.58 3.43
16 Segregation of Agl.Feeders 0 0 0 0 0.00
17 24 Hrs. supply to SSHead Qtrs. 9.28 1.10 8.04 0.00
18 Non-RAPDRPWorks 0 0 0 0.00
19SPA:PE(AgriculturalServices)
112.25 45.33 76.00 24.96
20 T&D Civil Works 30.00 15.72 26.24 8.01
21 T&D Other Works 83.50 46.84 90.00 39.32
22 T&D IT Works 4.00 0.82 8.76 0.84
Grand Total 697.78 358.43 689.55 267.56
8. E-FilingForms