army sustainability lecture series, army environmental ... military capacity, and the will of the...
TRANSCRIPT


Army Sustainability Lecture Series, Army Environmental Policy Institute
Washington DC, 28 Oct 08
DoD’s
Strategic Energy Opportunities:
More Fight, Less Fuel, Lower Cost, Safer World
Amory B. LovinsChairman & Chief Scientist Director & Chairman EmeritusRocky Mountain Institute
www.rmi.org
Copyright ©
2009 Rocky Mountain Institute. All rights reserved. PDF licensed to organizers, DoD, and participants for internal use. Hypercar®
and Fiberforge™
are trademarks of Fiberforge
Corporation. All the views expressed here are the author’s personal opinions, not the views of DoD
nor of the Defense Science Board.
DoD’s energy challenge
◊
The Department’s mission is at risk, and huge costs are being paid in blood, treasure, and lost combat effectiveness, due to:
Pervasive waste of energy in the battlespace
Fixed facilities’ dependence on the highly vulnerable electricity grid
◊
Solutions are available to turn these handicaps into revolutionary gains in capability, at com-
parable or lower capital cost and at far lower operating cost, without tradeoff or compromise
◊
Adopting these means to give DoD’s
forces and facilities two vital new attributes—endurance and resilience—depends on your attention

“[A]ggressively
developing and applying energy-saving techno- logies to military applications would potentially do more to solve the most pressing long-term challenges facing DoD
and our
national security than any other single investment area.”
—
LMI review of Winning the Oil Endgame, Jan 05, emphasis added
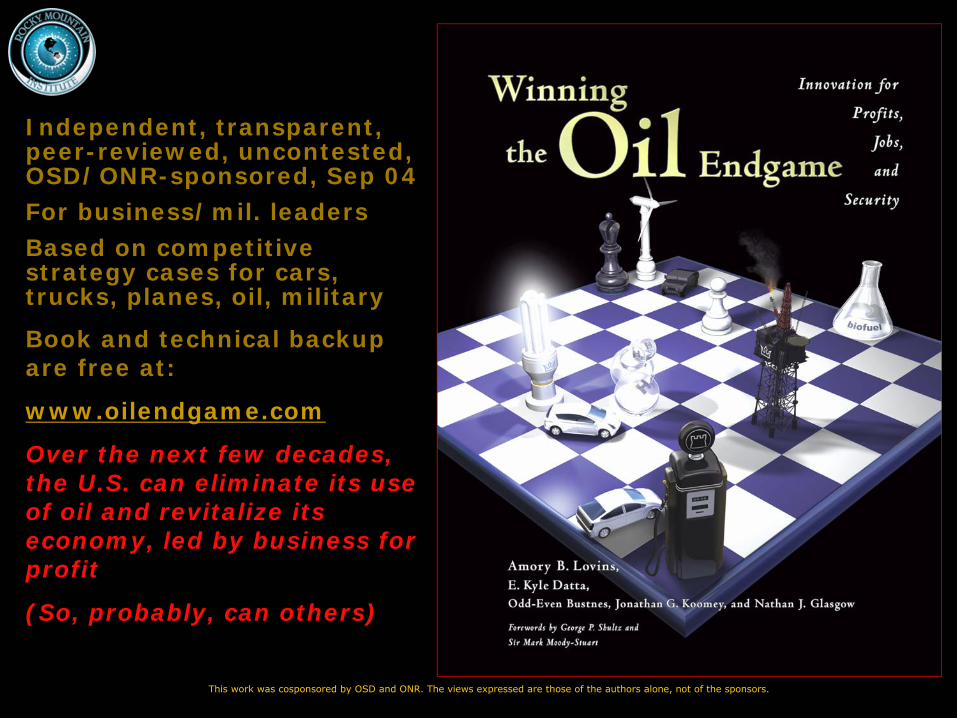
Independent, transparent, peer-reviewed, uncontested, OSD/ONR-sponsored, Sep 04For business/mil. leadersBased on competitive strategy cases for cars, trucks, planes, oil, military
Book and technical backup are free at:
www.oilendgame.com
Over the next few decades, the U.S. can eliminate its use of oil and revitalize its economy, led by business for profit
(So, probably, can others)
This work was cosponsored by OSD and ONR. The views expressed are those of the authors alone, not of the sponsors.

A profitable US transition beyond oil (with best 2004 technologies)
0
5
10
15
20
25
30
35
1950 1960 1970 1980 1990 2000 2010 2020 2030
Petr
ole
um
pro
du
ct e
qu
ivale
nt
con
sum
pti
on
(m
illio
n b
arr
els
/d
ay)
government projection (extrapolated after 2025)
end-use efficiency @ $12/bbl
plus supply substitution @<$26/bbl
plus optional hydrogen from leftover savednatural gas
U.S. oil use and imports, 1950–2035
Petroleum use
Petroleum imports
)
plus optional hydrogen from leftover saved natural gas and/or renewables (illustrating 10% substitution; 100%+ is feasible)
(av. $18/bbl)
Practice run 1977–85: GDP +27%, oil use –17%, oil imports –50%,
Persian Gulf imports –87%
Practice run 1977Practice run 1977––85: GDP +27%, 85: GDP +27%, oil use oil use ––17%, oil imports 17%, oil imports ––50%, 50%,
Persian Gulf imports Persian Gulf imports ––87%87%
You are hereYou are hereYou are here
…and all implementable without new fuel taxes, subsidies, mandates, or Federal laws
OPEC’s exports fell 48%, breaking its pricing power for a decade; US
is Saudi Arabia of negabarrels
OPECOPEC’’s exports fell 48%, breaking s exports fell 48%, breaking its pricing power for a decade; US its pricing power for a decade; US
is Saudi Arabia of is Saudi Arabia of negabarrelsnegabarrels
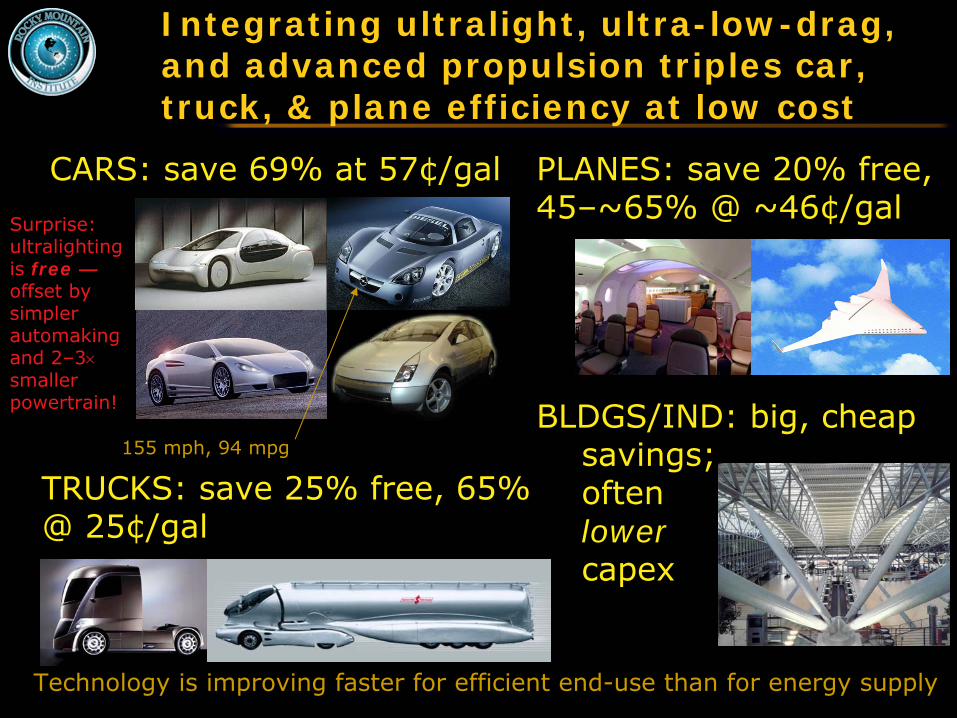
CARS: save 69% at 57¢/gal
BLDGS/IND: big, cheap savings;
often lower
capex
Integrating ultralight, ultra-low-drag, and advanced propulsion triples car, truck, & plane efficiency at low cost
TRUCKS: save 25% free, 65% @ 25¢/gal
PLANES: save 20% free, 45–~65% @ ~46¢/gal
Technology is improving faster for efficient end-use than for energy supply
155 mph, 94 mpg
Surprise:
ultralighting
is free — offset by simpler automaking
and 2–3×
smaller powertrain!

Each day, your car uses ~100× its weight in ancient plants.
Where does that fuel energy go?
6% accelerates the car; just ~0.3% moves the driver
Three-fourths of the fuel use is weight-related
Each unit of energy saved at the wheels saves ~7–8 units of gasoline in the tank (or ~3–4 with a hybrid)
So first make the car radically lighter-weight!
0% 20% 40% 60% 80% 100%Braking resistance Rolling resistance Aerodynamic dragEngine loss Idling loss Drivetrain lossAccessory loss
87% of the fuel energy is wasted
13% tractive load
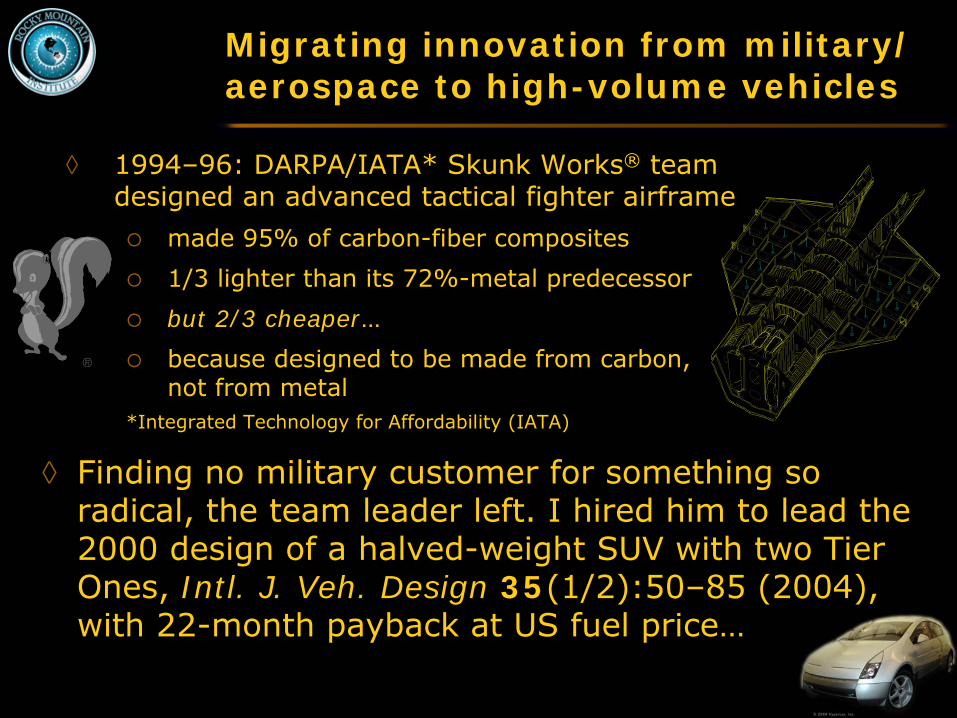
Migrating innovation from military/ aerospace to high-volume vehicles
◊
1994–96: DARPA/IATA* Skunk Works®
team designed an advanced tactical fighter airframe
made 95% of carbon-fiber composites
1/3 lighter than its 72%-metal predecessor
but 2/3 cheaper…
because designed to be made from carbon, not from metal
*Integrated Technology for Affordability (IATA)
◊
Finding no military customer for something so radical, the team leader left. I hired him to lead the 2000 design of a halved-weight SUV with two Tier Ones, Intl. J. Veh. Design 35(1/2):50–85 (2004), with 22-month payback at US fuel price…

Show car and a complete virtual design (2000), uncompromised, production-costed, manufactura- ble; gasoline ver. MSRP +$2,511 MSRP bec. hybrid
Midsize 5-seat Revolution concept crossover SUV Ultralight (1,889 lb, –53%) but ultrasafe 0–60 mph in 8.2 s, 114 mpg (H2 )… or 0–60 mph in 7.1 s, 67 mpg
(gasoline hybrid)
“We’ll take two.”
—
Automobile magazine
World Technology Award, 2003
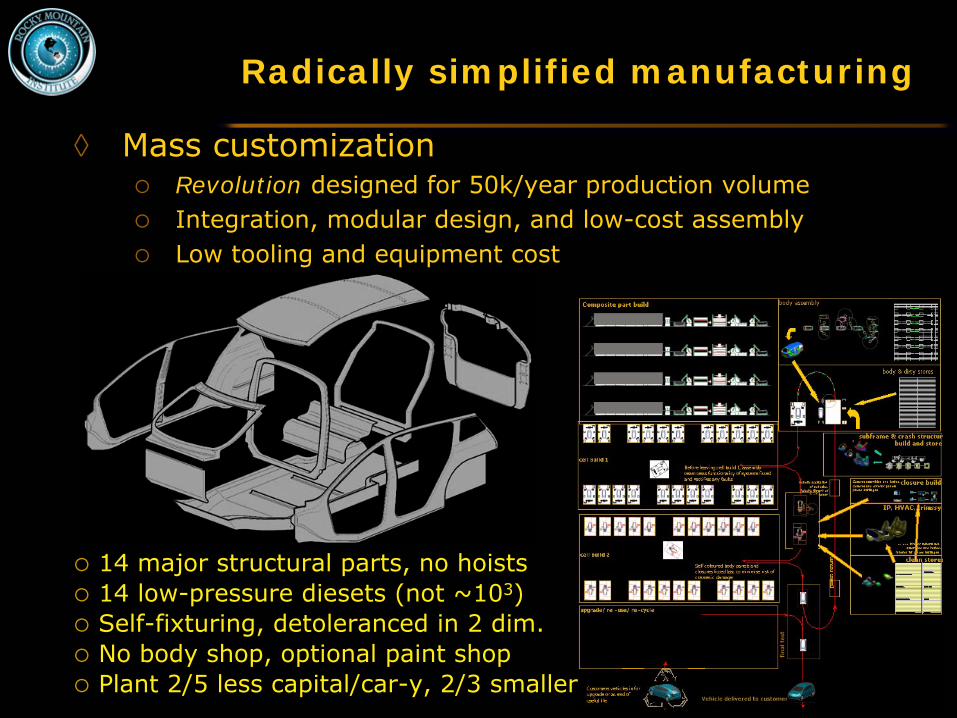
Radically simplified manufacturing
◊
Mass customizationRevolution designed for 50k/year production volumeIntegration, modular design, and low-cost assembly Low tooling and equipment cost
14 major structural parts, no hoists14 low-pressure diesets (not ~103)Self-fixturing, detoleranced in 2 dim. No body shop, optional paint shopPlant 2/5 less capital/car-y, 2/3 smaller

Ultralight safety confirmed by racecar crash experience (even with relatively brittle thermosets)
Katherine Legge’s
180-mph walk-away ChampCar wall crash on 29 Sep 06

Toyota’s Hypercar®-class 1/X concept car (Tokyo Motor Show, 26 Oct 2007)
◊
1/2 Prius fuel use, simi-
lar
interior vol. (4 seats)
◊
1/3 the weight (420 kg)
◊
carbon-fiber structure
◊
0.5-L flex-fuel engine under rear seat, RWD
◊
plug-in hybrid-electric (if plain hybrid, 400 kg)
•
One day earlier, Toray announced a ¥30b plant to mass-produce carbon-fiber auto parts for Toyota, Nissan,…; in July 2008, similar Honda/Nissan/Toray deal announced too; signals strategic intent
• Nov 2007: Ford announced 113–340-kg weight cuts MY2012–20
•
Dec 2007: 15% av. weight cut in all Nissan vehicles by 2015; China formed auto lightweighting
alliance targeting –200 kg 2010

WTOE implementation is underway via “institutional acupuncture”
◊
RMI’s
3-year, $4-million effort is leading & consolidating shifts
◊
Need to shift strategy & investment in six sectorsAviation: Boeing did it (787 Dreamliner)…and beat Airbus
Heavy trucks: Wal-Mart led it (with other buyers being added)
Military: emerging as the federal leader in getting the U.S. off oil
Fuels: strong investor interest and industrial activity
Finance: rapidly growing interest/realignment will drive others
◊
Cars and light trucks: slowest, hardest, but now changingAlan Mulally’s move from Boeing to Ford with transformational intent
Workers and dealers not blocking but eager for fundamental innovation
Schumpeterian “creative destruction” is causing top executives to be far more open to previously unthinkable change
Emerging prospects of leapfrogs by China, India, ?new market entrants
RMI’s two transformational projects and “feebate” promotion are helping
Competition, at a fundamental level and at a pace last seen in the 1920s, will change automakers’ managers or their minds, whichever comes first

DoD’s soft underbelly: fuel and fuel logistics
◊
In WWII, heavy steel forces “floated to victory on a sea of oil,”
and 6/7ths
of oil to defeat Axis came from Texas; today, warfighting
is ~16×
more energy-intensive, and
Texas is a net importer of oil
◊
Logistics consumes roughly half of DoD’s
personnel and
a third of DoD’s
budget
◊
~70% of tons moved when the Army deploys are fuel
◊
About half of casualties in theater are now associated with convoys—whole divisions hauling oil, more divisions trying to guard them (often including helicopter cover)
◊
Yet most of the fuel those convoys deliver is wasted, because when we require, design, and acquire the things that use the fuel, we assume that fuel logistics is free and
invulnerable; it is emphatically neither
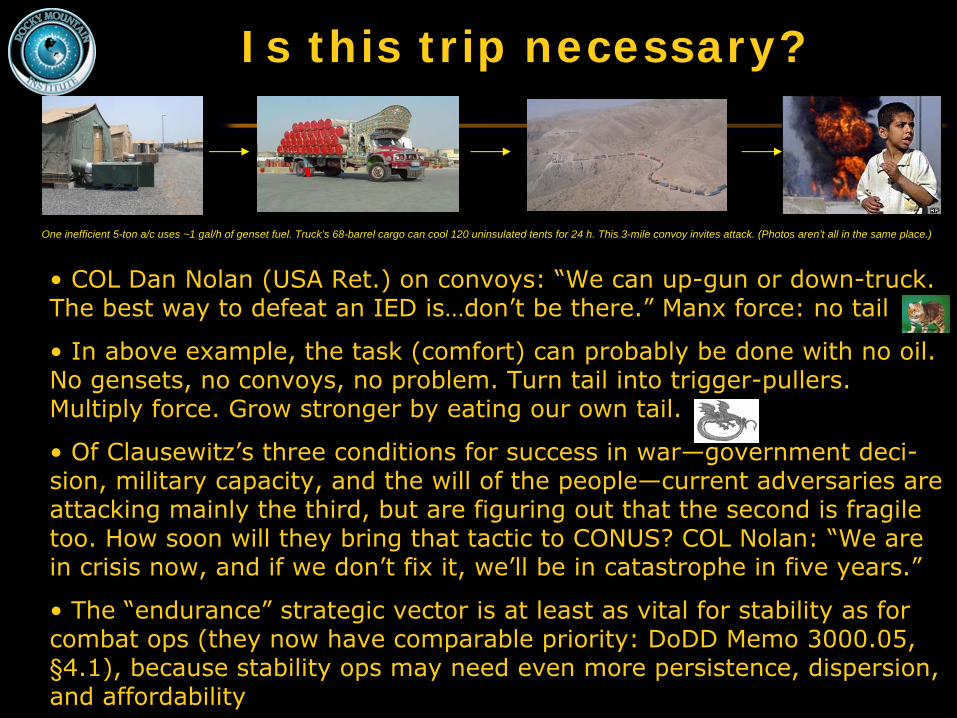
Is this trip necessary?
•
COL Dan Nolan (USA Ret.) on convoys: “We can up-gun or down-truck. The best way to defeat an IED is…don’t be there.”
Manx force: no tail
•
In above example, the task (comfort) can probably be done with no oil. No gensets, no convoys, no problem. Turn tail into trigger-pullers. Multiply force. Grow stronger by eating our own tail.
•
Of Clausewitz’s
three conditions for success in war—government deci-
sion, military capacity, and the will of the people—current adversaries are attacking mainly the third, but are figuring out that the second
is fragile too. How soon will they bring that tactic to CONUS? COL Nolan: “We are in crisis now, and if we don’t fix it, we’ll be in catastrophe in five years.”
•
The “endurance”
strategic vector is at least as vital for stability as for combat ops (they now have comparable priority: DoDD
Memo 3000.05, §4.1), because stability ops may need even more persistence, dispersion, and affordability
One inefficient 5-ton a/c uses ~1 gal/h of genset fuel. Truck’s 68-barrel cargo can cool 120 uninsulated tents for 24 h. This 3-mile convoy invites attack. (Photos aren’t all in the same place.)

Shooter
Shooter
Many noncombat gas-guzzlers too
Today’s Top 10 Battlefield Fuel UsersSWA scenario using current Equipment Usage Profile data
1. Truck Tractor: Line Haul C/S 50000 GVWR 6X4 M915
2. Helicopter Utility: UH-60L
3. Truck Tractor: MTV W/E
4. Truck Tractor: Heavy Equipment Transporter (HET)
5. Tank Combat Full Tracked: 120MM Gun M1A2
6. Helicopter Cargo Transport: CH-47D
7. Decontaminating Apparatus: PWR DRVN LT WT
8. Truck Utility: Cargo/Troop Carrier 1 1/4 Ton 4X4 W/E (HMMWV)
9. Water Heater: Mounted Ration
10. Helicopter: Attack AH-64D
Of the top 10 Army battlefield fuel users, only #5 and #10 are combat platforms
Source: CASCOM study for 2001 DSB using FASTALS for SWA.
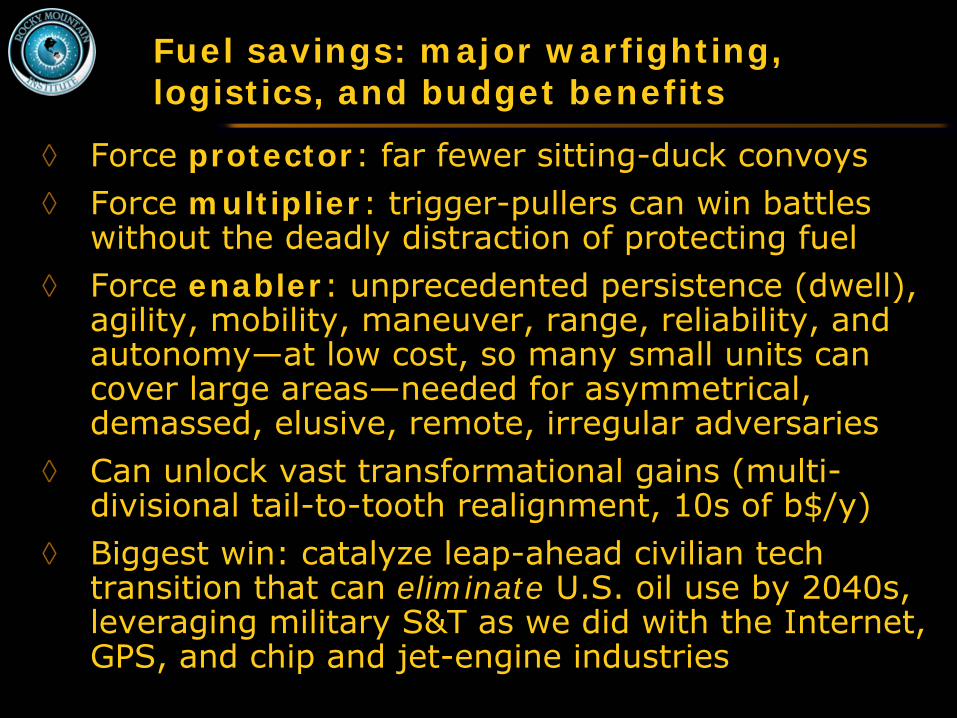
Fuel savings: major warfighting, logistics, and budget benefits
◊
Force protector: far fewer sitting-duck convoys◊
Force multiplier: trigger-pullers can win battles without the deadly distraction of protecting fuel
◊
Force enabler: unprecedented persistence (dwell), agility, mobility, maneuver, range, reliability, and autonomy—at low cost, so many small units can cover large areas—needed for asymmetrical, demassed, elusive, remote, irregular adversaries
◊
Can unlock vast transformational gains (multi- divisional tail-to-tooth realignment, 10s of b$/y)
◊
Biggest win: catalyze leap-ahead civilian tech transition that can eliminate U.S. oil use by 2040s, leveraging military S&T as we did with the Internet, GPS, and chip and jet-engine industries
Ships41%
Other5%
Shore10%
Ground Vehicles
8%
Aircraft36%
44 million bbl, $TKb
TK million bbl, $TKb
~25* million bbl, $TKb, ~2/3 logistics
Civilian98.05%
Other Fed Gov.
0.15%
DoD1.80%
Hotel loads(approx.)
Propulsion, weapons, C3I
Facilities2%
Ground Vehicles
4%
Bombers7%
Fighters28%
C4ISR etc.6%
Trainers3%
Transports and Tankers
51%
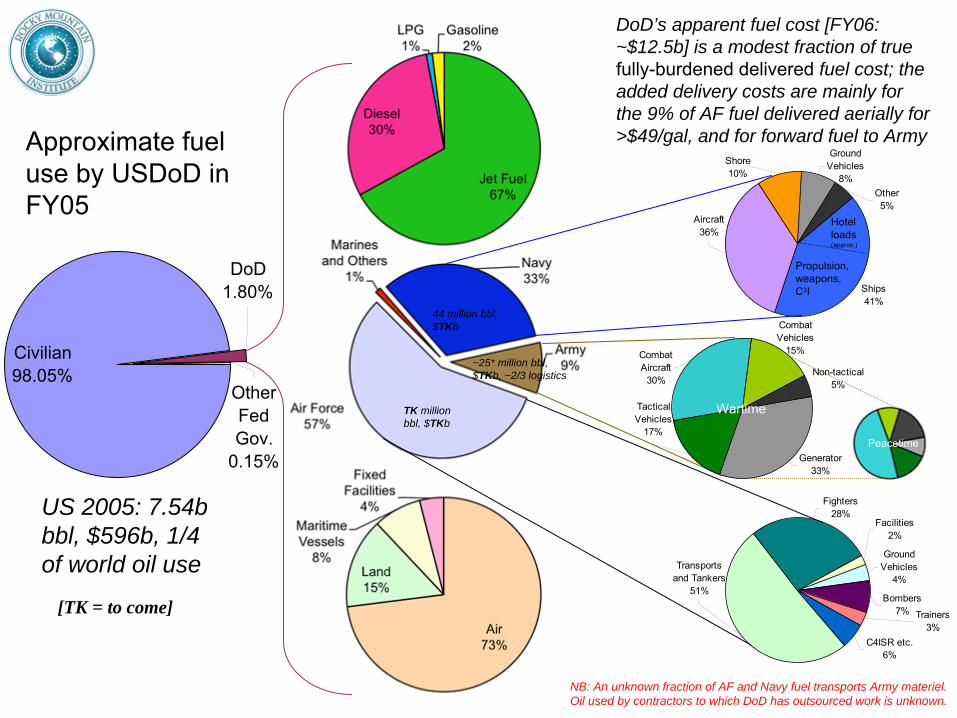
Approximate fuel use by USDoD
in FY05
US 2005: 7.54b bbl, $596b, 1/4 of world oil use
[TK = to come]
DoD’s apparent fuel cost [FY06: ~$12.5b] is a modest fraction of true fully-burdened delivered
fuel cost; the added delivery costs are mainly for the 9% of AF fuel delivered aerially for >$49/gal, and for forward fuel to Army
NB: An unknown fraction of AF and Navy fuel transports Army materiel. Oil used by contractors to which DoD has outsourced work is unknown.
Non-tactical5%
Generator33%
Combat Aircraft
30%
Combat Vehicles
15%
Tactical Vehicles
17%
Wartime
Peacetime

US Defense Science Board Energy Strategy Task Force
Former SECDEF/SECEN/SECTREAS/DCI James R. Schlesinger
and GEN Mike Carns
(USAF Ret), Co-Chairs
More Fight—Less Fuel www.acq.osd.mil/dsb/reports/2008-02-ESTF.pdf
Unofficial slides reflecting my own personal views
(consistent with the Task Force’s briefs &
discussions)

Terms of Reference•
Identify opportunities to reduce fuel demand by deployed forces and assess cost, operational and force structure effects
•
Identify opportunities to deploy renewable and alternative energy sources for facilities and deployed forces
•
Identify institutional barriers to achieving this transition

Key Findings•
Two primary energy risks to DoD
–
Unnecessarily high and growing operational fuel demand increases mission risk
–
Critical missions at fixed installations are at unacceptable risk from extended power loss
•
DoD
lacks the strategy, policies, metrics, information, and governance structure necessary to properly manage its energy risks
•
There are technologies available now to make DoD
systems more energy efficient, but they are undervalued, slowing their implementation and resulting in inadequate S&T investments
•
There are many opportunities to reduce energy demand by changing wasteful operational practices and procedures
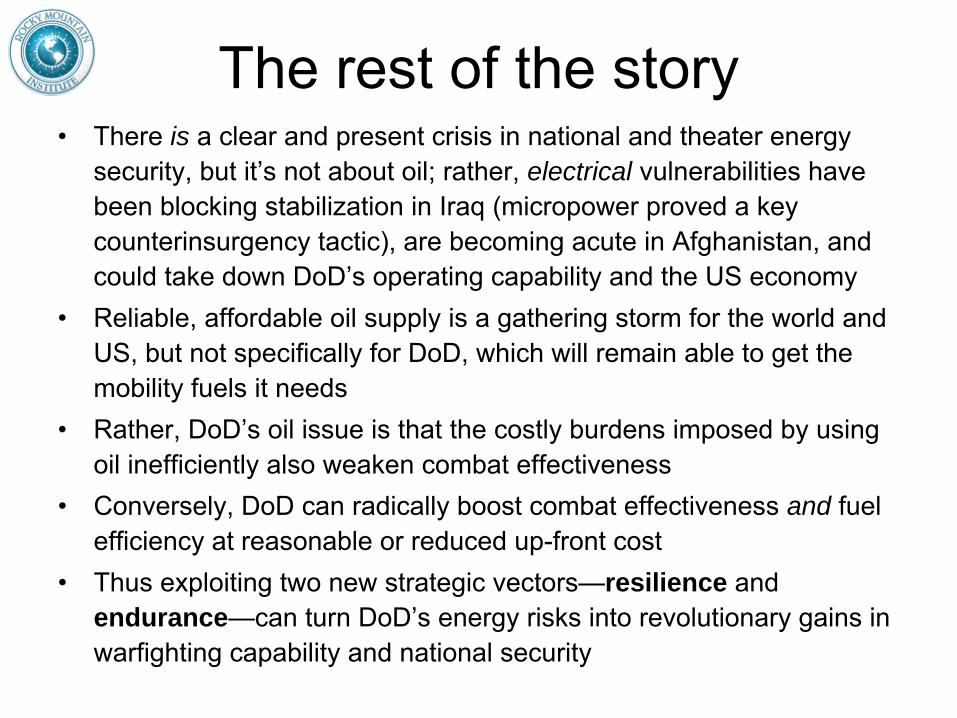
The rest of the story•
There is a clear and present crisis in national and theater energy security, but it’s not about oil; rather, electrical vulnerabilities have been blocking stabilization in Iraq (micropower
proved a key counterinsurgency tactic), are becoming acute in Afghanistan, and could take down DoD’s
operating capability and
the US economy•
Reliable, affordable oil supply is a gathering storm for the world and US, but not specifically for DoD, which will remain able to get the mobility fuels it needs
•
Rather, DoD’s
oil issue is that the costly burdens imposed by using oil inefficiently also weaken combat effectiveness
•
Conversely, DoD
can radically boost combat effectiveness and fuel efficiency at reasonable or reduced up-front cost
•
Thus exploiting two new strategic vectors—resilience and endurance—can turn DoD’s
energy risks into revolutionary gains in warfighting
capability and national security
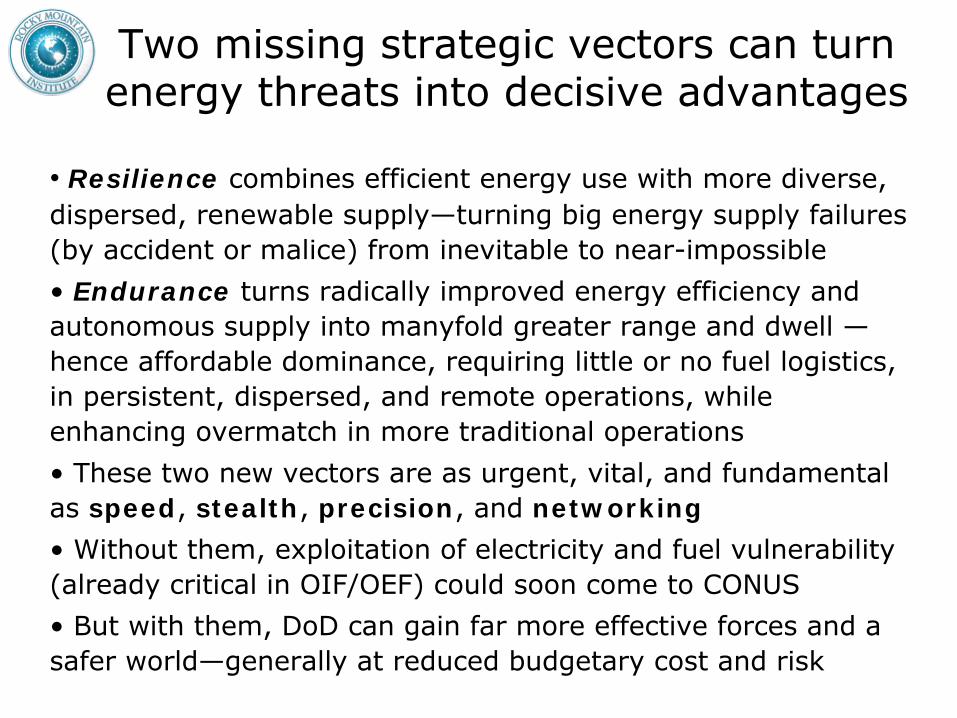
Two missing strategic vectors can turn energy threats into decisive advantages
•
Resilience combines efficient energy use with more diverse, dispersed, renewable supply—turning big energy supply failures (by accident or malice) from inevitable to near-impossible
•
Endurance turns radically improved energy efficiency and autonomous supply into manyfold
greater range and dwell —
hence affordable dominance, requiring little or no fuel logistics, in persistent, dispersed, and remote operations, while enhancing overmatch in more traditional operations
•
These two new vectors are as urgent, vital, and fundamental as speed, stealth, precision, and networking
•
Without them, exploitation of electricity and fuel vulnerability (already critical in OIF/OEF) could soon come to CONUS
•
But with them, DoD
can gain far more effective forces and
a safer world—generally at reduced budgetary cost and risk

“Amory’s petting zoo”
from DSB 08: dramatic gains in combat effectiveness and energy efficiency are widely available, e.g.:
25% lighter, 30% cheaper advanced composite structures; aircraft can have ~95% fewer parts,
weigh ≥1/3 less, cost less
VAATE engines: loiter ×
2, fuel –
25–40%, far less maintenance, often lower capital cost
SensorCraft (C4ISR): 50-h loiter, sorties ÷
18, fuel ÷
>30, cost ÷
2
BWB quiet aircraft: range & payload ×
~2,
sorties ÷
5–10,
fuel ÷
5–9 (Σ
2–4)
(scaled-down wind-tunnel model)
More lethal, highly IED-resistant, stable HMMVV replacement, weight ÷
3, fuel ÷
>3
(up-armored HMMVV ~4 mpg)
Hotel-load retrofits could save ~40–50% of onboard electricity (thus saving ~1/6 of the Navy’s non-aviation fuel)
Advanced propulsors
can save much
noise and fuel
240-Gflops supercomputer, ultrareliable
with no cooling at 31˚C, lifecycle cost ÷
3–4
Rugged, 2.5-
W PC, $150, solar + back-
up crank
FOB uses 95% of gen-
set fuel to cool desert; could be ~0 with same
or better comfort
Re-engine M1 with modern diesel, range ×
≥2, fuel ÷
3–4
A zero-net-
energy building (it’s been done in –44˚
to 46˚C at lower cost)
Actuators: per-
formance
×
10, fault tolerance ×
4, size & mass ÷
3–10
Optimum Speed Tilt Rotor (OSTR): range ×
5–6, speed ×
3, quiet, fuel ÷
5–6

Where to find winners: prospecting1.
The most total fuel can be saved in aircraft: Since aircraft use 73% of DoD
oil, a 35% saving in aircraft
would equal the total fuel use by all land and maritime vehicles plus facilities
–
Fortunately, 35% is conservative because 60% of Heavy Fixed Wing
inventory (which uses 61% of AF aviation fuel) uses 50–60-year-old designs, and nearly all Vertical Lift fleet is 30–50-year-old configurations and derivatives
–
Heavy Fixed Wing fleet can halve fuel use by practical geometrically compounded improvement in aero, materials, systems, and propulsion including shift to integrated-wing-body configurations; in vertical lift, OSTR saves 5–6×
2.
The greatest gains in combat effectiveness will come from fuel-efficient ground forces (land and vertical-lift platforms, land warriors, FOBs)
3.
Savings downstream, near the spear-tip, save the most total fuel: delivering 1 liter to Army speartip
consumes
~1.4 extra liters in logistics4.
Savings in aerially refueled aircraft and forward-
deployed ground forces save the most delivery cost and thus realignable support assets

“Effectively immediately, it is DoD policy to include the fully burdened cost of delivered energy in trade-off analyses conducted for all tactical systems with end items that create a demand for energy and to improve the energy efficiency of those systems, consistent with mission requirements and cost effectiveness.” —USD(AT&L) memo 10 April 2007
Pilot Programs established to refine methodology•
Joint Light Tactical Vehicle (JLTV) (MS B mid 2007)•
CG(X)—Maritime Air and Missile Defense of Joint Forces alternative ship concepts AoA (MS B mid 2007)
•
Next Generation Long-Range Strike (MS B FY11)In Aug 06, too, JROC established the energy KPP in CJCSI 3170, though
implementation is slow so farBut NDAA 08 mandated Fully Burdened Cost of Fuel methodology and
Energy KPPs…and DoD is starting to organize energy leadershipNow we need to focus on some even deeper issues DSB discovered…
Progress is emerging
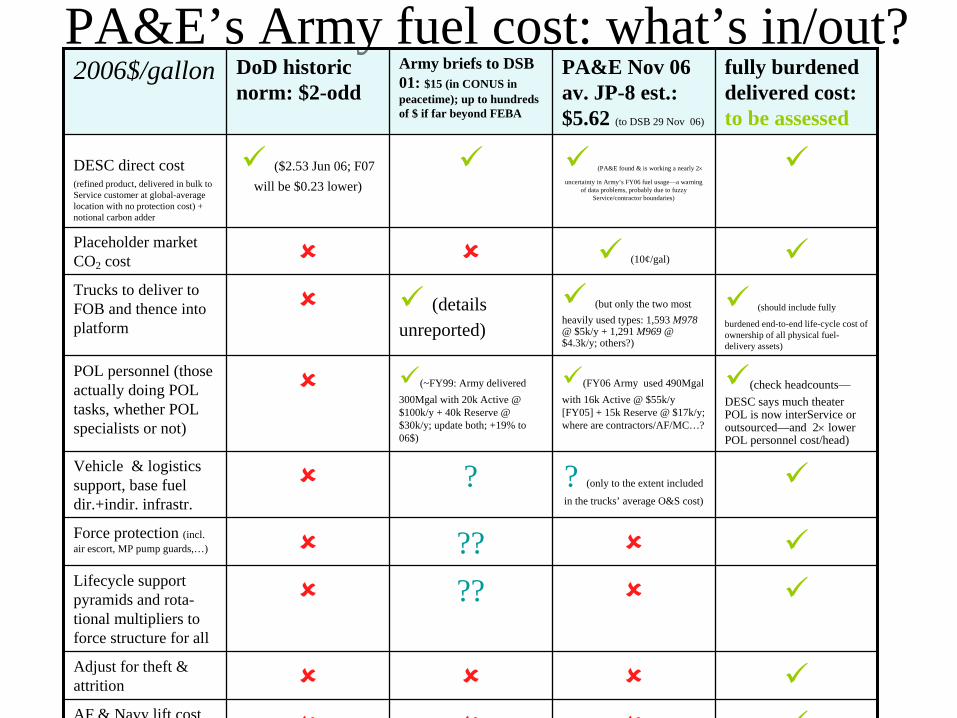
PA&E’s Army fuel cost: what’s in/out?2006$/gallon DoD historic
norm: $2-oddArmy briefs to DSB 01: $15 (in CONUS in peacetime); up to hundreds of $ if far beyond FEBA
PA&E Nov 06 av. JP-8 est.: $5.62 (to DSB 29 Nov 06)
fully burdened delivered cost: to be assessed
DESC direct cost (refined product, delivered in bulk to Service customer at global-average location with no protection cost) + notional carbon adder
($2.53 Jun 06; F07 will be $0.23 lower)
(PA&E found & is working a nearly 2×
uncertainty in Army’s FY06 fuel usage—a warning of data problems, probably due to fuzzy
Service/contractor boundaries)
Placeholder market CO2 cost (10¢/gal)
Trucks to deliver to FOB and thence into platform
(details unreported)
(but only the two most heavily used types: 1,593 M978@ $5k/y + 1,291 M969 @ $4.3k/y; others?)
(should include fully
burdened end-to-end life-cycle cost of ownership of all physical fuel-delivery assets)
POL personnel (those actually doing POL tasks, whether POL specialists or not)
(~FY99: Army delivered 300Mgal with 20k Active @ $100k/y + 40k Reserve @ $30k/y; update both; +19% to 06$)
(FY06 Army used 490Mgal with 16k Active @ $55k/y [FY05] + 15k Reserve @ $17k/y; where are contractors/AF/MC…?
(check headcounts—DESC says much theater POL is now interService or outsourced—and 2× lower POL personnel cost/head)
Vehicle & logistics support, base fuel dir.+indir. infrastr.
? ? (only to the extent included
in the trucks’ average O&S cost)
Force protection (incl. air escort, MP pump guards,…) ??Lifecycle support pyramids and rota- tional multipliers to force structure for all
??
Adjust for theft & attrition
AF & Navy lift cost
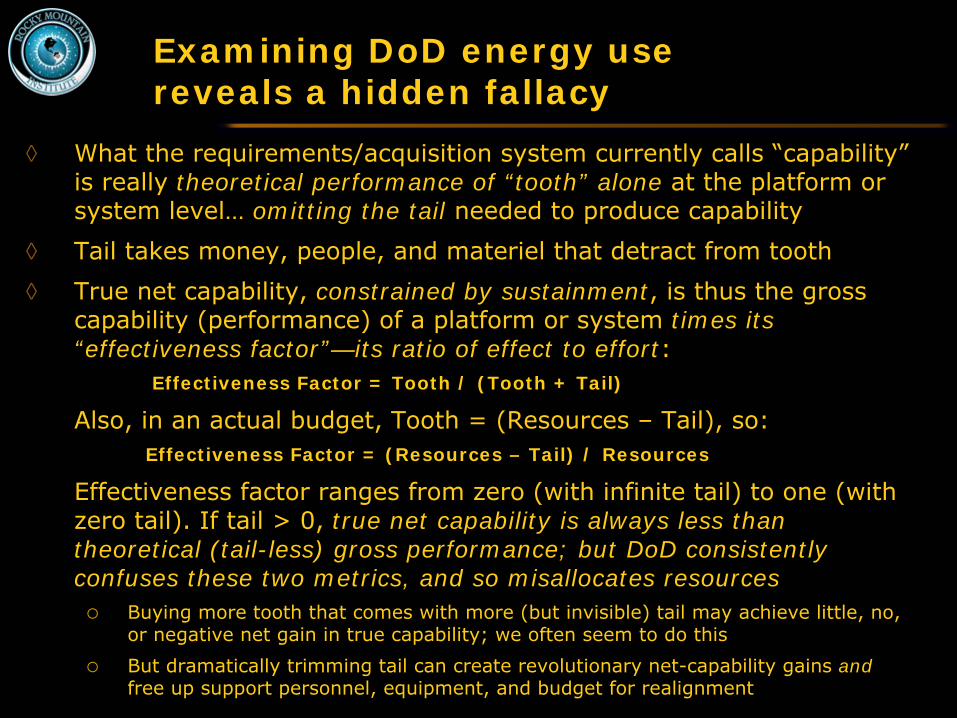
Examining DoD energy use reveals a hidden fallacy
◊
What the requirements/acquisition system currently calls “capability”
is really theoretical performance of “tooth” alone at the platform or system level…
omitting the tail needed to produce capability
◊
Tail takes money, people, and materiel that detract from tooth
◊
True net capability, constrained by sustainment, is thus the gross capability (performance) of a platform or system times its “effectiveness factor”—its ratio of effect to effort:
Effectiveness Factor = Tooth / (Tooth + Tail)
◊
Also, in an actual budget, Tooth = (Resources –
Tail), so:Effectiveness Factor = (Resources – Tail) / Resources
◊
Effectiveness factor ranges from zero (with infinite tail) to one (with zero tail). If tail > 0, true net capability is always less than theoretical (tail-less) gross performance; but DoD consistently confuses these two metrics, and so misallocates resources
Buying more tooth that comes with more (but invisible) tail may achieve little, no, or negative net gain in true capability; we often seem to do this
But dramatically trimming tail can create revolutionary net-capability gains and free up support personnel, equipment, and budget for realignment
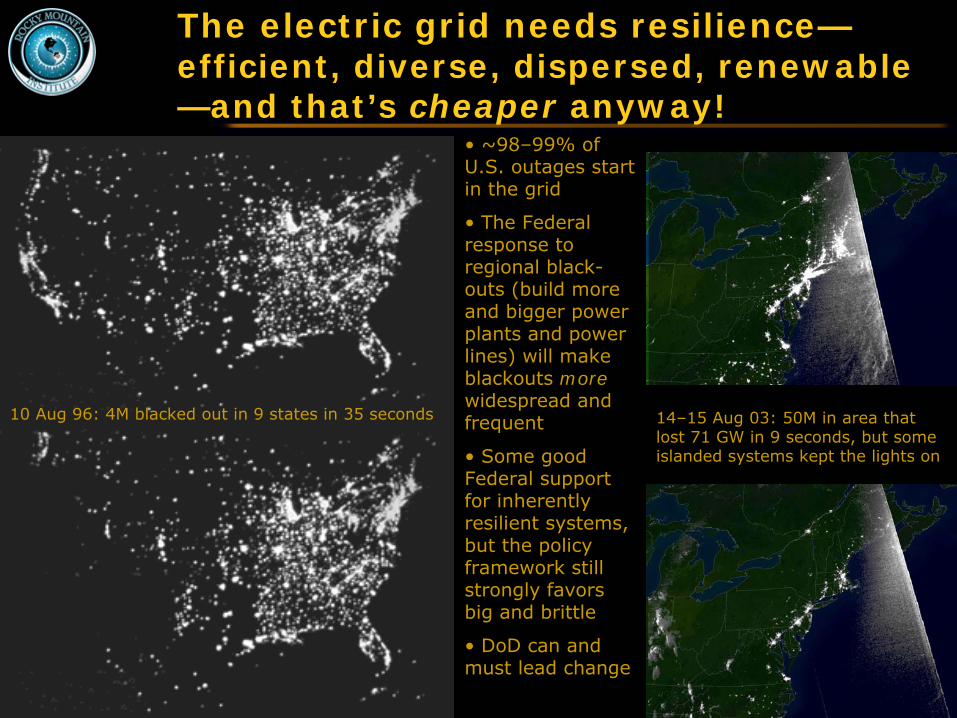
The electric grid needs resilience— efficient, diverse, dispersed, renewable —and that’s cheaper anyway!
•
~98–99% of U.S. outages start in the grid
•
The Federal response to regional black-
outs (build more and bigger power plants and power lines) will make blackouts more widespread and frequent
•
Some good Federal support for inherently resilient systems, but the policy framework still strongly favors big and brittle
•
DoD
can and must lead change
10 Aug 96: 4M blacked out in 9 states in 35 seconds 14–15 Aug 03: 50M in area that lost 71 GW in 9 seconds, but some islanded systems kept the lights on
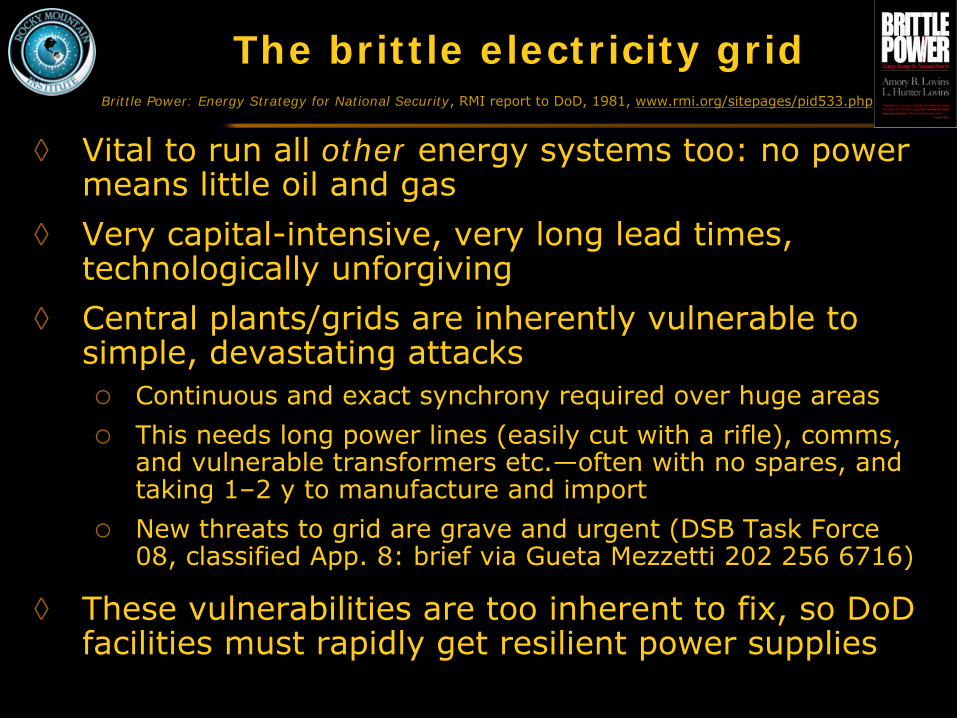
The brittle electricity grid
◊
Vital to run all other energy systems too: no power means little oil and gas
◊
Very capital-intensive, very long lead times, technologically unforgiving
◊
Central plants/grids are inherently vulnerable to simple, devastating attacks
Continuous and exact synchrony required over huge areas
This needs long power lines (easily cut with a rifle), comms, and vulnerable transformers etc.—often with no spares, and taking 1–2 y to manufacture and import
New threats to grid are grave and urgent (DSB Task Force 08, classified App. 8: brief via Gueta Mezzetti 202 256 6716)
◊
These vulnerabilities are too inherent to fix, so DoD facilities must rapidly get resilient power supplies
Brittle Power: Energy Strategy for National Security, RMI report to DoD, 1981, www.rmi.org/sitepages/pid533.php

The brittle grid threatens DoD’s mission continuity—urgent fixes are needed
◊
DoD, though the world’s #1 buyer of renewable energy, is at least 98% reliant on the brittle electric grid, so it must quick-
ly
make bases’
power supplies resilient and mainly renewableOf 584 CONUS bases, ~90% have good supply options onsite or nearby, mostly renewable, and most of their electricity can readily be renewable; could achieve zero daily net energy need for facilities/ops/ground vehicles, full independence in hunker-down mode (no grid), then power export to nearby communities and to nucleate grid blackstart
So DoD bases’ energy independence would collaterally enable national electric grid resilience—and probably only DoD can move as decisively as the threat warrants
OCONUS potential for austere-FOB energy independence is even larger because avoidable delivered energy costs are higher
◊
DSB Task Force 08 strongly recommended implementing existing policy (DoDI
1470.11 §5.2.3) so bases switch to onsite, self-contained power for critical functions, DoD-
facilities-based micro-grids, and netted area microgrids
for extended strategic islanding, all with efficient end-use
Designing for resilience (1981– 84)...
“An inherently resilient system should include many relatively small, fine-grained elements, dispersed in space, each having a low cost of failure. These substitutible
compo-
nents should be richly interconnected by short, redundant links…Failed components or links should be promptly detected, isolated, and repaired. Components need to be so organized that each element can interconnect with the rest at will but stand alone at need, and that each succes-
sive
level of function is little affected by failures or substi-
tutions
at a subordinate level. Systems should be designed so that any failures are slow and graceful. Components, finally, should be understandable, maintainable, reproducible at a variety of scales, capable of rapid evolution, and societally
compatible.”Summarized from Chapter 13, “Designing for Resilience,” A.B. & L.H. Lovins, Brittle Power: Energy Strategy for National Security, Brick House 1982, RMI 2001, reposted at www.rmi.org
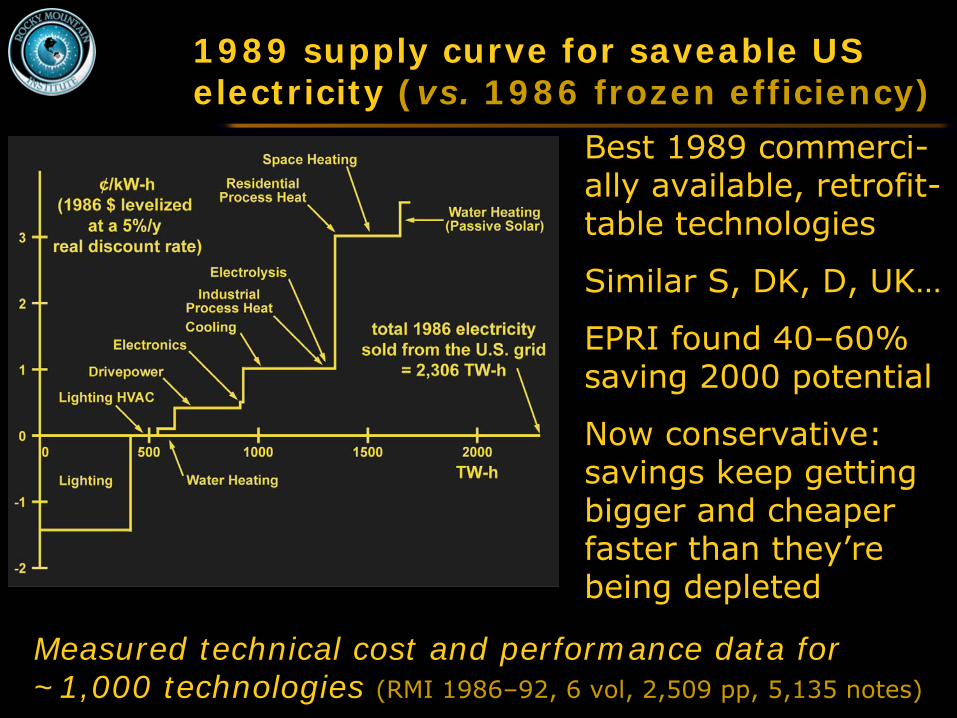
1989 supply curve for saveable US electricity (vs. 1986 frozen efficiency)
Best 1989 commerci- ally available, retrofit- table technologies
Similar S, DK, D, UK…
EPRI found 40–60% saving 2000 potential
Now conservative: savings keep getting bigger and cheaper faster than they’re being depleted
Measured technical cost and performance data for ~1,000 technologies (RMI 1986–92, 6 vol, 2,509 pp, 5,135 notes)

–47 to +115˚F with no heating/cooling equipment, less construction cost: Can your base housing do this? Why not?
◊
Lovins house / RMI HQ, Snowmass, Colorado, ’84
Saves 99% of space & water heating energy, 90% of home el. (4,000 ft2 use ~120 Wav costing ~$5/month @ $0.07/kWh)
10-month payback in 1983
7100’, frost any day, 39 days’
continuous midwinter cloud…yet 28 banana crops with no furnace
Key: integrative design—multiple benefits from single expenditures
◊
PG&E ACT2, Davis CA, ’94Mature-market cost –$1,800
Present-valued maint. –$1,600
82% design saving from best 1992 std., ~90% from US norm
◊
Prof. Soontorn
Boonyatikarn
house, Bangkok, Thailand, ’9684% less a/c capacity, ~90% less a/c energy, better comfort
No extra construction cost

Old design mentality: always diminishing returns...
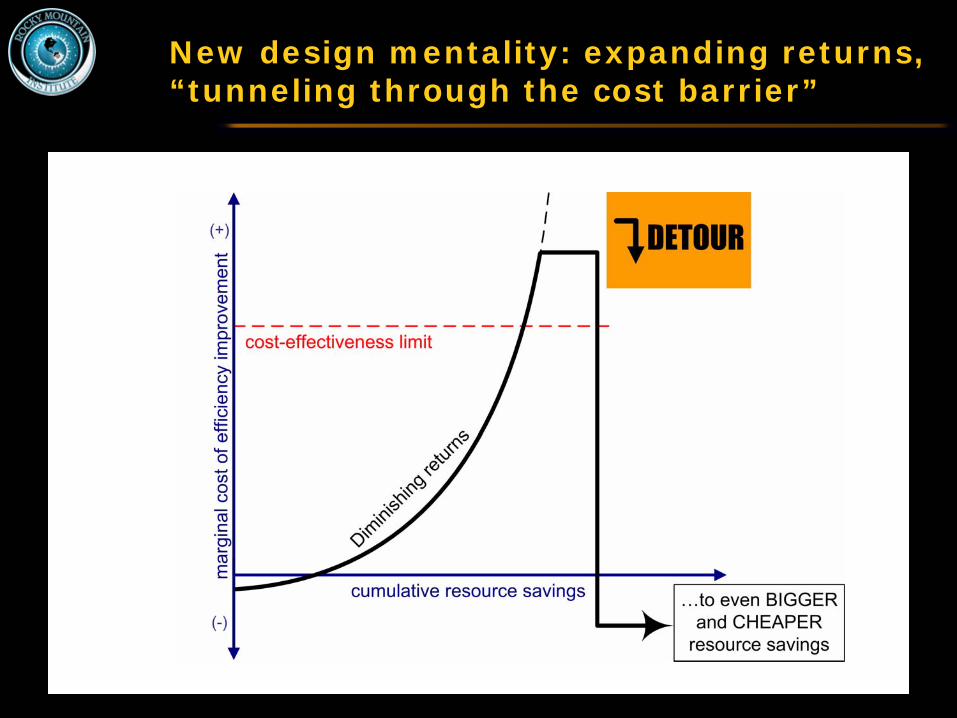
New design mentality: expanding returns, “tunneling through the cost barrier”
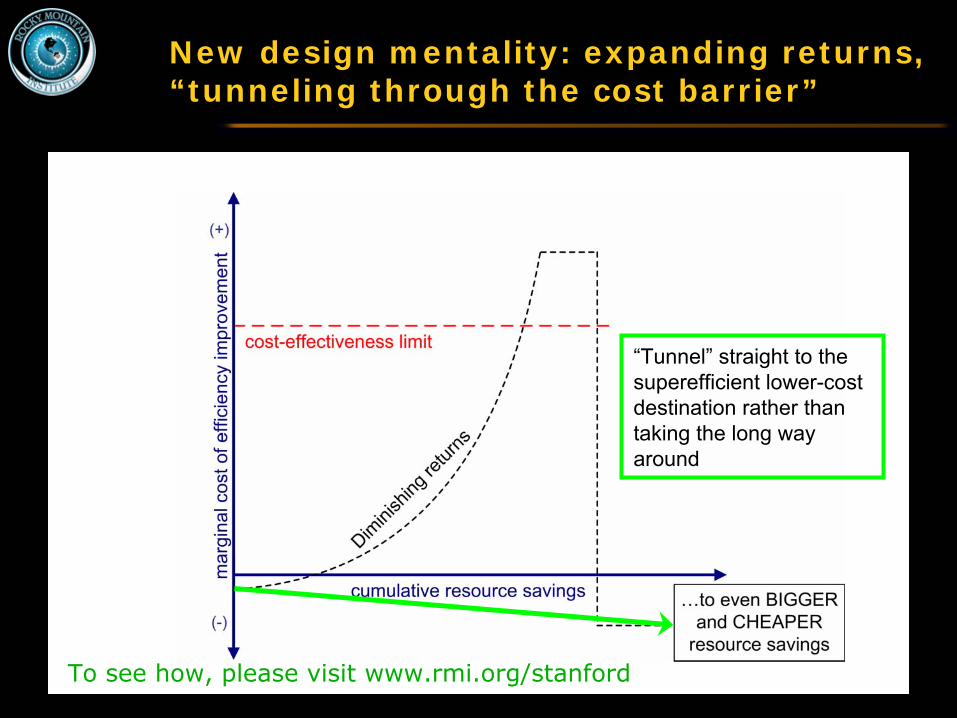
New design mentality: expanding returns, “tunneling through the cost barrier”
“Tunnel”
straight to the superefficient
lower-cost destination rather than taking the long way around
To see how, please visit www.rmi.org/stanford

Cost can be negative even for retrofits of big buildings
◊
200,000-ft2, 20-year-old curtainwall
office near Chicago (hot & humid summer, very cold winter)
◊
Dark-glass window units’ edge-seals were failing
◊
Replace not with similar but with superwindowsLet in nearly 6× more light, 0.9× as much unwanted heat, reduce heat loss and noise by 3–4×, cost 78¢ more per ft2 of glass
Add deep daylighting, plus very efficient lights (0.3 W/ft2) and office equipment (0.2 W/ft2); peak cooling load drops by 77%
◊
Replace big old cooling system with a new one 4× smaller, 3.8×
more efficient, $0.2 million cheaper
◊
That capital saving pays for all the extra costs
◊
75% energy saving—cheaper than usual renovation
QuickTime™ and aTIFF (Uncompressed) decompressor
are needed to see this picture.

Retrofitting New York City’s 2.8-milliion- ft2 Empire State Building (2009)
◊
Will save 38% of energy use, with a 3-year payback and increased value
◊
Integrative design yields 2–3×
the savings normally cost-effective
◊
Remanufacturing 6,500 windows onsite (!) into superwindows
cuts their winter heat loss by ≥2/3 and their unwanted heat gain by 1/2
◊
That plus better lights and office equipment cuts cooling loads by 1/3
◊
Old chillers can then be reduced and renovated, not replaced and expan-
ded—saving capital that helps pay for all the other improvements
◊
Designed for scalable replication
QuickTime™ and a decompressor
are needed to see this picture.

New design mentality makes very big energy savings cheaper than small ones New design mentality makes very big energy savings cheaper than small ones
•
Redesigning a standard (supposedly optimized) industrial pumping loop cut its power from 95 to 7 hp (–92%), cost less to build, and worked better
Just by fat short straight pipes, not thin long crooked pipes
Should have saved ~98% and paid even less!
•
Redesigning a standard (supposedly optimized) industrial pumping loop cut its power from 95 to 7 hp (–92%), cost less to build, and worked better
Just by fat short straight pipes, not thin long crooked pipes
Should have saved ~98% and paid even less!

Compounding losses…or savings…so start saving at the downstream end to save ten times as much energy at the power plant
Also makes upstream equipment smaller, simpler, cheaper
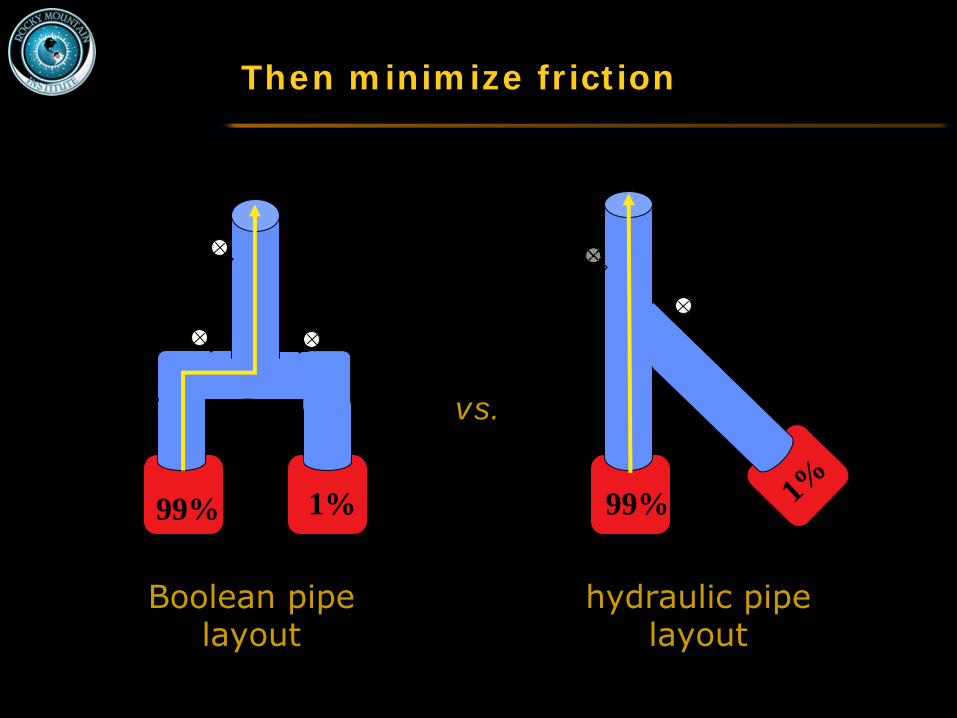
99% 1%
hydraulic pipe layout
vs.
Then minimize frictionEXAMPLE
1%
Boolean pipe layout
optional
99%

High-efficiency pumping / piping retrofit (Rumsey Engineers, Oakland Museum)
downsized CW pumps, ~75% pumping energy saving
Notice smooth piping design– 45os and Ys
15 negapumps

Which of these layouts has less capex & energy use?
Condenser water plant: traditional design
to chiller
to chiller
to chiller
return from tower
return from tower
return from tower
• Less space, weight, friction, energy
•
Fewer parts, smaller pumps and motors, less installation labor
• Less O&M, higher uptimereturn
from tower
to chiller
return from
tower
…or how about this?

Examples from RMI’s industrial practice (>$30b of facilities)
◊
Retrofit eight chip fabs, save 30–50+% of HVAC energy, ~2-y paybacks◊
Retrofit very efficient oil refinery, save 42%, ~3-y payback◊
Retrofit North Sea oil platform, save 50% el., get the rest from
waste◊
Retrofit huge LNG plant, ≥40% energy savings; ~60% new, cost less◊
Retrofit giant platinum mine, 43% energy savings, 2–3-y payback ◊
Redesign new mine, save 100% of fossil fuel (it’s powered by gravity)◊
Redesign $5b gas-to-liquids plant, save >50% energy and 20% capex◊
Redesign next new chip fab, eliminate chillers, save 2/3 el. & 1/2 capex◊
Redesign new data ctr, save 75–95%, cut capex
& time, improve uptime◊
Redesign supermarket, save 70–90%, better sales, ?lower capex◊
Redesign new chemical plant, save ~3/4 of auxiliary el., –10% capex◊
Redesign cellulosic
ethanol plant, –50% steam, –60% el, –30% capex◊
Retrofits save ~30–60% w/2–3-y payback; new, ~40–90% w/less capex◊
“Tunneling through the cost barrier”
now observed in 29 sectors◊
None of this would be possible if original designs had been good◊
Needs engineering pedadogy/practice reforms; see www.10xE.org
(RMI’s
plot for the nonviolent overthrow of bad engineering)

>100×
energy leverage in a data center
30WEnergy intoData Center
17WEnergy Into Server
9WEnergy Into Chips
.3W–1.5WEnergy intoApplications
100WEnergy intoPower Plant
Under-Utilization85%-97%
•
Compute•
Storage•
Bandwidth
Fans10%
PowerSupply35%
InefficientBusiness
Processes??%
Cooling33%
Lighting4%
UPS15%
Inefficient &Zero-ValueApplications10%-40%
Transmission10%
Power Plant 67%
$$.12W-.9WEnergy intoBusinessProcess
.00?WEnergy intoCustomerValue
←then cut utility losses by ~50%→
←…then cut support overhead by 90%→
←…then cut IT equipment’s internal losses by 75%…
→←First debloat
software and ensure that every computation cycle is needed →
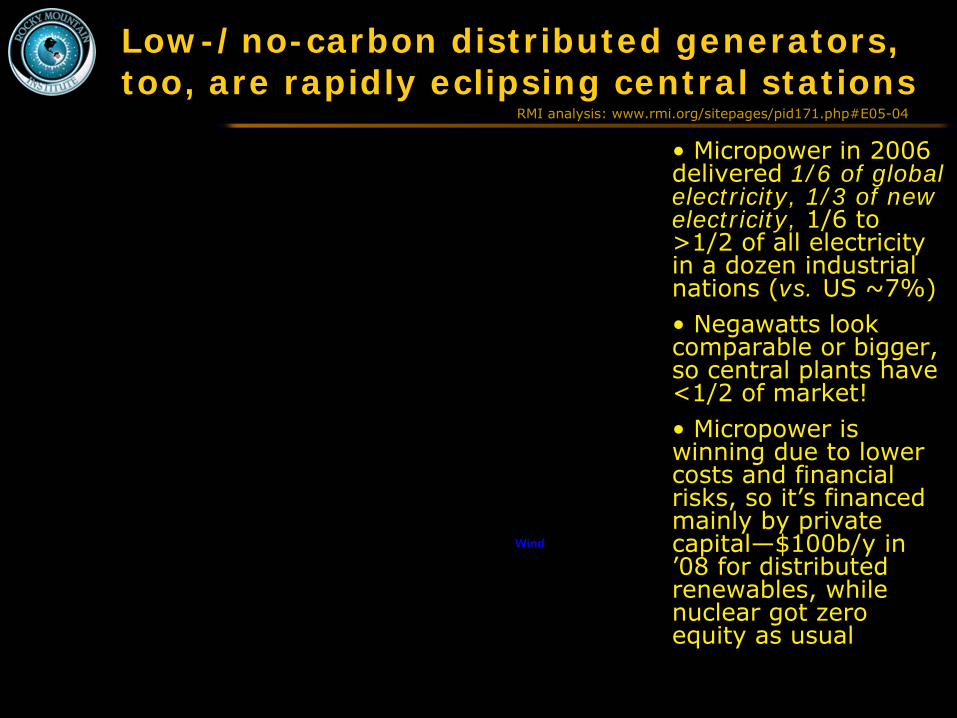
Low-/no-carbon distributed generators, too, are rapidly eclipsing central stations
•
Micropower
in 2006 delivered 1/6 of global electricity, 1/3 of new electricity, 1/6 to >1/2 of all electricity in a dozen industrial nations (vs. US ~7%)•
Negawatts
look comparable or bigger, so central plants have <1/2 of market!•
Micropower
is winning due to lower costs and financial risks, so it’s financed mainly by private capital—$100b/y in ’08 for distributed renewables, while nuclear got zero equity as usual
RMI analysis: www.rmi.org/sitepages/pid171.php#E05-04
QuickTime™ and a decompressor
are needed to see this picture.
Wind

Global nuclear additions are dwindling while renewables soar
QuickTime™ and a decompressor
are needed to see this picture.
QuickTime™ and a decompressor
are needed to see this picture.
•
Global nuclear retirements (L) would need heroic construction pace to keep up with >2015 (impossible to do so earlier)
•
Nuclear “renaissance”
(lower L) is barely perceptible in construction starts so far
•
While nuclear additions grind to a halt (lower R)—e.g., zero for the past 2 years —distributed renewables
are surging ahead, adding 40 GW in 2008 alone
Where’s the “nuclear renaissance”?
◊
In Aug 05–Aug 08, with the most robust capital markets and nuclear politics in history, new
U.S.
nuclear subsidies rivaling or exceeding total con- struction
cost elicited zero equity for 33 projects
◊
Of the 52 reactors said by the IAEA to be “under construction” at 1 Aug 09, 13 have been “under construction” for >20 y; 24 have no official start date; half are late; 36 are in China, India, Russia, or S Korea; all 52 are centrally planned; none are normal competitive free-market purchases
◊
Nuclear capacity fell 1.6 GW in 2008. Further falls are inevitable at least through 2015 and can be only temporarily stabilized thereafter, even with huge building efforts and global license extensions (the average operating plant is now 25 y old)

Nuclear is the costliest of the low- or no-carbon resources
“Forget Nuclear,”
at www.rmi.org/sitepages/pid
467.php; “The Nuclear Illusion,”
Ambio, in press, 2010, preprint at www.rmi.org/images/PDFs/
Energy/E08-
01_AmbioNucIllusion.pdf
Cost of new delivered electricity
-1
0
1
2
3
4
5
6
7
8
9
10
11
12
13
14
15
Nuclear plant Coal plant Large combined-cycle gas plant
Large wind farm(dispatchable)
Combined-cycleindustrial cogen
Building-scalecogen
Recovered-heatindustrial cogen
End-use efficiency
20
07
US
¢ p
er
deli
vere
d k
Wh
Credit forrecovered andreused heat
Fuel minus heatcredit
Transmission andDistribution
Firming andintegration
Operation andMaintenance
Capital
MIT (2003)
Keystone (June 2007)
Moody's $7,500/kWe capex + Keystone O&M and financing: 15.2–20.6¢/kWh
2009 order ~10–13¢
2009 order ~9–13¢
2008 av. 8.4¢
net of 1¢
PTC
(May 08)

Cheapest and lowest-carbon sources save the most C per $
(calculated by multiplying coal-plant carbon displaced per kWh times kWh delivered per dollar)
Coal-fired CO2 emissions displaced per dollar spent on electrical services
0
5
10
15
20
25
30
35
Nuclear plant Coal plant Large combined-cycle gas plant
Large wind farm Combined-cycleindustrial cogen
Building-scalecogen
Recovered-heatindustrial cogen
End-use efficiency
kg
CO
2 d
isp
lace
d p
er
20
07
do
llar
Keystone high nuclear cost scenario
N/A
Carbon displacement at various efficiency costs/kWh
3¢
4¢
2¢: 47 kg CO2/$
1¢: 93 kg CO2/$
Moody's estimate
New nuclear saves 2–20+×
less carbon per dollar, ~20–40×
slower, than efficiency and micropower
investments
Buying new nuclear instead of efficiency results in more carbon release than if the same money had been spent buying a new coal-fired power plant
MIT study 035/08
6/07
Percentage of U.S. coal-fired electricity that can be saved or displaced by…
◊
Using electricity as efficiently as the average of the top ten states: ~62%
◊
Using electricity fully cost-effectively: >100%◊
Building the 300 GW of windpower
stuck in the
interconnection queue: >50%◊
Building cost-effective windpower
in available U.S.
sites: >400%◊
Building untapped industrial cogeneration: ~40% (not counting the large potential in buildings)
◊
Putting photovoltaics
on 7% of U.S. structures: >200%
◊
Plus lots of other renewables…◊
All (except some PVs
briefly) beat new coal; the
first two beat operating old coal

Negawatts/renewables synergy: Bundling PVs with end-use efficiency— a recent example, widely applicable
◊
Santa Rita Jail, Alameda County, California, 2002–3
◊
PowerLight
1.18 MWp
project, 1.46 GWh/y, ~3 acres of PVs
◊
Integrated with Cool Roof and ESCO efficiency retrofit (light-
ing, HVAC, controls, 1 GWh/y)
◊
Energy management optimizes use of PV output
◊
Dramatic (~0.7 MWp
) load cut◊
Gross project cost $9 million◊
State incentives $5 million◊
Gross savings $15 million/25 y◊
IRR >10%/y (Cty. hurdle rate)◊
Works for PVs, so should work better for cheaper distrib. gen.

What are we waiting for? We are the people we have been waiting for!
www.oilendgame.com,
www.fiberforge.com, www.rmi.org (Publications), www.natcap.org
Your move…
“Only puny secrets need protection. Big discoveries are protected by public incredulity.”
—Marshall McLuhan