armchair investor trend-following...
TRANSCRIPT

4/24/2017 UPTREND Wow! Major indexes take off with Major Accumulation days! Monday Volume 16 Day 077
Join us at the April 26 (Wednesday) Dallas-Wide IBD Meetup at the Haggard Library in Plano, 6:30 – 8:30 p.m. Pre-registration is required – we are in downstairs meeting room with limited seating. And please remember to also pay online before the Meetup – see the Meetup for details – www.meetup.com/ibd-265
ARMCHAIR INVESTOR TREND-FOLLOWING STRATEGY*
(*For that part of your portfolio which is invested in a market-tracking ETF like the QQQ.) “
MONDAY : Major indexes open with a big gap up, ending day
with Major Accumulation day.
The S&P500 was UP 1.2% with volume up 6.5%.
The Nasdaq was UP 1.1% with volume up 4.8%.
The two major indexes might not be showing as much weakness as some dramatic commentators are saying:
The Nasdaq closed only one day under its 50-day moving average in the last 4 months. That low close was Thursday of last week. Now it is within a breath of a new high.
In contrast, the S&P500 closed below its 50-day m.a. a week ago. But the S&P500 has not wandered far from its 50-day m.a. – reaching up during each day to just a whisper away from the 50-day m.a. until todays close at its 50- day m.a. Staying so close also shows strength. No freefall here!
Compare this recent pullback with others in the last few years.
Why is the market direction NOT changing to “Uptrend under Pressure”?
I am watching the distribution days for density (frequency) and significance of the drops. That means I look at the size of the price and volume moves, and where the volume ends up. E.G. below-average volume carries much less weight than above-average volume.
The indexes are staying closely snuggled right around the 50-day moving average lines.
The distribution count is 5 days for both indexes and those days are all less than 1% moves.
A final warning: Yes, this Uptrend will eventually roll over. Yes this
longest Bull market will lose 20+% and become a bear. I just don’t see it at the moment. But the diagnosis can change quickly. Please note: this is not a time to forget to check the market every day.
MARKET DIAGNOSIS: “UPTREND” “REMEMBER”:
THE MARKET CONTINUES IN THE DIRECTION IS IT GOING UNTIL IT DOESN’T.
What to consider now: Hold the QQQ.
I hold my full QQQ position (When the market rises above prior highs, I will consider moving some of my position to TQQQ).
For buyers of individual stocks: I am buying individual stocks. See ADDITIONAL COMMENTS section in the full newsletter:
The FULL ARMCHAIR INVESTOR NEWSLETTER can be downloaded at
www.ArmchairInvestor.com
Click on the Armchair Investor Current Newsletter tab
© Armchair Investor(SM) 2017, Charlotte Hudgin 214-995-6702 All rights Reserved
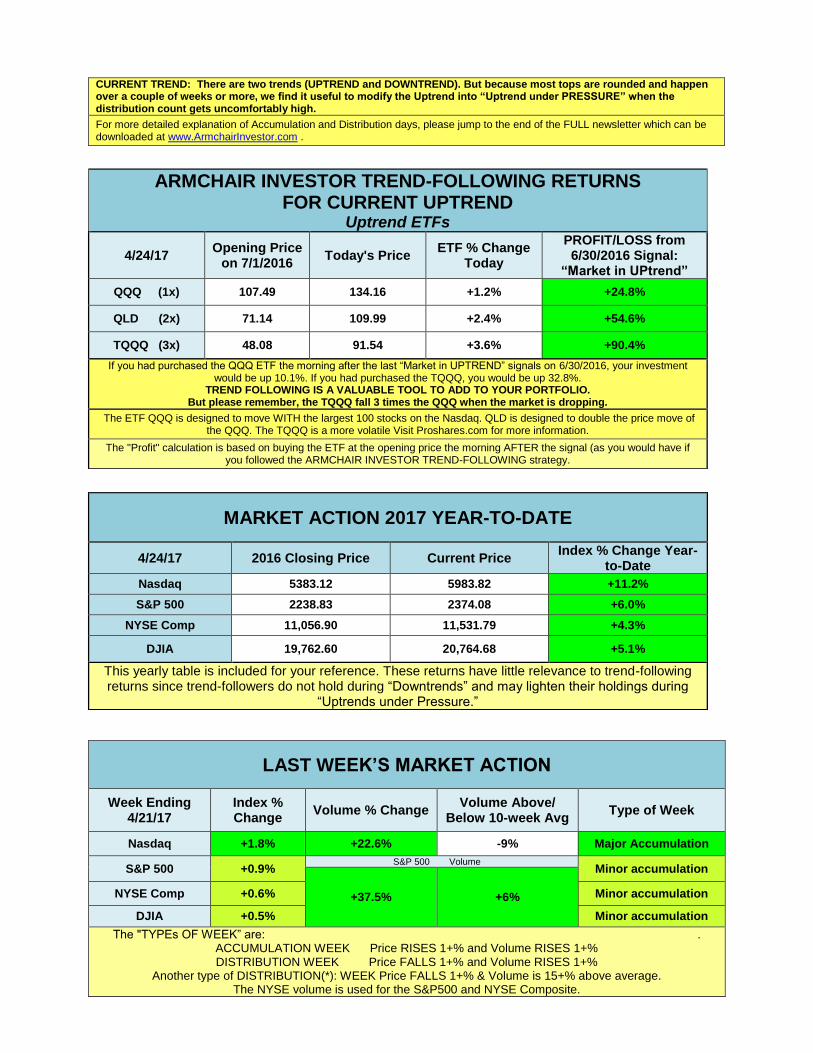
TODAY’S MARKET ACTION
4/24/17 Index Close
Index % Change
Volume % Change
Volume vs 50-day Avg
Accumulation or Distribution Day?
Current Trend: UPTREND
Began 6/30/2016
Nasdaq 5983.82 +1.2% +6.5% -1.2% Major
Accumulation +23.7%
S&P500 2374.08 +1.1% NYSE Volume Major
Accumulation
+13.1%
+4.8% +5.6%
NYSE 11,531.7
9 +1.3%
Major Accumulation
+9.9%
DJIA 20,764.6
8 +1.1%
Major Accumulation
+15.8%
An ACCUMULATION day points at heavy buying by institutional money managers - the mutual funds, pension funds, banks, etc. A DISTRIBUTION day points at heavy selling by institutional money managers. See additional notes on accumulation and distribution at the end of the FULL newsletter
A Major ACCUMULATION Day: Price RISES 1.0% or more with higher Volume than the day before A Minor accumulation Day: Price RISES 0.2% but less than 1% and Volume is strong (either higher than the day before or is well-above average volume)
A Major DISTRIBUTION Day: Price FALLS 1.0% or more and higher Volume than the day before. A Minor distribution Day: Price FALLS 0.2% but less than 1% and Volume is strong (either higher than the day before or is well-above average volume)
Distribution indicates institutions are selling their stock. The standard mathematical requirements for distribution days are shown above.
And there are additional types of distribution days that show substantial selling such as happened on Monday June 27, 2016, when the market fell 2.4%, closed near the bottom of the day’s price range but had lighter volume. The volume was still a strong 31% above average. In total, the day was heavy selling and labeled distribution (6/27/2016 was the second day of the market’s heavy selling response to England’s vote to leave the European Union.)
CURRENT TREND: There are two trends (UPTREND and DOWNTREND). But because most tops are rounded and happen over a couple of weeks or more, we find it useful to modify the Uptrend into “Uptrend under PRESSURE” when the distribution count gets uncomfortably high.
For more detailed explanation of Accumulation and Distribution days, please jump to the end of the FULL newsletter which can be downloaded at www.ArmchairInvestor.com .
ARMCHAIR INVESTOR TREND-FOLLOWING RETURNS FOR CURRENT UPTREND
Uptrend ETFs
4/24/17 Opening Price
on 7/1/2016 Today's Price
ETF % Change Today
PROFIT/LOSS from 6/30/2016 Signal:
“Market in UPtrend”
QQQ (1x) 107.49 134.16 +1.2% +24.8%
QLD (2x) 71.14 109.99 +2.4% +54.6%
TQQQ (3x) 48.08 91.54 +3.6% +90.4%
If you had purchased the QQQ ETF the morning after the last “Market in UPTREND” signals on 6/30/2016, your investment would be up 10.1%. If you had purchased the TQQQ, you would be up 32.8%.
TREND FOLLOWING IS A VALUABLE TOOL TO ADD TO YOUR PORTFOLIO. But please remember, the TQQQ fall 3 times the QQQ when the market is dropping.
The ETF QQQ is designed to move WITH the largest 100 stocks on the Nasdaq. QLD is designed to double the price move of the QQQ. The TQQQ is a more volatile Visit Proshares.com for more information.
The "Profit" calculation is based on buying the ETF at the opening price the morning AFTER the signal (as you would have if you followed the ARMCHAIR INVESTOR TREND-FOLLOWING strategy.
MARKET ACTION 2017 YEAR-TO-DATE
4/24/17 2016 Closing Price Current Price Index % Change Year-
to-Date
Nasdaq 5383.12 5983.82 +11.2%
S&P 500 2238.83 2374.08 +6.0%
NYSE Comp 11,056.90 11,531.79 +4.3%
DJIA 19,762.60 20,764.68 +5.1%
This yearly table is included for your reference. These returns have little relevance to trend-following returns since trend-followers do not hold during “Downtrends” and may lighten their holdings during
“Uptrends under Pressure.”
LAST WEEK’S MARKET ACTION
Week Ending 4/21/17
Index % Change
Volume % Change Volume Above/
Below 10-week Avg Type of Week
Nasdaq +1.8% +22.6% -9% Major Accumulation
S&P 500 +0.9% S&P 500 Volume
Minor accumulation
+37.5% +6% NYSE Comp +0.6% Minor accumulation
DJIA +0.5% Minor accumulation
The "TYPEs OF WEEK” are: . ACCUMULATION WEEK Price RISES 1+% and Volume RISES 1+% DISTRIBUTION WEEK Price FALLS 1+% and Volume RISES 1+%
Another type of DISTRIBUTION(*): WEEK Price FALLS 1+% & Volume is 15+% above average. The NYSE volume is used for the S&P500 and NYSE Composite.

PROGRESS IN ACCUMULATION/DISTRIBUTION RATINGS
for Stocks Over $5
A B C D E Total
4 weeks ago 3/24 11% 42% 23% 18% 7% 6344
3 weeks ago 3/31 12% 44% 22% 16% 5% 6364
2 weeks ago 4/7 10% 42% 24% 18% 6% 6359
1 week ago 4/17 9% 40% 25% 19% 7% 6353
Today 4/24 10% 43% 23% 18% 6%
# 653 2722 1493 1124 367 6359
Note: The Accumulation/Distribution ratings are calculated overnight & reported one day delayed. "2 weeks ago" is 10 market days ago; "4 weeks ago" is 20. The ratings which are higher than two weeks prior are colored light
GREEN. Those lower are PINK.
The above charts are from StockCharts.com, a valuable site for investors with many free tools. On the daily charts: The price 20-day, 50-day and 200-day moving averages are shown. If you don’t see the 200-day price moving average, it is too far away from the price bars to show. But stay tuned – it will appear on these charts when the market direction changes. Also, the volume 50-day moving average is shown.
On the weekly charts: The price 10-week & 40-week moving averages and the 10-week volume
moving average is shown.
S&P500 Daily
Nasdaq Daily
S&P500 Weekly
(as of 4/7/17)
Nasdaq Weekly
(as of 4/7/17)
- - - - - - - - - - - - - - - - - - - - - - - - - - - - - - - - - - - - - - - - - - -
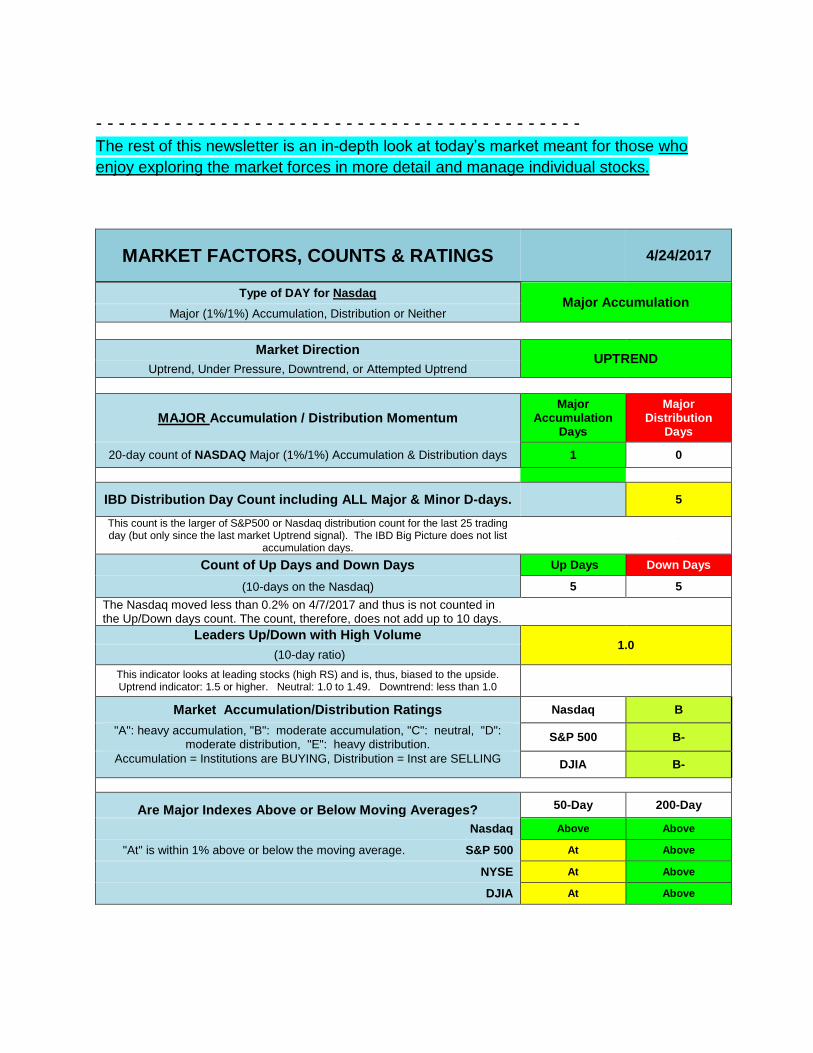
The rest of this newsletter is an in-depth look at today’s market meant for those who
enjoy exploring the market forces in more detail and manage individual stocks.
MARKET FACTORS, COUNTS & RATINGS 4/24/2017
Type of DAY for Nasdaq Major Accumulation
Major (1%/1%) Accumulation, Distribution or Neither
Market Direction UPTREND
Uptrend, Under Pressure, Downtrend, or Attempted Uptrend
MAJOR Accumulation / Distribution Momentum Major
Accumulation Days
Major Distribution
Days
20-day count of NASDAQ Major (1%/1%) Accumulation & Distribution days 1 0
IBD Distribution Day Count including ALL Major & Minor D-days. 5
This count is the larger of S&P500 or Nasdaq distribution count for the last 25 trading day (but only since the last market Uptrend signal). The IBD Big Picture does not list
accumulation days. .
Count of Up Days and Down Days Up Days Down Days
(10-days on the Nasdaq) 5 5
The Nasdaq moved less than 0.2% on 4/7/2017 and thus is not counted in the Up/Down days count. The count, therefore, does not add up to 10 days.
Leaders Up/Down with High Volume 1.0
(10-day ratio)
This indicator looks at leading stocks (high RS) and is, thus, biased to the upside. Uptrend indicator: 1.5 or higher. Neutral: 1.0 to 1.49. Downtrend: less than 1.0
Market Accumulation/Distribution Ratings Nasdaq B
"A": heavy accumulation, "B": moderate accumulation, "C": neutral, "D": moderate distribution, "E": heavy distribution.
S&P 500 B-
Accumulation = Institutions are BUYING, Distribution = Inst are SELLING DJIA B-
Are Major Indexes Above or Below Moving Averages? 50-Day 200-Day
Nasdaq Above Above
"At" is within 1% above or below the moving average. S&P 500 At Above
NYSE At Above
DJIA At Above
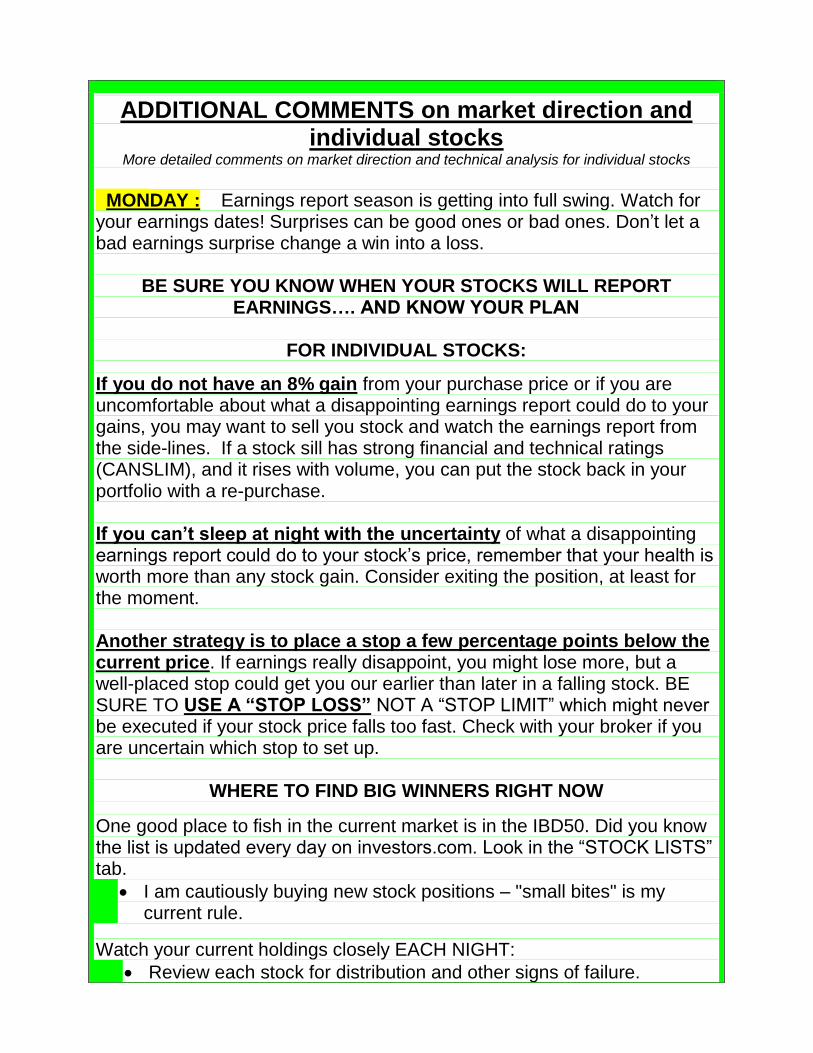
ADDITIONAL COMMENTS on market direction and individual stocks
More detailed comments on market direction and technical analysis for individual stocks
MONDAY : Earnings report season is getting into full swing. Watch for your earnings dates! Surprises can be good ones or bad ones. Don’t let a bad earnings surprise change a win into a loss.
BE SURE YOU KNOW WHEN YOUR STOCKS WILL REPORT EARNINGS…. AND KNOW YOUR PLAN
FOR INDIVIDUAL STOCKS:
If you do not have an 8% gain from your purchase price or if you are uncomfortable about what a disappointing earnings report could do to your gains, you may want to sell you stock and watch the earnings report from the side-lines. If a stock sill has strong financial and technical ratings (CANSLIM), and it rises with volume, you can put the stock back in your portfolio with a re-purchase. If you can’t sleep at night with the uncertainty of what a disappointing earnings report could do to your stock’s price, remember that your health is worth more than any stock gain. Consider exiting the position, at least for the moment. Another strategy is to place a stop a few percentage points below the current price. If earnings really disappoint, you might lose more, but a well-placed stop could get you our earlier than later in a falling stock. BE SURE TO USE A “STOP LOSS” NOT A “STOP LIMIT” which might never be executed if your stock price falls too fast. Check with your broker if you are uncertain which stop to set up.
WHERE TO FIND BIG WINNERS RIGHT NOW
One good place to fish in the current market is in the IBD50. Did you know the list is updated every day on investors.com. Look in the “STOCK LISTS” tab.
I am cautiously buying new stock positions – "small bites" is my current rule.
Watch your current holdings closely EACH NIGHT:
Review each stock for distribution and other signs of failure.

Don’t be afraid to protect your winnings by taking some or all of those winnings off the table (e.g. consider selling stocks that you see are not continuing upward with strength.)
YOU ARE NOT SMARTER THAN THE MARKET
REMEMBER THESE IMPORTANT INVESTING RULES:
#1 Investing Rule
PROTECT YOUR PORTFOLIO WITH AN 8% STOP
And, yes. You may have chosen a tighter 7% or 6% stop. The most important aspect of this first rule is:
CHOOSE YOUR STOP & LIVE BY IT – NO EXCUSES!
And you don’t have to wait for your stock to fall to the stop. A concentration of distribution is a good reason to get out wherever it happens! #2 Investing Rule:
TRADE IN THE DIRECTION OF THE CURRENT MARKET And remember:
THE MARKET AND STOCKS CONTINUE IN THE DIRECTION THEY ARE GOING…… UNTIL THEY DON’T.
MARKET DIAGNOSIS: “UPTREND”
What to do now:
BUY THE BEST STOCKS AS THEY BREAK OUT OF STRONG BASES or add-on buy points.
BUILD YOUR WATCH LIST of great stocks near buy points
WATCH YOUR INVESTMENTS CLOSELY:
DON’T LOSE YOUR GAINS: Sell any stock that is showing a concentration of distribution days. Or breaking below your stop.
If you need cash for a hot new breakout, consider selling a
stock that you bought but hasn’t taken off. It might be languishing near the buy point or it might have already round tripped – risen from a good buy point and bombed back to or below the buy price.

EXPLANATION OF TERMS FOR THE
MARKET ACTION OVER THE LAST 20 DAYS Four weeks of price and volume action reveal much about the direction of the market and
the strength of that movement. Price Volume
Healthy Uptrend Price-Volume
Movement
Strong Action Up Up
Weaker Action Down Down
Healthy Downtrend Price-Volume-
Movement
Strong Action Down Up
Weaker Action Up Down
The chart below identifies the market direction indicated by the Nasdaq’s price and volume action for the last 20 days at two levels of significance.
ACCUMULATION/DISTRIBUTION COLUMN - TELLS YOU WHERE THE BIG MONEY IS GOING
The listing includes: the date, Nasdaq closing price and percent change of the Nasdaq price and volume.
The next column identifies days that were Major Accumulation (serious UPTREND indicator) or Major Distribution (serious Downtrend indicator) using the 1% minimum rise or fall with higher volume.
Minor accumulation and minor distribution days are also identified – days that moved 0.2% or more but less than 1%.
“CONSISTENT WITH”– THE SUBTLE, BUT TELLING MOVES
The last column is a UPTREND /Downtrend indicator.
Think of a healthy Uptrend. It will have many days where the index rises with increased volume as institutions buy as much as they can at today’s low prices But even in the most robust Uptrend, not every day will be up. In any Uptrend, there will be some down days. If they have higher volume, then the day becomes a distribution day but if the volume is lighter (as frequently happens in an Uptrend), then the down day is NOT a distribution day. In fact, a drop on lighter volume says the market is NOT selling off heavily – good news and consistent with the Uptrend. Using the Healthy UPTREND/DOWNTREND price and volume movement listed above.
For example, if the Nasdaq’s closing price rose 0.7% and the volume rose 2%, the day is “consistent with” the price-volume action of a Healthy UPTREND.
If the price drops 0.5% and the volume rises 1.2% (down and up), that movement is “consistent with” the price-volume action of a Healthy Downtrend as indicated in the table above.
Any index change less than + or – 0.2% or volume change less than + or – 0.2% has no “consistent with” notation. Price and volume movements that small is not “significant” – not strong enough to tell us about the market movement.

MARKET ACTION (Nasdaq) OVER THE LAST 20 DAYS (For a full explanation of the terms in this table see end of this newsletter)
# Date Close Index % Change
Volume % Change
Current Trend Day
Count
Type of Day Accumulation, Distribution or Neither (—)
CONSISTENT WITH: UPTREND or Downtrend?
MARKET IN UPTREND
20 3/27/17 801.37 +0.20% -9.9% 186 — DOWNTREND
19 3/28/17 5875.14 +0.6% +6.6% 187 Minor accumulation Day UPTREND
18 3/29/17 5897.55 +0.4% -4.1% 188 — DOWNTREND
17 3/30/17 5914.34 +0.3% +0.3% 189 Minor accumulation Day UPTREND
16 3/31/17 5911.74 -0.04% +9.0% 190 — —
15 4/3/17 5894.68 -0.3% -2.2% 191 — UPTREND
14 4/4/17 5989.61 +0.07% -8.1% 192 — —
13 4/5/17 5864.48 -0.6% +30.2% 193 Minor distribution day DOWNTREND
12 4/6/17 5878.00 +0.25% -16.4% 194 — DOWNTREND
11 4/7/17 5877.81 -0.02% -9.6% 195 — —
10 4/10/17 5880.93 +0.07% -3.1% 196 — —
9 4/11/17 5866.77 -0.24% +12.2% 197 Minor distribution day DOWNTREND
8 4/12/17 5836.16 -0.5% -8.8% 198 — UPTREND
7 4/13/17 5805.15 -0.5% -4.2% 199 — UPTREND
6 4/17/17 5856.79 +0.9% -14.5% 200 — DOWNTREND
5 4/18/17 5849.47 -0.12% +18.5% 201 — —
4 4/19/17 5863.34 +0.24% +10.0% 202 Minor accumulation Day UPTREND
3 4/20/17 5916.78 +0.9% -8.8% 203 — DOWNTREND
2 4/21/17 5910.52 -0.11% -1.9% 204 — —
1 4/24/17 5983.82 +1.2% +6.5% 205 Major Accumulation Day UPTREND
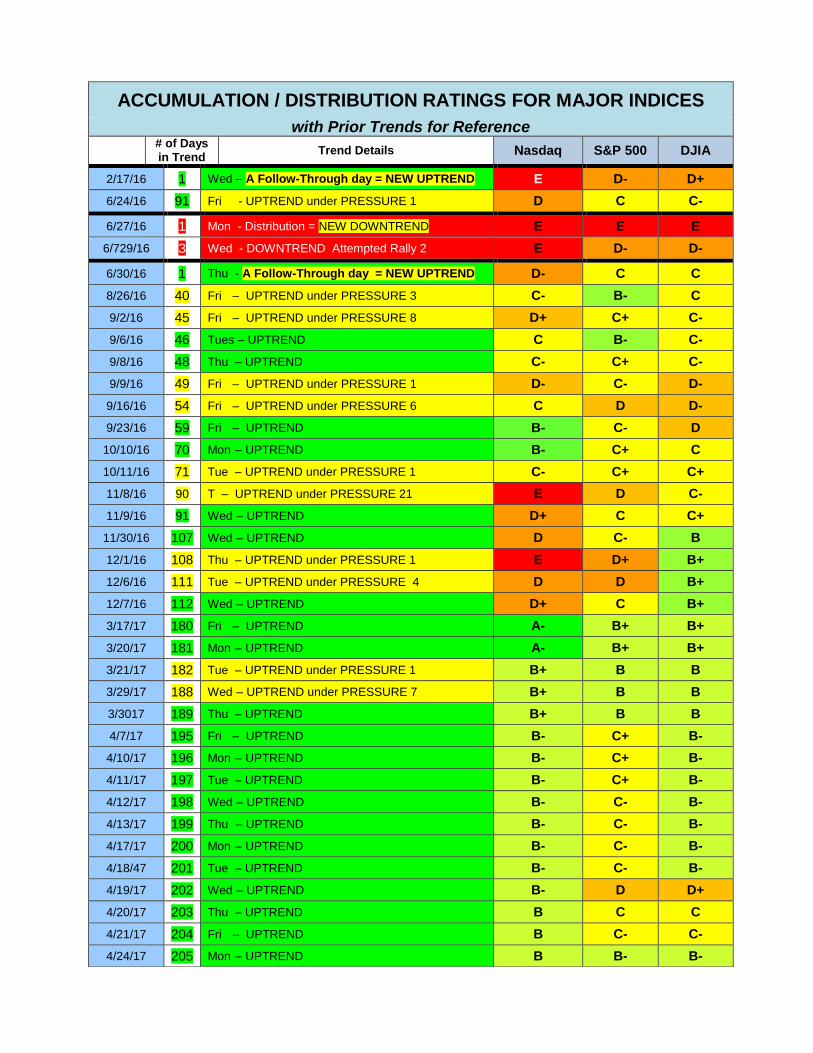
ACCUMULATION / DISTRIBUTION RATINGS FOR MAJOR INDICES
with Prior Trends for Reference
# of Days in Trend
Trend Details Nasdaq S&P 500 DJIA
2/17/16 1 Wed – A Follow-Through day = NEW UPTREND E D- D+
6/24/16 91 Fri - UPTREND under PRESSURE 1 D C C-
6/27/16 1 Mon - Distribution = NEW DOWNTREND E E E
6/729/16 3 Wed - DOWNTREND Attempted Rally 2 E D- D-
6/30/16 1 Thu - A Follow-Through day = NEW UPTREND D- C C
8/26/16 40 Fri – UPTREND under PRESSURE 3 C- B- C
9/2/16 45 Fri – UPTREND under PRESSURE 8 D+ C+ C-
9/6/16 46 Tues – UPTREND C B- C-
9/8/16 48 Thu – UPTREND C- C+ C-
9/9/16 49 Fri – UPTREND under PRESSURE 1 D- C- D-
9/16/16 54 Fri – UPTREND under PRESSURE 6 C D D-
9/23/16 59 Fri – UPTREND B- C- D
10/10/16 70 Mon – UPTREND B- C+ C
10/11/16 71 Tue – UPTREND under PRESSURE 1 C- C+ C+
11/8/16 90 T – UPTREND under PRESSURE 21 E D C-
11/9/16 91 Wed – UPTREND D+ C C+
11/30/16 107 Wed – UPTREND D C- B
12/1/16 108 Thu – UPTREND under PRESSURE 1 E D+ B+
12/6/16 111 Tue – UPTREND under PRESSURE 4 D D B+
12/7/16 112 Wed – UPTREND D+ C B+
3/17/17 180 Fri – UPTREND A- B+ B+
3/20/17 181 Mon – UPTREND A- B+ B+
3/21/17 182 Tue – UPTREND under PRESSURE 1 B+ B B
3/29/17 188 Wed – UPTREND under PRESSURE 7 B+ B B
3/3017 189 Thu – UPTREND B+ B B
4/7/17 195 Fri – UPTREND B- C+ B-
4/10/17 196 Mon – UPTREND B- C+ B-
4/11/17 197 Tue – UPTREND B- C+ B-
4/12/17 198 Wed – UPTREND B- C- B-
4/13/17 199 Thu – UPTREND B- C- B-
4/17/17 200 Mon – UPTREND B- C- B-
4/18/47 201 Tue – UPTREND B- C- B-
4/19/17 202 Wed – UPTREND B- D D+
4/20/17 203 Thu – UPTREND B C C
4/21/17 204 Fri – UPTREND B C- C-
4/24/17 205 Mon – UPTREND B B- B-

Wishing you "Many Happy Returns," Charlotte Hudgin, 214-995-6702, Editor, the Armchair Investor
DISCLAIMER, “Buyer Beware” WARNING: This newsletter shares the ideas I use in my investing. It is not investing advice but should be taken as education only. Your investment decisions are your responsibility as are the results. If you are not comfortable with or do not understand a strategy completely, I recommend that you paper-trade until you are successful and can sleep at night. Questions may be submitted to [email protected] Some of your questions will be used in future newsletters.
Armchair Investor, P.O. Box 671146, Dallas, TX 75367, USA
Additional notes follow:
ARMCHAIR INVESTOR WEEKLY CLASS SCHEDULE
Join us for the ARMCHAIR INVESTOR classes. Be my guest (FREE) if you have not visited in the last six months (guest seating limited). The 2017 ARMCHAIR INVESTOR classes schedule (please verify with Charlotte): Monday 7:00 – 9:00 p.m. Barnes & Noble at Royal & Preston (northwest corner), 5959 Royal
Ln, Dallas 75230 Tuesdays 4:00 – 6:00 p.m. Barnes & Noble at Royal & Preston (northwest corner), 5959 Royal
Ln, Dallas 75230 Wednesday 10:00 am – noon, Barnes & Noble, on Beltline just east of Montfort,5301 Beltline Rd,
Dallas 75254 (in Addison with Dallas mailing address).
Guest attendance is limited to ensure class members get their full value. -
Be sure to call to confirm we are having a class and to reserve your spot.
Call or text me at 214-995-6702 to schedule your FREE visit (new visitors only) to an ARMCHAIR INVESTOR class.
TO REGISTER FOR THE COMPREHENSIVE, SINGLE SUBJECT ARMCHAIR INVESTOR WORKSHOPS
OR TO VISIT AN ARMCHAIR INVESTOR CLASS:
CALL OR TEXT CHARLOTTE HUDGIN AT 214-995-6702

EXAMPLE OF ACCUMULATION AND DISTRIBUTION WITH
EXPANDED EXPLANATION OF TERMS:
Today’s Market Action with explanation
2/5/16 Index Close
Index % Change
Volume % Change
Volume vs 50-day Avg
Accumulation or Distribution Day?
Current Trend: DOWNTREND
Began 1/4/2015
Nasdaq 4363.14 -3.2% +13.8% +21.8% Major Distribution +11.3%
S&P500 1879.92 -1.9% NYSE Volume
Neither +6.6%
-5.3% +15.0%
NYSE
9,390.33 -1.5% Neither +6.2%
DJIA 16,204.62 -1.3% Neither +5.5%
A Major Accumulation Day: Price RISES 1.0% or more and higher Volume than the day before A Minor accumulation Day: Price RISES 0.2% or more and Volume is strong (either higher volume or is well-above average volume)
A Major Distribution Day: Price FALLS 1.0% or more and higher Volume than the day before. A Minor distribution Day: Price FALLS 0.2% or more, Volume is strong (either higher volume or is well-above average volume) A Stalling minor distribution Day: Only in an up-trending index or stock, price is FLAT or DOWN slightly compared to the day before, closing in the bottom half of the day’s range and volume is heavier or about equal to the day before or strong compared to the past market. It’s the price closing low in the day’s range after an uptrend that is the key for this designation. Price close to flat and higher or consistent volume indicates the big money (institutions: mutual funds, banks, etc.) are gently selling, trying to sneak out so you won’t notice.
** The “CURRENT TREND” column calculates how far each index has moved in the current trend assuming you purchased the index (which is not buyable) at the opening price on the day after the trend
change signal.
When this column is GREEN, the index has moved in the direction of the market trend.
HOWEVER, when this column is RED, the index change has fallen into negative territory (which could be a rise during a Downtrend)
An ACCUMULATION day points at heavy buying by institutional money managers - the mutual funds, pension funds, banks, etc. A DISTRIBUTION day points at heavy selling by institutional money managers. –