arlene b. inocencio et al. - philippine institute for ... · executive summary ... laguna...
TRANSCRIPT

For comments, suggestions or further inquiries please contact:
Philippine Institute for Development StudiesSurian sa mga Pag-aaral Pangkaunlaran ng Pilipinas
The PIDS Discussion Paper Seriesconstitutes studies that are preliminary andsubject to further revisions. They are be-ing circulated in a limited number of cop-ies only for purposes of soliciting com-ments and suggestions for further refine-ments. The studies under the Series areunedited and unreviewed.
The views and opinions expressedare those of the author(s) and do not neces-sarily reflect those of the Institute.
Not for quotation without permissionfrom the author(s) and the Institute.
The Research Information Staff, Philippine Institute for Development Studies18th Floor, Three Cyberpod Centris - North Tower, EDSA corner Quezon Avenue, 1100 Quezon City, PhilippinesTelephone Numbers: (63-2) 3721291 and 3721292; E-mail: [email protected]
Or visit our website at http://www.pids.gov.ph
April 2016
DISCUSSION PAPER SERIES NO. 2016-12
Technical and Institutional Evaluationof Selected National and Communal
Irrigation Systems and Characterizationof Irrigation Sector Governance Structure
Arlene B. Inocencio et al.

Technical and Institutional Evaluation
of Selected National and Communal
Irrigation Systems and
Characterization of Irrigation Sector
Governance Structure: Integrative
Chapter
Final Report
Arlene B. Inocencio(Principal Investigator) together with Carl Ureta, Alex Baulita and Arman Baulita With inputs from NIS & CIS Technical Studies Proponents -- Roberto Clemente for NIS component and Roger Luyun and Dulce Elazegui for CIS component

1
Contents LIST OF TABLES .......................................................................................................................... 3
LIST OF FIGURES ........................................................................................................................ 8 EXECUTIVE SUMMARY .......................................................................................................... 11
Key Findings ............................................................................................................................. 11 Recommendations ..................................................................................................................... 16
INTRODUCTION ........................................................................................................................ 19
OBJECTIVES ............................................................................................................................... 20 FRAMEWORK OF ANALYSIS AND METHODOLOGY ........................................................ 21
Scope of the Study .................................................................................................................... 23 Data Collection ......................................................................................................................... 24 Data Analysis ............................................................................................................................ 25
TRENDS IN NATIONAL IRRIGATION INVESTMENTS AND PERFORMANCE ............... 27
NIS REGIONAL TRENDS AND SYSTEM PERFORMANCE ................................................. 35
Region 1 – Ilocos ...................................................................................................................... 42 Bonga 2 Pump Irrigation System .......................................................................................... 42 Madongan ............................................................................................................................. 42 Nueva Era.............................................................................................................................. 50
Banaoang............................................................................................................................... 50 Ambayoan-Dipalo ................................................................................................................. 53
Region 2 Cagayan Valley ......................................................................................................... 53 Magapit Pump Irrigation System (PIS)................................................................................. 53 Visitacion Irrigation System ................................................................................................. 59
Solana-Tuguegarao Pump Irrigation System ........................................................................ 62 Magat River Integrated Irrigation System (MRIIS) Division 2 ............................................ 62
Magat River Integrated Irrigation System (MRIIS) Division 4 ........................................... 69
Region 3 Central Luzon ............................................................................................................ 73
Angat-Maasim River Irrigation System (AMRIS) ............................................................... 73 Pampanga Delta River Irrigation System (PDRIS) .............................................................. 73
Tarlac Groundwater Irrigation System (TGIS) ..................................................................... 80 Tarlac-San-Miguel O’Donell River Irrigation System (TASMORIS) ................................. 80 Upper Pampanga River Integrated Irrigation System (UPRIIS), Division 2 ........................ 84
Upper Pampanga River Integrated Irrigation System (UPRIIS), Division 3 ........................ 84 Upper Pampanga River Integrated Irrigation System (UPRIIS), Division 4 ........................ 91
Region 4A CALABARZON ..................................................................................................... 91 Cavite Friar Lands (Balayungan RIS) ................................................................................... 91
Dumacaa-Hanagdong-Lagnas ............................................................................................... 98 Region 4B MIMAROPA ........................................................................................................ 102
Caguray RIS ........................................................................................................................ 102 Region 5 Bicol ........................................................................................................................ 106
Libmanan-Cabusao ............................................................................................................. 106 ANALYSIS AND CHARACTERIZATION OF THE SAMPLE NIS....................................... 110
By Province ............................................................................................................................. 110
By Size .................................................................................................................................... 131 By Technology ........................................................................................................................ 142
2
By Location ............................................................................................................................. 154 By Vintage .............................................................................................................................. 168 By “Success” ........................................................................................................................... 180 Technical and Institutional Issues and Concerns across the 22 Sample NIS .......................... 191
Overall Irrigation Performance Assessment ....................................................................... 191 COMMUNAL IRRIGATION SYSTEM PROVINCIAL OR IMO TRENDS........................... 196
CAR ........................................................................................................................................ 208 Benguet (part of Abra, Benguet-Ifugao-Mt. Province IMO) ............................................. 208
Region 1 Ilocos ....................................................................................................................... 210
Ilocos Norte IMO ................................................................................................................ 210 Pangasinan IMO.................................................................................................................. 212
Region 2 Cagayan Valley ....................................................................................................... 215 Cagayan (Cagayan-Batanes IMO) ...................................................................................... 215 Isabela IMO ........................................................................................................................ 217
Nueva Vizcaya IMO ........................................................................................................... 219
Region 3 Central Luzon .......................................................................................................... 221 Pampanga (Pampanga-Bataan IMO) .................................................................................. 221
Nueva Ecija (Bulacan-Aurora-Nueva Ecija IMO) .............................................................. 223 Region 4A CALABARZON ................................................................................................... 225
Laguna (Laguna-Rizal IMO) .............................................................................................. 225
Region 4B MIMAROPA ........................................................................................................ 228 Occidental Mindoro IMO ................................................................................................... 228
Region 5 BICOL ..................................................................................................................... 231 Camarines Sur IMO ............................................................................................................ 231
CHARACTERIZING THE SAMPLE CIS ................................................................................. 235
By province ............................................................................................................................. 235
By size of system .................................................................................................................... 243
By technology ......................................................................................................................... 249 By “success” ........................................................................................................................... 255
Technical Assessment ............................................................................................................. 261 CONCLUSIONS......................................................................................................................... 269 RECOMMENDATIONS ............................................................................................................ 273
REFERENCES ........................................................................................................................... 277 ANNEX 1. SAMPLE NIS KEY INFORMANT INTERVIEWS ............................................... 279
Ilocos Norte Irrigation System (Nueva Era, Bonga 2) ............................................................ 279 Banaoang Pump Irrigation System ......................................................................................... 281 Ambayoan-Dipalo River Irrigation System (2 NIS) ............................................................... 283
Magat River Integrated Irrigation System (Div II & Div IV) ................................................. 285 Solana Pump Irrigation System .............................................................................................. 287
Magapit Pump Irrigation System ............................................................................................ 288 Visitacion Irrigation System ................................................................................................... 290
Pampanga Delta River Irrigation System ............................................................................... 292 Tarlac Groundwater Irrigation System (TGIS) ....................................................................... 294 Tarlac-San Miguel-O'Donnel River Irrigation System (TASMORIS – 2 NIS) ...................... 296 Upper Pampanga River Integrated Irrigation System (Div II, Div III, Div IV) ..................... 297

3
Angat-Maasim River Irrigation System .................................................................................. 300 Balayungan RIS ...................................................................................................................... 301 Caguray Irrigation System ...................................................................................................... 302 Libmanan-Cabusao Pump Irrigation System .......................................................................... 304
ANNEX 2. SAMPLE CIS IN SELECTED IMO/PROVINCES KEY INFORMANT
INTERVIEWS ............................................................................................................................ 305 Benguet (Kalinga-Ifugao-Mt Province IMO) ......................................................................... 305 Ilocos Norte IMO .................................................................................................................... 309 Pangasinan IMO...................................................................................................................... 312
Cagayan (Cagayan-Batanes IMO) .......................................................................................... 316 Isabela IMO ............................................................................................................................ 320 Nueva Vizcaya IMO ............................................................................................................... 323 Pampanga (Pampanga-Bataan IMO) ...................................................................................... 327 Nueva Ecija (Bulacan-Aurora-Nueva Ecija IMO) .................................................................. 330
Laguna (Laguna-Rizal IMO) .................................................................................................. 333
Occidental Mindoro IMO ....................................................................................................... 336 Camarines Sur IMO ................................................................................................................ 339
LIST OF TABLES
Table 1. Budget appropriation by the Department of Agriculture
Table 2. Performance Ratios of NIS Philippines, 1965 – 2013
Table 3. Performance Ratios of Bonga 2, 1966 – 2013
Table 4. Performance Ratios of Madongan, 2001 – 2013
Table 5. Performance Ratios of Nueva Era, 2001 – 2013
Table 6. Performance Ratios of Banaoang, 2002 – 2013
Table 7. Performance Ratios of Ambayoan-Dipalo, 1983 – 2013
Table 8. Performance Ratios of Magapit, 1986 – 2013
Table 9. Performance Ratios of Visitacion, 2001 – 2013
Table 10. Performance Ratios of Solana-Tuguegarao PIS, 1990 – 2013
Table 11. Performance Ratios of MRIIS 2, 1986 – 2013
Table 12. Performance Ratios of MRIIS 4, 1986 – 2013
Table 13. Performance Ratios of AMRIS, 1983 – 2013
Table 14. Performance Ratios of Pampanga Delta, 2003 – 2013
Table 15. Performance Ratios of TASMORIS, 1983 – 2013
Table 16. Performance Ratios of UPRIIS 2, 1984 – 2013
Table 17. Performance Ratios of UPRIIS 3, 1985 –2013
Table 18. Performance Ratios of UPRIIS 4, 1984 – 2013
Table 19. Performance Ratios of Cavite Friar Lands, 1983 – 2013
Table 20. Performance Ratios of Caguray, 1985 – 2013
Table 21. Performance Ratios of Dumacaa-Hanagdong-Lagnas, 1983 – 2013
Table 22. Performance Ratios of Libmanan-Cabusao, 1983 – 2013
Table 23.1. NIS IA Profile, Cropping Information and Financial Aspects by Province
Table 23.2. Problems/concerns of NIS IAs by Province

4
Table 23.3. NIA's NIS Functionality Survey rating, IA's own Financial Strength rating, Collection
Efficiency and IA's performance rating of ISF collection by Province
Table 23.4. NIS IA's Performance Ratings of their water distribution and delivery service by
Province
Table 23.5. NIS IA's rating of their ability to seek outside help by Province
Table 23.6. Assistance received by NIS IAs from Various Sources by Province
Table 23.7. Cropping problems of NIS IAs by Province
Table 23.8. Problems encountered by NIS IAs by Province
Table 23.9. Performance Rating of various functions of NIS IAs by Province
Table 23.10. NIS IA's Rating on Water Delivery Service and Water Distribution Policy by
Province
Table 23.11. Mode of irrigation scheduling and rating for effectiveness of accountability
provision among NIS IAs by Province
Table 23.12. Provisions in NIS IA policies holding IA officers/BOD accountable by Province
Table 23.13. Policies which are not adequately implemented by NIS IAs by Province
Table 23.14. Trainings attended by NIS IAs by Province
Table 23.15. Average participation to NIS-IA meetings of IA officers and BODs by Province
Table 23.16. Frequency of meeting of NIS-IA officers/BODs and members by Province
Table 23.17. Manner of choosing and term of office and forms of compensation of NIS-IA
officers/BOD by Province
Table 23.18. Respondents' rating on NIA's support to NIS IAs and modifications by NIS IAs to IS
by Province
Table 24.1. NIS IA Profile, Cropping Information and Financial Aspects by "Size"
Table 24.2. Problems/concerns of NIS IAs by "Size"
Table 24.3. NIA's NIS Functionality Survey rating, IA's own Financial Strength rating, Collection
Efficiency and IA's performance rating of ISF collection by "Size"
Table 24.4. NIS IA's Performance Ratings of their water distribution and delivery service by
"Size"
Table 24.5. NIS IA's rating of their ability to seek outside help by "Size"
Table 24.6. Assistance received by NIS IAs from Various Sources by "Size"
Table 24.7. Cropping problems of NIS IAs by "Size"
Table 24.8. Problems encountered by NIS IAs by "Size"
Table 24.9. Performance Rating of various functions of NIS IAs by "Size"
Table 24.10. NIS IA's Collection Rate by "Size"
Table 24.11. NIS IA's Rating on Water Delivery Service and Water Distribution Policy by "Size"
Table 24.12. Mode of irrigation scheduling and rating for effectiveness of accountability
provision among NIS IAs by "Size"
Table 24.13. Provisions in NIS IA policies holding IA officers/BOD accountable by "Size"
Table 24.14. Policies which are not adequately implemented by NIS IAs by "Size"
Table 24.15. Trainings attended by NIS IAs by "Size"
Table 24.16. Average participation to NIS-IA meetings of IA officers and BODs by "Size"
Table 24.17. Frequency of meeting of NIS-IA officers/BODs and members by "Size"
Table 24.18. Manner of choosing and term of office and forms of compensation of NIS-IA
officers/BOD by "Size"

5
Table 24.19. Respondents' rating on NIA's support to NIS IAs and modifications by NIS IAs to IS
by "Size"
Table 25.1. NIS IA Profile, Cropping Information and Financial Aspects by "Technology"
Table 25.2. Problems/concerns of NIS IAs by "Technology"
Table 25.3. NIA's Functionality Survey rating, IA's own Financial Strength rating, Collection
Efficiency and IA's performance rating of ISF collection by "Technology"
Table 25.4. NIS IA's Performance Ratings of their water distribution and delivery service by
"Technology"
Table 25.5. NIS IA's rating of their ability to seek outside help by "Technology"
Table 25.6. Assistance received by NIS IAs from Various Sources by "Technology"
Table 25.7. Cropping problems of NIS IAs by "Technology"
Table 25.8. Problems encountered by NIS IAs by "Technology"
Table 25.9. Performance Rating of various functions of NIS IAs by "Technology"
Table 25.10. NIS IA's Collection Rate by "Technology"
Table 25.11. NIS IA's Rating on Water Delivery Service and Water Distribution Policy by
"Technology"
Table 25.12. Mode of irrigation scheduling and rating for effectiveness of accountability
provision among NIS IAs by "Technology"
Table 25.13. Provisions in NIS IA policies holding IA officers/BOD accountable by
"Technology"
Table 25.14. Policies which are not adequately implemented by NIS IAs by "Technology"
Table 25.15. Trainings attended by NIS IAs by "Technology"
Table 25.16. Average participation to NIS-IA meetings of IA officers and BODs by "Technology"
Table 25.17. Frequency of meeting of NIS-IA officers/BODs and members by "Technology"
Table 25.18. Manner of choosing and term of office and forms of compensation of NIS-IA
officers/BOD by "Technology"
Table 25.19. Respondents' rating on NIA's support to NIS IAs and modifications by NIS IAs to IS
by "Technology"
Table 26.1. NIS IA Profile, Cropping Information and Financial Aspects by "Location"
Table 26.2. Problems/concerns of NIS IAs by "Location"
Table 26.3. NIA's NIS Functionality Survey rating, IA's own Financial Strength rating, Collection
Efficiency and IA's performance rating of ISF collection by "Location"
Table 26.4. NIS IA's Performance Ratings of their water distribution and delivery service by
"Location"
Table 26.5. NIS IA's rating of their ability to seek outside help by "Location"
Table 26.6. Assistance received by NIS IAs from Various Sources by "Location"
Table 26.7. Cropping problems of NIS IAs by "Location"
Table 26.8. Problems encountered by NIS IAs by "Location"
Table 26.9. Performance Rating of various functions of NIS IAs by "Location"
Table 26.10. NIS IA's Collection Rate by "Location"
Table 26.11. NIS IA's Rating on Water Delivery Service and Water Distribution Policy by
"Location"
Table 26.12. Mode of irrigation scheduling and rating for effectiveness of accountability
provision among NIS IAs by "Location"
Table 26.13. Provisions in NIS IA policies holding IA officers/BOD accountable by "Location"

6
Table 26.14. Policies which are not adequately implemented by NIS IAs by "Location"
Table 26.15. Trainings attended by NIS IAs by "Location"
Table 26.16. Average participation to NIS-IA meetings of IA officers and BODs by "Location"
Table 26.17. Frequency of meeting of NIS-IA officers/BODs and members by "Location"
Table 26.18. Manner of choosing and term of office and forms of compensation of NIS-IA
officers/BOD by "Location"
Table 26.19. Respondents' rating on NIA's support to NIS IAs and modifications by NIS IAs to IS
by "Location"
Table 27.1. NIS IA Profile, Cropping Information and Financial Aspects by "Vintage"
Table 27.2. Problems/concerns of NIS IAs by "Vintage"
Table 27.3. NIA's NIS Functionality Survey rating, IA's own Financial Strength rating, Collection
Efficiency and IA's performance rating of ISF collection by "Vintage"
Table 27.4. NIS IA's Performance Ratings of their water distribution and delivery service by
"Vintage"
Table 27.5. NIS IA's rating of their ability to seek outside help by "Vintage"
Table 27.6. Assistance received by NIS IAs from Various Sources by "Vintage"
Table 27.7. Cropping problems of NIS IAs by "Vintage"
Table 27.8. Problems encountered by NIS IAs by "Vintage"
Table 27.9. Performance Rating of various functions of NIS IAs by "Vintage"
Table 27.10. NIS IA's Collection Rate by "Vintage"
Table 27.11. NIS IA's Rating on Water Delivery Service and Water Distribution Policy by
"Vintage"
Table 27.12. Mode of irrigation scheduling and rating for effectiveness of accountability
provision among NIS IAs by "Vintage"
Table 27.13. Provisions in NIS IA policies holding IA officers/BOD accountable by "Vintage"
Table 27.14. Policies which are not adequately implemented by NIS IAs by "Vintage"
Table 27.15. Trainings attended by NIS IAs by "Vintage"
Table 27.16. Average participation to NIS-IA meetings of IA officers and BODs by "Vintage"
Table 27.17. Frequency of meeting of NIS-IA officers/BODs and members by "Vintage"
Table 27.18. Manner of choosing and term of office and forms of compensation of NIS-IA
officers/BOD by "Vintage"
Table 27.19. Respondents' rating on NIA's support to NIS IAs and modifications by NIS IAs to IS
by "Vintage"
Table 28.1. NIS IA Profile, Cropping Information and Financial Aspects by "Success"
Table 28.2. Problems/concerns of NIS IAs by "Success"
Table 28.3. NIA's NIS Functionality Survey rating, IA's own Financial Strength rating, Collection
Efficiency and IA's performance rating of ISF collection by "Success"
Table 28.4. NIS IA's Performance Ratings of their water distribution and delivery service by
"Success"
Table 28.5. NIS IA's rating of their ability to seek outside help by "Success"
Table 28.6. Assistance received by NIS IAs from Various Sources by "Success"
Table 28.7. Cropping problems of NIS IAs by "Success"
Table 28.8. Problems encountered by NIS IAs by "Success"
Table 28.9. Performance Rating of various functions of NIS IAs by "Success"
Table 28.10. NIS IA's Collection Rate by "Success"

7
Table 28.11. NIS IA's Rating on Water Delivery Service and Water Distribution Policy by
"Success"
Table 28.12. Mode of irrigation scheduling and rating for effectiveness of accountability
provision among NIS IAs by "Success"
Table 28.13. Provisions in NIS IA policies holding IA officers/BOD accountable by "Success"
Table 28.14. Policies which are not adequately implemented by NIS IAs by "Success"
Table 28.15. Trainings attended by NIS IAs by "Success"
Table 28.16. Average participation to NIS-IA meetings of IA officers and BODs by "Success"
Table 28.17. Frequency of meeting of NIS-IA officers/BODs and members by "Success"
Table 28.18. Manner of choosing and term of office and forms of compensation of NIS-IA
officers/BOD by "Success"
Table 28.19. Respondents' rating on NIA's support to NIS IAs and modifications by NIS IAs to IS
by "Success"
Table 29 Summary of Observation for each NIS
Table 30. Summary of Problems Encountered by the Sampled 21 Luzon NIS, 2015
Table 31.1 Summary of IA responses and rating to technical, institutional, organizational,
economic and financial inquiries
Table 32. CIS Performance Ratios of National, 2005 to 2013
Table 33. CIS Performance Ratios of Benguet, 2005 to 2013
Table 34. CIS Performance Ratios of Ilocos Norte IMO, 2005 to 2013
Table 35. CIS Performance Ratios of Pangasinan IMO, 2005 to 2013
Table 36. CIS Performance Ratios of Cagayan(Cagayan-Batanes IMO), 2005 to2013
Table 37. CIS Performance Ratios of Isabela IMO, 2005 to2013
Table 38. CIS Performance Ratios of Nueva Vizcaya IMO, 2005 to2013
Table 39. CIS Performance Ratios of Pampanga (PAMBAT IMO), 2005 to 2013
Table 40. CIS Performance Ratios of Nueva Ecija (BANE IMO), 2005 to2013
Table 41. CIS Performance Ratios of Laguna (Laguna-Rizal IMO), 2005 to 2013
Table 42. CIS Performance Ratios of Occidental Mindoro IMO, 2005 to2013
Table 43. CIS Performance Ratios of Camarines Sur IMO, 2005 to2013
Table 44.1. CIS IA Profile, Cropping Information and Financial Aspects by Province
Table 44.2. Problems/concerns of CIS IAs by Province
Table 44.3. NIA's CIS Functionality Survey rating, IA's own Financial Strength rating, IA's
performance rating of ISF collection and Collection Efficiency by Province
Table 44.4. CIS IA's Performance Ratings of their water distribution and delivery service by
Province
Table 44.5 CIS IA's Average SA, Converted Area, Permanently Non-Restorable Area, FUSA,
Operational & Non-operational SA by Province
Table 44.6 CIS IA's Average Irrigated and Benefited Area by Province
Table 44.7 CIS IA's Average Cropping Intensities, Average Yield and Farmer Beneficiaries by
Province
Table 45.1. CIS IA Profile, Cropping Information and Financial Aspects by "Size"
Table 45.2. Problems/concerns of CIS IAs by "Size"
Table 45.3. NIA's CIS Functionality Survey rating, IA's own Financial Strength rating, IA's
performance rating of ISF collection and Collection Efficiency by "Size"

8
Table 45.4. CIS IA's Performance Ratings of their water distribution and delivery service by
"Size"
Table 45.5 CIS IA's Average SA, Converted Area, Permanently Non-Restorable Area, FUSA,
Operational & Non-operational SA by "Size"
Table 45.6 CIS IA's Average Irrigated and Benefited Area by "Size"
Table 45.7 CIS IA's Average Cropping Intensities, Average Yield and Farmer Beneficiaries by
"Size"
Table 46.1. CIS IA Profile, Cropping Information and Financial Aspects by "Technology"
Table 46.2. Problems/concerns of CIS IAs by "Technology"
Table 46.3. NIA's CIS Functionality Survey rating, IA's own Financial Strength rating, IA's
performance rating of ISF collection and Collection Efficiency by "Technology"
Table 46.4. CIS IA's Performance Ratings of their water distribution and delivery service by
"Technology"
Table 46.5 CIS IA's Average SA, Converted Area, Permanently Non-Restorable Area, FUSA,
Operational & Non-operational SA by "Technology"
Table 46.6 CIS IA's Average Irrigated and Benefited Area by "Technology"
Table 46.7 CIS IA's Average Cropping Intensities, Average Yield and Farmer Beneficiaries by
"Technology"
Table 47.1. CIS IA Profile, Cropping Information and Financial Aspects by "Success"
Table 47.2. Problems/concerns of CIS IAs by "Success"
Table 47.3. NIA's CIS Functionality Survey rating, IA's own Financial Strength rating, IA's
performance rating of ISF collection and Collection Efficiency by "Success"
Table 47.4. CIS IA's Performance Ratings of their water distribution and delivery service by
"Success"
Table 47.5 CIS IA's Average SA, Converted Area, Permanently Non-Restorable Area, FUSA,
Operational & Non-operational SA by "Success"
Table 47.6 CIS IA's Average Irrigated and Benefited Area by "Success"
Table 47.7 CIS IA's Average Cropping Intensities, Average Yield and Farmer Beneficiaries by
"Success"
Table 48. Summary of Observation for each CIS
Table 49. Summary of Problems Encountered by the 66 Sample CIS in Luzon, 2015
Table 50.1. Deployment of Institutional Development Officers to communal irrigation systems in
11 selected Irrigation Management Offices.
Table 50.2. Source of funding of communal irrigation systems, 2014.
Table 50.3. Cost payment schemes of irrigators associations in the 11 sample Irrigation
Management Offices, 2014.
Table 50.4. Problems/issues and suggestions to address their concerns by the sample irrigators
associations in 11 selected provinces.
LIST OF FIGURES
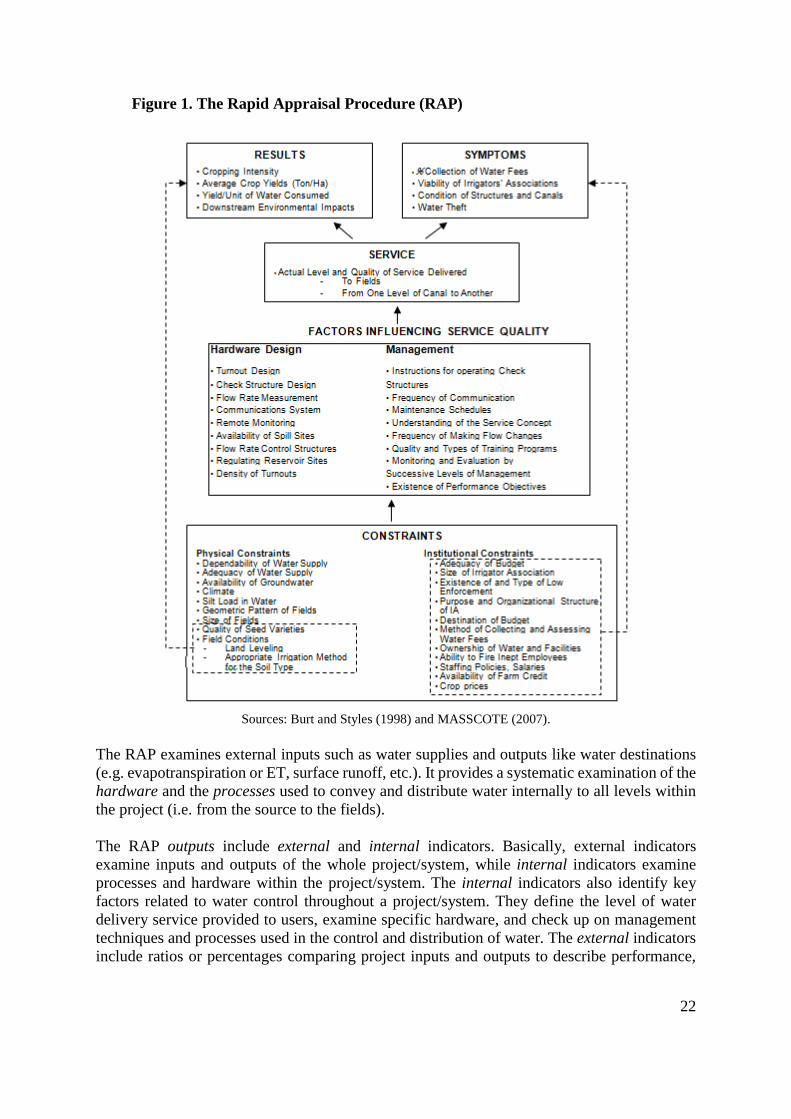
Figure 1. The Rapid Appraisal Procedure (RAP)
Figure 2. Irrigation investment trends for national and communal irrigation systems, 1965-2012
Figure 3. Trends in irrigation investments by source of funding, 1965-2012

9
Figure 4. Trends in irrigation investments by purpose, 1965-2012
Figure 5. Trends in NIA NIS, CIS & Pump service areas, Actual NIS irrigated area (wet season),
and the BAS-PSA estimates of irrigated rice crop area (second semester), 1964-2012
(000 has).
Figure 6. Trends in Irrigation Intensity in NIS and CIS, Philippines, 1965-2013
Figure 7. Trends in Collection Efficiency in NIS and CIS, Philippines, 1965-2013
Figure 8. Trends in the actual cost of operation and maintenance (O&M) of service area
compared to recommended levels and to irrigation service fee collections of national
irrigation systems at 2000 prices.
Figure 9. Trends in key performance indicators, Philippines, 1965-2013
Figure 10. Trends in the service area of NIS by scheme type and by region, 1967-2013 (‘000 ha)
Figure 11.Trends in the real O&M, O&M/SA and O&M/FUSA in national irrigation systems by
region, 1985-2013 (at 2000 prices).
Figure 12. Trends in irrigation intensities in national irrigation systems by region, 1967-2013.
Figure 13. Trends in collection efficiency in national irrigation systems by region, 1967-2013.
Figure 14. Trends in key performance indicators, Bonga 2, Ilocos Norte Irrigation System,
Region 1, 1965-2013
Figure 15. Trends in key performance indicators, Madongan, Ilocos Norte Irrigation System,
Region 1, 1965-2013
Figure 16. Trends in key performance indicators, Nueva Era, Ilocos Norte Irrigation System,
Region 1, 1965-2013
Figure 17. Trends in key performance indicators, Banaoang PIP, Ilocos Sur, Region 1, 1965-
2013
Figure 18. Trends in key performance indicators, Ambayoan-Dipalo RC, Pangasinan, Region 1,
1965-2013
Figure 19. Trends in key performance indicators, Magapit PIS, Cagayan, Region 2, 1965-2013
Figure 20. Trends in key performance indicators, Visitacion RIS, Cagayan, Region 2, 1965-2013
Figure 21. Trends in key performance indicators, Solana-Tuguegarao, Cagayan, Region 2, 1965-
2013
Figure 22. Trends in key performance indicators, MRIIS 2, Isabela, Region 2, 1965-2013
Figure 23. Trends in key performance indicators, MRIIS 4, Isabela, Region 2, 1965-2013
Figure 24. Trends in key performance indicators, Angat-Maasim RC, Bulacan, Region 3, 1965-
2013
Figure 25. Trends in key performance indicators, Pampanga Delta RIS, Pampanga, Region 3,
1965-2013
Figure 26. Trends in key performance indicators, TASMORIS, Tarlac, Region 3, 1965-2013
Figure 27. Trends in key performance indicators, UPRIIS 2, Nueva Ecija, Region 3, 1965-2013
Figure 28. Trends in key performance indicators, UPRIIS 3, Nueva Ecija, Region 3, 1965-2013
Figure 29. Trends in key performance indicators, UPRIIS 4, Nueva Ecija, Region 3, 1965-2013
Figure 30. Trends in key performance indicators, Cavite FLIS, Cavite, Region 4, 1965-2013
Figure 31. Trends in key performance indicators, Caguray RIS, Occidental Mindoro, Region 4,
1965-2013
Figure 32. Trends in key performance indicators, Dumacaa-Hanagdong-Lagnas RC, Laguna,
Region 4, 1965-2013

10
Figure 33. Trends in key performance indicators, Libmanan-Cabusao PIS, Camarines Sur,
Region 5, 1965-2013
Figure 34. Trends in key performance indicators of CIS, Philippines, 2005-2013
Figure 35. Trends in O&M, Amort. Collectible and Amortization Collected, CIS, Philippines,
2005-2013
Figure 36. Trends in the service area of CIS by region, 2005-2013 (‘000 ha)
Figure 37. Trends in the service area of CIS by IMO-Province, 2005-2013 (‘000 ha)
Figure 38. Trends in the real O&M, O&M/SA and O&M/FUSA of CIS by region, 2005-2013 (at
2000 prices).
Figure 39. Trends in the real O&M, O&M/SA and O&M/FUSA of CIS by IMO-Province, 2005-
2013 (at 2000 prices).
Figure 40. Trends in irrigation intensities of CIS by region, 2005-2013.
Figure 41. Trends in irrigation intensities of CIS by IMO-Province, 2005-2013.
Figure 42. Trends in collection efficiency of CIS by region, 2005-2013.
Figure 43. Trends in collection efficiency of CIS by IMO-Province, 2005-2013.
Figure 44. Trends in key performance indicators, Benguet, CAR, 2005-2013
Figure 45. Trends in key performance indicators, Ilocos Norte IMO, Region 1, 2005-2013
Figure 46. Trends in key performance indicators, Pangasinan IMO, Region 1, 2005-2013
Figure 47. Trends in key performance indicators, Cagayan (Cagayan-Batanes IMO), Region 2,
2005-2013
Figure 48. Trends in key performance indicators, Isabela IMO, Region 2, 2005-2013
Figure 49. Trends in key performance indicators, Nueva Vizcaya IMO, Region 3, 2005-2013
Figure 50. Trends in key performance indicators, Pampanga (PAMBAT IMO), Region 3, 2005-
2013
Figure 51. Trends in key performance indicators, Nueva Ecija (BANE IMO), Region 3, 2005-
2013
Figure 52. Trends in key performance indicators, Laguna (Laguna-Rizal IMO), Region 4, 2005-
2013
Figure 53. Trends in key performance indicators, Occidental Mindoro IMO, Region 4, 2005-
2013
Figure 54. Trends in key performance indicators, Camarines Sur IMO, Region 5, 2005-2013

Abstract
This discussion paper presents an analysis of the performance of national (NIS) and communal
irrigation systems (CIS) by region, complemented by technical and institutional assessments of
30 sample NIS and 66 sample CIS in Luzon. It shows that there is value in looking at subnational
trends. Using secondary data from the central and regional offices of the National Irrigation
Administration and the systems, complemented by key informant interviews and ocular
inspections, this study establishes key institutional and technical constraints to improving
performance of NIS and CIS systems.
In addition to the selected key performance indicators, some ratios are used to characterize the
capacities of the systems in terms of manpower, level of functionality, financial structure, and
productivity of the systems. This study examines the NIS cases by province, size (large, medium,
small), technology (gravity type vs pump type), location (upstream, midstream, downstream),
vintage (pre-NIA, 1965–1980, 1981–2013), and by some measures of “success” and presents a
number of instructive results.
Keywords: irrigation performance, management and development of irrigation systems,
irrigators’ association, Luzon
11
EXECUTIVE SUMMARY
This paper presents findings and some preliminary recommendations on irrigation related to
technical/physical and institutional aspects of irrigation management and development for both
national and communal systems.
Key Findings There is value in looking at sub-national trends given insights which cannot be inferred from
national trends. Using secondary data from the Central and regional offices of NIA and the
systems, complemented by key informant interviews and ocular inspections, this study establishes
key institutional and technical constraints to improving performance of both national and
communal irrigation systems.
Specifically, for national irrigation systems, we found the following:
National and regional trends in NIS
Service area growth has slowed down in the last decade and growth has been concentrated in
just four regions. Firmed up service area difference with service area indicate on average a
land conversion rate or declared permanently non-restorable area of about 10%. Most NIS
systems are diversion systems and the few operational pump systems available are in five
regions (Regions 1, 2, 3, 5 and 13).
Cropping intensity only slightly increased over the years. In fact wet season irrigation intensity
appears to have largely slowed down. In Luzon, some increases in dry season irrigation
intensities can be seen while wet season intensities appear to have stagnated. However, in
Mindanao, similar increasing patterns for both wet and dry seasons irrigation intensities are
observed.
Collection efficiency has only noticeably improved in two (the rest of Regions 2 and 4) regions
only in Luzon and in MRIIS and slightly in UPRIIS while worst in Region 6. The Mindanao
regions appear to have been performing better in terms of this indicator, consistent with the
corresponding improvements in cropping intensity. Aside from this, possibly other factors
maybe at play given the performance in Regions 2 and 11 and in MRIIS and higher cropping
intensities in the rest of Mindanao.
NIS Cases - Performance and Issues
Of the 21 NIS cases, six are from Ilocos, five from Cagayan (including 2 MRIIS), seven from
Region 3 (including 3 UPRIIS), three from Regions 4a and 4b, and one from Region 5. The
sample also included four pump systems.1 Except for UPRIIS and MRIIS, the rest of the
systems are diversion/gravity type.
1Part of UPRIIS and MRIIS systems are served by pumps.

12
The performance of the NIS cases are analyzed in terms of size of IAs (defined as large,
medium, small based on their FUSA), technology (diversion/gravity, pump, reservoir),
location (upstream, midstream, downstream of the main canals), vintage (before 1965, 1965-
80, 1981-2013), and by some measures of “success” which largely capture institutional and
financial/economic aspects of irrigation system management by IAs/NIA. “Success” is
measured similarly as NIA loosely defines it -- based on functionality ratings and active and
functional IA organization, high collection efficiency and payment of ISF to NIA. These
typologies capture various technical and institutional aspects of providing irrigation service by
national systems. Pump systems will have different challenges from reservoir and diversion
systems. Size of IAs based on firmed-up service area will likely be correlated with complexity
of design, and operation of physical structures and facilities, and the corresponding type of
management. Vintage entails different technical and institutional concerns between relatively
old vs. newer systems. “Successful" IAs entail institutional factors at play but also probably
technical aspects contributing to such performance.
The analysis according to size indicates that there is disparity between small and large IAs.
The small IAs reported the highest incidence of inadequate water during dry seasons, flooding
during wet season, high counts of canal problems especially lateral canals, and siltation/solid
waste problems. The large systems/IAs indicated adequate water supply, least occurrence of
siltation problems, lowest count of irrigation headwork and main canal problems, minimal
occurrence of flooding and adequacy of budget. These IAs also have a high percentage of
“successful” IAs compared with the small and medium size IAs. This apparent advantage of
large IAs may be linked to their degree of influence by virtue of their size and ability to access
funds which result in favorable physical states of their systems, which in turn led to their
success.
Looking at systems according to technology, reservoir systems show clear advantages over the
other types of schemes. And while pumped systems are shown to be doing well, these systems
are in fact heavily subsidized. The IA sample irrigated by diversion system (gravity) reported
the highest count of inadequacy in water supply especially during the dry season. The IAs
which used pump systems have the highest counts of siltation, lateral canals and institutional
problems. Despite these concerns, these IAs reported adequacy and dependability of water
supply even during dry season, no flooding problem, and higher collection efficiencies
compared to the situation of IAs with diversion/gravity system. The IAs in reservoir systems
claimed to be most successful of the three groups. This group reported adequate water supply,
lowest count of siltation problems, largest percentage of financially strong IAs, very high IA
functionality ratings and high collection efficiencies.
As to the location of the IAs relative to main canals, downstream IAs are shown to be heavily
disadvantaged over the rest of the IAs. The sample has the following characteristics: highest
count of siltation and/or solid waste problems, highest count of lack of water supply, highest
occurrence of flooding during wet seasons, highest count of damaged farm-to-market roads,
highest percentage of financially weak IAs and lowest ratings of water delivery service in terms
of adequacy and timeliness. The upstream IAs on the other hand, reported the least incidence
of water supply problems, lowest count of solid waste and/or siltation problems, highest

13
irrigation structure problems, highest count of lack of machineries and equipment and a high
percentage of financially strong IAs. Irrigation canal problems were ranked first in the list of
problems, and followed by institutional problems and then by calamities/pest infestation
causing production problems.
In terms of vintage, the profile of IAs and irrigation systems also differs. This measure splits
the sample into three periods which coincide with the distinct trends in irrigation investment
and development. Interestingly, the pre-NIA systems are characterized as those with the least
irrigation structure problems, concern for lack of machineries and equipment and inadequacy
of water supply. However, the IAs in these systems have the lowest functionality ratings.
Systems constructed between 1965 and 1980 have the following attributes: highest count of
poor headwork and control structures condition, highest concern of lack of machineries and
equipment, highest count of financially weak IAs, highest count of lack of water supply, and
highest incidence of damaged FMRs. Yet, these systems have the least siltation/solid waste
problems relative to systems from the other periods. Prevalent problems in decreasing order
include: inadequate of water during dry seasons, poor conditions of lateral canal and control
structures. The IAs with systems built between 1981 and 2013 reported the highest count of
main and lateral canal problems. They also have the highest incidence of siltation problems
and the largest count of institutional problems. However, this group has the largest number of
financially strong IAs, the highest count of “successful” IAs, the least occurrence of flooding,
with adequate water supply and least damaged FMRs. This observation seems ironic as it
implies that IAs can still be financially strong and “successful” despite technical and
institutional problems.
Profiling IAs according to “success” or failure indicates distinct differences between these
groups. “Successful” IAs in the sample are characterized as those with adequate water supply,
less institutional problems, adequate budget and facilities, machineries and equipment.
However, these IAs experience higher incidence of siltation and problems with physical state
of main canals, lateral canals and control structures. The hierarchy of problems of successful
IAs are as follows in decreasing order: lateral canal condition problems, institutional problems,
crop production problems due to calamities/pest infestations and damaged irrigation structures.
The “not successful” IAs have the higher count of inadequate water during dry seasons,
irrigation headwork problems, lack of facilities, machineries and equipment, with inadequate
budget and lower IA functionality ratings, indicating poor management performance. In order
of importance, inadequacy of water comes first, followed by institutional problems, and then
by the lack of irrigation facilities/infrastructures, machineries and equipment.
Lastly, using an alternative approach to analyzing the sample NIS performance, the results
show that irrigation performance has much to improve. This approach establishes an irrigation
performance index (IPI) measured in terms of five aspects: financial, economic, institutional,
technical and environmental factors. The financial factors include: 1) IAs rating of their
financial strength – financial capability of the IA is critical in the organization’s development;
2) collection efficiency – a higher collection efficiency means higher ISF shares by IAs and
better incentive; and 3) collection delinquency – a higher delinquency decreases the

14
performance index. Financially strong IAs can carry out better O&M and repairs so that
irrigation systems can deliver good/sustainable irrigation service.
The economic factors include average annual yields and gross profits of IA members which
would be indicative of benefits that reach beneficiary farmers. Higher annual yields can lead
to higher annual profits. Also, higher incomes can mean farmer members would be better able
to pay ISF resulting in IAs financial strength. The institutional component includes: 1)
effectiveness of policies; 2) flexibility index rating; 3) reliability index rating; and 4)
satisfaction rating on farm to market road.
The technical component indicators include canal structures ease of operability and canal
structure’s operability vs. design. Canal structure ease of operability pertains to the ease in
operating irrigation structures such as check gates, turnout gates, etc. While canal structure
operability vs design compares the original design of the irrigation system vs the actual use of
the structure. The environmental component indicators include dissolve oxygen content and
acidity. Higher DO (i.e. > 6 ppm) and pH content (i.e. >5) mean better quality water. The pH
found in most water samples show levels >7 which indicate alkaline conditions and potential
sodicity problems if not addressed on time. The results of this analysis show that 58% of the
sample IAs rated the irrigation performance as moderate. Only 12% of the sample rated
performance as high and the rest, low performance.
For communal irrigation systems, the preliminary evaluation leads to the following findings:
National and Regional/Provincial Trends
Service area has been growing but at a relatively very slow pace while firmed up service area
has been closely following. Given the relatively stable difference between the SA and FUSA,
land conversion or growth in permanently non-restorable area does not appear to be a concern.
However, the trends in actual irrigated areas during the wet and dry seasons seem to have
faltered in 2012. Wet and dry seasons irrigation intensities never reached the 80% mark and
even declined by about 20% in 2012.
With the rise in equity schemes, the amortization collection decreased and became a less
significant source of income. Despite this trend, amortization collection efficiency drastically
declined, making this a serious concern.
Characterizing the sample CIS
The 66 CIS are saddled with technical issues and problems that affect their performance. The
sample CIS in this study have run-of-the-river type dams which are quite old, with exposed
rock cores, damaged spillways, and sediments almost at the crest level. The sluice gates and
intake gates which were initially made of steel have been replaced with flashboards, sand bags,
or stones and in some relatively larger CIS, with defective lifting mechanisms. These problems
contributed to the increase in sedimentation. However, most of the sample CIS have concrete-
lined main canals and even laterals. The good conditions of these lined and unlined canal
networks are said to be due to the IAs O&M efforts and cleanup mechanisms. Where heavy
siltation is experienced due to watershed degradation, the solutions are simply beyond the IAs.

15
The sample CIS are characterized according to size, technology, “success” or “not successful”
and by province. On size, three types are defined: small, medium, large. Based on technology,
the CIS are classified as gravity or pump systems. To profile CIS according to some measure
of success, a “successful” IA is defined in terms of three criteria: (1) NIA’s functionality rating
of very satisfactory to outstanding; (2) IA’s own financial rating of 3 to 4, with 4 as very strong;
and (3) IA’s ISF collection performance rating of 3 to 4, with 4 as excellent, and a collection
rate of 65% and above. “Not successful” or unsuccessful IAs are defined as all other IAs not
classified as “successful”. These categories capture various technical and institutional factors
that influence CIS irrigation service.
The experience in small CIS exemplifies “small is beautiful.” Compared to the other classes,
the small CIS have the least incidence of inadequate water during dry seasons, siltation and
solid waste problems. They also have less problem in irrigation structures and canals compared
with the large systems and they reported the highest average cropping intensity and yield.
However, they have the lowest collection efficiency and highest count of funding problem.
Following the criteria above on “successful” CIS, the small systems have the highest
percentage of “successful” IAs compared to the larger systems. The large CIS have the highest
incidence of floods during the wet seasons. They also have the highest count of irrigation canal
problems and water theft. But, they have the least funding problems.
Contrary to earlier findings, IAs using pump technology in the sample are found to be more
successful despite the higher incidence of flooding and funding problems, and low cropping
intensities. The disparity is likely due to their adequate water supply even during dry seasons,
fewer problems with their irrigation canals and structures, and high collection efficiencies. The
pump technology appears to be closely associated with better control of available water and
the success of IAs.
The IAs irrigated by gravity have the highest cropping intensity and a low incidence of
flooding, but they have more problems with irrigation canals and structures, more severe water
shortages, and greater incidence of funding problems and water theft.
As to profile of “successful” IAs, they have adequate and dependable sources of water supply,
high cropping intensity, high collection efficiency, and adequate funding. This success profile
is obtained despite flooding, siltation, irrigation structures, and water theft problems. Less
successful IAs are characterized by inadequate water in the dry season, more problems with
irrigation main canal and control structures, low collection efficiencies, and severe funding
problems. It is interesting to note that IAs can still be classified as successful despite physical
and economic concerns. It seems that water availability is a key factor in high collection
efficiency. This finding needs to be validated so NIA can use this result in formulating
strategies to improve collection efficiency.

16
Recommendations Based on the technical and institutional analyses carried out for national and communal irrigation
systems, the following recommendations are in order.
For National Irrigation Systems:
Given the new insights from sub-national trends which cannot be inferred from national level
data, such level of analysis should be scaled up to cover more NIS in Visayas and Mindanao
and better understand the situation on the ground and establish some patterns and trends which
can be used to formulate relevant policy changes and actions.
It appears that conversion of irrigated areas is a more serious concern in certain regions. If the
rate of land conversion will continue to rise, estimates of design areas should properly take this
into account.
Given the dramatic slowdown in growth or stagnation of wet season irrigation intensity, it is
high time that NIA gives attention to the need to invest in drainage and/or collaborate with
DPWH to explicitly and more systematically address flooding problems in NIS systems which
fall under the turf of the latter and may require bigger technical/engineering solutions.
As a first step, each NIS should clearly establish size of firmed-up service areas which are
flooded during the wet season. For systems where there is a big difference between wet and
dry season irrigable area, two FUSA measures should be recognized in order to set more
realistic irrigated area targets.
Collection efficiency improvements appear to correspond to improvements in cropping
intensities. If this relationship can be confirmed, the strategy to improve collection efficiency
should include improvement in cropping intensities which in turn will require improvement in
irrigation service.
Relative to the medium and large irrigators associations (IAs), the small IAs appear to have
the disproportionate share of the problems.Given this disparity, the design of institutional
interventions should take into account “size” of IAs according to membership. Special
attention should be given to the needs of small IAs and appropriate interventions be designed.
Irrigators Associations in reservoir systems claimed to be most “successful” based on many
indicators when compared with those in diversion and pump systems. In considering types of
projects to invest in, government will have to weigh the trade-offs in investing more in
reservoir types which will likely mean higher initial capital requirements vs. other type of
systems (e.g. pumps). The later type may mean less initial investment but higher O&M after
project completion and less likely to be sustainable to operate given volatility in oil prices.
“Successful” IAs in the sample are characterized as those with adequate water supply, less
institutional problems, adequate budget and facilities, machineries and equipment. If we take
these factors as indicative of necessary requirements for “successful IAs,” then at minimum,
NIA’s system design and eventually service areas should have better estimates of available
water. This finding makes necessary more firm and systematic assessment of adequacy and
reliability of water that will be available to farmers when an NIS system operates.
The issue of equity in the delivery of service remains a major concern given the heavily
disadvantaged downstream IAs – with inadequate water during the dry season and more water
than they need during the wet season. NIA has to come up with a better strategy of addressing
this aspect of equity as part of improving quality of irrigation service.
17
If use of pumps is to be taken as a way to partly address equity concerns especially during dry
seasons, the lack of policy on treatment of use of pumps within NIS systems has to be
addressed. The use of discount needs to be evaluated and made an official policy rather than
leaving too much discretion on the water masters or institutional development officers in the
field.
Performance of irrigators associations using functionality ratings differ by vintage -- pre-NIA
systems, 1965-80 and 1981 to 2013 – indicating that contrary to expectations, functionality of
“older” IAs maybe more problematic. If functionality ratings can be validated, there may be a
strong case for revisiting the institutionalization program. “Old” IAs appear to need more
retraining/reorienting/strengthening so they can keep up and become more effective
organizations.
Again, appropriate institutionalization policy has to be designed according to the specific needs
of different types of IAs. Irrigators associations in the early NIA years appear to be mostly
financially weak. Given this, the capacity building strategy for IAs should explicitly include
ways to improve financial strengths and that intervention for IAs should consider not only size
(in terms of membership) but also vintage. IAs with systems built between 1981 and 2013
appear to need in addition, more engineering/technical solutions. These observations should
be confirmed by further evaluations given two possible scenarios –more recent systems are not
built as strongly or we have simply more intense weather and climate contributing to more
rapid deterioration or damage to the systems. If the latter would be the case, this finding will
provide a strong support for more deliberate climate change resilient systems in terms of design
and structures.
Using an alternative approach to analyzing the sample NIS, the results show that the composite
performance has much to improve. This approach establishes an irrigation performance index
in terms of five aspects: financial, economic, institutional, technical and environmental
factors.If the results can be confirmed, addressing specific aspects of performance with respect
to the five areas can lead to possible marked improvement. Given this potential usefulness of
the analysis, this approach should be scaled-up to cover more IAs and national systems to
validate the initial observations and at the same time refine the measure to be more useful.
For Communal Irrigation Systems:
Service area has been growing at a very slow pace and prelimnary investigation shows that a
good number of CIS are already in elevations beyond the 3% slope. This initial finding
warrants scaling up of the characterization to cover more IMOs to get a better sense of the
location and distribution of the over 9000 CIS nationwide.
An assessment of the potential and economics of considering areas between 3% and 8% slopes
for CIS expansion should be pursued. Using the GIS technology and some modeling, a more
systematic identification of irrigable CIS areas should be carried out taking into account water
availability, associated environmental damage/watershed degradation.
The wet and dry seasons irrigation intensities which are generally below 80%, should be
further investigated and understood by looking at trends in all provinces/IMOs and more
systems. As a first step to this assessment, the firmed up service area (FUSA) has to be
examined and the field work should be used to understand why the actual irrigated areas have
been falling short in both seasons. The evaluation should be able to establish how much is due

18
to “non-functional” areas (which will therefore need repair/rehabilitation/restoration) vs.
flooded during wet or with inadequate water during dry.
With the rise in equity schemes, the amortization collection decreased and became a less
significant source of income. Despite this, the fact that amortization collection efficiency has
declined, is a concern which should be addressed.
Reservoir systems appear to coincide with most successful group of IAs. If this finding can be
validated, consideration of this type of system may well justify the possibly higher investment
needs compared to other type of systems.
The technical issues and problems affecting the CIS performance point to the need to revisit
adherence to design and construction guidelines for new development and rehabilitation of
CIS. Specifically, the assessment of dependable flow, catchment conditions, sediment
discharges and potential of groundwater source should be properly carried out. The trade-off
between spending more on capital requirement during the development phase versus higher
O&M expenditures after turnover should be carefully weighed.
If results can be validated by scaling up the evaluation to cover more CIS, appropriate
government interventions can be designed according to the priority needs of IAs. NIA can use
the results for targeting interventions and allocating the corresponding resources. Small IAs
need more capacity building and funding while large IAs need more technical solutions.
Lastly, while IAs can still be considered “successful” despite physical and economic concerns,
it appears that water availability is a key factor in high collection efficiency. NIA’s strategy
to improve collection efficiency has to also include addressing the issue of water availability.

19
INTRODUCTION
This report is a Phase 2 of the 2013 Rapid Assessment of national irrigation systems (NIS)
conducted for the Philippine Institute for Development Studies (PIDS) which largely focused
on national level data and analysis with six case studies (Inocencio, et al. 2013). This second
phase has three components: (i) assessment of national irrigation systems (NIS) regional trends
and 22 systems; (ii) rapid appraisal of communal irrigation systems (CIS) at the IMO or
province level and a sample of 66 systems; and (iii) characterization the irrigation sector
governance structure. This component is tasked with integrating the first two components.
Irrigation development and management in the country has historically been the single biggest
item of public expenditure for agriculture, accounting for about a third of the total since the
1960s. In the 1970s and early 1980s, as well as in recent years when world rice prices rose at
unprecedented levels, this ratio was even higher at close to half of total public expenditures for
agriculture. In recent years, irrigation has taken up from one third to close to half of the
Department of Agriculture budget.
Table 1. Budget appropriation by the Department of Agriculture2
Appropriation for irrigation
(P Million)
Share in Department of Agriculture
budget (%)
2011 12,790.650 36.8
2012 24,454.052 46.2
2013 27,156.295 42.1
2014 21,182.734 30.9
2015 28,750.441 42.4 Sources: Various General Appropriations Act (GAA).
The National Irrigation Administration (NIA) development program largely focuses on
national irrigation systems (NIS) and communal irrigation systems. NIS are irrigation systems
supposedly with minimum service areas of 1,000 hectares (ha), the biggest reaching over
120,000 ha. However, a number of NIS fall short of the 1,000 ha threshold size. Management
of these NIS systems is by NIA and irrigators associations. There are 231 NIS with a total
service area of 813,916 ha. (or 731,186 ha firmed-up service area) as of December 2014. The
three largest NIS with massive reservoirs operated in combination with river run off, are gravity
irrigation systems which account for about a third of total NIS service area. The remaining two-
thirds are mostly run-of-the-river gravity irrigation, except for five medium-sized NIS that
pump water from large rivers.
Communal irrigation systems (CIS) are those whose service areas fall below the 1,000-ha
threshold. The total service area of CIS continues to be sizeable at about 599,049 ha or a firmed-
up service area of 576,859 ha as of December 2014. While many CIS started as private
initiatives, most of them have been receiving government support for the cost of rehabilitation
and new construction. At least 95% of CIS are gravity systems obtaining water from rivers or
streams. However, few have been given funding support for medium sized pumps to also
2 The 2015 share is computed as ratio of NIA to DA plus NIA budgets to be consistent with other years. The
appropriations for irrigation are only those through NIA.

20
abstract and distribute water from a river. Most CIS are constructed by NIA, but the irrigator
associations are responsible for the management and maintenance of the systems.
While the government started to promote the adoption of pump irrigation in the 1950s, recent
data indicate that at least 90% of pump irrigation used by rice farmers have been purchased
privately, and even more so for pumps used for non-rice cultivation. The Department of
Agriculture’s Bureau of Soils and Water Management (BSWM), as well as NIA, have
occasionally distributed small pumps to rice farmers for free and sometimes on credit,
especially during periods of drought when the surface irrigation systems have unusually low
actual irrigated areas. In relative terms, government subsidy for the use of small pump or
individual irrigation systems has been nominal.
OBJECTIVES
The project aims to evaluate the effectiveness and efficiency of the government's irrigation
program. It focuses on technical, physical, and institutional aspects of performance of both
national (NIS) and communal irrigation systems (CIS), and selected cases led by other project
proponents. Specifically,
Component 1: National Irrigation Systems
This component analyzes trends in NIS secondary data and examines 22 cases to help
understand and explain the trends and state of national irrigation service provision from the
points of view of providers and beneficiaries. Specifically:
1. Analyze the trends and patterns of performance indicators across different types of systems
in terms of ratios of actual irrigated areas to service and firmed-up service area, cropping
intensity, collection efficiency, operation and maintenance (O&M), and farm productivity
based on system level and aggregated data, and
2. Analyze the factors affecting the trends and patterns of performance across NIS and within
selected NIS using secondary data, key informant interviews and focus group discussions,
geographic information system (GIS), and other techniques. This analysis requires
collection of secondary data at the different levels of NIA – Central Office (CO), Regional
Irrigation Office (RIO), Irrigation Management Office (IMO) and selected NIS cases.
Component 2: Communal irrigation systems
This component provides preliminary evaluation of investments in CIS. This component
undertakes CIS analyses from secondary data and cases to help understand and explain the
trends and state of irrigation service provision from the points of view of providers and
beneficiaries. Specifically:
1. Characterize the CIS at national and provincial levels, examine the trends and patterns of
performance indicators in terms of ratios of actual irrigated areas to service and firmed-up
service areas and cropping intensity, collection efficiency, and farm productivity based on
national and provincial level data, and

21
2. Undertake preliminary analysis of factors affecting the trends and patterns of performance
of CIS at the national and provincial levels and within selected CIS in 11 IMOs/provinces
(out of 60 total as of July 2015) using secondary data, key informant interviews and focus
group discussions, GIS, and other techniques. This analysis requires collection of
secondary data at the different levels of NIA particularly the CO and the IMO and site visits
to selected CIS cases.
This component is tasked with integrating the findings of both the NIS and CIS technical and
institutional assessments of performance. The aim is to establish technical and institutional
factors constraining the NIS and CIS systems from performing well and delivering quality
service. These factors may relate to inefficiencies in the development and management of the
systems, from planning and design, to project evaluation/selection, construction, operation and
maintenance, and rehabilitation. A separate study component covers the entire irrigation sector
governance aspect.
FRAMEWORK OF ANALYSIS AND METHODOLOGY3
The study applies a rapid assessment approach following Burt and Styles (1998) and the
MASSCOTE (Mapping Systems and Services for Canal Operation TEchniques) (2007) rapid
appraisal procedure (RAP) taking into account availability and access to technical data on the
systems and what can be realistically measured during the relatively short visits and ocular
inspections.4
Figure 1 shows some of the major inter-relationships that affect outputs from irrigation
projects/systems. It is important to distinguish "results" from "causes" and "symptoms". For
instance, strong IAs maybe thought to eliminate most of the problems in irrigation
systems/projects. However, this framework takes strong IAs as a result and not a cause. A
scenario for the existence of a weak IA is where the irrigation project authorities expect the IA
to collect water fees, distribute water, and maintain a water distribution network. Yet, the IA
has little or no say in how the fees are spent and the water arrives at the IA area is inadequate
and untimely (i.e. poor water delivery service). In this scenario, the weak IA is a symptom and
not a cause of poor water delivery service.
The framework shows that many factors will impact project/system outputs and that the
strength of an IA is dependent on both institutional and water delivery service factors. It
describes a rapid appraisal process that takes into account the various hardware design and
management factors that affect service. Consequently, the physical, technical constraints that
include aspects of water supply and sources, and institutional constraints that include capacities of
parties involved, influence availability and flexibility of irrigation service.
3The RAP approach draws heavily from Burt and Styles (1998). 4 The MASSCOTE framework aims to map the entire services area into manageable cost-effective units to better
serve users. The framework maps the service to users by taking into account the perturbations, the opportunities
for water management improvement, and the costs. This mapping in turn serves as an input in formulating
strategies for water management service delivery, canal operation, and modernization. The NIS and CIS studies
only limit themselves to the use of some relevant and applicable parts of the RAP.
22
Figure 1. The Rapid Appraisal Procedure (RAP)
Sources: Burt and Styles (1998) and MASSCOTE (2007).
The RAP examines external inputs such as water supplies and outputs like water destinations
(e.g. evapotranspiration or ET, surface runoff, etc.). It provides a systematic examination of the
hardware and the processes used to convey and distribute water internally to all levels within
the project (i.e. from the source to the fields).
The RAP outputs include external and internal indicators. Basically, external indicators
examine inputs and outputs of the whole project/system, while internal indicators examine
processes and hardware within the project/system. The internal indicators also identify key
factors related to water control throughout a project/system. They define the level of water
delivery service provided to users, examine specific hardware, and check up on management
techniques and processes used in the control and distribution of water. The external indicators
include ratios or percentages comparing project inputs and outputs to describe performance,

23
measures of forms of efficiencies related to budgets, water, yields, etc. However, these
indicators do not provide insight in how to improve performance.
The fieldwork asked questions to management in the RIO/IMO offices, systems operators, and
IA officers/farmer beneficiaries, and observes or critically examines them. Questions for
provincial/IMO/system offices probe on information/readily available data on general
project/system conditions, water supply location, ownership of land and water, budgets,
operation as described by office staff, and stated water delivery service at various levels in the
system. In the field, RAP includes observing the state of the canals and structures from head
works to main canals to laterals to field level, discussing operations of cross regulator and inlet,
and performing key informant interviews (KIIs) with NIA staff/irrigators association
officers/members responsible for system management/co-management and water distribution.
Scope of the Study
For the NIS component, 22 systems in 14 provinces in Luzon are covered: (1) Bonga Pump 2
and (2) Nueva Era RIS in Ilocos Norte; (3) Banaoang Pump Irrigation System (PIS) in Ilocos
Sur; (4) Magapit PIS and (5) Solana PIS both in Cagayan; (6) Visitacion RIS also in Cagayan;
(7-8) Magat River Integrated Irrigation System (MRIIS) in Isabela; (9-10) Ambayoan-Dipalo
RIS in Pangasinan; (11-13) Upper Pampanga River Integrated Irrigation System (UPRIIS) in
Nueva Ecija and parts of Tarlac, Pampanga, and Bulacan; (14-16) Tarlac-San Miguel-
O'Donnel River Irrigation System (TASMORIS) and selected operational TGIS systems; (17)
Pampanga Delta RIS; (18) Angat-Maasim RIS in Bulacan; (19) Balayungan friar land irrigation
system (FLIS) in Cavite; (20) Libmanan-Cabusao PIS in Camarines Sur, (21) Caguray IS in
Mindoro Occidental, (22) Dumacaa in Quezon. The sampling frame represents Regions 1 to 5
national systems, with a total firmed-up service area (FUSA) of 440,785 ha (as of December
2014). The selected NIS represent about 47% of the Regions 1 to 5 firmed up service area
(FUSA) or 28% of overall total NIS FUSA.5
For the CIS component, 11 provinces/IMOs in Luzon are covered, with total firmed-up service
area of around 180,328 has, representing 31% of the total. The selected IMOs were drawn from
the top 20 provinces in terms of total FUSA except for Laguna because it was selected to
optimize the overlap with the NIS sample provinces. Specifically, the selected provinces/IMOs
include the following: (1) Laguna (part of Laguna-Rizal IMO); (2) Ilocos Norte; (3) Cagayan
(part of Cagayan-Batanes IMO); (4) Isabela; (5) Nueva Vizcaya; (6) Benguet (part of Abra-
Benguet -Ifugao-Mt. Province IMO); (7) Pangasinan; (8) Nueva Ecija (part of Bulacan, Aurora,
Nueva-Ecija IMO); (9) Pampanga (part of Pampanga-Bataan IMO); (10) Camarines Sur; and
(11) Occidental Mindoro. Of these provinces, Camarines Sur (with 43,730 has) and Pangasinan
(29,783 has) have the largest CIS areas (NIA 2014).6
5 UPRIIS and MRIIS have FUSA of 119,640 ha and 85,176 ha., respectively, as of December 2014. These two
largest systems already represent around 28% of the total FUSA for NIS. 6 NIA has 60 IMOs nationwide each headed by a Division Manager. The IMOs consist of 40 clustered provinces;
and the 9 district offices, and two dam and reservoir divisions of UPRIIS and MRIIS. The IMOs are responsible
for the construction and rehabilitation of irrigation projects and systems in one or a cluster of provinces. They also
implement the operation and maintenance (O&M) plans of irrigation systems in collaboration with the farmer-
beneficiaries (http://www.nia.gov.ph).

24
For each selected province/IMO, six sample CIS systems were drawn using the 2013 NIA
Inventory file that serves as the sampling frame. This file contains system size, technology,
source of water, and percentage of operational/non-operational FUSA. The CIS sample
represents small (i.e. 50 ha and below), medium (i.e. above 50 to 100ha), and large (i.e. above
100 ha) systems. Selection of CIS is also based on the type of technology, whether gravity or
pump. In consultation with the NIA Irrigation Development Officers (IDOs) at each IMO,
“success” and “failure” cases were included in the sample. Accessibility of the system was also
considered.
Data Collection
Primary and secondary data were collected from the central and field offices. Primary data
were collected during technical field visits, and qualitative information gathered from key
informant interviews (KIIs) for the institutional and governance aspects of irrigation service.
Secondary data were collected from the different NIA offices such as NIA-Central, Regional,
Irrigation Management Offices (IMOs), and the offices of each selected NIS. Additional
secondary data were gathered from other the government agencies. Relevant documents,
appraisal, implementation/completion, project performance audit reports, annual/yearend
reports, technical studies, policy notes, and river basin master plans were reviewed to
characterize the current state and distribution of NIS and CIS and to evaluate trends and
patterns of performance indicators.
Specifically, secondary data/reports, whenever available, included the following:
List of NIS/CIS under the IMOs and available data including functionality survey
results;
Technical data (i.e. physical state, service area, irrigation efficiency, source of water,
access to and availability of water, year constructed and start of operations, construction
cost, rehabilitation cost, other major investments, yield, cropping calendar, cropping
intensity; rainfall and other climatic data;
Status of IAs (i.e. profile/institutional report of IAs, source of funding, financial
status/viability, program of works (POWs) for all available years, and national
irrigation system performance (NISPER) and communal irrigation system performance
(CISPER); and
Assistance provided by NIA to CIS/IAs; assistance provided by other agencies to
CIS/IAs.
For each selected NIS or CIS case, the proponents met with the IMO Division Managers, NIS
Managers, and the system personnel. Where available, technical references including
feasibility studies, technical drawings, network maps were obtained. A review and analysis of
the maps, including technical specifications, canal layout, location and functions of irrigation
structures, and irrigated and built-up areas were conducted.
Key informant interviews (KIIs) of NIS or CIS staff and IAs (e.g. IMO, System managers,
IDOs/operations staff, and IA president/officer/member) were conducted. Information on
socio-economic characteristics of farmer-members, institutional capacity of IA, problems and
constraints in managing the NIS canals/laterals/CIS by the IAs were generated from the KIIs.
The status and current conditions of the main canal, selected secondary, and tertiary canals

25
were initially determined through KIIs and complemented by ocular observations during the
walk-throughs.7
Walk-throughs and actual measurements were collected for a subset of the sample NIS and CIS
to gauge the physical conditions of the systems (i.e. current vs. designed dam/reservoir
capacity; length and efficiencies of lined vs. unlined canals; legal and illegal turnouts, including
functionality; for pump systems: fully, partially operational, or non-operational pumps; among
others). Depending on the size of the IS, one secondary lateral was selected: (a) near the dam
or headgate, (b) in the middle, or (c) at the tail end of the system. If the NIS is relatively small,
only one lateral near the headgate and one at the tail end had been selected. These
structures/facilities are photographed and geo-tagged for proper referencing. Conveyance
losses were measured on selected main and lateral canals, and where applicable, compared for
lined and unlined canals. For the CIS, at least two systems per IMO/province were selected for
the walk-throughs. One lateral each near the headgate and at the tail end were selected for
technical evaluation.
Data Analysis
This study carried out trend analysis and use case studies to provide in-depth analysis. To
accomplish this goal, technical and institutional evaluations are carried out applying some RAP
approaches. Application of the RAP framework allows development of internal process indicators
and external indicators. The generation of internal process indicators requires information
listed in the "Constraints", "Factors Influencing Service Quality", "Service", and
"Symptoms" in Figure 1. The external indicators require some of the information contained
under "Physical Constraints" (e.g. water supply, climate) and "Results".
The following measures can be considered as among the internal indicators:
Service area (SA) (proxy for hardware)– total area that a completed national or communal
system can potentially irrigate;
Firmed-up service area (FUSA) (proxy for hardware) – Service Area less converted areas
and permanently non-restorable areas; this is further broken down into
operational/functional vs. non-operational/functional; functional service area is the actual
area irrigated in the wet season plus the area submerged in the said season but irrigated in
the dry season; non-operational/functional service area is the difference between FUSA and
operational/functional service area, mainly due to water shortage and dilapidated facilities;
Programmed service area (dry season, wet season) (proxy for management) – FUSA less
non-operational area that can be irrigated given “expected/estimated” available water in the
dry season and less areas that will potentially be flooded during the wet season;
While the following maybe considered a combination of internal and external indicators:
Actual irrigated area (dry season, wet season) – Programmed area which were planted and
reported in the verified list of irrigated planted area (LIPA);
7 Refer to the inception report for the KII and guide questions for NIS staff at different levels and NIS/CIS IAs.

26
Benefitted area (dry season, wet season) – irrigated areas which harvested at least 40
cavans/ha.
Cropping intensity (result) – sum of actual irrigated wet and dry seasons divided by FUSA
(before 2004, SA is used)
Irrigation intensity (result) – actual irrigated wet (or dry season) divided by FUSA (before
2004, SA is used)
Collection efficiency (symptom) – current collected irrigation service fee (ISF) divided by
current collectible;
Viability (symptom) – total system income divided by reported total O&M expenses.
In addition to the above performance indicators, some ratios are used to characterize the
institutional constraints captured by capacities of the systems in terms of manpower, level of
operation or functionality, financial structure, and productivity of the systems (result).

27
TRENDS IN NATIONAL IRRIGATION INVESTMENTS AND
PERFORMANCE
Irrigation investment remains the most important policy instrument that government uses to
increase productivity in agriculture and to achieve its food staples sufficiency objective. Figure
2 presents the trends in total public expenditures for irrigation in 2000 prices. Over the past
four decades, irrigation investments have peaked in the 1ate 1970s to early 1980s and rose
again in more recent years.
Figure 2. Irrigation investment trends for national and communal irrigation systems, 1965-
2012
Sources: NIA Yearend Report, various years. The increase in world rice prices in the 1970s together with the introduction of modern rice
varieties suited to irrigated conditions raised the marginal rates of returns for irrigation
investments. As world commodity prices decline, yields of modern rice varieties leveling off,
and the cost of irrigation expansion increase, public expenditures declined. Investment shifted
from new development to rehabilitation projects, which were reported to give higher returns to
investment.
The rise in investments in 2008 was as a response to the increase in world rice prices in 2007.
This trend continues with the present administration’s food self-sufficiency program. More
systematic analyses indicate that levels of public investments respond to short-run changes in
-
5
10
15
20
25
1965 1970 1975 1980 1985 1990 1995 2000 2005 2010
Others
CIS
NIS
P million (2000 price)

28
world rice prices as these affect marginal rates of returns to irrigation investments and adoption
of rice self-sufficiency instead of consideration of long-term benefits and costs
There are also discernible shifts in investments from largely NIS to more CIS in early 2000
and in more recent years (Inocencio and David 2013). These changes were consistent with the
delayed enforcement of the provisions in AFMA (supposedly to begin in 1997) to give more
attention to smaller systems and promote participation of LGUs in developing CIS.
The funding source also has shifted from predominantly foreign in the 1970s to the 1980s to
local in more recent years (Figure 3). This pattern is reflective of the country’s development
strategy at that time where foreign funding was a key element. That period was characterized
by a debt-driven growth. The poor fiscal position of the country in early 2000 led it to foreign
funding for irrigation projects. The recognition of the need to reduce foreign exchange risks,
directed borrowings back to local sources. This fiscal policy had implications on the quality
of projects and implementation. Foreign funding appeared to have certain implementation rules
and standards at the start of the project up to completion. Local funding however, appears to
have fewer requirements and less stringent rules and accountability.
Figure 3. Trends in irrigation investments by source of funding, 1965-2012
Sources: NIA Yearend Report, various years.
0
5
10
15
20
25
1965 1970 1975 1980 1985 1990 1995 2000 2005 2010
LFPFAP
P million (2000 price)

29
Looking at investment by purpose (Figure 4), the 1970s and early 1980s were dominated by
new projects with some rehabilitation components. Donor evaluation studies in the late 1980s
indicated that rehabilitation projects have higher rates of return (Jones 1995). This was also
the period in which donors began to invest more in institutional strengthening relative to
construction projects.
Figure 4. Trends in irrigation investments by purpose, 1965-2012
Sources: NIA Yearend Report, various years.
0
5
10
15
20
25
1965 1970 1975 1980 1985 1990 1995 2000 2005 2010
Others Rehab
Rehab/New New/Rehab
New
P million (2000 price)
Fig. 4. Trends in irrigation investments by purpose, 1965-2012

30
Trends in irrigation service areas indicate continuously rising service areas although the rates
of increases seem to be slowing down in the last decade (Figure 5). The NIA data would be
seemingly consistent with those of BAS if the former’s correction of CIS data in 1994 is
extended back to the mid-1970s. Noteworthy is the trend in actual NIS irrigated area (wet
season) which appears to grow even on much lower rate relative to the NIS service area. Also,
interesting to note that private pumps appear to be increasing with discernible growth in early
2000.
Figure 5. Trends in NIA NIS, CIS & Pump service areas, Actual NIS irrigated area (wet
season), and the BAS-PSA estimates of irrigated rice crop area (second semester), 1964-2012
(000 has).
Sources: NIA-SMD NISPER and CISPER data, various years.
0
200
400
600
800
1,000
1,200
1,400
1,600
1,800
1964 1967 1970 1973 1976 1979 1982 1985 1988 1991 1994 1997 2000 2003 2006 2009 2012
(000 has)
Year
Pump
CIS
NIS
BAS
NIS actual irrigated wet

31
Figure 6 shows the trends in irrigation intensities for NIS and CIS, wet and dry seasons. The
trends for CIS show the same pattern for wet and dry seasons, with the first generally higher
than the latter, Using the irrigated area to FUSA measure, the NIS intensities are much better
than those of the CIS. What is striking is that the NIS intensities using the SA are seemingly
in contrast with a declining wet season versus a rising dry season trend. Yet, if the FUSA
definition is used, the contrast seems to diminish with both wet and dry intensities rising closely
to each other. The correction in FUSA with converted lands and permanently non-restorable
areas removed from SA, shows improved performance which does not differ much between
seasons.
Figure 6. Trends in Irrigation Intensity in NIS and CIS, Philippines, 1965-2013
Sources: NIA-SMD NISPER and CISPER data, various years.
0
10
20
30
40
50
60
70
80
90
100
1965 1970 1975 1980 1985 1990 1995 2000 2005 2010
(ha)
NIS Irrigated Wet/FUSA
NIS Irrigated Wet/SA
CIS Irrigated Wet/FUSA
NIS Irrigated Dry/FUSA
NIS Irrigated Dry/SA
CIS Irrigated Dry/FUSA

32
The collection efficiencies (Figure 7) defined for NIS as the rate of current ISF collection ratio
to current collectible, while for CIS, current amortization payment ratio to current collectible,
show opposite trends. The collection efficiency for NIS has been below 50% until the early
2000. It started rising in 2003 to over 60 percent in more recent years. The ISF collection is
used for O &M of the systems and to partly cover the operations costs of the IMOs and the
RIOs. For the CIS, the amortization collection rate has been declining since 2004 which should
be alarming given the declining share to total revenues from CIS. This pattern could mean
much reduced effort in collection and/or less effective collection strategy.
Figure 7. Trends in Collection Efficiency in NIS and CIS, Philippines, 1965-2013
Sources: NIA-SMD NISPER and CISPER data, various years.
0
10
20
30
40
50
60
70
80
90
100
1983 1988 1993 1998 2003 2008 2013
(%)
NIS CE
CIS CE

33
Figure 8 shows the trends in actual cost of NIS operation and maintenance (O&M) compared
to recommended/desirable levels and to irrigation service fee collectible and collections o at
2000 prices. There are a few key observations: (1) an old recommended O&M is much higher
than current collectible ISF implying that even with a 100% collection efficiency, the ISF will
not be able to properly cover the O&M; (2) the actual O&M appears to be pegged to the actual
ISF collected. These observations may help explain why despite the increasing investments in
irrigation development, firmed up service areas, actual irrigated and irrigation intensities hardly
improved over time.
Figure 8. Trends in the actual cost of operation and maintenance (O&M) of service area
compared to recommended levels and to irrigation service fee collections of national
irrigation systems at 2000 prices.
Sources: NIA-SMD NISPER data, various years.
0
500
1,000
1,500
2,000
2,500
3,000
1983 1985 1987 1989 1991 1993 1995 1997 1999 2001 2003 2005 2007 2009 2011 2013
P /ha (at 2000
prices)
O & M actualISF collected
Recommended O&M
(1999 study)
ISF collectible
Desirable O&M
(2011 study)

34
Figure 9 provides a snap shot of all the key performance indicators of the NIS from 1965 to
2013.
Figure 9. Trends in key performance indicators, Philippines, 1965-2013
Sources: NIA-SMD NISPER data, various years.

35
NIS REGIONAL TRENDS AND SYSTEM PERFORMANCE
This section presents system level and regional trends put together from NIA-SMD data to
broadly explain the national trends. While Figure 9 shows trends in key national performance
indicators, Figures 10 to 13 report regional trends in selected performance indicators.
Trends in regional service area (SA) indicate that the national growth has been coming from
four regions – Regions 2, 3, 10 and 12 (Figure 10). By type of scheme, the growth in Luzon is
in reservoir type while that in Mindanao, diversion type.
The NIS are classified into three types of schemes: run-of-the-river diversion, storage or
reservoir, and pump irrigation. A diversion scheme draws water under controlled conditions
directly from the flow of rivers or streams while a storage or reservoir scheme involves the
construction of storage dams to impound water and released as needed to be drawn from a
diversion dam downstream. According to NIA, the reservoir projects are usually multi-purpose
and may serve power generation, flood control, fishery and recreation functions. Pump projects
lift water from underground or from rivers and streams. These schemes maybe used in some
storage or diversion systems to lift water to irrigate areas in higher elevation or pump
groundwater to supplement available surface water supply. As of 2012, reservoir type accounts
for 31% while diversion schemes, 63%. The rest of the areas are accounted by pump-systems.
The reservoir schemes are largely found in Regions 2 (i.e., MRIIS) and 3 (i.e., UPRIIS) while
most of the pump systems are in Regions 2 and 5. Over time, much of the expansion appears
to have been in diversion and small reservoir schemes. Diversion schemes will be more
vulnerable during dry seasons and also to higher water stress resulting from decreased rainfall
and extended dry spells.
Figure 11 shows the regional trends in O&M expenditures and O&M per ha. According to
Shepley, et al. (2000), the recommended cost of O&M per hectare that will cover the average
direct costs of water scheduling and gate operations, canal cleaning labor, gate repairs/greasing
and locks, use of hand held radios and equipment rental is at least double the current level of
ISF charged in run of the river diversion and reservoir systems (Inocencio, et al 2014). The
actual spending on O&M/ha at the field level is even significantly less than the collectible ISF
in the wet and dry seasons, as ISF collection rate on current account has averaged only about
50% in the 1980s and 1990s, and rising to slightly higher than 60% over the past decade. The
Shepley, et al. study found that about 40% of the time of ditch tenders is devoted to ISF
collection, rather than to O&M. In fact, a more recent study on ISF indicated that the system
operations staff spend as high as 80% of their time for ISF collection (Cablayan, et al. 2014).
Except for four regions, regional real O&M expenditures have been almost constant (CAR and
Region 1, Regions 7and 9) or even declining (Regions 6, 10 & 13, and slightly, Regions 4 and
5 and AMRIS). Real O&M per ha follow the same pattern of decline or hardly changing in the
last three decades. Given these trend, the dismal states of many systems and likely poorer
performance can only be expected. The poor performance is confirmed by the trends in
regional (wet and dry season) irrigation intensities (Figure 12).

36
Figure 10. Trends in the service area of NIS by scheme type and by region, 1967-2013 (‘000
ha)
Sources: NISPER, NIA-SMD, various years.

37
Figure 11.Trends in the real O&M, O&M/SA and O&M/FUSA in national irrigation systems by
region, 1985-2013 (at 2000 prices).
Sources: NISPER, NIA-SMD, various years.

38
Figure 12. Trends in irrigation intensities in national irrigation systems by region, 1967-2013.
Sources: NISPER, NIA-SMD, various years.

39
In terms of explaining the national trends, CAR, Regions 1 and 4 appear to be consistent for both
wet and dry irrigation intensities. As to the increasing trend in dry season irrigation intensity,
almost all regions seem to be consistent with the exception of Regions 5 and 6 which have more
flat lines and Region 3 because of the big drop in the early 1990s because of the Mt. Pinatubo
eruption impact.
The regional trends in collection efficiency in Figure 13 show generally poor performance except
for Regions 2 and 11. In recent years, however, several regions (Regions 4, 7, 8, 10/13, and
12/ARMM) and MRIIS are starting to show improvements. The consistent poorly performing
regions and system (CAR/Region 1, Regions 3, 5, 6 and 9, AMRIS) appear to be also those which
suffer from low irrigation intensities.
What is notable is the trend in benefitted to actual irrigated area (Figure 9c) indicating increasing
exemptions (for areas harvesting below 40 cavans/ha) over time at around 10%. Since 2008,
exemptions for wet season irrigated area have been higher, even reaching as high as 20% in 2011.
Table 2 shows additional indicators to help characterize NIS capacity and resources and
productivity of systems and these figures serve as the benchmark for the regional trends. With the
rationalization and food self-sufficiency agenda, it is interesting to note that at the national level,
NIA is still to fill-up about 40% of its approved plantilla under the RatPlan, as of December 2014.
. Since 2010, one plantilla staff is on average responsible for an increasing service area, at 424 ha
as of December 2014. If the daily staff would be considered, the coverage decreases by 86. It
appears that the daily staff is on average covering 17 to 20% of service area in the last five years.

40
Figure 13.Trends in collection efficiency in national irrigation systems by region, 1967-2013.
Sources: NISPER, NIA-SMD, various years.

41
Table 2. Performance Ratios of NIS Philippines, 1965 – 2003
Ratios 1983 1984 1985 1986 1987 1988 1989 1990 1991 1992 1993 1994 1995 1996 1997 1998 1999 2000 2001 2002 2003
Filled-up/Plantilla (%)
FUSA/Filled-up (Ha/staff) FUSA/Filled-up + Daily Staff
(Ha/staff)
FUSA/SA (%)
Ben. Wet/Actual Wet (%) 96 92 93 96 95 82 84 96 90 90 89 90 86 85 93 80 93 89 87 91 92
Ben. Dry/Actual Dry (%) 94 93 95 97 94 93 94 95 97 89 93 96 87 93 93 82 95 90 95 90 86
ISF Current Account/Total Income
(%) 26 23 27 24 23 17 18 69 77 73 73 70 62 62 60 53 49 59 59 69 70 ISF Back Account/Total income
(%) 5 5 5 3 3 3 3 20 13 14 16 17 19 21 18 18 16 17 16 15 18
Other Income/Total Income (%) 13 12 13 11 13 20 18 22 29 35 25 25 16 12
Total Income (%) 31 28 32 28 26 20 21 103 101 100 100 100 100 100 100 100 100 100 100 100 100
Total ISF/Total Income (%) 31 28 32 28 26 20 21 89 90 87 90 87 80 82 79 71 65 75 75 84 88
Yield Wet (cavan/ha)
Yield Dry (cavan/ha)
Sources: NIA-SMD NISPER data, various years.
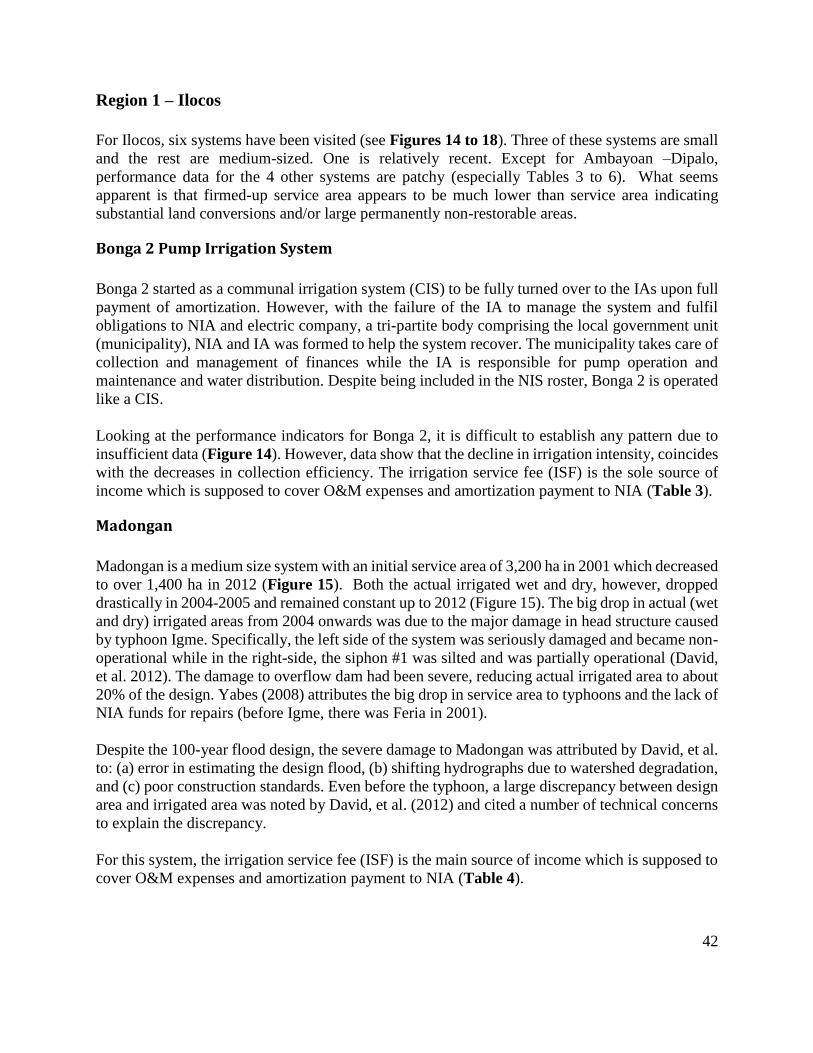
42
Region 1 – Ilocos
For Ilocos, six systems have been visited (see Figures 14 to 18). Three of these systems are small
and the rest are medium-sized. One is relatively recent. Except for Ambayoan –Dipalo,
performance data for the 4 other systems are patchy (especially Tables 3 to 6). What seems
apparent is that firmed-up service area appears to be much lower than service area indicating
substantial land conversions and/or large permanently non-restorable areas.
Bonga 2 Pump Irrigation System
Bonga 2 started as a communal irrigation system (CIS) to be fully turned over to the IAs upon full
payment of amortization. However, with the failure of the IA to manage the system and fulfil
obligations to NIA and electric company, a tri-partite body comprising the local government unit
(municipality), NIA and IA was formed to help the system recover. The municipality takes care of
collection and management of finances while the IA is responsible for pump operation and
maintenance and water distribution. Despite being included in the NIS roster, Bonga 2 is operated
like a CIS.
Looking at the performance indicators for Bonga 2, it is difficult to establish any pattern due to
insufficient data (Figure 14). However, data show that the decline in irrigation intensity, coincides
with the decreases in collection efficiency. The irrigation service fee (ISF) is the sole source of
income which is supposed to cover O&M expenses and amortization payment to NIA (Table 3).
Madongan
Madongan is a medium size system with an initial service area of 3,200 ha in 2001 which decreased
to over 1,400 ha in 2012 (Figure 15). Both the actual irrigated wet and dry, however, dropped
drastically in 2004-2005 and remained constant up to 2012 (Figure 15). The big drop in actual (wet
and dry) irrigated areas from 2004 onwards was due to the major damage in head structure caused
by typhoon Igme. Specifically, the left side of the system was seriously damaged and became non-
operational while in the right-side, the siphon #1 was silted and was partially operational (David,
et al. 2012). The damage to overflow dam had been severe, reducing actual irrigated area to about
20% of the design. Yabes (2008) attributes the big drop in service area to typhoons and the lack of
NIA funds for repairs (before Igme, there was Feria in 2001).
Despite the 100-year flood design, the severe damage to Madongan was attributed by David, et al.
to: (a) error in estimating the design flood, (b) shifting hydrographs due to watershed degradation,
and (c) poor construction standards. Even before the typhoon, a large discrepancy between design
area and irrigated area was noted by David, et al. (2012) and cited a number of technical concerns
to explain the discrepancy.
For this system, the irrigation service fee (ISF) is the main source of income which is supposed to
cover O&M expenses and amortization payment to NIA (Table 4).

43
Figure 14. Trends in key performance indicators, Bonga 2, Ilocos Norte Irrigation System,
Region 1, 1965-2013
Sources: NIA-SMD NISPER data, various years.

44
Figure 15. Trends in key performance indicators, Madongan, Ilocos Norte Irrigation System,
Region 1, 1965-2013
Sources: NIA-SMD NISPER data, various years.

45
Figure 16. Trends in key performance indicators, Nueva Era, Ilocos Norte Irrigation System,
Region 1, 1965-2013
Sources: NIA-SMD NISPER data, various years.

46
Figure 17. Trends in key performance indicators, Banaoang PIP, Ilocos Sur, Region 1, 1965-
2013
Sources: NIA-SMD NISPER data, various years.

47
Figure 18. Trends in key performance indicators, Ambayoan-Dipalo RC, Pangasinan, Region 1,
1965-2013
Sources: NIA-SMD NISPER data, various years.

48
Table 3. Performance Ratios of Bonga 2, 1966 – 2013
Ratios 1976 1977 1978 1979 1980 1981 1982 2001 2002 2003 2004 2005 2006 2007 2008 2009 2010 2011 2012 2013
Filled-up/Plantilla (%)
FUSA/Filled-up (Ha/staff) FUSA/Filled-up + Daily Staff
(Ha/staff)
FUSA/SA (%) 100 100 100 100 100 100 100 100 100 100 100
Ben. Wet/Actual Wet (%) 100 81 100 99 100 100
Ben. Dry/Actual Dry (%) 78 45 73 84 85 87 74 100
ISF Current Account/Total Income (%) 76
ISF Back Account/Total income
(%) 9
Other Income/Total Income (%) 5
Total Income (%) 90
Total ISF/Total Income (%) 79 91 92 100 93 100 100 100 100
Yield Wet (cavan/ha)
Yield Dry (cavan/ha)
Sources: NIA-SMD NISPER data, various years.

49
Table 4. Performance Ratios of Madongan, 2001 – 2013
Ratios 2001 2002 2003 2004 2005 2006 2007 2008 2009 2010 2011 2012 2013
Filled-up/Plantilla (%)
FUSA/Filled-up (Ha/staff)
FUSA/Filled-up + Daily Staff (Ha/staff)
FUSA/SA (%) 100 100 100 100 100 100 100 100 100 100 100
Ben. Wet/Actual Wet (%) 100
Ben. Dry/Actual Dry (%) 100
ISF Current Account/Total Income (%) 85
ISF Back Account/Total income (%) 1
Other Income/Total Income (%) 12
Total Income (%) 98.23
Total ISF/Total Income (%) 94 59 90 100 100 89 105 92 100 100
Yield Wet (cavan/ha)
Yield Dry (cavan/ha)
Sources: NIA-SMD NISPER data, various years.

50
Nueva Era
Again, there is not enough data for Nueva Era to establish any pattern. Like Madongan, the system
was also badly damaged by typhoons especially Igme. After typhoon Igme, the system was heavily
damaged and silted and was not operational which explains the drastic declines in performance
(ratios to current collectibles of current collections and total collections, with irrigation intensity,
have downward trends in Table 5, Figure 16). Total ISF collections as part of total income and
collection efficiency correspondingly drastically declined.
Banaoang
Banaoang in Ilocos Sur is a newly completed system, thus data only started in 2010. So far, a
declining trend for service area and irrigated wet are reported while the ratios to current collectibles
to total current collections and share of current to total collections trend upward. With already
small farms, farmers were not willing to give up land for right of way or were not willing to pay
for irrigation service. Due to this, the realized service area has been much lower than the designed
area.
The same decreasing pattern can be seen for both O&M cost per service area and per FUSA. Lastly,
both irrigation intensity and viability index trend downward (Figure 17, Table 6).

51
Table 5. Performance Ratios of Nueva Era, 2001 – 2013
Ratios 2001 2002 2003 2004 2005 2006 2007 2008 2009 2010 2011 2012 2013
Filled-up/Plantilla (%)
FUSA/Filled-up (Ha/staff)
FUSA/Filled-up + Daily Staff (Ha/staff)
FUSA/SA (%) 100 100 100 100 100 100 100 100 100 100 100
Ben. Wet/Actual Wet (%) 100
Ben. Dry/Actual Dry (%)
ISF Current Account/Total Income (%) 52
ISF Back Account/Total income (%)
Other Income/Total Income (%) 48
Total Income (%) 100
Total ISF/Total Income (%) 77 25 1
Yield Wet (cavan/ha)
Yield Dry (cavan/ha)
Sources: NIA-SMD NISPER data, various years.

52
Table 6. Performance Ratios of Banaoang, 2002 – 2013
Ratios 2002 2003 2004 2005 2006 2007 2008 2009 2010 2011 2012 2013
Filled-up/Plantilla (%) 36
FUSA/Filled-up (Ha/staff) 782
FUSA/Filled-up + Daily Staff (Ha/staff) 782
FUSA/SA (%) 60 100
Ben. Wet/Actual Wet (%) 100 100
Ben. Dry/Actual Dry (%) 100 100
ISF Current Account/Total Income (%) 81 94
ISF Back Account/Total income (%) 17 4
Other Income/Total Income (%) 2 2
Total Income (%) 100 100
Total ISF/Total Income (%) 98 98
Yield Wet (cavan/ha) 105 105
Yield Dry (cavan/ha) 85 95
Sources: NIA-SMD NISPER data, various years.

53
Ambayoan-Dipalo
Service area of Ambayoan-Dipalo dropped from 10,800 ha. to 2,445 ha. in 1974. It then recovered
and settled at 6,300 ha since 1988. Irrigated areas during wet seasons generally showed a
downward trend after 1976 while dry seasons fluctuated through the years with a slightly upward
trend.
The system has a low collection efficiency never reaching above 50%. While, the collection
efficiency as well as the ratio of ISF collections to collections and total income seemed to increase
slightly in the later years. Shares of back account collections generally showed an increasing trend
from 1989 to 2008. Cropping intensity as ratio of the sum of irrigated wet and dry area to either
irrigated wet or dry area showed an upward direction over time reaching up to 157% in 2013. On
the other hand, O&M cost per service area followed a downward path after its peak in 1992.
Viability index rose from 33% to 131% in 2013 (Figure 18).
Table 7 shows additional indicators to profile these two systems. The coverage area per staff
spiked to 578 ha per staff in 2013. This relatively big coverage per staff might hinder the staff from
providing the necessary services to their assigned areas. The gaps between irrigated area and FUSA
during dry season ranged from 62% to 75% are higher compared to wet season which only ranged
from 18% to 43%. These gaps are likely caused by lack of water supply and defective facilities.
But, despite of these gaps, benefited to irrigated area showed high ratios across the year averaging
at 97% during wet seasons and 94% during dry seasons.
Most of the total income comes from current account collections averaging at 57%, followed by
the other income like equipment rentals at 23% and then, by back collections at 17%. The system
has very low collection efficiency and viability index compared to other systems averaging only
at 19% and 62%, respectively.
Region 2 Cagayan Valley
Magapit Pump Irrigation System (PIS)
The service area of Magapit PIS has been increasing over time. In 2012, it more than tripled its
size from 3,523 has in 1986 to 11,875 ha. Actual irrigated areas during wet and dry seasons also
correspondingly increased (Figure 19).
Collections and income ratios fluctuated over the years (Table 8). Shares of current and back
collection to total collection moved symmetrically at opposite trends from each other. Ratios of
irrigated area to FUSA during wet season fluctuated towards 50% while during dry seasons it
fluctuated towards 100%. The ratio of benefited area to irrigated area during wet season seemed
to stabilize in the later years while dry season showed a slightly downward trend. Cropping
intensity fluctuated towards 150% from 1993 to 2012. O&M cost per service area also showed
steep movement over the years having peaks up to PhP 4,672/ha in 1991 and dips up to 417 in

54
Figure 19. Trends in key performance indicators, Magapit PIS, Cagayan, Region 2, 1965-2013
Sources: NIA-SMD NISPER data, various years.

55
Table 7. Performance Ratios of Ambayoan-Dipalo, 1983 – 2003
Ratios 1983 1984 1985 1986 1987 1988 1989 1990 1991 1992 1993 1994 1995 1996 1997 1998 1999 2000 2001 2002 2003
Filled-up/Plantilla (%)
FUSA/Filled-up (Ha/staff) FUSA/Filled-up + Daily Staff
(Ha/staff)
FUSA/SA (%)
Ben. Wet/Actual Wet (%) 99 99 100 99 100 93 100 100 100 73 94 100 100 100 100 90 89 100 100 100 100
Ben. Dry/Actual Dry (%) 76 71 93 100 100 99 100 100 99 100 100 100 95 100 100 100 100 100 100 98 74
ISF Current Account/Total Income
(%) 75 75 75 49 55 74 72 55 63 32 54 36 53 36 36 80 24 20 39 46 46 ISF Back Account/Total income (%) 25 25 25 16 18 25 5 6 13 7 6 10 8 11 9 20 7 8 13 21 24
Other Income/Total Income (%) 40 25 61 40 54 39 53 54 0 69 72 49 32 30
Total Income (%) 100 100 100 65 73 99 77 101 101 100 100 100 100 100 99 100 100 100 101 99 100
Total ISF/Total Income (%) 100 100 100 65 74 99 77 60 75 39 60 46 61 47 46 100 31 28 51 68 70
Yield Wet (cavan/ha) 75 76 75 75 75 76 78 78 78 81 91 100 90 53
Yield Dry (cavan/ha) 76 77 76 77 77 77 78 79 80 83 83 80 85 80
Sources: NIA-SMD NISPER data, various
years.

56
Table 7. Performance Ratios of Ambayoan-Dipalo, 2004 – 2013
Ratios 2004 2005 2006 2007 2008 2009 2010 2011 2012 2013
Filled-up/Plantilla (%) 25 38 25 25 25 54
FUSA/Filled-up (Ha/staff) 506 809 506 506 506 578 FUSA/Filled-up + Daily Staff
(Ha/staff) 337 674 337 337 337 506
FUSA/SA (%) 63 63 50 63 63 63 63 63 64 64
Ben. Wet/Actual Wet (%) 100 100 100 100 100 88 77 74 100 100
Ben. Dry/Actual Dry (%) 100 100 100 100 100 100 100 100 100 100
ISF Current Account/Total Income
(%) 54 59 41 69 55 62 82 77 82 85 ISF Back Account/Total income
(%) 17 41 28 26 30 33 15 13 16 13
Other Income/Total Income (%) 29 1 32 4 15 5 3 10 2 2
Total Income (%) 100 101 101 99 100 100 100 100 100 100
Total ISF/Total Income (%) 71 99 68 96 85 95 97 90 98 98
Yield Wet (cavan/ha) 89 79 78 80 90 84 90 90
Yield Dry (cavan/ha) 90 80 75 80 89 80 85 90 79
Sources: NIA-SMD NISPER data, various years.

57
Table 8. Performance Ratios of Magapit, 1986 – 2003
Ratios 1986 1987 1988 1989 1990 1991 1992 1993 1994 1995 1996 1997 1998 1999 2000 2001 2002 2003
Filled-up/Plantilla (%)
FUSA/Filled-up (Ha/staff)
FUSA/Filled-up + Daily Staff (Ha/staff)
FUSA/SA (%)
Ben. Wet/Actual Wet (%) 100 100 98 0 100 100 86 51 80 91 51 61 65 100 98 100 90
Ben. Dry/Actual Dry (%) 88 80 100 100 100 99 98 100 98 78 83 100 100 68 97 100 80
ISF Current Account/Total Income (%) 58 58 62 86 94 88 82 82 74 79 72 82 83 49 59 31 53 53
ISF Back Account/Total income (%) 42 42 46 14 6 12 12 16 15 16 22 13 16 10 14 11 13 12
Other Income/Total Income (%) 6 2 11 5 6 5 1 40 27 57 33 34
Total Income (%) 100 100 108 100 100 100 100 100 100 100 100 100 100 99 100 99 99 99
Total ISF/Total Income (%) 100 100 108 100 100 100 94 98 89 95 94 95 99 60 73 43 67 66
Yield Wet (cavan/ha) 75 76 77 78 79 79 80 80 81 81 82 74 78
Yield Dry (cavan/ha) 78 79 80 81 81 82 83 84 75 84 85 85 75 83
Sources: NIA-SMD NISPER data, various years.

58
Table 8. Performance Ratios of Magapit, 2004 – 2013
Ratios 2004 2005 2006 2007 2008 2009 2010 2011 2012 2013
Filled-up/Plantilla (%) 40 53 53 53 53
FUSA/Filled-up (Ha/staff) 419 408 306 306 306 306
FUSA/Filled-up + Daily Staff (Ha/staff) 150 408 306 306 306 306
FUSA/SA (%) 86 86 100 100 100 82 82 82 82 97
Ben. Wet/Actual Wet (%) 79 45 93 95 33 80 81 50 46 60
Ben. Dry/Actual Dry (%) 84 91 84 94 97 91 98 93 94 90
ISF Current Account/Total Income (%) 88 89 88 82 83 54 85 88 90 44
ISF Back Account/Total income (%) 9 9 10 11 14 5 15 11 10 3
Other Income/Total Income (%) 3 3 2 7 3 41 0 1 0 53
Total Income (%) 100 101 100 100 100 100 100 100 100 100
Total ISF/Total Income (%) 97 97 98 93 97 59 100 99 100 47
Yield Wet (cavan/ha) 70 76 62 83 60 78
Yield Dry (cavan/ha) 78 80 85 88 85 80
Sources: NIA-SMD NISPER data, various years.

59
2012. Viability index exhibited an increasing trend starting at 39% in 1986 and ending at 115% in
2013.
Filled-up plantilla position was constant at 53% from 2010 to 2013. FUSA to filled-up plus daily
staff also had minimal changes, ending at 306 ha. per staff in 2013. The ratios of actual irrigated
areas to FUSA are much lower in the wet seasons, averaging 45%, compared to dry seasons which
average of 89%. This pattern is likely caused by calamities or floods during the wet season.
Collection efficiencies in terms of ratios of ISF current account and total ISF (current plus back
accounts) to total income do not show any clear trend. The ISF collections comprise 73% of total
income over the years. Viability index, despite its fluctuations, generally followed an upward trend
peaking at 254% in 2012.
Visitacion Irrigation System
Visitacion in Cagayan is an interesting case because it was a communal system which has been
converted to an NIS. Apparently, funding constraints led to the slow pace of development of
irrigation facilities of Dagupan CIS. In addition, the inadequate staff of NIA resulted in the poor
social condition of water users because of the disorganized IA which led further to the deterioration
of irrigation facilities. This condition motivated the IAs, with strong support from the LGU of Sta.
Ana to pursue the conversion of Visitacion CIA into an NIS. The thinking was that, with the
conversion, the funding problem would be addressed and the system will be restored to its fully
operational condition and fully developed.
Collection efficiency tends to fluctuate through the years with no clear trend while the other
collections and income ratios appear to be stable (Figure 20). The ratios of benefited to irrigated
areas do not show any clear trends. Cropping intensity, on the other hand has been increasing and
reached 122% in 2013. The same trend is observed with the O&M cost per SA and viability index
(Table 9).
There is no data on filled-up plantilla positions of Visitacion. In the last 5 years, no land conversion
has been reported with FUSA equal to SA. But ratios of actual irrigated area to FUSA show
relatively low averages of 50% during the wet season and about 30% in the dry season. These low
irrigation intensities are essentially due to the poor physical state of the irrigation system, defective
facilities and lack of water supply.
The ISF current account collection accounts for the system’s income averaging at 99%. The
cropping intensity has an increasing trend despite drops in various years. Viability index also
exhibits the same upward trend from 103% in 2004 to 193% in 2013.

60
Figure 20. Trends in key performance indicators, Visitacion RIS, Cagayan, Region 2, 1965-2013
Sources: NIA-SMD NISPER data, various years.
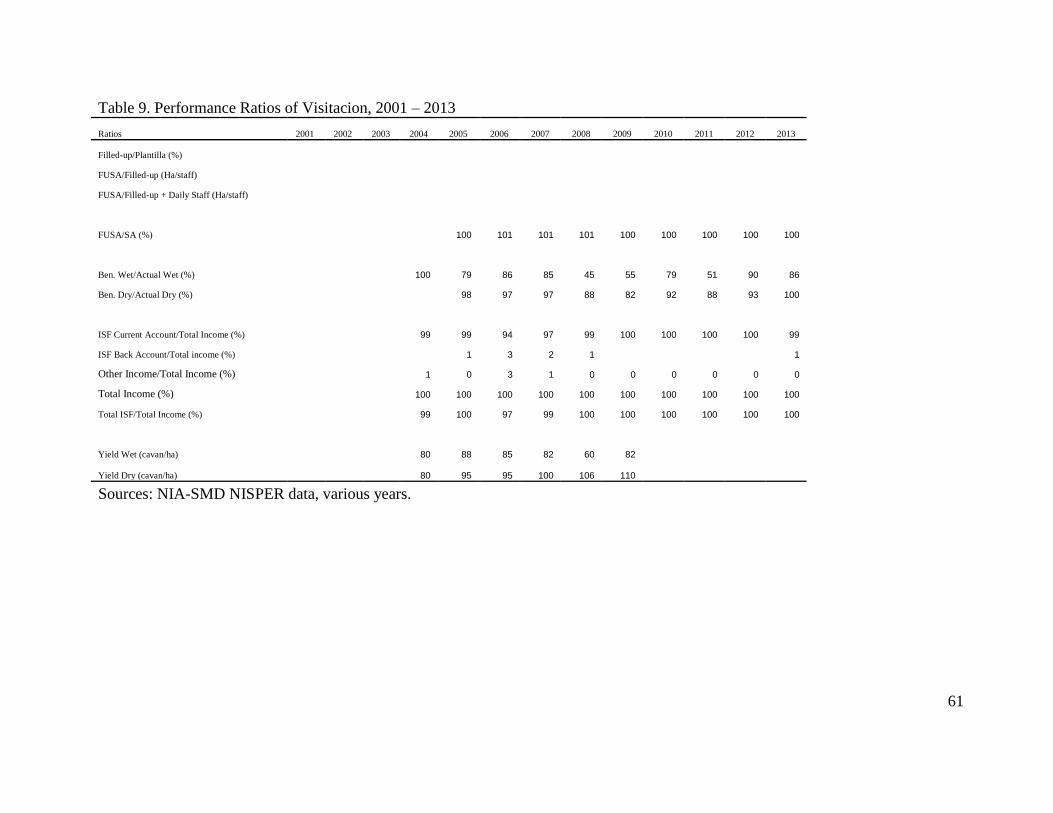
61
Table 9. Performance Ratios of Visitacion, 2001 – 2013
Ratios 2001 2002 2003 2004 2005 2006 2007 2008 2009 2010 2011 2012 2013
Filled-up/Plantilla (%)
FUSA/Filled-up (Ha/staff)
FUSA/Filled-up + Daily Staff (Ha/staff)
FUSA/SA (%) 100 101 101 101 100 100 100 100 100
Ben. Wet/Actual Wet (%) 100 79 86 85 45 55 79 51 90 86
Ben. Dry/Actual Dry (%) 98 97 97 88 82 92 88 93 100
ISF Current Account/Total Income (%) 99 99 94 97 99 100 100 100 100 99
ISF Back Account/Total income (%) 1 3 2 1 1
Other Income/Total Income (%) 1 0 3 1 0 0 0 0 0 0
Total Income (%) 100 100 100 100 100 100 100 100 100 100
Total ISF/Total Income (%) 99 100 97 99 100 100 100 100 100 100
Yield Wet (cavan/ha) 80 88 85 82 60 82
Yield Dry (cavan/ha) 80 95 95 100 106 110
Sources: NIA-SMD NISPER data, various years.

62
Solana-Tuguegarao Pump Irrigation System
The service area of Solana-Tuguegarao barely increased from 2009 onwards (Figure 21a). FUSA
remained constant over the years. But with the increase in service area in 2009, the gap between
FUSA and SA increased to 12 % indicating land conversions and uncovered permanently non-
restorable areas.
Actual irrigated area started increasing around mid 2000s. These changes are consistent with the
installation of a new pump house in March 2002 under the Water Resources Development Project
(WRDP) Fund. This project was completed in 2003 and became operational during the wet season
crop in 2004.
The ratio of actual irrigated area to FUSA in wet season has a higher average over the years
compared to dry season. But, in terms of ratios of benefited area to irrigated area, dry season crop
did better indicating substantial areas during wet being exempted –either because of damage from
calamities or pests and diseases.
The ISF accounts for much of the system’s income averaging 87% over the years although its
share to total income dropped in 2009 and 2013 as other incomes like equipment rental increase
during these years (Table 10). Collection efficiency has sharp fluctuations exhibiting drops below
50% over the years. Starting in 1997, the share of current collection to total collections, on the
other hand, seemed to stabilize at 100%. Cropping intensity fluctuated over the years but showed
an increasing trend in the later years. O&M expenditure per ha has been increasing over time
starting at PhP. 2,611/ha in 1990 and PhP 12,669/ha in 2013. The same is true even for the O&M
over FUSA. In terms of viability of system (revenues exceeding O&M expenditures), the system
appears to be generally not viable except in 2009 and 2012.
Magat River Integrated Irrigation System (MRIIS) Division 2
Figures 22a to f show trends in key performance indicators for MRIIS 2. Service area is among
the largest of national systems at 23,241 ha until 2013 and when it increased to 25,718 ha. Actual
irrigated areas showed modest increases as they already approach the firmed-up service area,
indicating the system is almost fully operational. Aside from the share of ISF collection to total
income and collection efficiency which showed an upward trend in later years, ratios of collections
and income fluctuated towards the same level in earlier years. Cropping intensity as a ratio of
irrigated wet plus dry over FUSA generally has an upward trend despite dips in various years.
O&M cost per service area and O&M cost per FUSA moved with the same upward trend. Viability
index has a downward trend and exhibiting drops below 100%.
Looking at the ratio of filled-up plantilla positions to approved plantilla and firmed-up service
area, the coverage area per staff has increased from 225 ha in 2004 and increased to 399 ha in
2013 (Table 11). The gaps between actual irrigated areas in both wet and dry seasons and FUSA
over the years do not exceed 5%. Inadequate and/or defective facilities account for these gaps. The
ratios of benefited areas to irrigated areas across the years averaged 96% during dry season and
91% in the wet season indicating little crop damage by calamities and crop infestations.

63
Figure 21. Trends in key performance indicators, Solana-Tuguegarao, Cagayan, Region 2, 1965-
2013
Sources: NIA-SMD NISPER data, various years.

64
Figure 22. Trends in key performance indicators, MRIIS 2, Isabela, Region 2, 1965-2013
Sources: NIA-SMD NISPER data, various years.

65
Table 10. Performance Ratios of Solana-Tuguegarao PIS, 1990 – 2003
Ratios 1990 1991 1992 1993 1994 1995 1996 1997 1998 1999 2000 2001 2002 2003
Filled-up/Plantilla (%)
FUSA/Filled-up (Ha/staff)
FUSA/Filled-up + Daily Staff (Ha/staff)
FUSA/SA (%)
Ben. Wet/Actual Wet (%) 100 91 44 63 72 46 7 87 100
Ben. Dry/Actual Dry (%) 96 100 100 100 100 72 86 100 100 100 100 100 98
ISF Current Account/Total Income (%) 93 86 81 89 88 68 83 100 100 91 82 93 91
ISF Back Account/Total income (%) 6 13 18 11 8 26 17 0 0 0 0 0 2
Other Income/Total Income (%) 1 2 1 0 4 6 0 0 0 9 100 18 6 7
Total Income (%) 100 101 100 100 100 100 100 100 100 100 100 100 99 100
Total ISF/Total Income (%) 99 98 99 100 96 94 100 100 100 91 82 94 93
Yield Wet (cavan/ha) 80 75 81
Yield Dry (cavan/ha) 82 82 75 82 82 108 84
Sources: NIA-SMD NISPER data, various years.
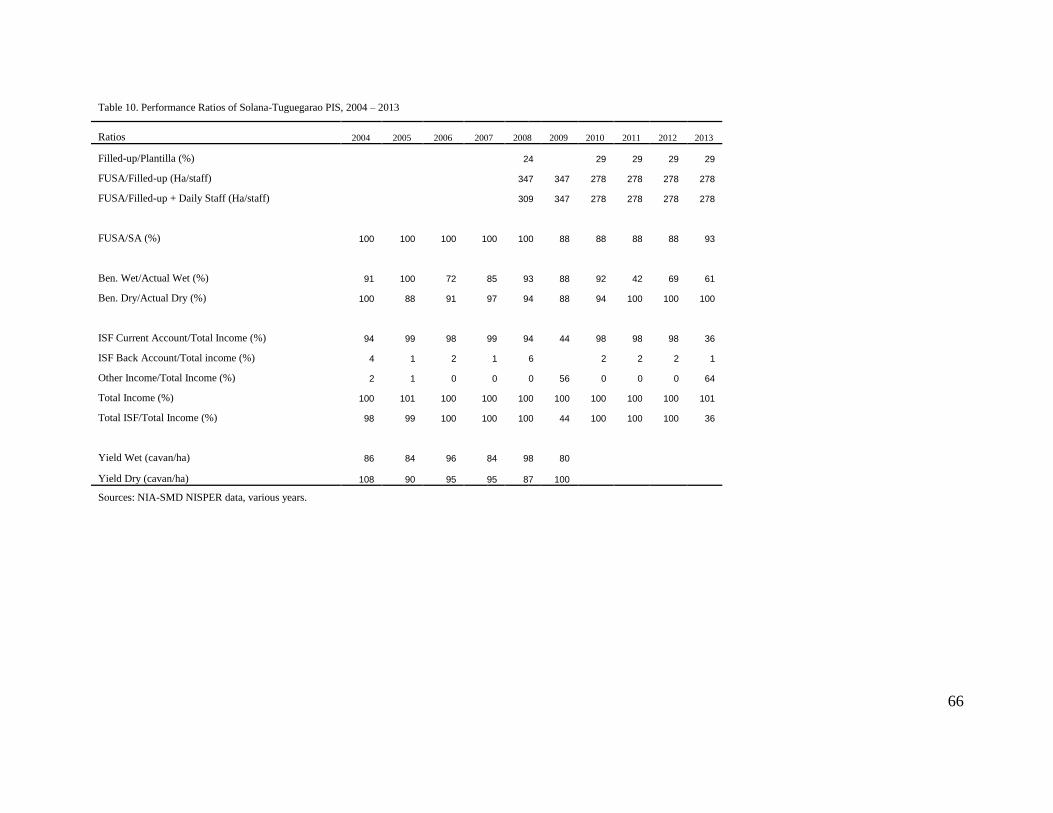
66
Table 10. Performance Ratios of Solana-Tuguegarao PIS, 2004 – 2013
Ratios 2004 2005 2006 2007 2008 2009 2010 2011 2012 2013
Filled-up/Plantilla (%) 24 29 29 29 29
FUSA/Filled-up (Ha/staff) 347 347 278 278 278 278
FUSA/Filled-up + Daily Staff (Ha/staff) 309 347 278 278 278 278
FUSA/SA (%) 100 100 100 100 100 88 88 88 88 93
Ben. Wet/Actual Wet (%) 91 100 72 85 93 88 92 42 69 61
Ben. Dry/Actual Dry (%) 100 88 91 97 94 88 94 100 100 100
ISF Current Account/Total Income (%) 94 99 98 99 94 44 98 98 98 36
ISF Back Account/Total income (%) 4 1 2 1 6 2 2 2 1
Other Income/Total Income (%) 2 1 0 0 0 56 0 0 0 64
Total Income (%) 100 101 100 100 100 100 100 100 100 101
Total ISF/Total Income (%) 98 99 100 100 100 44 100 100 100 36
Yield Wet (cavan/ha) 86 84 96 84 98 80
Yield Dry (cavan/ha) 108 90 95 95 87 100
Sources: NIA-SMD NISPER data, various years.

67
Table 11. Performance Ratios of MRIIS 2, 1986 – 2003
Ratios 1986 1987 1988 1989 1990 1991 1992 1993 1994 1995 1996 1997 1998 1999 2000 2001 2002 2003
Filled-up/Plantilla (%)
FUSA/Filled-up (Ha/staff)
FUSA/Filled-up + Daily Staff (Ha/staff)
FUSA/SA (%)
Ben. Wet/Actual Wet (%) 99 97 93 93 100 96 96 72 93 97 100 95 76 83 95 68 90 95
Ben. Dry/Actual Dry (%) 100 95 97 100 100 99 98 95 99 89 98 99 95 100 98 98 96 76
ISF Current Account/Total Income (%) 78 78 79 80 72 82 79 75 77 83 78 80 82 72 76 79 84 77
ISF Back Account/Total income (%) 21 21 21 19 24 17 21 24 22 16 21 20 17 26 22 15 14 16
Other Income/Total Income (%) 4 1 0 0 1 1 1 0 1 1 1 6 2 7
Total Income (%) 99 99 100 99 100 100 100 99 100 100 100 100 100 99 99 100 100 100
Total ISF/Total Income (%) 99 99 100 99 96 99 100 100 99 99 99 100 99 99 99 94 98 93
Yield Wet (cavan/ha) 75 75 76 76 77 77 79 81 81 80 98 89 89 89
Yield Dry (cavan/ha) 77 77 78 79 79 80 80 83 75 82 101 101 101 101
Sources: NIA-SMD NISPER data, various years.

68
Table 11. Performance Ratios of MRIIS 2, 2004 – 2013
Ratios 2004 2005 2006 2007 2008 2009 2010 2011 2012 2013
Filled-up/Plantilla (%) 37 72 37 88 37 92
FUSA/Filled-up (Ha/staff) 319 527 319 428 337 435
FUSA/Filled-up + Daily Staff (Ha/staff) 225 287 225 372 237 399
FUSA/SA (%) 98 98 98 98 98 98 98 98 103 93
Ben. Wet/Actual Wet (%) 99 100 84 100 95 95 61 72 100 100
Ben. Dry/Actual Dry (%) 100 100 100 100 100 100 74 98 100 97
ISF Current Account/Total Income (%) 78 76 62 76 82 82 75 81 82 83
ISF Back Account/Total income (%) 21 23 35 22 18 17 24 17 17 16
Other Income/Total Income (%) 1 1 3 2 1 1 1 2 1 1
Total Income (%) 100 100 100 100 101 100 100 100 100 100
Total ISF/Total Income (%) 99 99 97 98 99 99 99 98 99 99
Yield Wet (cavan/ha) 96 103 78 102 87 87
Yield Dry (cavan/ha) 101 107 94 107 104 95 83
Sources: NIA-SMD NISPER data, various years.

69
Magat River Integrated Irrigation System (MRIIS) Division 4
MARIIS 4 service area and firmed-up service area have hardly changed over time until 2013 when
service area increased to 24,000 ha (Figure 23). Actual irrigated areas generally exhibited an
upward trend over the years.
The ratios of ISF current collection to total income moved in an upward trend starting in 2006
(Table 12). The same upward pattern is observed of its collection efficiency reaching up to 83%
in 2013.
Shares of current and back collection to total income moved across the years in more or less the
same level they started. Benefited area during wet season moved through the years with more dips
compared to dry season. This might be due to occurrence of calamities like typhoons and flooding
during wet seasons. Cropping intensity as a ratio of irrigated wet plus dry to FUSA has an upward
trend. O&M cost per service area as well as the O&M cost per FUSA exhibited peaks and dips in
various years but generally has an increasing trend. Viability index fluctuated over the years with
a slightly decreasing trend exhibiting dips below 1.0 in various years.
The ratio of filled-up plantilla positions to approved plantilla fluctuated as the plantilla positions
varied annually. The coverage area per staff has a slightly increasing trend reaching 342 ha per
staff in 2013. The gaps of irrigated areas and FUSA reached 10%. This is likely due to defective
or inadequate facilities. Ratios of benefited area to irrigated area during wet season are much lower
averaging only at 87% compared to the 96% during dry season. This might be due to occurrence
of calamities like typhoons during wet seasons.
Despite the dips in various years, the ratios of ISF collection to total income as well as collection
efficiency have been increasing over time. Viability index, on the contrary, fluctuated downward
with dips reaching up to 0.74 in 2008.

70
Figure 23. Trends in key performance indicators, MRIIS 4, Isabela, Region 2, 1965-2013
Sources: NIA-SMD NISPER data, various years.

71
Table 12. Performance Ratios of MRIIS 4, 1986 – 2003
Ratios 1986 1987 1988 1989 1990 1991 1992 1993 1994 1995 1996 1997 1998 1999 2000 2001 2002 2003
Filled-up/Plantilla (%)
FUSA/Filled-up (Ha/staff)
FUSA/Filled-up + Daily Staff (Ha/staff)
FUSA/SA (%)
Ben. Wet/Actual Wet (%) 99 97 93 93 100 96 96 72 93 97 100 95 76 83 95 68 90 95
Ben. Dry/Actual Dry (%) 100 95 97 100 100 99 98 95 99 89 98 99 95 100 98 98 96 76
ISF Current Account/Total Income (%) 78 78 79 80 72 82 79 75 77 83 78 80 82 72 76 79 84 77
ISF Back Account/Total income (%) 21 21 21 19 24 17 21 24 22 16 21 20 17 26 22 15 14 16
Other Income/Total Income (%) 4 0 1 0 0 0 6 15 17 16 25 4 2 3
Total Income (%) 99 99 100 99 100 99 101 99 99 99 105 115 116 114 123 98 100 96
Total ISF/Total Income (%) 99 99 100 99 96 99 100 100 99 99 99 100 99 99 99 94 98 93
Yield Wet (cavan/ha) 75 75 76 76 77 77 79 81 81 80 98 89 89 89
Yield Dry (cavan/ha) 77 77 78 79 79 80 80 83 75 82 101 101 101 101
Sources: NIA-SMD NISPER data, various years.

72
Table 12. Performance Ratios of MRIIS 4, 2004 – 2013
Ratios 2004 2005 2006 2007 2008 2009 2010 2011 2012 2013
Filled-up/Plantilla (%) 37 72 37 88 37 92
FUSA/Filled-up (Ha/staff) 319 527 319 428 337 435
FUSA/Filled-up + Daily Staff (Ha/staff) 225 287 225 372 237 399
FUSA/SA (%) 98 98 98 98 98 98 98 98 103 93
Ben. Wet/Actual Wet (%) 99 100 84 100 95 95 61 72 100 100
Ben. Dry/Actual Dry (%) 100 100 100 100 100 100 74 98 100 97
ISF Current Account/Total Income (%) 78 76 62 76 82 82 75 81 82 83
ISF Back Account/Total income (%) 21 23 35 22 18 17 24 17 17 16
Other Income/Total Income (%) 0 0 6 4 0 0 1 0 1 2
Total Income (%) 99 99 103 102 100 99 100 98 100 101
Total ISF/Total Income (%) 99 99 97 98 99 99 99 98 99 99
Yield Wet (cavan/ha) 96 103 78 102 87 87
Yield Dry (cavan/ha) 101 107 94 107 104 95 83
Sources: NIA-SMD NISPER data, various years.

73
Region 3 Central Luzon
Angat-Maasim River Irrigation System (AMRIS)
Angat-Maasim in Bulacan has an unchanged service area (Figure 24). However, it may be
important to note the big dips in areas for irrigated dry and wet from highs of almost 30,000 has.
to below 15,000 has. in 1990 and 2005 respectively.
No clear trend with the collections and income ratios can be established (Table 13). In 1998, shares
of back to total collection and total collections to current collectibles peaked at about 90%. On the
other hand, shares of current to total collections, total ISF collections to total income, and current
collections to current collectibles dipped and recovered slightly after. It seems interesting to note
that all measures seem to converge towards 50% in 2013. Cropping intensity as ratio of the sum
of irrigated wet and dry area to FUSA does not fall below 150%. O&M cost per service area was
declining from about PhP1,700 per hectare in the 1980s to less than PhP1,000 per hectare in 2013.
On the contrary, viability index constantly rose to almost 1.5 in 2013.
Filled-up plantilla position was constant at 39% from 2008 to 2013. FUSA to filled-up plus daily
staff also had minimal changes, increasing slightly to 203 ha per staff in 2013. Though irrigated
areas in the wet season is lower back in 2004 with a 30% gap, it has closed the gap by half with
the irrigated dry as it increase to 83% in 2013.
Ratios to total income of ISF current account and total ISF and collection efficiency appear to have
a downward tread. On the other contrary, ISF back account ratio to total income and viability index
both increased across the years.
Pampanga Delta River Irrigation System (PDRIS)
Pampanga Delta’s service area has been pegged at 8000 ha over the years with a slight increase in
2013 (Figure 25). Actual irrigated area in the dry season has been increasing over the years,
reaching over 5,000 ha in 2013. On the other hand, wet season actual irrigated area has been
generally low with over 2,000 ha in 2010 and only 433 ha in 2012. There is also no clear trend for
the share of total ISF collections to total income, though it started at near 100% with a general
downward direction (Table 14). Cropping intensity as ratio of the sum of irrigated wet and dry
area to FUSA in Pampanga Delta is generally increasing with downward dips in 2010 and 2012.
O&M cost per service area was increasing before 2005, however as data for O&M cost per FUSA
became available, it followed its downward trend. Viability index dropped greatly in 2003, but it
has recovered and has averaged at about 1.0.
FUSA per staff, which includes both filled-up and daily staff, averages at around 262 has. This
relatively stable movement is also seen for FUSA per service area averaging at around 72.

74
Irrigated wet per FUSA averaged at about 10% with peak at 32% in 2011. On the other hand,
actual wet irrigated area over FUSA remained more than double the dry ranging from 34% to 52%
in 2013. This gap may be due to defective or inadequate facilities like lack of drainage.
The ratios of ISF current account to total income, total ISF to total income, and collection
efficiency follow downward but fluctuating trends from 97%, 97%, and 94% respectively in 2003
to 83%, 87%, and 52% respectively in 2013.

75
Figure 24. Trends in key performance indicators, Angat-Maasim RC, Bulacan, Region 3, 1965-
2013
Sources: NIA-SMD NISPER data, various years.

76
Figure 25. Trends in key performance indicators, Pampanga Delta RIS, Pampanga, Region 3,
1965-2013
Sources: NIA-SMD NISPER data, various years

77
Table 13. Performance Ratios of AMRIS, 1983 – 2003
Ratios 1983 1984 1985 1986 1987 1988 1989 1970 1991 1992 1993 1994 1995 1996 1997 1998 1999 2000 2001 2002 2003
Filled-up/Plantilla (%)
FUSA/Filled-up (Ha/staff) FUSA/Filled-up + Daily Staff
(Ha/staff)
FUSA/SA (%)
Ben. Wet/Actual Wet (%) 100 98 97 98 100 89 100 98 100 94 95 86 100 99 100 58 92 78 89 100 96
Ben. Dry/Actual Dry (%) 96 100 99 102 100 100 100 87 100 99 100 98 100 95 100 95 99 100 100 97
ISF Current Account/Total Income
(%) 69 69 69 69 72 69 73 48 73 58 60 61 46 38 39 4 24 41 43 67 67
ISF Back Account/Total income (%) 31 31 31 31 33 31 27 22 13 13 17 17 18 25 21 23 12 19 22 14 24
Other Income/Total Income (%) 30 14 29 23 21 36 37 40 73 64 40 35 19 9
Total Income (%) 100 100 100 100 105 100 100 100 100 100 100 99 100 100 100 100 100 100 100 100 100
Total ISF/Total Income (%) 100 100 100 100 105 100 100 70 86 71 77 79 64 63 60 27 36 60 65 81 91
Yield Wet (cavan/ha) 76 78 79 80 82 82 80 82 82 85 85 85 82 82
Yield Dry (cavan/ha) 78 81 82 82 84 85 85 85 88 90 88 88 88
Sources: NIA-SMD NISPER data, various years.

78
Table 13. Performance Ratios of AMRIS, 2004 – 2013
Ratios 2004 2005 2006 2007 2008 2009 2010 2011 2012 2013
Filled-up/Plantilla (%) 39 39 39 39 39 39
FUSA/Filled-up (Ha/staff) 188 189 189 206 206 208
FUSA/Filled-up + Daily Staff (Ha/staff) 184 185 185 201 201 203
FUSA/SA (%) 85 85 85 85 87 87 85 84 84 85
Ben. Wet/Actual Wet (%) 99 100 90 89 100 72 100 30 56 58
Ben. Dry/Actual Dry (%) 100 100 94 100 100 100 100 75 74 100
ISF Current Account/Total Income (%) 55 60 58 57 58 72 64 55 49 43
ISF Back Account/Total income (%) 19 14 22 19 22 19 23 24 20 29
Other Income/Total Income (%) 26 26 21 24 20 9 13 21 30 28
Total Income (%) 100 100 101 100 100 100 100 100 99 100
Total ISF/Total Income (%) 74 74 79 76 80 91 87 79 70 72
Yield Wet (cavan/ha) 81 82 82 82 85
Yield Dry (cavan/ha) 88 86 85 86 91 95
Sources: NIA-SMD NISPER data, various years.

79
Table 14. Performance Ratios of Pampanga Delta, 2003 – 2013
Ratios 2003 2004 2005 2006 2007 2008 2009 2010 2011 2012 2013
Filled-up/Plantilla (%)
FUSA/Filled-up (Ha/staff)
FUSA/Filled-up + Daily Staff (Ha/staff) 237 262 262 262 262 304
FUSA/SA (%) 78 78 67 67 66 72 72 72 72 81
Ben. Wet/Actual Wet (%) 100 100 100 100 100 57 100 14 100 100
Ben. Dry/Actual Dry (%) 85 100 96 90 100 100 100 100 91 100 100
ISF Current Account/Total Income (%) 97 88 78 84 79 76 61 57 85 71 83
ISF Back Account/Total income (%) 0 4 19 15 15 12 8 4 8 5 4
Other Income/Total Income (%) 3 7 3 1 7 12 31 39 7 24 13
Total Income (%) 100 99 100 100 101 100 100 100 100 100 100
Total ISF/Total Income (%) 97 93 97 99 93 88 69 61 93 76 87
Yield Wet (cavan/ha) 83 80 81 85 89 82
Yield Dry (cavan/ha) 86 83 83 95 94 85 85
Sources: NIA-SMD NISPER data, various years.

80
Tarlac Groundwater Irrigation System (TGIS)
Given the interest in the viability and sustainability in deepwell irrigation, the TGIS was selected.
However, there is hardly any information on the TGIS at the Central Office. Going to the field
office, we found that data for the systems under the TGIS hardly exist except for the personal notes
of the irrigation development officer (IDO) in-charged of amortization payments. The TGIS is
actually 72 CIS systems which have been clustered and listed as among the NIS which partly
explains the lack of data.
So, in place of the TGIS, the team decided to cover TASMORIS instead. Highlights of the
interviews of IA officers from three TGIS systems are in Annex 1.
Tarlac-San-Miguel O’Donell River Irrigation System (TASMORIS)
TASMORIS’s service area has a generally declining trend starting at about 20,000 has. and
dropping to 5,000 has. from the 1960s until 2009 (Figure 26). However, it recovered in the later
years reaching 15,000 has. in 2013.The same trend can be observed for irrigated areas during both
wet and dry seasons. Movement of collections ratios have no clear trend, but all measures
experienced a huge dip in the early 2000s. Cropping intensity as ratio of the sum of irrigated wet
and dry areas to either wet or dry generally falls below 150%, but starting in 2006 rose above
150%. TASMORIS’ viability index generally has an upward trend.
Only 15% of plantilla positions are filled up likely due to either lack of funds or qualified
applicants (Table 15). FUSA per filled-up position increased more than twice in five years with
596 ha as coverage per staff in 2013. This large coverage and lack of resources may hinder the
staff from properly working on their assigned area.
The ratio of irrigated area during the wet season to FUSA almost always remained double the ratio
during the dry season from 2004 through 2013. This gap may be due to defective or inadequate
facilities like lack of drainage.
Ratios to total income of ISF current account, ISF back account, and total ISF were relatively
stable, along with collection efficiency. On the other hand, viability index fluctuated greatly with
a peak of 147 in 2008 and low point of 42 in 2013.
81
Figure 26. Trends in key performance indicators, TASMORIS, Tarlac, Region 3, 1965-2013
Sources: NIA-SMD NISPER data, various years.

82
Table 15. Performance Ratios of TASMORIS, 1983 –
2003
Ratios 1983 1984 1985 1986 1987 1988 1989 1990 1991 1992 1993 1994 1995 1996 1997 1998 1999 2000 2001 2002 2003
Filled-up/Plantilla (%)
FUSA/Filled-up (Ha/staff)
FUSA/Filled-up + Daily Staff
(Ha/staff)
FUSA/SA (%)
Ben. Wet/Actual Wet (%) 99 83 73 100 99 95 96 100 75 47 100 100 95 69 100 100
Ben. Dry/Actual Dry (%) 99 90 181 100 100 100 80 100 100 99 54 100 100 87 100 94 100
ISF Current Account/Total Income
(%) 89 89 89 88 85 55 79 75 87 28 27 3 7 1 5 6 6 11 32 31 45
ISF Back Account/Total income (%) 11 11 11 11 10 7 14 10 9 26 26 11 37 8 15 6 1 1 9 10 15
Other Income/Total Income (%) 15 4 47 47 87 56 91 81 88 93 89 59 59 40
Total Income (%) 100 100 100 99 95 62 93 100 100 101 100 101 100 100 101 100 100 101 100 100 100
Total ISF/Total Income (%) 100 100 100 99 95 61 93 85 96 53 53 13 44 9 19 12 7 11 41 41 60
Yield Wet (cavan/ha) 75 77 80 81 81 82 82 83 83
Yield Dry (cavan/ha) 76 77 79 79 75 82 83 86 86 86
Sources: NIA-SMD NISPER data, various
years.

83
Table 15. Performance Ratios of TASMORIS, 2004 – 2013
Ratios 2004 2005 2006 2007 2008 2009 2010 2011 2012 2013
Filled-up/Plantilla (%) 15 15 15 15 15 15
FUSA/Filled-up (Ha/staff) 190 189 324 324 346 596
FUSA/Filled-up + Daily Staff (Ha/staff) 176 175 300 300 320 552
FUSA/SA (%) 85 85 85 85 90 89 93 93 100 100
Ben. Wet/Actual Wet (%) 100 100 100 100 100 86 100 100 100 100
Ben. Dry/Actual Dry (%) 97 100 93 100 100 100 100 100 100 100
ISF Current Account/Total Income (%) 66 72 52 42 73 40 47 65 67 78
ISF Back Account/Total income (%) 16 12 13 15 10 5 6 11 9 13
Other Income/Total Income (%) 19 16 35 42 17 55 47 25 24 10
Total Income (%) 101 100 100 99 100 100 100 101 100 101
Total ISF/Total Income (%) 81 84 65 58 83 45 53 75 76 90
Yield Wet (cavan/ha) 82 81 82 86 81
Yield Dry (cavan/ha) 86 82 85 87 85 85
Sources: NIA-SMD NISPER data, various years.

84
Upper Pampanga River Integrated Irrigation System (UPRIIS), Division 2
Figure 27a shows UPRIIS Division 2 service area has a slightly declining trend experiencing
significant dips in 1994 and 2005. It dropped from 25,327 ha in 1976 to 24,000 has. in 2013.
Irrigated areas also had big dips in various years especially during dry seasons. But, starting in
2004, they moved in a more or less stable manner following FUSA’s trend. The share of total ISF
to total income fluctuated across the years but stabilized starting in 2002. As share of back
collection increased, share of current collectible to total collections fluctuated downward.
Collection efficiency and total collections to current collectibles had an upward movement.
Cropping intensities had drops over the years but seemed to smoothen out in the later years. O&M
costs over service area (SA) followed the same pattern stabilizing at P1000 starting in 2003.
Viability index fluctuated and exhibited an upward trend in the later years.
With the reduction of plantilla positions in 2009, the filled-up position per plantilla ratio has
remained above 90% (Table 16). With this, FUSA per filled-up staff including daily staff average
at around 350 ha in the past five years. UPRIIS’s FUSA generally increased over time as well as
its irrigated area closing the gap between FUSA to only 307 has. in 2013. Ratios of benefited area
to irrigated area had fewer fluctuations compared to wet seasons averaging across the years at 97%
and 90%, respectively. ISF current accounts make up majority of the total income averaging at
83% over the years, followed by back account collections at 12% and the rest from other incomes
like equipment rentals.
Upper Pampanga River Integrated Irrigation System (UPRIIS), Division 3
UPRIIS Division 3 service area averaged at about 27,000 ha until the early 2000s (Figure 28).
Despite its big drop in 2008, its trend has been increasing. This rising trend is followed by the
FUSA and actual irrigated areas during both wet and dry seasons.
Table 16 shows the shares to total income of current, total ISF collections, and back collection.
These measures appear to be moving together over time. However, after 2005, share of back to
total collection moved opposite the rest until 2013 (Table 17). It is interesting to note that cropping
intensity moved similarly with irrigated area in the dry season, where downward fluctuations were
prominent until the late 1990s. O&M costs over service area (SA) averaged below P1000 and the
same is true even for the O&M over the firmed-up service area (FUSA). Viability index fluctuated
but appears to be generally increasing.
From 2008 with only 24% of its plantilla positions filled-up, the ratio increased in the succeeding
years reaching 107% in 2013. The FUSA to filled-up plantilla in the past five years averaged at
400 ha/staff while the ratio to both plantilla and daily staff averaged at o 300 ha/staff.
The FUSA is increasing over time. Actual irrigated areas in both wet and dry seasons do not have
a clear trend. The ISF current account ratio to total income slightly fluctuated over the years, with
highs from 2008 to 2010. A similar pattern can be seen for ISF back accounts to total income ratio,
with highs from 2004 to 2006. Total ISF collections comprise most of total income while collection
efficiency averages at about 50%.

85
Figure 27. Trends in key performance indicators, UPRIIS 2, Nueva Ecija, Region 3, 1965-2013
Sources: NIA-SMD NISPER data, various years.

86
Figure 28. Trends in key performance indicators, UPRIIS 3, Nueva Ecija, Region 3, 1965-2013
Sources: NIA-SMD NISPER data, various years.

87
Table 16. Performance Ratios of UPRIIS 2, 1984 – 2003
Ratios 1984 1985 1986 1987 1988 1989 1990 1991 1992 1993 1994 1995 1996 1997 1998 1999 2000 2001 2002 2003
Filled-up/Plantilla (%)
FUSA/Filled-up (Ha/staff)
FUSA/Filled-up + Daily Staff (Ha/staff)
FUSA/SA (%)
Ben. Wet/Actual Wet (%) 94 52 100 100 46 62 93 100 100 100 97 71 97 100 100 100 96 100 100 98
Ben. Dry/Actual Dry (%) 96 96 100 99 96 95 100 100 100 100 100 83 100 92 83 84 93 93 100 100
ISF Current Account/Total Income (%) 97 90 92 94 85 88 83 91 96 92 93 69 66 89 78 56 83 68 88 80
ISF Back Account/Total income (%) 2 2 2 2 2 5 15 4 3 6 7 25 21 8 11 13 8 17 11 20
Other Income/Total Income (%) 2 5 1 2 0 6 13 3 12 32 10 16 1 0
Total Income (%) 99 92 94 96 87 93 100 100 100 100 100 100 100 100 101 101 101 101 100 100
Total ISF/Total Income (%) 99 93 94 96 87 93 98 95 99 98 100 94 87 97 88 68 82 84 99 100
Yield Wet (cavan/ha) 77 78 79 80 80 80 80 81 82 83 50 73 52 66
Yield Dry (cavan/ha) 78 79 81 82 82 82 82 83 74 85 91 94 95 91
Sources: NIA-SMD NISPER data, various years.

88
Table 16. Performance Ratios of UPRIIS 2, 2004 – 2013
Ratios 2004 2005 2006 2007 2008 2009 2010 2011 2012 2013
Filled-up/Plantilla (%) 35 92 94 94 94 95
FUSA/Filled-up (Ha/staff) 318 377 370 370 379 374
FUSA/Filled-up + Daily Staff (Ha/staff) 269 337 297 172 176 317
FUSA/SA (%) 93 99 100 100 100 100 94 100 102 97
Ben. Wet/Actual Wet (%) 100 100 99 99 98 65 56 75 75 99
Ben. Dry/Actual Dry (%) 100 100 97 99 100 100 96 99 99 99
ISF Current Account/Total Income (%) 82 79 80 77 88 85 91 78 78 89
ISF Back Account/Total income (%) 17 21 20 23 11 13 8 20 20 10
Other Income/Total Income (%) 1 0 0 0 1 2 1 2 2 1
Total Income (%) 100 100 100 100 100 100 100 100 100 100
Total ISF/Total Income (%) 99 100 100 100 99 98 99 98 98 99
Yield Wet (cavan/ha) 69 65 79 81 69 56 70 81 81
Yield Dry (cavan/ha) 94 98 94 109 117 123 115 130 130 131
Sources: NIA-SMD NISPER data, various years.
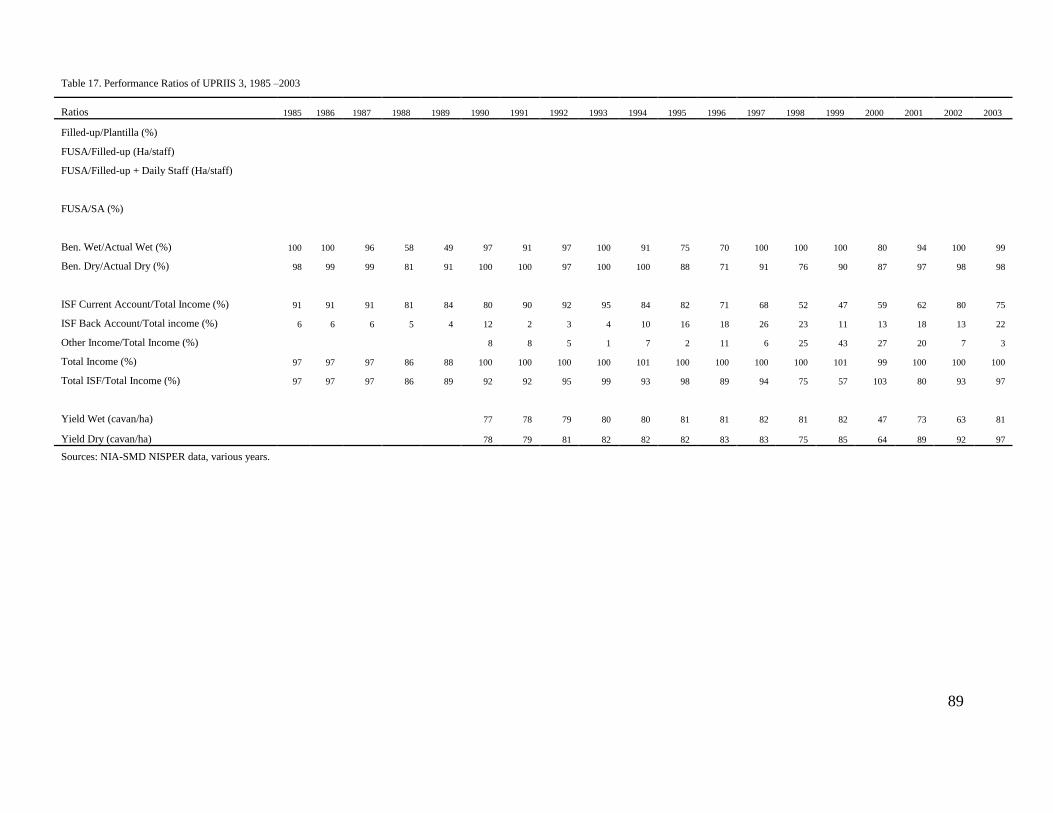
89
Table 17. Performance Ratios of UPRIIS 3, 1985 –2003
Ratios 1985 1986 1987 1988 1989 1990 1991 1992 1993 1994 1995 1996 1997 1998 1999 2000 2001 2002 2003
Filled-up/Plantilla (%)
FUSA/Filled-up (Ha/staff)
FUSA/Filled-up + Daily Staff (Ha/staff)
FUSA/SA (%)
Ben. Wet/Actual Wet (%) 100 100 96 58 49 97 91 97 100 91 75 70 100 100 100 80 94 100 99
Ben. Dry/Actual Dry (%) 98 99 99 81 91 100 100 97 100 100 88 71 91 76 90 87 97 98 98
ISF Current Account/Total Income (%) 91 91 91 81 84 80 90 92 95 84 82 71 68 52 47 59 62 80 75
ISF Back Account/Total income (%) 6 6 6 5 4 12 2 3 4 10 16 18 26 23 11 13 18 13 22
Other Income/Total Income (%) 8 8 5 1 7 2 11 6 25 43 27 20 7 3
Total Income (%) 97 97 97 86 88 100 100 100 100 101 100 100 100 100 101 99 100 100 100
Total ISF/Total Income (%) 97 97 97 86 89 92 92 95 99 93 98 89 94 75 57 103 80 93 97
Yield Wet (cavan/ha) 77 78 79 80 80 81 81 82 81 82 47 73 63 81
Yield Dry (cavan/ha) 78 79 81 82 82 82 83 83 75 85 64 89 92 97
Sources: NIA-SMD NISPER data, various years.

90
Table 17. Performance Ratios of UPRIIS 3, 2004 –2013
Ratios 2004 2005 2006 2007 2008 2009 2010 2011 2012 2013
Filled-up/Plantilla (%) 24 118 82 110 110 107
FUSA/Filled-up (Ha/staff) 429 332 477 361 413 454
FUSA/Filled-up + Daily Staff (Ha/staff) 343 285 385 183 209 371
FUSA/SA (%) 82 95 100 99 99 98 86 100 114 96
Ben. Wet/Actual Wet (%) 98 99 83 99 100 67 64 56 56 74
Ben. Dry/Actual Dry (%) 99 96 95 96 100 98 100 99 99 99
ISF Current Account/Total Income (%) 67 72 68 73 89 82 82 68 68 77
ISF Back Account/Total income (%) 32 28 31 27 11 16 14 31 31 21
Other Income/Total Income (%) 1 0 0 0 0 2 4 2 2 2
Total Income (%) 100 100 99 100 100 100 100 101 101 100
Total ISF/Total Income (%) 99 100 100 100 100 98 96 98 98 98
Yield Wet (cavan/ha) 77 84 80 81 82 73 71 80 80
Yield Dry (cavan/ha) 100 74 100 100 103 104 120 136 136 122
Sources: NIA-SMD NISPER data, various years.

91
Upper Pampanga River Integrated Irrigation System (UPRIIS), Division 4
Figure 29 shows the service area for UPRIIS 4 fluctuated across the years, with 20,000 ha in the
1960s and mid-2000s, and ending 2013 back to 25,000 has. Irrigated area during the wet season
dominated the dry season’s until 2005 where the former was consistently outnumbered. Irrigation
intensity had similar movements with dry actual as it continued with an upward trend in recent
years. On the other hand, shares to total income of current and back collections appear to move in
opposite directions. O&M costs per service area decreased after 1997 to PhP500 per ha in 1999.
However, the average O&M remains below PhP1,000 although has been increasing after 2010.
Filled-up positions for plantilla started with 23% in 2008 and improved significantly ending 2013
with 86% (Table 18). FUSA covered by staff, both for filled-up and daily staff, were at 486 has in
2013 despite variable fluctuations in previous years.
Ratios of irrigated wet and irrigated dry to FUSA appear to move in similar directions and have
little to no gap across the years. ISF current account as part of total income did not change variably
unlike ISF back accounts as part of total income, which experienced a decline after 2007 but
recovered back in 2011. Collection efficiency is slightly higher at around 60%. However, viability
index is lower than the others at 180 percent.
Region 4A CALABARZON
Cavite Friar Lands (Balayungan RIS)
While the system actually visited was Balayungan, the trends reported in this section pertain to the
entire Cavite friar land irrigation system (FLIS). Cavite FLIS’ service area has been decreasing
over time (Figure 30). It started at 15,000 ha in 1967 and was at 13,500 ha in 2013. The actual
irrigated area during wet season declined over time increasing the gap between the service area by
8,725 ha in 2013. During the dry season, even with the slightly increasing trend of actual irrigated
area, the gap is bigger at 9,545 ha in 2013. This gap is mainly due to the lack of water supply and
aggravated by inadequate and/or defective facilities. The ratio of benefited area to irrigated area
has been consistently rising during dry seasons while decreasing in the wet seasons.
Collection efficiency fluctuated above 50% despite dips in several years. Contributions of back
account collections averaged 17% over the years. Cropping intensity as ratio of the sum of irrigated
wet and dry areas to either irrigated wet or dry seemed to increase over time reaching up to 183%
in 2013. O&M cost per service area displayed steep variations through the year but levelled out
starting 2002. Viability index showed no clear trend over the years.
In 2012, the staff had been reduced to 32 from 74, increasing the coverage area per staff to 265 ha
from 115 ha (Table 19). During the wet season, the gap between irrigated area and FUSA ranged
from 23% to 44%. While during dry season, the gap is even bigger ranging from 52% to 72%.

92
Figure 29. Trends in key performance indicators, UPRIIS 4, Nueva Ecija, Region 3, 1965-2013
Sources: NIA-SMD NISPER data, various years.

93
Figure 30. Trends in key performance indicators, Cavite FLIS, Cavite, Region 4, 1965-2013
Sources: NIA-SMD NISPER data, various years

94
Table 18. Performance Ratios of UPRIIS 4, 1984 – 2003
Ratios 1984 1985 1986 1987 1988 1989 1990 1991 1992 1993 1994 1995 1996 1997 1998 1999 2000 2001 2002 2003
Filled-up/Plantilla (%)
FUSA/Filled-up (Ha/staff)
FUSA/Filled-up + Daily Staff (Ha/staff)
FUSA/SA (%)
Ben. Wet/Actual Wet (%) 93 82 82 96 69 74 65 100 93 100 97 65 88 100 100 100 56 100 100 94
Ben. Dry/Actual Dry (%) 84 82 96 85 98 94 100 100 100 100 100 91 100 92 67 98 95 88 92 80
ISF Current Account/Total Income (%) 84 77 76 88 80 65 88 96 94 95 88 78 88 82 59 60 68 62 77 73
ISF Back Account/Total income (%) 4 4 3 4 4 13 8 2 4 4 9 16 9 15 17 14 16 13 18 24
Other Income/Total Income (%) 4 1 3 1 3 6 3 4 24 26 16 25 5 2
Total Income (%) 88 81 79 92 84 78 100 99 101 100 100 100 100 101 100 100 100 100 100 99
Total ISF/Total Income (%) 87 81 79 92 84 78 96 99 97 99 97 94 97 96 76 74 87 75 95 98
Yield Wet (cavan/ha) 77 78 80 80 80 81 82 83 81 82 40 76 78 77
Yield Dry (cavan/ha) 79 80 81 82 82 82 83 85 75 85 62 89 77 64
Sources: NIA-SMD NISPER data, various years.

95
Table 18. Performance Ratios of UPRIIS 4, 2004 – 2013
Ratios 2004 2005 2006 2007 2008 2009 2010 2011 2012 2013
Filled-up/Plantilla (%) 23 105 90 84 84 86
FUSA/Filled-up (Ha/staff) 383 327 433 459 491 486
FUSA/Filled-up + Daily Staff (Ha/staff) 321 302 417 227 243 486
FUSA/SA (%) 89 107 100 100 100 100 95 100 107 99
Ben. Wet/Actual Wet (%) 84 97 91 92 94 61 33 63 63 81
Ben. Dry/Actual Dry (%) 92 100 95 95 100 98 80 96 96 97
ISF Current Account/Total Income (%) 72 71 70 70 89 86 92 79 79 81
ISF Back Account/Total income (%) 23 28 29 30 9 11 7 21 21 17
Other Income/Total Income (%) 5 1 1 0 1 3 1 0 0 2
Total Income (%) 100 100 100 100 99 100 100 100 100 100
Total ISF/Total Income (%) 95 99 99 100 99 97 99 100 100 98
Yield Wet (cavan/ha) 69 75 70 74 76 50 103 122 122
Yield Dry (cavan/ha) 76 81 73 73 85 88 85 112 112 95
Sources: NIA-SMD NISPER data, various years.

96
Table 19. Performance Ratios of Cavite Friar Lands, 1983 – 2003
Ratios 1983 1984 1985 1986 1987 1988 1989 1990 1991 1992 1993 1994 1995 1996 1997 1998 1999 2000 2001 2002 2003
Filled-up/Plantilla (%)
FUSA/Filled-up (Ha/staff) FUSA/Filled-up + Daily Staff
(Ha/staff)
FUSA/SA (%)
Ben. Wet/Actual Wet (%) 93 100 100 100 86 20 81 99 97 100 91 72 90 100 93 95 100 66 64 100 100
Ben. Dry/Actual Dry (%) 100 100 100 100 100 85 100 100 100 99 100 98 99 100 100 95 100 100 100 94 97
ISF Current Account/Total Income (%) 85 85 85 85 85 85 87 93 95 66 79 85 80 72 69 71 76 83 39 79 85
ISF Back Account/Total income (%) 15 15 15 15 15 15 9 7 5 6 13 15 19 28 21 27 23 15 9 10 8
Other Income/Total Income (%) 1 0 28 9 0 0 0 11 3 1 2 52 11 7
Total Income (%) 100 100 100 100 100 100 96 101 100 100 101 100 99 100 101 101 100 100 100 100 100
Total ISF/Total Income (%) 100 100 100 100 100 100 96 99 100 72 91 100 100 100 89 97 99 98 48 89 93
Yield Wet (cavan/ha) 75 76 77 77 79 79 80 80 81 81 82 81 66 81
Yield Dry (cavan/ha) 76 77 79 79 79 80 81 82 75 82 83 85 74 84
Sources: NIA-SMD NISPER data, various years.

97
Table 19. Performance Ratios of Cavite Friar Lands, 2004 – 2013
Ratios 2004 2005 2006 2007 2008 2009 2010 2011 2012 2013
Filled-up/Plantilla (%) 32 32 32 32 80 80
FUSA/Filled-up (Ha/staff) 129 129 129 129 354 354
FUSA/Filled-up + Daily Staff (Ha/staff) 115 115 115 115 265 265
FUSA/SA (%) 65 65 65 65 65 65 65 65 65 63
Ben. Wet/Actual Wet (%) 84 97 59 100 100 71 99 90 82 83
Ben. Dry/Actual Dry (%) 97 100 96 99 100 89 98 100 93 96
ISF Current Account/Total Income (%) 77 79 86 78 64 68 76 66 66 64
ISF Back Account/Total income (%) 16 14 9 11 34 24 17 34 34 33
Other Income/Total Income (%) 8 6 5 11 3 8 7 0 0 4
Total Income (%) 101 99 100 100 101 100 100 100 100 101
Total ISF/Total Income (%) 92 94 95 89 97 92 93 100 100 96
Yield Wet (cavan/ha) 82 82 81 80 84
Yield Dry (cavan/ha) 85 83 84 84 83 83 80 80
Sources: NIA-SMD NISPER data, various years.

98
These gaps are probably caused by lack of water supply and aggravated by defective facilities.
But, despite these gaps, benefited to irrigated area showed high ratios of 91% during wet seasons
and 99% during dry seasons.
About 77% of the total income comes from current account collections while 17% from back
account collections. Collection efficiency showed no clear trend throughout the years but has a
relatively high average at 73% compared to other systems. The viability index also displayed no
clear course averaging at 96% over the years.
Dumacaa-Hanagdong-Lagnas
The service area of Dumacaa-Hanagdong-Lagnas has been stagnant over the years at about 3,300
ha from 1994 to 2013 (Figure 32). The actual irrigated areas during wet and dry seasons have been
almost stagnant with minor declines in 1980 and 1998. The ratio of benefited area to irrigated area
as well as the ratio of irrigated to FUSA exhibited minimal fluctuations except for sharp dips in
1981, 1982, 1988 and 2001.
The ratios of collections to collectibles and income, on the other hand, exhibited sharp fluctuations
throughout the years. But, despite these fluctuations, collection efficiency and share of current
collections to total collection depicted an increasing trend.
In spite of fluctuations over the years, cropping intensity appears to be increasing. O&M cost per
service area tend go towards PhP1,000 per ha. after its drop to PhP518 per ha. in 2000. Viability
index rose from 56% in 1998 to 253% in 2013.
Even with the reduction of plantilla positions from 51 to 12 in 2012, the coverage area per staff of
229 ha is still relatively low compared with the other systems (Table 20). Ratios of benefited area
to actual irrigated areas showed relatively high averages at 94% during wet season and 97% during
dry season.
Sixty percent (60%) of the total income are obtained from current account collections. This source
is followed by back accounts collections averaging at 35% and other income at 5%. The collection
efficiency averaged only at 51% but rose in the later years. The viability index has been fluctuating
over the years but t showed an upward trend in the later years and reached 253% in 2013.
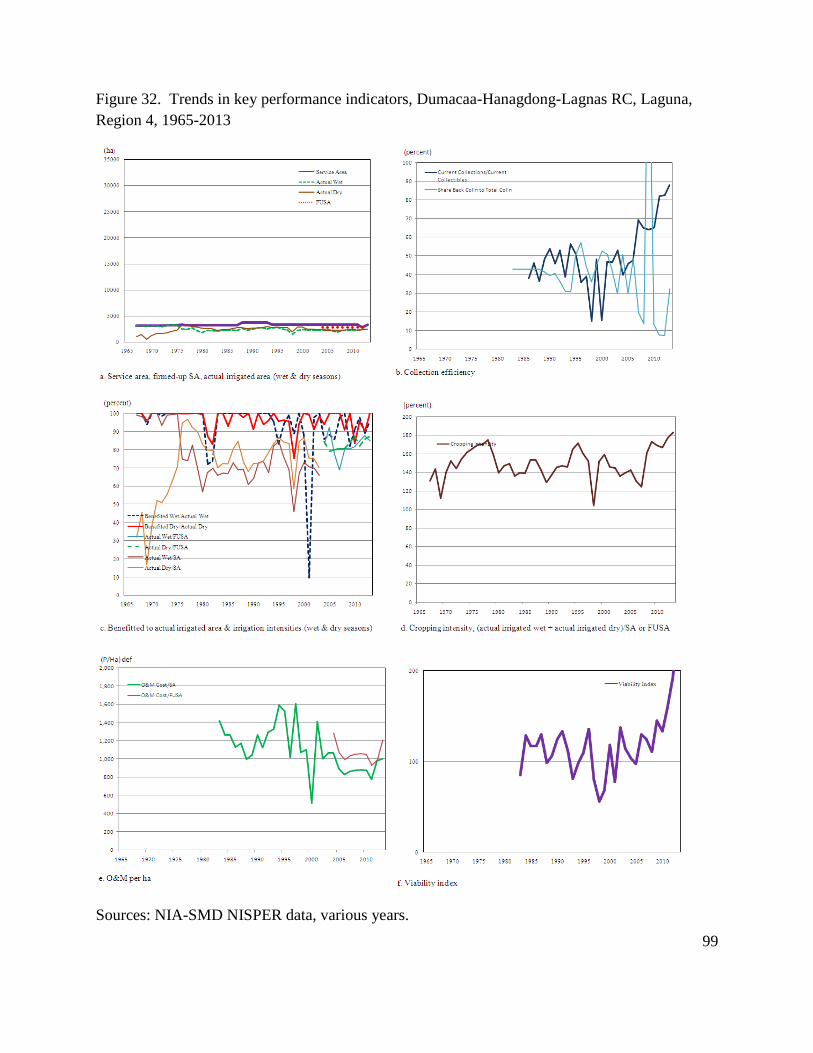
99
Figure 32. Trends in key performance indicators, Dumacaa-Hanagdong-Lagnas RC, Laguna,
Region 4, 1965-2013
Sources: NIA-SMD NISPER data, various years.

100
Table 20. Performance Ratios of Dumacaa-Hanagdong-Lagnas, 1983 – 2003
Ratios 1983 1984 1985 1986 1987 1988 1989 1990 1991 1992 1993 1994 1995 1996 1997 1998 1999 2000 2001 2002 2003
Filled-up/Plantilla (%)
FUSA/Filled-up (Ha/staff) FUSA/Filled-up + Daily Staff
(Ha/staff)
FUSA/SA (%)
Ben. Wet/Actual Wet (%) 100 100 100 100 100 100 100 106 100 100 100 95 83 94 99 89 100 88 10 98 100
Ben. Dry/Actual Dry (%) 100 100 93 100 100 98 100 91 100 94 96 100 96 96 96 75 94 100 99 91 98
ISF Current Account/Total Income (%) 57 57 57 57 57 57 57 58 58 63 59 61 46 40 51 64 54 47 48 50 63
ISF Back Account/Total income (%) 43 43 43 43 43 43 41 38 39 35 27 27 46 53 41 36 45 52 49 37 26
Other Income/Total Income (%) 0 0 0 0 0 0 0 5 2 2 14 12 8 7 9 0 1 0 3 13 11
Total Income (%) 100 100 100 100 100 100 98 101 99 100 100 100 100 100 101 100 100 99 100 100 100
Total ISF/Total Income (%) 100 100 100 100 100 100 98 95 98 98 86 88 92 93 91 100 99 100 97 87 89
Yield Wet (cavan/ha) 75 76 77 77 79 79 80 80 81 81 82 82 78 80
Yield Dry (cavan/ha) 76 77 79 79 79 80 81 82 75 82 83 84 83 83
Sources: NIA-SMD NISPER data, various years.

101
Table 20. Performance Ratios of Dumacaa-Hanagdong-Lagnas, 2004 – 2013
Ratios 2004 2005 2006 2007 2008 2009 2010 2011 2012 2013
Filled-up/Plantilla (%) 45 45 45 45 100 100
FUSA/Filled-up (Ha/staff) 120 120 120 120 229 231 FUSA/Filled-up + Daily Staff
(Ha/staff) 115 115 115 115 229 231
FUSA/SA (%) 83 83 83 83 83 83 83 83 100 83
Ben. Wet/Actual Wet (%) 86 88 86 98 100 82 91 98 89 96
Ben. Dry/Actual Dry (%) 94 100 100 100 91 100 84 96 90 100
ISF Current Account/Total Income (%) 46 69 51 74 75 71 81 91 75 61
ISF Back Account/Total income (%) 47 29 48 18 17 25 6 9 2 29
Other Income/Total Income (%) 7 2 0 8 8 4 13 0 23 10
Total Income (%) 100 100 99 100 100 100 100 100 100 100
Total ISF/Total Income (%) 93 98 100 92 92 96 87 100 77 90
Yield Wet (cavan/ha) 82 82 83 83 0 80 0 0 75 75
Yield Dry (cavan/ha) 83 83 85 86 82 82 0 0 80 80
Sources: NIA-SMD NISPER data, various years.

102
Region 4B MIMAROPA
Caguray RIS
Starting in 1988, the service area of Caguray remained constant at 3,308 ha (Figure 31). The actual
irrigated areas, however, fluctuated over the years and had been generally low during dry seasons.
This is mainly due to inadequate water made worse by defective facilities. The ratio of benefited
area to irrigated area also followed the same trend and reaching below 50% in various years.
The ratios of collections and income showed sharp fluctuations with no clear trends (Table 21).
Cropping intensity as ratio of the sum of irrigated wet and dry areas to either irrigated wet or dry
area whichever is bigger generally falls below 150%. O&M cost per service and viability index
wavered throughout the years exhibiting no clear directions.
Despite the fact that only 47% of plantilla positions are filled up, the average area per staff is only
142 ha which is much better compared with the other systems. There is a big gap between actual
irrigated areas and FUSA especially during the dry seasons where the ratios average 17%. This
phenomenon is consistent with the ratio of benefited areas to actual irrigated areas during dry
seasons averaging only at 75% compared to the 95% during wet seasons. Inadequate of water and
inadequate or defective facilities are the likely causes of these gaps.
Majority of the income comes from collections of current account averaging at 78% and followed
by other income at 15%. Collection efficiency averaged only at 55% across the years exhibiting
no clear trend. The viability index also showed no clear trend averaging at 99% through the years.

103
Figure 31. Trends in key performance indicators, Caguray RIS, Occidental Mindoro, Region 4,
1965-2013
Sources: NIA-SMD NISPER data, various years.

104
Table 21. Performance Ratios of Caguray, 1985 – 2003
Ratios 1985 1986 1987 1988 1989 1990 1991 1992 1993 1994 1995 1996 1997 1998 1999 2000 2001 2002 2003
Filled-up/Plantilla (%)
FUSA/Filled-up (Ha/staff)
FUSA/Filled-up + Daily Staff (Ha/staff)
FUSA/SA (%)
Ben. Wet/Actual Wet (%) 100 100 91 95 100 100 92 100 100 100 76 89 100 90 100 91 80 100 99
Ben. Dry/Actual Dry (%) 100 100 100 70 27 8 100 50 100 100 72 65 100 66 93 70 100 23 37
ISF Current Account/Total Income (%) 100 100 100 100 94 59 64 52 68 72 49 96 85 87 94 78 61 39 51
ISF Back Account/Total income (%) 31 3 16 1 4 0 9 4 22 5 1 6
Other Income/Total Income (%) 6 41 5 48 28 12 50 0 15 4 1 0 34 60 43
Total Income (%) 100 100 100 100 100 100 100 100 99 100 100 100 100 100 99 100 100 100 100
Total ISF/Total Income (%) 100 100 100 100 94 59 95 52 72 88 50 100 85 96 99 100 66 40 57
Yield Wet (cavan/ha) 72 72 73 73 74 75 75 76 75 76 55 60 94 94
Yield Dry (cavan/ha) 76 77 75 76 76 77 79 79 78 78 85 85 86 86
Sources: NIA-SMD NISPER data, various
years.

105
Table 21. Performance Ratios of Caguray, 2004 – 2013
Ratios 2004 2005 2006 2007 2008 2009 2010 2011 2012 2013
Filled-up/Plantilla (%) 47 47 47 47
FUSA/Filled-up (Ha/staff) 142 142 142 142
FUSA/Filled-up + Daily Staff (Ha/staff) 142 142 142 142
FUSA/SA (%) 60 60 60 60 60 60 60 60 60 60
Ben. Wet/Actual Wet (%) 96 95 95 96 99 82 99 100 93 94
Ben. Dry/Actual Dry (%) 78 78 91 84 85 39 55 93 100 100
ISF Current Account/Total Income (%) 72 82 78 83 80 74 78 93 96 79
ISF Back Account/Total income (%) 7 18 22 13 16 7 1 7 4 3
Other Income/Total Income (%) 21 0 0 4 3 19 20 0 0 18
Total Income (%) 100 100 100 100 99 100 99 100 100 100
Total ISF/Total Income (%) 79 100 100 96 97 81 80 100 100 82
Yield Wet (cavan/ha) 82 82 79 82 82 85 85
Yield Dry (cavan/ha) 86 85 82 84 84 84 85 85
Sources: NIA-SMD NISPER data, various years.

106
Region 5 Bicol
Libmanan-Cabusao The service area of Libmanan-Cabusao has been generally decreasing from 3,427 ha to 2,195 ha
in 1986 (Figure 33). However, irrigated areas during both wet and dry seasons showed no clear
trend.
The collection and income ratios exhibit steep variations with no clear trends. Same sharp
fluctuations are observed with the ratios of benefited to irrigated area, irrigated to FUSA and
cropping intensity. O&M cost per service area, on the other hand, has a clear downward direction
from Php3,263 per hectare in the early 1980s to less than Php500 per hectare in 2013. On the
contrary, viability index despite its dips in various years tend to have a slightly increasing course
from 35% in 1983 to 83% in 2013.
The filled-up plantilla positions remained constant at 22% from 2009 to 2013 (Table 22). FUSA
to filled-up plantilla plus daily staff also has hardly changed, increasing slightly to 366 ha per staff
in 2013. The ratio of irrigated area to FUSA averaged only around 53% to 56%. This is likely due
to defective facilities and inadequate equipment like main irrigation pumps.
The ratios of ISF current account and total ISF fluctuated through the years following the
movement of collection efficiency. The ratios of benefited area to irrigated area sharply declined
in 1999 and 2013 reaching below 50%. The O&M cost to SA generally appeared to have a
downward direction dropping from PhP3263/ha to PhP422/ha. in 2013. Despite low levels in
various years, the viability index seemed to have a slightly increasing trend starting from 35% in
1983 and ending at 83% in 2013.

107
Figure 33. Trends in key performance indicators, Libmanan-Cabusao PIS, Camarines Sur,
Region 5, 1965-2013
Sources: NIA-SMD NISPER data, various years.

108
Table 22. Performance Ratios of Libmanan-Cabusao, 1983 – 2003
Ratios 1983 1984 1985 1986 1987 1988 1989 1990 1991 1992 1993 1994 1995 1996 1997 1998 1999 2000 2001 2002 2003
Filled-up/Plantilla (%)
FUSA/Filled-up (Ha/staff)
FUSA/Filled-up + Daily Staff (Ha/staff)
FUSA/SA (%)
Ben. Wet/Actual Wet (%) 68 78 44 40 99 92 81 100 100 95 91 88 48 78 23 27 61
Ben. Dry/Actual Dry (%) 78 78 77 100 67 13 100 100 97 89 89 82 81 100 100 16 73
ISF Current Account/Total Income (%) 100 100 100 100 99 68 73 82 96 96 98 87 81 81 67 46 71 56 52
ISF Back Account/Total income (%) 5 4 29 8 12 19 2 2 13 2
Other Income/Total Income (%) 18 4 4 2 13 15 71 10 20 36 27 98 31 47
Total Income (%) 100 100 100 100 99 68 78 100 100 100 100 100 100 100 99 99 101 100 100 100 101
Total ISF/Total Income (%) 100 100 100 100 99 68 78 82 96 96 98 87 85 29 90 80 64 73 2 69 53
Yield Wet (cavan/ha) 75 76 77 77 79 79 80 81 81 82 79 83
Yield Dry (cavan/ha) 76 77 79 79 0 80 82 75 82 83 82 82
Sources: NIA-SMD NISPER data, various years.

109
Table 22. Performance Ratios of Libmanan-Cabusao, 2004 – 2013
Ratios 2004 2005 2006 2007 2008 2009 2010 2011 2012 2013
Filled-up/Plantilla (%) 33 22 22 22 22 22
FUSA/Filled-up (Ha/staff) 692 1038 1038 1038 1098 1098
FUSA/Filled-up + Daily Staff (Ha/staff) 297 346 346 346 366 366
FUSA/SA (%) 95 95 95 95 95 95 95 95 66 100
Ben. Wet/Actual Wet (%) 60 95 67 100 77 84
Ben. Dry/Actual Dry (%) 100 100 83 54 59 67 81 61 100
ISF Current Account/Total Income (%) 98 87 100 99 71 28 81 87 79 91
ISF Back Account/Total income (%) 2 13 1 13 41 1 2 9 9
Other Income/Total Income (%) 1 0 0 0 16 31 18 11 13 0
Total Income (%) 101 100 100 100 100 100 100 100 101 100
Total ISF/Total Income (%) 99 100 100 100 84 69 82 89 87 100
Yield Wet (cavan/ha) 80 81 82 82 82
Yield Dry (cavan/ha) 82 82 84 85 84 84
Sources: NIA-SMD NISPER data, various years.
110
ANALYSIS AND CHARACTERIZATION OF THE SAMPLE NIS
This study examines 22 NIS cases by province, size (large, medium, small), technology (gravity
type vs pump type), location (upstream, midstream, downstream), vintage, and by some
measures of “success”.
For vintage of systems, the sample is classified into three periods: pre-NIA, 1965-1980, 1980-
onwards. For size, the sample systems (and effectively the IAs) is classified into large, medium
and small according to their firmed-up service area (FUSA). IAs with FUSA size of above 5,000
ha are classified as large. IAs falling between 1,000 and 5,000 ha FUSA are classified as medium
while those with FUSA below 1000 ha are classified as small.
Then following NIA’s loose definition of successful IAs, the sample IAs is classified into
“successful” and “less successful”. The first group are those that satisfy the following criteria:
NIA’s functionality survey rating of very satisfactory to outstanding, IA’s own financial rating of
at least 3, with 4 as very strong, IA’s ISF collection performance rating of 3 to 4 with 4 as excellent
and/or having a collection rate of 65% and above. On the other hand, “less successful” IAs are
defined as those which satisfy the following criteria: NIA’s functionality survey of poor to
satisfactory, IA’s own financial rating of 0 to 2 with 4 as very strong, IA’s ISF collection
performance rating of 0 to 2 with 4 as excellent and/or having a collection rate below 65%.
These typologies capture various technical and institutional aspects of providing irrigation service
by national systems. Pump systems will have different challenges from reservoir and diversion
systems. Size of IAs based on firmed-up service area will likely be correlated with complexity of
design, and operation of physical structures and facilities, and the corresponding type of
management. Vintage entails different technical and institutional concerns between relatively old
vs. newer systems. “Successful IAs” entail institutional factors at play but also probably technical
aspects contributing to such performance.
By Province
The characterization of the sample NIS according to province is captured in various tables (Tables
23.1 to 23.18).
The IA sample of Bulacan reported lack of facilities like farm-to-market roads (FMRs) and high
occurrence of calamities like pest infestations as key concerns. On the brighter side, the IAs have
relatively high functionality ratings, reported the minimum count of irrigation structure problems
and moderate occurrence of siltation problem.
The Cagayan sample IAs did not report inadequate water supply as a problem. All the IAs claimed
high collection efficiencies. However, these IAs are characterized by the following as problems in
decreasing order: low yield due to pest infestation, lack of facilities/infrastructure like solar driers

111
and FMRs, deteriorated lateral canals, siltation problems, and institutional problems like water
theft.
The Camarines Sur sample is saddled with of inadequate water supply, lack of machineries and
equipment like pumps, low functionality survey ratings, financially weak IAs and high occurrence
of poor structure design. On the plus side, the IAs have minimal problems in their irrigation canals
and irrigation structures, no occurrence of siltation problems and lack of facilities.
The Cavite sample reports high counts of FMR problems, institutional problems like water theft
and lack of discipline among members, low functionality survey ratings, high percentage of
financially weak IAs, low buying price of produce, occurrence of siltation, headwork and lateral
canal problems.
The hierarchy of prevailing problems of Ilocos Norte IA sample is as follows (in decreasing order):
inadequacy of water supply, lateral canal problems and siltation problems. On a positive note, the
IAs did not report institutional problems as key concerns, FMR problems or lack of facilities. A
high collection rate is reported.
Ilocos Sur sample IAs does not consider inadequacy of water supply during dry seasons as a key
concern, and reported moderate count of irrigation canal problems, minimal siltation problems,
moderate institutional problems like lack of safety policies and training and generally have high
collection efficiencies. But, half of these IAs have problems with the main and lateral canals.
The dominating negative features of NIS systems reported by the Isabela sample IAs are as follows
(in decreasing importance): irrigation main canal, lateral canal and control structure problems,
institutional problems like lack of policies and water theft, crop production problems due to
calamities and pest infestations/diseases and occurrence of siltation. But, all sample IAs reported
adequate water supply, no occurrence of flooding, very high IA functionality ratings and very
strong financial position.
The Nueva Ecija sample IAs reported adequate water supply, no occurrence of siltation problems,
minimal problems in their irrigation structures, low counts of problems in their FMRs and lack of
facilities, and minimal occurrence of flooding. Furthermore, they only have slight institutional
concerns like few hard headed members and water theft.
Mindoro Occidental sample IAs consider inadequate water supply especially during dry season as
a key problem, followed by very high siltation problems and high occurrence of headwork and
canal problems. However, the IAs have not reported flooding, calamity/pest infestation problems
and problems with lacking facilities, machineries and equipment, as important concerns.
Most of the Pampanga sample IAs have control structure problems like damaged or vandalized
check gates. They also encounter several institutional problems, like water theft and delinquent
members and flooding problems due to low level areas acting as catch basins in the wet season.

112
The Pangasinan IAs generally exhibit many irrigation structure problems, especially headwork and
control structures, inadequacy of water supply, siltation problems, deteriorated FMRs, and lack of
machineries (e.g. backhoe for dredging works).
IAs sample from Quezon showed the following problems in decreasing order: inadequate water
supply, irrigation canal problems, institutional concerns like water theft, and solid waste deposits
in canals. Given the problems, majority of these samples are considered less successful IAs.
The Tarlac IA samples experience the following predominant problems, in decreasing severity:
water supply inadequacy, solid waste in canals, and siltation problems. On the contrary, these IAs
do not experience flooding, have only slight irrigation structure problems, and relatively high
collection efficiencies.

113
Table 23.1. NIS IA Profile, Cropping Information and Financial Aspects by
Province
Provinces No. of IA
sample
Ave. of No. of
Members
Ave. of No. of
Farmers-
Landowner-operator (%)
Ave. of
No. of
Farmers-Tenant
(%)
Ave. of
No. of
Farmers-
Lessees
(%)
Does IA
have water
permit? (answer: no)
Does IA
have water
permit? (answer:
yes)
Does IA
have water
permit? (no answer)
No. of
Crops
Irrigated: rice only
No of Crops
Irrigated: rice
and other crops
No. of IAs
paying
ISF/DCC/amortization
Bulacan 2 192
40
60
2
2
1
Cagayan 9
403
59
40
10
4
3
2
8
1
4
Camarines Sur 3
256
67
50
1
2
1
3
Cavite 3 44
100
3
3
Ilocos Norte 3
263
45
55
2
1
1
2
1
Ilocos Sur 4
136
69
28
10
3
1
3
1
1
Isabela 9 158
66
28
19
5
3
1
9
9
Nueva Ecija 12
203
77
55
10
5
1
5
8
5
Occidental Mindoro 3
72
63
37
1
1
1
1
2
1
Pampanga 5
69
52
35
13
2
2
1
4
1
2
Pangasinan 5 131
54
39
15
2
1
2
5
2
Quezon 3
74
32
68
1
2
3
2
Tarlac 3
97
38
45
50
2
1
3
3
Average for All Sample/Total 64
187
60
45
17
29
15
17
44
16
34
Sources: NIS KII

114
Table 23.2. Problems/concerns of NIS IAs by Province
Provinces No. of
IA sample
No. of IAs
with inadequate
water
supply in dry season
No. of
IAs with
flooding
problem during
wet
season
No. of IAs with
Irrigation Headwork
Problems
(damaged, deteriorated,
lacking)
No. of IAs
with Irrigation
Main Canal
Problems (damaged,
deteriorated,
unlined)
No. of IAs
with Irrigation
Lateral
Canal Problems
(damaged,
deteriorated, unlined)
No. of IAs
with Irrigation
Control
Structure Problems
(damaged,
deteriorated, lacking,
unlined)
No. of
IAs with Siltation,
Solid
Waste, Informal
Settlers
& Water Quality
Problems
No. of IAs with
problems due to lack of facilities,
infrastructure
(FMRs), canal extensions,
drainage, storage,
pipelines, STWs, solar drier & etc.
No. of IAs with
problems due to damaged/lack of
Machineries &
Equipment (ex. Backhoes, pumps,
pipes & etc.)
No. of IAs with
institutional/management problems
Bulacan 2
1
1
1 2 1
Cagayan 9 1
2
6
3
4 6 4 4
Camarines Sur 3
3 2 3 1
Cavite 3 1 1
1
1 3 3
Ilocos Norte 3
2
1 1
2
1
2 1
Ilocos Sur 4
2
2
1 2
Isabela 9 1
5
8
3
2 2 1 6
Nueva Ecija 12
1
1
1
2
1 4 2 4 Occidental
Mindoro 3
3 2
1
1
1
2 2
Pampanga 5 1
3 2
Pangasinan 5
4
1 4
1
2
3
1 2 3 2
Quezon 3
2
1
1
1 2
Tarlac 3 3 1
1
2 1 1
Total 64 22
3 12
13
27
15
17 19 16 29
Sources: NIS KII
Note: Institutional/Management Problems - Water Stealing, lack of discipline, water scheduling problems, illegal turnouts, animals like carabaos allowed in canal, attendance during maintenance work, conflict
among members, rules not followed, safety problems

115
Table 23.3. NIA's NIS Functionality Survey rating, IA's own Financial Strength rating, Collection Efficiency and IA's performance rating of ISF collection by
Province
Provinces No. of IA sample IA Functionality
Survey Rating (No Data)
IA Functionality
Survey Rating (Poor -
Satisfactory)
IA Functionality
Survey Rating (Very Satisfactory
- Outstanding)
IA's Financial
Strength Rating (no data)
IA's Financial
Strength Rating (0 - 2, weak)
IA's Financial
Strength Rating (3-4, strong)
IA's Collection
Efficiency (0 -64%, weak)
Bulacan 2 2 1 1 1
Cagayan 9 3 3 3 2 5 2
Camarines Sur 3 3 1 2 2
Cavite 3 3 2 1
Ilocos Norte 3 3 1 2
Ilocos Sur 4 4 2 1 1
Isabela 9 9 9 2
Nueva Ecija 12 12 9 1 2 2
Occidental Mindoro 3 3 2 1 1
Pampanga 5 5 3 1 1 1
Pangasinan 5 5 1 2 1 2
Quezon 3 2 1 1 2 1
Tarlac 3 1 2 1 2
Total 64 35 12 17 23 21 19 12
Sources: NIS KII
Provinces IA's Collection
Efficiency (65% - 100%, strong)
IA's Performance
Rating of Collection of ISF
(no data)
IA's Performance
Rating of Collection of ISF
(0-2, weak)
IA's Performance
Rating of Collection of ISF
(3-4, strong)
No. of IAs by
"Success" (insufficient data)
No. of IAs by
"Success" (Not Successful)
No. of IAs by
"Success" (Successful)
Bulacan 1 1 1 1 1
Cagayan 9 4 1 4 5 4
Camarines Sur 1 1 2 1 2
Cavite 3 1 2 3
Ilocos Norte 3 3 3
Ilocos Sur 4 3 1 4
Isabela 7 9 9
Nueva Ecija 5 9 1 2 12
Occidental Mindoro 3 3
Pampanga 3 3 2 5
Pangasinan 3 3 1 1 5
Quezon 2 1 1 1 1 2
Tarlac 3 1 1 1 1 2
Total 44 33 5 26 40 14 10
Sources: NIS KII

116
Table 23.4. NIS IA's Performance Ratings of their water distribution and delivery service by Province
Provinces No. of IA
sample
Flexibility Index - no
answer
Flexibility Index
Rating -
(0-2, not flexible)
Flexibility Index
Rating -
(3-4, flexible)
Reliability Index
Rating - no
answer
Reliability Index
Rating -
(0-2, not reliable)
Reliability Index
Rating -
(3-4, reliable)
Equitability Index
Rating - no
answer
Equitability Index
Rating - (0-
2, not equitable)
Equitability Index
Rating - (3-
4, equitable)
Adequacy of Service
Delivery
Rating - no data
Adequacy of Service
Delivery
Rating - (0-2,
inadequate
service)
Adequacy of Service
Delivery
Rating - (3-4,
adequate
service)
Bulacan 2
1
1
1
1
1
1
1
1
Cagayan 9 1
3
5
1
4
4
4
2
3
2
3
4
Camarines Sur 3
3
3
2
1
1
2
Cavite 3
3
3
3
1
2
Ilocos Norte 3 1
2
1
2
1
2
3
Ilocos Sur 4
1
3
1
3
1
3
4
Isabela 9
1
8
1
8
1
8
9
Nueva Ecija 12 5
6
5
1
6
6
6
8
4
Occidental Mindoro 3
1
1
1
1
2
1
1
1
3
Pampanga 5
3
2
3
2
3
2
2
1
2
Pangasinan 5 1
2
2
1
1
3
2
1
2
2
2
1
Quezon 3
1
2
1
2
1
2
2
1
Tarlac 3
1
1
1
1
2
3
2
1
Total 64 16
12
35
15
10
39
20
7
37
16
19
29
Sources: NIS KII

117
Table 23.5. NIS IA's rating of their ability to seek outside help by Province
Provinces No. of IA
sample
Ave. Rating for
ability of NIS IAs to seek
outside help (0-4,
4 most influential)
Rating for ability
of NIS IAs to seek outside help
(0)
Rating for
ability of NIS IAs to seek
outside help (1)
Rating for ability
of NIS IAs to seek outside help (2)
Rating for
ability of NIS IAs to seek
outside help (3)
Rating for ability of
NIS IAs to seek outside help (4)
Rating for
ability of NIS IAs to seek
outside help (No
answer)
Bulacan 2 3 1 1
Cagayan 9 3 2 1 2 4
Camarines Sur 3 3 2 1
Cavite 3 2 3
Ilocos Norte 3 3 1 1 1
Ilocos Sur 4 1 1 2 1
Isabela 9 2 2 1 4 2
Nueva Ecija 12 2 1 1 10
Occidental Mindoro 3 3 1 1 1
Pampanga 5 4 1 1 3
Pangasinan 5 5
Quezon 3 3 1 1 1
Tarlac 3 2 1 1 1
Average for All Sample/Total 64 2 4 2 10 13 6 29
Sources: NIS KII

118
Table 23.6. Assistance received by NIS IAs from Various Sources by Province
Provinces No. of
IA
sample
Assistanc
e
received by NIS
IAs from
Various sources.
BSWM -
Free Soil analysis
Assistanc
e received
by NIS IAs from
Various
sources. LGU -
Farm
inputs/seed subsidy
Assistanc
e received
by NIS IAs from
Various
sources. LGU -
Repair
farm to market
roads
Assistance
received by NIS
IAs from Various sources. LGU -
financial/liveliho
od
Assistanc
e
received by NIS
IAs from
Various sources.
LGU -
technical support
Assistance received
by NIS IAs from
Various sources. LGU -
equipment/thresher/f
uel
Assistanc
e
received by NIS
IAs from
Various sources.
Others -
flatbed dryer/sola
r dryer
Assistance
received by
NIS IAs from
Various
sources. Others -
pump/thresh
er / fuel
Assistance
received by
NIS IAs from Various
sources.
Others - Seed subsidy/analys
is
Assistance
received by
NIS IAs from Various
sources. Others
- soil sampling/traini
ng
Bulacan 2 1
1
1
Cagayan 9
1
1
1
1
Camarines Sur 3 1
1
2
Cavite 3
Ilocos Norte 3
Ilocos Sur 4
2
2
2
Isabela 9
7
1 3
1
1
3
1
Nueva Ecija 12 1 1
2
Occidental Mindoro 3
1 1
1
1
Pampanga 5
1
Pangasinan 5
1
1
Quezon 3 1 1
Tarlac 3
1
1
1
1
Total 64
10
4
2 4
1 3
4
6
15
2
Sources: NIS KII

119
Table 23.7. Cropping problems of NIS IAs by Province
Provinces No. of IA sample Cropping problems
of NIS IAs. Garbage in the canals
Cropping
problems of NIS IAs. Lack of
water supply
Cropping
problems of NIS IAs. Water
delivery
schedule
Cropping
problems of NIS IAs. Low
yield/calamities
Cropping
problems of NIS IAs. High
production
cost/low buying price
Cropping
problems of NIS IAs. FMR/high
harvest loss
Cropping
problems of NIS IAs. Others -
informal settlers,
govt. Support
Bulacan 2 2
Cagayan 9 7 1
Camarines Sur 3 1 2
Cavite 3 3
Ilocos Norte 3 1 1 1
Ilocos Sur 4 3 1
Isabela 9 5 2
Nueva Ecija 12 1 1 1
Occidental Mindoro 3 1
Pampanga 5 2 1
Pangasinan 5 1 2
Quezon 3 1 1
Tarlac 3 1 1 1 1
Total 64 1 4 3 27 9 1 1
Sources: NIS KII

120
Table 23.8. Problems encountered by NIS IAs by Province
Provinces No. of IA
sample
Problems
encountered by
NIS-IAs. Unlined canals and
turnout
Problems
encountered
by NIS-IAs. Poor structure
design
Problems
encountered
by NIS-IAs. Damaged
irrigation
structure
Problems
encountered
by NIS-IAs. Lack of water
supply
Problems
encountered
by NIS-IAs. Solid waste in
canals/siltatio
n
Problems
encountered
by NIS-IAs. Some
members
don't follow the schedule
Problems
encountered
by NIS-IAs. Illegal
turnouts
Problems
encountered
by NIS-IAs. Damaged
farm to
market road
Problems
encountere
d by NIS-IAs. Others
Bulacan 2
1
1
Cagayan 9 1
2
2
2
1
4
2
Camarines Sur 3 2
3
2
Cavite 3 1
1
1
1
3
Ilocos Norte 3
2
3
1
Ilocos Sur 4 1 1
1
1
1
1
Isabela 9
2
4
3
1
1
Nueva Ecija 12 1
1
1
1
4
Occidental Mindoro 3 1 2
2
1
Pampanga 5 1
1
1
2
1
2
Pangasinan 5 1
1
3
1
1
Quezon 3 2
1
Tarlac 3
2
2
Total 64 7
5
11
18
14
8
2
11
13
Sources: NIS KII
Note: Others - extension of water schedule, lack of equipment; lack of irrigation facilities; monitoring of water delivery & maintenance of laterals with certain stretch; none; improve the irrigation
facilities; irrigation structure not yet finished; lack of discipline; not following cropping calendar; political intervention; slow action of NIS; ISF very high; lack of water
pump

121
Table 23.9. Performance Rating of various functions of NIS IAs by Province
Provinces No. of IA
sample
Performance
Rating of NIS IAs (0-4, 4
excellent).
Water distribution
Performance
Rating of NIS IAs (0-4, 4
excellent).
Maintenance of canals
Performance
Rating of NIS IAs (0-4, 4
excellent).
Maintenance of control
structures
Performance
Rating of NIS IAs (0-4, 4
excellent).
Construction of facilities
Performance
Rating of NIS IAs (0-4, 4
excellent).
Collection of ISF
Performance
Rating of NIS IAs (0-4, 4
excellent).
Collection of other fees
Performance
Rating of NIS IAs (0-4, 4
excellent).
Technical Advice to
farmers
Performance
Rating of NIS IAs. Overall
rating
Bulacan 2 4 4
3
4
3
3
3
3
Cagayan 9 3 3
3
3
3
3
3
2
Camarines Sur 3 4 4
4
1
4 -
4
2
Cavite 3 3 3
3
4
4
3
Ilocos Norte 3 -
Ilocos Sur 4 4 4
4
4
3
3
4
1
Isabela 9 4 4
3
2
3
3
3
Nueva Ecija 12 4 4
4
4
3
3
4
1
Occidental Mindoro 3 3 3
2
3
1
Pampanga 5 3 4
3
4
3
3
1
Pangasinan 5 2 3
2
1
3
3
4
1
Quezon 3 4 3
3
1
2
3
4
2
Tarlac 3 3 3
3
3
3
3
3
2
Average for All
Sample/Total 64 3 3
3
2
3
3
3
2
Sources: NIS KII

122
Table 23.10. NIS IA's Rating on Water Delivery Service and Water Distribution Policy by Province
Provinces No. of IA
sample
Rating of
NIS IAs' water
delivery
service (0-4, 4
highest).
0
Rating
of NIS IAs'
water
delivery service
(0-4, 4
highest). 1
Rating
of NIS IAs'
water
delivery service
(0-4, 4
highest). 2
Rating of
NIS IAs' water
delivery
service (0-4, 4
highest). 3
Rating of
NIS IAs' water
delivery
service (0-4, 4 highest). 4
Rating of
NIS IAs' policy on
water
distribution scheme (0-
4, 4
highest). 0
Rating of
NIS IAs' policy on
water
distribution scheme (0-
4, 4
highest). 1
Rating of
NIS IAs' policy on
water
distribution scheme (0-
4, 4
highest). 2
Rating of
NIS IAs' policy on
water
distribution scheme (0-
4, 4
highest). 3
Rating of
NIS IAs' policy on
water
distribution scheme (0-
4, 4
highest). 4
Bulacan 2
1
1
1
Cagayan 9
3
2
2
2
3
Camarines Sur 3 2
2
Cavite 3
1
1
1
3
Ilocos Norte 3
3
1
1
Ilocos Sur 4 1
3
2
2
Isabela 9
2
7
2
7
Nueva Ecija 12
1
3
1
2
Occidental Mindoro 3 1
1
1
Pampanga 5
2
2
Pangasinan 5
1
1
2
Quezon 3 1
1
1
1
Tarlac 3
1
1
2
Total 64
1
3
10
8
21
1
2
8
28
Sources: NIS KII
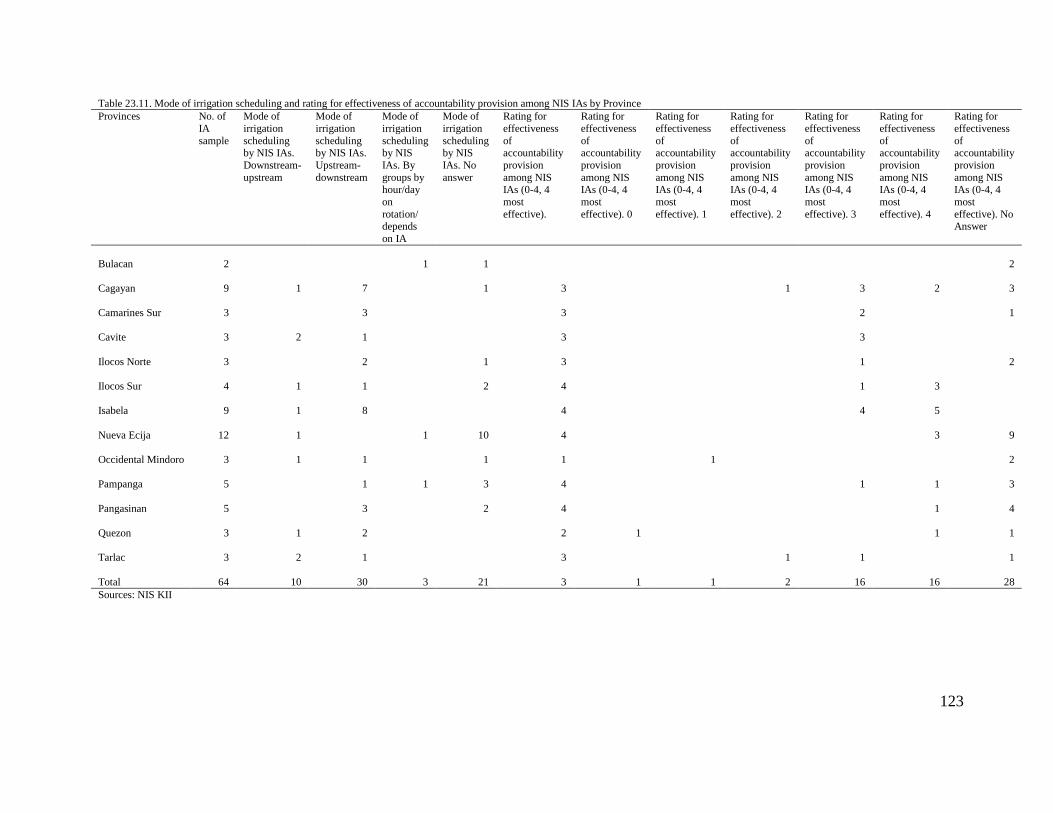
123
Table 23.11. Mode of irrigation scheduling and rating for effectiveness of accountability provision among NIS IAs by Province
Provinces No. of
IA
sample
Mode of
irrigation
scheduling by NIS IAs.
Downstream-
upstream
Mode of
irrigation
scheduling by NIS IAs.
Upstream-
downstream
Mode of
irrigation
scheduling by NIS
IAs. By
groups by hour/day
on
rotation/ depends
on IA
Mode of
irrigation
scheduling by NIS
IAs. No
answer
Rating for
effectiveness
of accountability
provision
among NIS IAs (0-4, 4
most
effective).
Rating for
effectiveness
of accountability
provision
among NIS IAs (0-4, 4
most
effective). 0
Rating for
effectiveness
of accountability
provision
among NIS IAs (0-4, 4
most
effective). 1
Rating for
effectiveness
of accountability
provision
among NIS IAs (0-4, 4
most
effective). 2
Rating for
effectiveness
of accountability
provision
among NIS IAs (0-4, 4
most
effective). 3
Rating for
effectiveness
of accountability
provision
among NIS IAs (0-4, 4
most
effective). 4
Rating for
effectiveness
of accountability
provision
among NIS IAs (0-4, 4
most
effective). No Answer
Bulacan 2
1
1
2
Cagayan 9
1
7
1
3
1
3
2
3
Camarines Sur 3
3
3
2
1
Cavite 3
2
1
3
3
Ilocos Norte 3
2
1
3
1
2
Ilocos Sur 4
1
1
2
4
1
3
Isabela 9
1
8
4
4
5
Nueva Ecija 12
1
1
10
4
3
9
Occidental Mindoro 3
1
1
1
1
1
2
Pampanga 5
1
1
3
4
1
1
3
Pangasinan 5
3
2
4
1
4
Quezon 3
1
2
2
1
1
1
Tarlac 3
2
1
3
1
1
1
Total 64
10
30
3
21
3
1
1
2
16
16
28
Sources: NIS KII

124
Table 23.12. Provisions in NIS IA policies holding IA officers/BOD accountable by Province
Provinces No. of IA sample Provisions in NIS
IA policies holding water
users accountable.
No
Provisions in NIS
IA policies holding water
users accountable.
Yes
Provisions in NIS
IA policies holding water
users accountable.
No Answer
Provisions in NIS
IA policies holding water
users accountable.
No Comment
Provisions in NIS
IA policies holding IA
officers/BOD
accountable. No
Provisions in
NIS IA policies holding IA
officers/BOD
accountable. Yes
Provisions in
NIS IA policies holding IA
officers/BOD
accountable. No Answer
Bulacan 2 2 1 1
Cagayan 9 2 6 1 1 4 4
Camarines Sur 3 3 1 2
Cavite 3 3 2 1
Ilocos Norte 3 1 2 1 2
Ilocos Sur 4 4 4
Isabela 9 8 1 2 6 1
Nueva Ecija 12 3 2 7 2 10
Occidental Mindoro 3 2 1 1 2
Pampanga 5 1 4 1 1 3
Pangasinan 5 1 1 3 1 4
Quezon 3 3 1 2
Tarlac 3 1 1 1 1 2
Total 64 9 33 20 2 11 25 28
Sources: NIS KII

125
Table 23.13. Policies which are not adequately implemented by NIS IAs by Province
Provinces No. of IA sample Policies which are
not adequately implemented by
NIS IAs. Payment
of ISF/IA dues
Policies which are
not adequately implemented by
NIS IAs. Water
delivery schedules
Policies which are not
adequately implemented by NIS IAs. Penalty clauses
Policies which
are not adequately
implemented by
NIS IAs. Others
Policies which
are not adequately
implemented by
NIS IAs. No Answer
Policies which
are not adequately
implemented by
NIS IAs. None
Policies which
are not adequately
implemented by
NIS IAs. Not Applicable
Bulacan 2 1 1
Cagayan 9 1 2 1 2 2 3
Camarines Sur 3 1 2 1
Cavite 3 3 1
Ilocos Norte 3 3
Ilocos Sur 4 2 2
Isabela 9 2 7
Nueva Ecija 12 1 3 2 7
Occidental Mindoro 3 2 1
Pampanga 5 2 1 2
Pangasinan 5 1 1 1 2
Quezon 3 1 2
Tarlac 3 1 1 1
Total 64 2 10 9 7 13 12 16
Sources: NIS KII
Note: Others - wearing of uniform, securing for personal needs, irrigation procedure, improper behavior, restriction of garbage/illegal settlers, destruction of turnouts.

126
Table 23.14. Trainings attended by NIS IAs by Province
Provinces No. of IA sample Trainings attended
by NIS IAs. Basic Leadership Devt.
Course
Trainings attended
by NIS IAs. Financial
Management
Trainings attended by NIS
IAs. Org. Management/Capability/Policy
Trainings
attended by NIS IAs. Values
formation
Trainings
attended by NIS IAs.
System/water
management
Trainings
attended by NIS IAs.
Cropping/AWD/
quality control/fertilizer
Bulacan 2 1 2 1 1
Cagayan 9 4 6 1 1 5 4
Camarines Sur 3 1 2
Cavite 3 3
Ilocos Norte 3 1
Ilocos Sur 4
Isabela 9 3 5 3 3 5 3
Nueva Ecija 12 2 1 2 4
Occidental Mindoro 3 2 1 1
Pampanga 5 2 2 1 1 1
Pangasinan 5 2 1
Quezon 3 1 1 1 3
Tarlac 3 1 1 1 1
Total 64 15 19 9 6 19 20
Sources: NIS KII

127
Table 23.15. Average participation to NIS-IA meetings of IA officers and BODs by Province
Provinces No. of IA sample
Participation to NIS-IA
meetings - IA
officers (50 and below)
Participation to NIS-IA
meetings - IA
officers (51 - 80)
Participation to NIS-IA
meetings - IA
officers (more than 80)
Participation to NIS-IA
meetings -
BODs (50 and below)
Participation to NIS-IA
meetings -
BODs (51 - 80)
Participation to NIS-IA
meetings -
BODs (more than 80)
Participation to NIS-IA
meetings -
General assembly (50
and below)
Participation to NIS-IA
meetings -
General assembly (51
- 80)
Participation to NIS-IA
meetings -
General assembly
(more than
80)
Bulacan 2
1
1
1
1
1
Cagayan 9
3
4
3
4
1
4
2
Camarines Sur 3
1
2
3
1
1
Cavite 3
3
3
2
1
Ilocos Norte 3
1
1
2
Ilocos Sur 4
2
1
2
1
2
Isabela 9
1
8
2
7
1
5
3
Nueva Ecija 12
1
1
2
1
2
2
1
Occidental
Mindoro 3
1
1
1
Pampanga 5
1
1
1
Pangasinan 5
3
3
3
Quezon 3
2
1
1
2
2
1
Tarlac 3
3
3
1
1
Total 64
2
11
30
3
7
32
10
19
10
Sources: NIS KII

128
Table 23.16. Frequency of meeting of NIS-IA officers/BODs and members by Province
Provinces No. of IA
sample
Frequency of
meeting of
NIS-IA officers/BODs
and members.
IA officers (once-thrice a
month)
Frequency of
meeting of
NIS-IA officers/BODs
and members.
IA officers (once to 6
times per
cropping)
Frequency of
meeting of
NIS-IA officers/BODs
and members.
IA officers (as needed)
Frequency of
meeting of
NIS-IA officers/BODs
and members.
BODs (1-2 times per
month)
Frequency of
meeting of
NIS-IA officers/BODs
and members.
BODs (once a year-every
cropping)
Frequency of
meeting of
NIS-IA officers/BODs
and members.
BODs (as needed)
Frequency of
meeting of
NIS-IA officers/BODs
and members.
General Assembly
(monthly-
twice a year)
Frequency of
meeting of
NIS-IA officers/BODs
and members.
General Assembly
(yearly/every
two years)
Frequency of
meeting of
NIS-IA officers/BODs
and members.
General Assembly (as
needed)
Frequency of
meeting of
NIS-IA officers/BODs
and members.
General Assembly
(have not yet
conducted)
Bulacan 2
2
2
1
1
Cagayan 9
7
1
8
5
4
Camarines Sur 3
3
3
1
2
Cavite 3
3
3
2
1
Ilocos Norte 3
3
3
2
1
Ilocos Sur 4
3
1
3
4
Isabela 9
8
1
9
4
5
Nueva Ecija 12
4
2
4
2
4
1
Occidental Mindoro 3
1
1
2
2
Pampanga 5
1
1
3
2
1
2
3
2
Pangasinan 5
5
5
2
3
Quezon 3
3
2
3
Tarlac 3
1
2
1
2
1
2
Total 64
44
6
6
47
3
4
30
23
2
1
Sources: NIS KII

129
Table 23.17. Manner of choosing and term of office and forms of compensation of NIS-IA officers/BOD by Province
Provinces No. of IA
sample
Manner of
choosing and term of
office of
NIS-IA officers/B
OD -
election by general
assembly
Manner of
choosing and term of
office of
NIS-IA officers/B
OD -
voted by BOD
Manner of
choosing and term of
office of
NIS-IA officers/B
OD - 1-2
years
Manner of
choosing and term of
office of
NIS-IA officers/B
OD - 3-4
years
Forms of
compensation of NIS-
IA (15-
30% of collection,
if 70-90%
collection)
Forms of
compensation of NIS-
IA (BOD
with honorariu
m P1,000-
P2,000)
Forms of
compensation of NIS-
IA (P100-
200/mgt/activity)
Forms of
compensation of NIS-
IA
(P5000/season)
Forms of
compensation of NIS-
IA (P200-
800/month)
Forms of
compensation of NIS-
IA (Other
incentives - snacks,
P500/grou
p discounts)
Forms of
compensation of NIS-
IA (none)
Bulacan 2
2
1
1
1
1
Cagayan 9
9
7
2
2
1
2
3 Camarines
Sur 3
3
3
1
1
1
Cavite 3
3
3
3
Ilocos Norte 3
2
1
3
1
2
Ilocos Sur 4
3
1
3
1
4
Isabela 9
8
1
9
2
2
3
2
Nueva Ecija 12
6
5
1
5 Occidental
Mindoro 3
3
3
3
Pampanga 5
4
4
1
4
Pangasinan 5
5
4
1
1
2
Quezon 3
3
3
3
Tarlac 3
3
3
1
Total 64
54
3
41
15
3
4
4
1
5
4
32
Sources: NIS
KII

130
Table 23.18. Respondents' rating on NIA's support to NIS IAs and modifications by NIS IAs to IS by Province
Provinces No. of IA sample Respondents'
average rating on NIA's support to
NIS-IAs.
(Technical - 0-4, 4 excellent)
Respondents'
average rating on NIA's support to
NIS-IAs.
(Financial - 0-4, 4 excellent)
Respondents'
average rating on NIA's support to
NIS-IAs.
(Institutional - 0-4, 4 excellent)
Modifications by
NIS IAs to IS. Structure non-
operational (No)
Modifications by
NIS IAs to IS. Structure non-
operational
(Yes)
Modifications by
NIS IAs to IS. Structure non-
operational (No
Answer)
Modifications by
NIS IAs to IS. Undertook
rehabilitation
(No)
Modifications by
NIS IAs to IS. Undertook
rehabilitation
(Yes)
Bulacan 2 3 3 2 Cagayan 9 4 3 4 6 3 4 2
Camarines Sur 3 4 3 1 1 1 2
Cavite 3 3 3 3 3 Ilocos Norte 3 3 1 2 1
Ilocos Sur 4 4 3 3 2 2 1
Isabela 9 4 4 4 6 3 4 5
Nueva Ecija 12 4 4 4 5 7 6
Occidental Mindoro 3 4 4 1 2 1
Pampanga 5 4 4 4 1 2 2 1 1
Pangasinan 5 3 3 3 3 2 3
Quezon 3 4 4 4 2 1 2
Tarlac 3 4 4 4 2 1 2
Total 64 4 4 4 27 10 27 26 9
Sources: NIS KII Provinces Modifications by
NIS IAs to IS.
Undertook
rehabilitation (No
Answer)
Modifications by
NIS IAs to IS.
Other
Modifications
(Canal Lining)
Modifications by
NIS IAs to IS.
Other
Modifications
(Drainage Rehab)
Modifications by
NIS IAs to IS. Other
Modifications
(Canal
Desiltation/rehab)
Modifications by
NIS IAs to IS.
Other
Modifications
(Others)
Bulacan 2
Cagayan 3 1 2 2
Camarines Sur 1 1
Cavite 3
Ilocos Norte 2
Ilocos Sur 3
Isabela 8 2
Nueva Ecija 6 3 3 4
Occidental Mindoro 2 1 1
Pampanga 3 1 1
Pangasinan 2 1
Quezon 1
Tarlac 1 1
Total 29 13 2 5 12
Sources: NIS KII

131
By Size
Characterizing the NIS sample according to size provide some useful insights (Tables 24.1 to
24.19).
The 64 IA NIS samples are not well distributed by size, as defined above. Small sized IAs come
from only one province. These IAs reported the highest incidence of water scarcity in the dry
season, flooding in the wet season, canal problems (e.g. lateral canals), and siltation/solid waste
problems. These IAs are financially weaker compared to the medium and large ones.
Medium-sized systems/IAs come second in severity of water scarcity in the dry season and
siltation problems. They have the highest count of problems of irrigation headwork and main canal.
They also have the highest count of lacking facilities or damaged FMRs. On the other hand, they
have reported flooding and the lateral canal and control structures problems as their least concerns.
In terms of gravity, institutional problems comprising of water theft, lack of discipline and conflict
among members, lack of policies and weak policy enforcement have been identified. These are
followed by inadequacy of water and irrigation structure condition problems.
Large systems/IAs indicated adequate water supply, least occurrence of siltation problems, lowest
count of irrigation headwork and main canal problems, minimal occurrence of flooding and
adequacy of budget. Furthermore, they have a high percentage of “successful” IAs compared with
the small and medium size IAs. On the flip side, they come second in terms of lateral canal and
control structure problems, lack of facilities/infrastructures and institutional problems like lack of
policies and weak enforcement of their laws. In this sample IAs, institutional problems have the
highest count, followed by irrigation structure problems and lastly, production problems caused
by calamities/pest infestations.

132
Table 24.1. NIS IA Profile, Cropping Information and Financial Aspects by "Size"
Size No. of IA sample
Ave. of No. of Members
Ave. of No. of Farmers-
Landowner-
operator (%)
Ave. of No. of Farmers-Tenant
(%)
Ave. of No. of Farmers-
Lessees (%)
Does IA have water
permit?
(answer: no)
Does IA have water
permit?
(answer: yes)
Does IA have water
permit?
(no answer)
No. of Crops Irrigated:
rice only
No of Crops Irrigated: rice
and other crops
No. of IAs paying ISF/DCC/amortization
Large 43
190
61 40
17
23
9
10
29 10 24
Medium 12
221
57 47
4
5
1
9 3 8
Small 9
127
56 62
2
1
6
6 3 2 Average for
All
Sample/Total 64
187
60 45
17
29
15
17
44 16 34
Sources: NIS KII
Table 24.2. Problems/concerns of NIS IAs by "Size"
Size No. of IA sample
No. of IAs with
inadequate
water supply in
dry season
No. of IAs with
flooding
problem during wet
season
No. of IAs with Irrigation
Headwork
Problems (damaged,
deteriorated,
lacking)
No. of IAs with
Irrigation
Main Canal Problems
(damaged,
deteriorated,
unlined)
No. of IAs with
Irrigation
Lateral Canal
Problems
(damaged,
deteriorated,
unlined)
No. of IAs with
Irrigation
Control Structure
Problems
(damaged,
deteriorated,
lacking,
unlined)
No. of IAs with
Siltation,
Solid Waste,
Informal
Settlers &
Water
Quality
Problems
No. of IAs with
problems
due to lack of facilities,
infrastructure
(FMRs),
canal
extensions,
drainage, storage,
pipelines, STWs, solar
drier & etc.
No. of IAs with problems due to
damaged/lack of
Machineries & Equipment (ex.
Backhoes,
pumps, pipes &
etc.)
No. of IAs with institutional/management
problems
Large 43
11
2 5
9
18
11
10
12 9 19
Medium 12
8 4
3
5
2
4
2 5 7
Small 9
3
1 3
1
4
2
3
5 2 3
Total 64
22
3 12
13
27
15
17
19 16 29
Sources: NIS
KII
Note: Institutional/Management Problems - Water Stealing, lack of discipline, water scheduling problems, illegal turnouts, animals like carabaos allowed in canal, attendance during maintenance work, conflict among members, rules not followed, safety
problems
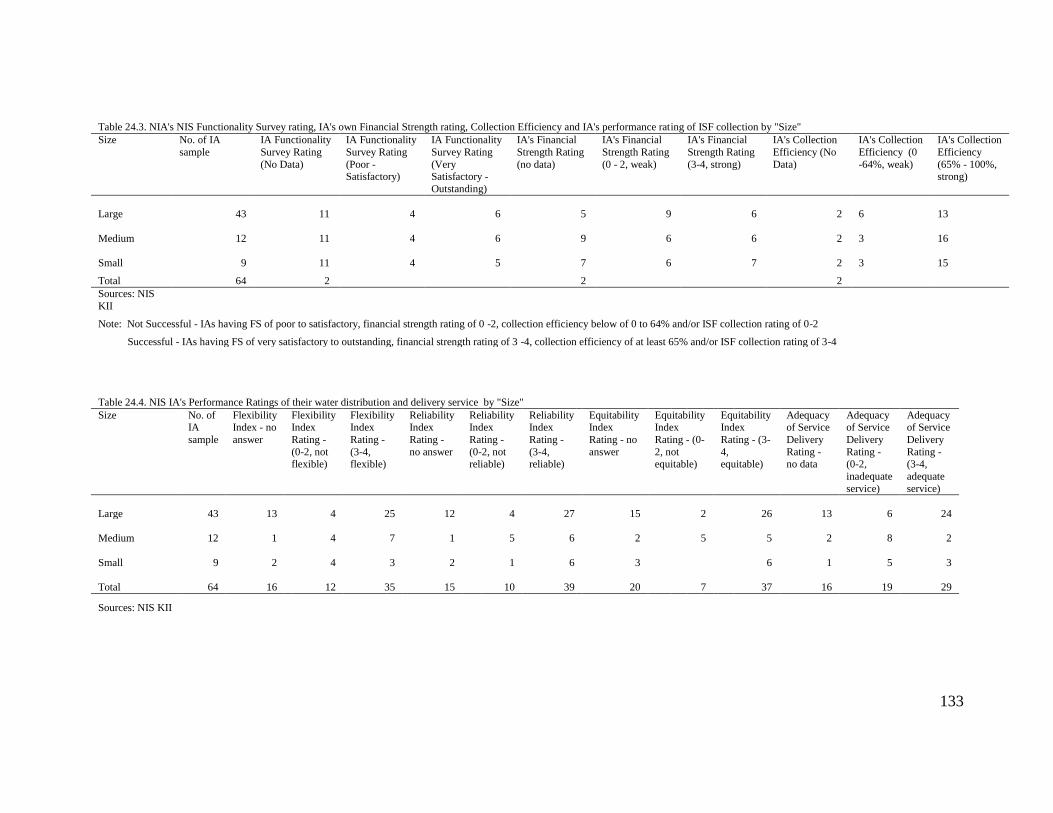
133
Table 24.3. NIA's NIS Functionality Survey rating, IA's own Financial Strength rating, Collection Efficiency and IA's performance rating of ISF collection by "Size"
Size No. of IA
sample
IA Functionality
Survey Rating
(No Data)
IA Functionality
Survey Rating
(Poor - Satisfactory)
IA Functionality
Survey Rating
(Very Satisfactory -
Outstanding)
IA's Financial
Strength Rating
(no data)
IA's Financial
Strength Rating
(0 - 2, weak)
IA's Financial
Strength Rating
(3-4, strong)
IA's Collection
Efficiency (No
Data)
IA's Collection
Efficiency (0
-64%, weak)
IA's Collection
Efficiency
(65% - 100%, strong)
Large 43 11 4 6 5 9 6 2 6
13
Medium 12 11 4 6 9 6 6 2
3
16
Small 9 11 4 5 7 6 7 2
3
15
Total 64 2 2 2
Sources: NIS
KII
Note: Not Successful - IAs having FS of poor to satisfactory, financial strength rating of 0 -2, collection efficiency below of 0 to 64% and/or ISF collection rating of 0-2
Successful - IAs having FS of very satisfactory to outstanding, financial strength rating of 3 -4, collection efficiency of at least 65% and/or ISF collection rating of 3-4
Table 24.4. NIS IA's Performance Ratings of their water distribution and delivery service by "Size"
Size No. of IA
sample
Flexibility Index - no
answer
Flexibility Index
Rating -
(0-2, not flexible)
Flexibility Index
Rating -
(3-4, flexible)
Reliability Index
Rating -
no answer
Reliability Index
Rating -
(0-2, not reliable)
Reliability Index
Rating -
(3-4, reliable)
Equitability Index
Rating - no
answer
Equitability Index
Rating - (0-
2, not equitable)
Equitability Index
Rating - (3-
4, equitable)
Adequacy of Service
Delivery
Rating - no data
Adequacy of Service
Delivery
Rating - (0-2,
inadequate
service)
Adequacy of Service
Delivery
Rating - (3-4,
adequate
service)
Large 43
13
4
25
12
4
27
15
2
26
13
6
24
Medium 12
1
4
7
1
5
6
2
5
5
2
8
2
Small 9
2
4
3
2
1
6
3
6
1
5
3
Total 64
16
12
35
15
10
39
20
7
37
16
19
29
Sources: NIS KII

134
Table 24.5. NIS IA's rating of their ability to seek outside help by "Size"
No. of IA
sample
Ave. Rating for ability of
NIS IAs to seek outside help (0-4, 4 most
influential)
Rating
for ability
of NIS
IAs to seek
outside
help (0)
Rating
for ability
of NIS
IAs to seek
outside
help (1)
Rating for ability of
NIS IAs to seek outside help (2)
Rating for ability of
NIS IAs to seek outside help (3)
Rating for ability of
NIS IAs to seek outside help (4)
Rating for
ability of NIS IAs to seek
outside help
(No answer)
43 2
4
1 5 8 3
22
12 3
1 1 4 2
4
9 3 4 1 1
3
64 2
4
2 10 13 6
29
Table 24.6. Assistance received by NIS IAs from Various Sources by "Size"
Size No.
of IA
sample
Assistance
received by
NIS IAs from Various
sources.
BSWM - Free Soil analysis
Assistance
received
by NIS IAs from
Various
sources. LGU -
Farm
inputs/seed subsidy
Assistance
received by
NIS IAs from Various
sources. LGU
- Repair farm to market
roads
Assistance
received by NIS
IAs from Various sources.
LGU -
financial/livelihood
Assistance
received by NIS
IAs from Various sources. LGU -
technical support
Assistance received
by NIS IAs from
Various sources. LGU -
equipment/thresher/
fuel
Assistance
received by
NIS IAs from
Various
sources. Others -
flatbed
dryer/solar dryer
Assistance
received by
NIS IAs from
Various
sources. Others -
pump/thres
her / fuel
Assistance
received by
NIS IAs from Various
sources.
Others - Seed subsidy/anal
ysis
Assistance
received
by NIS IAs from
Various
sources. Others -
soil
sampling/training
Large 43
10
3 3 1 1
3
5
10
2
Medium 12
1
1 1 2
1
1
4
Small 9
1
1
Total 64
10
4
2 4 1 3
4
6
15
2
Sources: NIS KII

135
Table 24.7. Cropping problems of NIS IAs by "Size"
Size No. of IA
sample
Cropping
problems of NIS
IAs.
Garbage in the
canals
Cropping
problems of NIS IAs.
Lack of
water supply
Cropping
problems of NIS IAs. Water
delivery
schedule
Cropping problems
of NIS IAs. Low yield/calamities
Cropping problems
of NIS IAs. High production cost/low
buying price
Cropping problems of
NIS IAs. FMR/high harvest loss
Cropping
problems of NIS IAs.
Others -
informal settlers, govt.
Support
Large 43
3 1 18 6 1
Medium 12
1 2 6
Small 9
1 3 3
1
Total 64
1
4 3 27 9 1
1
Sources: NIS KII
Table 24.8. Problems encountered by NIS IAs by "Size"
Size No. of
IA
sample
Problems
encountered by
NIS-IAs. Unlined canals and turnout
Problems
encountered
by NIS-IAs. Poor
structure
design
Problems
encountered
by NIS-IAs.
Damaged
irrigation
structure
Problems
encountered
by NIS-IAs. Lack
of water
supply
Problems encountered
by NIS-IAs. Solid waste
in canals/siltation
Problems
encountered by
NIS-IAs. Some members don't
follow the
schedule
Problems
encountered
by NIS-IAs. Illegal
turnouts
Problems
encountered by NIS-
IAs. Damaged farm to market road
Problems
encountered
by NIS-IAs. Others
Large 43 4
3
8
7 9 6
2 5
8
Medium 12 1 2
7 3 1
5
Small 9 2
3
4 2 1 6
Total 64 7
5
11
18 14 8
2 11
13
Sources: NIS KII
Note: Others - extension of water schedule; lack of equipment; lack of irrigation facilities; monitoring of water delivery & maintenance of laterals with certain stretch; none; improve the irrigation facilities; irrigation
structure not yet finished; lack of discipline; not following cropping calendar; political intervention; slow action of NIS; ISF very high;
lack of water pump

136
Table 24.9. Average Performance Rating of various functions of NIS IAs by "Size"
Size No. of IA sample Performance
Rating of NIS IAs (0-
4, 4
excellent). Water
distribution
Performance
Rating of NIS IAs (0-
4, 4
excellent). Maintenance
of canals
Performance
Rating of NIS IAs (0-4, 4
excellent).
Maintenance of control
structures
Performance
Rating of NIS IAs (0-4, 4
excellent).
Construction of facilities
Performance
Rating of NIS IAs (0-4, 4
excellent).
Collection of ISF
Performance
Rating of NIS IAs (0-4, 4
excellent).
Collection of other fees
Performance
Rating of NIS IAs (0-4, 4
excellent).
Technical Advice to
farmers
Performance
Rating of NIS IAs. Overall
rating
Large 43 3
4
3
3 3
3
3
2
Medium 12
3
3
3
2 3
2
3
2
Small 9
4
3
3 4
4
4
2
Average for All Sample/Total 64 3
3
3
2 3
3
3
2
Sources: NIS KII
Table 24.10. NIS IA's Collection Rate by "Size"
Size No. of
IA
sample
Ave. of
Collection Rate
(%) of NIS IAs
Collection
Rate (%)
of NIS IAs. 30
and below
Collection
Rate (%) of
NIS IAs. 31 - 60
Collection
Rate (%) of
NIS IAs. 61 - 90
Collection
Rate (%) of
NIS IAs. 91 and above
Collection
Rate (%)
of NIS IAs. No
answer
Rating on
NIS IAs'
ability to resolve
conflict (0-
4, 4 effective). 2
Rating on
NIS IAs'
ability to resolve
conflict (0-
4, 4 effective). 3
Rating on
NIS IAs'
ability to resolve
conflict (0-4,
4 effective). 4
Rating on NIS
IAs' ability to
resolve conflict (0-4, 4 effective).
No Answer
Large 43
77
6
21
6
10
1
5
18 19
Medium 12
70
1
2
5
1
3
3
4 5
Small 9 83
6
3
2
1
5 1
Average for All
Sample/Total 64
77
1
8
32
10
13
3
9
27 25
Sources: NIS KII

137
Size Rating for
effectiveness of
accountability provision among
NIS IAs (0-4, 4
most effective). 4
Rating for effectiveness of
accountability provision
among NIS IAs (0-4, 4 most effective). No
Answer
Large 13 20
Medium 2 5
Small 1 3
Total 16 28
Sources: NIS KII
Table 24.11. NIS IA's Rating on Water Delivery Service and Water Distribution Policy by "Size"
Size No. of IA sample
Rating of NIS IAs' water delivery
service (0-4, 4
highest). 0
Rating of NIS IAs' water delivery
service (0-4, 4
highest). 1
Rating of NIS IAs' water
delivery service
(0-4, 4 highest). 2
Rating of NIS IAs' water
delivery
service (0-4, 4 highest). 3
Rating of NIS IAs' water delivery service (0-4, 4
highest). 4
Rating of NIS IAs' policy on
water distribution
scheme (0-4, 4 highest). 0
Rating of NIS IAs' policy on
water distribution
scheme (0-4, 4 highest). 1
Rating of NIS IAs' policy on water
distribution
scheme (0-4, 4 highest). 2
Rating of NIS IAs' policy on
water distribution
scheme (0-4, 4 highest). 3
Large 43 3
6 18 1 6
Medium 12 1 3 2
1 1 1 1 1
Small 9 5 1 2 1
Total 64 1 3 10
8 21 1 2 8
Sources: NIS KII
Table 24.12. Mode of irrigation scheduling and rating for effectiveness of accountability provision among NIS
IAs by "Size"
Size No. of IA
sample
Mode of irrigation
scheduling by NIS IAs. Downstream-
upstream
Mode of irrigation scheduling by
NIS IAs. Upstream-downstream
Mode of irrigation
scheduling by NIS IAs. By groups by
hour/day on rotation/
depends on IA
Mode of
irrigation scheduling
by NIS IAs.
No answer
Rating for
effectiveness of accountability
provision among
NIS IAs (0-4, 4 most effective).
Rating for
effectiveness of accountability
provision among
NIS IAs (0-4, 4 most effective). 0
Rating for
effectiveness of accountability
provision among
NIS IAs (0-4, 4 most effective). 1
Rating for
effectiveness of accountability
provision among
NIS IAs (0-4, 4 most effective). 2
Rating for
effectiveness of accountability
provision among
NIS IAs (0-4, 4 most effective). 3
Large 43 5 17 3 18 3 2 8
Medium 12 2 9
1 3 1 1 3
Small 9 3 4
2 3 5
Total 64 10 30 3 21 3 1 1 2 16
Sources: NIS KII

138
Table 24.13. Provisions in NIS IA policies holding IA officers/BOD accountable by "Size"
Size No. of IA sample Provisions in NIS IA
policies holding water users accountable. No
Provisions in NIS IA
policies holding water users accountable. Yes
Provisions in NIS IA
policies holding water users accountable. No
Answer
Provisions in
NIS IA policies holding water
users
accountable. No Comment
Provisions in
NIS IA policies holding IA
officers/BOD
accountable. No
Provisions in
NIS IA policies holding IA
officers/BOD
accountable. Yes
Provisions in
NIS IA policies holding IA
officers/BOD
accountable. No Answer
Large 43 6 19 16 2 7 16 20
Medium 12 3 8 1 4 5 3
Small 9 6 3 4 5
Total 64 9 33 20 2 11 25 28
Sources: NIS KII
Table 24.14. Policies which are not adequately implemented by NIS IAs by "Size"
No. of IA sample Policies which are not
adequately implemented by NIS IAs. Payment of
ISF/IA dues
Policies which are not
adequately implemented by NIS IAs. Water
delivery schedules
Policies which are not
adequately implemented by NIS IAs. Penalty clauses
Policies which
are not adequately
implemented by
NIS IAs. Others
Policies which
are not adequately
implemented by
NIS IAs. No Answer
Policies which are not
adequately implemented by NIS
IAs. None
Policies which
are not adequately
implemented by
NIS IAs. Not Applicable
43 3 7 6 8 10 12
12 2 4 2 2 1 2
9 3 1 3 1 2
64 2 10 9 7 13 12 16
Sources: NIS KII
Note: Others - wearing of uniform, securing for personal needs, irrigation procedure, improper behavior, restriction of garbage/illegal settlers, destruction of turnouts.

139
Table 24.15. Trainings attended by NIS IAs by "Size"
Size No. of IA sample Trainings attended by NIS
IAs. Basic Leadership
Devt. Course
Trainings attended by NIS
IAs. Financial
Management
Trainings attended by NIS IAs.
Org.
Management/Capability/Policy
Trainings attended
by NIS IAs.
Values formation
Trainings attended
by NIS IAs.
System/water management
Trainings attended by
NIS IAs.
Cropping/AWD/quality control/fertilizer
Large 43 10 12 8 4 11 11
Medium 12 4 5 1 2 6 3
Small 9 1 2 2 6
Total 64 15 19 9 6 19 20
Sources: NIS KII
Table 24.16. Average participation to NIS-IA meetings of IA officers and BODs by "Size"
Participation to
NIS-IA meetings - IA officers (50
and below)
Participation to
NIS-IA meetings - IA officers (51 -
80)
Participation to NIS-
IA meetings - IA officers (more than 80)
Participation to
NIS-IA meetings - BODs (50 and
below)
Participation to
NIS-IA meetings - BODs (51 - 80)
Participation to
NIS-IA meetings - BODs (more than
80)
Participation to
NIS-IA meetings - General assembly
(50 and below)
Participation to
NIS-IA meetings - General assembly
(51 - 80)
Participation to NIS-
IA meetings - General assembly (more than
80)
2 6 19 3 5 18 8 10 5
3 6 1 8 2 3 3
2 5 1 6 6 2
2 11 30 3 7 32 10 19 10
Sources: NIS KII

140
Table 24.17. Frequency of meeting of NIS-IA officers/BODs and members by "Size"
Size No. of IA
sample
Frequency of
meeting of NIS-IA
officers/BO
Ds and members. IA
officers
(once-thrice a month)
Frequency of
meeting of NIS-IA
officers/BO
Ds and members. IA
officers
(once to 6 times per
cropping)
Frequency of
meeting of NIS-IA
officers/BO
Ds and members. IA
officers (as
needed)
Frequency of
meeting of NIS-IA
officers/BO
Ds and members.
BODs (1-2
times per month)
Frequency of
meeting of NIS-IA
officers/BO
Ds and members.
BODs (once
a year-every cropping)
Frequency of
meeting of NIS-IA
officers/BO
Ds and members.
BODs (as
needed)
Frequency of
meeting of NIS-IA
officers/BO
Ds and members.
General
Assembly (monthly-
twice a year)
Frequency of
meeting of NIS-IA
officers/BO
Ds and members.
General
Assembly (yearly/ever
y two years)
Frequency of
meeting of NIS-IA
officers/BO
Ds and members.
General
Assembly (as needed)
Frequency of
meeting of NIS-IA
officers/BO
Ds and members.
General
Assembly (have not yet
conducted)
Large 43
27
4
6
29
3
4
19
14
2
1
Mediu
m 12
9
1
10
5
6
Small 9
8
1
8
6
3
Total 64
44
6
6
47
3
4
30
23
2
1
Sources: NIS KII
Table 24.18. Manner of choosing and term of office and forms of compensation of NIS-IA officers/BOD by "Size"
Size No. of IA sample
Manner of choosing
and term of
office of NIS-IA
officers/BO
D - election by
general
assembly
Manner of choosing
and term of
office of NIS-IA
officers/BO
D - voted by BOD
Manner of choosing
and term of
office of NIS-IA
officers/BO
D - 1-2 years
Manner of choosing
and term of
office of NIS-IA
officers/BO
D - 3-4 years
Forms of compensati
on of NIS-
IA (15-30% of
collection,
if 70-90% collection)
Forms of compensati
on of NIS-
IA (BOD with
honorarium
P1,000-P2,000)
Forms of compensatio
n of NIS-IA
(P100-200/mgt/acti
vity)
Forms of compensati
on of NIS-
IA (P5000/seas
on)
Forms of compensati
on of NIS-
IA (P200-800/month)
Forms of compensati
on of NIS-
IA (Other incentives -
snacks,
P500/group discounts)
Forms of compensati
on of NIS-
IA (none)
Large 43
34
2
27
8
1
4
3
5
2
18
Medium 12
12
8
4
2
1
1
8
Small 9
8
1
6
3
1
1
6
Total 64
54
3
41
15
3
4
4
1
5
4
32
Sources: NIS KII

141
Table 24.19. Respondents' rating on NIA's support to NIS IAs and modifications by NIS IAs to IS by "Size"
Size No. of IA sample Respondents' average
rating on NIA's support to NIS-IAs. (Technical -
0-4, 4 excellent)
Respondents' average
rating on NIA's support to NIS-IAs. (Financial -
0-4, 4 excellent)
Respondents'
average rating on NIA's support
to NIS-IAs.
(Institutional - 0-4, 4 excellent)
Modifications by
NIS IAs to IS. Structure non-
operational (No)
Modifications by
NIS IAs to IS. Structure non-
operational
(Yes)
Modifications by
NIS IAs to IS. Structure non-
operational (No
Answer)
Modifications by
NIS IAs to IS. Undertook
rehabilitation
(No)
Modifications by
NIS IAs to IS. Undertook
rehabilitation
(Yes)
Large 43 4 4 4 20 7 16 19 7
Medium 12 4 4 4 6 2 4 6 1
Small 9 3 3 3 1 1 7 1 1
Total 64 4 4 4 27 10 27 26 9
Sources: NIS KII
Size Modifications by NIS
IAs to IS. Undertook
rehabilitation (No
Answer)
Modifications by NIS IAs to IS. Other
Modifications (Canal
Lining)
Modifications by NIS IAs to IS. Other
Modifications (Drainage
Rehab)
Modifications by NIS IAs to IS.
Other
Modifications (Canal
Desiltation/rehab)
Modifications by NIS IAs to IS.
Other
Modifications (Others)
Large 17 11 1 4 10
Medium 5 2 1 1 1
Small 7 1
Total 29 13 2 5 12
Sources: NIS KII

142
By Technology
Tables 25.1 to 25.19 provide the profiles of the NIS sample in terms of technology: gravity,
reservoir and pump.
There are three types of irrigation technologies, irrigation by gravity, use of pump technology, and
reservoir systems. IA samples irrigated by gravity experience the most severe water supply
shortage in the dry season. Other problems they experience include flooding, irrigation headwork
and control structure problems, deteriorated FMRs, and having several financially weak IAs. On
the contrary, IAs irrigated by gravity have the least irrigation canal and institutional problems, and
second for siltation problems.
IA samples that use pump technology have adequate and dependable sources of water, do not
experience flooding problems, and have higher collection efficiencies compared to the gravity
system IAs. However, these IAs also have the highest incidence of siltation problems lateral canal,
and institutional problems. The most prevalent problem among this group is the poor condition of
their lateral canals, accompanied by problems induced by lack of machineries and equipment (e.g.
backhoe and back-up pumps).
Reservoir systems appear to be the most successful of the three technologies. In general, the sample
IAs had adequate water supply, low count of siltation problems, with more financially strong IAs,
high functionality survey ratings, and high collection efficiencies. On the contrary, they also have
the most number of deteriorated FMRs and the worst main canal conditions. Other problems are
institutional, and those caused by calamities and/or pest infestations.

143
Table 25.1. NIS IA Profile, Cropping Information and Financial Aspects by "Technology"
Technology No. of IA
sample
Ave. of No.
of Members
Ave. of No.
of Farmers-Landowner
-operator
(%)
Ave. of No.
of Farmers-Tenant (%)
Ave. of No.
of Farmers-Lessees (%)
Does IA
have water permit?
(answer:
no)
Does IA
have water permit?
(answer:
yes)
Does IA
have water permit? (no
answer)
No. of
Crops Irrigated:
rice only
No of
Crops Irrigated:
rice and
other crops
No. of IAs paying
ISF/DCC/amortization
Diversion 28
105
51
50
18
9
8
10
15
13 12
Pump 14
375
59
42
10
8
3
1
11
3 7
Reservoir 22
161
71
40
19
12
4
6
18 15
Average for All
Sample/Total 64
187
60
45
17
29
15
17
44
16 34
Sources: NIS KII
Table 25.2. Problems/concerns of NIS IAs by "Technology"
Technology No. of IA sample
No. of IAs with
inadequate
water supply in dry
season
No. of IAs with
flooding
problem during wet
season
No. of IAs with
Irrigation
Headwork Problems
(damaged,
deteriorated, lacking)
No. of IAs with
Irrigation
Main Canal Problems
(damaged,
deteriorated, unlined)
No. of IAs with
Irrigation
Lateral Canal
Problems
(damaged, deteriorated
, unlined)
No. of IAs with
Irrigation
Control Structure
Problems
(damaged, deteriorated
, lacking,
unlined)
No. of IAs with
Siltation,
Solid Waste,
Informal
Settlers & Water
Quality
Problems
No. of IAs with
problems
due to lack of facilities,
infrastructu
re (FMRs), canal
extensions,
drainage, storage,
pipelines,
STWs, solar drier
& etc.
No. of IAs with
problems
due to damaged/la
ck of
Machineries &
Equipment
(ex. Backhoes,
pumps,
pipes & etc.)
No. of IAs with institutional/mana
gement problems
Diversion 28
15
2
10
4
9
8
8
8
5 12
Pump 14
4
2
3
8
3
6
4
7 7
Reservoir 22
3
1
6
10
4
3
7
4 10
Total 64
22
3
12
13
27
15
17
19
16 29
Sources: NIS KII Note: Institutional/Management Problems - Water Stealing, lack of discipline, water scheduling problems, illegal turnouts, animals like carabaos allowed in canal, attendance during maintenance work,
conflict among members, rules not followed, safety problems

144
Table 25.3. NIA's NIS Functionality Survey rating, IA's own Financial Strength rating, Collection Efficiency and IA's performance rating of ISF
collection by "Technology"
Technolo
gy
No. of IA
sample
IA
Functionality
Survey Rating (No
Data)
IA
Functionality
Survey Rating (Poor
-
Satisfactory)
IA
Functionality
Survey Rating (Very
Satisfactory -
Outstanding)
IA's Financial
Strength
Rating (no data)
IA's Financial
Strength
Rating (0 - 2, weak)
IA's Financial
Strength
Rating (3-4, strong)
IA's
Collection
Efficiency (No Data)
IA's
Collection
Efficiency (0 -64%,
weak)
IA's
Collection
Efficiency (65% -
100%,
strong)
IA's
Performance
Rating of Collection of
ISF (no data)
Diversion 28
16
6
6
12
11
4
3
5
20
17
Pump 14
8
6
3
8
3
2
12
7
Reservoir 22
11
11
8
2
12
5
5
12
9
Total 64
35
12
17
23
21
19
8
12
44
33
Sources: NIS KII
Note: Not Successful - IAs having FS of poor to satisfactory, financial strength rating of 0 -2, collection efficiency below of 0 to 64% and/or ISF collection rating of 0-2
Successful - IAs having FS of very satisfactory to outstanding, financial strength rating of 3 -4, collection efficiency of at least 65% and/or ISF
collection rating of 3-4
Technology IA's Performance Rating of Collection of ISF (0-2, weak) IA's Performance Rating of
Collection of ISF (3-4, strong)
No. of IAs by "Success"
(insufficient data)
No. of IAs by "Success"
(Not Successful)
No. of IAs by
"Success" (Successful)
Diversion 3 8 20 8
Pump 1 6 9 5
Reservoir 1 12 11 1 10
Total 5 26 40 14 10
Sources: NIS KII
Note: Not Successful - IAs having FS of poor to satisfactory, financial strength rating of 0 -2, collection efficiency below of 0 to 64% and/or ISF collection rating of 0-2
Successful - IAs having FS of very satisfactory to outstanding, financial strength rating of 3 -4, collection efficiency of at least 65% and/or ISF collection rating of 3-4

145
Table 25.4. NIS IA's Performance Ratings of their water distribution and delivery service by "Technology"
Technology No. of
IA sample
Flexibility
Index - no answer
Flexibility
Index Rating -
(0-2, not
flexible)
Flexibility
Index Rating - (3-4,
flexible)
Reliability
Index Rating -
no answer
Reliability
Index Rating - (0-2, not
reliable)
Reliability
Index Rating -
(3-4,
reliable)
Equitab
ility Index
Rating
- no answer
Equitabilit
y Index Rating -
(0-2, not
equitable)
Equitability
Index Rating - (3-
4,
equitable)
Adequacy
of Service Delivery
Rating -
no data
Adequacy of
Service Delivery Rating
- (0-2,
inadequate service)
Adequacy of
Service Delivery
Rating - (3-4,
adequate service)
Diversion 28
8
9
10
8
6
14
10
3
15
6 14
8
Pump 14
1
2
11
1
3
10
3
4
7
2 5
7
Reservoir 22
7
1
14
6
1
15
7
15
8
14
Total 64
16
12
35
15
10
39
20
7
37
16 19
29
Sources: NIS KII
Table 25.5. NIS IA's rating of their ability to seek outside help by "Technology"
Technology No. of IA
sample
Ave. Rating for
ability of NIS
IAs to seek outside help (0-4,
4 most
influential)
Rating for
ability of NIS
IAs to seek outside help
(0)
Rating for
ability of NIS
IAs to seek outside help (1)
Rating for
ability of
NIS IAs to seek outside
help (2)
Rating for
ability of NIS
IAs to seek outside help (3)
Rating for ability of
NIS IAs to seek outside
help (4)
Rating for
ability of NIS
IAs to seek outside help (No
answer)
Diversion 28 3 2
5 3 3 15
Pump 14 2
1
4 4 1 4
Reservoir 22 2
3
1 6 2 10
Average for All Sample/Total 64 2
4 2
10 13 6 29
Sources: NIS KII

146
Table 25.6. Assistance received by NIS IAs from Various Sources by "Technology"
Technolo
gy
No. of IA
sample
Assistance
received by NIS IAs
from Various
sources. BSWM -
Free Soil
analysis
Assistance
received by NIS IAs
from
Various sources.
LGU - Farm
inputs/seed subsidy
Assistance
received by NIS IAs
from
Various sources.
LGU -
Repair farm to market
roads
Assistance
received by NIS IAs from
Various
sources. LGU - financial/liveli
hood
Assistance
received by NIS IAs
from
Various sources.
LGU -
technical support
Assistance
received by NIS IAs from Various
sources. LGU -
equipment/thresher/fuel
Assistance
received by NIS IAs
from
Various sources.
Others -
flatbed dryer/solar
dryer
Assistance
received by NIS IAs
from
Various sources.
Others -
pump/thresher / fuel
Assistance
received by NIS IAs
from
Various sources.
Others -
Seed subsidy/anal
ysis
Assistance
received by NIS IAs from
Various
sources. Others - soil
sampling/trai
ning
Diversio
n 28
2
2 2
1
2
5
1
Pump 14
1
1
1
3
2
4
Reservoir 22
7
3
3
1 1
2
6
1
Total 64
10
4
2
4
1 3
4
6
15
2
Sources: NIS KII
Table 25.7. Cropping problems of NIS IAs by "Technology"
Technology
No. of IA sample
Cropping problems
of NIS
IAs. Garbage
in the
canals
Cropping problems of
NIS IAs.
Lack of water supply
Cropping problems of
NIS IAs.
Water delivery
schedule
Cropping problems of
NIS IAs. Low
yield/calamities
Cropping problems of
NIS IAs.
High production
cost/low
buying price
Cropping problems of NIS
IAs. FMR/high
harvest loss
Cropping problems of
NIS IAs.
Others - informal
settlers,
govt. Support
Diversio
n 28
1
2
3
8
5 1
1
Pump 14
1
11
2
Reservoir 22
1
8
2
Total 64
1
4
3
27
9 1
1
Sources: NIS KII

147
Table 25.8. Problems encountered by NIS IAs by
"Technology"
Technology No. of IA
sample
Problems
encountered
by NIS-IAs. Unlined
canals and
turnout
Problems
encountered
by NIS-IAs. Poor
structure
design
Problems
encountered
by NIS-IAs. Damaged
irrigation
structure
Problems
encountered
by NIS-IAs. Lack of
water supply
Problems
encountered
by NIS-IAs. Solid waste
in
canals/siltation
Problems
encountered
by NIS-IAs. Some
members
don't follow the schedule
Problems
encountered
by NIS-IAs. Illegal
turnouts
Problems
encountered
by NIS-IAs. Damaged
farm to
market road
Problems
encountered
by NIS-IAs. Others
Diversion 28
5
1
3
13
6
3
8
4
Pump 14
1
2
2
5
4
3
1
2
5
Reservoir 22
1
2
6
4
2
1
1
4
Total 64
7
5
11
18
14
8
2
11
13
Sources: NIS KII
Note: Others - extension of water schedule; lack of equipment; lack of irrigation facilities; monitoring of water delivery & maintenance of laterals with certain stretch; none; improve the irrigation facilities; irrigation
structure not yet finished; lack of discipline; not following cropping calendar; political intervention; slow action of NIS; ISF very high; lack of water pump
Table 25.9. Average Performance Rating of various functions of NIS IAs by "Technology"
Technology No. of IA
sample
Performance
Rating of
NIS IAs (0-4, 4 excellent).
Water
distribution
Performance
Rating of
NIS IAs (0-4, 4 excellent).
Maintenance
of canals
Performance
Rating of
NIS IAs (0-4, 4 excellent).
Maintenance
of control structures
Performance
Rating of
NIS IAs (0-4, 4 excellent).
Construction
of facilities
Performance
Rating of
NIS IAs (0-4, 4 excellent).
Collection of
ISF
Performance
Rating of
NIS IAs (0-4, 4 excellent).
Collection of
other fees
Performance
Rating of
NIS IAs (0-4, 4 excellent).
Technical
Advice to farmers
Performance
Rating of
NIS IAs. Overall
rating
Diversion 28
3
3
3
2
3
3
4
1
Pump 14
3
3
3
3
3
3
3
2
Reservoir 22
4
4
3
2
3
3
3
2
Average for All
Sample/Total 64
3
3
3
2
3
3
3
2
Sources: NIS KII

148
Table 25.10. NIS IA's Collection Rate by "Technology"
Technology No. of IA
sample
Average of
Collection Rate (%) of
NIS IAs
Collection
Rate (%) of NIS IAs. 30
and below
Collection
Rate (%) of NIS IAs. 31
- 60
Collection
Rate (%) of NIS IAs. 61
- 90
Collection
Rate (%) of NIS IAs. 91
and above
Collection
Rate (%) of NIS IAs. No
answer
Rating on
NIS IAs' ability to
resolve
conflict (0-4, 4
effective). 2
Rating on
NIS IAs' ability to
resolve
conflict (0-4, 4
effective). 3
Rating on
NIS IAs' ability to
resolve
conflict (0-4, 4
effective). 4
Rating on
NIS IAs' ability to
resolve
conflict (0-4, 4
effective).
No Answer
Diversion 28
77
1
3
12
7
5
1
6
9
12
Pump 14
78
2
8
2
2
2
1
6
5
Reservoir 22
74
3
12
1
6
2
12
8
Average for All Sample/Total 64
77
1
8
32
10
13
3
9
27
25
Sources: NIS KII
Table 25.11. NIS IA's Rating on Water Delivery Service and Water Distribution
Policy by "Technology"
Technology
No. of IA sample
Rating of NIS IAs' water
delivery service
(0-4, 4 highest). 0
Rating of NIS IAs' water
delivery service
(0-4, 4 highest). 1
Rating of NIS IAs' water
delivery
service (0-4, 4 highest). 2
Rating of NIS IAs'
water
delivery service (0-4,
4 highest). 3
Rating of NIS IAs'
water
delivery service (0-4,
4 highest). 4
Rating of NIS IAs'
policy on
water distribution
scheme (0-4, 4 highest). 0
Rating of NIS
IAs'
policy on water
distribution
scheme
(0-4, 4 highest).
1
Rating of NIS IAs'
policy on
water distribution
scheme (0-4, 4 highest). 2
Rating of NIS IAs'
policy on
water distribution
scheme (0-4, 4 highest). 3
Rating of NIS IAs'
policy on
water distribution
scheme (0-4, 4 highest). 4
Diversio
n 28 1 1
7
1
7
1
1
12
Pump 14 2
3
3
4
2
3
6
Reservoi
r 22
4
10
4
10
Total 64 1 3
10
8
21
1
2
8
28
Sources: NIS KII

149
Table 25.12. Mode of irrigation scheduling and rating for effectiveness of accountability provision among
NIS IAs by "Technology"
Technol
ogy
No. of IA
sample
Mode of
irrigation
scheduling by NIS IAs.
Downstream
-upstream
Mode of
irrigation
scheduling by NIS IAs.
Upstream-
downstream
Mode of
irrigation
scheduling by NIS IAs.
By groups
by hour/day on rotation/
depends on
IA
Mode of
irrigation
scheduling by NIS IAs.
No answer
Rating for
effectivenes
s of accountabili
ty provision
among NIS IAs (0-4, 4
most
effective).
Rating for
effectivenes
s of accountabili
ty provision
among NIS IAs (0-4, 4
most
effective). 0
Rating for
effectivenes
s of accountabili
ty provision
among NIS IAs (0-4, 4
most
effective). 1
Rating for
effectivenes
s of accountabili
ty provision
among NIS IAs (0-4, 4
most
effective). 2
Rating for
effectivenes
s of accountabili
ty provision
among NIS IAs (0-4, 4
most
effective). 3
Rating for
effectivenes
s of accountabili
ty provision
among NIS IAs (0-4, 4
most
effective). 4
Rating for
effectivenes
s of accountabili
ty provision
among NIS IAs (0-4, 4
most
effective). No Answer
Diversio
n 28
7
11
1
9
3
1
1
1
6
4
15
Pump 14
1
11
2
3
1
6
4
3
Reservoi
r 22
2
8
2
10
4
4
8
10
Total 64
10
30
3
21
3
1
1
2
16
16
28
Sources: NIS KII
Table 25.13. Provisions in NIS IA policies holding IA officers/BOD accountable by "Technology"
Technology No. of IA sample Provisions in NIS IA
policies holding water users accountable. No
Provisions in NIS IA
policies holding water users
accountable. Yes
Provisions in NIS IA
policies holding water users
accountable. No Answer
Provisions in NIS
IA policies holding water users
accountable. No Comment
Provisions in NIS
IA policies holding IA officers/BOD
accountable. No
Provisions in NIS
IA policies holding IA officers/BOD
accountable. Yes
Provisions in NIS
IA policies holding IA officers/BOD
accountable. No Answer
Diversion 28 4 12 12 4 10 14
Pump 14 2 11 1 2 9 3
Reservoir 22 3 10 7 2 5 6 11
Total 64 9 33 20 2 11 25 28

150
Table 25.14. Policies which are not adequately implemented by NIS IAs by "Technology"
Technology No. of IA sample Policies which are
not adequately implemented by NIS
IAs. Payment of
ISF/IA dues
Policies which are
not adequately implemented by NIS
IAs. Water delivery
schedules
Policies which are
not adequately implemented by
NIS IAs. Penalty
clauses
Policies which are
not adequately implemented by
NIS IAs. Others
Policies which are
not adequately implemented by
NIS IAs. No
Answer
Policies which are
not adequately implemented by
NIS IAs. None
Policies which are
not adequately implemented by
NIS IAs. Not
Applicable
Diversion 28 1 7 4 1 6 2 8
Pump 14 1 3 4 1 6 1 1
Reservoir 22 1 5 1 9 7
Total 64 2 10 9 7 13 12 16
Sources: NIS KII
Note: Others - wearing of uniform, securing for personal needs, irrigation procedure, improper behavior, restriction of garbage/illegal settlers, destruction of turnouts.
Table 25.15. Trainings attended by NIS IAs by "Technology"
Technology No. of IA sample Trainings attended by NIS IAs. Basic
Leadership Devt.
Course
Trainings attended by NIS IAs.
Financial
Management
Trainings attended by NIS IAs. Org.
Management/Capability/Policy
Trainings attended by NIS IAs. Values
formation
Trainings attended by NIS IAs.
System/water
management
Trainings attended by NIS IAs. Cropping/AWD/quality
control/fertilizer
Diversion 28 7 7 3 2 8 8
Pump 14 3 5 1 1 3 4
Reservoir 22 5 7 5 3 8 8
Total 64 15 19 9 6 19 20
Sources: NIS KII

151
Table 25.16. Average participation to NIS-IA meetings of IA officers and BODs by
"Technology"
Technolog
y
No. of IA
sample
Participation to
NIS-IA meetings
- IA officers (50 and below)
Participation to
NIS-IA
meetings - IA officers (51 -
80)
Participation to
NIS-IA
meetings - IA officers (more
than 80)
Participation
to NIS-IA
meetings - BODs (50 and
below)
Participation
to NIS-IA
meetings - BODs (51 -
80)
Participation
to NIS-IA
meetings - BODs (more
than 80)
Participation
to NIS-IA
meetings - General
assembly (50
and below)
Participation
to NIS-IA
meetings - General
assembly (51 -
80)
Participation
to NIS-IA
meetings - General
assembly
(more than 80)
Diversion 28 4 14
2
16
6
7
4
Pump 14 5 5
2
2
6
1
6
2
Reservoir 22 2 2 11
1
3
10
3
6
4
Total 64 2 11 30
3
7
32
10
19
10
Table 25.17. Frequency of meeting of NIS-IA officers/BODs and members by
"Technology"
Technology
No. of IA sample
Frequency of meeting of
NIS-IA
officers/BODs and
members. IA
officers (once-thrice a
month)
Frequency of meeting of
NIS-IA
officers/BODs and
members. IA
officers (once to 6 times per
cropping)
Frequency of meeting of
NIS-IA
officers/BODs and
members. IA
officers (as needed)
Frequency of meeting of
NIS-IA
officers/BODs and
members.
BODs (1-2 times per
month)
Frequency of meeting of
NIS-IA
officers/BODs and
members.
BODs (once a year-every
cropping)
Frequency of meeting of
NIS-IA
officers/BODs and
members.
BODs (as needed)
Frequency of meeting of
NIS-IA
officers/BODs and
members.
General Assembly
(monthly-twice a year)
Frequency of meeting of
NIS-IA
officers/BODs and
members.
General Assembly
(yearly/every two years)
Frequency of meeting of
NIS-IA
officers/BODs and
members.
General Assembly (as
needed)
Frequency of meeting of
NIS-IA
officers/BODs and
members.
General Assembly
(have not yet conducted)
Diversion 28
18
5
3
19
3
2
14
10
2
Pump 14
12
1
13
8
6
Reservoir 22
14
1
2
15
2
8
7
1
Total 64
44
6
6
47
3
4
30
23
2
1
Sources: NIS KII

152
Table 25.18. Manner of choosing and term of office and forms of compensation of NIS-IA officers/BOD
by "Technology"
Technol
ogy
No. of IA
sample
Manner of
choosing
and term of office of
NIS-IA
officers/BOD - election
by general
assembly
Manner of
choosing
and term of office of
NIS-IA
officers/BOD - voted
by BOD
Manner of
choosing
and term of office of
NIS-IA
officers/BOD - 1-2
years
Manner of
choosing
and term of office of
NIS-IA
officers/BOD - 3-4
years
Forms of
compensati
on of NIS-IA (15-30%
of
collection, if 70-90%
collection)
Forms of
compensati
on of NIS-IA (BOD
with
honorarium P1,000-
P2,000)
Forms of
compensatio
n of NIS-IA (P100-
200/mgt/acti
vity)
Forms of
compensati
on of NIS-IA
(P5000/seas
on)
Forms of
compensati
on of NIS-IA (P200-
800/month)
Forms of
compensati
on of NIS-IA (Other
incentives -
snacks, P500/group
discounts)
Forms of
compensati
on of NIS-IA (none)
Diversion 28
26
19
7
2
1
19
Pump 14
12
2
7
7
3
2
1
1
7 Reservoi
r 22
16
1
15
1
2
2
5
2
6
Total 64
54
3
41
15
3
4
4
1
5
4
32

153
Table 25.19. Respondents' rating on NIA's support to NIS IAs and modifications by NIS IAs to IS by "Technology"
Technology No. of IA sample Respondents'
average rating on NIA's support to
NIS-IAs. (Technical
- 0-4, 4 excellent)
Respondents'
average rating on NIA's support to
NIS-IAs.
(Financial - 0-4, 4 excellent)
Respondents'
average rating on NIA's support to
NIS-IAs.
(Institutional - 0-4, 4 excellent)
Modifications
by NIS IAs to IS. Structure
non-operational
(No)
Modifications
by NIS IAs to IS. Structure
non-
operational (Yes)
Modifications
by NIS IAs to IS. Structure
non-
operational (No Answer)
Modifications
by NIS IAs to IS. Undertook
rehabilitation
(No)
Modifications
by NIS IAs to IS. Undertook
rehabilitation
(Yes)
Modifications
by NIS IAs to IS. Undertook
rehabilitation
(No Answer)
Diversion 28 3 4 3
10
4
14
11
1
16
Pump 14 4 3 4
6
3
5
6
3
5
Reservoir 22 4 4 4
11
3
8
9
5
8
Total 64 4 4 4
27
10
27
26
9
29
Sources: NIS KII
Table 25.19. Respondents' rating on NIA's support to NIS IAs and modifications by NIS IAs to IS by "Technology"
Technology Modifications by
NIS IAs to IS.
Other
Modifications
(Canal Lining)
Modifications by
NIS IAs to IS.
Other Modifications
(Drainage Rehab)
Modifications by
NIS IAs to IS.
Other
Modifications
(Canal
Desiltation/rehab)
Modifications
by NIS IAs to
IS. Other
Modifications
(Others)
Diversion 2
6
Pump 2 2
1
Reservoir 11 3
5
Total 13 2 5
12
Sources: NIS KII

154
By Location
Following earlier studies (Cablayan, Inocencio, et al 2014), location of the IAs relative to the main
canals of the NIS (upstream, mid-stream, downstream) is a key factor influencing performance.
Tables 26.1 to 26.19 show the IAs profiles by location.
Downstream IAs in the sample are characterized by high count of siltation and/or solid waste
problems, water supply shortages, flooding in the wet season, damaged FMRs, financially weak
IAs, and low ratings of water delivery service (i.e. in terms of adequacy and timeliness). In
addition, other problems include institutional, crop production and irrigation canal problems. On
the positive side, downstream IAs have no issues with their irrigation headwork and control
structures.
Midstream IAs are almost the opposite of the downstream IAs. They have the least solid
waste/siltation problems, no flooding problems,, low count of damaged FMRs, main canal, and
lateral canal problems. Despite lacking machineries and equipment, they face the least problems
brought by the deficiency. However, midstream IAs showed the most irrigation control structure
problems, least number of facilities/infrastructure, and the most institutional problems.
Prominent attributes of upstream IA group are low incidence of water supply shortage and solid
waste/siltation problems and a high percentage of financially strong IAs. This group also
experienced the following problems, in order of decreasing severity: , irrigation structure problems
(e.g, irrigation canal), institutional problems, cropping problems due to calamities/ pest infestation,
and inadequate machineries and equipment.

155
Table 26.1. NIS IA Profile, Cropping Information and Financial Aspects by "Location"
Location No. of IA sample Ave. of No. of
Members
Ave. of No. of
Farmers-
Landowner-
operator (%)
Ave. of No. of
Farmers-Tenant
(%)
Ave. of No. of
Farmers-Lessees
(%)
Does IA have
water permit?
(answer: no)
Does IA have
water permit?
(answer: yes)
Does IA have
water permit? (no
answer)
No. of Crops
Irrigated: rice only
No of Crops
Irrigated: rice and
other crops
No. of IAs paying
ISF/DCC/amortization
Downstream 21 162 59 44 15 8 7 5 16 5 15
Midstream 21 207 52 48 20 11 5 4 16 4 13
Upstream 20 184 66 47 16 10 2 7 12 7 6
Unclassified/Insufficient Data 2 279 94 12 1 1
Average for All Sample/Total 64 187 60 45 17 29 15 17 44 16 34
Sources: NIS KII
Table 26.2. Problems/concerns of NIS IAs by "Location"
Location No. of IA sample No. of IAs with
inadequate water
supply in dry
season
No. of IAs with
flooding
problem during
wet season
No. of IAs with
Irrigation
Headwork
Problems
(damaged,
deteriorated,
lacking)
No. of IAs with
Irrigation Main
Canal Problems
(damaged,
deteriorated,
unlined)
No. of IAs with
Irrigation Lateral
Canal Problems
(damaged,
deteriorated,
unlined)
No. of IAs with
Irrigation Control
Structure
Problems
(damaged,
deteriorated,
lacking, unlined)
No. of IAs with
Siltation, Solid
Waste, Informal
Settlers & Water
Quality Problems
No. of IAs with
problems due to
lack of facilities,
infrastructure
(FMRs), canal
extensions,
drainage, storage,
pipelines, STWs,
solar drier & etc.
No. of IAs with
problems due to
damaged/lack of
Machineries &
Equipment (ex.
Backhoes, pumps,
pipes & etc.)
No. of IAs with
institutional/management
problems
Downstream 21 7 2 2 5 9 4 8 6 6 10
Midstream 21 8 4 2 8 6 5 7 3 11
Upstream 20 7 1 6 6 10 5 4 6 7 8
Unclassified/Insufficient Data 2
Total 64 22 3 12 13 27 15 17 19 16 29
Sources: NIS KII
Note: Institutional/Management Problems - Water Stealing, lack of discipline, water scheduling problems, illegal turnouts, animals like carabao's allowed in canal, attendance during maintenance work, conflict among members, rules not followed, safety problems
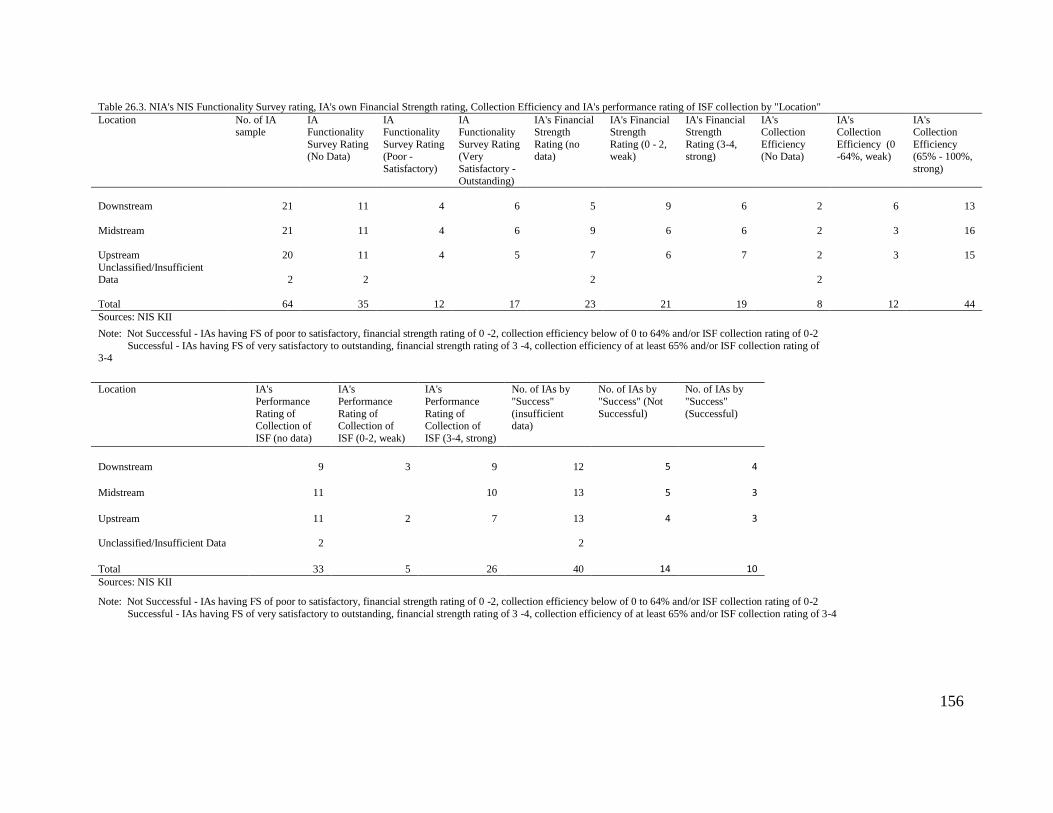
156
Table 26.3. NIA's NIS Functionality Survey rating, IA's own Financial Strength rating, Collection Efficiency and IA's performance rating of ISF collection by "Location"
Location No. of IA sample
IA Functionality
Survey Rating (No Data)
IA Functionality
Survey Rating (Poor -
Satisfactory)
IA Functionality
Survey Rating (Very
Satisfactory -
Outstanding)
IA's Financial Strength
Rating (no data)
IA's Financial Strength
Rating (0 - 2, weak)
IA's Financial Strength
Rating (3-4, strong)
IA's Collection
Efficiency (No Data)
IA's Collection
Efficiency (0 -64%, weak)
IA's Collection
Efficiency (65% - 100%,
strong)
Downstream 21
11
4
6
5
9
6
2
6
13
Midstream 21
11
4
6
9
6
6
2
3
16
Upstream 20
11
4
5
7
6
7
2
3
15
Unclassified/Insufficient Data 2
2
2
2
Total 64
35
12
17
23
21
19
8
12
44
Sources: NIS KII
Note: Not Successful - IAs having FS of poor to satisfactory, financial strength rating of 0 -2, collection efficiency below of 0 to 64% and/or ISF collection rating of 0-2
Successful - IAs having FS of very satisfactory to outstanding, financial strength rating of 3 -4, collection efficiency of at least 65% and/or ISF collection rating of 3-4
Location IA's
Performance
Rating of Collection of
ISF (no data)
IA's
Performance
Rating of Collection of
ISF (0-2, weak)
IA's
Performance
Rating of Collection of
ISF (3-4, strong)
No. of IAs by
"Success"
(insufficient data)
No. of IAs by
"Success" (Not
Successful)
No. of IAs by
"Success"
(Successful)
Downstream
9 3 9 12
5
4
Midstream
11 10 13
5
3
Upstream
11 2 7 13
4
3
Unclassified/Insufficient Data
2 2
Total
33 5 26 40
14
10
Sources: NIS KII
Note: Not Successful - IAs having FS of poor to satisfactory, financial strength rating of 0 -2, collection efficiency below of 0 to 64% and/or ISF collection rating of 0-2
Successful - IAs having FS of very satisfactory to outstanding, financial strength rating of 3 -4, collection efficiency of at least 65% and/or ISF collection rating of 3-4

157
Table 26.4. NIS IA's Performance Ratings of their water distribution
and delivery service by "Location" Location No. of IA
sample
Flexibilit
y Index -
no answer
Flexibilit
y Index
Rating - (0-2, not
flexible)
Flexibilit
y Index
Rating - (3-4,
flexible)
Reliabilit
y Index
Rating - no
answer
Reliabilit
y Index
Rating - (0-2, not
reliable)
Reliabilit
y Index
Rating - (3-4,
reliable)
Equitabili
ty Index
Rating - no
answer
Equitabili
ty Index
Rating - (0-2, not
equitable
)
Equitabili
ty Index
Rating - (3-4,
equitable
)
Adequac
y of
Service Delivery
Rating -
no data
Adequac
y of
Service Delivery
Rating -
(0-2, inadequat
e service)
Adequac
y of
Service Delivery
Rating -
(3-4, adequate
service)
Downstream 21
7
5
9
7
6
8
8
5
8
6
8
7
Midstream 21
5
2
13
4
2
15
5
1
15
3
7
11
Upstream 20
4
5
11
4
2
14
6
1
13
5
4
11 Unclassified/Insu
fficient Data 2
2
2
1
1
2
Total 64
16
12
35
15
10
39
20
7
37
16
19
29 Sources: NIS KII
Table 26.5. NIS IA's rating of their ability to seek outside help by "Location"
Location No. of IA sample Ave. Rating for
ability of NIS IAs to seek outside
help (0-4, 4 most influential)
Rating for ability
of NIS IAs to seek outside help
(0)
Rating for ability
of NIS IAs to seek outside help
(1)
Rating for ability
of NIS IAs to seek outside help
(2)
Rating for ability
of NIS IAs to seek outside help
(3)
Rating for ability
of NIS IAs to seek outside help
(4)
Rating for ability
of NIS IAs to seek outside help
(No answer)
Downstream 21 2 2 3 4 2 10
Midstream 21 3 1 4 6 3 7
Upstream 20 2 2 1 3 3 1 10
Unclassified/Insufficient Data 2 2
Average for All Sample/Total 64 2 4 2 10 13 6 29
Sources: NIS KII

158

159
Table 26.6. Assistance received by NIS IAs from Various Sources by
"Location"
Location No. of
IA
sample
Assistance
received by
NIS IAs from
Various
sources. BSWM -
Free Soil
analysis
Assistance
received by
NIS IAs from Various
sources. LGU
- Farm inputs/seed
subsidy
Assistance
received by
NIS IAs from Various
sources. LGU -
Repair farm to market roads
Assistance
received by
NIS IAs from
Various
sources. LGU -
financial/liv
elihood
Assistance
received by
NIS IAs from Various
sources.
LGU - technical
support
Assistance
received
by NIS IAs from
Various
sources. LGU -
equipment
/thresher/fuel
Assistance
received by
NIS IAs from
Various
sources. Others -
flatbed
dryer/solar dryer
Assistance
received
by NIS IAs from
Various
sources. Others -
pump/thre
sher / fuel
Assistance
received by
NIS IAs from
Various
sources. Others -
Seed
subsidy/analysis
Assistance
received by
NIS IAs from Various
sources.
Others - soil sampling/trai
ning
Downstream 21
3
2
1
2
1
2
Midstream 21
5
2
3
1
2
2
8
1
Upstream 20
2
2
1
1
4
5
1 Unclassified/Insufficient
Data 2
Total 64
10
4
2
4
1
3
4
6
15
2
Sources: NIS KII
Table 26.7. Cropping problems of NIS IAs by
"Location"
Location No. of
IA
sample
Cropping
problems of
NIS IAs. Garbage in
the canals
Cropping
problems of
NIS IAs. Lack of water
supply
Cropping
problems of
NIS IAs. Water delivery
schedule
Cropping
problems of
NIS IAs. Low
yield/calamit
ies
Cropping
problems of
NIS IAs. High
production
cost/low buying price
Cropping
problems
of NIS IAs.
FMR/high
harvest loss
Cropping
problems of
NIS IAs. Others -
informal
settlers, govt.
Support
Downstream 21
1
1
10
4
1
Midstream 21
2
2
10
3
1
Upstream 20
1
1
7
2
Unclassified/Insufficient Data 2
Total 64
1
4
3
27
9
1
1
Sources: NIS KII

160
Table 26.8. Problems encountered by NIS IAs by "Location"
Location No. of IA sample
Problems encountered
by NIS-IAs.
Unlined canals and
turnout
Problems encountered
by NIS-IAs.
Poor structure design
Problems encountered
by NIS-IAs.
Damaged irrigation
structure
Problems encountered
by NIS-IAs.
Lack of water supply
Problems encountered
by NIS-IAs.
Solid waste in canals/siltation
Problems encountered
by NIS-IAs.
Some members
don't follow
the schedule
Problems encountered
by NIS-IAs.
Illegal turnouts
Problems encountered
by NIS-IAs.
Damaged farm to
market road
Problems encountered
by NIS-
IAs. Others
Downstream 21
1
2
6
8
7
4
6
6
Midstream 21
2
1
6
3
4
1
2
4
Upstream 20
4
2
5
4
4
1
3
3 Unclassified/Insufficient
Data 2
Total 64
7
5
11
18
14
8
2
11
13
Sources: NIS KII
Note: Others - extension of water sched.; lack of equipment; lack of irrigation facilities; monitoring of water delivery & maintenance of laterals with certain stretch; none; improve the irrigation
facilities; irrigation structure not yet finished; lack of discipline; not following cropping calendar; political intervention; slow action of NIS; ISF very high; lack of water pump
Table 26.9. Average Performance Rating of various functions of NIS IAs by "Location"
Location No. of IA
sample
Performance
Rating of NIS IAs (0-4, 4
excellent).
Water distribution
Performance
Rating of NIS IAs (0-4, 4
excellent).
Maintenance of canals
Performance
Rating of NIS IAs (0-4, 4
excellent).
Maintenance of control
structures
Performance
Rating of NIS IAs (0-4, 4
excellent).
Construction of facilities
Performance
Rating of NIS IAs (0-4, 4
excellent).
Collection of ISF
Performance
Rating of NIS IAs (0-4, 4
excellent).
Collection of other fees
Performance
Rating of NIS IAs (0-4, 4
excellent).
Technical Advice to
farmers
Performance
Rating of NIS IAs.
Overall
rating
Downstream 21
3
3
3
3
3
4
4
2
Midstream 21
4
4
3
3
3
3
3
2
Upstream 20
4
3
3
2
3
3
3
2
Unclassified/Insufficient Data 2
-
Average for All
Sample/Total 64
3
3
3
2
3
3
3
2
Sources: NIS KII

161

162
Table 26.10. NIS IA's Collection Rate by "Location"
Location No. of IA
sample
Ave. of
Collection Rate (%) of
NIS IAs
Collection
Rate (%) of NIS IAs. 30
and below
Collection
Rate (%) of NIS IAs. 31
- 60
Collection
Rate (%) of NIS IAs. 61
- 90
Collection
Rate (%) of NIS IAs. 91
and above
Collection
Rate (%) of NIS IAs. No
answer
Rating on
NIS IAs' ability to
resolve
conflict (0-4, 4
effective). 2
Rating on
NIS IAs' ability to
resolve
conflict (0-4, 4
effective). 3
Rating on
NIS IAs' ability to
resolve
conflict (0-4, 4
effective). 4
Rating on
NIS IAs' ability to
resolve
conflict (0-4, 4
effective).
No Answer
Downstream 21
71
1
4
9
2
5
1
2
10
8
Midstream 21
80
2
11
5
3
1
5
7
8
Upstream 20
78
2
12
3
3
1
2
10
7
Unclassified/Insufficient Data 2
2
2
Average for All
Sample/Total 64
77
1
8
32
10
13
3
9
27
25
Sources: NIS KII
Table 26.11. NIS IA's Rating on Water Delivery Service and Water Distribution Policy by "Location"
Location No. of IA
sample
Rating of
NIS IAs'
water
delivery
service (0-4,
4 highest). 0
Rating of
NIS IAs'
water
delivery
service (0-4,
4 highest). 1
Rating of
NIS IAs'
water
delivery
service (0-4,
4 highest). 2
Rating of
NIS IAs'
water
delivery
service (0-4,
4 highest). 3
Rating of
NIS IAs'
water
delivery
service (0-4,
4 highest). 4
Rating of
NIS IAs'
policy on
water
distribution
scheme (0-4, 4
highest). 0
Rating
of NIS
IAs'
policy
on water
distribution
scheme (0-4, 4
highest).
1
Rating of
NIS IAs'
policy on
water
distribution
scheme (0-4, 4
highest). 2
Rating of
NIS IAs'
policy on
water
distribution
scheme (0-4, 4
highest). 3
Rating of
NIS IAs'
policy on
water
distribution
scheme (0-4, 4
highest). 4
Downstream 21
1
1
5
2
5
1
2
11
Midstream 21
2
2
4
7
5
9
Upstream 20
3
2
9
3
8
Unclassified/Insufficient Data 2
Total 64
1
3
10
8
21
1
2
8
28
Sources: NIS KII

163
Table 26.12. Mode of irrigation scheduling and rating for effectiveness of accountability provision among NIS IAs by "Location"
Location No.
of IA
sample
Mode of
irrigation
scheduling by NIS
IAs.
Downstream-
upstream
Mode of
irrigation
scheduling by NIS
IAs.
Upstream-downstrea
m
Mode of
irrigation
scheduling by
NIS IAs.
By groups
by
hour/day on
rotation/
depends on IA
Mode of
irrigation
scheduling by
NIS IAs.
No answer
Rating for
effectivenes
s of accountabili
ty provision
among NIS IAs (0-4, 4
most
effective).
Rating for
effectivenes
s of accountabili
ty provision
among NIS IAs (0-4, 4
most
effective). 0
Rating for
effectivenes
s of accountabili
ty provision
among NIS IAs (0-4, 4
most
effective). 1
Rating for
effectivenes
s of accountabili
ty provision
among NIS IAs (0-4, 4
most
effective). 2
Rating for
effectivenes
s of accountabili
ty provision
among NIS IAs (0-4, 4
most
effective). 3
Rating for
effectivenes
s of accountabili
ty provision
among NIS IAs (0-4, 4
most
effective). 4
Rating for
effectiveness of
accountability provision among
NIS IAs (0-4, 4
most effective). No Answer
Downstream 21
4
9
3
5
3
1
1
6
5 8
Midstream 21
3
10
8
3
1
1
5
6 8
Upstream 20
3
11
6
4
5
5 10
Unclassified/Insuffic
ient Data 2
2 2
Total 64
10
30
3
21
3
1
1
2
16
16 28
Sources: NIS KII
Table 26.13. Provisions in NIS IA policies holding IA officers/BOD accountable by "Location"
Location No. of IA sample
Provisions in NIS IA policies
holding water
users accountable. No
Provisions in NIS IA
policies
holding water users
accountable.
Yes
Provisions in NIS IA policies
holding water
users accountable. No
Answer
Provisions in NIS IA
policies
holding water users
accountable.
No Comment
Provisions in NIS IA policies
holding IA
officers/BOD accountable.
No
Provisions in NIS IA policies
holding IA
officers/BOD accountable. Yes
Provisions in NIS IA policies
holding IA
officers/BOD accountable. No
Answer
Downstream 21 3
10 7
1
2 11 8
Midstream 21 4
13 4
7 7 7
Upstream 20 2
10 7
1
2 7 11
Unclassified/Insufficient Data 2 2 2
Total 64 9
33 20
2
11 25 28
Sources: NIS KII

164
Table 26.14. Policies which are not adequately implemented by NIS IAs by
"Location"
Location No. of IA
sample
Policies
which are not adequately
implemented
by NIS IAs. Payment of
ISF/IA dues
Policies
which are not adequately
implemented
by NIS IAs. Water
delivery
schedules
Policies which are not
adequately implemented by NIS IAs. Penalty clauses
Policies
which are not adequately
implemented
by NIS IAs. Others
Policies
which are not adequately
implemented
by NIS IAs. No Answer
Policies which are not
adequately implemented by NIS
IAs. None
Policies
which are not adequately
implemented
by NIS IAs. Not
Applicable
Downstream 21
1
3 3
2
2 4
7
Midstream 21
1
5 3
3
4 3
5
Upstream 20
2 3
2
7 4
3
Unclassified/Insufficient
Data 2
1
1
Total 64
2
10 9
7
13 12
16
Sources: NIS KII
Note: Others - wearing of uniform, securing for personal needs, irrigation procedure, improper behavior, restriction of garbage/illegal settlers, destruction of turnouts.
Table 26.15. Trainings attended by NIS IAs by "Location"
Location No. of IA
sample
Trainings
attended by NIS IAs.
Basic
Leadership Devt. Course
Trainings
attended by NIS IAs.
Financial
Management
Trainings attended by NIS
IAs. Org. Management/Capability/Policy
Trainings
attended by NIS IAs.
Values
formation
Trainings
attended by NIS IAs.
System/water
management
Trainings attended by
NIS IAs. Cropping/AWD/quality
control/fertilizer
Downstream 21
6
6 5
3
7 6
Midstream 21
4
4 2
1
4 8
Upstream 20
5
9 2
2
8 6
No data 2
Total 64
15
19 9
6
19 20 Sources: NIS KII

165
Table 26.16. Average participation to NIS-IA meetings of IA officers and BODs by "Location"
Location No. of
IA sample
Participation
to NIS-IA meetings -
IA officers
(50 and below)
Participat
ion to NIS-IA
meetings
- IA officers
(51 - 80)
Participation
to NIS-IA meetings -
IA officers
(more than 80)
Participation to
NIS-IA meetings - BODs (50 and
below)
Participation
to NIS-IA meetings -
BODs (51 -
80)
Participatio
n to NIS-IA meetings -
BODs
(more than 80)
Participation
to NIS-IA meetings -
General
assembly (50 and below)
Participation to
NIS-IA meetings -
General
assembly (51 - 80)
Participation to NIS-IA
meetings - General assembly (more than 80)
Downstream 21
2
4
7
2
11
3 7 4
Midstream 21
5
13 3
3
11
4 5 4
Upstream 20
2
10
2
10
3 7 2
Unclassified/Insufficient Data 2
Total 64
2
11
30 3
7
32
10 19 10
Sources: NIS KII
Table 26.17. Frequency of meeting of NIS-IA officers/BODs and members by
"Location"
Location No. of IA sample
Frequency of meeting
of NIS-IA
officers/BO
Ds and
members.
IA officers (once-thrice
a month)
Frequency of meeting
of NIS-IA
officers/BO
Ds and
members.
IA officers (once to 6
times per
cropping)
Frequency of meeting
of NIS-IA
officers/BO
Ds and
members.
IA officers (as needed)
Frequency of meeting
of NIS-IA
officers/BO
Ds and
members.
BODs (1-2 times per
month)
Frequency of meeting
of NIS-IA
officers/BO
Ds and
members.
BODs (once a year-every
cropping)
Frequency of meeting
of NIS-IA
officers/BO
Ds and
members.
BODs (as needed)
Frequency of meeting
of NIS-IA
officers/BO
Ds and
members.
General Assembly
(monthly-
twice a year)
Frequency of meeting
of NIS-IA
officers/BO
Ds and
members.
General Assembly
(yearly/ever
y two years)
Frequency of meeting
of NIS-IA
officers/BO
Ds and
members.
General Assembly
(as needed)
Frequency of meeting
of NIS-IA
officers/BO
Ds and
members.
General Assembly
(have not
yet conducted)
Downstream 21
14
2
2
16
2
12
7
Midstream 21
14
3
2
16
1
2
8
8
2
Upstream 20
16
1
2
15
2
10
8
1
Unclassified/Insufficie
nt Data 2
Total 64
44
6
6
47
3
4
30
23
2
1
Sources: NIS KII

166
Table 26.18. Manner of choosing and term of office and forms of compensation of NIS-IA
officers/BOD by "Location"
Location No. of IA
sample
Manner of
choosing
and term of office of
NIS-IA
officers/BOD -
election by
general assembly
Manner of
choosing
and term of office of
NIS-IA
officers/BOD -
voted by
BOD
Manner of
choosing
and term of office of
NIS-IA
officers/BOD - 1-2
years
Manner of
choosing
and term of office of
NIS-IA
officers/BOD - 3-4
years
Forms of
compensati
on of NIS-IA (15-
30% of
collection, if 70-90%
collection)
Forms of
compensati
on of NIS-IA (BOD
with
honorarium P1,000-
P2,000)
Forms of
compensati
on of NIS-IA (P100-
200/mgt/act
ivity)
Forms of
compensati
on of NIS-IA
(P5000/sea
son)
Forms of
compensati
on of NIS-IA (P200-
800/month
)
Forms of
compensati
on of NIS-IA (Other
incentives
- snacks, P500/grou
p
discounts)
Forms of
compensati
on of NIS-IA (none)
Downstream 21
18
2
13
7
1
1
2
2
1
12
Midstream 21
18
14
3
1
2
1
1
10
Upstream 20
18
1
14
5
2
2
1
2
2
10 Unclassified/Insuffic
ient Data 2
Total 64
54
3
41
15
3
4
4
1
5
4
32
Sources: NIS KII

167
Table 26.19. Respondents' rating on NIA's support to NIS IAs and modifications by NIS IAs to IS by "Location"
Location No. of IA sample
Respondents' average rating
on NIA's support to NIS-
IAs. (Technical
- 0-4, 4 excellent)
Respondents' average rating
on NIA's support to NIS-
IAs. (Financial -
0-4, 4 excellent)
Respondents' average rating
on NIA's support to NIS-
IAs.
(Institutional - 0-4, 4 excellent)
Modifications by NIS IAs to
IS. Structure non-operational
(No)
Modifications by NIS IAs to
IS. Structure non-operational
(Yes)
Modifications by NIS IAs to
IS. Structure non-operational
(No Answer)
Modifications by NIS IAs to
IS. Undertook rehabilitation
(No)
Modifications by NIS IAs to
IS. Undertook rehabilitation
(Yes)
Downstream 21 4 3 4 9 6 6 8 5
Midstream 21 4 3 4 10 2 9 11 1
Upstream 20 4 4 4 8 2 10 7 3
Unclassified/Insufficient Data 2 4 4 2
Total 64 4 4 4 27 10 27 26 9
Sources: NIS KII
Location Modifications
by NIS IAs to
IS. Undertook
rehabilitation (No Answer)
Modifications by NIS IAs to
IS. Other
Modifications (Canal Lining)
Modifications by NIS IAs to
IS. Other
Modifications (Drainage
Rehab)
Modifications by NIS IAs to IS.
Other
Modifications (Canal
Desiltation/rehab)
Modifications by NIS IAs to IS.
Other
Modifications (Others)
Downstream 8 5 2 2 6
Midstream
9 3 2 5
Upstream
10 5 1 1
Unclassified/Insufficient Data 2
Total
29 13 2 5 12
Sources: NIS KII

168
By Vintage
Tables 27.1 to 27.19 report the profile of the sample NIS according to vintage covering the pre-
NIA and post NIA eras.
IAs with systems built before establishment of NIA generally have few irrigation structure
problems, sufficient machineries and equipment, and adequate water supply. However, they lack
facilities, lateral canal problems, and have the lowest ratings in NIA’s functionality surveys,
indicating poor management performance.
IAs constructed between 1965 and 1980 predominantly have irrigation headwork and control
structure condition problems, problems brought about by lack of machineries and equipment,
financially weak IAs, lack of water supply, damaged FMRs, cropping problems due to calamities/
pests. On the other hand, they have the least occurrence of institutional problems and siltation/solid
waste problems.
Generally, IA systems built from 1981 to 2013 are financially strong, successful, experience the
least flooding, have adequate water supply, and have FMRs in good condition. However, they also
exhibit the most and lateral canal problems, siltation problems, and institutional problems.

169
Table 27.1. NIS IA Profile, Cropping Information and Financial Aspects by "Vintage"
Vintage No. of
IA
sample
Ave. of
No. of
Members
Ave. of
No. of
Farmers-Landowner
-operator
(%)
Ave. of No. of
Farmers-
Tenant (%)
Ave. of
No. of
Farmers-Lessees
(%)
Does IA
have water
permit? (answer:
no)
Does IA
have water
permit? (answer:
yes)
Does IA
have water
permit? (no answer)
No. of Crops
Irrigated: rice
only
No of Crops
Irrigated:
rice and other crops
No. of IAs paying
ISF/DCC/amortization
1965-1980 9
160
55
41
15
3
2
4
2
7 3
1981-2013 35
211
59
37
18
18
10
5
26
9 23
Before NIA 20
151
63
70
10
8
3
8
16 8
Average for All
Sample/Total 64
187
60
45
17
29
15
17
44
16 34
Sources: NIS KII
Table 27.2. Problems/concerns of NIS IAs by "Vintage"
Vintage No. of IA
sampl
e
No. of IAs with
inadequat
e water supply in
dry
season
No. of IAs with
flooding
problem during wet
season
No. of IAs with
Irrigation
Headwork Problems
(damaged,
deteriorated, lacking)
No. of IAs with
Irrigation
Main Canal
Problems
(damaged, deteriorate
d, unlined)
No. of IAs with
Irrigation
Lateral Canal
Problems
(damaged, deteriorated
, unlined)
No. of IAs with
Irrigation
Control Structure
Problems
(damaged, deteriorate
d, lacking,
unlined)
No. of IAs with
Siltation,
Solid Waste,
Informal
Settlers & Water
Quality
Problems
No. of IAs with
problems due
to lack of facilities,
infrastructure
(FMRs), canal
extensions,
drainage, storage,
pipelines, STWs, solar
drier & etc.
No. of IAs with
problems
due to damaged/lac
k of
Machineries &
Equipment
(ex. Backhoes,
pumps, pipes & etc.)
No. of IAs with institutional/managem
ent problems
1965-1980 9
5
1
5
2
4
5
2
4
5 2
1981-2013 35
12
1
6
9
18
9
12
6
8 18
Before NIA 20
5
1
1
2
5
1
3
9
3 9
Total 64
22
3
12
13
27
15
17
19
16 29
Sources: NIS KII
Note: Institutional/Management Problems - Water Stealing, lack of discipline, water scheduling problems, illegal turnouts, animals like carabao's allowed in canal, attendance during maintenance work,
conflict among members, rules not followed, safety problems

170
Table 27.3. NIA's NIS Functionality Survey rating, IA's own Financial Strength rating, Collection Efficiency and IA's performance rating of ISF collection by "Vintage"
Vintage No. of IA
sample
IA Functionality
Survey Rating
(No Data)
IA Functionality
Survey Rating
(Poor - Satisfactory)
IA Functionality
Survey Rating
(Very Satisfactory -
Outstanding)
IA's Financial
Strength Rating
(no data)
IA's Financial
Strength Rating
(0 - 2, weak)
IA's Financial
Strength Rating
(3-4, strong)
IA's Collection
Efficiency (No
Data)
IA's
Collection
Efficiency (0 -64%, weak)
IA's
Collection
Efficiency (65% - 100%,
strong)
1965-
1980 9 6 3 3 4 1
2
7
1981-2013 35 17 7 11 10 11 14 3
6
26
Before
NIA 20 12 5 3 10 6 4 5
4
11
Total 64 35 12 17 23 21 19 8
12
44
Sources: NIS KII Note: Not Successful - IAs having FS of poor to satisfactory, financial strength rating of 0 -2, collection efficiency below of 0 to 64% and/or ISF collection rating of 0-2
Successful - IAs having FS of very satisfactory to outstanding, financial strength rating of 3 -4, collection efficiency of at least 65% and/or ISF collection rating of 3-
4
Vintage IA's Performance
Rating of
Collection of ISF
(no data)
IA's Performance Rating of
Collection of ISF
(0-2, weak)
IA's Performance Rating of
Collection of ISF
(3-4, strong)
No. of IAs by "Success"
(insufficient data)
No. of IAs by "Success" (Not
Successful)
No. of IAs by "Success"
(Successful)
1965-1980 6 1 2 8 1
1981-2013 15 2 18 19 7 9 Before
NIA 12 2 6 13 6 1
Total 33 5 26 40 14 10
Sources: NIS KII
Note: Not Successful - IAs having FS of poor to satisfactory, financial strength rating of 0 -2, collection efficiency below of 0 to 64% and/or ISF collection rating of 0-2
Successful - IAs having FS of very satisfactory to outstanding, financial strength rating of 3 -4, collection efficiency of at least 65% and/or ISF collection rating of 3-4

171
Table 27.4. NIS IA's Performance Ratings of their water distribution and delivery service by "Vintage"
Vintag
e
No. of IA
sample
Flexibility
Index - no answer
Flexibility
Index Rating -
(0-2, not
flexible)
Flexibility
Index Rating -
(3-4,
flexible)
Reliability
Index Rating -
no answer
Reliability
Index Rating -
(0-2, not
reliable)
Reliability
Index Rating -
(3-4,
reliable)
Equitabilit
y Index Rating -
no answer
Equitabilit
y Index Rating -
(0-2, not
equitable)
Equitabilit
y Index Rating -
(3-4,
equitable)
Adequacy
of Service Delivery
Rating -
no data
Adequacy
of Service Delivery
Rating -
(0-2, inadequat
e service)
Adequacy
of Service Delivery
Rating -
(3-4, adequate
service)
1965-1980 9
2
3
4
2
2
5
4
1
4
3
4
2
1981-
2013 35
8
4
23
7
6
22
9
5
21
4
12
19
Before
NIA 20
6
5
8
6
2
12
7
1
12
9
3
8
Total 64
16
12
35
15
10
39
20
7
37
16
19
29
Sources: NIS KII
Table 27.5. NIS IA's rating of their ability to seek outside help by "Vintage"
Vintage No. of IA
sample
Ave. Rating for
ability of NIS IAs
to seek outside
help (0-4, 4 most
influential)
Rating for ability
of NIS IAs to
seek outside help
(0)
Rating for ability
of NIS IAs to
seek outside help
(1)
Rating for ability of
NIS IAs to seek
outside help (2)
Rating for
ability of
NIS IAs to
seek
outside
help (3)
Rating for
ability of
NIS IAs to
seek outside
help (4)
Rating for
ability of
NIS IAs to
seek outside
help (No
answer)
1965-1980 9 4
1
1
7
1981-2013 35 2 3 1 7
10
4
10
Before NIA 20 2 1 1 3
2
1
12
Average for All Sample/Total 64 2 4 2 10
13
6
29
Sources: NIS KII

172
Table 27.6. Assistance received by NIS IAs from Various Sources by "Vintage"
Vintage No. of IA sample
Assistance received by
NIS IAs from
Various sources.
BSWM - Free
Soil analysis
Assistance received by
NIS IAs from
Various sources. LGU -
Farm
inputs/seed subsidy
Assistance received by
NIS IAs from
Various sources. LGU -
Repair farm to
market roads
Assistance received by NIS
IAs from Various
sources. LGU - financial/liveliho
od
Assistance
received
by NIS IAs from
Various
sources. LGU -
technical
support
Assistance received
by NIS
IAs from Various
sources.
LGU - equipment
/thresher/f
uel
Assistance received
by NIS
IAs from Various
sources.
Others - flatbed
dryer/solar
dryer
Assistance received by
NIS IAs
from Various
sources.
Others - pump/thres
her / fuel
Assistance
received
by NIS IAs from
Various
sources. Others -
Seed
subsidy/analysis
Assistance received by
NIS IAs
from Various sources.
Others - soil
sampling/training
1965-1980 9
1
1
1
1
1981-2013 35
9
2
1 4
1
1
4
4
10
2
Before NIA 20
2
2
1
4
Total 64
10
4
2 4
1
3
4
6
15
2
Sources: NIS KII
Table 27.7. Cropping problems of NIS IAs by "Vintage"
Vintage No. of IA
sample
Cropping
problems of
NIS IAs. Garbage in the
canals
Cropping
problems of
NIS IAs. Lack of water supply
Cropping
problems of
NIS IAs. Water delivery
schedule
Cropping
problems of NIS
IAs. Low yield/calamities
Cropping
problems
of NIS IAs.
High
production
cost/low buying
price
Cropping
problems
of NIS IAs.
FMR/high
harvest loss
Cropping
problems
of NIS IAs.
Others -
informal settlers,
govt. Support
1965-1980 9
1 5
1981-2013 35
1
2
2 18
6
1
Before NIA 20
1
1 4
3
1
Total 64
1
4
3 27
9
1
1
Sources: NIS KII

173
Table 27.8. Problems encountered by NIS IAs by "Vintage"
Vintage No. of IA
sample
Problems
encountered by NIS-IAs.
Unlined canals
and turnout
Problems
encountered by NIS-IAs.
Poor structure
design
Problems
encountered by NIS-IAs.
Damaged
irrigation structure
Problems
encountered by NIS-IAs.
Lack of water
supply
Problems
encountered by NIS-IAs.
Solid waste
in canals/siltati
on
Problems
encountered by NIS-
IAs. Some
members don't
follow the
schedule
Problems
encountered by NIS-
IAs.
Illegal turnouts
Problems encountered
by NIS-IAs. Damaged farm to
market road
Problems
encountered by NIS-IAs.
Others
1965-1980 9
2
1
2
4
1 4
1
1981-2013 35
3
4
7
11
10
6
2 3
8
Before NIA 20
2
2
3
3
2 4
4
Total 64
7
5
11
18
14
8
2 11
13
Sources: NIS KII
Note: Others - extension of water sched.; lack of equipment; lack of irrigation facilities; monitoring of water delivery & maintenance of laterals with certain stretch; none; improve the
irrigation facilities; irrigation structure not yet finished; lack of discipline; not following cropping calendar; political intervention; slow action of NIS; ISF very high; lack of water
pump
Table 27.9. Performance Rating of various functions of NIS IAs by "Vintage"
Vintage No. of IA
sample
Performance
Rating of NIS
IAs (0-4, 4
excellent). Water
distribution
Performance
Rating of NIS
IAs (0-4, 4
excellent). Maintenance
of canals
Performance
Rating of NIS
IAs (0-4, 4
excellent). Maintenance
of control structures
Performance
Rating of NIS
IAs (0-4, 4
excellent). Construction
of facilities
Performance
Rating of
NIS IAs (0-
4, 4 excellent).
Collection of ISF
Performan
ce Rating
of NIS IAs
(0-4, 4 excellent).
Collection of other
fees
Performan
ce Rating
of NIS IAs
(0-4, 4 excellent).
Technical Advice to
farmers
Performan
ce Rating
of NIS
IAs. Overall
rating
1965-1980 9
3
3
2
1
3
4
4
1
1981-2013 35
3
4
3
3
3
3
3
2
Before NIA 20
4
3
3
3
3
3
4
2
Average for All
Sample/Total 64
3
3
3
2
3
3
3
2
Sources: NIS KII

174
Table 27.10. NIS IA's Collection Rate by "Vintage"
Vintage No. of IA
sample
Ave. of
Collection Rate
(%) of NIS IAs
Collection Rate
(%) of NIS
IAs. 30 and below
Collection Rate
(%) of NIS
IAs. 31 - 60
Collection Rate
(%) of NIS
IAs. 61 - 90
Collection
Rate (%) of
NIS IAs. 91 and above
Collection
Rate (%)
of NIS IAs. No answer
Rating on
NIS IAs'
ability to resolve
conflict (0-
4, 4 effective).
2
Rating on
NIS IAs'
ability to resolve
conflict (0-
4, 4 effective).
3
Rating
on NIS
IAs' ability
to
resolve conflict
(0-4, 4
effective). 4
Rating
on NIS
IAs' ability to
resolve
conflict (0-4, 4
effective)
. No Answer
1965-1980 9
80
2
3
4
2
3
4
1981-2013 35
78
4
21
4
6
1
6
17
11
Before NIA 20
70
1
2
8
2
7
3
7
10
Average for All
Sample/Total 64
77
1
8
32
10
13
3
9
27
25
Sources: NIS KII
Table 27.11. NIS IA's Rating on Water Delivery Service and Water Distribution Policy by "Vintage"
Vintage No. of IA
samp
le
Rating of NIS
IAs'
water delivery
service
(0-4, 4 highest).
0
Rating of NIS IAs'
water
delivery service (0-
4, 4
highest). 1
Rating of NIS IAs' water
delivery
service (0-4, 4 highest). 2
Rating of NIS IAs'
water
delivery service (0-
4, 4
highest). 3
Rating of NIS IAs' water
delivery service
(0-4, 4 highest). 4
Rating of NIS IAs' policy on water
distribution
scheme (0-4, 4 highest). 0
Rating of NIS IAs' policy on
water
distribution scheme (0-4, 4
highest). 1
Rating of NIS IAs' policy on
water
distribution scheme (0-4, 4
highest). 2
Rating of NIS IAs' policy on
water
distribution scheme (0-4, 4
highest). 3
Rating of NIS IAs' policy on
water
distribution scheme (0-4,
4 highest). 4
1965-1980 9
3 2 1
3
1981-2013 35
3
6
5 14
2 5
18
Before NIA 20
1
1
3 5 1 2
7
Total 64
1
3
10
8 21 1
2 8
28
Sources: NIS KII

175
Table 27.12. Mode of irrigation scheduling and rating for effectiveness of accountability provision
among NIS IAs by "Vintage"
Vintage No.
of IA
sample
Mode of
irrigatio
n scheduli
ng by
NIS IAs.
Downstr
eam-upstrea
m
Mode of
irrigation
scheduling by NIS IAs.
Upstream-
downstream
Mode of
irrigation
scheduling by NIS IAs.
By groups
by hour/day on rotation/
depends on
IA
Mode of
irrigation
scheduling by NIS IAs. No
answer
Rating for
effectiveness
of accountabilit
y provision
among NIS IAs (0-4, 4
most
effective).
Rating for
effectiveness of
accountability provision among
NIS IAs (0-4, 4
most effective). 0
Rating for
effectiveness
of accountability
provision
among NIS IAs (0-4, 4
most
effective). 1
Rating for
effectiveness
of accountability
provision
among NIS IAs (0-4, 4
most
effective). 2
Rating for
effectiveness of
accountability provision
among NIS IAs
(0-4, 4 most effective). 3
Rating for
effectiveness
of accountabilit
y provision
among NIS IAs (0-4, 4
most
effective). 4
Rating for
effectiveness
of accountabilit
y provision
among NIS IAs (0-4, 4
most
effective). No Answer
1965-1980 9
1
5 3
4 2
2
5
1981-2013 35
5
22
1 7
3
1
2 11
10
11
Before NIA 20
4
3
2 11
3 1 3
4
12
Total 64
10
30
3 21
3 1
1
2 16
16
28
Sources: NIS KII
Table 27.13. Provisions in NIS IA policies holding IA officers/BOD accountable by "Vintage"
Vintage No.
of IA samp
le
Provisions
in NIS IA policies
holding
water users accountabl
e. No
Provisions
in NIS IA policies
holding
water users accountable.
Yes
Provisions
in NIS IA policies
holding
water users accountabl
e. No
Answer
Provisions in
NIS IA policies
holding water
users accountable.
No Comment
Provisions in
NIS IA policies
holding IA
officers/BOD accountable.
No
Provisions in NIS
IA policies holding IA
officers/BOD
accountable. Yes
Provisions in
NIS IA policies
holding IA
officers/BOD accountable.
No Answer
1965-1980 9
1
3
5 2
7
1981-2013 35
5
22
8
7 19
9
Before
NIA 20
3
8
7
2
4 4
12
Total 64
9
33
20
2
11 25
28
Sources: NIS KII

176
Table 27.14. Policies which are not adequately implemented by NIS IAs by
"Vintage"
Vintage No. of IA
sample
Policies which are
not adequately
implemented by NIS IAs. Payment
of ISF/IA dues
Policies which are
not adequately
implemented by NIS IAs. Water delivery
schedules
Policies which are not adequately
implemented by NIS IAs. Penalty
clauses
Policies which
are not
adequately implemented
by NIS IAs.
Others
Policies which are
not adequately
implemented by NIS IAs. No
Answer
Policies which are
not adequately
implemented by NIS IAs. None
Policies which
are not
adequately implemented
by NIS IAs.
Not Applicable
1965-1980 9 1 1 2 1
4
1981-2013 35 1 4 7
3 10 9
4
Before NIA 20 1 5 1
4 1 2
8
Total 64 2 10 9
7 13 12
16
Sources: NIS KII
Note: Others - wearing of uniform, securing for personal needs, irrigation procedure, improper behavior, restriction of garbage/illegal settlers, destruction of turnouts.
Table 27.15. Trainings attended by NIS IAs by "Vintage"
Vintage No. of IA
sample
Trainings attended
by NIS IAs. Basic Leadership Devt.
Course
Trainings attended
by NIS IAs. Financial
Management
Trainings attended by NIS IAs.
Org. Management/Capability/Policy
Trainings
attended by NIS IAs.
Values
formation
Trainings attended
by NIS IAs. System/water
management
Trainings attended
by NIS IAs. Cropping/AWD/qu
ality
control/fertilizer
1965-1980 9 8 7 3 7 9
1981-2013 35 4 7 2
3 7 7
Before NIA 20 3 5 4
3 5 4
Total 64 15 19 9
6 19 20
Sources: NIS KII
Table 27.16. Average participation to NIS-IA meetings of IA officers and BODs by "Vintage"

177
Vintage No. of
IA sample
Participation to
NIS-IA meetings - IA
officers (50 and
below)
Participation to
NIS-IA meetings - IA officers (51 -
80)
Participation to NIS-IA
meetings - IA officers (more than 80)
Participatio
n to NIS-IA meetings -
BODs (50
and below)
Participation to
NIS-IA meetings -
BODs (51 - 80)
Participation to
NIS-IA meetings -
BODs (more
than 80)
Participatio
n to NIS-IA meetings -
General
assembly (50 and
below)
Participation to
NIS-IA meetings -
General
assembly (51 - 80)
Participatio
n to NIS-IA meetings -
General
assembly (more than
80)
1965-1980 9 1 5 1 5
3 3
1
1981-2013 35 1 6 18
2 4 19
3 12
7
Before NIA 20 1 4 7
1 2 8
4 4
2
Total 64 2 11 30
3 7 32
10 19
10
Sources: NIS KII
Table 27.17. Frequency of meeting of NIS-IA officers/BODs and members by "Vintage"
Vintage No. of IA
sample
Frequency of
meeting of
NIS-IA officers/BOD
s and
members. IA officers
(once-thrice a
month)
Frequency of
meeting of
NIS-IA officers/BOD
s and
members. IA officers (once
to 6 times per
cropping)
Frequency of
meeting of
NIS-IA officers/BOD
s and
members. IA officers (as
needed)
Frequency of
meeting of
NIS-IA officers/BOD
s and
members. BODs (1-2
times per
month)
Frequency of
meeting of
NIS-IA officers/BOD
s and
members. BODs (once
a year-every
cropping)
Frequency of
meeting of
NIS-IA officers/BOD
s and
members. BODs (as
needed)
Frequency of
meeting of
NIS-IA officers/BOD
s and
members. General
Assembly
(monthly-twice a year)
Frequency of
meeting of
NIS-IA officers/BOD
s and
members. General
Assembly
(yearly/every two years)
Frequency of
meeting of
NIS-IA officers/BOD
s and
members. General
Assembly (as
needed)
Frequency of
meeting of
NIS-IA officers/BOD
s and
members. General
Assembly
(have not yet conducted)
1965-
1980 9
8
1
8
4
5
1981-2013 35
24
5
4
28
3
2
20
12
2
Before
NIA 20
12
2
11
2
6
6
1
Total 64
44
6
6
47
3
4
30
23
2
1
Sources: NIS KII

178
Table 27.18. Manner of choosing and term of office and forms of compensation of NIS-
IA officers/BOD by "Vintage"
Vintage No. of IA
sample
Manner of
choosing and
term of office of
NIS-IA
officers/BOD - election
by general
assembly
Manner of
choosing
and term of office of
NIS-IA
officers/BOD - voted
by BOD
Manner of
choosing
and term of office of
NIS-IA
officers/BOD - 1-2
years
Manner of
choosing
and term of office of
NIS-IA
officers/BOD - 3-4
years
Forms of
compensati
on of NIS-IA (15-
30% of
collection, if 70-90%
collection)
Forms of
compensati
on of NIS-IA (BOD
with
honorarium P1,000-
P2,000)
Forms of
compensati
on of NIS-IA (P100-
200/mgt/act
ivity)
Forms of
compensati
on of NIS-IA
(P5000/sea
son)
Forms of
compensati
on of NIS-IA (P200-
800/month
)
Forms of
compensati
on of NIS-IA (Other
incentives
- snacks, P500/grou
p
discounts)
Forms of
compensati
on of NIS-IA (none)
1965-
1980 9
8
1
7
2
1
1
1
3
1981-
2013 35
32
2
22
12
3
3
4
3
3
17
Before NIA 20
14
12
1
2
12
Total 64
54
3
41
15
3
4
4
1
5
4
32
Sources: NIS KII

179
Table 27.19. Respondents' rating on NIA's support to NIS ISs and modifications by NIS IAs to IS by
"Vintage"
Vintage No. of IA
sample
Respondents'
average rating
on NIA's support to NIS-
IAs. (Technical
- 0-4, 4 excellent)
Respondents'
average rating
on NIA's support to NIS-
IAs. (Financial
- 0-4, 4 excellent)
Respondents'
average rating
on NIA's support to NIS-
IAs.
(Institutional - 0-4, 4
excellent)
Modifications
by NIS IAs to
IS. Structure non-
operational
(No)
Modifications
by NIS IAs to
IS. Structure non-
operational
(Yes)
Modifications
by NIS IAs to
IS. Structure non-
operational
(No Answer)
Modifications
by NIS IAs to
IS. Undertook rehabilitation
(No)
Modifications
by NIS IAs to
IS. Undertook rehabilitation
(Yes)
Modifications
by NIS IAs to
IS. Undertook rehabilitation
(No Answer)
1965-1980 9
4
3
3
4
5
4
1
4
1981-2013 35
4
4
4
16
9
10
14
8
13
Before NIA 20
3
4
3
7
1
12
8
12
Total 64
4
4
4
27
10
27
26
9
29
Sources: NIS KII
Vintage Modifications by
NIS IAs to IS.
Other Modifications
(Canal Lining)
Modifications by NIS
IAs to IS. Other
Modifications
(Drainage Rehab)
Modifications by NIS
IAs to IS. Other
Modifications (Canal
Desiltation/rehab)
Modifications by NIS
IAs to IS. Other
Modifications
(Others)
1965-1980 2
1981-2013 10 2 2 6
Before NIA 3 3 4
Total 13 2 5 12
Sources: NIS KII

180
By “Success”
The characterization of the sample according to a measure of “success” is reported in Tables 28.1
to 28.19.
The NIA IA Functionality Survey classifies the IA into either successful or less successful, where
data collected from the field are few. In the samples, successful IAs generally have adequate water
supply, few institutional problems, high functionality survey ratings, sufficient budget, and fewer
problems due to lack of facilities, machineries and equipment. Despite these good attributes, these
IAs still exhibited cropping problems due to calamities/ pest infestation, severe siltation problems,
and condition problems for main canals, lateral canals, and control structures
On the other hand, less successful IAs experience water shortage in the dry seasons, irrigation
headwork problems, problems due to lack of facilities, machineries and equipment, inadequate
budget, and low ratings in functionality surveys

181
Table 28.1. NIS IA Profile, Cropping Information and Financial Aspects by "Success"
Classification No. of
IA sample
Ave. of No.
of Members
Ave. of No.
of Farmers-Landowner
-operator
(%)
Ave. of No. of
Farmers-Tenant (%)
Ave. of
No. of Farmers-
Lessees
(%)
Does IA
have water
permit?
(answer: no)
Does IA
have water
permit?
(answer: yes)
Does IA
have water permit? (no
answer)
No. of Crops
Irrigated: rice only
No of Crops
Irrigated: rice and
other crops
No. of IAs
paying ISF/DCC/amor
tization
Not Successful 14
186
51
57
50
5
5
3 12
2
8
Successful 10
161
63
32
19
6
3
1 10
10
Insufficient Data 40
194
62
44
12
18
7
13 22
14
16
Average for All
Sample/Total 64
187
60
45
17
29
15
17 44
16
34
Sources: NIS KII
Table 28.2. Problems/concerns of NIS IAs by "Success"
Classification No. of
IA sampl
e
No. of IAs
with inadequate
water supply
in dry season
No. of IAs
with flooding
problem
during wet season
No. of IAs with
Irrigation Headwork
Problems
(damaged, deteriorated,
lacking)
No. of IAs
with Irrigation
Main
Canal Problems
(damaged,
deteriorated,
unlined)
No. of IAs
with Irrigation
Lateral
Canal Problems
(damaged,
deteriorated,
unlined)
No. of
IAs with Irrigatio
n
Control Structure
Problem
s (damage
d,
deteriorated,
lacking,
unlined)
No. of IAs
with Siltation,
Solid Waste,
Informal Settlers &
Water
Quality Problems
No. of IAs with
problems due to lack of facilities,
infrastructure
(FMRs), canal extensions,
drainage,
storage, pipelines,
STWs, solar
drier & etc.
No. of IAs
with problems
due to
damaged/lack of
Machineries
&Equipment (ex.
Backhoes,
pumps, pipes & etc.)
No. of IAs
with institutional/
management
problems
Not Successful 14
7
3
1
5
1
4 7
6
9
Successful 10
1
5
9
3
3 3
1
6
Insufficient Data 40
14
3
9
7
13
11
10 9
9
14
Total 64
22
3
12
13
27
15
17 19
16
29
Source: NIS KII Note: Institutional/Management Problems - Water Stealing, lack of discipline, water scheduling problems, illegal turnouts, animals like carabao's allowed in canal, attendance during maintenance work, conflict among members, rules not
followed, safety problems

182
Table 28.3. NIA's NIS Functionality Survey rating, IA's own Financial Strength rating, Collection Efficiency and IA's performance rating of ISF collection by "Success"
Classification No.
of IA sampl
e
IA
Functionality
Survey
Rating (No
Data)
IA
Functionality
Survey
Rating (Poor -
Satisfa
ctory)
IA
Functionality Survey
Rating
(Very Satisfactor
y -
Outstanding)
IA's
Financial
Strengt
h Rating
(no
data)
IA's
Financial
Strength
Rating (0 - 2,
weak)
IA's
Financial Strength
Rating
(3-4, strong)
IA's
Collection
Efficie
ncy (No
Data)
IA's
Collection
Efficien
cy (0 -64%,
weak)
IA's
Collection
Efficien
cy (65% -
100%,
strong)
IA's
Performance
Rating
of Collecti
on of
ISF (no data)
IA's
Performance Rating
of
Collection of ISF (0-
2, weak)
IA's
Performance
Rating
of Collecti
on of
ISF (3-4,
strong)
No.
of IAs
by
"Success"
(insuf
ficient
data)
No. of
IAs by "Success
" (Not
Successful)
No. of
IAs by "Success
"
(Successful)
Not Successful 14
11
3
13
1
3
11
4
3
7
14
Successful 10
10
10
2
8
10
10
Insufficient Data 40
35
1
4
23
8
8
8
7
25
29
2
9
40
Total 64
35
12
17
23
21
19
8
12
44
33
5
26
40
14
10
Source: NIS KII Note: Not Successful - IAs having FS of poor to satisfactory, financial strength rating of 0 -2, collection efficiency below of 0 to 64%
and/or ISF collection rating of 0-2
Successful - IAs having FS of very satisfactory to outstanding, financial strength rating of 3 -4, collection efficiency of at least 65% and/or ISF collection rating of 3-4
Table 28.4. NIS IA's Performance Ratings of their water distribution and delivery service by "Success"
Classification No.
of IA
sample
Flexibili
ty Index
- no answer
Flexibi
lity
Index Rating
- (0-2, not
flexibl
e)
Flexibility
Index
Rating - (3-4,
flexible)
Reliabi
lity
Index Rating
- no answer
Reliabil
ity
Index Rating -
(0-2, not
reliable)
Reliabilit
y Index
Rating - (3-4,
reliable)
Equita
bility
Index Rating
- no answer
Equitabi
lity
Index Rating -
(0-2, not
equitabl
e)
Equitabi
lity
Index Rating -
(3-4, equitabl
e)
Adequa
cy of
Service Deliver
y Rating -
no data
Adequacy
of Service
Delivery Rating -
(0-2, inadequate
service)
Adequa
cy of
Service Deliver
y Rating -
(3-4,
adequate
service)
Not Successful 14
2
8
2
8
2
8
1
9
Successful 10
7
7
4
10
1
2
11
1
7
6
Insufficient Data 40
14
5
20
13
6
21
17
5
18
14
12
14
Total 64
16
12
35
15
10
39
20
7
37
16
19
29
Source: NIS KII

183
Table 28.5. NIS IA's rating of their ability to seek outside help by "Success"
Classification No. of IA sample
Ave. Rating for ability of
NIS IAs to
seek outside help (0-4, 4
most
influential)
Rating for ability of
NIS IAs to
seek outside help (0)
Rating for ability of NIS
IAs to seek
outside help (1)
Rating for ability of
NIS IAs to
seek outside help (2)
Rating for ability of NIS
IAs to seek
outside help (3)
Rating for ability of
NIS IAs to
seek outside
help (4)
Rating for ability of
NIS IAs to
seek outside
help (No
answer)
Not Successful 14
3
2
3
5
3
1
Successful 10
2
2
1
4
2
1
Insufficient Data 40
2
2
6
4
1
27 Average for All
Sample/Total 64
2
4
2
10
13
6
29
Source: NIS KII
Table 28.6. Assistance received by NIS IAs from Various Sources by
"Success"
Classification No. of IA
sample
Assistance
received by
NIS IAs from Various
sources.
BSWM - Free Soil analysis
Assistance
received by
NIS IAs from
Various
sources. LGU - Farm
inputs/seed
subsidy
Assistance
received by
NIS IAs from Various
sources. LGU
- Repair farm to market
roads
Assistance
received by
NIS IAs from
Various
sources. LGU -
financial/liv
elihood
Assistance
received by
NIS IAs from Various
sources. LGU
- technical support
Assistance
received
by NIS IAs from
Various
sources. LGU -
equipment
/thresher/fuel
Assistance
received
by NIS IAs from
Various
sources. Others -
flatbed
dryer/solar dryer
Assista
nce
received by
NIS
IAs from
Variou
s sources
.
Others -
pump/t
hresher / fuel
Assistance
received by
NIS IAs from Various
sources.
Others - Seed subsidy/analy
sis
Assistance
received by NIS
IAs from Various
sources. Others
- soil sampling/traini
ng
Not Successful 14
7
1
3
1
1
3 1
Successful 10
1
2
1
1
1
1
1
2 1
Insufficient Data 40
2
1
1
2
3
4
10
Total 64
10
4
2
4
1
3
4
6
15 2
Source: NIS KII

184
Table 28.7. Cropping problems of NIS IAs by "Success"
Classification No. of IA sample Cropping problems
of NIS IA’s. Garbage in the
canals
Cropping
problems of NIS IA’s. Lack of
water supply
Cropping
problems of NIS IAs. Water
delivery schedule
Cropping
problems of NIS IAs. Low
yield/calamities
Cropping
problems of NIS IAs. High
production
cost/low buying price
Cropping
problems of NIS IAs.
FMR/high
harvest loss
Cropping
problems of NIS IAs.
Others -
informal settlers, govt.
Support
Not Successful 14 6 2
Successful 10 2 2 6 4
Insufficient Data 40 1 2 1 15 3
1
1
Total 64 1 4 3 27 9
1
1
Source: NIS KII
Table 28.8. Problems encountered by NIS IAs by "Success"
Classification No. of IA
sample
Problems
encountered
by NIS-IAs. Unlined
canals and turnout
Problems
encountered
by NIS-IAs. Poor structure
design
Problems
encountered
by NIS-IAs. Damaged
irrigation structure
Problems
encountered
by NIS-IAs. Lack of water
supply
Problems
encountered
by NIS-IAs. Solid waste in
canals/siltation
Problems
encountered
by NIS-IAs. Some
members don't follow
the schedule
Problems
encountered
by NIS-IAs. Illegal
turnouts
Problems
encountered
by NIS-IAs.
Damaged farm to
market road
Problems
encountered
by NIS-IAs. Others
Not Successful 14
1
2
6
3
2
4
3
Successful 10
2
5
4
1
1
Insufficient Data 40
6
1
6
12
7
5
1
7
10
Total 64
7
5
11
18
14
8
2
11
13
Source: NIS KII
Note: Others - extension of water sched.. lack of equipment; lack of irrigation facilities; monitoring of water delivery & maintenance of laterals with certain stretch; none; improve the irrigation
facilities; irrigation
structure not yet finished; lack of discipline; not following cropping calendar; political intervention; slow action of NIS; ISF very high; lack of water
pump

185
Table 28.9. Average Performance Rating of various functions of NIS IAs by
"Success"
Classification No. of IA
sample
Performance
Rating of NIS
IAs (0-4, 4 excellent).
Water
distribution
Performance
Rating of NIS
IAs (0-4, 4 excellent).
Maintenance
of canals
Performance
Rating of NIS
IAs (0-4, 4 excellent).
Maintenance
of control structures
Performance
Rating of NIS
IAs (0-4, 4 excellent).
Construction
of facilities
Performance
Rating of NIS
IAs (0-4, 4 excellent).
Collection of
ISF
Performance
Rating of NIS
IAs (0-4, 4 excellent).
Collection of
other fees
Performance
Rating of
NIS IAs (0-4, 4
excellent).
Technical Advice to
farmers
Performance
Rating of
NIS IAs. Overall
rating
Not Successful 14
3
3
3
2
3
3
3
3
Successful 10
4
4
3
2
3
3
3
3
Insufficient Data 40
3
3
3
3
3
3
3
1
Average for All
Sample/Total 64
3
3
3
2
3
3
3
2
Source: NIS KII
Table 28.10. NIS IA's Collection Rate by "Success"
Classification No. of IA sample
Ave. of Collection
Rate (%) of
NIS IAs
Collection Rate (%) of
NIS IAs. 30
and below
Collection Rate (%) of
NIS IAs. 31 -
60
Collection Rate (%) of
NIS IAs. 61 -
90
Collection Rate (%) of
NIS IAs. 91
and above
Collection Rate (%) of
NIS IAs. No
answer
Rating on NIS IAs'
ability to
resolve conflict (0-
4, 4
effective). 2
Rating on NIS IAs'
ability to
resolve conflict (0-
4, 4
effective). 3
Rating on NIS IAs'
ability to
resolve conflict
(0-4, 4
effective). 4
Rating on NIS IAs'
ability to
resolve conflict
(0-4, 4
effective). No
Answer
Not Successful 14
72
1
1
10
1
1
1
5
7
1
Successful 10
75
1
9
9
1
Insufficient Data 40
79
6
13
9
12
2
4
11
23
Average for All Sample/Total 64
77
1
8
32
10
13
3
9
27
25
Source: NIS KII

186
Table 28.11. NIS IA's Rating on Water Delivery Service and Water Distribution Policy by
"Success"
Classification No. of IA
sample
Rating of NIS
IAs' water
delivery service (0-4, 4
highest). 0
Rating of NIS
IAs' water
delivery service (0-4, 4
highest). 1
Rating of NIS
IAs' water
delivery service (0-4, 4
highest). 2
Rating of
NIS IAs'
water delivery
service (0-
4, 4 highest). 3
Rating of
NIS IAs'
water delivery
service (0-
4, 4 highest). 4
Rating of
NIS IAs'
policy on water
distribution
scheme (0-4, 4
highest). 0
Rating of
NIS IAs'
policy on water
distribution
scheme (0-4, 4
highest). 1
Rating of
NIS IAs'
policy on water
distribution
scheme (0-4, 4
highest). 2
Rating of
NIS IAs'
policy on water
distribution
scheme (0-4, 4
highest). 3
Rating of
NIS IAs'
policy on water
distribution
scheme (0-4, 4
highest). 4
Not Successful 14
1
2
4
3
3
1
1
1
9
Successful 10
2
7
2
8
Insufficient Data 40
1
6
3
11
1
5
11
Total 64
1
3
10
8
21
1
2
8
28
Source: NIS KII
Table 28.12. Mode of irrigation scheduling and rating for effectiveness of accountability provision among NIS
IAs by "Success"
Classification No. of IA
sample
Mode of irrigation
scheduling
by NIS IAs. Downstream-
upstream
Mode of irrigation
scheduling
by NIS IAs. Upstream-
downstream
Mode of irrigation
scheduling
by NIS IAs. By groups by
hour/day on
rotation/ depends on
IA
Mode of irrigation
scheduling
by NIS IAs. No answer
Rating for effectiveness
of
accountability provision
among NIS
IAs (0-4, 4 most
effective).
Rating for effectiveness
of
accountability provision
among NIS
IAs (0-4, 4 most
effective). 0
Rating for effectiveness
of
accountability provision
among NIS
IAs (0-4, 4 most
effective). 1
Rating for effectiveness
of
accountability provision
among NIS
IAs (0-4, 4 most
effective). 2
Rating for effectiveness
of
accountability provision
among NIS
IAs (0-4, 4 most
effective). 3
Rating for effectiveness
of
accountability provision
among NIS
IAs (0-4, 4 most
effective). 4
Rating for effectiveness
of
accountability provision
among NIS
IAs (0-4, 4 most
effective). No
Answer
Not Successful 14
3
10
1
3
1
1
7
3
2
Successful 10
1
8
1
4
4
5
1
Insufficient Data 40
6
12
2
20
3
1
1
5
8
25
Total 64
10
30
3
21
3
1
1
2
16
16
28
Source: NIS KII

187
Table 28.13. Provisions in NIS IA policies holding IA officers/BOD accountable by "Success"
Classification No. of IA
sample
Provisions in
NIS IA policies holding water
users
accountable. No
Provisions in
NIS IA policies holding water
users
accountable. Yes
Provisions in
NIS IA policies holding water
users
accountable. No Answer
Provisions in
NIS IA policies
holding
water users accountable.
No Comment
Provisions in
NIS IA policies
holding IA
officers/BOD accountable.
No
Provisions in
NIS IA policies
holding IA
officers/BOD accountable.
Yes
Provisions in
NIS IA policies
holding IA
officers/BOD accountable.
No Answer
Not Successful 14 2 10 1 1
3
9
2
Successful 10 8 1
1
2
6
2
Insufficient Data 40 7 15 18
6
10
24
Total 64 9 33 20 2
11
25
28
Source: NIS KII
Table 28.14. Policies which are not adequately implemented by NIS IAs by "Success"
Classification No. of IA
sample
Policies which
are not adequately
implemented by
NIS IAs. Payment of
ISF/IA dues
Policies which
are not adequately
implemented by
NIS IAs. Water delivery
schedules
Policies which are not
adequately implemented by NIS IAs. Penalty clauses
Policies which
are not adequately
implemented by
NIS IAs. Others
Policies which
are not adequately
implemented by
NIS IAs. No Answer
Policies which are not
adequately implemented by NIS
IAs. None
Policies which
are not adequately
implemented by
NIS IAs. Not Applicable
Not Successful 14 1 8 1
1
2 2 1
Successful 10
2 7 1
Insufficient Data 40 1 2 8
4
11 3 14
Total 64 2 10 9
7
13 12 16
Source: NIS KII Note: Others - wearing of uniform, securing for personal needs, irrigation procedure, improper behavior, restriction of garbage/illegal settlers, destruction of turnouts.

188
Table 28.15. Trainings attended by NIS IAs by "Success"
Classification No. of IA sample
Trainings attended by NIS
IAs. Basic Leadership
Devt. Course
Trainings attended by NIS
IAs. Financial Management
Trainings attended by NIS IAs. Org.
Management/Capability/Policy
Trainings attended by
NIS IAs. Values
formation
Trainings attended by
NIS IAs. System/water
management
Trainings attended by NIS IAs.
Cropping/AWD/quality control/fertilizer
Not Successful 14 4 7 2
3
7 7
Successful 10 3 5 4
3
5 4
Insufficient Data 40 8 7 3
7 9
Total 64 15 19 9
6
19 20
Source: NIS KII
Table 28.16. Average participation to NIS-IA meetings of IA officers and BODs by "Success"
Classification No. of
IA sample
Participation
to NIS-IA meetings -
IA officers
(50 and below)
Participation
to NIS-IA meetings -
IA officers
(51 - 80)
Participation
to NIS-IA meetings -
IA officers
(more than 80)
Participation
to NIS-IA meetings -
BODs (50
and below)
Participation
to NIS-IA meetings -
BODs (51 -
80)
Participation
to NIS-IA meetings -
BODs (more
than 80)
Participation
to NIS-IA meetings -
General
assembly (50 and below)
Participation
to NIS-IA meetings -
General
assembly (51 - 80)
Participation
to NIS-IA meetings -
General
assembly (more than
80)
Not Successful 14
3
10
1
12
3
6
3
Successful 10
1
9
2
8
1
5
4
Insufficient Data 40
1
8
11
3
4
12
6
8
3
Total 64
2
11
30
3
7
32
10
19
10
Source: NIS KII

189
Table 28.17. Frequency of meeting of NIS-IA officers/BODs and members by "Success"
Classificati
on
No. of IA
sample
Frequency
of meeting of NIS-IA
officers/B
ODs and members.
IA officers
(once-thrice a
month)
Frequency
of meeting of NIS-IA
officers/B
ODs and members.
IA officers
(once to 6 times per
cropping)
Frequency
of meeting of NIS-IA
officers/B
ODs and members.
IA officers
(as needed)
Frequency
of meeting of NIS-IA
officers/B
ODs and members.
BODs (1-2
times per month)
Frequency
of meeting of NIS-IA
officers/BO
Ds and members.
BODs
(once a year-every
cropping)
Frequency of
meeting of NIS-IA officers/BODs
and members.
BODs (as needed)
Frequency
of meeting of NIS-IA
officers/B
ODs and members.
General
Assembly (monthly-
twice a
year)
Frequency
of meeting of NIS-IA
officers/B
ODs and members.
General
Assembly (yearly/ev
ery two
years)
Frequency
of meeting of NIS-IA
officers/B
ODs and members.
General
Assembly (as
needed)
Frequency
of meeting of NIS-IA
officers/B
ODs and members.
General
Assembly (have not
yet
conducted)
Not Successful 14
11
2
11
2
7
6
1
Successful 10
9
1
10
4
6 Insufficien
t Data 40
24
3
6
26
1 4
19
11
2
Total 64
44
6
6
47
3 4
30
23
2
1
Source: NIS KII
Table 28.18. Manner of choosing and term of office and forms of compensation of NIS-IA officers/BOD by "Success"
Classificati
on
No. of IA
sample
Manner of
choosing
and term of office
of NIS-IA
officers/BOD -
election by general
assembly
Manner of
choosing
and term of office
of NIS-IA
officers/BOD -
voted by BOD
Manner of
choosing
and term of office
of NIS-IA
officers/BOD - 1-2
years
Manner of
choosing
and term of office
of NIS-IA
officers/BOD - 3-4
years
Forms of
compensat
ion of NIS-IA
(15-30%
of collection,
if 70-90% collection)
Forms of
compensati
on of NIS-IA (BOD
with
honorarium P1,000-
P2,000)
Forms of
compensation of
NIS-IA (P100-200/mgt/activity)
Forms of
compensat
ion of NIS-IA
(P5000/se
ason)
Forms of
compensat
ion of NIS-IA
(P200-
800/month)
Forms of
compensat
ion of NIS-IA
(Other
incentives - snacks,
P500/group
discounts)
Forms of
compensat
ion of NIS-IA
(none)
Not
Successful 14
14
11
3
1 1
1
10
Successful 10
9
1
9
1
2 2
4
2
Insufficien
t Data 40
31
2
21
11
2
2 1
1
1
1
22
Total 64
54
3
41
15
3
4 4
1
5
4
32
Source: NIS KII

190
Table 28.19. Respondents' rating on NIA's support to NIS IAs and modifications by NIS IAs to IS by "Success"
Classifica
tion
No. of IA
sample
Responde
nts' average
rating on
NIA's support to
NIS-IAs.
(Technical - 0-4, 4
excellent)
Responde
nts' average
rating on
NIA's support to
NIS-IAs.
(Financial - 0-4, 4
excellent)
Responde
nts' average
rating on
NIA's support to
NIS-IAs.
(Institutional - 0-4,
4
excellent)
Modificat
ions by NIS IAs
to IS.
Structure non-
operation
al (No)
Modificat
ions by NIS IAs
to IS.
Structure non-
operation
al (Yes)
Modificat
ions by NIS IAs
to IS.
Structure non-
operation
al (No Answer)
Modificat
ions by NIS IAs
to IS.
Undertook
rehabilitat
ion (No)
Modificat
ions by NIS IAs
to IS.
Undertook
rehabilitat
ion (Yes)
Modificat
ions by NIS IAs
to IS.
Undertook
rehabilitat
ion (No Answer)
Modificat
ions by NIS IAs
to IS.
Other Modificat
ions
(Canal Lining)
Modificat
ions by NIS IAs
to IS.
Other Modificat
ions
(Drainage Rehab)
Modificati
ons by NIS IAs to IS.
Other
Modifications (Canal
Desiltation
/rehab)
Modificat
ions by NIS IAs
to IS.
Other Modificat
ions
(Others)
Not
Successfu
l 14
3
3
3
8
1
5
8
1
5
2
1
2 Successfu
l 10
4
4
4
6
3
1
4
5
1
8
2
Insufficient Data 40
4
3
4
13
6
21
14
3
23
3
1
5
8
Total 64
4
4
4
27
10
27
26
9
29
13
2
5
12
Source: NIS KII

191
Technical and Institutional Issues and Concerns across the 22 Sample NIS
Tables 29-31 show the summary of technical/environmental and institutional issues and concerns
across all the 22 NIS cases. This table reports siltation, damaged irrigation canals and control
structures, double pumping and high operation costs when private pumps are used when NIS water
is inadequate or not timely. For the environmental concerns, the high pH which can potentially
result in sodocity and lack of data are dominant. For the institutional concerns, water theft,
scheduling and distribution appear to be the more common concerns.
Overall Irrigation Performance Assessment8
In the initial development of Irrigation Performance Index (IPI) using PCA based on a small
sample size of 64, results show that performance ranged from low to high level with majority of
the IAs (37/64) having moderate level of performance as reflected in the IPI of the different NIS
cases analyzed. The key indicators that affect the performance of NIS consist of Financial,
Economic, Institutional, Technical and Environmental factors.
Within the financial component, the key indicators that posed significant contribution as computed
by the PCA are: 1) IA’s rate on their financial strength – this could imply the financial capability
of the IA which could be critical in the organization’s development; 2) Collection efficiency – a
higher collection efficiency would mean higher capacity to pay the ISF and consequently more
incentives for the organization; and 3) Collection delinquency – this indicator posed a negative
relationship with the overall CPI since a higher delinquency would decrease the performance index
of the IAs. This is expected since more uncollected ISFs would mean less incentive and could
imply a very low capacity to pay.
Within the economic component, the indicators Annual yield and Annual gross profit posed
significant contribution to the overall impact. Increase in the annual yield could also be consequent
to the increase in the annual profit. An increase in any of these factors also indicates an increase
in the overall CPI.
The significant indicators for the institutional component includes: 1) Effectiveness of policies; 2)
Flexibility index rating; 3) Reliability index rating; and 4) Satisfaction rate on farm to market road
availability. All institutional component indicators are based on satisfaction rating of IAs towards
the policies implemented by NIA.
The technical component indicators include Canal structure’s ease of operability and Canal
structure’s operability vs the design. Canal structure’s ease of operability pertains to how easy it
is to operate the structures such as check gates, turnout gates, etc. While Canal structure’s
operability vs design pertains to the comparison between the original designs of the irrigation
system vs the actual use of the irrigation structure.
8 This section is drawn from Clemente, et al. (2015).

192
Finally, the environmental component indicators show that the Dissolve Oxygen content and
acidity (indicated by pH content <5) posed significant effect to the overall CPI. Higher DO (i.e. >
6 ppm) and pH content (i.e. >5) means better quality of water. However, the pH found in most
water samples show levels >7 which indicate alkaline conditions and can pose some sodicity
problems in water quality if not addressed on time.
This impact assessment on performance is from the point of view of IAs and will have to be
complemented or validated by technical data. However this initial assessment already provides
some indication how an NIS is performing based on the overall index.
The results indicate that only 12% of the 64 sample IAs consider their systems’ performance as
“high” based on the five areas of irrigation service performance while 58% rated their systems’
performance as “moderate” and the rest of the systems, low performance. These results indicate
opportunities to improve overall irrigation service performance.

193
Table 29 Summary of Observation for each NIS
Issues Pampa
nga
Delta
River
Irrigati
on
System
(Pamp
anga)
Tarlac
Groundwater
Irrigation
System
(Tarlac)
UPRIIS-
Division
2
(Nueva
Ecija)
UPRIIS-
Division
3
(Nueva
Ecija)
UPRIIS-
Division
4
(Nueva
Ecija)
Angat-
Maasim
River
System
(Bulacan)
Nueva
Era
Pump
Irrigation
System
(Ilocos
Norte)
Bonga
Pump 2
Irrigation
System
(Ilocos
Norte)
Banaoang
Pump
Irrigation
System
(Ilocos
Sur)
Magat
River
Integrated
Irrigation
System-
Division
2
(Isabela)
Magat
River
Integrated
Irrigation
System-
Division
4
(Isabela)
Solana
Pump
Irrigation
System
(Cagayan)
Magapit
Pump
Irrigation
System
(Cagayan)
Visitacion
Irrigation
System
(Cagayan)
Libmanan-
Cabusao
Pump
Irrigation
System
(Camarines
Sur)
Ambayoan
River
Irrigation
System
(Pangasinan)
Dipalo River
Irrigation
System
(Pangasinan)
Tarlac-San
Miguel
O'Donnell
River
Irrigation
System
(TASMORIS)
Caguray
Irrigation
System
Balayungan
Irrigation
System
Dumacaa
River
Irrigation
System
(Quezon)
Technical Issues
Siltation
Canal related
High operation cost of pump
Control Structure
Flooding
Shortage of Water Supply
Informal Settlers/ Solid
Waste
Water Source
Farm-to-market road
Irrigation Headwork
Others
Machineries & Equipment
Drainage
Salt Intrusion
Calamities/Low Yield
Pest Infestation
Institutional Issues
Implementation of NIA's
Programs
LGU support
ISF Payment
Inadequate Policies or
Ordinances
Organizational
Funds
Registration
Water Theft, Scheduling &
Distribution
NIA Assistance/Support
Training Adaptation/
Competency
Profitability
Converted Area
Collection Efficiency
Problems
Lacking Regulation/Policy
Others:
Participation in Maintenance
Work
Environmental Issues:
Water quality measurements
Low DO levels of 2.7 ppm.
Measured pH values are
greater than 7
High salinity
No water quality data
Sea water intrusion
Salinity
Source: NIS KII and Ocular Inspection, PIDS Irrigation Study team (2015).
Note: For each NIS, 3 Irrigators Associations representing up-, mid-, downstream relative to main canals were interviewed.
For more details, refer to Excel file.

194
Table 30. Summary of Problems Encountered by the Sampled 21 Luzon NIS, 2015
Issues Percentage of Total NIS Sampled (%)
Technical Issues
Siltation 71
Canal related 67
High operation cost of pump 52
Control Structure 38
Flooding 14
Shortage of Water Supply 24
Informal Settlers/ Solid Waste 19
Water Source 38
Farm-to-market road 29
Irrigation Headwork 19
Others 5
Machineries & Equipment 48
Drainage 5
Salt Intrusion 10
Calamities/Low Yield 19
Pest Infestation 14
Institutional Issues
Implementation of NIA's Programs 10
LGU support 5
ISF Payment 24
Inadequate Policies or Ordinances 5
Organizational 5
Funds 10
Registration 10
Water Theft, Scheduling & Distribution 57
NIA Assistance/Support 10
Training Adaptation/ Competency 14
Profitability 29
Converted Area 5
Collection Efficiency Problems 5
Lacking Regulation/Policy 14
Others: 5
Participation in Maintenance Work 5
Environmental Issues
Water quality measurements 5
Low DO levels of 2.7 ppm. 5
Measured pH values are greater than 7 90
High salinity 14
No water quality data 86
Sea water intrusion 5
Salinity 5
Source: NIS KII and Ocular Inspection, PIDS Irrigation Study team (2015).
Note: For each NIS, 3 Irrigators Associations representing up-, mid-, downstream relative to main canals were interviewed.

195
Table 31. Summary of IA responses and rating to technical, institutional, organizational, economic and financial inquiries
Questions Upstream Midstream Downstream
Y N Y N Y N
Does the IA have water permit? 10% 90% 27% 73% 33% 67%
Had there been a complete turnover by NIA to IA? 43% 29% 59% 5% 57% 19%
Is there a MOA regarding the turnover? 81% 0% 64% 18% 76% 14%
Is there regular support from NIA? 57% 0% 73% 0% 71% 5%
Were there IA initiated modifications? 10% 38% 9% 45% 29% 43%
Has the IA undertaken rehabilitation? 14% 33% 5% 50% 24% 38%
Has the IA undertaken restoration? 10% 38% 0% 50% 5% 52%
At present, are there irrigation infrastructures that are not 100% operational? 29% 29% 23% 36% 24% 38%
Are there farms irrigated by supplemental mode (pumps)? 38% 19% 18% 36% 19% 38%
How do IAs decide on water allocation? (Y = quorum; N = GA votes) 52% 24% 59% 14% 48% 10%
Do you practice scheduling or rotational irrigation? 67% 33% 59% 41% 76% 24%
Preferred irrigation flow (Y = upstream-downstream; N = downstream-upstream) 86% 14% 86% 14% 67% 33%
Are there written rules regarding proper behavior of members? 67% 0% 77% 5% 71% 10%
How are decisions made? (Y - quorum; N - GA vote) 43% 38% 64% 14% 57% 24%
Are there provisions in the rule holding water users accountable? 48% 10% 59% 18% 48% 14%
If violated, how is accountability/liability enforced? (Y-penalty; N-sanctions) 38% 0% 45% 14% 43% 10%
Were there actions from local government, water district, NGO, or other
organizations? 0% 100% 0% 100% 5% 95%
Are there provisions in the rule holding officers/BOD accountable? 33% 10% 32% 32% 52% 10%
If conflict arises, are there conflict resolution mechanisms? 38% 24% 41% 32% 62% 14%
Are there legally specified mechanisms for transboundary conflict? 5% 57% 9% 41% 10% 52%
Has the IA received any awards related to operation/performance? 19% 43% 23% 41% 19% 48%
Has the IA availed of financial assistance through government or other agencies? 0.19 0.29 0.23 0.36 0.14 0.52
Are water charges collected? 0.57 0.29 0.5 0.36 0.57 0.33
Are there any incentives for paying on time? 0.33 0.29 0.41 0.36 0.33 0.38
Source: NIS KII

196
COMMUNAL IRRIGATION SYSTEM PROVINCIAL OR IMO TRENDS
To put the CIS institutional and technical assessments of 64 sample cases in perspective, trends in
provincial or IMO data are analyzed. The national CIS trends are used as benchmark (Table 32,
Figure 34).
Figure 34 shows the national trends in CIS performance. Service area has been growing but at a
relatively slow pace while firmed up service area has been closely following. Given the relatively
stable difference between the SA and FUSA, land conversion or growth in permanently non-
restorable area does not appear to be a concern as it peaked at 10% but down to 4% in 2013.
However, the trends in actual irrigated areas during the wet and dry seasons are much lower than
the FUSA and faltered in 2012. In fact, the wet and dry seasons irrigation intensities never reached
the 80% mark and even declined by about 20% in 2012.
The decline in collection efficiency has been steady and substantial from about 70% to just over
40%. The decrease in back account to collectible ratio is even more drastic. And yet, the share of
actual current amortization to total income has been largely reduced indicating amortization
collection has drastically dropped (Table 32). One explanation has to do with the reduction in the
CIS staff due to the RatPlan which started in 2008 and confirmed by the drastic declines in the
ratios of FUSA to plantilla staff even if the daily staff would be added. Another possible
explanation is the remoteness of many CIS and the lack of operating funds which may have limited
the efforts and effectiveness of NIA in collecting. A basic issue is that there is no incentive for
NIA to collect because whether the IAs would pay the amortization or not, the CIS staff are paid
salaries.
The O&M per ha had been declining since late 2000 although appear to be increasing again from
2012 (Figure 35). This pattern appears to be consistent with the observations of poor system
maintenance
Figure 36 shows the regional trends in service area indicating where the developments had been
in the last eight years. Hardly any change can be observed except in two regions – CAR and
Region 1 and region 5 since 2012. Eye catching is the sharp decline in Region 2 which may be
explained by the conversion of many CIS to NIS. Looking at the IMO or Provincial trends, it
looks like the decline in Region 2 is largely happening in Cagayan, followed by Isabela and Nueva
Vizcaya (Figure 37).
The regional trends in O&M and O&M per ha show a telling picture (Figure 38). Except for CAR
& Region 1, Regions 2 and 8, the rest of the regions show declining spending on O&M/ha. Figure
39 shows the trends for the sample IMO-Provinces clearly indicating where O&M spending are
relatively better particularly in Region 2.
Interestingly, irrigation intensities are seen to be increasing in Regions 2 and 9 from 2012 onward,
and generally in Regions 3 and 8 (Figure 40). The sample IMO-Provinces however, show only
Pangasinan and Nueva Ecija as seemingly consistent with the increasing regional patterns in
Regions 2 and 3 (Figure 41).

197
Figure 42 shows which regions show dismal collection efficiencies with below 50% or generally
declining trends. It appears that the Mindanao CIS are doing far better. Among the IMO sample,
Isabela and Nueva Vizcaya are doing better (Figure 43).
Table 32. CIS Performance Ratios of National, 2005 to 2013
Ratios 2005 2006 2007 2008 2009 2010 2011 2012 2013
Filled-up/Plantilla (%) 50 48 48 54 56
FUSA/Filled-up (Ha/staff) 835 842 870 1003 948
FUSA/Filled-up + Daily Staff (Ha/staff) 710 710 734 841 800
FUSA/SA (%) 100 90 96 93 93 91 95 94 96
Ben. Wet/Actual Wet (%) 92 90 84 94 100 98 93 97 97
Ben. Dry/Actual Dry (%) 100 98 97 94 95
CIS Amort./Total Income (%) 16 16 20 19 15 20 21 12 14
Amort. Back/Total Income (%) 10 5 5 2 2
Equipment Rental/Total Income (%) 27 25 18 19 16 17 19 12 11
Equity Payment/Total Income (%) 48 51 50 49 56 48 44 57 58
Total Income (%) 91 92 88 87 96 90 89 84 84
Wet Yield (cavan/ha) 80 80 80 81 33 10
Dry Yield (cavan/ha) 81 80 81 82 18
Sources: NIA-SMD CISPER data, various years.

198
Figure 34. Trends in key performance indicators of CIS, Philippines, 2005-2013
Sources: NIA-SMD CISPER data, various years.

199
Figure 35. Trends in O&M, Amort. Collectible and Amortization Collected, CIS, Philippines,
2005-2013
Sources: CISPER, NIA-SMD, various years.
0
50
100
150
200
250
300
350
2005 2007 2009 2011 2013Year
O & M actual
Amort. collected
Amort. Collectible
P/ha (2000 prices)
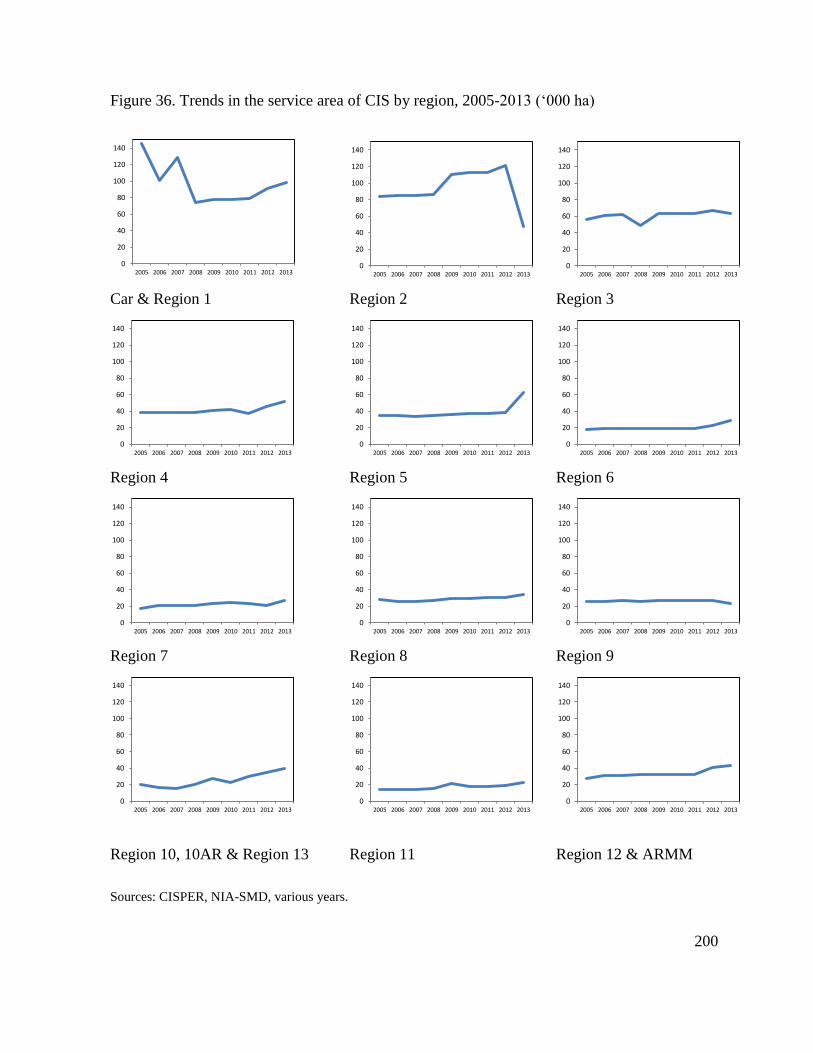
200
Figure 36. Trends in the service area of CIS by region, 2005-2013 (‘000 ha)
Car & Region 1 Region 2 Region 3
Region 4 Region 5 Region 6
Region 7 Region 8 Region 9
Region 10, 10AR & Region 13 Region 11 Region 12 & ARMM
Sources: CISPER, NIA-SMD, various years.
0
20
40
60
80
100
120
140
2005 2006 2007 2008 2009 2010 2011 2012 2013
Thousands
0
20
40
60
80
100
120
140
2005 2006 2007 2008 2009 2010 2011 2012 2013
Thousands
0
20
40
60
80
100
120
140
2005 2006 2007 2008 2009 2010 2011 2012 2013
Thousands
0
20
40
60
80
100
120
140
2005 2006 2007 2008 2009 2010 2011 2012 2013
Thousands
0
20
40
60
80
100
120
140
2005 2006 2007 2008 2009 2010 2011 2012 2013
Thousands
0
20
40
60
80
100
120
140
2005 2006 2007 2008 2009 2010 2011 2012 2013
Thousands
0
20
40
60
80
100
120
140
2005 2006 2007 2008 2009 2010 2011 2012 2013
Thousands
0
20
40
60
80
100
120
140
2005 2006 2007 2008 2009 2010 2011 2012 2013
Thousands
0
20
40
60
80
100
120
140
2005 2006 2007 2008 2009 2010 2011 2012 2013
Thousands
0
20
40
60
80
100
120
140
2005 2006 2007 2008 2009 2010 2011 2012 2013
Thousands
0
20
40
60
80
100
120
140
2005 2006 2007 2008 2009 2010 2011 2012 2013
Thousands
0
20
40
60
80
100
120
140
2005 2006 2007 2008 2009 2010 2011 2012 2013
Thousands

201
Figure 37. Trends in the service area of CIS by IMO-Province, 2005-2013 (‘000 ha)
Benguet Ilocos Norte IMO Pangasinan IMO
Cagayan Isabela IMO Nueva Vizcaya IMO
Pampanga Nueva Ecija Laguna
Occidental Mindoro IMO Camarines Sur IMO
Sources: CISPER, NIA-SMD, various years.
0
20
40
60
80
100
120
140
2005 2006 2007 2008 2009 2010 2011 2012 2013
Thousands
0
20
40
60
80
100
120
140
2005 2006 2007 2008 2009 2010 2011 2012 2013
Thousands
0
20
40
60
80
100
120
140
2005 2006 2007 2008 2009 2010 2011 2012 2013
Thousands
0
20
40
60
80
100
120
140
2005 2006 2007 2008 2009 2010 2011 2012 2013
Thousands
0
20
40
60
80
100
120
140
2005 2006 2007 2008 2009 2010 2011 2012 2013
Thousands
0
20
40
60
80
100
120
140
2005 2006 2007 2008 2009 2010 2011 2012 2013
Thousands
0
20
40
60
80
100
120
140
2005 2006 2007 2008 2009 2010 2011 2012 2013
Thousands
0
20
40
60
80
100
120
140
2005 2006 2007 2008 2009 2010 2011 2012 2013
Thousands
0
20
40
60
80
100
120
140
2005 2006 2007 2008 2009 2010 2011 2012 2013
Thousands
0
20
40
60
80
100
120
140
2005 2006 2007 2008 2009 2010 2011 2012 2013
Thousands
0
20
40
60
80
100
120
140
2005 2006 2007 2008 2009 2010 2011 2012 2013
Thousands

202
Figure 38. Trends in the real O&M, O&M/SA and O&M/FUSA of CIS by region, 2005-2013
(at 2000 prices).
CAR & Region 1 Region 2 Region 3
Region 4 Region 5 Region 6
Region 7 Region 8 Region 9
Region 10, 10AR & 13 Region 11 Region 12 & ARMM
Legend:
Sources: CISPER, NIA-SMD, various years.
-
0.50
1.00
0
10
20
30
40
50
2005 2006 2007 2008 2009 2010 2011 2012 2013
(P million) (P'000)/ha.
-
0.50
1.00
0
10
20
30
40
50
2005 2006 2007 2008 2009 2010 2011 2012 2013
(P million) (P'000)/ha.
-
0.50
1.00
0
10
20
30
40
50
2005 2006 2007 2008 2009 2010 2011 2012 2013
(P million) (P'000)/ha.
-
0.50
1.00
0
10
20
30
40
50
2005 2006 2007 2008 2009 2010 2011 2012 2013
(P million) (P'000)/ha.
-
0.50
1.00
0
10
20
30
40
50
2005 2006 2007 2008 2009 2010 2011 2012 2013
(P million) (P'000)/ha.
-
0.50
1.00
0
10
20
30
40
50
2005 2006 2007 2008 2009 2010 2011 2012 2013
(P million) (P'000)/ha.
-
0.50
1.00
0
10
20
30
40
50
2005 2006 2007 2008 2009 2010 2011 2012 2013
(P million) (P'000)/ha.
-
0.50
1.00
0
10
20
30
40
50
2005 2006 2007 2008 2009 2010 2011 2012 2013
(P million) (P'000)/ha.
-
0.50
1.00
0
10
20
30
40
50
2005 2006 2007 2008 2009 2010 2011 2012 2013
(P million) (P'000)/ha.
-
0.50
1.00
0
10
20
30
40
50
2005 2006 2007 2008 2009 2010 2011 2012 2013
(P million) (P'000)/ha.
-
0.50
1.00
0
10
20
30
40
50
2005 2006 2007 2008 2009 2010 2011 2012 2013
(P million) (P'000)/ha.
-
0.50
1.00
0
10
20
30
40
50
2005 2006 2007 2008 2009 2010 2011 2012 2013
(P million) (P'000)/ha.
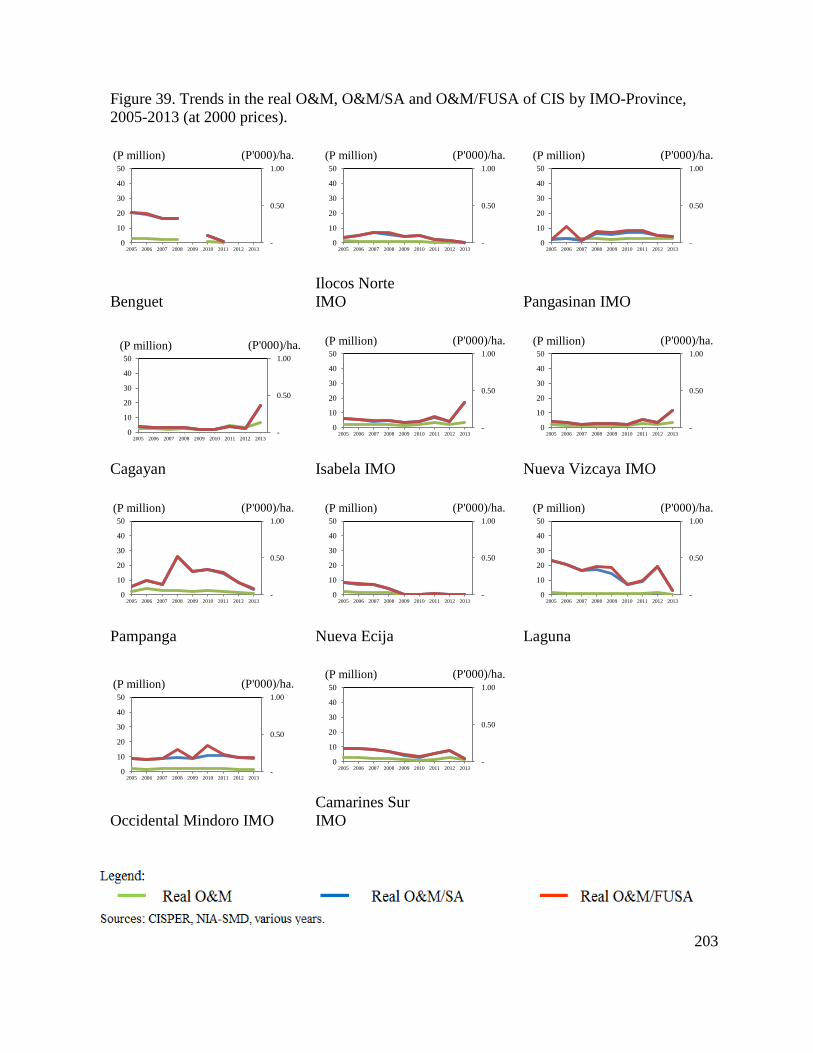
203
Figure 39. Trends in the real O&M, O&M/SA and O&M/FUSA of CIS by IMO-Province,
2005-2013 (at 2000 prices).
Benguet
Ilocos Norte
IMO Pangasinan IMO
Cagayan Isabela IMO Nueva Vizcaya IMO
Pampanga Nueva Ecija Laguna
Occidental Mindoro IMO
Camarines Sur
IMO
-
0.50
1.00
0
10
20
30
40
50
2005 2006 2007 2008 2009 2010 2011 2012 2013
(P million) (P'000)/ha.
-
0.50
1.00
0
10
20
30
40
50
2005 2006 2007 2008 2009 2010 2011 2012 2013
(P million) (P'000)/ha.
-
0.50
1.00
0
10
20
30
40
50
2005 2006 2007 2008 2009 2010 2011 2012 2013
(P million) (P'000)/ha.
-
0.50
1.00
0
10
20
30
40
50
2005 2006 2007 2008 2009 2010 2011 2012 2013
(P million) (P'000)/ha.
-
0.50
1.00
0
10
20
30
40
50
2005 2006 2007 2008 2009 2010 2011 2012 2013
(P million) (P'000)/ha.
-
0.50
1.00
0
10
20
30
40
50
2005 2006 2007 2008 2009 2010 2011 2012 2013
(P million) (P'000)/ha.
-
0.50
1.00
0
10
20
30
40
50
2005 2006 2007 2008 2009 2010 2011 2012 2013
(P million) (P'000)/ha.
-
0.50
1.00
0
10
20
30
40
50
2005 2006 2007 2008 2009 2010 2011 2012 2013
(P million) (P'000)/ha.
-
0.50
1.00
0
10
20
30
40
50
2005 2006 2007 2008 2009 2010 2011 2012 2013
(P million) (P'000)/ha.
-
0.50
1.00
0
10
20
30
40
50
2005 2006 2007 2008 2009 2010 2011 2012 2013
(P million) (P'000)/ha.
-
0.50
1.00
0
10
20
30
40
50
2005 2006 2007 2008 2009 2010 2011 2012 2013
(P million) (P'000)/ha.

204
Figure 40. Trends in irrigation intensities of CIS by region, 2005-
2013.
CAR & Region 1 Region 2 Region 3
Region 4 Region 5 Region 6
Region 7 Region 8 Region 9
Region 10, 10AR & 13 Region 11 Region 12 & ARMM
0
50
100
2005 2006 2007 2008 2009 2010 2011 2012 2013
(%)
0
50
100
2005 2006 2007 2008 2009 2010 2011 2012 2013
(%)
0
50
100
2005 2006 2007 2008 2009 2010 2011 2012 2013
(%)
0
50
100
2005 2006 2007 2008 2009 2010 2011 2012 2013
(%)
0
50
100
2005 2006 2007 2008 2009 2010 2011 2012 2013
(%)
0
50
100
2005 2006 2007 2008 2009 2010 2011 2012 2013
(%)
0
50
100
2005 2006 2007 2008 2009 2010 2011 2012 2013
(%)
0
50
100
2005 2006 2007 2008 2009 2010 2011 2012 2013
(%)
0
50
100
2005 2006 2007 2008 2009 2010 2011 2012 2013
(%)
0
50
100
2005 2006 2007 2008 2009 2010 2011 2012 2013
(%)
0
50
100
2005 2006 2007 2008 2009 2010 2011 2012 2013
(%)
0
50
100
2005 2006 2007 2008 2009 2010 2011 2012 2013
(%)
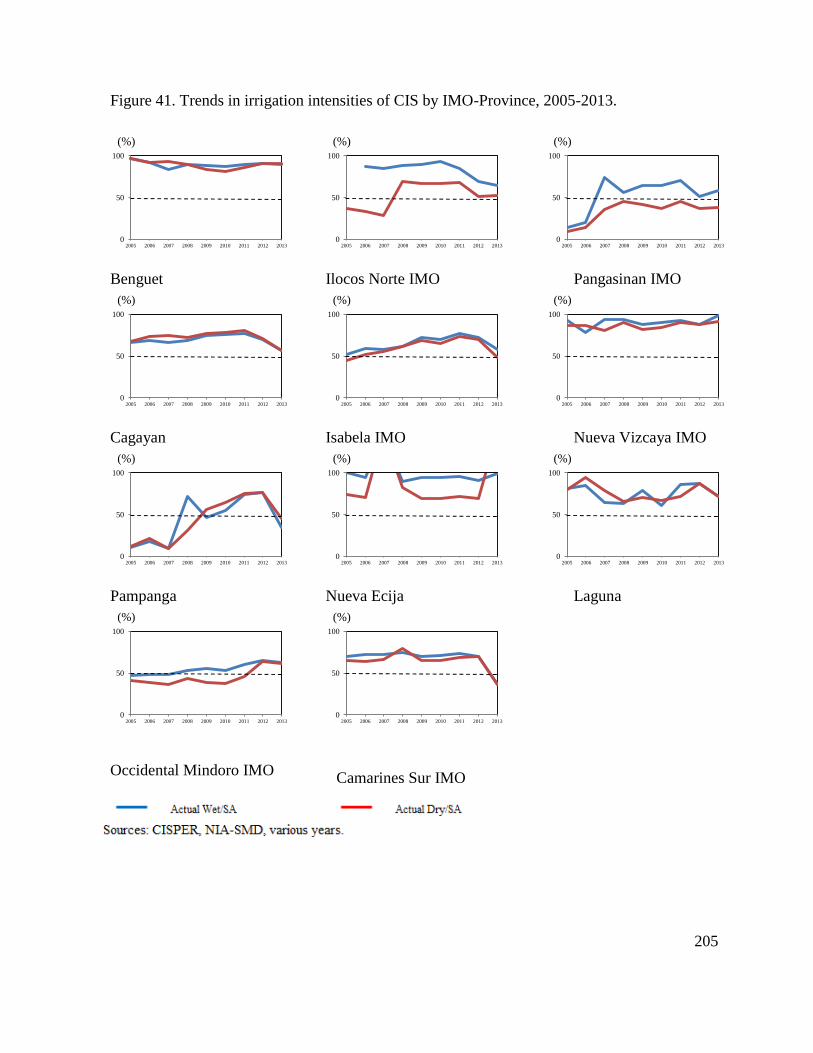
205
Figure 41. Trends in irrigation intensities of CIS by IMO-Province, 2005-2013.
Benguet Ilocos Norte IMO Pangasinan IMO
Cagayan Isabela IMO Nueva Vizcaya IMO
Pampanga Nueva Ecija Laguna
Occidental Mindoro IMO
Camarines Sur IMO
0
50
100
2005 2006 2007 2008 2009 2010 2011 2012 2013
(%)
0
50
100
2005 2006 2007 2008 2009 2010 2011 2012 2013
(%)
0
50
100
2005 2006 2007 2008 2009 2010 2011 2012 2013
(%)
0
50
100
2005 2006 2007 2008 2009 2010 2011 2012 2013
(%)
0
50
100
2005 2006 2007 2008 2009 2010 2011 2012 2013
(%)
0
50
100
2005 2006 2007 2008 2009 2010 2011 2012 2013
(%)
0
50
100
2005 2006 2007 2008 2009 2010 2011 2012 2013
(%)
0
50
100
2005 2006 2007 2008 2009 2010 2011 2012 2013
(%)
0
50
100
2005 2006 2007 2008 2009 2010 2011 2012 2013
(%)
0
50
100
2005 2006 2007 2008 2009 2010 2011 2012 2013
(%)
0
50
100
2005 2006 2007 2008 2009 2010 2011 2012 2013
(%)

206
Figure 42. Trends in collection efficiency of CIS by region, 2005-
2013.
CAR & Region 1 Region 2 Region 3
Region 4 Region 5 Region 6
Region 7 Region 8 Region 9
Region 10, 10AR & 13 Region 11 Region 12 & ARMM
Sources: CISPER, NIA-SMD, various years.
0
50
100
2005 2006 2007 2008 2009 2010 2011 2012 2013
(%)
0
50
100
2005 2006 2007 2008 2009 2010 2011 2012 2013
(%)
0
50
100
2005 2006 2007 2008 2009 2010 2011 2012 2013
(%)
0
50
100
2005 2006 2007 2008 2009 2010 2011 2012 2013
(%)
0
50
100
2005 2006 2007 2008 2009 2010 2011 2012 2013
(%)
0
50
100
2005 2006 2007 2008 2009 2010 2011 2012 2013
(%)
0
50
100
2005 2006 2007 2008 2009 2010 2011 2012 2013
(%)
0
50
100
2005 2006 2007 2008 2009 2010 2011 2012 2013
(%)
0
50
100
2005 2006 2007 2008 2009 2010 2011 2012 2013
(%)
0
50
100
2005 2006 2007 2008 2009 2010 2011 2012 2013
(%)
0
50
100
2005 2006 2007 2008 2009 2010 2011 2012 2013
(%)
0
50
100
2005 2006 2007 2008 2009 2010 2011 2012 2013
(%)
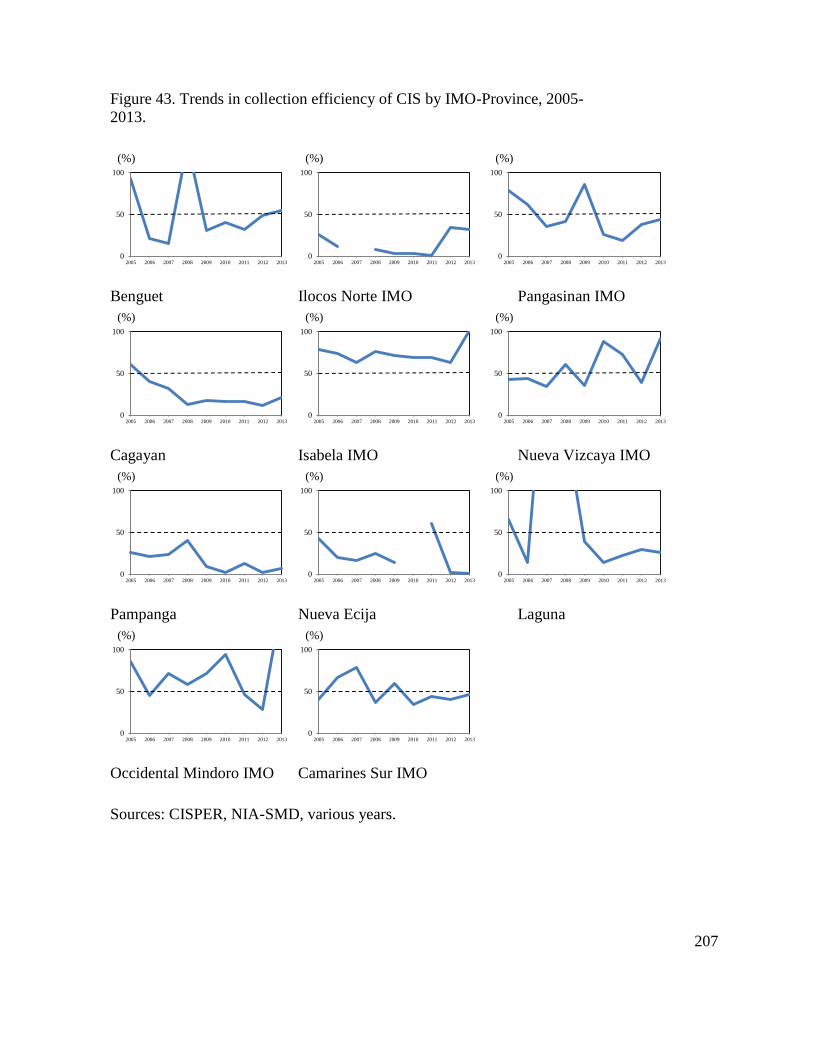
207
Figure 43. Trends in collection efficiency of CIS by IMO-Province, 2005-
2013.
Benguet Ilocos Norte IMO Pangasinan IMO
Cagayan Isabela IMO Nueva Vizcaya IMO
Pampanga Nueva Ecija Laguna
Occidental Mindoro IMO Camarines Sur IMO
Sources: CISPER, NIA-SMD, various years.
0
50
100
2005 2006 2007 2008 2009 2010 2011 2012 2013
(%)
0
50
100
2005 2006 2007 2008 2009 2010 2011 2012 2013
(%)
0
50
100
2005 2006 2007 2008 2009 2010 2011 2012 2013
(%)
0
50
100
2005 2006 2007 2008 2009 2010 2011 2012 2013
(%)
0
50
100
2005 2006 2007 2008 2009 2010 2011 2012 2013
(%)
0
50
100
2005 2006 2007 2008 2009 2010 2011 2012 2013
(%)
0
50
100
2005 2006 2007 2008 2009 2010 2011 2012 2013
(%)
0
50
100
2005 2006 2007 2008 2009 2010 2011 2012 2013
(%)
0
50
100
2005 2006 2007 2008 2009 2010 2011 2012 2013
(%)
0
50
100
2005 2006 2007 2008 2009 2010 2011 2012 2013
(%)
0
50
100
2005 2006 2007 2008 2009 2010 2011 2012 2013
(%)

208
CAR
Benguet (part of Abra, Benguet-Ifugao-Mt. Province IMO)
Both service area and irrigated area had increasing pattern (Figure 44). While the ratio of total
amortization to total income has a slightly increasing trend, total collection to collectibles and
collection efficiency have no clear trend (Table 33). There is a small gap between and the irrigated
areas in both wet and dry seasons. Minimal fluctuations are also observed between the ratios of
benefited areas to irrigated areas. O&M cost per SA has a declining trend. In contrast, the viability
index has been increasing over time. Cropping intensities have been showing nominal increases
from 2012. .
In 2012, the coverage per plantilla jumped from 350 has. per staff in 2011 to 573 has. (Table 33).
But, despite this increase, the coverage per staff is still better compared to other systems.
There is just a small gap between irrigated areas across the years reaching only 9% during wet
season and 18% during dry season. This gap is mainly due defective facilities and inadequate water
supply.
An average 62% of the total income over the years comes from equity. This is followed by
equipment rental at 26% and then, amortization at 9%. Cropping intensity followed a stable trend.
Viability generally had an upward trend.

209
Figure 44. Trends in key performance indicators, Benguet, CAR, 2005-2013
Sources: NIA-SMD CISPER data, various years

210
Table 33. CIS Performance Ratios of Benguet, 2005 to 2013
Ratios 2005 2006 2007 2008 2009 2010 2011 2012 2013
Filled-up/Plantilla (%) 63 63 63 100 100
FUSA/Filled-up (Ha/staff) 580 578 583 8,597 9,271
FUSA/Filled-up + Daily Staff (Ha/staff) 348 347 350 573 618
FUSA/SA (%) 100 97 100 100 100 100 100 99 99
Ben. Wet/Actual Wet (%) 100 100 112 100 100 100 100 100 100
Ben. Dry/Actual Dry (%) 100 100 100 100 100
CIS Amort./Total Income (%) 2 2 2 5 8 11 21 9 17
Amort. Back/Total Income (%)
Equipment Rental/Total Income (%) 19 9 8 13 17 34 47 59 25
Equity Payment/Total Income (%) 74 85 87 76 69 50 31 32 57
Total Income (%) 95 96 97 94 94 95 99 100 99
Wet Yield (cavan/ha) 82 82 80 82 78
Dry Yield (cavan/ha) 86 83 81 82 80
Sources: NIA-SMD CISPER data, various years.
Region 1 Ilocos Ilocos Norte IMO
Figure 45 shows that Ilocos Norte’s CIS service area dropped from 20,111 ha in 2005 to 7,124 ha
in 2007 with FUSA following the same trend (Figure 30). But after 2007, it slightly increased. The
gap between FUSA and the irrigated area is mainly due to lack of water supply especially during
dry season. Amortization payments and collection efficiency have downward trends from 2006 to
2011 but started increasing in the later years. The cropping intensity and viability index generally
have an increasing trend over the years.
Even if the filled-up plantilla positions are augmented by the daily staff, 76% of the plantilla
positions are not yet filled up Table 34). One major reason for this is for cost reduction of overhead
but this would result in a large coverage per staff of about 1,000 ha.

211
Figure 45. Trends in key performance indicators, Ilocos Norte IMO, Region 1, 2005-2013
Sources: NIA-SMD CISPER data, various years.

212
During wet season, the gap between irrigated area and FUSA ranges from 1% to 23%, while during
dry season, the gap is bigger ranging from 22% to 71%. This gap is mainly due to lack of water
supply in the dry season.
Majority of the total income comes from equity reaching up to 74% followed by CIS back
amortization ranging from 5% to 85% and then, CIS current amortization ranging from 2% to 30%.
The equity scheme had been chosen by the IAs because they received financial support from
LGUs. Viability and cropping intensity generally have an upward trend.
Table 34. CIS Performance Ratios of Ilocos Norte IMO, 2005 to 2013
Ratios 2005 2006 2007 2008 2009 2010 2011 2012 2013
Filled-up/Plantilla (%) 21 21 21
21
21
FUSA/Filled-up (Ha/staff) 1,316 1,286 1,286 1,223 1,379
FUSA/Filled-up + Daily Staff (Ha/staff) 1,128 1,102 1,102 1,048 1,182
FUSA/SA (%) 100 100 100 89 96 94 94 82 84
Ben. Wet/Actual Wet (%) 38 33 79 100 100 100 100 100
Ben. Dry/Actual Dry (%) 100 100 100 100 100
CIS Amort./Total Income (%) 30 8 4 2 8 2 27 19
Amort. Back/Total Income (%) 25 15 85 21 26 34 30 14 5
Equipment Rental/Total Income (%) 1 5 10 8 1 19 2
Equity Payment/Total Income (%) 44 71 13 71 60 50 67 39 74
Total Income (%) 100 99 98 96 98 100 100 99 100
Wet Yield (cavan/ha) 80 79 80 83
Dry Yield (cavan/ha) 82 81 80 85
Sources: NIA-SMD CISPER data, various years.
Pangasinan IMO
Pangasinan’s CIS service area dropped from 79,398 has. in 2005 to 21,854 ha in 2008 with FUSA
following the same trend (Figure 46). But, it has a slightly increasing trend in the later years. There
a big gap between FUSA and the irrigated area. This is probably due to lack of water supply
especially during dry season where the gap almost tripled. Amortization payments and collection
efficiency have a downward trend. Despite few dips, cropping intensities more or less moved at
the same level. However, viability index generally have an upward trend over the years.

213
Even if the filled-up plantilla positions are augmented by the daily staff, the coverage per staff for
CIS only is about 1,016 ha (Table 35). This is relatively big coverage per staff and without
necessary resources the staff may not be able to properly cover their assigned area.
During wet season the gap between irrigated area and FUSA ranges from 19% to 85%. While
during dry season, the gap is even bigger ranging from 46% to 90%. This gap is mainly due to lack
of water supply.
About 64% to 90% of the total income comes from equity while 6% to 21% comes from
amortization. Viability is not affected by the decreasing trend of amortization due to the increasing
trend of equity generated.

214
Figure 46. Trends in key performance indicators, Pangasinan IMO, Region 1, 2005-2013
Sources: NIA-SMD CISPER data, various years.

215
Table 35. CIS Performance Ratios of Pangasinan IMO, 2005 to 2013
Ratios 2005 2006 2007 2008 2009 2010 2011 2012 2013
Filled-up/Plantilla (%) 57 57 57 57 57
FUSA/Filled-up (Ha/staff) 1,112 1,112 1,112 1,689 1,734
FUSA/Filled-up + Daily Staff (Ha/staff) 652 652 652 990 1016
FUSA/SA (%) 100 28 100 83 87 87 87 100 100
Ben. Wet/Actual Wet (%) 67 74 48 80 100 100 100 100 100
Ben. Dry/Actual Dry (%) 100 100 100 100 100
CIS Amort./Total Income (%) 16 20 6 16 21 10 7 9 9
Amort. Back/Total Income (%) 3 8 1 3 2 1
Equipment Rental/Total Income (%) 10 8 3 8 5 4 4 2 12
Equity Payment/Total Income (%) 70 69 90 64 72 76 86 70 78
Total Income (%) 99 97 99 96 99 93 99 82 99
Wet Yield (cavan/ha) 88 79 82 82
Dry Yield (cavan/ha) 93 80 82 85
Sources: NIA-SMD CISPER data, various years.
Region 2 Cagayan Valley
Cagayan (Cagayan-Batanes IMO)
With minimal data, no clear trend can be seen on the Cagayan province CIS. But, the service area
and actual irrigated area appeared to have increasing trends. Notable is the large gap between
actual irrigated area and FUSA (Figure 47). This gap reached up to 34% in 2005 and is likely due
to inadequate and/or defective facilities aggravated by lack of water supply. The ratios of
collections and collection efficiency appeared to have a downward trend. Cropping intensity on
the other hand, seems stable while the viability index is decreasing (Table 36).
Almost half of the income of the province is derived from amortization and the other half from
equity payments.

216
Figure 47. Trends in key performance indicators, Cagayan (Cagayan-Batanes IMO), Region 2,
2005-2013
Sources: NIA-SMD CISPER data, various years.
Note: Data from 2009 to 2013 are combined data of Cagayan and Batanes Provinces

217
Table 36. CIS Performance Ratios of Cagayan (Cagayan-Batanes IMO), 2005 to2013
Ratios 2005 2006 2007 2008 2009 2010 2011 2012 2013
Filled-up/Plantilla (%)
FUSA/Filled-up (Ha/staff)
FUSA/Filled-up + Daily Staff (Ha/staff)
FUSA/SA (%) 100 100 100 100
Ben. Wet/Actual Wet (%) 101 106 113 104
Ben. Dry/Actual Dry (%)
CIS Amort./Total Income (%) 49 27 46 23
Amort. Back/Total Income (%) 42
Equipment Rental/Total Income (%) 3 6 23 1
Equity Payment/Total Income (%) 47 54 17 29
Total Income (%) 99 87 86 95
Wet Yield (cavan/ha) 82 81 81 82
Dry Yield (cavan/ha) 82 83 82 84
Sources: NIA-SMD CISPER data, various years.
Isabela IMO
Isabela CIS service area and irrigated area both had the same increasing trend across the years but
dropped significantly in 2013 (Figure 48). It is interesting to note that as the SA drooped in 2013
O&M cost reached its peak. This drop is probably due to defective facilities like silted canals and
lack of water supply. The ratios of total collections to collectibles, amortization to total income,
collection efficiency and back amortization to collectibles had no clear trends. Over the years,
cropping intensity increased to 200% despite dips in various years. The viability index, on the
other hand, recovered at a lower index after it decreased in 2011 and 2012.
About 79% of the plantilla positions are not filled up yet as of 2013 (Table 37). But with the
reduction of FUSA by more than half in 2013, the coverage per staff was also reduced from 3,643
ha to 1,464 ha. Yet even with this reduction, the coverage per staff is still large which consequently
could result in a poor service.
The gap between irrigated area and FUSA reached 48% in wet season and 55% in dry season. This
gap is likely due to defective facilities and/or lack of water supply.
The income consisted of equity collections followed by amortization and then, equipment rental.
Cropping intensity generally moved toward 200% in spite of drops in various. Viability index,
however, followed a declining trend with significant dips in 2011 and 2012.

218
Figure 48. Trends in key performance indicators, Isabela IMO, Region 2, 2005-2013
Sources: NIA-SMD CISPER data, various years

219
Table 37. CIS Performance Ratios of Isabela IMO, 2005 to2013
Ratios 2005 2006 2007 2008 2009 2010 2011 2012 2013
Filled-up/Plantilla (%) 42 21 21 21 21
FUSA/Filled-up (Ha/staff) 1,636 3,428 3,271 3,643 1,464
FUSA/Filled-up + Daily Staff (Ha/staff) 1,636 3,428 3,271 3,643 1,464
FUSA/SA (%) 100 100 97 100 100 100 95 100 99
Ben. Wet/Actual Wet (%) 85 96 97 102 100 94 89 35 100
Ben. Dry/Actual Dry (%) 100 89 100 100 100
CIS Amort./Total Income (%) 24 24 26 30 21 27 31 47 18
Amort. Back/Total Income (%) 1 1 8 9 5 3 14
Equipment Rental/Total Income (%) 27 26 6 17 12 21 29 21 21
Equity Payment/Total Income (%) 47 47 64 44 56 44 35 19 16
Total Income (%) 98 98 97 99 98 97 98 87 69
Wet Yield (cavan/ha) 79 80 82 82 77 75 75 75
Dry Yield (cavan/ha) 81 81 83 82 88 85 85 85
Sources: NIA-SMD CISPER data, various years.
Nueva Vizcaya IMO
Nueva Vizcaya IMO’s service area and irrigated area slightly increased over the years but dropped
significantly below 15,000 ha in 2013 (Figure 49). Inadequate water supply and defective
facilities is the probable cause of the gap between irrigated area and FUSA. Amortization payments
and collection efficiency generally have increasing trend over the years. The share of total
amortization to total income dropped to 18% in 2013. This might be due to maintenance work
since equipment rental peaked at 71% in the same year. The cropping intensities followed
stabilized pattern in the later years with a slightly increasing trend. While viability index, on the
other hand, fluctuated and seemed to have a downward trend.
Sixty-nine percent (69%) of the plantilla positions are not filled up yet (Table 38). With the
reduction of FUSA by almost half in 2013, the coverage per staff was also reduced from 3,446 ha
to 1,760 has. But, even with this reduction, the coverage per staff is still large that would
consequently affect the quality of serve.
The gap between irrigated area and FUSA during both wet and dry season reached 22% and 19%,
respectively. Defective and inadequate facilities coupled with lack of water supply are likely the
reasons for this gap.
In the later years, majority of the farmers opted to pay amortization with the decrease of equity
payments. Cropping intensities slightly fluctuated over the years while viability has a declining
trend.

220
Figure 49. Trends in key performance indicators, Nueva Vizcaya IMO, Region 2, 2005-2013
Sources: NIA-SMD CISPER data, various years

221
Table 38. CIS Performance Ratios of Nueva Vizcaya IMO, 2005 to2013
Ratios 2005 2006 2007 2008 2009 2010 2011 2012 2013
Filled-up/Plantilla (%) 42 31 31 31 31
FUSA/Filled-up (Ha/staff) 2,506 3,447 3,446 3,446 1,760
FUSA/Filled-up + Daily Staff (Ha/staff) 2,506 3,447 3,446 3,446 1,760
FUSA/SA (%) 100 100 100 100 100 100 100 100 100
Ben. Wet/Actual Wet (%) 94 112 86 96 100 97 71 26 93
Ben. Dry/Actual Dry (%) 100 93 100 100 100
CIS Amort./Total Income (%) 20 18 28 66 11 33 54 50 18
Amort. Back/Total Income (%) 7 12 1 1
Equipment Rental/Total Income (%) 24 9 54 43 1 1 71
Equity Payment/Total Income (%) 79 81 19 14 22 20 39 29 2
Total Income (%) 99 99 71 96 99 97 94 80 92
Wet Yield (cavan/ha) 81 81 83 82 79 85 85 85
Dry Yield (cavan/ha) 80 81 85 83 85 90 90 90
Sources: NIA-SMD CISPER data, various years.
Region 3 Central Luzon
Pampanga (Pampanga-Bataan IMO) Pampanga’s CIS service area drastically dropped in 2008 as O&M/ha reached its peak due to a
major O&M work (Figure 50). But, it gradually recovered over the years. The irrigated area is
also increased reaching above 5,000 has. Many opted to pay equity reaching more than 50% of
total income from 2008 up to 2010. Cropping intensities fluctuated across the years but generally
had an upward trend. Viability index, on the other hand, did not improve over the years due to
declining collection rate.
Table 39 shows that only 43% of plantilla positions are filled up due to lack of funds or lack of
qualified applicants but probably more of the first. On average, each staff covers a bigger service
area of about 398 ha. This is relatively a big coverage and without the necessary resources, NIA
will be likely unable to deliver the expected service.
Although the irrigated area is increasing over time, there is still about 62% gap between irrigated
wet and FUSA (Firmed-up Service Area) and about 50% between irrigated dry and FUSA in 2013.
The difference in gap might be due to defective or inadequate facilities like lack of drainage.
CIS current amortization ranged from 1% to 31% of the total income while the CIS back
amortization ranged between 3% and 32%. There is a big decline in amortization collection
efficiency from 26% in 2005 to only 7% in 2013.

222
Figure 50. Trends in key performance indicators, Pampanga (PAMBAT IMO), Region 3, 2005-
2013
Sources: NIA-SMD CISPER data, various years.

223
Table 39. CIS Performance Ratios of Pampanga (PAMBAT IMO), 2005 to 2013
Ratios 2005 2006 2007 2008 2009 2010 2011 2012 2013
Filled-up/Plantilla (%) 43 43 43 43 43
FUSA/Filled-up (Ha/staff) 214 214 214 235 398
FUSA/Filled-up + Daily Staff (Ha/staff)
FUSA/SA (%) 100 100 100 98 100 100 98 100 90
Ben. Wet/Actual Wet (%) 117 125 100 44 100 100 100 95
Ben. Dry/Actual Dry (%) 100 100 100 100 100
CIS Amort./Total Income (%) 15 29 21 31 4 1 19 5 18
Amort. Back/Total Income (%) 13 12 3 16 32 32
Equipment Rental/Total Income (%) 35 3 5 7 1
Equity Payment/Total Income (%) 23 21 26 56 63 55 21 12 25
Total Income (%) 73 53 52 100 79 66 56 50 75
Wet Yield (cavan/ha) 82 80 82 80
Dry Yield (cavan/ha) 83 82 85 80
Sources: NIA-SMD CISPER data, various years.
Nueva Ecija (Bulacan-Aurora-Nueva Ecija IMO)
Nueva Ecija’s CIS service area almost doubled its size in 2012 but dropped back in 2013 (Figure
51). But, it gradually recovered over the years. The irrigated areas during wet season almost have
the same areas as FUSA. But during dry season in 2008 to 2012, it falls down. The share of CIS
current amortization to the total income is very minimal with a decreasing collection rate in the
later years. Despite fluctuations, cropping intensities move smoothly between 2008 and 2012.
Viability index generally increased over the years.
About 56% of plantilla positions are not filled up yet might be due to lack of funds or lack of
qualified applicants but probably more of the first (Table 40). Aside from the NIS coverage of
NIA staff, about 586 has. more for CIS is added to the staff’s responsibility. This is relatively big
coverage per staff and without necessary resources the staff may not be able to properly cover their
assigned area.
More areas are irrigated during wet season by up to 37% more. This is mainly due to lesser
available water during dry season.
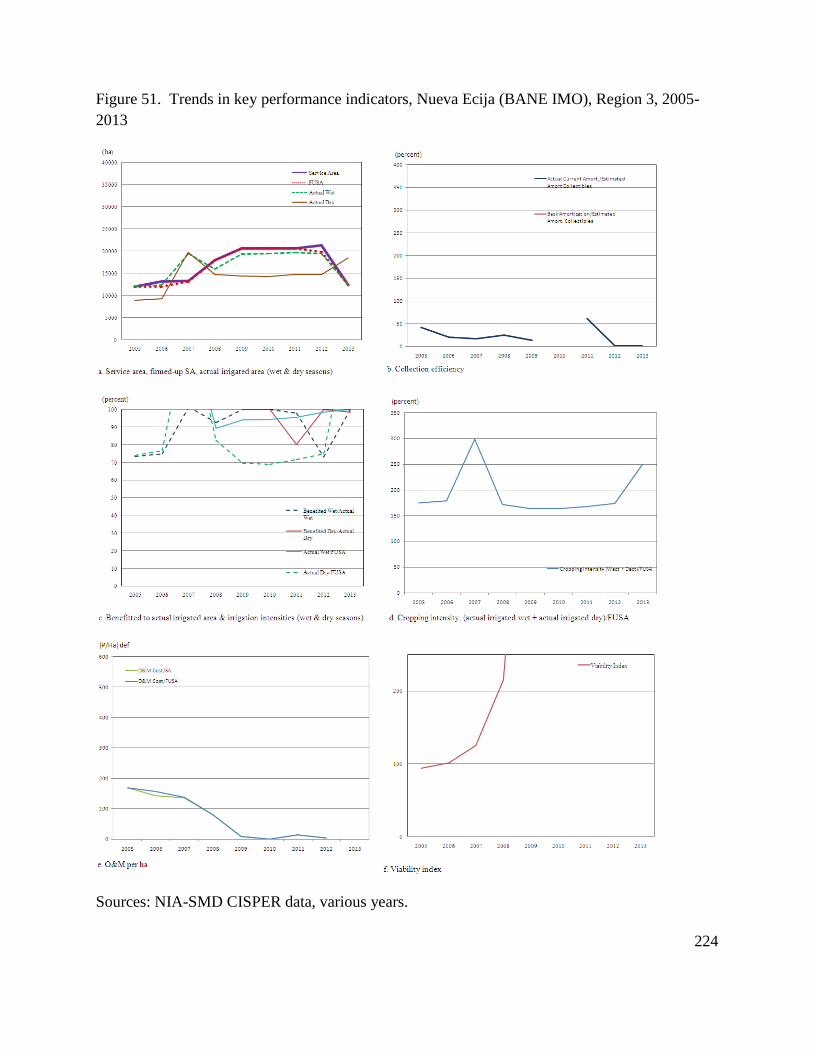
224
Figure 51. Trends in key performance indicators, Nueva Ecija (BANE IMO), Region 3, 2005-
2013
Sources: NIA-SMD CISPER data, various years.

225
Table 40. CIS Performance Ratios of Nueva Ecija (BANE IMO), 2005 to2013 Ratios 2005 2006 2007 2008 2009 2010 2011 2012 2013
Filled-up/Plantilla (%) 44 44 44 44 44
FUSA/Filled-up (Ha/staff) 1371 1371 1371 1314 820
FUSA/Filled-up + Daily Staff (Ha/staff) 980 980 980 938 586
FUSA/SA (%) 100 92 99 100 100 100 100 93 100
Ben. Wet/Actual Wet (%) 73 75 102 93 100 100 98 73 100
Ben. Dry/Actual Dry (%) 100 100 80 100 98
CIS Amort./Total Income (%) 5 3 3 2 3 1 2 1 2
Amort. Back/Total Income (%)
Equipment Rental/Total Income (%) 23 26 9 22 23
Equity Payment/Total Income (%) 68 71 88 76 73 99 97 98 98
Total Income (%) 96 100 100 100 99 100 99 99 100
Wet Yield (cavan/ha) 80 81 82 82
Dry Yield (cavan/ha) 82 82 85 82
Sources: NIA-SMD CISPER data, various years.
Majority of the systems in Nueva Ecija opted to pay equity ranging from 68% to 99% of total
income while CIS current amortization only ranged from 1% to 5% of the total income. There is a
big decline in amortization collection efficiency from 20% in 2005 to only 1% in 2013.
Region 4A CALABARZON
Laguna (Laguna-Rizal IMO)
The service area and irrigated area of Laguna-Rizal CIS exhibited an upward trend over the years
(Figure 52). There is little gap between FUSA, SA and the irrigated area probably owing to
sufficient water supply of the system. Ratios of amortization payments, collections and collection
efficiency peaked between 2007 and 2008 with the drastic reduction of the estimated amortization
collectible. Cropping intensities fluctuated through the years but moved towards increasing values
in the later years. Viability index had a slight increasing trend over the years.
The filled-up plantilla is only 42%. But, in spite of this, the coverage area per staff has a fairly
good ratio of only 475 ha (Table 41)
The ratios of benefited area to irrigated area during wet season are generally lower compared to
dry season ratios. This is probably due occurrence of calamities and flooding during wet season.

226

227
Figure 52. Trends in key performance indicators, Laguna (Laguna-Rizal IMO), Region 4, 2005-
2013
Sources: NIA-SMD CISPER data, various years.

228
Table 41. CIS Performance Ratios of Laguna (Laguna-Rizal IMO), 2005 to 2013
Ratios 2005 2006 2007 2008 2009 2010 2011 2012 2013
Filled-up/Plantilla (%) 42 42 42
FUSA/Filled-up (Ha/staff) 358 475 475
FUSA/Filled-up + Daily Staff (Ha/staff) 358 475 475
FUSA/SA (%) 100 100 100 88 80 100 98 100 81
Ben. Wet/Actual Wet (%) 98 110 122 104 100 83 78 61 68
Ben. Dry/Actual Dry (%) 100 91 99 100 90
CIS Amort./Total Income (%) 23 9 15 20 17 8 9 27 43
Amort. Back/Total Income (%) 73 15 3 19 24
Equipment Rental/Total Income (%) 63 36 41 25 49 3
Equity Payment/Total Income (%) 4 76 18 26 19 10 15 53
Total Income (%) 100 100 99 101 101 43 73 30 96
Wet Yield (cavan/ha) 81 80 80 81
Dry Yield (cavan/ha) 83 81 82 84
Sources: NIA-SMD CISPER data, various years.
The total income comes from equity averaging 25% across the years followed by equipment rental
at 24%, CIS current amortization at 19% and then, equipment rental at 15%. Viability index dipped
in 2012 but generally have an upward trend.
Region 4B MIMAROPA
Occidental Mindoro IMO
Occidental Mindoro CIS service area has more or less stable movement over the years as well as
its irrigated area. FUSA, on the other hand, fluctuated with dips in 2008 and 2010 (Figure 53).
The gap between FUSA and the irrigated area is probably due to lack of water supply and defective
facilities. Share of amortization to total income dropped as equity payments increased. Collection
efficiency fluctuated across the years reaching its peak in 2013. O&M cost per SA and FUSA had
moved in a stable pattern over the years. The ratios of benefited area to irrigated area generally
have an upward trend. The upward trend is observed with both cropping intensities and viability
index.
In 2012, 88% of the plantilla positions are filled up, reducing the coverage per staff (Table 42).
But even with the reduction, the 610 ha per staff in 2013 is still a relatively large area to cover
considering distance and remoteness of some CIS and limited resources to support IDO activities.

229

230
Figure 53. Trends in key performance indicators, Occidental Mindoro IMO, Region 4, 2005-
2013
Sources: NIA-SMD CISPER data, various years
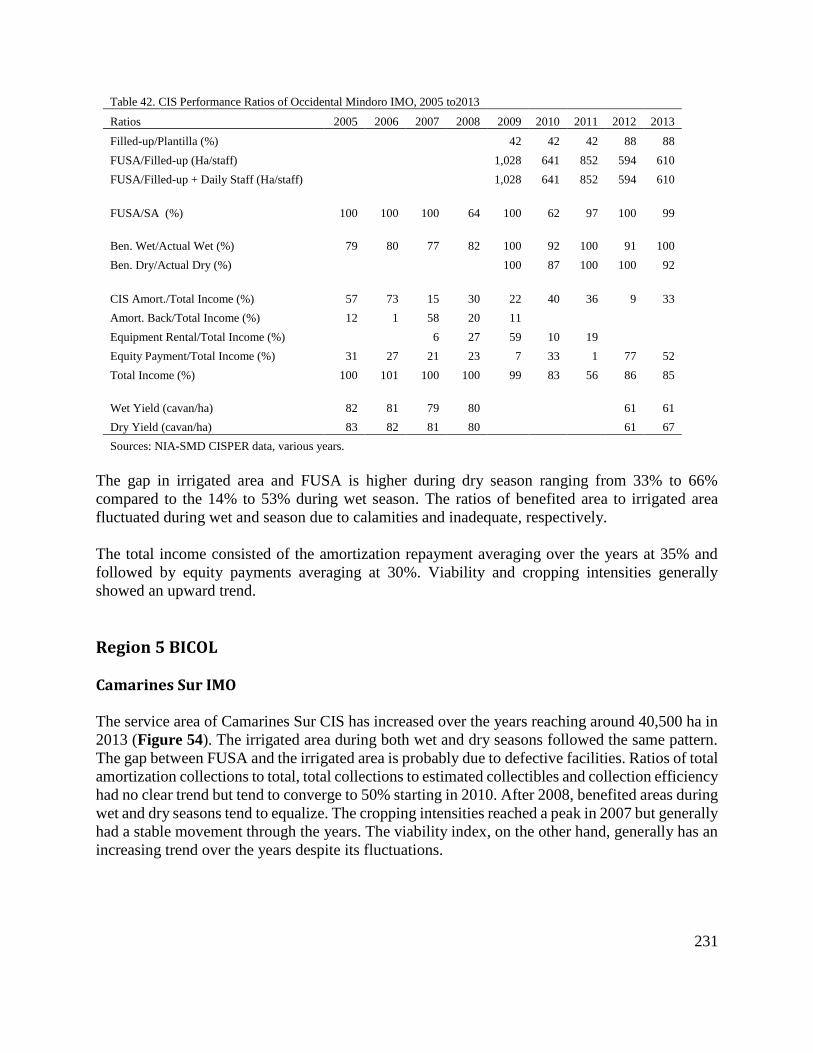
231
Table 42. CIS Performance Ratios of Occidental Mindoro IMO, 2005 to2013
Ratios 2005 2006 2007 2008 2009 2010 2011 2012 2013
Filled-up/Plantilla (%) 42 42 42 88 88
FUSA/Filled-up (Ha/staff) 1,028 641 852 594 610
FUSA/Filled-up + Daily Staff (Ha/staff) 1,028 641 852 594 610
FUSA/SA (%) 100 100 100 64 100 62 97 100 99
Ben. Wet/Actual Wet (%) 79 80 77 82 100 92 100 91 100
Ben. Dry/Actual Dry (%) 100 87 100 100 92
CIS Amort./Total Income (%) 57 73 15 30 22 40 36 9 33
Amort. Back/Total Income (%) 12 1 58 20 11
Equipment Rental/Total Income (%) 6 27 59 10 19
Equity Payment/Total Income (%) 31 27 21 23 7 33 1 77 52
Total Income (%) 100 101 100 100 99 83 56 86 85
Wet Yield (cavan/ha) 82 81 79 80 61 61
Dry Yield (cavan/ha) 83 82 81 80 61 67
Sources: NIA-SMD CISPER data, various years.
The gap in irrigated area and FUSA is higher during dry season ranging from 33% to 66%
compared to the 14% to 53% during wet season. The ratios of benefited area to irrigated area
fluctuated during wet and season due to calamities and inadequate, respectively.
The total income consisted of the amortization repayment averaging over the years at 35% and
followed by equity payments averaging at 30%. Viability and cropping intensities generally
showed an upward trend.
Region 5 BICOL
Camarines Sur IMO
The service area of Camarines Sur CIS has increased over the years reaching around 40,500 ha in
2013 (Figure 54). The irrigated area during both wet and dry seasons followed the same pattern.
The gap between FUSA and the irrigated area is probably due to defective facilities. Ratios of total
amortization collections to total, total collections to estimated collectibles and collection efficiency
had no clear trend but tend to converge to 50% starting in 2010. After 2008, benefited areas during
wet and dry seasons tend to equalize. The cropping intensities reached a peak in 2007 but generally
had a stable movement through the years. The viability index, on the other hand, generally has an
increasing trend over the years despite its fluctuations.

232

233
Figure 54. Trends in key performance indicators, Camarines Sur IMO, Region 5, 2005-2013
Sources: NIA-SMD CISPER data, various years.

234
Table 43. CIS Performance Ratios of Camarines Sur IMO, 2005 to2013
Ratios 2005 2006 2007 2008 2009 2010 2011 2012 2013
Filled-up/Plantilla (%) 75 75 75 75 75
FUSA/Filled-up (Ha/staff) 995 995 1,162 1,190 2,699
FUSA/Filled-up + Daily Staff (Ha/staff) 995 995 1,162 1,190 2,699
FUSA/SA (%) 100 100 100 100 93 85 99 100 100
Ben. Wet/Actual Wet (%) 94 90 92 108 100 100 100 100 100
Ben. Dry/Actual Dry (%) 100 100 100 100 100
CIS Amort./Total Income (%) 46 55 28 20 24 35 32 51 50
Amort. Back/Total Income (%) 21 9 4 43 41 3 12 4 1
Equipment Rental/Total Income (%) 5 9 8 4 4 2 1
Equity Payment/Total Income (%) 5 25 37 44 41 41
Total Income (%) 72 94 78 115 110 83 46 55 52
Wet Yield (cavan/ha) 80 82 82 82
Dry Yield (cavan/ha) 84 84 82 82
Sources: NIA-SMD CISPER data, various years.
Even with the plantilla positions filled-up to up to 75%, each personnel still have a very large
coverage of 2,699 ha per staff (Table 43). The reduction of staff might be due to lack of funds.
But, this large coverage per staff would consequently diminish the quality of their service.
During wet and dry seasons, the gap between irrigated area and FUSA ranged from 17% to 64%
and 20% to 64%, respectively. This gap is might be due to defective and/or inadequate facilities.
Majority of the total income comes from amortization repayment averaging up to 38% over total
income across the years. This is followed by equity payments averaging at 29%. Cropping
intensities generally had a stable movement despite few fluctuations across the years. Viability
index, on the other hand, had some fluctuations but generally followed an upward trend.

235
CHARACTERIZING THE SAMPLE CIS
The 66 communal irrigation systems (CIS) sample are characterized according to size, technology,
“success” or “failure” and by province. On size, three types are defined: small, medium, large,
based on the size of the firmed-up service area (FUSA). IAs with FUSA of 100 ha or more are
classified as large while those with FUSA between 50 ha and 99 ha. are classified as medium. IAs
with FUSA below 50 ha are classified as small. Based on technology, the CIS are classified as
gravity or pump systems. To profile “successful” or “failed” CIS, “success” is defined in terms of
three criteria: (1) NIA’s functionality survey rating of very satisfactory to outstanding; (2) IA’s
own financial rating of 3 to 4, with 4 as very strong; and (3) IA’s ISF collection performance rating
of 3 to 4 with 4 as excellent and/or a collection rate of 65% and above. “Unsuccessful” or “less
successful” IAs are then defined as those which are not “successful” or with NIA’s functionality
survey rating of poor to satisfactory, with own financial rating of 0 to 2 , and ISF collection
performance rating of 0 to 2 or a collection rate below 65%.
By province
To establish patterns according to province, the provincial profiles of the sample CIS are reported
in Tables 44.1 to 44.7.
Benguet IA samples have more successful IAs than less successful ones. Generally, Benguet has
the highest cropping intensity and collection efficiency does not experience water shortage in the
dry season or flooding problems, and have minimal siltation problems However, they do have
moderate problems in funding and in the condition of their headwork and old piping structures.
They also have the least number of facilities, such as water storage, among the IAs from 11
provinces.
Cagayan is one of the 3 provinces that only have less successful IAs. Their IA samples have high
incidence of water supply shortages especially on dry seasons, severe condition problems of
canals, very high siltation problems, low cropping intensity, low collection efficiency, and high
occurrence of water theft.
For Camarines Sur, half of the sample IAs are considered successful and the other half, less
successful. Of the 11 provinces in the study, Camarines Sur IAs have the highest average yield,
high dependability, adequate water supply, and , fewer funding problems. On the contrary, they
have the most number of lateral canal problems, moderate occurrence of flooding, and, slight
siltation problems. They also lack facilities and equipment like farm-to-market-roads and backup
pumps.
IAs from Ilocos Norte are also considered as less successful. The sample IAs have the highest
count of water inadequacy, funding problems, and the most problems with the lateral canals and
control structures. In addition, the CISs have relatively low cropping intensity and low average
yield.

236
The IAs of Isabela have the least access to production credit, high siltation, and inadequate water
supply. They also have high counts of irrigation headwork structure problems and main and lateral
canal problems. Despite these constraints, Isabela has more “successful” IAs than less successful
ones, likely due to good management performance, resulting in high functionality ratings, and
relatively good levels of collection efficiency.
Of the Laguna IAs visited, only one would qualify as “successful”. The rest are “less successful.”
high cropping intensities, adequate of water supply, and good levels of collection efficiency,
Laguna IAs have the most flooding problems, funding problems, and condition problems for
lateral canal and control structures. In addition, their management rating is not very good, resulting
in lower functionality survey ratings.
Nueva Ecija has many less successful IAs, attributed to having low collection efficiency,
inadequate water supply during dry seasons, high siltation and funding problems,, water theft, and
problems with headwork and lateral canal conditions. On the positive side, most of the sample IAs
have good management performance resulting in high ratings.
IAs in Nueva Vizcaya are less successful IAs. Despite having high average cropping intensity and
yield, these IAs exhibit high counts of canal and headwork problems, inadequate water supply,
high count of siltation problems, low collection efficiency, and several funding problems.
Occidental Mindoro has the largest amortization rate among the 11 provinces. Their IAs have
minimal funding problems, good levels of collection efficiency, and do not experience siltation
problems. However, their “less successful” IAs dominate the “successful” ones. This disparity is
likely due to inadequate water supply especially during the dry season, very low average yield,
low cropping intensity, flooding problems, problems with irrigation canals and headwork
structures, water theft, and lack of facilities (e.g. FMR, solar driers, canal extensions and STWs).
Pampanga IAs have the same percentage of successful and less successful IAs. They experience
both minimal water shortages in dry seasons and flooding in wet seasons. All sample IAs have
high ratings in the functionality surveys, indicating very good management performance. Albeit
the good ratings, Pampanga IAs have high siltation problems, low average collection efficiencies,
and problems with the condition of their canal and control structures.
Pangasinan IAs have a higher percentage of successful IAs compared to less successful ones.
Their IAs have not experienced flooding and funding problems, and have high collection
efficiencies, and good functionality ratings. However, they still experience water supply shortages
during the dry seasons, low average cropping intensity, problems with physical conditions of
irrigation canals, water theft, and slight siltation problems.

237
Table 44.1. CIS IA Profile, Cropping Information and Financial Aspects by Province
Province No. of IA sample Ave. No. of Members Ave. Irrig.
Wet
Ave. Irrig.
Dry
Ave. Cropping
Intensity 1
Ave. Cropping
Intensity 2
Ave. No. of
Farmers-Landowner-
operator (%)
Ave. of No.
of Farmers-Tenant (%)
Ave. of No.
of Farmers-lessees (%)
Ave. of
Others (%)
Benguet 6 63 64 61 193 197 98 3
Cagayan 6 82 67 63 144 196 62 46 0
Camarines Sur 6 187 184 184 169 200 58 19 28 29
Ilocos Norte 6 207 156 99 157 157 65 31 3
Isabela 6 138 92 104 150 189 49 52 8
Laguna 6 64 87 87 181 200 22 74 5 81
Nueva Ecija 6 105 159 108 161 176 79 30 2
Nueva Vizcaya 6 161 179 151 177 184 52 40 15
Occidental Mindoro 6 143 298 259 193 192 75 37
Pampanga 6 68 149 83 162 162 78 14 3 95
Pangasinan 6 106 108 52 136 149 62 38 0
Total 66 120 140 114 166 182 64 41 7 68
Sources: CIS KII
Notes: Cropping intensity 1 = (Wet actual + Dry actual irrig)/FUSA
Cropping intensity 2 = (Wet actual + Dry actual irrig)/Wet actual ( except in cases where actual dry season irrigated is bigger)
Province No. of Crops Irrigated: Rice Only No. of Crops Irrigated: Rice
& Other Crops Ave. Amount of Loan
Ave. Equity Ave. Rate of Remittance
(Peso/year)
Ave. Amortization Rate (Php/Year)
Benguet
6
Cagayan 6
13253757 75000 161750 149560 Camarines Sur 6
14458647 1027985 161923 161923
Ilocos Norte 3 3 1500000 150000 37000 37000
Isabela 5 1 6380667
80333 80333
Laguna 6
3466520
55453 55453
Nueva Ecija 2 4 7391427 1173000 51250 32500
Nueva Vizcaya 6
4170239 61000 64112 64112
Occidental Mindoro 3 3 10066667 950000 52000 299926
Pampanga 2 4 1600000 450000 66867 67400
Pangasinan 4 2 28735087 1180000 67056 56699
Total 43 23 11037753 861598 89051 114802
Sources: CIS KII
Notes: Cropping intensity 1 = (Wet actual + Dry actual irrig)/FUSA Cropping intensity 2 = (Wet actual + Dry actual irrig)/Wet actual ( except in cases where actual dry season irrigated is bigger)

238
Table 44.2. Problems/concerns of CIS IAs by Province
Province No. of IA
sample
No. of IAs with inadequate water
supply in dry season
No. of
IAs
with
floodin
g
proble
m
during
wet
season
No. of IAs
with
Irrigation
Headwork
Problems
(damaged,
deteriorated
, lacking)
No. of IAs
with
Irrigation
Main Canal
Problems
(damaged,
deteriorated
, unlined)
No. of IAs
with
Irrigation
Lateral
Canal
Problems
(damaged,
deteriorated
, unlined)
No. of IAs
with
Irrigation
Control
Structure
Problems
(damaged,
deteriorated
, lacking,
unlined)
No. of
IAs with
Siltation,
Solid
Waste,
Informal
Settlers
& Water
Quality
Problems
No. of IAs
with
problems
due to lack
of facilities,
infrastructur
e (FMRs),
canal
extensions,
drainage,
storage,
pipelines,
STWs, solar
drier & etc.
No. of IAs
with
problems
due to
damaged/lac
k of
Machineries
&
Equipment
(ex.
Backhoes,
pumps, pipes
& etc.)
Benguet 6
2 1 1
1 6 1
Cagayan 6 6
2 2 4 1 4 4 1
Camarines Sur 6
2 2
5
2 3 2
Ilocos Norte 6 5 1
1 5 4 3 1 3
Isabela 6 3
3 2 4
4 2
Laguna 6 1 3 1
3 2
1
Nueva Ecija 6 5 1 3 1 3
4 2 2
Nueva Vizcaya 6 3 1 5 2 5 3 4
1
Occidental Mindoro 6 4 2 2 2 5 1
4 2
Pampanga 6 2 1 1 2 5 3 4 2 1
Pangasinan 6 6
1 3 3 1 2 1
Total 66 35 11 22 16 43 15 28 26 13
Sources: CIS KII

239
Table 44.3. NIA's CIS Functionality Survey rating, IA's own Financial Strength rating, IA's performance rating of ISF collection and Collection Efficiency by Province
Province No. of IA
sample
Ave.
Collection Efficiency (%)
IA Functionality
Survey Rating (No Data)
IA Functionality
Survey Rating (Poor -
Satisfactory)
IA Functionality
Survey Rating (Very
Satisfactory -
Outstanding)
IA's
Financial Strength
Rating (no
data)
IA's
Financial Strength
Rating (0 -
2, weak)
IA's
Financial Strength
Rating (3-
4, strong)
IA's
Performance Rating of
Collection
of ISF (no data)
IA's
Performance Rating of
Collection
of ISF (0-2, weak)
Benguet 6 100 1 5 3 3 4
Cagayan 6 73 3 2 1 3 3 3
Camarines Sur 6 83 2 4 1 5 1
Ilocos Norte 6 85 1 3 2 1 4 1 3 1
Isabela 6 89 1 1 4 1 2 3 2 2
Laguna 6 83 4 2 3 3 1 1
Nueva Ecija 6 43 2 4 4 2 4
Nueva Vizcaya 6 76 2 2 2 3 3 1 4
Occidental
Mindoro 6 80 3 2 1 1 5 1 3
Pampanga 6 78 6 1 1 4 2 2
Pangasinan 6 88 1 2 3 6 3
Total 66 80 12 20 34 3 25 38 14 24
Sources: CIS KII
Note: Not Successful - IAs having FS of poor to satisfactory, financial strength rating of 0 -2, collection efficiency below of 0 to 64% and/or ISF collection rating of 0-2 Successful - IAs having FS of very satisfactory to outstanding, financial strength rating of 3 -4, collection efficiency of at least 65% and/or ISF collection rating of
3-4

240
Province IA's Performance
Rating of Collection of ISF
(3-4, strong)
IA's Collection
Efficiency (No Data)
IA's Collection
Efficiency (0 -64%, weak)
IA's Collection
Efficiency (65% - 100%, strong)
No. of IAs by
"Success" (insufficient data)
No. of IAs by
"Success" (Not Successful)
No. of IAs by
"Success" (Successful)
Benguet 2 2
4 3
3
Cagayan 3
1 5 3 3
Camarines Sur 5
1 5
3 3
Ilocos Norte 2 4
2 4 2
Isabela 2 1 1 4 1 2 3
Laguna 4 1
5 1 4 1
Nueva Ecija 2 1 3 2
4 2
Nueva Vizcaya 1 1 1 4 2 4
Occidental Mindoro 2
3 3 3 2 1
Pampanga 2 1 2 3 2 2 2
Pangasinan 3 1 1 4 1 2 3
Total 28 12 13 41 20 28 18
Sources: CIS KII
Table 44.4. CIS IA's Performance Ratings of their water distribution and delivery service by Province
Province No. of IA sample Flexibility
Index Rating - (3-4, flexible)
Reliability Index
Rating - (3-4, reliable)
Equitability Index
Rating - (3-4, equitable)
Adequacy of
Service Delivery Rating - (3-4,
adequate service)
Benguet 6 6 6 6 3
Cagayan 6 4 3 5
Camarines Sur 6 6 6 6 6 Ilocos Norte 6 6 5 6 1
Isabela 6 3 4 5 4
Laguna 6 5 5 6 5
Nueva Ecija 6 2 4 4 3 Nueva Vizcaya 6 5 6 6 3
Occidental Mindoro 6 4 6 6 2
Pampanga 6 6 5 6 4
Pangasinan 6 6 5 6 Total 66 53 55 62 31
Sources: CIS KII

241
Table 44.5 CIS IA's Average SA, Converted Area, Permanently Non-Restorable Area, FUSA, Operational & Non-operational SA by Province
Province No. of IA sample Service Area Converted Area Permanently Non-Restorable Area
Firmed Up Service Area
Operational SA Non-Operational SA
Benguet 6 110 0 0 110 110 0
Cagayan 6 134 0 0 134 72 62
Camarines Sur 6 244 0 0 244 195 49
Ilocos Norte 6 187 2 39 146 126 20
Isabela 6 191 0 0 191 187 3
Laguna 6 107 1 20 86 80 7
Nueva Ecija 6 167 0 0 167 154 12
Nueva Vizcaya 6 203 0 0 203 196 7
Occidental Mindoro 6 385 0 0 385 271 114
Pampanga 6 179 2 0 177 166 11
Pangasinan 6 125 0 0 125 103 22
Total 66 185 0 6 179 151 28
Sources: NIA-SMD Inventory data, 2014.
Table 44.6 CIS IA's Average Irrigated and Benefited Area by Province
Province No. of IA sample Irrigated Wet Area (ha.)
Irrigated Dry Area (ha.)
Irrigated Ratooning / QTA
Area (ha.)
Irrigated Third Crop Area (ha.)
Benefited Wet Area (ha.)
Benefited Dry Area (ha.)
Benefited Ratooning /
QTA Area (ha.)
Benefited Third Crop Area (ha.)
Benguet 6 110 110 0 8 110 110 0 8
Cagayan 6 72 72 0 0 72 72 0 0
Camarines Sur 6 186 186 35 34 186 186 35 34
Ilocos Norte 6 126 117 0 0 126 117 0 0
Isabela 6 88 182 0 0 88 182 0 0
Laguna 6 80 80 0 1 71 80 0 0
Nueva Ecija 6 146 143 0 0 146 143 0 0
Nueva Vizcaya 6 184 183 0 0 184 183 0 0
Occidental Mindoro 6 233 203 0 0 233 203 0 0
Pampanga 6 94 156 0 0 94 156 0 0
Pangasinan 6 98 63 0 0 98 63 0 0
Total 66 128 136 3 4 127 136 3 4
Sources: NIA-SMD Inventory data, 2014.

242
Table 44.7 CIS IA's Average Cropping Intensities, Average Yield and Farmer Beneficiaries by Province
Province No. of IA sample Cropping
Intensity 1
Cropping
Intensity 2
Yield Wet Yield Dry Yield
Ratooning / QTA
Yield Third
Crop
Farmer
Beneficiaries
Benguet 6 199 200 58 60 0 0 84
Cagayan 6 118 199 83 83 0 0 89
Camarines Sur 6 155 200 100 96 7 28 206
Ilocos Norte 6 165 187 76 81 0 0 189
Isabela 6 169 173 76 90 0 0 159
Laguna 6 186 200 78 98 0 0 50
Nueva Ecija 6 166 183 78 83 0 0 89
Nueva Vizcaya 6 185 192 88 91 0 0 135
Occidental Mindoro 6 156 192 61 61 0 0 95
Pampanga 6 158 183 68 89 0 0 85
Pangasinan 6 121 156 93 83 0 0 96
Total 66 160 187 79 85 1 3 118
Sources: NIA-SMD Inventory data, 2014.
Notes: Cropping intensity 1 = (Wet actual + Dry actual irrig)/FUSA
Cropping intensity 2 = (Wet actual + Dry actual irrig)/Wet actual ( except in cases where actual dry season irrigated is bigger)

243
By size of system
The CIS sample has been categorized and characterized according to three sizes: small, medium,
and large as shown in Tables 45.1 to 45.7.
Compared to medium and large CIS, the small CIS have the least incidence of inadequate water
during dry seasons, siltation and solid waste problems. The small CIS have the least problem in
their irrigation structures and canals compared to the large systems. They come second to the
medium size CIS on incidence of water theft. The small CIS report the highest average cropping
intensity and yield. However, despite this favorable profile, they have the lowest collection
efficiency and highest count of funding problem. Following the criteria above on “successful” CIS,
the small systems have the highest percentage of “successful” IAs compared to the larger systems.
Medium-sized CIS have the lowest average cropping intensity and yield. They have the highest
incidence of inadequate water supply during dry seasons and siltation problems. They have the
highest count of irrigation headwork and control structures-related problems. On the other hand,
they have the highest collection efficiency and least incidence of floods and water theft. The
medium CIS have the second highest percentage of successful IAs.
Large CIS have the highest incidence of floods during the wet seasons. They also have the highest
count of irrigation canal problems and water theft. But, they have the least count of funding
problems.
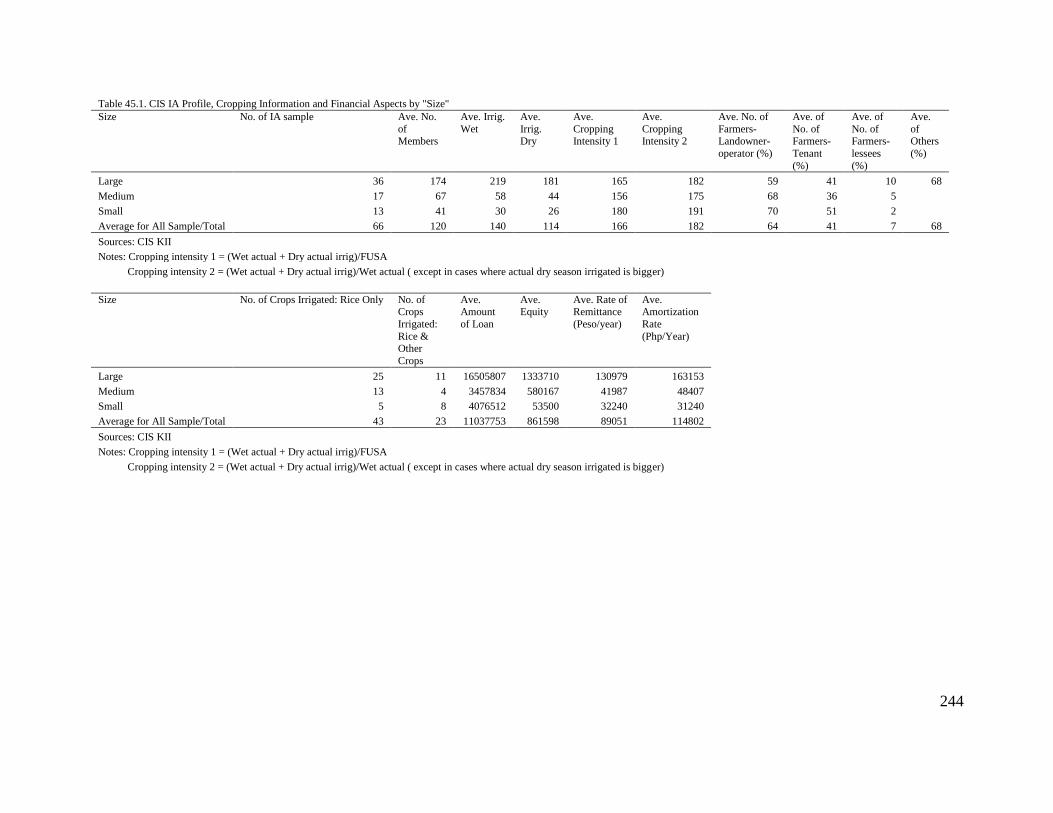
244
Table 45.1. CIS IA Profile, Cropping Information and Financial Aspects by "Size"
Size No. of IA sample Ave. No.
of Members
Ave. Irrig.
Wet
Ave.
Irrig. Dry
Ave.
Cropping Intensity 1
Ave.
Cropping Intensity 2
Ave. No. of
Farmers-Landowner-
operator (%)
Ave. of
No. of Farmers-
Tenant
(%)
Ave. of
No. of Farmers-
lessees
(%)
Ave.
of Others
(%)
Large 36 174 219 181 165 182 59 41 10 68
Medium 17 67 58 44 156 175 68 36 5
Small 13 41 30 26 180 191 70 51 2
Average for All Sample/Total 66 120 140 114 166 182 64 41 7 68
Sources: CIS KII
Notes: Cropping intensity 1 = (Wet actual + Dry actual irrig)/FUSA
Cropping intensity 2 = (Wet actual + Dry actual irrig)/Wet actual ( except in cases where actual dry season irrigated is bigger)
Size No. of Crops Irrigated: Rice Only No. of Crops
Irrigated:
Rice & Other
Crops
Ave. Amount
of Loan
Ave. Equity
Ave. Rate of Remittance
(Peso/year)
Ave. Amortization
Rate
(Php/Year)
Large 25 11 16505807 1333710 130979 163153
Medium 13 4 3457834 580167 41987 48407
Small 5 8 4076512 53500 32240 31240
Average for All Sample/Total 43 23 11037753 861598 89051 114802
Sources: CIS KII
Notes: Cropping intensity 1 = (Wet actual + Dry actual irrig)/FUSA
Cropping intensity 2 = (Wet actual + Dry actual irrig)/Wet actual ( except in cases where actual dry season irrigated is bigger)

245
Table 45.2. Problems/concerns of CIS IAs by "Size"
Size No. of IA sample
No. of IAs with inadequate
water supply in
dry season
No. of IAs with
flooding
problem during wet
season
No. of IAs with Irrigation
Headwork
Problems (damaged,
deteriorated,
lacking)
No. of IAs with
Irrigation
Main Canal Problems
(damaged,
deteriorated, unlined)
No. of IAs with
Irrigation
Lateral Canal Problems
(damaged,
deteriorated, unlined)
No. of IAs with
Irrigation
Control Structure
Problems
(damaged, deteriorated,
lacking,
unlined)
No. of IAs with
Siltation,
Solid Waste, Informal
Settlers &
Water Quality
Problems
No. of IAs with
problems due
to lack of facilities,
infrastructure
(FMRs), canal
extensions,
drainage, storage,
pipelines,
STWs, solar drier & etc.
No. of IAs with problems due to
damaged/lack of
Machineries & Equipment (ex.
Backhoes,
pumps, pipes & etc.)
Large 36 21 7 12 10 27 7 14 17 5
Medium 17 10 2 7 4 9 5 10 3 4
Small 13 4 2 3 2 7 3 4 6 4 Total 66 35 11 22 16 43 15 28 26 13
Sources: CIS KII

246
Table 45.3. NIA's CIS Functionality Survey rating, IA's own Financial Strength rating, IA's performance rating of ISF collection and Collection Efficiency by "Size"
Size No. of IA sample Ave.
Collection Efficiency
(%)
IA
Functionality Survey
Rating (No
Data)
IA Functionality
Survey Rating (Poor -
Satisfactory)
IA
Functionality Survey
Rating (Very
Satisfactory - Outstanding)
IA's Financial
Strength Rating (no
data)
IA's Financial
Strength Rating (0 - 2,
weak)
IA's Financial
Strength Rating (3-4,
strong)
IA's
Performance Rating of
Collection of
ISF (no data)
IA's Performance
Rating of Collection of ISF
(0-2, weak)
Large 36 80 6 13 17 2 9 25 8 12
Medium 17 81 4 3 10 1 8 8 2 9
Small 13 78 2 4 7 8 5 4 3 Average for All
Sample/Total 66 80 12 20 34 3 25 38 14 24
Sources: CIS KII
Note: Not Successful - IAs having FS of poor to satisfactory, financial strength rating of 0 -2, collection efficiency below of 0 to 64% and/or ISF collection rating of 0-2 Successful - IAs having FS of very satisfactory to outstanding, financial strength rating of 3 -4, collection efficiency of at least 65% and/or ISF collection rating of
3-4
Size IA's Performance
Rating of Collection
of ISF (3-4, strong)
IA's Collection
Efficiency (No
Data)
IA's Collection Efficiency (0 -
64%, weak)
IA's Collection Efficiency (65% -
100%, strong)
No. of IAs by "Success"
(insufficient
data)
No. of IAs by "Success" (Not
Successful)
No. of IAs by "Success"
(Successful)
Large 16 6 8 22 9 17 10
Medium 6 2 4 11 5 7 5
Small 6 4 1 8 6 4 3
Average for All Sample/Total 28 12 13 41 20 28 18
Sources: CIS KII

247
Table 45.4. CIS IA's Performance Ratings of their water distribution and delivery service by "Size"
Size No. of IA sample Flexibility
Index Rating - (3-4, flexible)
Reliability
Index Rating - (3-4, reliable)
Equitability
Index Rating - (3-4, equitable)
Adequacy of
Service Delivery
Rating - (3-4,
adequate service)
Large 36 29 32 34 16
Medium 17 13 12 16 7
Small 13 11 11 12 8
Total 66 53 55 62 31
Sources: CIS KII
Table 45.5 CIS IA's Average SA, Converted Area, Permanently Non-Restorable Area, FUSA, Operational & Non-operational SA by "Size"
Size Service Area Converted Area Permanently
Non-Restorable
Area
Firmed Up
Service Area
Operational SA Non-
Operational SA
Average of
NON-
OPERATIONAL (SA)
Large 36 270 0 4 265 226 40
Medium 17 83 1 7 76 61 15
Small 13 62 0 11 52 43 9
Average for All Sample/Total 66 185 0 6 179 151 28
Sources: CIS KII

248
Table 45.6 CIS IA's Average Irrigated and Benefited Area by "Size"
Size No. of IA sample Irrigated Wet
Area (ha.)
Irrigated Dry
Area (ha.)
Irrigated
Ratooning / QTA Area (ha.)
Irrigated Third
Crop Area (ha.)
Benefited Wet
Area (ha.)
Benefited Dry
Area (ha.)
Benefited
Ratooning / QTA Area (ha.)
Benefited
Third Crop Area (ha.)
Large 36 187 204 6 6 185 204 6 6
Medium 17 57 54 0 0 57 54 0 0
Small 13 42 38 0 3 42 38 0 3
Average for All Sample/Total 66 128 136 3 4 127 136 3 4
Sources: CIS KII
Table 45.7 CIS IA's Average Cropping Intensities, Average Yield and Farmer Beneficiaries by "Size"
Size No. of IA sample Cropping
Intensity 1
Cropping
Intensity 2
Yield Wet Yield Dry Yield
Ratooning / QTA
Yield Third
Crop
Farmer
Beneficiaries
Large 36 159 188 77 83 1 5 166
Medium 17 151 184 84 86 0 0 61
Small 13 178 188 80 87 0 0 47
Average for All Sample/Total 66 160 187 79 85 1 3 118
Sources: CIS KII
Notes: Cropping intensity 1 = (Wet actual + Dry actual irrig)/FUSA
Cropping intensity 2 = (Wet actual + Dry actual irrig)/Wet actual ( except in cases where actual dry season irrigated is bigger)

249
By technology
The CIS sample is also characterized in terms of usage of pump vs. gravity systems (Tables 46.1
to 46.7).
Contrary to the common findings, IAs using pump technology in the sample have more successful
IAs despite having higher amortization rates, incidence of flooding and funding problems, and low
cropping intensities. The disparity is likely due to their adequate water supply even during dry
seasons, fewer problems with their irrigation canals and structures, and high collection efficiencies.
On the other hand, IAs irrigated by gravity have the highest cropping intensity and a low
occurrence of flooding. However, when compared to IAs using pump systems, they have more
problems with irrigation canals and structures, more severe water shortages, and greater incidence
of funding problems and water theft.9
9 Of the 66 sample IAs, only one IA with a reservoir scheme does not have much data to allow comparison with the
other schemes.

250
Table 46.1. CIS IA Profile, Cropping Information and Financial Aspects by "Technology"
Technology No. of IA
sample
Ave. No. of
Members
Ave. Irrig.
Wet
Ave. Irrig. Dry Ave. Cropping
Intensity 1
Ave.
Cropping
Intensity 2
Ave. No. of
Farmers-
Landowner-operator (%)
Ave. of No. of
Farmers-Tenant (%)
Ave. of No. of
Farmers-
lessees (%)
Gravity 56 122 141 116 172 183 65 40 7
Pump 9 109 136 106 130 182 60 47 8
Reservoir 1 150 160 80 150 150 33 66 1 Average for All
Sample/Total 66 120 140 114 166 182 64 41 7
Sources: CIS KII
Notes: Cropping intensity 1 = (Wet actual + Dry actual
irrig)/FUSA
Cropping intensity 2 = (Wet actual + Dry actual irrig)/Wet actual ( except in cases where actual dry season irrigated is bigger)
Technology Ave. of Others
(%) No. of Crops Irrigated:
Rice Only
No. of Crops Irrigated: Rice
& Other Crops
Ave. Amount of Loan Ave. Equity Ave. Rate of Remittance
(Peso/year)
Ave. Amortization
Rate (Php/Year)
Gravity 55 37 19 7727362 911385 87906 116999
Pump 95 5 4 5263114 537985 114329 122029
Reservoir 1 150000000 20000 20000
Average for All Sample/Total 68 43 23 11037753 861598 89051 114802
Sources: CIS KII
Notes: Cropping intensity 1 = (Wet actual + Dry actual irrig)/FUSA
Cropping intensity 2 = (Wet actual + Dry actual irrig)/Wet actual ( except in cases where actual dry season irrigated is bigger)

251
Table 46.2. Problems/concerns of CIS IAs by
"Technology"
Technology No. of IA
sample
No. of IAs
with
inadequate water
supply in
dry season
No. of IAs
with
flooding problem
during wet
season
No. of IAs with
Irrigation
Headwork Problems
(damaged,
deteriorated, lacking)
No. of IAs
with
Irrigation Main Canal
Problems
(damaged, deteriorated,
unlined)
No. of IAs
with
Irrigation Lateral Canal
Problems
(damaged, deteriorated,
unlined)
No. of IAs
with
Irrigation Control
Structure
Problems (damaged,
deteriorated,
lacking, unlined)
No. of IAs
with Siltation,
Solid Waste, Informal
Settlers &
Water Quality Problems
No. of IAs
with problems
due to lack of facilities,
infrastructure
(FMRs), canal extensions,
drainage,
storage, pipelines,
STWs, solar
drier & etc.
No. of IAs with
problems due to
damaged/lack of Machineries &
Equipment (ex.
Backhoes, pumps, pipes &
etc.)
Gravity 56 31 8 22 15 38 14 24 22 11
Pump 9 3 3 1 4 1 4 4 2
Reservoir 1 1 1
Total 66 35 11 22 16 43 15 28 26 13
Sources: CIS KII

252
Table 46.3. NIA's CIS Functionality Survey rating, IA's own Financial Strength rating, IA's performance rating of ISF collection and Collection Efficiency by
"Technology" Technology No. of IA
sample
Ave.
Collection
Efficiency (%)
IA
Functionality
Survey Rating (No
Data)
IA Functionality
Survey Rating
(Poor - Satisfactory)
IA
Functionality
Survey Rating (Very
Satisfactory -
Outstanding)
IA's Financial
Strength
Rating (no data)
IA's Financial
Strength
Rating (0 - 2, weak)
IA's Financial
Strength
Rating (3-4, strong)
IA's
Performance
Rating of Collection of
ISF (no data)
IA's
Performance
Rating of Collection of
ISF (0-2, weak)
Gravity 56 79 10 16 30 2 23 31 10 22 Pump 9 87 1 4 4 1 2 6 4 1
Reservoir 1 1 1 1
Average for All Sample/Total 66 80 12 20 34 3 25 38 14 24
Sources: CIS KII
Note: Not Successful - IAs having FS of poor to satisfactory, financial strength rating of 0 -2, collection efficiency below of 0 to 64% and/or ISF collection rating of 0-2 Successful - IAs having FS of very satisfactory to outstanding, financial strength rating of 3 -4, collection efficiency of at least 65% and/or ISF collection rating of
3-4
Technology IA's
Performance Rating of
Collection of
ISF (3-4, strong)
IA's
Collection Efficiency
(No Data)
IA's Collection
Efficiency (0 -64%, weak)
IA's Collection
Efficiency (65% - 100%, strong)
No. of IAs by
"Success" (insufficient
data)
No. of IAs by
"Success" (Not Successful)
No. of IAs by
"Success" (Successful)
Gravity 24 9 12 35 16 25 15
Pump 4 3 1 5 3 3 3
Reservoir 1 1
Average for All Sample/Total 28 12 13 41 20 28 18
Sources: CIS KII
Note: Not Successful - IAs having FS of poor to satisfactory, financial strength rating of 0 -2, collection efficiency below of 0 to 64% and/or ISF collection rating of 0-2
Successful - IAs having FS of very satisfactory to outstanding, financial strength rating of 3 -4, collection efficiency of at least 65% and/or ISF collection rating of 3-4

253
Table 46.4. CIS IA's Performance Ratings of their water distribution and delivery service by "Technology"
Technology No. of IA sample Flexibility Index
Rating - (3-4, flexible)
Reliability
Index Rating - (3-4, reliable)
Equitability
Index Rating - (3-4, equitable)
Adequacy of
Service Delivery Rating
- (3-4, adequate
service)
Gravity 56 45 48 53 25
Pump 9 7 6 8 6
Reservoir 1 1 1 1
Total 66 53 55 62 31
Sources: CIS KII
Table 46.5 CIS IA's Average SA, Converted Area, Permanently Non-Restorable Area, FUSA, Operational & Non-operational SA by "Technology"
Technology No. of IA sample Service Area Converted Area Permanently
Non-Restorable
Area
Firmed Up
Service Area
Operational SA Non-
Operational SA
Gravity 56 178 1 5 172 147 26
Pump 9 236 0 12 224 187 37
Reservoir 1 108 0 0 108 60 48
Average for All Sample/Total 66 185 0 6 179 151 28
Sources: NIA-SMD Inventory data, 2014.

254
Table 46.6 CIS IA's Average Irrigated and Benefited Area by "Technology"
Technology No. of IA sample Irrigated Wet
Area (ha.)
Irrigated Dry
Area (ha.)
Irrigated
Ratooning / QTA Area (ha.)
Irrigated Third
Crop Area (ha.)
Benefited Wet
Area (ha.)
Benefited Dry
Area (ha.)
Benefited
Ratooning / QTA Area (ha.)
Benefited Third
Crop Area (ha.)
Gravity 56 138 130 3 1 137 130 3 1
Pump 9 77 180 7 22 76 180 7 22
Reservoir 1 50 30 0 0 50 30 0 0
Average for All Sample/Total 66 128 136 3 4 127 136 3 4
Sources: NIA-SMD Inventory data, 2014.
Table 46.7 CIS IA's Average Cropping Intensities, Average Yield and Farmer Beneficiaries by "Technology"
Technology No. of IA sample Cropping
Intensity 1
Cropping
Intensity 2
Yield Wet Yield Dry Yield
Ratooning / QTA
Yield Third
Crop
Farmer
Beneficiaries
Gravity 56 169 191 80 84 0 2 119
Pump 9 118 167 70 86 2 10 128
Reservoir 1 74 160 100 80 0 0 0
Average for All Sample/Total 66 160 187 79 85 1 3 118
Sources: NIA-SMD Inventory data, 2014.
Notes: Cropping intensity 1 = (Wet actual + Dry actual irrig)/FUSA
Cropping intensity 2 = (Wet actual + Dry actual irrig)/Wet actual ( except in cases where actual dry season irrigated is bigger)

255
By “success”
The profiles of the CIS sample in terms of some “success” measure are reported in Tables 47.1
to 47.7.
Despite flooding, siltation problems, problems with irrigation structures, and water theft,
successful IAs as defined above generally have adequate and dependable sources of water supply,
high cropping intensity, high collection efficiency, and adequate funding.
Less successful IAs are characterized by inadequate water in the dry seasons, more problems
with irrigation main canal and control structures, low collection efficiencies, and severe funding
problems.

256
Table 47.1. CIS IA Profile, Cropping Information and Financial Aspects by "Success"
Classification No. of IA sample Ave. No. of Members Ave. Irrig.
Wet
Ave.
Irrig. Dry
Ave.
Cropping Intensity 1
Ave.
Cropping Intensity 2
Ave. No. of
Farmers-Landowner-
operator (%)
Ave. of
No. of Farmers-
Tenant (%)
Ave. of
No. of Farmers-
lessees (%)
Ave. of
Others (%)
Not Successful 28 121 129 117 160 179 64 36 10 81
Successful 18 118 165 117 171 181 62 42 7 62
Insufficient Data 20 122 134 109 169 187 64 47 4
Average for All Sample/Total 66 120 140 114 166 182 64 41 7 68
Sources: CIS KII
Notes: Cropping intensity 1 = (Wet actual + Dry actual irrig)/FUSA
Cropping intensity 2 = (Wet actual + Dry actual irrig)/Wet actual ( except in cases where actual dry season irrigated is bigger)
Table 47.1. CIS IA Profile, Cropping Information and Financial Aspects by "Success"
Classification No. of Crops Irrigated: Rice
Only
No. of Crops Irrigated: Rice
& Other
Crops
Ave. Amount of Loan
Ave. Equity Ave. Rate of Remittance
(Peso/year)
Ave. Amortization
Rate (Php/Year)
Not Successful 19 9 7407343 916495 96500 91994
Successful 11 7 8111770 1133333 86088 231525
Insufficient Data 13 7 34760000 208333 42333 28400
Average for All Sample/Total 43 23 11037753 861598 89051 114802
Sources: CIS KII
Notes: Cropping intensity 1 = (Wet actual + Dry actual irrig)/FUSA
Cropping intensity 2 = (Wet actual + Dry actual irrig)/Wet actual ( except in cases where actual dry season irrigated is bigger)

257
Table 47.2. Problems/concerns of CIS IAs by "Success"
Classification No. of IA
sample
No. of IAs
with inadequate
water
supply in dry season
No. of IAs
with flooding
problem
during wet season
No. of IAs with
Irrigation Headwork
Problems
(damaged, deteriorated,
lacking)
No. of IAs
with Irrigation
Main Canal
Problems (damaged,
deteriorated,
unlined)
No. of IAs
with Irrigation
Lateral Canal
Problems (damaged,
deteriorated,
unlined)
No. of IAs
with Irrigation
Control
Structure Problems
(damaged,
deteriorated, lacking,
unlined)
No. of IAs
with Siltation,
Solid Waste,
Informal Settlers &
Water
Quality Problems
No. of IAs
with problems due
to lack of
facilities, infrastructure
(FMRs),
canal extensions,
drainage,
storage,
pipelines,
STWs, solar
drier & etc.
No. of IAs
with problems due to
damaged/lack
of Machineries &
Equipment
(ex. Backhoes, pumps, pipes
& etc.)
Not Successful 28 15 3 9 6 18 9 10 8 7
Successful 18 7 3 6 3 12 1 11 11 3
Insufficient Data 20 13 5 7 7 13 5 7 7 3
Total 66 35 11 22 16 43 15 28 26 13
Sources: CIS KII

258
Table 47.3. NIA's CIS Functionality Survey rating, IA's own Financial Strength rating, IA's performance rating of ISF collection and Collection Efficiency by
"Success"
Classification No. of IA
sample
Ave.
Collection
Efficiency (%)
IA
Functionality
Survey Rating (No
Data)
IA Functionality
Survey Rating
(Poor - Satisfactory)
IA
Functionality
Survey Rating (Very
Satisfactory -
Outstanding)
IA's
Financial
Strength Rating (no
data)
IA's
Financial
Strength Rating (0 - 2,
weak)
IA's
Financial
Strength Rating (3-4,
strong)
IA's
Performance
Rating of Collection of
ISF (no data)
IA's
Performance
Rating of Collection of
ISF (0-2,
weak)
Not Successful 28 71 17 11 1 15 12 1 16
Successful 18 93 18 18 2 3
Insufficient Data 20 80 12 3 5 2 10 8 11 5
Average for All
Sample/Total 66 80 12 20 34 3 25 38 14 24
Sources: CIS KII
Note: Not Successful - IAs having FS of poor to satisfactory, financial strength rating of 0 -2, collection efficiency below of 0 to 64% and/or ISF collection rating of 0-2
Successful - IAs having FS of very satisfactory to outstanding, financial strength rating of 3 -4, collection efficiency of at least 65% and/or ISF collection
rating of 3-4
Classification IA's
Performance
Rating of
Collection of ISF (3-4, strong)
IA's Collection
Efficiency
(No Data)
IA's Collection Efficiency (0 -
64%, weak)
IA's Collection Efficiency (65% -
100%, strong)
No. of IAs by "Success"
(insufficient
data)
No. of IAs by "Success" (Not
Successful)
No. of IAs by "Success"
(Successful)
Not Successful 11 9 19 28
Successful 13 2 1 15 18
Insufficient Data 4 10 3 7 20
Average for All Sample/Total 28 12 13 41 20 28 18
Sources: CIS KII
Note: Not Successful - IAs having FS of poor to satisfactory, financial strength rating of 0 -2, collection efficiency below of 0 to 64% and/or ISF collection rating of 0-2
Successful - IAs having FS of very satisfactory to outstanding, financial strength rating of 3 -4, collection efficiency of at least 65% and/or ISF collection rating of 3-4

259
Table 47.4. CIS IA's Performance Ratings of their water distribution and delivery service by "Success"
Classification No. of IA sample Flexibility Index
Rating - (3-4, flexible)
Reliability Index
Rating - (3-4, reliable)
Equitability Index
Rating - (3-4, equitable)
Adequacy of
Service Delivery Rating - (3-4,
adequate service)
Not Successful 28 22 21 24 14
Successful 18 16 18 18 11
Insufficient Data 20 15 16 20 6
Total 66 53 55 62 31
Sources: CIS KII
Table 47.5 CIS IA's Average SA, Converted Area, Permanently Non-Restorable Area, FUSA, Operational & Non-operational SA by "Success"
Classification No. of IA sample Service Area Converted Area Permanently Non-
Restorable Area
Firmed Up Service
Area
Operational SA Non-Operational
SA
Not Successful 28 201 1 4 196 168 29
Successful 18 179 0 0 179 165 14
Insufficient Data 20 163 0 15 148 106 43
Average for All Sample/Total 66 185 0 6 179 151 28
Sources: NIA-SMD Inventory data, 2014.

260
Table 47.6 CIS IA's Average Irrigated and Benefited Area by "Success"
Classification No. of IA sample Irrigated Wet
Area (ha.)
Irrigated Dry
Area (ha.)
Irrigated
Ratooning / QTA Area (ha.)
Irrigated Third
Crop Area (ha.)
Benefited Wet
Area (ha.)
Benefited Dry
Area (ha.)
Benefited
Ratooning / QTA Area (ha.)
Benefited
Third Crop Area (ha.)
Not Successful 28 136 149 2 7 134 149 2 7
Successful 18 139 145 8 2 139 145 8 2
Insufficient Data 20 102 103 0 0 101 103 0 0
Average for All Sample/Total 66 128 136 3 4 127 136 3 4
Sources: NIA-SMD Inventory data, 2014.
Table 47.7 CIS IA's Average Cropping Intensities, Average Yield and Farmer Beneficiaries by "Success"
Classification No. of IA sample Cropping Intensity 1
Cropping Intensity 2
Yield Wet Yield Dry Yield Ratooning /
QTA
Yield Third Crop
Farmer Beneficiaries
Not Successful 28 157 186 80 88 1 3 124
Successful 18 166 182 80 85 1 4 120
Insufficient Data 20 158 193 76 77 0 0 105
Average for All Sample/Total 66 160 187 79 85 1 3 118
Sources: NIA-SMD Inventory data, 2014.
Notes: Cropping intensity 1 = (Wet actual + Dry actual irrig)/FUSA
Cropping intensity 2 = (Wet actual + Dry actual irrig)/Wet actual ( except in cases where actual dry season irrigated is bigger)
261
Technical Assessment10
There are technical issues/problems that generally confront the IAs and the performance of their
CIS (Tables 48 to 50). Most run-of-the-river type dams are quite old, with exposed rock cores,
damaged spillways, and with sediments almost at the crest level. Most of the sluice gates and intake
gates usually made of steel are now replaced with flashboards, sand bags, or stones and in some
relatively larger CIS with defective lifting mechanisms. These problems also contribute to
increased sedimentation. On a positive note, most CIS that were visited have concrete-lined main
canals with some up to the laterals. In general, the good conditions of the lined and unlined canal
networks are due to the IAs having good O&M and cleanup mechanisms. In some cases, heavy
siltation experienced is due to watershed degradation and requires major policy/governance
solutions.
Structures found in CIS include cross regulators, check gates, drop structures, division boxes and
farm turnouts. Some of which are well-maintained, while others have deteriorated with control
structures not functioning well or as originally intended. For example, some cross or check
regulators initially intended to measure discharges lack staff gages that measure water levels and
have missing or uncalibrated rating curves. Other miscellaneous or appurtenant structures
commonly found in all CIS are road and thresher crossings, end checks, and service roads, where
most service roads are rough roads with most dams accessible only by walking or by motorcycles.
As in most irrigation systems, there are no specific drainage canals at the CIS. Normally, the
downstream farm ditches receive the excess water from paddies, which in turn would be used to
irrigate downstream areas in some CIS. With water distribution downstream being from paddy to
paddy, not having an individual farm ditch for each paddy, result in large application losses.
Sedimentation is one of the main problems that cause canal deterioration and decrease in water
yield in dry seasons. Identified sources of sediments are (a) sidehills, (b) drainage/creeks, (c) side
slopes of irrigation canals, and (d) catchments. Lahar is the major source of sediments for some
CIS in Pampanga. Several operational lapses (e.g. full opening of intake gates and closing of sluice
gates to maximize water intake even during high sediment inflows), contribute to increased
sedimentation. For example, defective lifting mechanisms or the replacement of steel sluice gates
permanently by flashboard or concrete maximize water inflow into the system but also effectively
increase sediment inflows. Given the high sedimentation rate, IAs regularly clean the canals,
especially since CIS canals are smaller and more manageable compared to NIS. Thus, the IAs
rated low silt level and undesired seepage grade in their canals. .
One of the major reasons for low performance by irrigation systems is the lack of water during dry
seasons. The sources of water for the CIS visited are lakes, rivers, creeks, springs, ground water,
runoff, or a combination of these sources. Some rivers are large and have adequate flows that can
irrigate even during the dry seasons, while some rivers have very low dry season flows. Most
creeks have adequate flows for small areas during wet seasons but are either very low or have no
flow during dry seasons. Only 22 of the 66 surveyed CIS (33%) have river sources capable of
10 This section is drawn from Luyun (2015) Final Report.

262
providing irrigation during dry seasons. Eight rivers have published historical records that showed
low dependable flows. Four of these rivers are very large and can provide water for large NIS,
thus, irrigation is assured at least 80% of the time with only siltation and hardware problems
remaining. However, water source is a major problem for majority of the CIS that tap water from
less dependable small rivers, creeks, springs, and runoffs.
Groundwater remains a viable option, especially for areas where the surface water sources (i.e.
creeks) have low dependable discharges during the dry seasons, and are underlain by good shallow
aquifers. Despite having to use STW pumps and engines that lead to additional fuel costs,
groundwater is reliable even in intense drought periods or El Niño episodes, and farmers have
control of irrigation schedules and flows. In times of water shortages or when the area to be
irrigated is higher from the source, STWs and LLPs (3”x 3” or 4”x 4” centrifugal pumps) are
commonly used. They are usually driven by 8 – 12 Hp water-cooled diesel engines. With respect
to rehabilitation, the rehabilitated areas averaged at about 140,000 ha per year from 2006-2013,
which is double of the 1992-1996 rate. Despite massive efforts and funding, the increase in
irrigation area is minimal at just about 40,000 ha per year.
In terms of water delivery performance, on average, the IAs appear to be satisfied given that their
rating for their CIS are highly flexible, reliable, and equitable. Around 40% of the IAs practiced
AWD technology.
The operation and maintenance of CIS is turned over to IAs upon project completion. Based on
the KIIs, most of the IAs claim that they receive sufficient water at the right time. Moreover, the
IAs rated themselves high in terms of water distribution, maintenance of canals, and control
structures. However, improvements may be necessary since delays are still commonplace.
The expansion of irrigated agriculture, through the development of new areas or the rehabilitation
of old ones, is necessary for food security. New irrigable areas come from small scale systems like
CIS, STWs and SWIPs, all of which have low gestation periods, offer low investments, quite
efficient, and are easy to manage.

263
Table 48 Summary of Observation for each CIS
Issues Dangdangla
CIS
San
Jera
Tanap
A
Dakkel
CIS
Palompong
CIS
Zanjera
Bangisirt
CIS
Der-ap
Saoit
CIS
Baay
CIS
San
Agel
SRIP
Don
Oftociano
Sr. CIS
Sapid
CIS
Nama
CIS
Convento
CIS
Ngayaoyaoan
CIS
Gumarang
CIS
Garab
CIS
Naddungan
CIS
Abaca
CIS
Calusit
CIS
Tappakan
Baraccoit
CIS
Masipi
West
IA CIS
Masipi
East
CIS
Viola
PIS
Technical Issues
Siltation
Seepage
Lacking/incomplete Irrigation Facilities
Canal related
High operation cost of pump
Control Structure
Flooding
Shortage of Water Supply
Informal Settlers/Solid Waste
Water Source
Farm-to-market/ Access Road
Irrigation Headwork
Machineries & Equipment
Structure Design
Salt Intrusion
Calamities/Low Yield
Pest Insfestation
Illegal Offtakes/Turnouts/Pumps
Others
Institutional Issues
ISF/Amortization Payment / Collection Efficiency
Inadequate, Unclear or Absence of Policies, Ordinances or
Regulations
Implementation of Policies, Ordinances, Penalties or
Regulation
Funds
Registration or Permit
Water Theft, Scheduling & Distribution
Attendance in Maintenance Work & Meetings
Environmental Issues
Mining
Source: CIS KII & Ocular Inspection Findings
Note: For more details, refer to Excel file.

264
Table 48 Summary of Observation for each CIS
Issues Dangdangla
CIS
San
Jera
Tanap
A
Dakkel
CIS
Palompong
CIS
Zanjera
Bangisirt
CIS
Der-
ap
Saoit
CIS
Baay
CIS
San
Agel
SRIP
Don
Oftociano
Sr. CIS
Sapid
CIS
Nama
CIS
Convento
CIS
Ngayaoyaoan
CIS
Gumarang
CIS
Garab
CIS
Naddungan
CIS
Abaca
CIS
Calusit
CIS
Tappakan
Baraccoit
CIS
Masipi
West
IA
CIS
Masipi
East
CIS
Viola
PIS
Technical Issues
Siltation
Seepage
Lacking/incomplete Irrigation Facilities
Canal related
High operation cost of pump
Control Structure
Flooding
Shortage of Water Supply
Informal Settlers/Solid Waste
Water Source
Farm-to-market/ Access Road
Irrigation Headwork
Machineries & Equipment
Structure Design
Salt Intrusion
Calamities/Low Yield
Pest Insfestation
Illegal Offtakes/Turnouts/Pumps
Others
Institutional Issues
ISF/Amortization Payment / Collection
Efficiency
Inadequate, Unclear or Absence of Policies,
Ordinances or Regulations
Implementation of Policies, Ordinances,
Penalties or Regulation
Funds
Registration or Permit
Water Theft, Scheduling & Distribution
Attendance in Maintenance Work & Meetings
Environmental Issues
Mining
Source: CIS KII & Ocular Inspection Findings
Note: For more details, refer to Excel file.
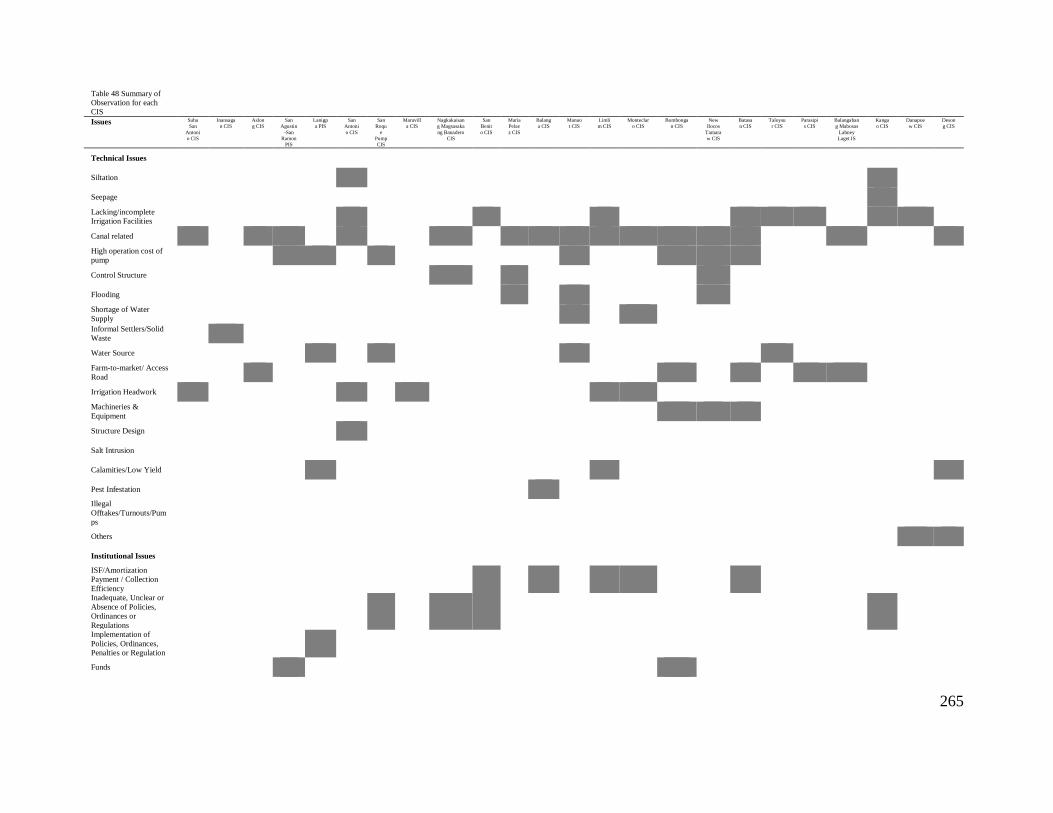
265
Table 48 Summary of
Observation for each
CIS
Issues Suha
San
Antoni
o CIS
Inansaga
n CIS
Aslon
g CIS
San
Agustin
-San
Ramon
PIS
Lanigp
a PIS
San
Antoni
o CIS
San
Roqu
e
Pump
CIS
Maravill
a CIS
Nagkakaisan
g Magsasaka
ng Banadero
CIS
San
Benit
o CIS
Maria
Pelae
z CIS
Balang
a CIS
Manuo
t CIS
Limli
m CIS
Monteclar
o CIS
Bombonga
n CIS
New
Ilocos
Tamara
w CIS
Batasa
n CIS
Taloysu
r CIS
Parasipi
s CIS
Balangaban
g Mabosas
Labney
Laget IS
Kanga
o CIS
Danapoe
w CIS
Deson
g CIS
Technical Issues Siltation Seepage Lacking/incomplete
Irrigation Facilities Canal related High operation cost of
pump Control Structure Flooding Shortage of Water
Supply Informal Settlers/Solid
Waste Water Source Farm-to-market/ Access
Road Irrigation Headwork Machineries &
Equipment Structure Design Salt Intrusion Calamities/Low Yield Pest Infestation Illegal
Offtakes/Turnouts/Pum
ps
Others Institutional Issues ISF/Amortization
Payment / Collection
Efficiency Inadequate, Unclear or
Absence of Policies,
Ordinances or
Regulations Implementation of
Policies, Ordinances,
Penalties or Regulation Funds

266
Registration or Permit Water Theft, Scheduling
& Distribution Attendance in
Maintenance Work &
Meetings Environmental Issues Mining Source: CIS KII &
Ocular Inspection
Findings
Note: For more details,
refer to Excel file.

267
Table 49. Summary of Problems Encountered by the 66 Sample CIS in Luzon, 2015
Issues Percentage of Total CIS Sample
(%)
Technical Issues
Siltation 38
Seepage 6
Lacking/incomplete Irrigation Facilities 20
Canal related 64
High operation cost of pump 21
Control Structure 21
Flooding 8
Shortage of Water Supply 30
Informal Settlers/Solid Waste 2
Water Source 23
Farm-to-market/ Access Road 9
Irrigation Headwork 21
Machineries & Equipment 11
Structure Design 11
Salt Intrusion 2
Calamities/Low Yield 11
Pest Infestation 2
Illegal Offtakes/Turnouts/Pumps 6
Others 5
Institutional Issues
ISF/Amortization Payment / Collection Efficiency 20
Inadequate, Unclear or Absence of Policies, Ordinances or Regulations 17
Implementation of Policies, Ordinances, Penalties or Regulation 6
Funds 8
Registration or Permit 2
Water Theft, Scheduling & Distribution 9
Attendance in Maintenance Work & Meetings 17
Environmental Issues
Mining 2
Source: CIS KII and Ocular Inspection, PIDS Irrigation Study team (2015). Note: For more details, refer to Excel file.

268
Table 50.1. Deployment of Institutional Development Officers to communal
irrigation systems in 11 selected Irrigation Management Offices. Table 50.2. Source of funding of communal irrigation systems, 2014.
IMO
No. of
CIS/IAs No. of IDOs Sources NIA ARISP CARP-IC ARCDP Others1 Total
Pampanga 68
1 Sr. IDO for CIS and 1 Community
Relation Assistant (CRA)
No. of
CIS 1029 8 30 26 69 1162
Nueva Ecija 60 7 IDOs with CRAs helping
Amount
(PhP) 603466957 28268012
19662121
7 103377093.7
931733
280
Pangasinan 120
8 IDOs are assigned to CIS in 6
districts % Share 64.77 3.03 21.1 11.1
Ilocos Norte 116
4 IDOs assigned to CIS; 5 IDOs to
both CIS/NIS; two (2) farmers’
Irrigators’ organizers
Source: Seasonal Operational and Maintenance Report of Respective Irrigation Management Offices (as of
2013, 2014)
*Includes FSDC tie-up with NIA; CIDP, SIP, GAA, REGIP, RREIS, RREIS
Benguet 431 3 IDOs
Camarines Sur 152
2 IDOs for CARP and SRIP; 6
Research Assistant B position
covering 5 districts
Table 50.3. Cost payment schemes of irrigators associations in the 11 sample Irrigation Management
Offices, 2014.
Nueva Vizcaya 217 4 IDOs are assigned CIS/IAs
IMO Amortizing Non-
Amortizing
Fully
amortized
30% Equity
paid
Dole Out Others*
Isabela 45
1 assigned to CIS project but there
are many radiation projects
All
(n=1467)
Cagayan 673 3 IDOs No. 577 313 34 395 5 143
Laguna 13 3 IDOs in 3 districts % 39.33 21.34 2.32 26.93 0.34 9.75
Occidental Mindoro 32 5 IDOs Source of basic data: IA Profile in respective Irrigation Management Offices (as of 2013, 2014)
Source: Personal interviews of IA officials/members
*Non-functional systems, deferred, under
construction
Table 50.4. Problems/issues and suggestions to address their concerns by the sample irrigators associations in 11 selected provinces.
Province Operation
and
managemen
t of the
system
Access to funds for rehabilitation Access to
production
credit
Technica
l support
from
NIA,
support
services
from DA
Access to water
(quantity and
timeliness)
Others* Additiona
l
Pumps/ST
Ws
Construction
of Steel
Gates
Canal
Lining
Financia
l
Subsidy
/Farm
Inputs/R
oads
Siltation and
Dredging/
Providing of
Backhoe
Redesign/
Reroute/
Rehabilitat
e System/
Repair of
Structures
Soil Analysis
Pampanga 0 1 2 0 0 2 1 0 3 2 0 4 0
Nueva Ecija 1 1 0 0 3 4 0 0 2 5 2 1 0
Pangasinan 2 1 1 0 4 0 0 0 3 1 1 1 0
Ilocos Norte 3 1 0 1 4 1 3 3 5 1 1 0 0
Camarines Sur 4 3 1 0 1 0 1 0 3 2 0 3 0
Benguet 1 1 2 1 1 0 0 0 0 2 0 5 0
Nueva Vizcaya 2 1 2 0 3 3 0 0 4 1 1 3 0
Isabela 3 3 4 3 5 2 1 0 3 1 1 5 0
Cagayan 3 3 1 1 6 1 3 0 4 0 2 1 1
Laguna 3 2 1 0 0 1 3 0 4 0 2 1 1
Occidental Mindoro 3 2 1 0 5 0 2 0 3 2 0 4 0
ALL
No. 25 19 15 6 32 14 11 4 32 19 8 30 1
% 37.88 28.79 22.73 9.09 48.48 21.21 16.67 6.06 48.48 28.79 12.12 45.45 1.52
Source: Personal interviews of IA officials/members
*Others include pest and diseases, flooding, collection of fees, problems in the association, problems in the system
Note: For more details, refer to Excel file.

269
CONCLUSIONS
There is value in looking at sub-national trends given insights which cannot be inferred from
national trends. Using secondary data from the Central and regional offices of NIA and the
systems, complemented by key informant interviews and ocular inspections, this study establishes
key institutional and technical constraints to improving performance of both national and
communal irrigation systems.
Specifically, for national irrigation systems, we found the following:
National and regional trends in NIS. Service area growth has slowed down in the last decade
and growth has been concentrated in just four regions. Firmed up service area difference with
service area indicate on average a land conversion rate or declared permanently non-restorable
area of about 10%. Most NIS systems are diversion systems and the few operational pump
systems available are in five regions (Regions 1, 2, 3, 5 and 13).
Cropping intensity only slightly increased over the years. In fact wet season irrigation intensity
appears to have largely slowed down. In Luzon, some increases in dry season irrigation
intensities can be seen while wet season intensities appear to have stagnated. However, in
Mindanao, similar increasing patterns for both wet and dry seasons irrigation intensities are
observed.
Collection efficiency has only noticeably improved in two (the rest of Region 2 and Region 4)
regions only in Luzon and in MRIIS and slightly in UPRIIS while worst in Region 6. The
Mindanao regions appear to have been performing better in terms of this indicator, consistent
with the corresponding improvements in cropping intensity. Aside from this, possibly other
factors maybe at play given dramatic performances in Regions 2 and 11 and in MRIIS and
higher cropping intensities in the rest of Mindanao.
NIS Cases: States and Patterns. Of the 22 NIS cases, six are from Ilocos, five from Cagayan
(including 2 MRIIS), seven from Region 3 (including 3 UPRIIS), three from Regions 4a and
4b, and one from Region 5. The sample also included four pump systems.11 Except for UPRIIS
and MRIIS, the rest of the systems are diversion/gravity type.
The performance of the NIS cases are analyzed in terms of size of IAs (defined as large,
medium, small based on their FUSA), technology (diversion/gravity, pump, reservoir),
location (upstream, midstream, downstream of the main canals), vintage (before 1965, 1965-
80, 1981-2013), and by some measures of “success” which largely capture institutional and
financial/economic aspects of irrigation system management by IAs/NIA. “Success” is
measured similarly as NIA loosely defines it -- based on functionality ratings and active and
functional IA organization, high collection efficiency and payment of ISF to NIA. These
typologies capture various technical and institutional aspects of providing irrigation service by
11 Part of UPRIIS and MRIIS systems are served by pumps.

270
national systems. Pump systems will have different challenges from reservoir and diversion
systems. Size of IAs based on firmed-up service area will likely be correlated with complexity
of design, and operation of physical structures and facilities, and the corresponding type of
management. Vintage entails different technical and institutional concerns between relatively
old vs. newer systems. “Successful" IAs entail institutional factors at play but also probably
technical aspects contributing to such performance.
There is disparity between small and large IAs. The small IAs reported the highest incidence
of inadequate water during dry seasons, flooding during wet season, high counts of canal
problems especially lateral canals, and siltation/solid waste problems. The large systems/IAs
indicated adequate water supply, least occurrence of siltation problems, lowest count of
irrigation headwork and main canal problems, minimal occurrence of flooding and adequacy
of budget. These IAs also have a high percentage of “successful” IAs compared with the small
and medium size IAs. This apparent advantage of large IAs may be linked to their degree of
influence by virtue of their size and ability to access funds which result in favorable physical
states of their systems, which in turn led to their success.
Reservoir systems appear to have clear advantages over the other types of schemes. And while
pumped systems are shown to be doing well, these systems are in fact heavily subsidized. The
IA sample irrigated by diversion system (gravity) reported the highest count of inadequacy in
water supply especially during the dry season. The IAs which used pump systems have the
highest counts of siltation, lateral canals and institutional problems. Despite these concerns,
these IAs reported adequacy and dependability of water supply even during dry season, no
flooding problem, and higher collection efficiencies compared to the situation of IAs with
diversion/gravity system. The IAs in reservoir systems claimed to be most successful of the
three groups. This group reported adequate water supply, lowest count of siltation problems,
largest percentage of financially strong IAs, very high IA functionality ratings and high
collection efficiencies.
Downstream IAs are heavily disadvantaged over the rest of the IAs. The sample has the
following characteristics: highest count of siltation and/or solid waste problems, highest count
of lack of water supply, highest occurrence of flooding during wet seasons, highest count of
damaged farm-to-market roads, highest percentage of financially weak IAs and lowest ratings
of water delivery service in terms of adequacy and timeliness. The upstream IAs on the other
hand, reported the least incidence of water supply problems, lowest count of solid waste and/or
siltation problems, highest irrigation structure problems, highest count of lack of machineries
and equipment and a high percentage of financially strong IAs. Irrigation canal problems were
ranked first in the list of problems, and followed by institutional problems and then by
calamities/pest infestation causing production problems.
Profiles of IAs and irrigation systems differ by vintage. This measure splits the sample into
three periods which coincide with the distinct trends in irrigation investment and development.
Interestingly, the pre-NIA systems are characterized as those with the least irrigation structure
problems, concern for lack of machineries and equipment and inadequacy of water supply.
However, the IAs in these systems have the lowest functionality ratings. Systems constructed

271
between 1965 to 1980 have the following attributes: highest count of poor headwork and
control structures condition, highest concern of lack of machineries and equipment, highest
count of financially weak IAs, highest count of lack of water supply, and highest incidence of
damaged FMRs. Yet, these systems have the least siltation/solid waste problems relative to
systems from the other periods. Prevalent problems in decreasing order include: inadequate of
water during dry seasons, poor conditions of lateral canal and control structures. The IAs with
systems built between 1981 and 2013 reported the highest count of main and lateral canal
problems. They also have the highest incidence of siltation problems and the largest count of
institutional problems. However, this group has the largest number of financially strong IAs,
the highest count of “successful” IAs, the least occurrence of flooding, with adequate water
supply and least damaged FMRs. This observation seems ironic as it implies that IAs can still
be financially strong and “successful” despite technical and institutional problems.
Profiling IAs according to “success” or failure, indicates distinct differences between these
groups. “Successful” IAs in the sample are characterized as those with adequate water supply,
less institutional problems, adequate budget and facilities, machineries and equipment.
However, these IAs experience higher incidence of siltation and problems with physical state
of main canals, lateral canals and control structures. The hierarchy of problems of successful
IAs are as follows in decreasing order: lateral canal condition problems, institutional problems,
crop production problems due to calamities/pest infestations and damaged irrigation structures.
The “less successful” IAs have the higher count of inadequate water during dry seasons,
irrigation headwork problems, lack of facilities, machineries and equipment, with inadequate
budget and lower IA functionality ratings, indicating poor management performance. In order
of importance, inadequacy of water comes first, followed by institutional problems, and then
by the lack of irrigation facilities/infrastructures, machineries and equipment.
Using an alternative approach to analyzing the sample NIS performance, the results show that
irrigation performance has much to improve. This approach establishes an irrigation
performance index (IPI) measured in terms of five aspects: financial, economic, institutional,
technical and environmental factors. The financial factors include: 1) IAs rating of their
financial strength – financial capability of the IA is critical in the organization’s development;
2) collection efficiency – a higher collection efficiency means higher ISF shares by IAs and
better incentive; and 3) collection delinquency – a higher delinquency decreases the
performance index. Financially strong IAs can carry out better O&M and repairs so that
irrigation systems can deliver good/sustainable irrigation service. The economic factors
include average annual yields and gross profits of IA members which would be indicative of
benefits that reach beneficiary farmers. Higher annual yields can lead to higher annual profits.
Also, higher incomes can mean farmer members would be better able to pay ISF resulting in
IAs financial strength. The institutional component includes: 1) effectiveness of policies; 2)
flexibility index rating; 3) reliability index rating; and 4) satisfaction rating on farm to market
road. The technical component indicators include canal structures ease of operability and canal
structure’s operability vs. design. Canal structure ease of operability pertains to the ease in
operating irrigation structures such as check gates, turnout gates, etc. While canal structure
operability vs design compares the original design of the irrigation system vs the actual use of
the structure. The environmental component indicators include dissolve oxygen content and

272
acidity. Higher DO (i.e. > 6 ppm) and pH content (i.e. >5) mean better quality water. The pH
found in most water samples show levels >7 which indicate alkaline conditions and potential
sodicity problems if not addressed on time. The results of this analysis show that 58% of the
sample IAs rated the irrigation performance as moderate. Only 12% of the sample rated
performance as high and the rest, low performance.
For communal irrigation systems, we found the following:
This component provides preliminary evaluation of investments in CIS.
National and Regional/Provincial Trends
Service area has been growing but at a relatively very slow pace while firmed up service area
has been closely following. Given the relatively stable difference between the SA and FUSA,
land conversion or growth in permanently non-restorable area does not appear to be a concern.
However, the trends in actual irrigated areas during the wet and dry seasons seem to have
faltered in 2012. Wet and dry seasons irrigation intensities never reached the 80% mark and
even declined by about 20% in 2012.
With the rise in equity schemes, the amortization collection decreased and became a less
significant source of income. Also, the fact that amortization collection efficiency drastically
declined is a serious concern.
Characterizing the sample CIS
The 66 CIS are saddled with technical issues and problems that affect their performance. The
sample CIS in this study have run-of-the-river type dams which are quite old, with exposed
rock cores, damaged spillways, and sediments almost at the crest level. The sluice gates and
intake gates which were initially made of steel have been replaced with flashboards, sand bags,
or stones and in some relatively larger CIS, with defective lifting mechanisms. These problems
contributed to the increase in sedimentation. However, most of the sample CIS have concrete-
lined main canals and even laterals. The good conditions of these lined and unlined canal
networks are said to be due to the IAs O&M efforts and cleanup mechanisms. Where heavy
siltation is experienced due to watershed degradation, the solutions are simply beyond the IAs.
The sample CIS are characterized according to size, technology, “success” or “failure” and by
province. On size, three types are defined: small, medium, large. Based on technology, the
CIS are classified as gravity or pump systems. To profile “successful” or “failed” CIS,
“success” is defined in terms of three criteria: (1) NIA’s functionality rating of very satisfactory
to outstanding; (2) IA’s own financial rating of 3 to 4, with 4 as very strong; and (3) IA’s ISF
collection performance rating of 3 to 4 with 4 as excellent and/or a collection rate of 65% and
above. “Unsuccessful” or “less successful” IAs are defined as those which are not “successful.”
These categories capture various technical and institutional factors that influence CIS irrigation
service.

273
The experience in small CIS exemplifies “small is beautiful.” Compared to the other classes,
the small CIS have the least incidence of inadequate water during dry seasons, siltation and
solid waste problems. They also have less problems in irrigation structures and canals
compared with the large systems and they reported the highest average cropping intensity and
yield. However, they have the lowest collection efficiency and highest count of funding
problem. Following the criteria above on “successful” CIS, the small systems have the highest
percentage of “successful” IAs compared to the larger systems. The large CIS have the highest
incidence of floods during the wet seasons. They also have the highest count of irrigation canal
problems and water theft. But, they have the least funding problems.
Contrary to earlier findings, IAs using pump technology in the sample have more successful
IAs despite the higher incidence of flooding and funding problems, and low cropping
intensities. The disparity is likely due to their adequate water supply even during dry seasons,
fewer problems with their irrigation canals and structures, and high collection efficiencies. The
pump technology appears to be closely associated with better control of available water and
the success of IAs.
The IAs irrigated by gravity have the highest cropping intensity and a low incidence of
flooding, but they have more problems with irrigation canals and structures, more severe water
shortages, and greater incidence of funding problems and water theft.
As to profile of “successful” IAs, they have adequate and dependable sources of water supply,
high cropping intensity, high collection efficiency, and adequate funding. This success profile
is obtained despite flooding, siltation, irrigation structures, and water theft problems. Less
successful IAs are characterized by inadequate water in the dry season, more problems with
irrigation main canal and control structures, low collection efficiencies, and severe funding
problems. It is interesting to note that “IAs can still be successful despite physical and
economic concerns. It seems that water availability is a key factor in high collection efficiency.
This finding needs to be validated so NIA can use this result in formulating strategies to
improve collection efficiency.
RECOMMENDATIONS
Based on the technical and institutional analyses carried out for national and communal irrigation
systems, the following recommendations are in order.
For National Irrigation Systems:
Given the new insights from sub-national trends which cannot be inferred from national trends,
such level of analysis should be scaled up to cover more NIS in Visayas and Mindanao and
better understand the situation on the ground and establish some patterns and trends which can
be used to formulate relevant policy changes and actions.

274
It appears that conversion of irrigated areas is a more serious concern in certain regions. If the
rate of land conversion will continue to rise, estimates of design areas should properly take this
into account.
Given the dramatic slowdown in growth or stagnation of wet season irrigation intensity, it is
high time that NIA gives attention to the need to invest in drainage and/or collaborate with
DPWH to explicitly and more systematically address flooding problems in NIS systems which
may require bigger technical/engineering solutions.
As a first step, each NIS should clearly establish size of firmed-up service areas which are
flooded during the wet season. For systems where there is a big difference between wet and
dry season irrigable area, two FUSA measures should be recognized. This will have
implications on the calculation of cropping intensity which uses FUSA as denominator.
Collection efficiency improvements appear to correspond to improvements in cropping
intensities. If this relationship can be confirmed, the strategy to improve collection efficiency
should include improvement in cropping intensities which in turn will require improvement in
irrigation service.
Relative to the medium and large irrigators associations (IAs), the small IAs appear to have
the disproportionate share of the problems. Given this disparity, the design of institutional
interventions that take into account “size” of IAs according to membership. Special attention
should be given to the needs of small IAs and appropriate interventions be designed.
Irrigators Associations in reservoir systems claimed to be most “successful” based on many
indicators when compared with those in diversion and pump systems. In considering types of
projects to invest in, government will have to consider the trade-offs in investing more in
reservoir types which will likely mean higher initial capital requirements vs. pumped systems.
The later type may mean less initial investment but higher O&M after project completion and
less likely to be sustainable to operate given volatility in oil prices.
“Successful” IAs in the sample are characterized as those with adequate water supply, less
institutional problems, adequate budget and facilities, machineries and equipment. If we take
these factors as indicative of necessary requirements for “successful IAs,” then at minimum,
NIA’s system design and eventually service areas should be matched with adequate water. This
finding makes necessary more firm and systematic assessment of adequacy and reliability of
water that will be available to farmers when an NIS system operates.
The issue of equity in the delivery of service remains a major concern given the heavily
disadvantaged downstream IAs – with inadequate water during the dry season and more water
than they need during the wet season. NIA has to come up with a better strategy of addressing
this aspect of equity as part of improving quality of irrigation service.
If use of pumps is to be taken as a way to partly address equity concerns especially during dry
seasons, the lack of policy on treatment of use of pumps within NIS systems has to be
275
addressed. The use of discount needs to be evaluated and made an official policy rather than
leaving too much discretion on the water masters or institutional development officers in the
field.
Performance of irrigators associations using functionality ratings differ by vintage -- pre-NIA
systems, 1965-80 and 1981 to 2013 – indicating that contrary to expectations, functionality of
“older” IAs maybe more problematic. If functionality ratings can be validated, there may be a
strong case for revisiting the institutionalization program. “Old” IAs appear to need more
retraining/reorienting/strengthening so they can keep up and become more effective
organizations.
Again, appropriate institutionalization policy has to be designed according to the specific needs
of different types of IAs. Irrigators associations in the early NIA years appear to be mostly
financially weak. Given this, the capacity building strategy for IAs should explicitly include
ways to improve financial strengths and that intervention for IAs should consider not only size
(in terms of membership) but also vintage. IAs with systems built between 1981 and 2013
appear to need in addition, more engineering/technical solutions. These observations should
be confirmed by further evaluations given two possible scenarios –more recent systems are not
built as strongly or we have simply more intense weather and climate contributing to more
rapid deterioration or damage to the systems. If the latter would be the case, this finding will
provide a strong support for more deliberate climate change resilient systems in terms of design
and structures.
Using an alternative approach to analyzing the sample NIS, the results show that the composite
performance has much to improve. This approach establishes an irrigation performance index
in terms of five aspects: financial, economic, institutional, technical and environmental factors.
If the results can be confirmed, addressing specific aspects of performance with respect to the
five areas can lead to possible marked improvement. Given this potential usefulness of the
analysis, this approach should be scaled-up to cover more IAs and national systems to validate
the initial observations and at the same time refine the measure to be more useful.
For Communal Irrigation Systems:
Service area has been growing at a very slow pace and prelimnary investigation shows that a
good number of CIS are already in elevations beyond the 3% slope. This initial finding
warrants scaling up of the characterization to cover more IMOs to get a better sense of the
location and distribution of the over 9000 CIS nationwide.
An assessment of the potential and economics of considering areas between 3% and 8% slopes
for CIS expansion should be pursued. Using the GIS technology and some modeling, a more
systematic identification of irrigable CIS areas should be carried out taking into account water
availability, associated environmental damage/watershed degradation.

276
The wet and dry seasons irrigation intensities which are generally below 80%, should be
further investigated and understood by looking at trends in all provinces/IMOs and more
systems. As a first step to this assessment, the FUSA has to be examined and the field work
should be used to understand why the actual irrigated areas have been falling short in both
seasons. The evaluation should be able to establish how much is truly “non-functional” area
(which will therefore need repair/rehabilitation/restoration) vs. flooded during wet or with
inadequate water during dry.
With the rise in equity schemes, the amortization collection decreased and became a less
significant source of income. However, the decline in amortization collection efficiency is a
concern which should be addressed.
Reservoir systems appear to coincide with most successful group of IAs. If this finding can be
validated, consideration of this type of system may well justify the possibly higher investment
needs compared to other types.
The technical issues and problems affecting the CIS performance point to the need to revisit
adherence to design and construction guidelines for new development and rehabilitation of
CIS. Specifically, the assessment of dependable flow, catchment conditions, sediment
discharges and potential of groundwater source be properly carried out. The trade-off between
spending more on capital requirement during the development phase versus higher O&M
expenditures after turnover be carefully weighed.
If results can be validated by scaling up the evaluation to cover more CIS, appropriate
government interventions can be designed according to the priority needs of IAs. NIA can use
the results for targeting interventions and allocating the corresponding resources. Small IAs
need more capacity building and funding while large IAs need more technical solutions.
Lastly, while IAs can still be considered “successful” despite physical and economic concerns,
it appears that water availability is a key factor in high collection efficiency. NIA’s strategy
to improve collection efficiency has to also include addressing the issue of water availability.

277
REFERENCES
Araral, Eduardo. 2005. The Impacts of Irrigation Management Transfer, In Shyamsundar, P.;
Araral, E. and Weeratne, S. (Eds), Devolution of Resource Rights, Poverty, and Natural
Resource Management (A Review) pp. 45-62. Washington, DC: World Bank.
Burt, C. and S. Styles. 1998. Modern Water Control and Management Practices in Irrigation:
Impact on Performance. Report prepared for the World Bank Research Committee. (October).
Cablayan, O., A.B. Inocencio, C. Francisco, V. Saw with C. Ureta (2014). “Review of National
Irrigation Service Fee”, Policy Paper submitted to PIDP, National Irrigation Administration,
Quezon City.
David, Wilfredo P., Mona Liza Delos Reyes, Manolo Villano and Arthur Fajardo. 2012. Design
shortcomings of the headwork and water distribution and control facilities of the canal
irrigation systems of Ilocos Norte, Philippines. PAS. Vol 95 no. 1, 64-78 March 2012.
David, Wilfredo P., Mona Liza Delos Reyes, Manolo Villano and Arthur Fajardo. 2012. Faulty
design parameters and criteria of farm water requirements result in poor performance of canal
irrigation systems in Ilocos Norte, Philippines. PAS. Vol 95 no. 2, 199-208 June 2012.
David, Wilfredo P. (2003). Averting the Water Crisis: Program ad Policy Framework for
Irrigation in the Philippines, UP Press and APPC, Diliman, Quezon City.
David, Wilfredo P. (2008). “Irrigation” in Dy, R.T. et al, Modernizing Philippine Agriculture and
Fisheries: The AFMA Implementation Experience, University of Asia and the Pacific and
others, Manila.
Elazegui, D. 2015. Institutional Evaluation of Communal Irrigation Systems. Final Report
submitted to PIDS, Makati City.
Food and Agriculture Organization (FAO) of the United Nations. 2007. Modernizing Irrigation
Management - the Masscote Approach: Mapping System and Services for Canal Operation
Techniques. FAO Irrigation and Drainage Paper #63. Rome.
Inocencio, A, C David, and R Briones. 2014. A rapid appraisal of the irrigation program of the
Philippine government. PIDS.
Luyun, R. 2015. Technical Evaluation of Communal Irrigation Systems and Selected National
Irrigation Systems. Final Report submitted to PIDS, Makati City.
NIA. 2013. Status of Irrigation Development, Based on Inventory as of December 31, 2013.
Downloaded from http://www.nia.gov.ph.

278
NIA. 2015. NIS and CIS Performance Data as of December 31, 2014. NIA_SMD, Quezon City.
Repetto, Robert. 1986. World Enough and Time: Successful Strategies for Resource Management.
World Resources Institute, Washington, D.C.
Saleth , Maria and Ariel Dinar. 2004. Water institutional reforms: theory and practice. Water
Policy 7. 2005. 1-19.Wade, Robert, 1982. The System of Administrative and Political
Corruption. Canal Irrigation in South India. Journal of Development Studies 18 (3) 287-328.
Shepley, Steven C., E. M. Buenaventura, and D.C. Roca (2000). “Review of Cost Recovery
Mechanism for National Irrigation Systems”, TA 3235-PHI, National Irrigation
Administration and Asian Development Bank, Manila.
Yabes, R. 2008. Institutional change from shocks to an indigenous irrigation system in the
Philippines: the impact of participatory planning on Zanjera Danum. Dynamics of Institutions
in Water Resources Management Workshop, School of Human Evolution & Social Change
and The Center for the Study of Institutional Diversity, Arizona State University. January 9-
11.

279
ANNEX 1. SAMPLE NIS KEY INFORMANT INTERVIEWS
Ilocos Norte Irrigation System (Nueva Era, Bonga 2)12
IA Profile Issues and Concerns
Kadaklan
Baldias IA -
Nueva Era
(upstream)
Crop: Rice
Yield: 90 [hyb]
(dry); 80 (wet)
Total cost: P20,000
ISF: 2550 (dry);
1700 (wet);
CE: 80%
FUSA: 190
Technical/Physical
- Constant repair of brush dams
- There is a constant need to put up a brush dam
in order to store water specially during dry
season
Institutional/Socio-Economic/Political/Cultural
- Usual conflict is due to improper use of
turnouts and scheduling of water distribution
Caniyogan-
Balbalay-
Kali Alakay-
IA – Banna
(downstream)
Crop: Rice and
corn
Yield: 80 (rice); 4
tons (corn)
Total cost:
P30,000; P20,000
(corn)
CE: 70%
FUSA: 181
Model 3
Technical/Physical with Institutional/Political
complexities
- Water supply is difficult in the area due to
complex situations:
*Initially, the IA constructed brush dams in order to
store water. However, due to a dike construction by
the DPWH, the water that flows to the brush dam and
eventually to the canal is blocked.
*Constructed dike was too high that water can no
longer flow through the irrigation canal
*The design was contested but DPWH said that it was
approved by the Mayor. While the Mayor cannot do
anything because that the design was by DPWH.
*Problem becomes complicated withwater source in a
different municipality
-Proposed to construct an impounding dam, 10 km
upstream, which should go directly to Banna
San Nicolas-
Laoag
Bonga Pump
2
Crop: Rice and
corn
Yield: 10 tons/ha
[hyb] (dry); 6
tons/ha (wet)
Total cost: P45,000
Technical/Physical
-During wet season, the canal is blocked by heavy
siltation due to quarrying activities in the area.
Therefore, a channeling canal of 3kms was
constructed around for the water to flow.
-The cost of excavation for desilting is P100k per
excavation
12 IA Profile does not include total planted area thus cannot compute for CI.

280
ISF: 7000 (dry);
4000 (wet)
CE: 80%
FUSA: 250
Stage 3 special
case
-A river channeling project was proposed worth
P20 million but the budget was reduced to P7
million. Since the cost was reduced, it was
instead used to restore canals.
-Although the restoration of the canal is good, it
was inappropriate and farmers would opt to
have used it to purchase a back hoe for
excavation use instead.
-IA is willing to pay for the purchase of heavy
equipment (back hoe) even under an
amortization scheme
-Dilapidation of canals and turnouts are also
aggravated by the heavy siltation from the
river
-The heavy siltation is due to quarrying. It would
have been best to implement a designated zone
for quarrying
Institutional/Socio-Economic/Political/Cultural
-High prices of inputs while low prices of harvest
Initiative/Success stories
-IA is under a tripartite agreement with NIA and
LGU
*NIA does the construction and repair; LGU
manages the collection and fund disbursement;
and IA does the operation

281
Banaoang Pump Irrigation System
IA Profile Issues and Concerns
Paing-
Taguipuro IA
(upstream)
Crop: Rice and corn
Yield: 100 (dry); 110
(wet)
Total cost: P35,000
ISF: 6375 (dry); 4250
(wet)
CE: 85%
FUSA: 230
Total Planted Area: 69
CI: 30%
Model 1
Technical/Physical
- Some main canals are not lined
- Personal STW pumps are used as back
up for times with low water supply
- Cost of pump operation is P15,000
Institutional/Socio-Economic/Political/Cultural
- Low trading price of rice
- Typical conflict issue is due to lack of
water management knowledge within
members
Cabusligan
(midstream)
Crop: Rice
Yield: 100 (dry); 200
(wet)
Total cost: P30,000
CE: 70%
Model 1
Technical/Physical
- Uses 5hp surface pump in elevated areas
which costs P60,000 per unit
- New hybrid variety has low yield
Capangdanan
(midstream)
Crop: Rice
Yield: 100 (dry); 120
(wet)
Total cost: P30,000
CE: 80%
Model 1
VSPC IA,
San Hera De
Magsinggal
IA, Western
Magsinggal
IA, Pansaca
IA
(downstream)
Crop: Rice
Yield: 4.5 tons (dry); 5.5
tons (wet)
Total cost: P40,000
ISF: 6375 (dry); 4250
(wet)
CE: 80%
FUSA: 525
Total Planted Area: 216
CI: 42%
IMT Model 1
Technical/Physical
- Need to fix farm to market roads
especially during wet season.
- Main canal is beginning to be silted
which lessens the availability of water
- Siltation comes from the river source
- Propose to have adequate heavy
equipment due to usual dredging needs
Institutional/Socio-Economic/Political/Cultural
- Since the irrigation facility is new, no
ordinances are still intended for the

282
protection of the facilities i.e. no
throwing of waste.
- Many farmers are still traditional and do
not want to pay the ISF and do not
follow the cropping calendar.
- Low trading price of rice
- Farmers cannot comply with the
requirements of NFA therefore they are
discouraged to sell in NFA
- Sikat saka is not availed by members as
of the moment due to requirements

283
Ambayoan-Dipalo River Irrigation System (2 NIS)13
IA Profile Issues and Concerns
Salud-San
Eugenio
(upstream)
Crop: Rice
Yield: 40-45 cav/ha
Total cost: P25,000
CE: 70%
Model 2
Technical/Physical
- Structures were destroyed during 2014
typhoon
- Need construction of good farm-to-market
roads
- Lining of canals
- There are canals that have become shallow
due to siltation
- Some members use a low lift pump that was
provided by LGU
Main Canal
Ambayoan
Saranay IA
(midstream)
Crop: Rice and corn
Yield: 80(dry); 100
(wet)
Total cost: P30,000 –
P35,000
ISF: 2550 (dry); 1700
(wet); 1530 (other
crops aside from rice)
CE: 70%
Model 2
Technical/Physical
- Low water supply during dry season
- NIS and CIS shares the intake to get water
with only 25% goes to NIS and 75% goes to
CIS
- Complete the intake construction of
Ambayoan
- Concretize canals
- Replace old steel gates and regulators
- Concretize farm-to-market roads
Kaps
Ambayoan
IA
(downstream)
Crop: Rice and corn
Yield: 50 (w/o
pump); 138 (w/
pump) – Rice
100 (w/o pump); 170
(w/ pump)
Total Cost: P40,000
(w/o pump) – P
70,000 (w/ pump)
ISF: 1750 w/ 10%
discount for those
who used pump
CE: 59%
Model 1
Technical/Physical
- Water schedule is too tight (2days and
2nights only)
- Members use pump since no other sources
of water apart from irrigation
- Another major reason is the construction of
the ARIIP main canal. The construction
traversed trough the laterals which
eventually block the pathway of water from
main canal to the lateral.
- During wet season, the farms are flooded
because the ARIIP main canal also blocks
the drainage water.
13 No secondary data for IA profile.

284
- Heavy siltation also comes from the
unfinished area of the ARIIP
- The construction of ARIIP is on hold as of
the moment.
- Best to provide STW pumps to farmers as
supplement for irrigation
- Propose to restore intake of Ambayoan
river.
Institutional/Socio-Economic/Political/Cultural
- Cannot successfully complete 2nd cropping
because at the same time, upstream farmers
already go to 3rd cropping wherein they
consume the water intended supposedly for
downstream’s 2nd crops
- Due to tight scheduling, IAs requests for
extension of water delivery. This brings a
chain reaction wherein the last of the
farmers can no longer benefit from the
irrigation
- NIA’s implementation of water delivery
schedule is poor.
- Water master is not doing its job. In 5
schedules of water delivery, not once did the
water master monitor and assisted in the
distribution.
SMD –
Samahang
Magsasaka
ng Gonzalo
(upstream)
Crop: Rice and corn
Yield: 90 (dry); 120
(wet);
Total cost: P30,000 –
P35,000
ISF: 1700
CE: 70-95%
Model 2
Technical/Physical
- Low water supply during dry season due to
alternate rotation
- Intake in dam should be increased
- Availability of back hoe
Carsan
Kudungo
dungo IA -
San Quintin
(downstream)
Crop: Rice and corn
Yield: 80-90 (dry) –
rice; 100 cav/ha (dry)
– corn; 70-80 (wet )
Total cost: P20,000
(rice) – P30,000
(corn)
ISF: 1700 (wet only)
CE: 50%
Type 2
Technical/Physical
- Main dam in Dipalo is highly silted since
the earthquake of 1990
- All canals are highly silted which blocks the
water to flow
- No check structures (steel gate, culvert,
regulator, etc.)
- NIA has inadequate heavy equipment

285
Magat River Integrated Irrigation System (Div II & Div IV)14
IA Profile Issues and Concerns
Bagong
Silang IA
(upstream)
Div 2
Crop: Rice
Yield: 120 (dry); 110
(wet)
Total cost: P30,000
ISF: 2975 (dry); 2125
(wet)
CE: 85%
Technical/Physical
- Earth canals are damaged by carabaos when
they dip in the water. This eventually causes
siltation.
- Needs heavy equipment (back hoe and
dump truck) for the constant need to repair
the canals
Institutional/Socio-Economic/Political/Cultural
- Low buying of rice while high prices of
input
FIA D-2
members IA
(midstream)
Div 2
Crop: Rice
Yield: 130 (dry); 120
(wet)
Total cost: P30,000
ISF: 2975 (dry); 2125
(wet)
CE: 60%
Technical/Physical
- Lateral canals need to be rehabilitated
- Earth canals have to be lined
New Life IA
(downstream)
Div 2
Crop: Rice
Yield: 130 (dry); 120
(wet)
Total cost: P60,000
ISF: 2975 (dry); 2125
(wet)
CE: 62%
Technical/Physical
- In low water supplies, members borrow
pumps in NIA and DA. Borrowing of pump
is on a first come first serve basis. The
members will provide for the gasoline.
- The total cost of the unit is P14,000
- Labor cost in the area is too high (5000-
6000 per ha), which forces the farmers to do
“seed-throwing” instead which is an
inefficient way of planting
- Canals are eroded and highly silted
therefore, best to concretize the main canal.
- Concretize the farm-to-market roads
Institutional/Socio-Economic/Political/Cultural
- Water schedules were not followed by some
members
14 No secondary data yet for IA Profile.

286
Victoria, San
Mateo IA
(upstream)
Div 2
Crop: Rice
Yield: 129 (dry); 129
(wet)
Total cost: P30,000
ISF: 2975 (dry); 2125
(wet)
CE: 85%
Technical/Physical
- Canals are eroded and damaged
- Request for additional concrete roads for all
IAs
Der-An IA
(midstream)
Crop: Rice
Yield: 150 (dry); 100
(wet)
Total cost: P45,000
ISF: 2975 (dry); 2125
(wet)
CE: 60%
Technical/Physical
- Lateral canals need to be rehabilitated
- Earth canals have to be lined
- NIA’s equipment are inadequate to service
the system. This leads to longer response
time of NIA to address the farmers’
concerns
Institutional/Socio-Economic/Political/Cultural
- Need regulation on prohibition of animals in
the canals
Victory IA
(downstream)
Crop: Rice
Yield: 100 (wet); 100
(dry)
Total cost: P45,000
ISF: 2975 (dry); 2125
(wet)
CE: 62%
Technical/Physical
- Canals are silted and damaged due to
carabaos
- Incomplete lining of canals. NIA’s efforts
are not sufficient due to financial constraints

287
Solana Pump Irrigation System15
IA Profile Issues and Concerns
Muhara IA –
(upstream)
Crop: Rice
Yield: 90-100 (dry);
45-50 (wet)
Total cost: P20,000 -
30,000
ISF: 6375/ha with
25% discount for
those who re-pumped
CE: 57-87%
Model 1
Technical/Physical
- Elevation of canal is lower than paddies
therefore, surface pumps are needed to draw
water
- Sediments clog the main canal thus constant
clearing is needed
- Domestic and commercial solid and liquid
wastes are thrown towards the irrigation
canals
- Water is very limited due to high cost of
pump operation (29 million) due to high
electricity prices
- Irrigation equipment and facilities are
damaged when operation is left with farmers
- 5 in 2 scheme greatly decreased the yield of
farmers
Northern
Solana Rice
Producer IA
(midstream)
Crop: Rice
Yield: 120-150 [hyb]
(dry); 100-130 [hyb]
(wet)
Total cost: P30,000 –
P35,000
ISF: 6500/ha
CE: 80%
Model 1
Technical/Physical
- Rat infestation during dry season
- Implementation of AWD is not effective
- Concreting of farm-to-market roads
- Installation of steel gates and regulator
- Desilting of canals
NWSFIA
(downstream)
Crop: Rice
Yield: 100 (dry); 80
(wet)
Total Cost: P40,000
ISF:6375/ha
Model 1
Technical/Physical
- Earth canals need to be lined
- Drainage rehabilitation
- Due to high level of canal, surface pumps
are used. Surface pump costs P20,000 per
unit
- Pest infestations (eel, rat, tungro)
15 No secondary data for IA profile.

288
Magapit Pump Irrigation System16
IA Profile Issues and Concerns
Lal-lo IA
(upstream)
Crop: Rice
Yield: 120 (dry); 80-
100 (wet)
Total cost: P35,000 -
40,000
ISF: 3187.50
normally but 2550 for
those who re-pumped
CE: 98%
Model 1
Technical/Physical
- Silted canals drainage
- Drainage water cannot get through since
elevation of drainage is lower than the river
- Paddies are flooded during wet season due
to overflow of river
- Herbicides of upland farmers go through
lowland paddies
- Upland farming contributes to siltation
- Canals are heavily silted which also results
to clogged drainage
- There are salt water intrusion in times of
calamities
- The root cause of siltation is the Cagayan
river, therefore dredging the river is the
immediate solution
Camalap IA
(midstream)
Crop: Rice
Yield: 120 (dry);
60(wet)
Total cost: P30,000 –
P35,000
ISF: 3187.50
CE: 94%
Model 1
Technical/Physical
- There are illegal turnouts
- During wet season, there are areas that are
not plantable
- River is fully silted therefore the silt flows
to the canals during rainy season
- Pest infestation
- Presence of illegal settlers along canals
Institutional/Socio-Economic/Political/Cultural
- Some members do not follow the water
schedule. They open the gate during night
time.
16 No secondary data for IA profile.

289
Zigiran-
Dadan IA
(downstream)
Crop: Rice
Yield: 120 (dry); 75
(wet)
Total Cost: P40,000
ISF: 3187.50
normally but 2550 for
those who re-pumped
CE: 65-75%
Model 1
Technical/Physical
- Earth canals need to be lined
- Heavy siltation
- Inadequate heavy equipment to address
siltation
- Need to rehabilitate canals
- Implement ordinances for irrigation
- Need buster pump to pump water from
drainage canal

290
Visitacion Irrigation System17
IA Profile Issues and Concerns
Dagupan IA
– USUAC
sector
(upstream)
Crop: Rice
Yield: 200 (dry); 150
(wet)
Total cost: P35,000
ISF: 2500 (dry); 1500
(wet)
CE: 100%
Model 1
Technical/Physical
- There is a corner area of an irrigation canal
which is very near the river. The water flow
has to be carefully regulated because strong
flow might damage the canal. Overflow of
the canal will lead to merging of water
between river and irrigation. This redirects
the irrigation water to the river instead of
going to the farm area.
- There is a link canal from other alternative
sources but a check structure has to be
installed to prevent too much water gushing
in
- Farm to market road are damaged and have
not been rehabilitated for the last 3 years.
- Farm roads are currently under DA.
Previously, maintenance of the road is fine
under NIA
- Proposed to have an impounding dam to
avoid water shortage
- More investment on heavy equipment as it
is urgently needed
Initiatives/Success Stories
- The IA implements strict rules and
regulation. There is a penalty of P500 per
violation.
- Not planting on the intended cropping
calendar is also a violation. Therefore, when
farmers do not plant, they will still have to
pay P500. Otherwise, no water for next
cropping and penalty will be doubled if
violation will reach another cropping
season.
17 No secondary data for IA profile.

291
- Revenues from penalties usually reach 8000
per year
- Revenue from collection incentive is 4000
per year
Dagupan IA
– CABISIA
sector
(midstream)
Crop: Rice
Yield: 180 ca/ha
Total cost: P30,000
ISF: 2550 (dry); 1700
(wet)
CE: 70-100%
Model 1
Technical/Physical
- Farm-to-market roads have deteriorated
- Needs mini dam or impounding dam to
store water for dry season
- Some private owners don’t allow NIA to
dredge portions of drainage.
Dagupan IA
– KAVISYA
sector
(downstream)
Crop: Rice
Yield: 100 (dry); 70
(wet)
Total cost: P30,000
ISF: 2550 (dry); 1700
(wet)
CE: 80-100%
Model 1
Technical/Physical
- Difficulty in water delivery due to canals
not being lined
- Heavy siltation of canals
- Damaged roads and difficult access
- Needs heavy equipment (backhoe)
- There’s a need to use surface pumps for
water to reach the area
- Surface pump operation cost is P8000 per
cropping

292
Pampanga Delta River Irrigation System
IA Profile Issues and Concerns
Sto. Nino
Candating IA
(Upstream)
Crop: Rice
Yield: 100-110 (dry);
70-80 (wet)
CE: 94%
FUSA: 220 ha
Program Area: 220
ha
Total Area Planted:
158.10 ha
CI: 72%
IMT Model 2
Technical/Physical
- Most laterals are earth canals
- Experienced pest infestation in 2013 due to
5 in 2
- LGU promised a backhoe but have not
materialized
Magcasaup
IA
(Midstream)
Crop: Rice
Yield: 80-100 (dry);
60-70 (wet)
Total cost:
PhP50,000
ISF: 2550 (dry);
1700 (wet)
CE: 91-100%
FUSA: 99.30 ha
Program Area: 99.30
ha
Total Area Planted:
128.07 ha
CI: 129%
IMT Model 2
Institutional/Socio-Economic/Political/Cultural
- Farmers only get break-even thus cannot
pay the ISF
- No provisions or ordinance in the by-laws
which holds the officer accountable
San Carlos-
Sta.Rita-San
Pedro IA
(downstream)
Crop: Rice
Yield: 80-100 (dry);
50-60 (wet)
Total cost: P20,000
ISF: 2550 (dry);
1700 (wet)
CE: 60%
FUSA: 162.60 ha
Program Area:
162.60 ha
Total Area Planted:
154.35
CI: 95%
IMT Model 2
Technical/Physical
- There is double pumping of water from
drainage
- Pump operating cost is P3000
- Need to improve irrigation facilities
- Rehabilitation of damaged canals
- NIA has no adequate funds for
implementation of projects
Institutional/Socio-Economic/Political/Cultural
- Conflict arises due to difficulty in
convincing members to pay the ISF

293
- Reshuffling of management affects
prioritization of programs which leads to
delay or cancellation
- Funds should go directly to NIA, not to
other channels, since farmers have strong
linkage with NIA
Initiatives/Success stories
- Improvements were made through lining
and desilting of canals funded by
congressmen and politicians.

294
Tarlac Groundwater Irrigation System (TGIS)18
IA Profile Issues and Concerns
TG 86 ISC Crop: Rice
Yield: 80-90 (dry); 0
(wet)
Pump cost: 2 drums
of diesel per hectare;
1 cavan per hectare
(operator’s salary)
Technical/Physical
- Most areas are flooded during wet season
thus, one cropping only
- For non-cropping season, farmers go to other
areas to do farming labor
- Usual conflict is due to distribution schedule
Institutional/Socio-Economic/Political/Cultural
Difficulty in renewing cooperative registration
due to administrative requirements
TG 09
Kalibuan ISC
Crop: Rice
Yield: 100-
130/170[hyb] (dry);
90 (wet)
Total cost: P40,000
per hectare [hyb]
Pump cost: 200 liters
per hectare; P50 per
hectare (operator’s
salary); P150 per
member for
maintenance and
repair of pump
Technical/Physical
- Visit and support from NIA declined since
2005 due to cost constraints. Further
declined due to Rationalization Plan
Institutional/Socio-Economic/Political/Cultural
- Farmers tend to be resistant to change such
as using hybrid and organic farming.
- Values of farmers have to be influenced to
be adaptable to change and new technology
Initiatives/Success stories
- There is an additional income to the IA by
using the pump to supply domestic water to
households
GT 125 ISC Crop: Rice and
yellow corn
Yield: 100-150
[hyb] (dry); 80-100
(wet)
Total cost: P30,000
– P35,000 [hyb]
Pump cost: 7% of
total revenue (rice);
5% of total revenue
(corn)
Initiatives/Success stories
- One of the most successful irrigation
cooperatives.
- They were able to complete the payment of
the amortization of the pump to NIA.
- Used the pump to provide irrigation water to
other groups which have insufficient water.
- The success of the cooperative was able to
construct an additional 300 meters of lined
canal, renovate the pump house, and
maintain the pump condition
18 No IA profile from IS.

295
CE: 100%

296
Tarlac-San Miguel-O'Donnel River Irrigation System (TASMORIS – 2 NIS)19
IA Profile Issues and Concerns
Maliwalo IA
– (Lateral IA)
Crop: Rice, mongo
Yield: 140 (dry);
110 (wet)
ISF: 2500 (dry);
1500 (wet)
CE: 70%
Technical/Physical
- Solid waste management on canals
- Need to use pump as supplement during dry
season
- Cost of unit of pump is P15,000
- Irrigation canal must be desilted and cleared
of trash
Himala IA –
(midstream)
Crop: Rice, mongo
Yield: 100 (dry);
90(wet)
ISF: 2500 (dry);
1700 (wet)
CE: 90%
Model 1
Technical/Physical
- Insufficient water during dry season
- Need to construct an additional impounding
dam for water storage
- water should be continuous and without
rotation schedule
- Invest in more heavy equipment (backhoe)
19 No secondary data IA profile from IS.
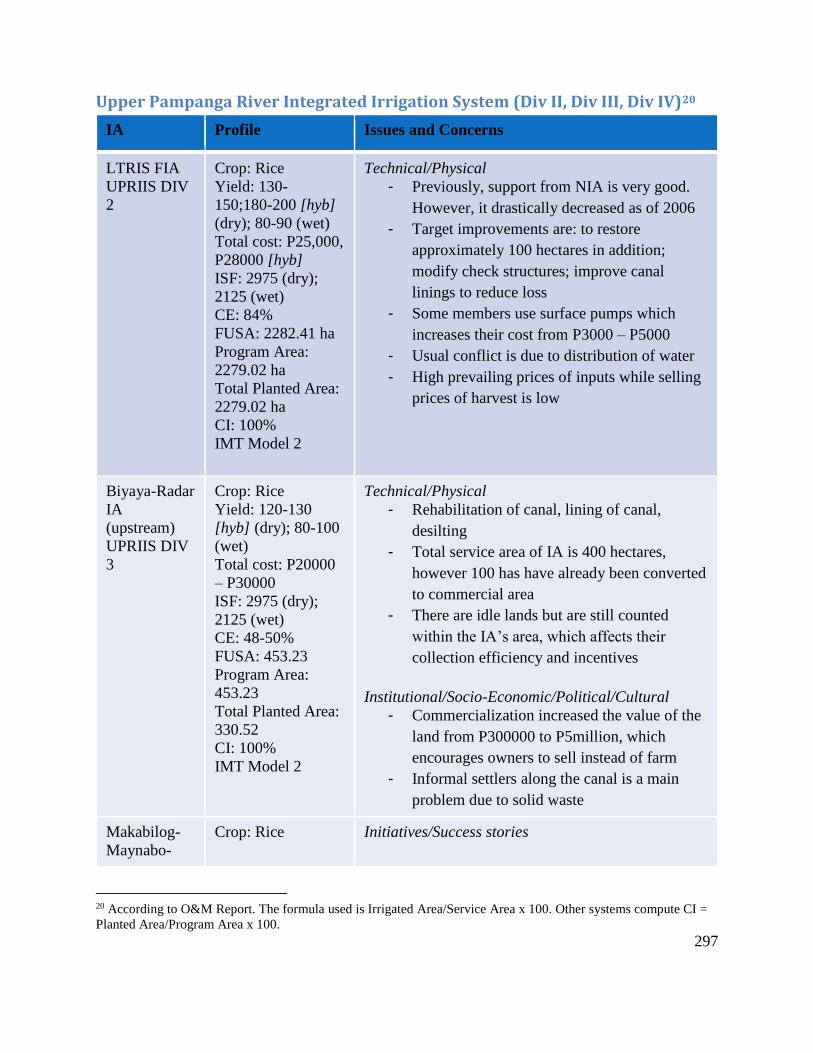
297
Upper Pampanga River Integrated Irrigation System (Div II, Div III, Div IV)20
IA Profile Issues and Concerns
LTRIS FIA
UPRIIS DIV
2
Crop: Rice
Yield: 130-
150;180-200 [hyb]
(dry); 80-90 (wet)
Total cost: P25,000,
P28000 [hyb]
ISF: 2975 (dry);
2125 (wet)
CE: 84%
FUSA: 2282.41 ha
Program Area:
2279.02 ha
Total Planted Area:
2279.02 ha
CI: 100%
IMT Model 2
Technical/Physical
- Previously, support from NIA is very good.
However, it drastically decreased as of 2006
- Target improvements are: to restore
approximately 100 hectares in addition;
modify check structures; improve canal
linings to reduce loss
- Some members use surface pumps which
increases their cost from P3000 – P5000
- Usual conflict is due to distribution of water
- High prevailing prices of inputs while selling
prices of harvest is low
Biyaya-Radar
IA
(upstream)
UPRIIS DIV
3
Crop: Rice
Yield: 120-130
[hyb] (dry); 80-100
(wet)
Total cost: P20000
– P30000
ISF: 2975 (dry);
2125 (wet)
CE: 48-50%
FUSA: 453.23
Program Area:
453.23
Total Planted Area:
330.52
CI: 100%
IMT Model 2
Technical/Physical
- Rehabilitation of canal, lining of canal,
desilting
- Total service area of IA is 400 hectares,
however 100 has have already been converted
to commercial area
- There are idle lands but are still counted
within the IA’s area, which affects their
collection efficiency and incentives
Institutional/Socio-Economic/Political/Cultural
- Commercialization increased the value of the
land from P300000 to P5million, which
encourages owners to sell instead of farm
- Informal settlers along the canal is a main
problem due to solid waste
Makabilog-
Maynabo-
Crop: Rice Initiatives/Success stories
20 According to O&M Report. The formula used is Irrigated Area/Service Area x 100. Other systems compute CI =
Planted Area/Program Area x 100.

298
Tambo IA
(midstream)
UPRIIS DIV
3
Yield: 100-120
[hyb] (dry); 80
(wet)
Total cost: P50,000
ISF: P2550 (dry);
P1700 (wet)
CE: 100%
FUSA: 112.58
Program Area:
112.58
Total Planted Area:
103.58
CI: 100%
IMT Model 1
- The IA became profitable since they were
able to acquire farm assets (thresher, flat bed
drier, harvester, tractor, rice mill). It started
by a flatbed drier through a grant in which
they had it rented to others for a price
- The IA was also able to build its own office
due to the profit
Flume
(downstream)
UPRIIS DIV
3
Crop: Rice
Yield: 130 [hyb]
(dry); 80(wet)
Total cost: P60000
(dry) – P30000
(wet)
ISF: 2975 (dry);
2125 (wet)
CE: 84%
FUSA: 342.23
Program Area:
342.23
Total Planted Area:
329.73
CI: 100%
IMT Model 1
Technical/Physical
- Low production only during calamity times
(i.e. Xanti, 2013)
Mapamasa
IA
(upstream)
UPRIIS DIV
4
Crop: Rice
Yield: 120-150
[hyb] (dry); 80-100
(wet)
Total cost: P50,000
(dry) – P30,000
(wet)
ISF: 2975 (dry);
2125 (wet)
CE: 84%
FUSA: 231.27
Total Planted Area:
228.55
CI: 99%
Technical/Physical
- Farmers experience delay and occasional
shortage of water
- Earth canals are very prone to damage and
siltation
- Declining water supply due to heavy siltation
of Penaranda river
- Heavy siltation is due to poor watershed
management
- Water source is too far (Pantabangan dam),
thus even if the dam is full, the water is still
few for the area since it has to travel a very
long distance before it reaches the division

299
Type 4
- Highly recommend to continue the proposed
Balintingon dam where it could store water
near Division 4 area
Initiatives/Success stories:
- members patronize sikat saka
- early payors of ISF have 10% discount
Penaranda IA
(downstream)
UPRIIS DIV
4
Crop: Rice
Yield: 120 (dry);
110 (wet)
Total cost: P50,000
CE: 100%
FUSA: 228.79
Total Planted Area:
228.79
CI: 100%
Model 4
Technical/Physical
- A pump is used to service a part of the
elevated area
- Cost of maintenance and repair for the pump
is P22,000 annually; Cost of operation
reaches P211,000; operator of pump is given
P7000 per month; BOD that maintains the
pump is given P3000 per month
- Need to concretize farm-to-market roads
- Need to desilt and line the canals
- Earth canals are very prone to damage which
also contributes to siltation

300
Angat-Maasim River Irrigation System21
IA Profile Issues and Concerns
MASACPI
IA
(upstream)
Crop: Rice
Yield: 120 (dry); 98
(wet)
Total cost: P50,000
(dry) – P30,000 (wet)
ISF: 2550 (dry); 1800
(wet)
CE: 63%
Type 4
Technical/Physical
- Needs a structure that will regulate water
release to reduce efficiency loss
- Convert earth canals to line canals
- Members normally use 8hp surface pumps
which will cost around P90,000 for the
entire assembly
- Concretize farm-to-market road
- Main concern is to have adequate equipment
for continuous rehabilitation
Institutional/Socio-Economic/Political/Cultural
- Usual cause of conflict is when upstream
members block the path of water which
affects downstream water supply
- 1% penalty for not paying ISF is too lenient
and low
Initiatives/Success stories:
- members patronize sikat saka
- early payors of ISF have 10% discount
Bagbaguin-
Manatal IA
(midstream)
Crop: Rice
Yield: 140 (dry); 100
(wet)
ISF: 2550 (dry); 1700
(wet)
CE: 82%
Technical/Physical
- Embankment is damaged and main canal is
heavily silted
21 No secondary data IA profile from IS.

301
Balayungan RIS
IA Profile Issues and Concerns
Bucal Pasong
Malainen
Luma IA
(upstream)
Crop: Rice
Yield: 100 (dry); 80
(wet); 60 (3rd)
Total cost: P30,000-
P40,000
ISF: 4000 (dry); 2000
(wet and 3rd cropping)
CE: 77%
Model 1
Technical/Physical
- Farm to market road
Institutional/Socio-Economic/Political/Cultural
- Low buying price of crops
- Stealing of water
Balite Munti
IA
(midstream)
Crop: Rice
Yield: 80 (dry); 70
(wet)
Total cost: P30,000
ISF: 2500 (dry); 2200
(wet)
CE: 60%
Model 1
Technical/Physical
- Farm to market road
- Need to construct a water impounding
facility for sufficient water supply
Institutional/Socio-Economic/Political/Cultural
- Occurrence of stealing of water
Malaking
Pilapil/
Magabe C -
IA
(downstream)
Crop: Rice
Yield: 80 (dry); 75
(wet)
Total cost: P30,000-
P40,000
ISF: 5600 (dry); 3600
(wet)
CE: 70%
Model 1
Technical/Physical
- Farm to market road
Institutional/Socio-Economic/Political/Cultural
- Incidence of water stealing
- Not following the water schedule
- Not paying ISF

302
Caguray Irrigation System22
IA Profile Issues and Concerns
Purnaga
Magsaysay
IA
(upstream)
Crop: Rice, onion,
ginger
Yield: 130(dry); 80
(wet)
Total cost: P42,000
ISF: 2550 (dry); 1700
(wet)
CE: 60%
Model 1
Technical/Physical
- Canals should be cemented and cleaned
- There is a small impounding dam but
cannot be used because farmers steals the
equipment
- Due to low water supply, members resort to
the use of STW which costs P30,000 per
unit
- Water supply is really inadequate, thus
propose to have groundwater extraction
instead
- Install steel gates and regulators
Bugtong Buri
Olima IA
(midstream)
Crop: Rice, corn,
onion, garlic
Yield: 80 (dry); 60
(wet) – rice; 20
tons/ha (onion); 60
ca/ha (corn)
Total cost: P30,000
ISF: 2550 (dry); 1700
(wet)
CE: 90% (wet only)
*dry 0%
Type 2
Technical/Physical
- Very low water supply from source
- Most uses STW due to low water supply
- Cost of pump per unit is P30,000
- Water scheduling is not properly
implemented. Scheduling is implemented
even wet season
- Proposed to have a water impounding
project to store water
- Constant need for a heavy equipment for
desilting purposes
Gamot Bolo
Nicolas IA
(downstream)
Crop: Rice
Yield: 100 (wet); 50
ca/ha (dry) – but not
all can do 2nd crop.
Only those with pump
Pump operating cost:
P3000
ISF: 1700 (wet only)
Model 1
Technical/Physical
- Very low water supply
- Canals are heavily silted since majority are
earth canals, even in the main canal
- Earth canals are damaged by carabaos
when they dip in the water
Institutional/Socio-Economic/Political/Cultural
- There is a pending check dam initiated by
LGU since 2013 but construction have not
been completed until the present
22 No secondary data for IA profile.

303
- Ordinance in preventing carabaos in the
irrigation canals not properly implemented

304
Libmanan-Cabusao Pump Irrigation System23
IA Profile Issues and Concerns
Labao-
Boguites IS
(upstream)
Crop: Rice
Yield: 100 (dry); 80
(wet)
Total cost: P30,000
ISF: 2550
CE: 52%
Technical/Physical
- Low water supply
- Only 2 out of 4 pumps are currently used
- Need to use 6hp pump in order to pump the
water from the canal
- Construct dam for gravity irrigation instead
of pump
BPC IA and
PNPC IA
(downstream)
Crop: Rice
Yield: 80 (dry); 60
(wet)
Total cost: P30,000
ISF: 2550 (dry); 1700
(wet)
CE: 45%
Model 2
Technical/Physical
- Insufficient supply of water
- Canals are on a lower level of elevation vs
farms
- Seawater comes in the drainage during high
tide
- Due to insufficiency of water, most farmers
depends on rainfall instead of irrigation
- Insufficiency in water could be remedied by
using 4 pumps at the same time
- Farmers are having no interest to participate
in irrigation maintenance and operation
activities due to water service
23 No secondary data for IA profile.

305
ANNEX 2. SAMPLE CIS IN SELECTED IMO/PROVINCES KEY INFORMANT
INTERVIEWS
Benguet (Kalinga-Ifugao-Mt Province IMO)
IA Profile Issues and Concerns
Taloysur IA
(Baw-ak Taloysur,
Tuba)
SA/FUSA: 30 has./30 has.
CI: 200%
CE: 100%
ISF Rate/Amortization: 0
Equity: grant thru
Balikatan Sagip Patubig
Program
Crop: Various Veggies &
Flowers
Yield/ha: Various yield
Production Cost/Ha.:
Various Veggies &
Flowers - P56 K to P500
K (wet & dry)
Type of System: Gravity
No. of members:44
Tenure Status:100%-
landowners
Project Cost & Source of
Fund: P2.5 Mn under
Balikatan Sagip Patubig
Program
Undergone
rehab/extensions, cost &
source of fund: Yes, IA
repaired damaged pipes
with varying cost from P20
K to P100 K per repair
using IA’s own fund
Other modes of
supplementary irrig: none
Physical/Technical
- Protection of their water source
by making the area as eco park
- Additional pipe extension to
increase service area
- Livelihood programs
Institutional
- Conflict resolution ability (0 –
nothing done, 1 – not effective
since conflicts are not resolved, 2
– not very effective as conflict
happens occasionally, 3 –
moderately successful as the
conflict repeatedly happens, 4 –
very effective, conflicts happen
rarely): 4
- IA’s accountability provision
effectiveness (0 – not effective, 1
– rarely, 2 – sometimes, 3-
frequent, 4 – always effective): 4
- Water allocation or delivery
service (0 – no water received, 1
– all do not receive sufficient
water when needed, 2 – not all
receive required water more
often, 3 – all receive required
volume but with occasional
delay, 4 – all receive required
volume at the right time): 4
(upstream to downstream)
- With water permit? Yes
Financial
- Sources of funds/income: IA’s
ISF of P500/member/year
- Expenditure Items: M&OE &
water rights fee

306
- Assistance from NIA/other
agencies: LGU gave grant
through Balikatan Sagip Patubig
Program (P2.5 Mn)
Governance
- Participation of Officers/BOD &
members: Officers/BOD – 100%,
Members – 90%
Parasipis PIS
Integrated Service
Association(Tabaan
Norte, Tuba)
SA/FUSA: 133 has./125
has.
CI: 176%
CE: already paid off
equity
ISF Rate/Amortization: 0
Equity: already paid off
the 30% equity of P3 Mn
by rendering labor &
cash payments
Crop: Rice, Various
veggies & fruits
Yield/ha: Rice – 40-50
(wet), 30-40 (dry);
Various veggies & fruits
- various yields
Production Cost/Ha.:
various veggies & fruit -
P15 K to P80 K (wet &
dry)
Type of System: Gravity
No. of members:173
Tenure Status:100%-
landowners
Project Cost & Source of
Fund: P3 Mn by NIA
Undergone
rehabilitation/extensions,
cost & source of fund:
Yes, IA repaired
damaged pipes with
varying cost using IA’s
own fund
Physical/Technical
- Access roads in their fields
- Extensions of lateral pipes to
irrigate more areas
Institutional
- Conflict resolution ability (0 –
nothing done, 1 – not effective
since conflicts are not resolved, 2
– not very effective as conflict
happens occasionally, 3 –
moderately successful as the
conflict repeatedly happens, 4 –
very effective such that conflicts
happens rarely): 3
- IA’s accountability provision
effectiveness (0 – not effective, 1
– rarely, 2 – sometimes, 3-
frequent, 4 – always effective): 4
- Water allocation or delivery
service (0 – no water received, 1
– all do not receive sufficient
water when needed, 2 – not all
receive required water more
often, 3 – all receive required
volume but with occasional
delay, 4 – all receive required
volume at the right time): 2
(upstream to downstream)
- With water permit? Yes
Financial
- Sources of funds/income: IA’s
Annual Due of P50/member
- Expenditure Items: M&OE &
water rights fee

307
Other modes of
supplementary irrigation:
none
- Assistance from NIA/other
agencies: LGU gave P200 K for
rehab
Governance
- Participation of Officers/BOD
and members: Officers/BOD –
100%, Members – 90%
Balangabang
Mabosas
Labney
Laget
Farmer’s
IA(Tabaan
Norte, Tuba)
SA/FUSA: 168 has./168
has.
CI: 182%
CE: already paid off
equity
ISF Rate/Amortization:
0
Equity: already paid off
the 30% equity of P1.2
Mn by rendering labor &
cash payments
Crop: Various veggies &
root crop
Yield/ha: various yields
Production Cost/Ha.:
various veggies & root
crop - P40 K to P160 K
(wet & dry)
Type of System: Gravity
No. of members: 48
Tenure Status:100%-
landowners
Project Cost & Source of
Fund: P1.2 Mn by NIA
Undergone
rehabilitation/extensions,
cost & source of fund:
Yes, IA repaired
damaged pipes with
varying cost using IA’s
own fund
Physical/Technical
- Concreting of their existing access roads
- Construction of additional access roads
- Rehabilitation of old pipe systems
Institutional
- Conflict resolution ability (0 – nothing
done, 1 – not effective since conflicts are
not resolved, 2 – not very effective as
conflict happens occasionally, 3 –
moderately successful as the conflict
repeatedly happens, 4 – very effective
such that conflicts happens rarely): 3
- IA’s accountability provision
effectiveness (0 – not effective, 1 –
rarely, 2 – sometimes, 3- frequent, 4 –
always effective): 4
- Water allocation or delivery service (0 –
no water received, 1 – all do not receive
sufficient water when needed, 2 – not all
receive required water more often, 3 – all
receive required volume but with
occasional delay, 4 – all receive required
volume at the right time): 2 (upstream to
downstream)
- With water permit? Yes
Financial
- Sources of funds/income: IA’s Annual
Due of P250/member
- Expenditure Items: M&OE & water
rights fee
- Assistance from NIA/other agencies:
DSWD gave P3 K for food during repair
works, LGU gave P200 K for rehab
Governance

308
Other modes of
supplementary
irrigation: none
- Participation of Officers/BOD and
members: 90%

309
Ilocos Norte IMO
IA Profile Issues and Concerns
Dangdanglas
IA
(Baruyen,
Bangui)
SA/FUSA: 15 has./15
has.
CI: 200%
CE: 30%
ISF Rate/Amortization:
0
Equity: paid off equity
Crop: Rice, Corn &
Onion
Yield/ha: Rice – 15-25
(wet), 20-30 (dry); Corn
– 6,800 kg, Onion –
10,400 kg (dry)
Production Cost/Ha.:
Rice - P27,000 per
season, Corn – P20,000,
Onion – P80,000
Type of System: Gravity
No. of members:35
Tenure Status: 74%-
landowners, 26%-
tenants
Project Cost & Source of
Fund: P23 Mn by LGU
(Senator Alvarez
Project)
Undergone
rehabilitation/extensions,
cost & source of fund:
no
Other modes of
supplementary
irrigation: none
Physical/Technical
- Replace wooden control gates to steel
gates
Institutional
- Conflict resolution ability (0 – nothing
done, 1 – not effective since conflicts are
not resolved, 2 – not very effective as
conflict happens occasionally, 3 –
moderately successful as the conflict
repeatedly happens, 4 – very effective
such that conflicts happens rarely): 3
- IA’s accountability provision
effectiveness (0 – not effective, 1 – rarely,
2 – sometimes, 3- frequent, 4 – always
effective): 2
- Water allocation or delivery service (0 –
no water received, 1 – all do not receive
sufficient water when needed, 2 – not all
receive required water more often, 3 – all
receive required volume but with
occasional delay, 4 – all receive required
volume at the right time): 3 (downstream
to upstream)
- With water permit? Yes
Financial
- Sources of funds/income: IA’s annual due
of P900 plus/member
- Expenditure Items: Salaries, M&OE &
annual water permit
- Assistance from NIA/other agencies:
LGU gave P3,000 for roof of meeting
place of IA
Governance
- Participation of Officers/BOD and
members: 100%

310
Tanap A
Dakkkel
IA
(Baduang,
Pagudpud)
SA/FUSA: 435 has./435
has.
CI: 169%
CE: already paid off
loan
ISF Rate/Amortization:
paid off loan
Equity: 0
Crop: Rice
Yield/ha: Rice – 100-
150 (wet), 50-70 (dry)
Production Cost/Ha.:
Rice - P40,000 per
season
Type of System: Gravity
No. of members:525
Tenure Status: 38%-
landowners, 62%-
tenants
Project Cost & Source of
Fund: By NIA
Undergone
rehabilitation/extensions,
cost & source of fund:
Yes, repaired damaged
canal about 200 meters
using IA fund
Other modes of
supplementary
irrigation: none
Physical/Technical
- Additional pump & STWs for dry season
- Source of water
- Canal lining
Institutional
- Conflict resolution ability (0 – nothing
done, 1 – not effective since conflicts are
not resolved, 2 – not very effective as
conflict happens occasionally, 3 –
moderately successful as the conflict
repeatedly happens, 4 – very effective such
that conflicts happens rarely): 3
- IA’s accountability provision effectiveness
(0 – not effective, 1 – rarely, 2 –
sometimes, 3- frequent, 4 – always
effective): 3
- Water allocation or delivery service (0 – no
water received, 1 – all do not receive
sufficient water when needed, 2 – not all
receive required water more often, 3 – all
receive required volume but with
occasional delay, 4 – all receive required
volume at the right time): 2 (upstream to
downstream)
- With water permit? No
Financial
- Sources of funds/income: IA’s annual due
of P100 /member
- Expenditure Items: Salaries, M&OE
- Assistance from NIA/other agencies: none
Governance
- Participation of Officers/BOD and
members: Officers/BOD – 80%, Members
– 70%

311
Palongpong
IA
(Palompomg,
Pagudpud)
SA/FUSA: 35 has./35
has.
CI: 100%
CE: 70%
ISF Rate/Amortization:
0
Equity: 0
Crop: Rice, Corn, Garlic
Yield/ha: Rice – 120-
140 (wet), Corn - 4500
(dry), Tomato - 6600 kg
(dry)
Production Cost/Ha.:
Rice - P25,000 (wet),
Corn – P18,000 (dry),
Tomato – P30,000 (dry)
Type of System: Gravity
No. of members:100
Tenure Status: 80%-
landowners, 20%-
tenants
Project Cost & Source of
Fund: Grant by national
government through
Balikatan Sagip Patubig
Program
Undergone
rehabilitation/extensions,
cost & source of fund:
none
Other modes of
supplementary
irrigation: all SA pump
from STW during dry
season
Physical/Technical
- Source of water
- Rehabilitation of canals
Institutional
- Conflict resolution ability (0 – nothing
done, 1 – not effective since conflicts are
not resolved, 2 – not very effective as
conflict happens occasionally, 3 –
moderately successful as the conflict
repeatedly happens, 4 – very effective
such that conflicts happens rarely): 2
- IA’s accountability provision
effectiveness (0 – not effective, 1 –
rarely, 2 – sometimes, 3- frequent, 4 –
always effective): 0
- Water allocation or delivery service (0 –
no water received, 1 – all do not receive
sufficient water when needed, 2 – not all
receive required water more often, 3 – all
receive required volume but with
occasional delay, 4 – all receive required
volume at the right time): 2 (downstream
to upstream)
- With water permit? No
Financial
- Sources of funds/income: IA’s ISF of 5
cents/m2
- Expenditure Items: Salaries, M&OE
- Assistance from NIA/other agencies:
National government paid the 30% equity
of project cost
Governance
- Participation of Officers/BOD and
members: 80%

312
Pangasinan IMO
IA Profile Issues and Concerns
San
AngelSRIP
IA (San
Angel,
Rosales)
SA/FUSA: 160 has./160
has.
CI: 150%
CE: 95%
ISF Rate/Amortization:
P20,000/year
Equity: 0
Crop: Rice
Yield/ha: Rice – 100-
130 (wet),100-150 (dry)
Production Cost/Ha.:
Rice - P30,000 per
season
Type of System: Gravity
No. of members: 150
Tenure Status: 33%-
landowners, 66%-
tenants, 1%-lessees
Project Cost & Source of
Fund: P150 Mn by NIA
Undergone
rehabilitation/extensions,
cost & source of fund:
no
Other modes of
supplementary
irrigation: none
Physical/Technical
- Water going through the spillway should
be rerouted back to the dam
Institutional
- Conflict resolution ability (0 – nothing
done, 1 – not effective since conflicts are
not resolved, 2 – not very effective as
conflict happens occasionally, 3 –
moderately successful as the conflict
repeatedly happens, 4 – very effective such
that conflicts happens rarely): 1
- IA’s accountability provision effectiveness
(0 – not effective, 1 – rarely, 2 –
sometimes, 3- frequent, 4 – always
effective): 3
- Water allocation or delivery service (0 – no
water received, 1 – all do not receive
sufficient water when needed, 2 – not all
receive required water more often, 3 – all
receive required volume but with
occasional delay, 4 – all receive required
volume at the right time): 3 (downstream
to upstream)
- With water permit? Yes
Financial
- Sources of funds/income: IA’s ISF of
4250/ha/cropping
- Expenditure Items: Rehabilitation &
M&OE- all fund collected less
amortization; Amortization – P
20,000/year
- Assistance from NIA/other agencies: none
Governance
- Participation of Officers/BOD and
members: Officers/BOD - 10%, Members
– 40%
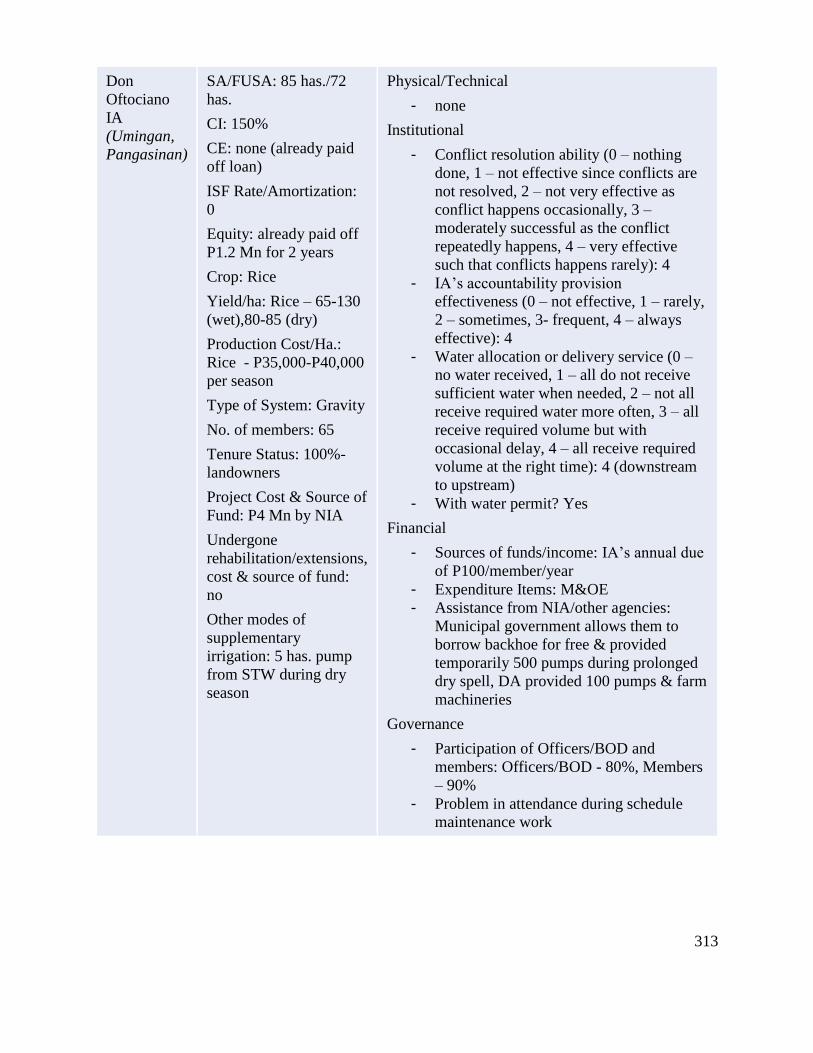
313
Don
Oftociano
IA
(Umingan,
Pangasinan)
SA/FUSA: 85 has./72
has.
CI: 150%
CE: none (already paid
off loan)
ISF Rate/Amortization:
0
Equity: already paid off
P1.2 Mn for 2 years
Crop: Rice
Yield/ha: Rice – 65-130
(wet),80-85 (dry)
Production Cost/Ha.:
Rice - P35,000-P40,000
per season
Type of System: Gravity
No. of members: 65
Tenure Status: 100%-
landowners
Project Cost & Source of
Fund: P4 Mn by NIA
Undergone
rehabilitation/extensions,
cost & source of fund:
no
Other modes of
supplementary
irrigation: 5 has. pump
from STW during dry
season
Physical/Technical
- none
Institutional
- Conflict resolution ability (0 – nothing
done, 1 – not effective since conflicts are
not resolved, 2 – not very effective as
conflict happens occasionally, 3 –
moderately successful as the conflict
repeatedly happens, 4 – very effective
such that conflicts happens rarely): 4
- IA’s accountability provision
effectiveness (0 – not effective, 1 – rarely,
2 – sometimes, 3- frequent, 4 – always
effective): 4
- Water allocation or delivery service (0 –
no water received, 1 – all do not receive
sufficient water when needed, 2 – not all
receive required water more often, 3 – all
receive required volume but with
occasional delay, 4 – all receive required
volume at the right time): 4 (downstream
to upstream)
- With water permit? Yes
Financial
- Sources of funds/income: IA’s annual due
of P100/member/year
- Expenditure Items: M&OE
- Assistance from NIA/other agencies:
Municipal government allows them to
borrow backhoe for free & provided
temporarily 500 pumps during prolonged
dry spell, DA provided 100 pumps & farm
machineries
Governance
- Participation of Officers/BOD and
members: Officers/BOD - 80%, Members
– 90%
- Problem in attendance during schedule
maintenance work

314
Sapid Dam
Farmer’s
IA
(Labayug,
Sison)
SA/FUSA: 50 has./50
has.
CI: 150%
CE: 90%
ISF Rate/Amortization:
P60,210.40/year
Equity: 0
Crop: Rice, Peanuts &
Corn
Yield/ha: Rice – 60-100
(wet & dry), Peanuts –
6,800 kg, Corn – 6,800
kg
Production Cost/Ha.:
Rice - P33,333 per
season, Peanut –
P30,000, Corn –
P20,000
Type of System: Gravity
No. of members: 40
Tenure Status: 50%-
landowners, 50%-
tenants
Project Cost & Source of
Fund: P3 Mn by NIA
Undergone
rehabilitation/extensions,
cost & source of fund:
no
Other modes of
supplementary
irrigation: 25 has. pump
from STW during dry
season
Physical/Technical
- Lining of 200 meter main canal
- Lack of water supply
Institutional
- Conflict resolution ability (0 – nothing
done, 1 – not effective since conflicts are
not resolved, 2 – not very effective as
conflict happens occasionally, 3 –
moderately successful as the conflict
repeatedly happens, 4 – very effective such
that conflicts happens rarely): 3
- IA’s accountability provision effectiveness
(0 – not effective, 1 – rarely, 2 –
sometimes, 3- frequent, 4 – always
effective): 3
- Water allocation or delivery service (0 – no
water received, 1 – all do not receive
sufficient water when needed, 2 – not all
receive required water more often, 3 – all
receive required volume but with
occasional delay, 4 – all receive required
volume at the right time): 2 (upstream to
downstream)
- With water permit? Yes
Financial
- Sources of funds/income: IA’s ISF of
P1,005/ha/cropping & annual due of
P50/member
- Expenditure Items: M&OE &
Amortization
- Assistance from NIA/other agencies: none
Governance
- Participation of Officers/BOD and
members: Officers/BOD – 70%-80%,
Members – 70%

315
Sinbicpa
IA (Nama,
Pozorrubio)
SA/FUSA: 235 has./235
has.
CI: 150%
CE: 30%
ISF Rate/Amortization:
P1,275/ha/year
Equity: 0
Crop: Rice, Peanuts,
Mongo & Corn
Yield/ha: Rice – 70-130
(wet), 50-70 (dry);
Peanuts – 6,800 kg;
Mongo – 500 kg; Corn –
6,800 kg
Production Cost/Ha.:
Rice - P25,000 per
season, Peanut –
P30,000, Corn –
P20,000
Type of System: Gravity
No. of members: 256
Tenure Status: 90%-
landowners, 10%-
tenants
Project Cost & Source of
Fund: P9.1 Mn by NIA
Undergone
rehabilitation/extensions,
cost & source of fund:
no
Other modes of
supplementary
irrigation: 10-15 has.
pump from STW during
dry season
Physical/Technical
- Lining of all main & lateral canals
Institutional
- Conflict resolution ability (0 – nothing
done, 1 – not effective since conflicts are
not resolved, 2 – not very effective as
conflict happens occasionally, 3 –
moderately successful as the conflict
repeatedly happens, 4 – very effective such
that conflicts happens rarely): 3
- IA’s accountability provision effectiveness
(0 – not effective, 1 – rarely, 2 –
sometimes, 3- frequent, 4 – always
effective): 3
- Water allocation or delivery service (0 –
no water received, 1 – all do not receive
sufficient water when needed, 2 – not all
receive required water more often, 3 – all
receive required volume but with
occasional delay, 4 – all receive required
volume at the right time): 2 (upstream to
downstream)
- With water permit? Yes
Financial
- Sources of funds/income: IA’s
ISF/Amortization of & annual due of
P50/member
- Expenditure Items: Salaries, M&OE &
Amortization
- Assistance from NIA/other agencies: LGU
gave P13,000 worth of fuel for backhoe
clearing operation
Governance
- Participation of Officers/BOD and
members: 50%

316
Cagayan (Cagayan-Batanes IMO)
IA Profile Issues and Concerns
Gumarang
IA
(Marobbob,
Amulong)
SA/FUSA: 98 has./98
has.
CI: 20%
CE: 50%
ISF Rate/Amortization:
P55,000/year
Equity: 0
Crop: Rice
Yield/ha: Rice – 50-80
(wet), 90-100 (dry)
Production Cost/Ha.:
Rice - P20 K-P25 K
(wet & dry)
Type of System: Gravity
No. of members: 90
Tenure Status: 100%-
landowners
Project Cost & Source of
Fund: P3.5 Mn by NIA
Undergone
rehabilitation/extensions,
cost & source of fund:
Yes, NIA rehabilitated
the system due to
typhoon damage
amounting to P11.1 Mn
Other modes of
supplementary
irrigation: 2 has. pump
from STW during dry
season
Physical/Technical
- Redesign the canal to elevate its water
level
- Their intake siphon should be relocated
above ground for ease of performing the
regular declogging activities
- Rehabilitation of the 2 kilometer canal
damaged by landslide to irrigate 88 has.
more
Institutional
- Conflict resolution ability (0 – nothing
done, 1 – not effective since conflicts are
not resolved, 2 – not very effective as
conflict happens occasionally, 3 –
moderately successful as the conflict
repeatedly happens, 4 – very effective such
that conflicts happens rarely): 3
- IA’s accountability provision effectiveness
(0 – not effective, 1 – rarely, 2 –
sometimes, 3- frequent, 4 – always
effective): 2
- Water allocation or delivery service (0 – no
water received, 1 – all do not receive
sufficient water when needed, 2 – not all
receive required water more often, 3 – all
receive required volume but with
occasional delay, 4 – all receive required
volume at the right time): 1 (upstream to
downstream)
- With water permit? No
Financial
- Sources of funds/income: IA’s ISF of
P1,700/ha (wet), P2,550/ha (dry); annual
due of P100/member
- Expenditure Items: Amortization
- Assistance from NIA/other agencies: none
Governance
- Participation of Officers/BOD and
members: 80%

317
Garab IA
(Garab,
Iguig)
SA/FUSA: 160 has./160
has.
CI: 131%
CE: 80%
ISF Rate/Amortization:
no amount yet for
amortization
Equity: 0
Crop: Rice
Yield/ha: Rice – 60-100
(both wet & dry)
Production Cost/Ha.:
Rice - P25 K (wet), P35
K (dry)
Type of System: Gravity
No. of members: 95
Tenure Status: 50%-
landowners, 50% tenants
Project Cost & Source of
Fund: P8.7 Mn by DAR;
P24.7 Mn improved by
NIA
Undergone
rehabilitation/extensions,
cost & source of fund:
none
Other modes of
supplementary
irrigation: 52.5 has.
pump from STW and
creek during dry season
Physical/Technical
- Completion of the 3 kilometer mail canal
to irrigate 55 has. more
Institutional
- Conflict resolution ability (0 – nothing
done, 1 – not effective since conflicts are
not resolved, 2 – not very effective as
conflict happens occasionally, 3 –
moderately successful as the conflict
repeatedly happens, 4 – very effective such
that conflicts happens rarely): 2
- IA’s accountability provision effectiveness
(0 – not effective, 1 – rarely, 2 –
sometimes, 3- frequent, 4 – always
effective): 2
- Water allocation or delivery service (0 – no
water received, 1 – all do not receive
sufficient water when needed, 2 – not all
receive required water more often, 3 – all
receive required volume but with
occasional delay, 4 – all receive required
volume at the right time): 2 (upstream to
downstream)
- With water permit? No
Financial
- Sources of funds/income: IA’s ISF of
P600/ha/cropping (will be increased upon
turnover of project by NIA)
- Expenditure Items: M&OE
- Assistance from NIA/other agencies: none
Governance
- Participation of Officers/BOD and
members: Officers/BOD – 70%, Members
– 100%

318
Naddungan
IA(Naddungan,
Gattaran)
SA/FUSA: 120 has./120
has.
CI: 150%
CE: 70%
ISF Rate/Amortization:
P45 K/year
Equity: P221 K/year
(just recently transferred
to equity)
Crop: Rice
Yield/ha: Rice – 60-100
(wet), 70-120 (dry)
Production Cost/Ha.:
Rice - P40,000 (both
wet & dry)
Type of System: Gravity
No. of members: 117
Tenure Status: 90%-
landowners, 10% tenants
Project Cost & Source of
Fund: P5 Mn by NIA
Undergone
rehabilitation/extensions,
cost & source of fund:
Yes, lining of 128 meter
canal using IA’s own
fund
Other modes of
supplementary
irrigation: 30 has. pump
from the river during dry
season
Physical/Technical
- Protection of their watersheds
- Regular dredging works in their intake
due to high levels of siltation
- Lining of 70% of canal to improve
efficiency
- Additional water pumps to help
augment water supply during dry
season
Institutional
- Conflict resolution ability (0 – nothing
done, 1 – not effective since conflicts
are not resolved, 2 – not very effective
as conflict happens occasionally, 3 –
moderately successful as the conflict
repeatedly happens, 4 – very effective
such that conflicts happens rarely): 4
- IA’s accountability provision
effectiveness (0 – not effective, 1 –
rarely, 2 – sometimes, 3- frequent, 4 –
always effective): 4
- Water allocation or delivery service (0
– no water received, 1 – all do not
receive sufficient water when needed, 2
– not all receive required water more
often, 3 – all receive required volume
but with occasional delay, 4 – all
receive required volume at the right
time): 4 (downstream to upstream)
- With water permit? No
Financial
- Sources of funds/income: IA’s ISF of
P1,500/ha/cropping
- Expenditure Items: M&OE – P10 K;
Representation, improvements,
rehabilitation – P40 K, Equity – P221
K
- Assistance from NIA/other agencies:
DILG gave P100 K for canal lining
Governance
- Participation of Officers/BOD and
members:Officers/BOD – 100%,
Members – 90%

319

320
Isabela IMO
IA Profile Issues and Concerns
Casilagan
Ballacong
IA
(Casilagan,
Ilagan)
SA/FUSA: 170 has./170
has.
CI: 123%
CE: 70%
ISF Rate/Amortization:
P110,000/year
Equity: 0
Crop: Rice
Yield/ha: Rice – 200-
220 (wet), 120-160 (dry)
Production Cost/Ha.:
Rice - P40,000 (wet &
dry)
Type of System: Gravity
No. of members: 200
Tenure Status: 80%-
landowners, 20%-
lessees
Project Cost & Source of
Fund: P10 Mn by NIA
Undergone
rehabilitation/extensions,
cost & source of fund:
Yes, canal lining worth
P2.4 Mn by NIA, repair
of intake structure worth
P3 Mn grant by BSPP
Other modes of
supplementary
irrigation: 5 ha. pumps
from the canal during
dry season
Physical/Technical
- Canal lining
- Repair of their intake structure
Institutional
- Conflict resolution ability (0 – nothing
done, 1 – not effective since conflicts are
not resolved, 2 – not very effective as
conflict happens occasionally, 3 –
moderately successful as the conflict
repeatedly happens, 4 – very effective such
that conflicts happens rarely): 2
- IA’s accountability provision effectiveness
(0 – not effective, 1 – rarely, 2 –
sometimes, 3- frequent, 4 – always
effective): 4
- Water allocation or delivery service (0 – no
water received, 1 – all do not receive
sufficient water when needed, 2 – not all
receive required water more often, 3 – all
receive required volume but with
occasional delay, 4 – all receive required
volume at the right time): 2 (upstream to
downstream)
- With water permit? Yes
Financial
- Sources of funds/income: IA’s ISF of
P2,040/ha/cropping & annual due of
P50/member/year
- Expenditure Items: Salaries – 10% of
collection, M&OE, Improvements &
Amortization – 90% of collection
- Assistance from NIA/other agencies: none
Governance
- Participation of Officers/BOD and
members: 100%

321
Cumabao
IA
(Cumabao,
Tumauini)
SA/FUSA: 160 has./160
has.
CI: 188%
CE: 98%
ISF Rate/Amortization:
P65,000/year
Equity: 0
Crop: Rice
Yield/ha: Rice – 80-120
(wet), 90-150 (dry)
Production Cost/Ha.:
Rice - P30,000 (wet &
dry)
Type of System: Gravity
No. of members: 203
Tenure Status: 2%-
landowners, 98%-
tenants
Project Cost & Source of
Fund: P11.5 Mn by NIA
Undergone
rehabilitation/extensions,
cost & source of fund:
Yes, minor repairs due
to typhoon damages
using IA’s fund
Other modes of
supplementary
irrigation: 30 has. pump
from the river, creek &
mini catch dams during
dry season
Physical/Technical
- 5 kilometer extension canal to irrigate 30
has. more
- Change unlined portion of the canal to
concrete pipelines to lessen erosion and
desiltation works
Institutional
- Conflict resolution ability (0 – nothing
done, 1 – not effective since conflicts are
not resolved, 2 – not very effective as
conflict happens occasionally, 3 –
moderately successful as the conflict
repeatedly happens, 4 – very effective such
that conflicts happens rarely): 3
- IA’s accountability provision effectiveness
(0 – not effective, 1 – rarely, 2 –
sometimes, 3- frequent, 4 – always
effective): 4
- Water allocation or delivery service (0 – no
water received, 1 – all do not receive
sufficient water when needed, 2 – not all
receive required water more often, 3 – all
receive required volume but with
occasional delay, 4 – all receive required
volume at the right time): 4 (upstream to
downstream)
- With water permit? Yes
Financial
- Sources of funds/income: IA’s ISF of
P2,550/ha/cropping & annual due of
P85/member/year
- Expenditure Items: Salaries, M&OE,
Improvements, Rehabilitation – P236
K/year; Amortization – P65 K/year
- Assistance from NIA/other agencies: LGU
gave P400 K for repair of dam
Governance
- Participation of Officers/BOD and
members: 100%

322
Cadarña IA
(Cabaruan,
Naguilian)
SA/FUSA: 96 has./96
has.
CI: 146%
CE: already paid off
ISF Rate/Amortization:
0
Equity: already paid off
10% equity
Crop: Rice
Yield/ha: Rice – 60-120
(both wet & dry)
Production Cost/Ha.:
Rice - P30,000 (wet &
dry)
Type of System: Pump
No. of members: 84
Tenure Status: 60%-
landowners, 40%-
tenants
Project Cost & Source of
Fund: P2.6 Mn by NIA
Undergone
rehabilitation/extensions,
cost & source of fund:
none
Other modes of
supplementary
irrigation: none
Physical/Technical
- Construction of a water impounding dam
which will give them a reliable and
cheaper source of water
Institutional
- Conflict resolution ability (0 – nothing
done, 1 – not effective since conflicts are
not resolved, 2 – not very effective as
conflict happens occasionally, 3 –
moderately successful as the conflict
repeatedly happens, 4 – very effective such
that conflicts happens rarely): 3
- IA’s accountability provision effectiveness
(0 – not effective, 1 – rarely, 2 –
sometimes, 3- frequent, 4 – always
effective): 0
- Water allocation or delivery service (0 – no
water received, 1 – all do not receive
sufficient water when needed, 2 – not all
receive required water more often, 3 – all
receive required volume but with
occasional delay, 4 – all receive required
volume at the right time): 2
- With water permit? Yes
Financial
- Sources of funds/income: none
- Expenditure Items: pump M&OE
- Assistance from NIA/other agencies: none
Governance
- Participation of Officers/BOD and
members: Officers/BOD – 70%, Members
– 80%

323
Nueva Vizcaya IMO
IA Profile Issues and Concerns
Paoac
Barobbob
La Torre IA
(La Torre
South,
Bayombong)
SA/FUSA: 278 has./278
has.
CI: 150%
CE: already paid off
ISF Rate/Amortization:
0
Equity: already paid off
equity
Crop: Rice
Yield/ha: Rice – 40-80
(wet), 20-30 (dry)
Production Cost/Ha.:
Rice - P44,333.85 (wet
& dry)
Type of System: Gravity
No. of members:278
Tenure Status:50%-
landowners, 50%-
tenants
Project Cost & Source of
Fund: P1 Mn by NIA
Undergone
rehabilitation/extensions,
cost & source of fund:
no
Other modes of
supplementary
irrigation: 30 ha. pumps
from drainage canal
during dry season
Physical/Technical
- Canal lining
- Repair of dam
- Source of water like water impounding
projects
Institutional
- Conflict resolution ability (0 – nothing
done, 1 – not effective since conflicts are
not resolved, 2 – not very effective as
conflict happens occasionally, 3 –
moderately successful as the conflict
repeatedly happens, 4 – very effective
such that conflicts happens rarely): 2
- IA’s accountability provision
effectiveness (0 – not effective, 1 – rarely,
2 – sometimes, 3- frequent, 4 – always
effective): 0
- Water allocation or delivery service (0 –
no water received, 1 – all do not receive
sufficient water when needed, 2 – not all
receive required water more often, 3 – all
receive required volume but with
occasional delay, 4 – all receive required
volume at the right time): 1 (upstream to
downstream)
- With water permit? Yes
Financial
- Sources of funds/income: Member’s
contributions if the need arises
- Expenditure Items: M&OE
- Assistance from NIA/other agencies:
National Government gave P45 K for dam
repair, NIA gave P66K for PE pipes and
P288 K for water pumps
Governance
- Participation of Officers/BOD and
members: Officers/BOD – 40%, Members
– 30%

324

325
Duruarog IA
(Nagsabaran,
Diadi)
SA/FUSA: 60 has./45.5
has.
CI: 178%
CE: 80%
ISF Rate/Amortization:
P5,000/year
Equity: 0
Crop: Rice
Yield/ha: Rice – 90-120
(wet), 80-100 (dry)
Production Cost/Ha.:
Rice - P26,000 (wet &
dry)
Type of System: Gravity
No. of members:30
Tenure Status:90%-
landowners, 10%-
tenants
Project Cost & Source of
Fund: P100 K by NIA
Undergone
rehabilitation/extensions,
cost & source of fund:
Yes, IA made 30 meter
canal extension using
their own fund of about
P7,500.
Other modes of
supplementary
irrigation: 2 ha. pumps
from the river during dry
season
Physical/Technical
- 2 km canal lining
Institutional
- Conflict resolution ability (0 – nothing
done, 1 – not effective since conflicts are
not resolved, 2 – not very effective as
conflict happens occasionally, 3 –
moderately successful as the conflict
repeatedly happens, 4 – very effective
such that conflicts happens rarely): 3
- IA’s accountability provision
effectiveness (0 – not effective, 1 –
rarely, 2 – sometimes, 3- frequent, 4 –
always effective): 4
- Water allocation or delivery service (0 –
no water received, 1 – all do not receive
sufficient water when needed, 2 – not all
receive required water more often, 3 – all
receive required volume but with
occasional delay, 4 – all receive required
volume at the right time): 2 (upstream to
downstream)
- With water permit? Yes
Financial
- Sources of funds/income: IA’s ISF of
P1,275/ha/year & annual due of
P200/member/year
- Expenditure Items: Salaries, M&OE,
Improvements & Amortization
- Assistance from NIA/other agencies:
National Government gave P180 K for
rehab, LGU gave P400 K for repair of
intake structure, Governor gave P24,000
worth of cement
Governance
- Participation of Officers/BOD and
members: 100%

326
Buliwao
IA
(Buliwao,
Quezon)
SA/FUSA: 73 has./73
has.
CI: 142%
CE: 60%
ISF Rate/Amortization:
P15,356/year
Equity: 0
Crop: Rice
Yield/ha: Rice – 70-100
(wet & dry)
Production Cost/Ha.:
Rice - P20,000 (wet &
dry)
Type of System: Gravity
No. of members:50
Tenure Status: 30%-
landowners, 50%-
tenants, 20% - lessees
Project Cost & Source of
Fund: P909 K by NIA
Undergone
rehabilitation/extensions,
cost & source of fund:
none
Other modes of
supplementary
irrigation: 10 ha. pumps
from the river during dry
season
Physical/Technical
- Canal rehabilitation
Institutional
- Conflict resolution ability (0 – nothing
done, 1 – not effective since conflicts are
not resolved, 2 – not very effective as
conflict happens occasionally, 3 –
moderately successful as the conflict
repeatedly happens, 4 – very effective such
that conflicts happens rarely): 3
- IA’s accountability provision effectiveness
(0 – not effective, 1 – rarely, 2 –
sometimes, 3- frequent, 4 – always
effective): 0
- Water allocation or delivery service (0 – no
water received, 1 – all do not receive
sufficient water when needed, 2 – not all
receive required water more often, 3 – all
receive required volume but with
occasional delay, 4 – all receive required
volume at the right time): 3 (upstream to
downstream & downstream to upstream)
- With water permit? Yes
Financial
- Sources of funds/income: IA’s ISF of
P600/ha/year & annual due of
P500/member/year
- Expenditure Items: Amortization
- Assistance from NIA/other agencies:
Municipal Government gave P75 K for
canal lining, LGU gave P20 K for canal
lining, NIA gave project worth P500 K for
canal lining which they will be paying thru
amortization after turnover
Governance
- Participation of Officers/BOD and
members: Officers/BOD – 30%, Members
– rarely attends

327
Pampanga (Pampanga-Bataan IMO)
IA Profile Issues and Concerns
Sitio Ipil
IA (Gulap,
Candaba)
SA/FUSA: 30 has./20
has.
CI: 175%
CE: 95%
ISF Rate/Amortization:
P3000 (wet); P4000
(dry)
Equity: 0
Crop: Rice& Corn
Yield/ha: Rice – 60-100
(wet),13-40 (dry); Corn
– 100,000 kg
Production Cost/Ha.:
P40,000 (wet); P18,000
(dry)
Type of System: Pump
No. of members: 17
Tenure Status: 100%-
landowners
Project Cost & Source of
Fund: P1.7 Mn by NIA
Undergone
rehabilitation/extensions,
cost & source of fund:
No
Other modes of
supplementary
irrigation: none
Cost of O&M of Pump:
P30,000-
P40,000/cropping for
20has.
Physical/Technical
- Replacement of old pumps
- Lining of earth canals
Institutional
- Conflict resolution ability (0 – nothing
done, 1 – not effective since conflicts are
not resolved, 2 – not very effective as
conflict happens occasionally, 3 –
moderately successful as the conflict
repeatedly happens, 4 – very effective such
that conflicts happens rarely): 4
- IA’s accountability provision effectiveness
(0 – not effective, 1 – rarely, 2 –
sometimes, 3- frequent, 4 – always
effective): 2
- Water allocation or delivery service (0 –
no water received, 1 – all do not receive
sufficient water when needed, 2 – not all
receive required water more often, 3 – all
receive required volume but with
occasional delay, 4 – all receive required
volume at the right time): 3 (upstream to
downstream)
- With water permit? No
Financial
- Sources of funds/income: IA’s
ISF/Amortization
- Expenditure Items: M&OE- P16,000-
P20,000 & annual amortization – P60,000
- Assistance from NIA/other agencies: NIA
gave P4,800 for replacement of pump parts
in Jan. 2015
Governance
- Participation of Officers/BOD and
members: 90%

328
Sapa-San
Vicente
Pampanga
IA (Sto
Nino, Sto.
Tomas)
SA/FUSA: 15 has./15
has.
CI: 200%
CE: 100%
ISF Rate/Amortization:
already paid-off but
collects
P1,000/ha/cropping for
M&OE
Equity: 0
Crop: Rice& Corn
Yield/ha: Rice – 100
(wet),60 (dry); Corn –
6,800 kg
Production Cost/Ha.:
P15,000 (wet & dry)
Type of System: Pump
No. of members: 15
Tenure Status: 100%-
landowners
Project Cost & Source of
Fund: P2 Mn by NIA
Undergone
rehabilitation/extensions,
cost & source of fund:
No
Other modes of
supplementary
irrigation: none
Cost of O&M of Pump:
P15,000/year for 15 has.
Physical/Technical
- Repair of old pumps
- Additional farm machinery like combined
harvester
- canal extension of about 100 meters to
irrigate 20 has. more
Institutional
- Conflict resolution ability (0 – nothing
done, 1 – not effective since conflicts are
not resolved, 2 – not very effective as
conflict happens occasionally, 3 –
moderately successful as the conflict
repeatedly happens, 4 – very effective such
that conflicts happens rarely): 3
- IA’s accountability provision effectiveness
(0 – not effective, 1 – rarely, 2 –
sometimes, 3- frequent, 4 – always
effective): 3
- Water allocation or delivery service (0 –
no water received, 1 – all do not receive
sufficient water when needed, 2 – not all
receive required water more often, 3 – all
receive required volume but with
occasional delay, 4 – all receive required
volume at the right time): 4 (upstream to
downstream)
- With water permit? Don’t know
Financial
- Sources of funds/income: IA’s
ISF/Amortization
- Expenditure Items: M&OE- P15,000/year
- Assistance from NIA/other agencies: LGU
gave P40,000 for repair of pump 4 years
ago
Governance
- Participation of Officers/BOD and
members: 100%

329
Anao
Farmer’s
IA (Anao,
Mexico)
SA/FUSA: 443 has./335
has.
CI: 200%
CE: 50% upon shifting
to ISF from amortization
ISF Rate/Amortization:
P1700 (wet); P2550
(dry)
Equity: 0
Crop: Rice& Corn
Yield/ha: Rice – 100
(wet),115 (dry); Corn –
6,800 kg
Production Cost/Ha.:
P25,000 (wet & dry)
Type of System: Gravity
No. of members: 165
Tenure Status: 80%-
landowners, 20%-lessees
Project Cost & Source of
Fund: P70 Mn by NIA
Undergone
rehabilitation/extensions,
cost & source of fund:
No
Other modes of
supplementary
irrigation: 30% of SA
pumps from STW during
dry season
Cost of O&M of Pump:
P1,000/ha./cropping
Physical/Technical
- lining of the 3.5 km earth canal and
replacement of deteriorated steel gate of
the 1st cross regulator
Institutional
- Conflict resolution ability (0 – nothing
done, 1 – not effective since conflicts are
not resolved, 2 – not very effective as
conflict happens occasionally, 3 –
moderately successful as the conflict
repeatedly happens, 4 – very effective such
that conflicts happens rarely): 4
- IA’s accountability provision effectiveness
(0 – not effective, 1 – rarely, 2 –
sometimes, 3- frequent, 4 – always
effective): 3
- Water allocation or delivery service (0 –
no water received, 1 – all do not receive
sufficient water when needed, 2 – not all
receive required water more often, 3 – all
receive required volume but with
occasional delay, 4 – all receive required
volume at the right time): 34(upstream to
downstream)
- With water permit? No
Financial
- Sources of funds/income: IA’s ISF
- Expenditure Items: Salaries & M&OE-
P40,000/year; ISF – P 60,000/year
- Assistance from NIA/other agencies: none
Governance
- Participation of Officers/BOD and
members: Officers/BOD - 80%, Members
– 30% (This is due to shift from
amortization to ISF scheme which most
members don’t agree.)

330
Nueva Ecija (Bulacan-Aurora-Nueva Ecija IMO)
IA Profile Issues and Concerns
Cordero
SSIS
Active
Farmer’s
Association
(Cordero,
Lupao)
SA/FUSA: 60.2 has./50
has.
CI: 140%
CE: 17%
ISF Rate/Amortization:
0
Equity: P1.2 Mn paid at
P14,000/ha/year for 2
years
Crop: Rice& Corn
Yield/ha: Rice – 75-80
(wet),75-80 (dry); Corn
– 6,300 kg
Production Cost/Ha.:
P20,000 (wet), P18,000
(dry)
Type of System: Gravity
No. of members: 27
Tenure Status: 100%-
landowners
Project Cost & Source of
Fund: P4.2 Mn by NIA
Undergone
rehabilitation/extensions,
cost & source of fund:
No
Other modes of
supplementary
irrigation: 20 has. pump
from STW during dry
season
Cost of O&M of Pump:
P3,000/ha./year
Physical/Technical
- 2 kilometer canal extension to irrigate 50
has. more
- rehabilitation of dam
- flat bed drier
Institutional
- Conflict resolution ability (0 – nothing
done, 1 – not effective since conflicts are
not resolved, 2 – not very effective as
conflict happens occasionally, 3 –
moderately successful as the conflict
repeatedly happens, 4 – very effective such
that conflicts happens rarely): 1
- IA’s accountability provision effectiveness
(0 – not effective, 1 – rarely, 2 –
sometimes, 3- frequent, 4 – always
effective): 1
- Water allocation or delivery service (0 – no
water received, 1 – all do not receive
sufficient water when needed, 2 – not all
receive required water more often, 3 – all
receive required volume but with
occasional delay, 4 – all receive required
volume at the right time): 2 (upstream to
downstream)
- With water permit? Yes
Financial
- Sources of funds/income: IA’s equity
repayment
- Expenditure Items: Equity repayment
- Assistance from NIA/other agencies: none
- IA experienced difficulty on access to bank
loans
- 87% do not pay since they do not receive
enough water
Governance
- Participation of Officers/BOD and
members: 100%

331
Inasan IA
(Ligaya,
Gabaldon)
SA/FUSA: 150 has./150
has.
CI: 167%
CE: 75%
ISF Rate/Amortization:
P1000/ha/cropping
Equity: 0
Crop: Rice
Yield/ha: Rice – 100-
160 (wet),100-160 (dry)
Production Cost/Ha.:
P25,000 (wet & dry)
Type of System: Gravity
No. of members: 206
Tenure Status: 25%-
landowners, 75%-
tenants
Project Cost & Source of
Fund: P5 Mn by NIA
Undergone
rehabilitation/extensions,
cost & source of fund:
Yes, repaired damaged
dam amounting to P600
K given by LGU
Other modes of
supplementary
irrigation: none
Physical/Technical
- Lining of the 3 km earth canals
- Government to give financial support &
livelihood like livestock raising
Institutional
- Conflict resolution ability (0 – nothing
done, 1 – not effective since conflicts are
not resolved, 2 – not very effective as
conflict happens occasionally, 3 –
moderately successful as the conflict
repeatedly happens, 4 – very effective such
that conflicts happens rarely): 3
- IA’s accountability provision effectiveness
(0 – not effective, 1 – rarely, 2 –
sometimes, 3- frequent, 4 – always
effective): 4
- Water allocation or delivery service (0 – no
water received, 1 – all do not receive
sufficient water when needed, 2 – not all
receive required water more often, 3 – all
receive required volume but with
occasional delay, 4 – all receive required
volume at the right time): 4 (upstream to
downstream)
- With water permit? Yes
Financial
- Sources of funds/income: IA’s ISF
- Expenditure Items: Salaries & M&OE-
P70,000/year; Amortization – P
30,000/year
- Assistance from NIA/other agencies: none
Governance
- Participation of Officers/BOD and
members: Officers/BOD - 100%, Members
– 80%
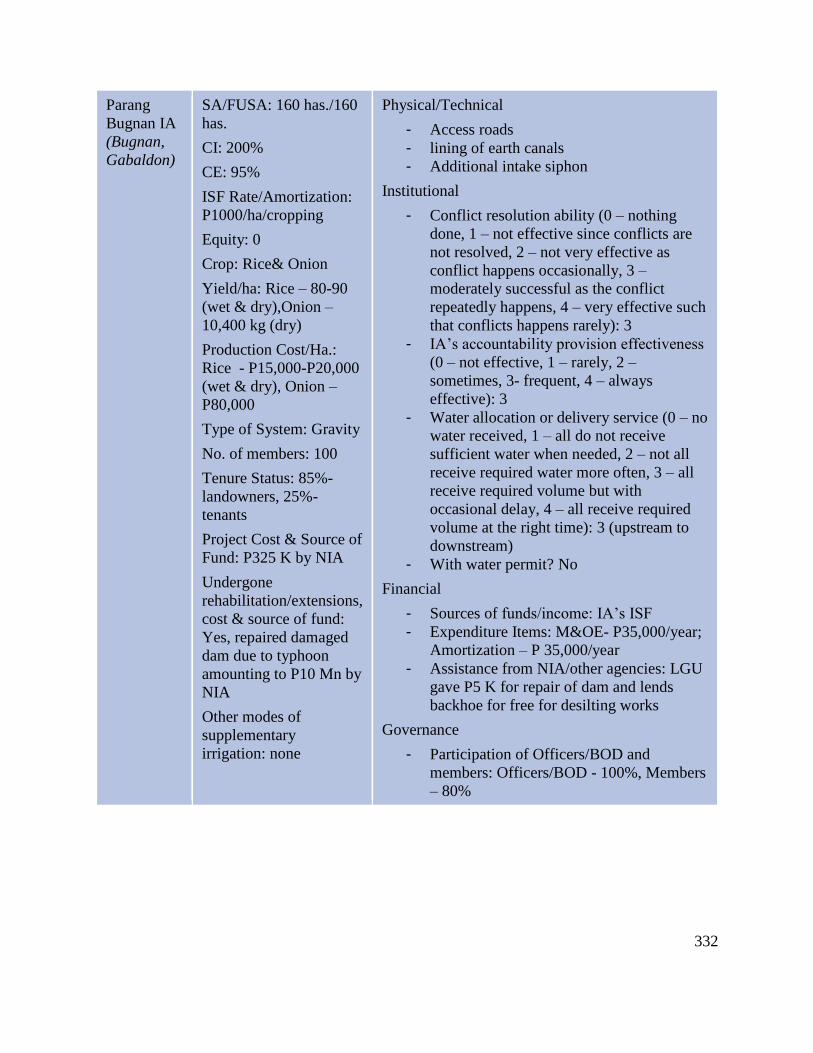
332
Parang
Bugnan IA
(Bugnan,
Gabaldon)
SA/FUSA: 160 has./160
has.
CI: 200%
CE: 95%
ISF Rate/Amortization:
P1000/ha/cropping
Equity: 0
Crop: Rice& Onion
Yield/ha: Rice – 80-90
(wet & dry),Onion –
10,400 kg (dry)
Production Cost/Ha.:
Rice - P15,000-P20,000
(wet & dry), Onion –
P80,000
Type of System: Gravity
No. of members: 100
Tenure Status: 85%-
landowners, 25%-
tenants
Project Cost & Source of
Fund: P325 K by NIA
Undergone
rehabilitation/extensions,
cost & source of fund:
Yes, repaired damaged
dam due to typhoon
amounting to P10 Mn by
NIA
Other modes of
supplementary
irrigation: none
Physical/Technical
- Access roads
- lining of earth canals
- Additional intake siphon
Institutional
- Conflict resolution ability (0 – nothing
done, 1 – not effective since conflicts are
not resolved, 2 – not very effective as
conflict happens occasionally, 3 –
moderately successful as the conflict
repeatedly happens, 4 – very effective such
that conflicts happens rarely): 3
- IA’s accountability provision effectiveness
(0 – not effective, 1 – rarely, 2 –
sometimes, 3- frequent, 4 – always
effective): 3
- Water allocation or delivery service (0 – no
water received, 1 – all do not receive
sufficient water when needed, 2 – not all
receive required water more often, 3 – all
receive required volume but with
occasional delay, 4 – all receive required
volume at the right time): 3 (upstream to
downstream)
- With water permit? No
Financial
- Sources of funds/income: IA’s ISF
- Expenditure Items: M&OE- P35,000/year;
Amortization – P 35,000/year
- Assistance from NIA/other agencies: LGU
gave P5 K for repair of dam and lends
backhoe for free for desilting works
Governance
- Participation of Officers/BOD and
members: Officers/BOD - 100%, Members
– 80%

333
Laguna (Laguna-Rizal IMO)
IA Profile Issues and Concerns
San Roque
Farmer’s
Association
(San
Roque,
Victoria)
SA/FUSA: 200 has./200
has.
CI: 100%
CE: already paid off
ISF Rate/Amortization:
0
Equity: 0
Crop: Rice
Yield/ha: Rice – 90-120
(wet), 70-80 (dry)
Production Cost/Ha.:
Rice - P20,000 (wet),
P30,000 (dry)
Type of System: Pump
No. of members: 100
Tenure Status: 30%-
landowners, 70%-
tenants
Project Cost & Source of
Fund: FAs individual
funds
Undergone
rehabilitation/extensions,
cost & source of fund:
no
Other modes of
supplementary
irrigation: none
Physical/Technical
- Source of water like small water
impounding project
Institutional
- Conflict resolution ability (0 – nothing
done, 1 – not effective since conflicts are
not resolved, 2 – not very effective as
conflict happens occasionally, 3 –
moderately successful as the conflict
repeatedly happens, 4 – very effective such
that conflicts happens rarely): 2
- IA’s accountability provision effectiveness
(0 – not effective, 1 – rarely, 2 –
sometimes, 3- frequent, 4 – always
effective): 4
- Water allocation or delivery service (0 – no
water received, 1 – all do not receive
sufficient water when needed, 2 – not all
receive required water more often, 3 – all
receive required volume but with
occasional delay, 4 – all receive required
volume at the right time): 1
- With water permit? No
Financial
- Sources of funds/income: none
- Expenditure Items: pump M&OE
- Assistance from NIA/other agencies: LGU
gave seedlings worth P25 K
Governance
- Participation of Officers/BOD and
members: Officers/BOD – 70%, Members
– 100%

334
Maravilla
Alipit
Malinao IA
(Maravilla,
Magdalena)
SA/FUSA: 40 has./40
has.
CI: 200%
CE: 100%
ISF Rate/Amortization:
P80,000/year
Equity: 0
Crop: Rice
Yield/ha: Rice – 60-80
(wet & dry)
Production Cost/Ha.:
Rice - P25,000 (wet),
P28,000 (dry)
Type of System: Gravity
No. of members: 34
Tenure Status: 10%-
landowners, 90% tenants
Project Cost & Source of
Fund: P1.16 Mn by NIA
Undergone
rehabilitation/extensions,
cost & source of fund:
no
Other modes of
supplementary
irrigation: none
Physical/Technical
- Cementing of mini dam
Institutional
- Conflict resolution ability (0 – nothing
done, 1 – not effective since conflicts are
not resolved, 2 – not very effective as
conflict happens occasionally, 3 –
moderately successful as the conflict
repeatedly happens, 4 – very effective such
that conflicts happens rarely): 4
- IA’s accountability provision effectiveness
(0 – not effective, 1 – rarely, 2 –
sometimes, 3- frequent, 4 – always
effective): 4
- Water allocation or delivery service (0 –
no water received, 1 – all do not receive
sufficient water when needed, 2 – not all
receive required water more often, 3 – all
receive required volume but with
occasional delay, 4 – all receive required
volume at the right time): 4 (upstream to
downstream)
- With water permit? No
Financial
- Sources of funds/income: IA’s ISF of
P1,000/ha/cropping
- Expenditure Items: Amortization
- Assistance from NIA/other agencies:
Mayor gave P300 K for payment of
amortization
Governance
- Participation of Officers/BOD and
members: 100%

335
Nagkakaisang
Magsasakang
Banadero IA
(Santisimo
Rosario, San
Pablo)
SA/FUSA: 160 has./130
has.
CI: 200%
CE: 95%
ISF Rate/Amortization:
P897/ha/year to start in
2016
Equity: 0
Crop: Rice and
vegetables
Yield/ha: Rice – 70-130
(wet & dry), vegetables
– various yields
Production Cost/Ha.:
Rice - P15,000 (both
wet & dry); vegetables –
various cost
Type of System: Gravity
No. of members: 80
Tenure Status: 10%-
landowners, 90% tenants
Project Cost & Source of
Fund: P7 Mn under
CARP of DA
Undergone
rehabilitation/extensions,
cost & source of fund:
no
Other modes of
supplementary
irrigation: none
Physical/Technical
- Lining of canal and cementing of turn
outs
- SLEX project would affect their service
area by 70% - 80%
Institutional
- Conflict resolution ability (0 – nothing
done, 1 – not effective since conflicts are
not resolved, 2 – not very effective as
conflict happens occasionally, 3 –
moderately successful as the conflict
repeatedly happens, 4 – very effective
such that conflicts happens rarely): 4
- IA’s accountability provision
effectiveness (0 – not effective, 1 –
rarely, 2 – sometimes, 3- frequent, 4 –
always effective): 1
- Water allocation or delivery service (0 –
no water received, 1 – all do not receive
sufficient water when needed, 2 – not all
receive required water more often, 3 – all
receive required volume but with
occasional delay, 4 – all receive required
volume at the right time): 4 (upstream to
downstream)
- With water permit? No
Financial
- Sources of funds/income: IA’s annual
due of P50/ha/cropping
- Expenditure Items: M&OE
- Assistance from NIA/other agencies: DA
rehabilitation of irrigation system (P7
Mn)
Governance
- Participation of Officers/BOD and
members:Officers/BOD – 80%,
Members – 60%

336
Occidental Mindoro IMO
IA Profile Issues and Concerns
Amaling-
Manuot IA
(Manuot,
Rizal)
SA/FUSA: 535.15
has./535.15 has.
CI: 159%
CE: 90%
ISF Rate/Amortization:
P200,000/season
Equity: 0
Crop: Rice
Yield/ha: Rice – 100-
180 (wet), 100-180 (dry)
Production Cost/Ha.:
Rice - P25,000 (wet),
P35,000 (dry)
Type of System: Gravity
No. of members: 242
Tenure Status: 100%-
landowners
Project Cost & Source of
Fund: P6 Mn under
CARP
Undergone
rehabilitation/extensions,
cost & source of fund:
Yes, repair of river dike
damaged by typhoon in
2012 using NIA’s
calamity fund
Other modes of
supplementary
irrigation: 150 has.
pump from STWs during
dry season
Physical/Technical
- Completion of the river dike needed for
flood protection
- Lining of canal
- STWs for the 150 has. to augment water
supply during dry season
Institutional
- Conflict resolution ability (0 – nothing
done, 1 – not effective since conflicts are
not resolved, 2 – not very effective as
conflict happens occasionally, 3 –
moderately successful as the conflict
repeatedly happens, 4 – very effective such
that conflicts happens rarely): 4
- IA’s accountability provision effectiveness
(0 – not effective, 1 – rarely, 2 –
sometimes, 3- frequent, 4 – always
effective): 3
- Water allocation or delivery service (0 –
no water received, 1 – all do not receive
sufficient water when needed, 2 – not all
receive required water more often, 3 – all
receive required volume but with
occasional delay, 4 – all receive required
volume at the right time): 3 )downstream
to upstream)
- With water permit? Yes
Financial
- Sources of funds/income: IA’s annual due
of 2 cavans/ha/cropping & NFA’s FAIR,
IPAD & CDIF incentives
- Expenditure Items: salaries, M&OE &
repairs
- Assistance from NIA/other agencies: DA
gave P1 MN for Warehouse and P0.750
Mn for flat bed drier, Congresswoman
Sato gave 249K for multipurpose drying
payment

337
Governance
- Participation of Officers/BOD and
members: Officers/BOD – 100%,
Members – 100%
Barangay
Rizal, Rizal
Occidental
Mindoro IA
(Rizal,
Rizal)
SA/FUSA: 600 has./600
has.
CI: 192%
CE: 50%
ISF Rate/Amortization:
none
Equity: 0
Crop: Rice, corn,
tobacco, mongo, onion,
peanut & “camote”
Yield/ha: Rice – 80-120
(wet), 90-130 (dry)
Production Cost/Ha.:
Rice - P30,000 (wet),
P35,000 (dry)
Type of System: Gravity
No. of members: 300
Tenure Status: 30%-
landowners, 70% tenants
Project Cost & Source of
Fund: no project yet
Undergone
rehabilitation/extensions,
cost & source of fund:
no
Other modes of
supplementary
irrigation: 76 has. pump
from STWs and small
impounding holes during
dry season
Physical/Technical
- Completion of the stalled project
- More canal extensions to increase SA
- Canal lining for water service efficiency
Institutional
- Conflict resolution ability (0 – nothing
done, 1 – not effective since conflicts are
not resolved, 2 – not very effective as
conflict happens occasionally, 3 –
moderately successful as the conflict
repeatedly happens, 4 – very effective such
that conflicts happens rarely): 4
- IA’s accountability provision effectiveness
(0 – not effective, 1 – rarely, 2 –
sometimes, 3- frequent, 4 – always
effective): 3
- Water allocation or delivery service (0 –
no water received, 1 – all do not receive
sufficient water when needed, 2 – not all
receive required water more often, 3 – all
receive required volume but with
occasional delay, 4 – all receive required
volume at the right time): 3 (upstream to
downstream)
- With water permit? Yes
Financial
- Sources of funds/income: IA’s ISF of
P850/ha/cropping & NFA’s FAIR, IPAD
& CDIF incentives
- Expenditure Items: 10% incentive of
collectors, O&M and repairs
- Assistance from NIA/other agencies: DA
gave subsidized seedlings
Governance
- Participation of Officers/BOD and
members: Officers/BOD – 100%,
Members – 60%

338
Monteclaro
IA
(Monteclaro,
San Jose)
SA/FUSA: 229 has./229
has.
CI: 200%
CE: 60%
ISF Rate/Amortization:
P100,000/ year
Equity: 0
Crop: Rice, corn, onion
& garlic
Yield/ha: Rice – 80-120
(wet), 100-150 (dry)
Production Cost/Ha.:
Rice - P41,000 (both
wet & dry)
Type of System: Gravity
No. of members: 104
Tenure Status: 100%-
landowners
Project Cost & Source of
Fund: P6.2 Mn by NIA
Undergone
rehabilitation/extensions,
cost & source of fund:
Yes, repaired damaged
siphon in 2011 using
IA’s own fund
Other modes of
supplementary
irrigation: 50 has. pump
from STWs, canal and
river during dry season
Physical/Technical
- Lining of 70% of their canal
- Cementing of dam
Institutional
- Conflict resolution ability (0 – nothing
done, 1 – not effective since conflicts are
not resolved, 2 – not very effective as
conflict happens occasionally, 3 –
moderately successful as the conflict
repeatedly happens, 4 – very effective
such that conflicts happens rarely): 3
- IA’s accountability provision
effectiveness (0 – not effective, 1 – rarely,
2 – sometimes, 3- frequent, 4 – always
effective): 2
- Water allocation or delivery service (0 –
no water received, 1 – all do not receive
sufficient water when needed, 2 – not all
receive required water more often, 3 – all
receive required volume but with
occasional delay, 4 – all receive required
volume at the right time): 3 (downstream
to upstream)
- With water permit? No
Financial
- Sources of funds/income: IA’s ISF of
P1000/ha/year & NFA’s FAIR, IPAD &
CDIF incentives
- Expenditure Items: 10% incentive of
collectors, M&OE & amortization
- Assistance from NIA/other agencies: DA
gave about P360 K of rice seeds
Governance
- Participation of Officers/BOD and
members: Officers/BOD – 100%,
Members – 70%

339
Camarines Sur IMO
IA Profile Issues and Concerns
Suha San
Antonio IA
(San
Antonio,
Ocampo)
SA/FUSA: 136 has./100
has.
CI: 200%
CE: 65%
ISF Rate/Amortization:
P72,000/year
Equity: 0
Crop: Rice
Yield/ha: Rice – 60-70
(wet), 80-100 (dry)
Production Cost/Ha.:
Rice - P25,000 (wet &
dry)
Type of System: Gravity
No. of members:74
Tenure Status: 50%-
landowners, 20%-
tenants,30%- lessees
Project Cost & Source of
Fund: P5.1 Mn by NIA
Undergone
rehabilitation/extensions,
cost & source of fund:
none
Other modes of
supplementary
irrigation: 3 has. pump
from drainage during dry
season
Physical/Technical
- Canal lining
- Repair of intake structure
Institutional
- Conflict resolution ability (0 – nothing
done, 1 – not effective since conflicts are
not resolved, 2 – not very effective as
conflict happens occasionally, 3 –
moderately successful as the conflict
repeatedly happens, 4 – very effective
such that conflicts happens rarely): 3
- IA’s accountability provision
effectiveness (0 – not effective, 1 – rarely,
2 – sometimes, 3- frequent, 4 – always
effective): 3
- Water allocation or delivery service (0 –
no water received, 1 – all do not receive
sufficient water when needed, 2 – not all
receive required water more often, 3 – all
receive required volume but with
occasional delay, 4 – all receive required
volume at the right time): 3 (upstream to
downstream)
- With water permit? No
Financial
- Sources of funds/income: IA’s ISF of
P1,500/ha/cropping
- Expenditure Items: Salaries –
P6,425/month, M&OE – P77,100,
Amortization
- Assistance from NIA/other agencies: LGU
gave P40 k for canal lining, DA granted
P1.5 Mn for SWIP
Governance
- Participation of Officers/BOD and
members: Officers/BOD – 100%,
Members – 60%

340
Gubat-
Lagonay
IA (Gubat,
Lagonay)
SA/FUSA: 50 has./45
has.
CI: 147%
CE: 100%
ISF Rate/Amortization:
already paid off
amortization
Equity: 0
Crop: Rice
Yield/ha: Rice – 40-100
(both wet & dry)
Production Cost/Ha.:
Rice - P15,000 (wet &
dry)
Type of System: Gravity
No. of members:59
Tenure Status: 40%-
landowners, 50%-
tenants,10%- lessees
Project Cost & Source of
Fund: P134 k by NIA
Undergone
rehabilitation/extensions,
cost & source of fund:
Yes, P2.72 Mn by NIA
Other modes of
supplementary
irrigation: none
Physical/Technical
- Canal lining
- Access roads/ FRM
- Canal extension to irrigate 5 has. more
Institutional
- Conflict resolution ability (0 – nothing
done, 1 – not effective since conflicts are
not resolved, 2 – not very effective as
conflict happens occasionally, 3 –
moderately successful as the conflict
repeatedly happens, 4 – very effective
such that conflicts happens rarely): 4
- IA’s accountability provision effectiveness
(0 – not effective, 1 – rarely, 2 –
sometimes, 3- frequent, 4 – always
effective): 4
- Water allocation or delivery service (0 –
no water received, 1 – all do not receive
sufficient water when needed, 2 – not all
receive required water more often, 3 – all
receive required volume but with
occasional delay, 4 – all receive required
volume at the right time): 4 (upstream to
downstream)
- With water permit? Yes
Financial
- Sources of funds/income: IA’s ISF of
P400/ha/cropping
- Expenditure Items: Salaries & M&OE –
P26,400
- Assistance from NIA/other agencies: LGU
gave P500 k for canal lining, DA
subsidized seedlings cost
Governance
- Participation of Officers/BOD and
members: Officers/BOD – 50%, Members
– 70%

341
San Isidro
Bahay
Aslong
Palangon
IA (San
Isidro,
Libmanan)
SA/FUSA: 250 has./250
has.
CI: 200%
CE: 60%
ISF Rate/Amortization:
P46,666/Year
Equity: 0
Crop: Rice
Yield/ha: Rice – 40-110
(wet), 20-95 (dry)
Production Cost/Ha.:
Rice - P30,000 (wet &
dry)
Type of System: Gravity
No. of members:245
Tenure Status:70%-
landowners, 20%-
tenants,10%- lessees
Project Cost & Source of
Fund: P632 k by NIA
Undergone
rehabilitation/extensions,
cost & source of fund:
Yes, P34.3 Mn by NIA
Other modes of
supplementary
irrigation: 1 ha. pumps
from drainage canal
during dry season
Physical/Technical
- Lacking FMR or access roads
- Canal lining of 6 km of lateral canals
Institutional
- Conflict resolution ability (0 – nothing
done, 1 – not effective since conflicts are
not resolved, 2 – not very effective as
conflict happens occasionally, 3 –
moderately successful as the conflict
repeatedly happens, 4 – very effective
such that conflicts happens rarely): 4
- IA’s accountability provision effectiveness
(0 – not effective, 1 – rarely, 2 –
sometimes, 3- frequent, 4 – always
effective): 3
- Water allocation or delivery service (0 –
no water received, 1 – all do not receive
sufficient water when needed, 2 – not all
receive required water more often, 3 – all
receive required volume but with
occasional delay, 4 – all receive required
volume at the right time): 4 (downstream
to upstream)
- With water permit? Yes
Financial
- Sources of funds/income: IA’s ISF and
annual due
- Expenditure Items: Salaries –
P152,400/year, M&OE – P18,000/year
- Assistance from NIA/other agencies:
Cong. Andaya granted P1 Mn for their
bodega, LGU donated 60 bags of
fertilizers and DA gave 500 bags of
fertilizers
Governance
- Participation of Officers/BOD and
members: Officers/BOD – 10%, Members
– 80%