arkansas educator preparation provider report -...
TRANSCRIPT
1
2016 Educator Preparation Provider Report
Arkansas
Arkansas Educator Preparation Provider Report
Table of Contents
I. Introduction .................................................................................................................................................................................................................................................................................................................... 2
II. Educator Workforce Data ........................................................................................................................................................................................................................................................................................... 4
III. Teacher – EPP Enrollment Data .............................................................................................................................................................................................................................................................................. 6
IV. Teacher – EPP Completer Data .............................................................................................................................................................................................................................................................................. 8
V. Administrator - Enrollment and Completer Data ................................................................................................................................................................................................................................................... 10
VI. Gender/Race/Ethnicity Data ................................................................................................................................................................................................................................................................................... 11
VII. Number of Teacher Program Completers Working in Arkansas Public Schools (first-year) ....................................................................................................................................................................... 13
VIII. Three-year Average Number of Teachers Prepared By License Area .......................................................................................................................................................................................................... 15
IX. Praxis® Licensure Test Pass Rates ...................................................................................................................................................................................................................................................................... 19
X. Praxis® Licensure Test Summary Pass Rates ..................................................................................................................................................................................................................................................... 21
XI. Novice Teacher Surveys - Perceptions of Preparation ..................................................................................................................................................................................................................................... 22
XII. Glossary .................................................................................................................................................................................................................................................................................................................... 23
2
2016 Educator Preparation Provider Report
Arkansas
I. Introduction Highly effective teachers and principals are paramount to producing college and career ready learners. To continuously improve the quality of the state’s educator preparation providers (EPP), the Arkansas Department of Education (ADE) works collaboratively with Arkansas’s institutions of higher education (IHE) and nontraditional educator programs to report data via the Educator Preparation Provider Report (EPPR). The intent of the report is two-fold: 1) to report information on enrollees and graduates at the EPPs and 2) to report demographic and statistical data to inform policy decisions. The commitment of EPPs to providing accurate, relevant data in a timely manner demonstrates their dedication and contribution to the success of this effort. All parties involved share an interest in preparing the best possible educators to provide a quality education to all Arkansas students. Identification of the metrics and the report format were developed in collaboration with a representative committee from all Arkansas EPPs. Table 1. Arkansas EPPs
EPP Abbreviation* IHE Type Program Type EPP Abbreviation* IHE Type Program Type
AR Prof. Pathway to Ed. Licensure APPEL Public Nontraditional Philander Smith College PSC Independent Traditional
Arkansas State University ASU Public Both Southern Arkansas University SAU Public Both
Arkansas Teacher Corps ATC Public Nontraditional Teach For America - AR TFA Public Nontraditional
Arkansas Tech University ATU Public Both U of A – Fayetteville UAF Public Traditional
Central Baptist College CBC Independent Traditional U of A - Fort Smith UAFS Public Traditional
Crowley’s Ridge College CRC Independent Traditional U of A - Little Rock UALR Public Both
Harding University HU Independent Both U of A – Monticello UAM Public Both
Henderson State University HSU Public Both U of A - Pine Bluff UAPB Public Both
Hendrix College HC Independent Traditional University of Central Arkansas UCA Public Both
John Brown University JBU Independent Traditional University of The Ozarks UO Independent Traditional
Lyon College LC Independent Traditional Williams Baptist College WBC Independent Traditional
Ouachita Baptist University OBU Independent Traditional * These abbreviations are utilized throughout this report.
3
2016 Educator Preparation Provider Report
Arkansas EPPR metrics:
• EPP data is submitted to the U.S. Dept. of Education via the HEA Title II reports. HEA Title II is a national data collection for states and EPPs that is related to teacher preparation and licensure. HEA Title II Reports can be found at https://title2.ed.gov/Public/Home.aspx. Title II data includes: o Program Enrollment and Program Completers o Race and Ethnicity data
• Data that is submitted directly to ADE includes: o Numbers of teachers or administrators prepared, licensed, and/or working in AR public schools o Surveys - Novice Teacher Perception of EPP Preparation
• Data submitted to Educational Testing Service (ETS®) for Title II Pass Rate reporting includes: o Licensure Exam Test Results and Pass Rates
Limitations of the EPPR
• The most recent data reported for these metrics are not all representative of the same years. Where appropriate, the year and source of data is indicated throughout the report
• Data reported for program completers who were teaching the following year only represents completers who were teaching in Arkansas public schools. The data do not include teachers who teach in private schools or schools outside the state.
• Data reported do not identify those with an Associate of Arts in Teaching degree, or other students who transfer into the institutions. • Institutions having both traditional educator preparation programs and nontraditional programs (e.g. MAT programs) may have combined data in some sections of the
report. Where appropriate they are indicated as such. Uses of the EPPR
• The EPPR allows the public to view aggregate data for Arkansas’s EPP graduates by institution and program area. • School districts and charter schools can use the report to make informed decisions about hiring. • Students interested in pursuing a career in education can use the report to make decisions regarding which program to attend. • Institutions may use the data to support continuous improvement efforts. • These data assist state and institutional policy makers in identifying future needs and targeted improvements.
4
2016 Educator Preparation Provider Report
Arkansas II. Educator Workforce Data Arkansas Public Schools (APS) employ over 2,000 new teachers each year. Table 2 demonstrates that many teachers return each year and continue to teach in APS. Since 2006 approximately 85 percent of new teachers did return to APS after one (1) year of teaching (~15% attrition). Seventy percent were still in APS after three (3) years (~30% attrition), and 64 percent remained in APS after five (5) years (~36% attrition). These state numbers are far above the often-reported national average of 50% after five (5) years. However, the ADE is committed to retaining as many effective teachers in classrooms as possible. Table 2. Teacher Attrition
School Year # Beginning Teachers
Attrition after 1 year % Attrition after 3
years % Attrition after 5 years %
2006-07 2,504 173 6.91% 613 24.48% 798 31.87%
2007-08 2,507 342 13.64% 672 26.80% 861 34.34%
2008-09 2,284 326 14.27% 641 28.06% 798 34.94%
2009-10 2,413 326 13.51% 728 30.17% 961 39.83%
2010-11 2,266 343 15.14% 709 31.29% 916 40.42%
2011-12 2,432 403 16.57% 849 34.91%
2012-13 2,959 697 23.56% 1,096 37.04%
2013-14 2,937 469 15.97%
2014-15 3,524 565 16.03%
2015-16 3,387 1-yr Attrition (2006-2015) 23,826 3,644 Avg. = 15.29%
3-yr Attrition (2006-2013) 17,365 5,308 Avg. = 30.57%
5-yr Attrition (2006-2011) 11,974 4,334 Avg. = 36.19%
1-yr attrition = the average % of teachers not returning in Arkansas Public Schools after one year 3-yr attrition = the average % of teachers not returning in Arkansas Public Schools after three years 5-yr attrition = the average % of teachers not returning in Arkansas Public Schools after five years Source: ADE Data Administration
5
2016 Educator Preparation Provider Report
Arkansas
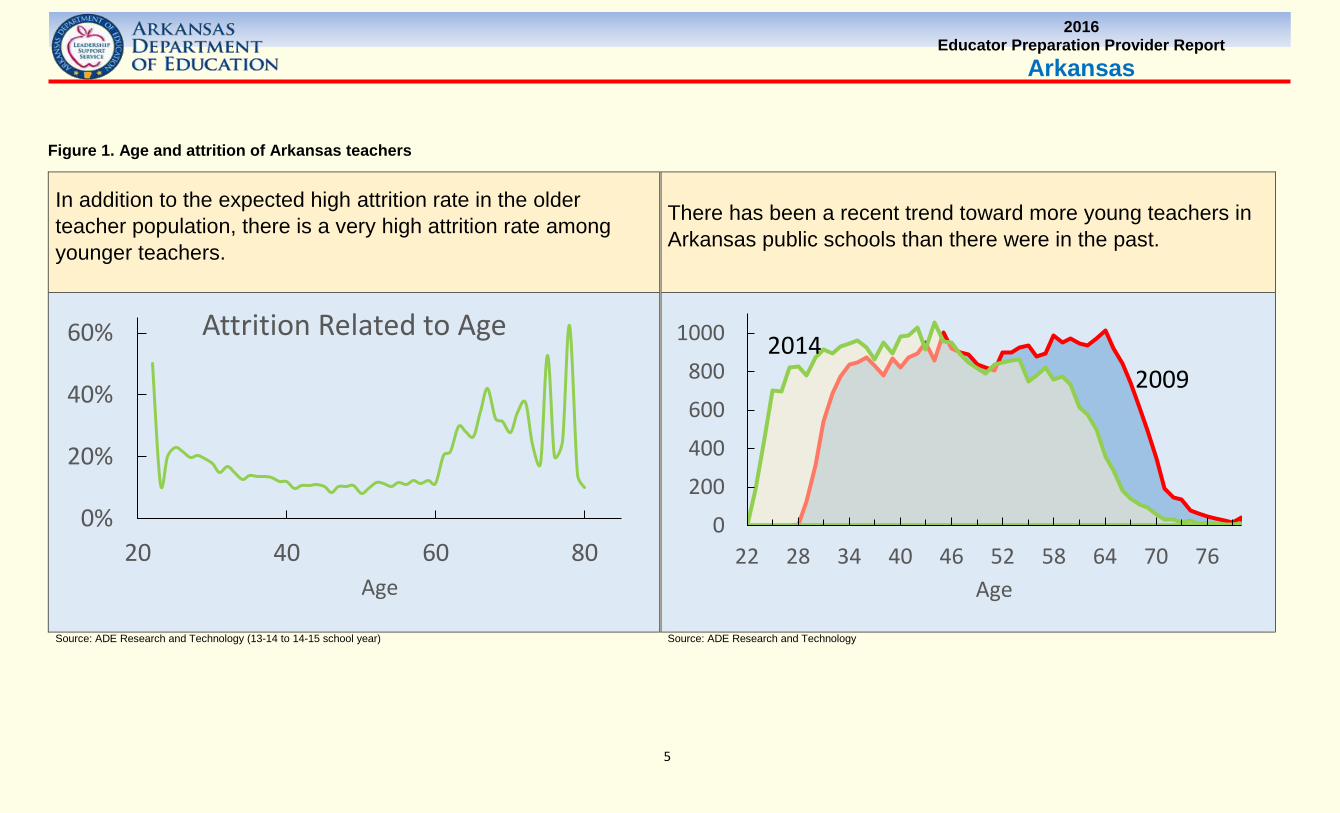
Figure 1. Age and attrition of Arkansas teachers
In addition to the expected high attrition rate in the older teacher population, there is a very high attrition rate among younger teachers.
There has been a recent trend toward more young teachers in Arkansas public schools than there were in the past.
Source: ADE Research and Technology (13-14 to 14-15 school year) Source: ADE Research and Technology
0%
20%
40%
60%
20 40 60 80Age
Attrition Related to Age
0
200
400
600
800
1000
22 28 34 40 46 52 58 64 70 76Age
20142009
6
2016 Educator Preparation Provider Report
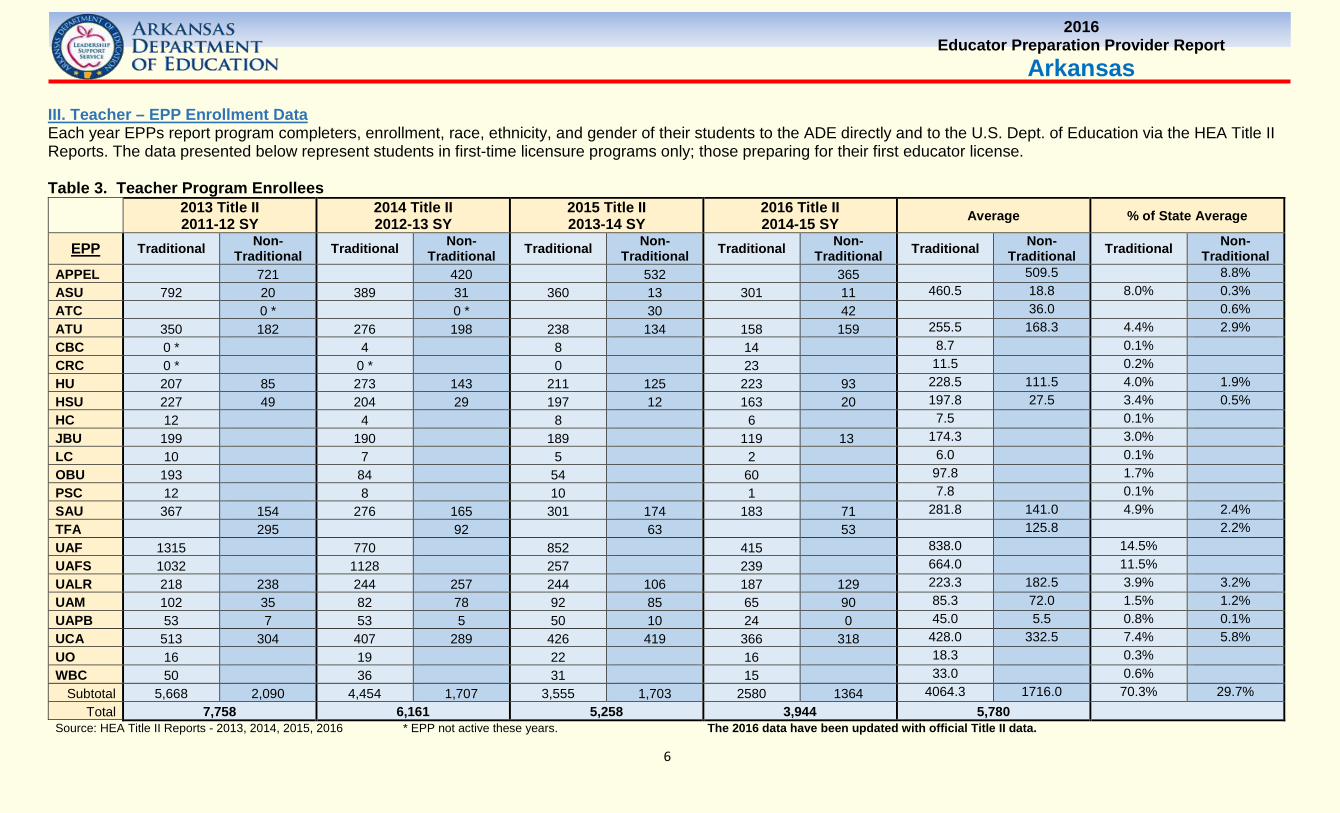
Arkansas III. Teacher – EPP Enrollment Data Each year EPPs report program completers, enrollment, race, ethnicity, and gender of their students to the ADE directly and to the U.S. Dept. of Education via the HEA Title II Reports. The data presented below represent students in first-time licensure programs only; those preparing for their first educator license. Table 3. Teacher Program Enrollees
2013 Title II 2011-12 SY
2014 Title II 2012-13 SY
2015 Title II 2013-14 SY
2016 Title II 2014-15 SY Average % of State Average
EPP Traditional Non-Traditional Traditional Non-
Traditional Traditional Non-Traditional Traditional Non-
Traditional Traditional Non-Traditional Traditional Non-
Traditional APPEL 721 420 532 365 509.5 8.8% ASU 792 20 389 31 360 13 301 11 460.5 18.8 8.0% 0.3% ATC 0 * 0 * 30 42 36.0 0.6% ATU 350 182 276 198 238 134 158 159 255.5 168.3 4.4% 2.9% CBC 0 * 4 8 14 8.7 0.1% CRC 0 * 0 * 0 23 11.5 0.2% HU 207 85 273 143 211 125 223 93 228.5 111.5 4.0% 1.9% HSU 227 49 204 29 197 12 163 20 197.8 27.5 3.4% 0.5% HC 12 4 8 6 7.5 0.1% JBU 199 190 189 119 13 174.3 3.0% LC 10 7 5 2 6.0 0.1% OBU 193 84 54 60 97.8 1.7% PSC 12 8 10 1 7.8 0.1% SAU 367 154 276 165 301 174 183 71 281.8 141.0 4.9% 2.4% TFA 295 92 63 53 125.8 2.2% UAF 1315 770 852 415 838.0 14.5% UAFS 1032 1128 257 239 664.0 11.5% UALR 218 238 244 257 244 106 187 129 223.3 182.5 3.9% 3.2% UAM 102 35 82 78 92 85 65 90 85.3 72.0 1.5% 1.2% UAPB 53 7 53 5 50 10 24 0 45.0 5.5 0.8% 0.1% UCA 513 304 407 289 426 419 366 318 428.0 332.5 7.4% 5.8% UO 16 19 22 16 18.3 0.3% WBC 50 36 31 15 33.0 0.6%
Subtotal 5,668 2,090 4,454 1,707 3,555 1,703 2580 1364 4064.3 1716.0 70.3% 29.7% Total 7,758 6,161 5,258 3,944 5,780
Source: HEA Title II Reports - 2013, 2014, 2015, 2016 * EPP not active these years. The 2016 data have been updated with official Title II data.
7
2016 Educator Preparation Provider Report
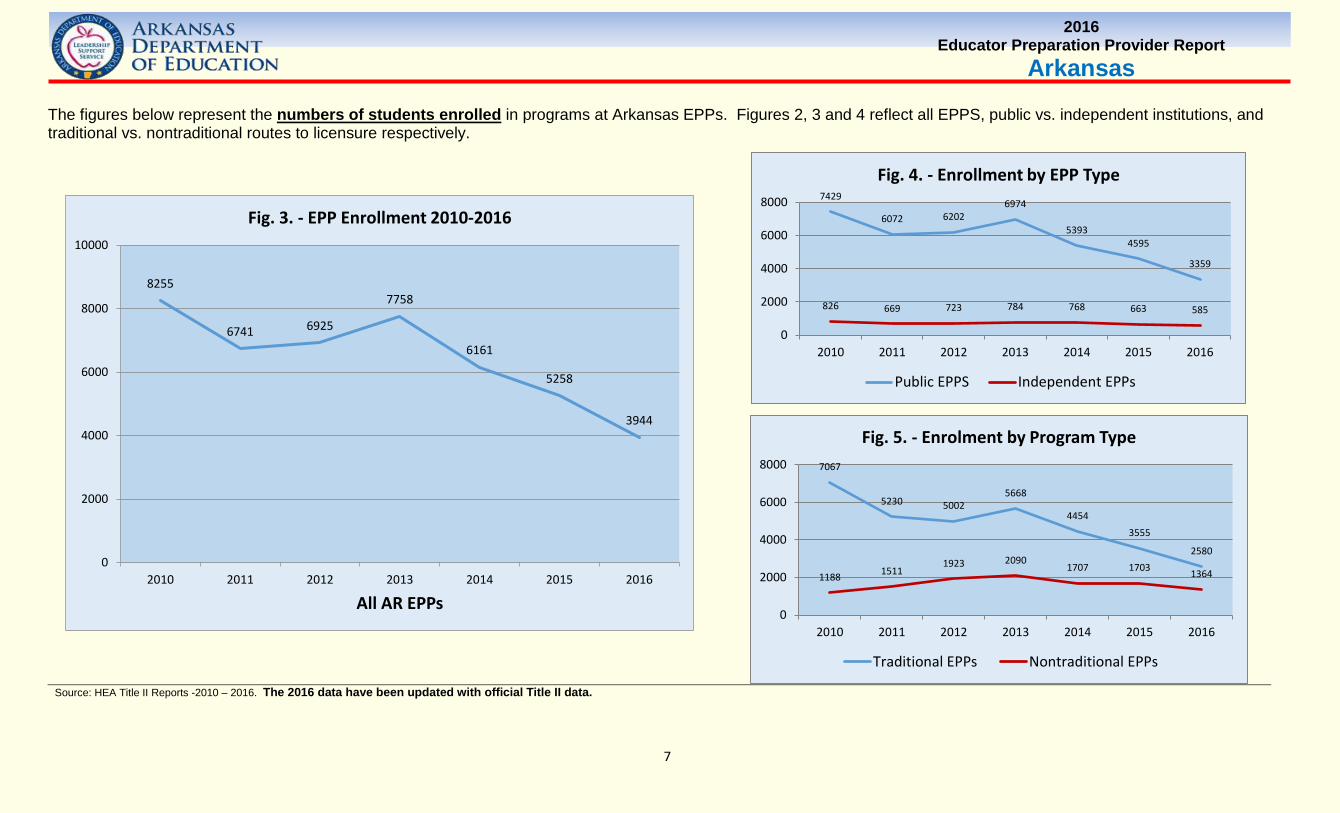
Arkansas The figures below represent the numbers of students enrolled in programs at Arkansas EPPs. Figures 2, 3 and 4 reflect all EPPS, public vs. independent institutions, and traditional vs. nontraditional routes to licensure respectively.
Source: HEA Title II Reports -2010 – 2016. The 2016 data have been updated with official Title II data.
8255
6741 6925
7758
6161
5258
3944
0
2000
4000
6000
8000
10000
2010 2011 2012 2013 2014 2015 2016
All AR EPPs
Fig. 3. - EPP Enrollment 2010-20167429
6072 62026974
53934595
3359
826 669 723 784 768 663 585
0
2000
4000
6000
8000
2010 2011 2012 2013 2014 2015 2016
Fig. 4. - Enrollment by EPP Type
Public EPPS Independent EPPs
7067
5230 50025668
44543555
2580
1188 15111923 2090
1707 1703 1364
0
2000
4000
6000
8000
2010 2011 2012 2013 2014 2015 2016
Fig. 5. - Enrolment by Program Type
Traditional EPPs Nontraditional EPPs
8
2016 Educator Preparation Provider Report
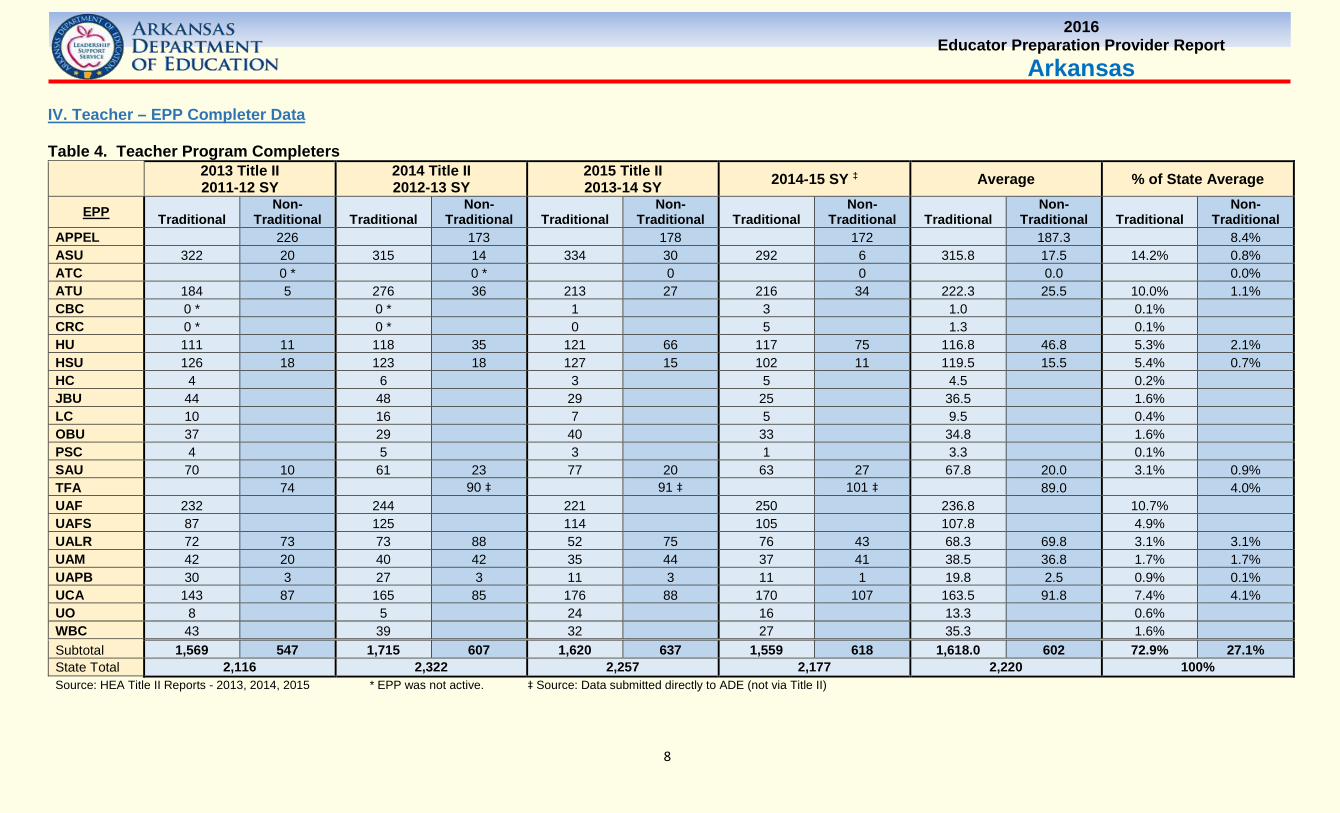
Arkansas IV. Teacher – EPP Completer Data Table 4. Teacher Program Completers
2013 Title II 2011-12 SY
2014 Title II 2012-13 SY
2015 Title II 2013-14 SY 2014-15 SY ‡ Average % of State Average
EPP Traditional Non-
Traditional Traditional Non-
Traditional Traditional Non-
Traditional Traditional Non-
Traditional Traditional Non-
Traditional Traditional Non-
Traditional APPEL 226 173 178 172 187.3 8.4% ASU 322 20 315 14 334 30 292 6 315.8 17.5 14.2% 0.8% ATC 0 * 0 * 0 0 0.0 0.0% ATU 184 5 276 36 213 27 216 34 222.3 25.5 10.0% 1.1% CBC 0 * 0 * 1 3 1.0 0.1% CRC 0 * 0 * 0 5 1.3 0.1% HU 111 11 118 35 121 66 117 75 116.8 46.8 5.3% 2.1% HSU 126 18 123 18 127 15 102 11 119.5 15.5 5.4% 0.7% HC 4 6 3 5 4.5 0.2% JBU 44 48 29 25 36.5 1.6% LC 10 16 7 5 9.5 0.4% OBU 37 29 40 33 34.8 1.6% PSC 4 5 3 1 3.3 0.1% SAU 70 10 61 23 77 20 63 27 67.8 20.0 3.1% 0.9% TFA 74 90 ‡ 91 ‡ 101 ‡ 89.0 4.0% UAF 232 244 221 250 236.8 10.7% UAFS 87 125 114 105 107.8 4.9% UALR 72 73 73 88 52 75 76 43 68.3 69.8 3.1% 3.1% UAM 42 20 40 42 35 44 37 41 38.5 36.8 1.7% 1.7% UAPB 30 3 27 3 11 3 11 1 19.8 2.5 0.9% 0.1% UCA 143 87 165 85 176 88 170 107 163.5 91.8 7.4% 4.1% UO 8 5 24 16 13.3 0.6% WBC 43 39 32 27 35.3 1.6% Subtotal 1,569 547 1,715 607 1,620 637 1,559 618 1,618.0 602 72.9% 27.1% State Total 2,116 2,322 2,257 2,177 2,220 100% Source: HEA Title II Reports - 2013, 2014, 2015 * EPP was not active. ‡ Source: Data submitted directly to ADE (not via Title II)
9
2016 Educator Preparation Provider Report
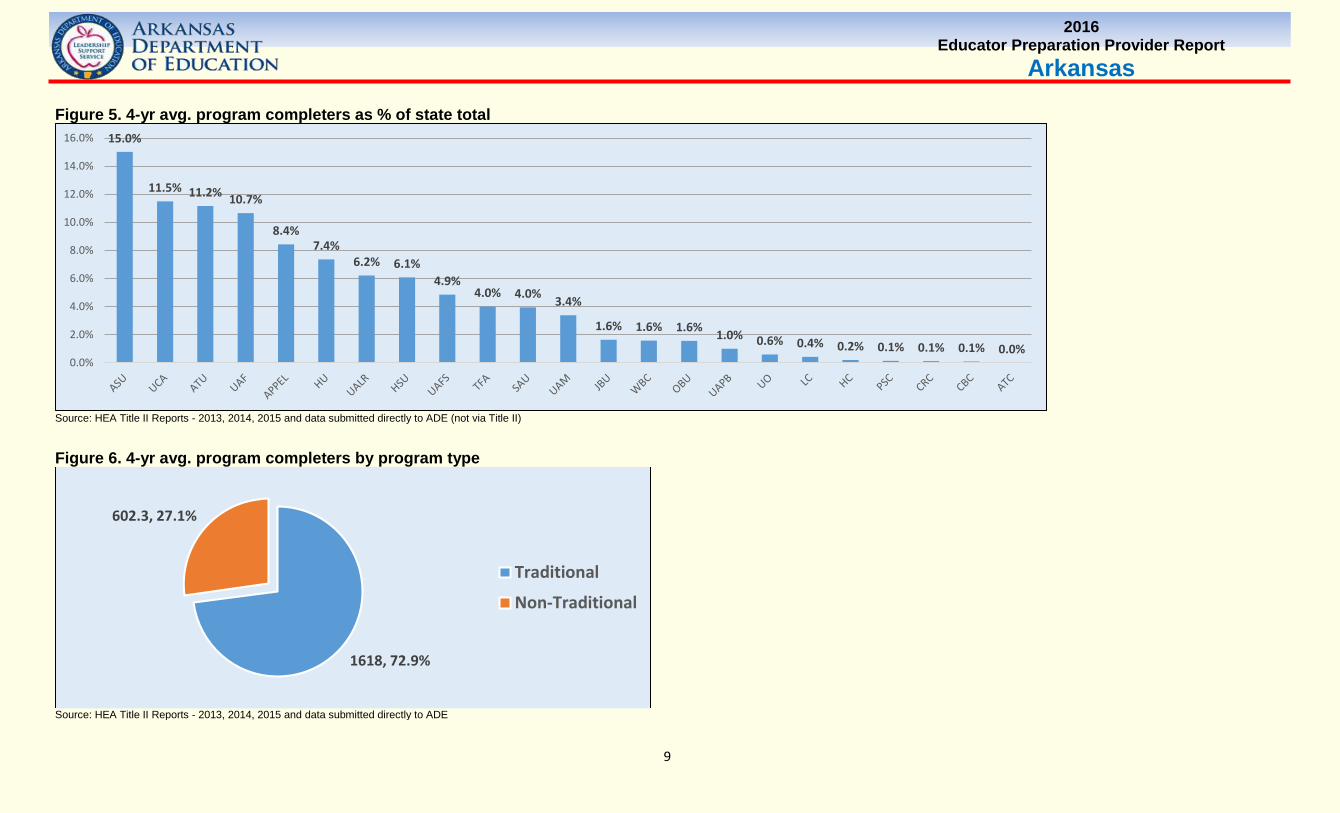
Arkansas Figure 5. 4-yr avg. program completers as % of state total
Source: HEA Title II Reports - 2013, 2014, 2015 and data submitted directly to ADE (not via Title II) Figure 6. 4-yr avg. program completers by program type
Source: HEA Title II Reports - 2013, 2014, 2015 and data submitted directly to ADE
15.0%
11.5% 11.2% 10.7%
8.4%7.4%
6.2% 6.1%4.9%
4.0% 4.0% 3.4%
1.6% 1.6% 1.6% 1.0% 0.6% 0.4% 0.2% 0.1% 0.1% 0.1% 0.0%0.0%
2.0%
4.0%
6.0%
8.0%
10.0%
12.0%
14.0%
16.0%
1618, 72.9%
602.3, 27.1%
Traditional
Non-Traditional
10
2016 Educator Preparation Provider Report
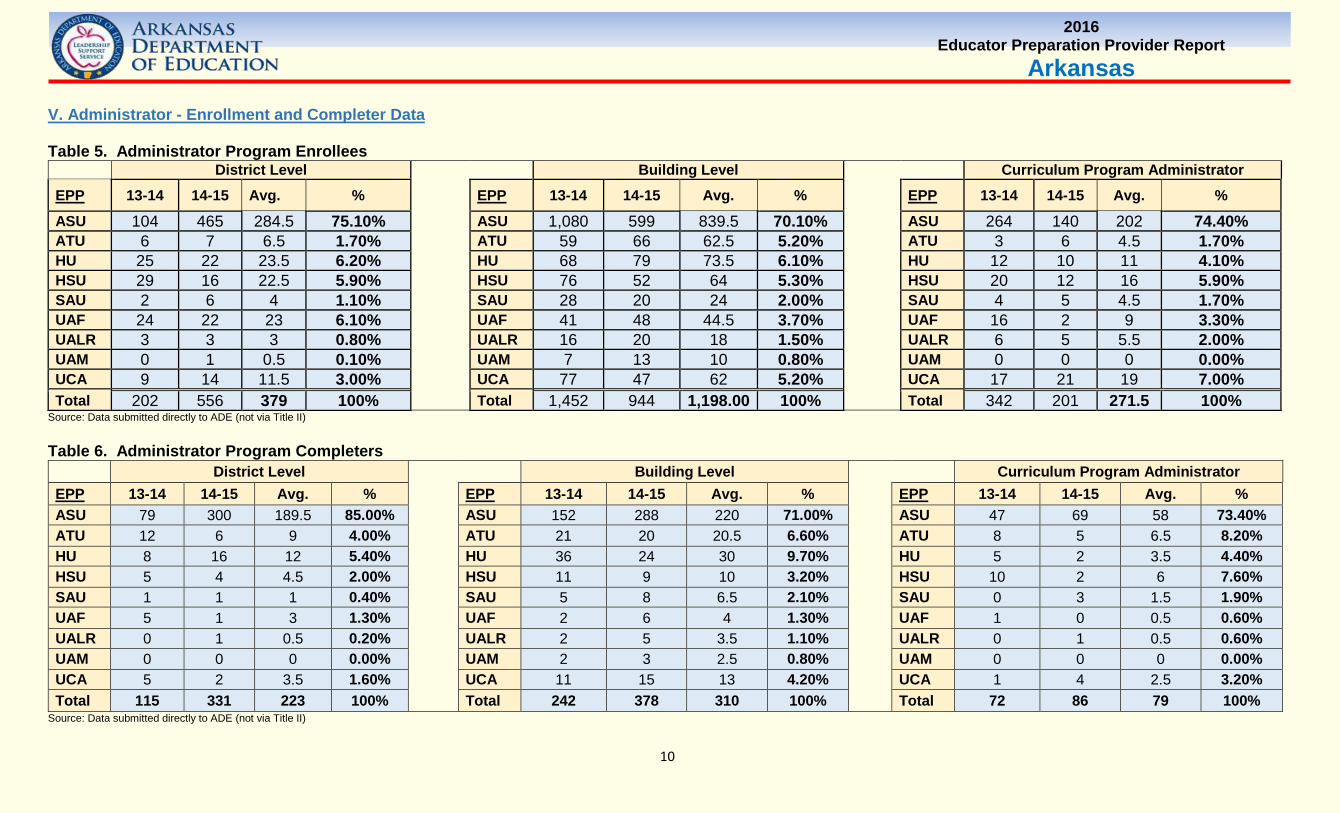
Arkansas V. Administrator - Enrollment and Completer Data Table 5. Administrator Program Enrollees
District Level Building Level Curriculum Program Administrator EPP 13-14 14-15 Avg. % EPP 13-14 14-15 Avg. % EPP 13-14 14-15 Avg. %
ASU 104 465 284.5 75.10% ASU 1,080 599 839.5 70.10% ASU 264 140 202 74.40% ATU 6 7 6.5 1.70% ATU 59 66 62.5 5.20% ATU 3 6 4.5 1.70% HU 25 22 23.5 6.20% HU 68 79 73.5 6.10% HU 12 10 11 4.10% HSU 29 16 22.5 5.90% HSU 76 52 64 5.30% HSU 20 12 16 5.90% SAU 2 6 4 1.10% SAU 28 20 24 2.00% SAU 4 5 4.5 1.70% UAF 24 22 23 6.10% UAF 41 48 44.5 3.70% UAF 16 2 9 3.30% UALR 3 3 3 0.80% UALR 16 20 18 1.50% UALR 6 5 5.5 2.00% UAM 0 1 0.5 0.10% UAM 7 13 10 0.80% UAM 0 0 0 0.00% UCA 9 14 11.5 3.00% UCA 77 47 62 5.20% UCA 17 21 19 7.00% Total 202 556 379 100% Total 1,452 944 1,198.00 100% Total 342 201 271.5 100%
Source: Data submitted directly to ADE (not via Title II) Table 6. Administrator Program Completers District Level Building Level Curriculum Program Administrator EPP 13-14 14-15 Avg. % EPP 13-14 14-15 Avg. % EPP 13-14 14-15 Avg. % ASU 79 300 189.5 85.00% ASU 152 288 220 71.00% ASU 47 69 58 73.40% ATU 12 6 9 4.00% ATU 21 20 20.5 6.60% ATU 8 5 6.5 8.20% HU 8 16 12 5.40% HU 36 24 30 9.70% HU 5 2 3.5 4.40% HSU 5 4 4.5 2.00% HSU 11 9 10 3.20% HSU 10 2 6 7.60% SAU 1 1 1 0.40% SAU 5 8 6.5 2.10% SAU 0 3 1.5 1.90% UAF 5 1 3 1.30% UAF 2 6 4 1.30% UAF 1 0 0.5 0.60% UALR 0 1 0.5 0.20% UALR 2 5 3.5 1.10% UALR 0 1 0.5 0.60% UAM 0 0 0 0.00% UAM 2 3 2.5 0.80% UAM 0 0 0 0.00% UCA 5 2 3.5 1.60% UCA 11 15 13 4.20% UCA 1 4 2.5 3.20% Total 115 331 223 100% Total 242 378 310 100% Total 72 86 79 100%
Source: Data submitted directly to ADE (not via Title II)
11
2016 Educator Preparation Provider Report
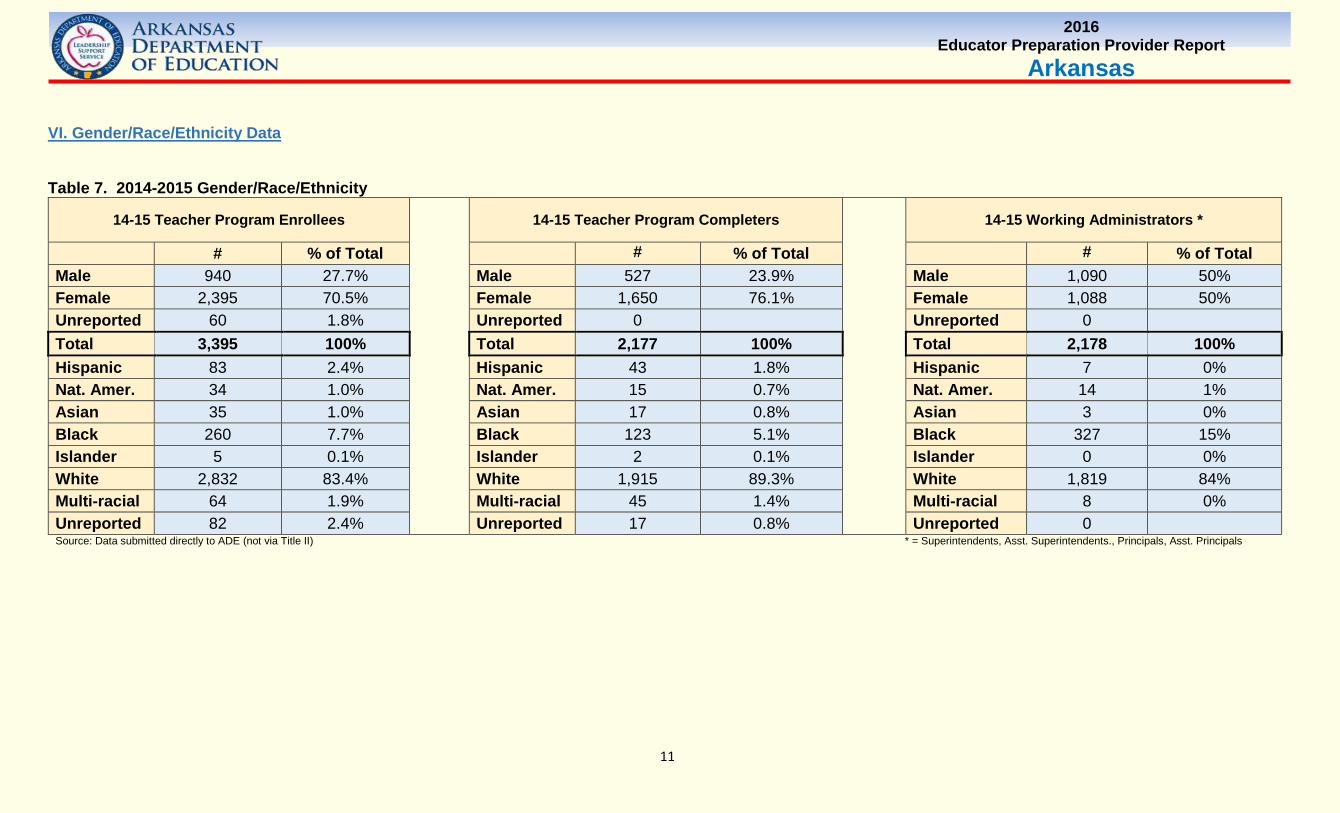
Arkansas VI. Gender/Race/Ethnicity Data Table 7. 2014-2015 Gender/Race/Ethnicity
14-15 Teacher Program Enrollees
14-15 Teacher Program Completers
14-15 Working Administrators *
# % of Total # % of Total # % of Total Male 940 27.7% Male 527 23.9% Male 1,090 50% Female 2,395 70.5% Female 1,650 76.1% Female 1,088 50% Unreported 60 1.8% Unreported 0 Unreported 0 Total 3,395 100% Total 2,177 100% Total 2,178 100% Hispanic 83 2.4% Hispanic 43 1.8% Hispanic 7 0% Nat. Amer. 34 1.0% Nat. Amer. 15 0.7% Nat. Amer. 14 1% Asian 35 1.0% Asian 17 0.8% Asian 3 0% Black 260 7.7% Black 123 5.1% Black 327 15% Islander 5 0.1% Islander 2 0.1% Islander 0 0% White 2,832 83.4% White 1,915 89.3% White 1,819 84% Multi-racial 64 1.9% Multi-racial 45 1.4% Multi-racial 8 0% Unreported 82 2.4% Unreported 17 0.8% Unreported 0 Source: Data submitted directly to ADE (not via Title II) * = Superintendents, Asst. Superintendents., Principals, Asst. Principals
12
2016 Educator Preparation Provider Report
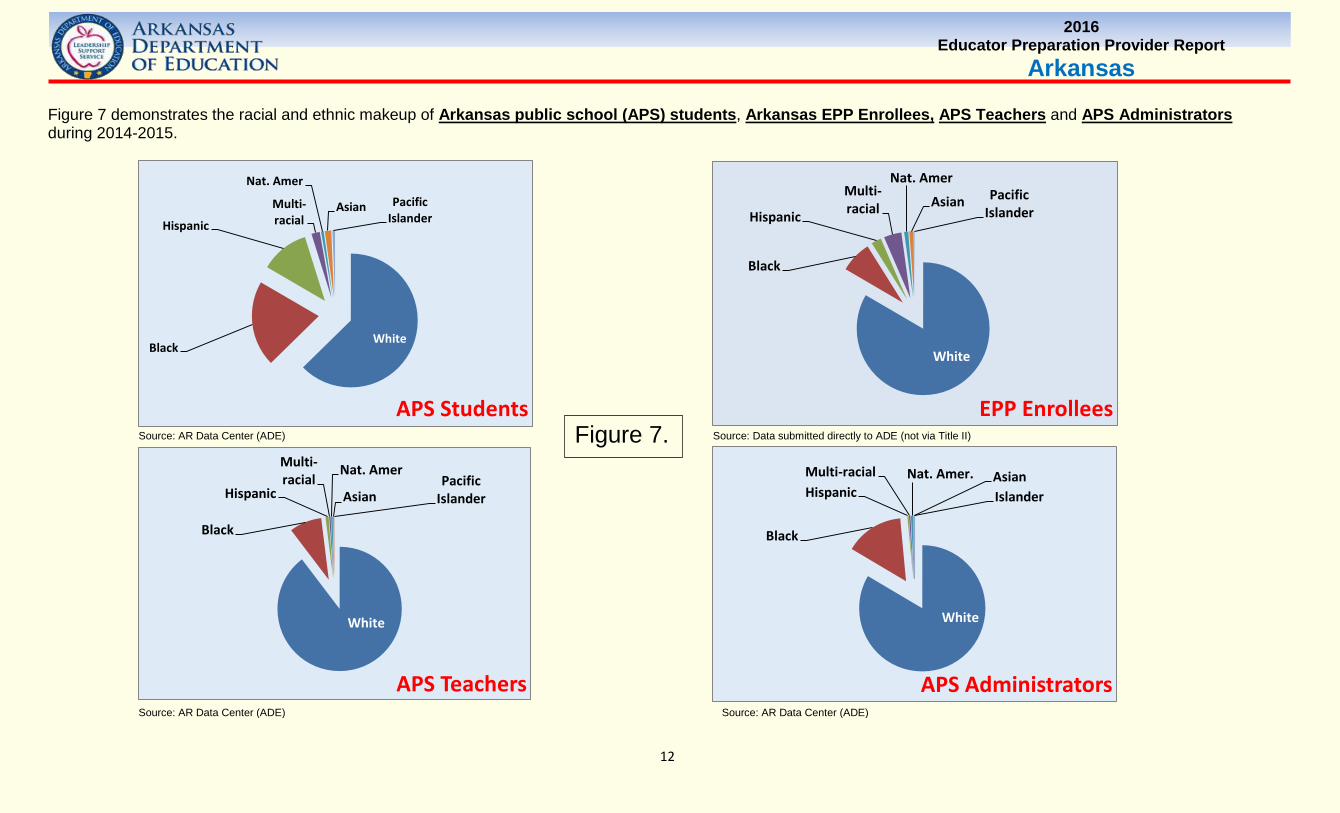
Arkansas Figure 7 demonstrates the racial and ethnic makeup of Arkansas public school (APS) students, Arkansas EPP Enrollees, APS Teachers and APS Administrators during 2014-2015.
Source: AR Data Center (ADE) Source: Data submitted directly to ADE (not via Title II)
Source: AR Data Center (ADE) Source: AR Data Center (ADE)
WhiteBlack
Hispanic
Multi-racial
Nat. Amer
Asian PacificIslander
APS Students
White
Black
Hispanic
Multi-racial
Nat. Amer
Asian PacificIslander
EPP Enrollees
White
Black
Hispanic
Multi-racial
Nat. Amer
AsianPacific
Islander
APS Teachers
White
Black
HispanicMulti-racial Nat. Amer. Asian
Islander
APS Administrators
Figure 7.
13
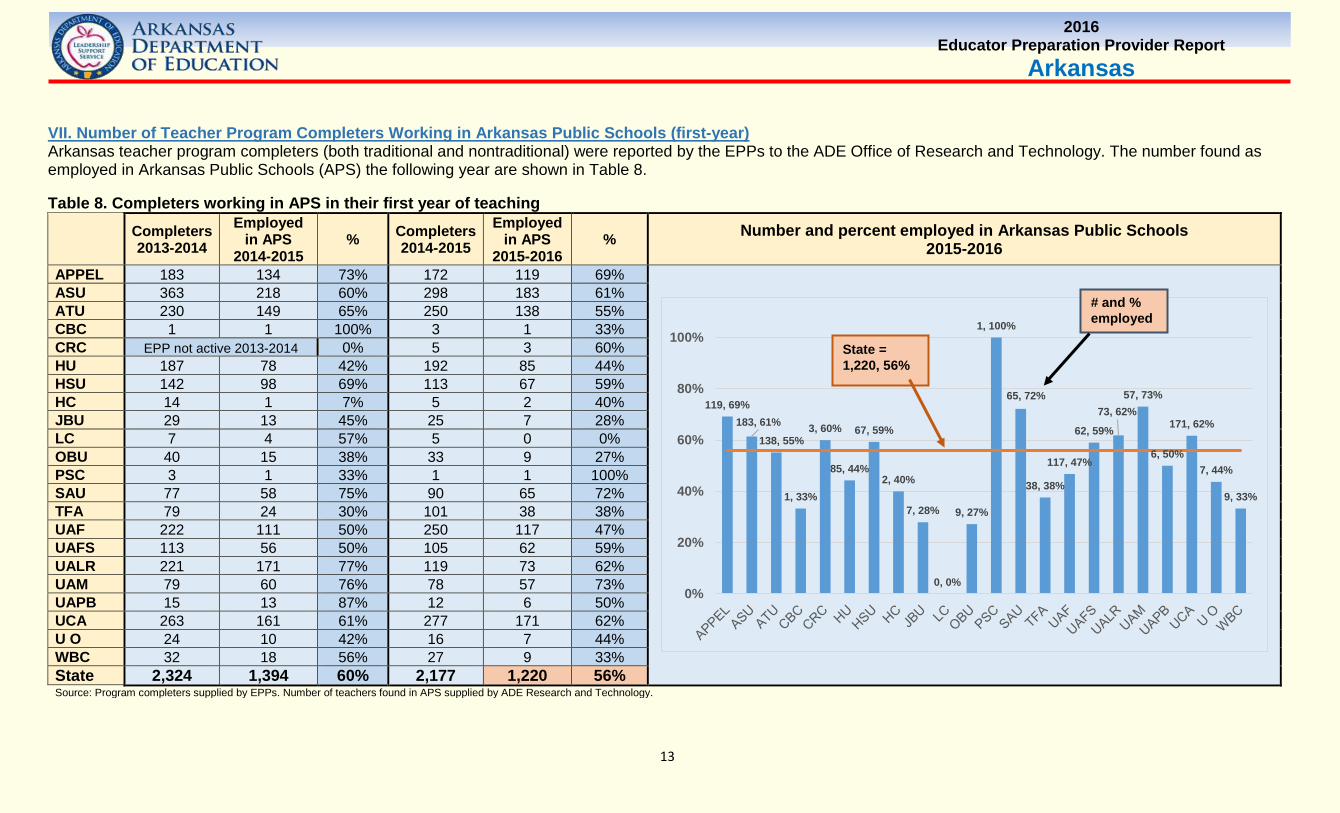
2016 Educator Preparation Provider Report
Arkansas VII. Number of Teacher Program Completers Working in Arkansas Public Schools (first-year) Arkansas teacher program completers (both traditional and nontraditional) were reported by the EPPs to the ADE Office of Research and Technology. The number found as employed in Arkansas Public Schools (APS) the following year are shown in Table 8. Table 8. Completers working in APS in their first year of teaching
Completers 2013-2014
Employed in APS
2014-2015 % Completers
2014-2015 Employed
in APS 2015-2016
% Number and percent employed in Arkansas Public Schools 2015-2016
APPEL 183 134 73% 172 119 69%
ASU 363 218 60% 298 183 61% ATU 230 149 65% 250 138 55% CBC 1 1 100% 3 1 33% CRC EPP not active 2013-2014 0% 5 3 60% HU 187 78 42% 192 85 44% HSU 142 98 69% 113 67 59% HC 14 1 7% 5 2 40% JBU 29 13 45% 25 7 28% LC 7 4 57% 5 0 0% OBU 40 15 38% 33 9 27% PSC 3 1 33% 1 1 100% SAU 77 58 75% 90 65 72% TFA 79 24 30% 101 38 38% UAF 222 111 50% 250 117 47% UAFS 113 56 50% 105 62 59% UALR 221 171 77% 119 73 62% UAM 79 60 76% 78 57 73% UAPB 15 13 87% 12 6 50% UCA 263 161 61% 277 171 62% U O 24 10 42% 16 7 44% WBC 32 18 56% 27 9 33% State 2,324 1,394 60% 2,177 1,220 56% Source: Program completers supplied by EPPs. Number of teachers found in APS supplied by ADE Research and Technology.
119, 69%183, 61%
138, 55%
1, 33%
3, 60%
85, 44%
67, 59%
2, 40%
7, 28%
0, 0%
9, 27%
1, 100%
65, 72%
38, 38%
117, 47%
62, 59%
73, 62%57, 73%
6, 50%
171, 62%
7, 44%
9, 33%
0%
20%
40%
60%
80%
100%
# and % employed
State = 1,220, 56%
14
2016 Educator Preparation Provider Report
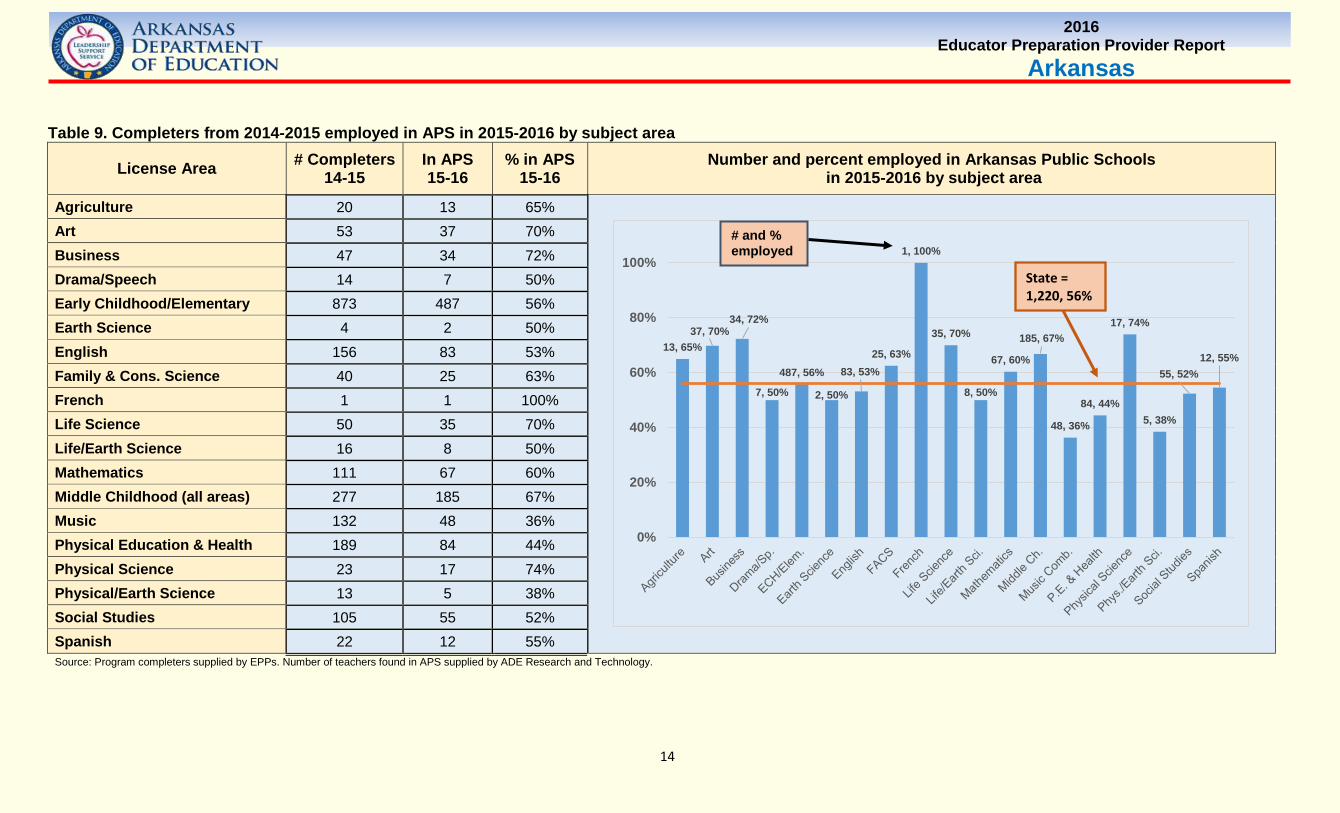
Arkansas Table 9. Completers from 2014-2015 employed in APS in 2015-2016 by subject area
License Area # Completers 14-15
In APS 15-16
% in APS 15-16
Number and percent employed in Arkansas Public Schools in 2015-2016 by subject area
Agriculture 20 13 65%
Art 53 37 70% Business 47 34 72% Drama/Speech 14 7 50% Early Childhood/Elementary 873 487 56% Earth Science 4 2 50% English 156 83 53% Family & Cons. Science 40 25 63% French 1 1 100% Life Science 50 35 70% Life/Earth Science 16 8 50% Mathematics 111 67 60% Middle Childhood (all areas) 277 185 67% Music 132 48 36% Physical Education & Health 189 84 44% Physical Science 23 17 74% Physical/Earth Science 13 5 38% Social Studies 105 55 52% Spanish 22 12 55% Source: Program completers supplied by EPPs. Number of teachers found in APS supplied by ADE Research and Technology.
13, 65%37, 70%
34, 72%
7, 50%
487, 56%
2, 50%
83, 53%25, 63%
1, 100%
35, 70%
8, 50%
67, 60%
185, 67%
48, 36%
84, 44%
17, 74%
5, 38%
55, 52%12, 55%
0%
20%
40%
60%
80%
100%
# and % employed
State = 1,220, 56%
15
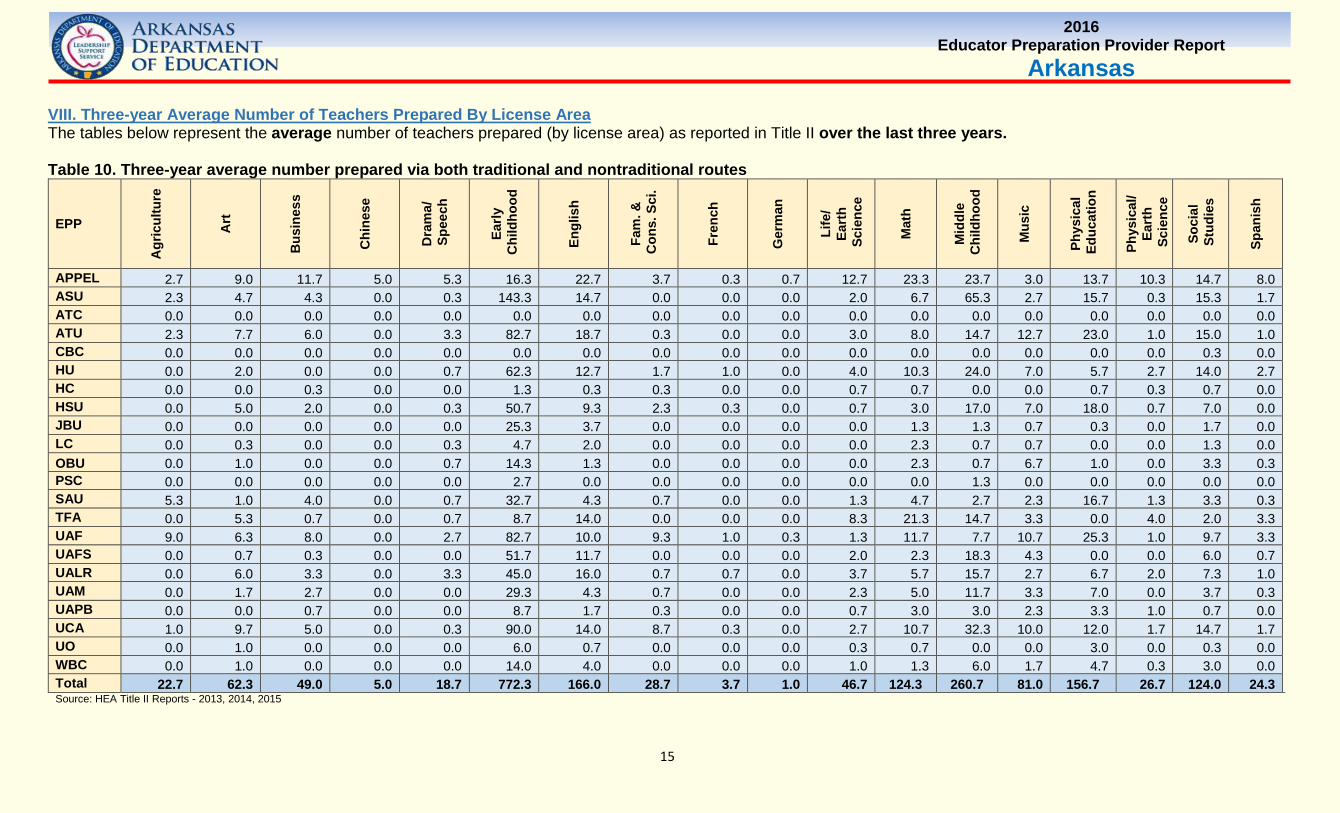
2016 Educator Preparation Provider Report
Arkansas VIII. Three-year Average Number of Teachers Prepared By License Area The tables below represent the average number of teachers prepared (by license area) as reported in Title II over the last three years. Table 10. Three-year average number prepared via both traditional and nontraditional routes
EPP
Agr
icul
ture
Art
Bus
ines
s
Chi
nese
Dra
ma/
S
peec
h
Early
C
hild
hood
Engl
ish
Fam
. &
Con
s. S
ci.
Fren
ch
Ger
man
Life
/ Ea
rth
Sci
ence
Mat
h
Mid
dle
Chi
ldho
od
Mus
ic
Phys
ical
E
duca
tion
Phys
ical
/ Ea
rth
Sci
ence
Soci
al
Stu
dies
Span
ish
APPEL 2.7 9.0 11.7 5.0 5.3 16.3 22.7 3.7 0.3 0.7 12.7 23.3 23.7 3.0 13.7 10.3 14.7 8.0 ASU 2.3 4.7 4.3 0.0 0.3 143.3 14.7 0.0 0.0 0.0 2.0 6.7 65.3 2.7 15.7 0.3 15.3 1.7 ATC 0.0 0.0 0.0 0.0 0.0 0.0 0.0 0.0 0.0 0.0 0.0 0.0 0.0 0.0 0.0 0.0 0.0 0.0 ATU 2.3 7.7 6.0 0.0 3.3 82.7 18.7 0.3 0.0 0.0 3.0 8.0 14.7 12.7 23.0 1.0 15.0 1.0 CBC 0.0 0.0 0.0 0.0 0.0 0.0 0.0 0.0 0.0 0.0 0.0 0.0 0.0 0.0 0.0 0.0 0.3 0.0 HU 0.0 2.0 0.0 0.0 0.7 62.3 12.7 1.7 1.0 0.0 4.0 10.3 24.0 7.0 5.7 2.7 14.0 2.7 HC 0.0 0.0 0.3 0.0 0.0 1.3 0.3 0.3 0.0 0.0 0.7 0.7 0.0 0.0 0.7 0.3 0.7 0.0 HSU 0.0 5.0 2.0 0.0 0.3 50.7 9.3 2.3 0.3 0.0 0.7 3.0 17.0 7.0 18.0 0.7 7.0 0.0 JBU 0.0 0.0 0.0 0.0 0.0 25.3 3.7 0.0 0.0 0.0 0.0 1.3 1.3 0.7 0.3 0.0 1.7 0.0 LC 0.0 0.3 0.0 0.0 0.3 4.7 2.0 0.0 0.0 0.0 0.0 2.3 0.7 0.7 0.0 0.0 1.3 0.0 OBU 0.0 1.0 0.0 0.0 0.7 14.3 1.3 0.0 0.0 0.0 0.0 2.3 0.7 6.7 1.0 0.0 3.3 0.3 PSC 0.0 0.0 0.0 0.0 0.0 2.7 0.0 0.0 0.0 0.0 0.0 0.0 1.3 0.0 0.0 0.0 0.0 0.0 SAU 5.3 1.0 4.0 0.0 0.7 32.7 4.3 0.7 0.0 0.0 1.3 4.7 2.7 2.3 16.7 1.3 3.3 0.3 TFA 0.0 5.3 0.7 0.0 0.7 8.7 14.0 0.0 0.0 0.0 8.3 21.3 14.7 3.3 0.0 4.0 2.0 3.3 UAF 9.0 6.3 8.0 0.0 2.7 82.7 10.0 9.3 1.0 0.3 1.3 11.7 7.7 10.7 25.3 1.0 9.7 3.3 UAFS 0.0 0.7 0.3 0.0 0.0 51.7 11.7 0.0 0.0 0.0 2.0 2.3 18.3 4.3 0.0 0.0 6.0 0.7 UALR 0.0 6.0 3.3 0.0 3.3 45.0 16.0 0.7 0.7 0.0 3.7 5.7 15.7 2.7 6.7 2.0 7.3 1.0 UAM 0.0 1.7 2.7 0.0 0.0 29.3 4.3 0.7 0.0 0.0 2.3 5.0 11.7 3.3 7.0 0.0 3.7 0.3 UAPB 0.0 0.0 0.7 0.0 0.0 8.7 1.7 0.3 0.0 0.0 0.7 3.0 3.0 2.3 3.3 1.0 0.7 0.0 UCA 1.0 9.7 5.0 0.0 0.3 90.0 14.0 8.7 0.3 0.0 2.7 10.7 32.3 10.0 12.0 1.7 14.7 1.7 UO 0.0 1.0 0.0 0.0 0.0 6.0 0.7 0.0 0.0 0.0 0.3 0.7 0.0 0.0 3.0 0.0 0.3 0.0 WBC 0.0 1.0 0.0 0.0 0.0 14.0 4.0 0.0 0.0 0.0 1.0 1.3 6.0 1.7 4.7 0.3 3.0 0.0 Total 22.7 62.3 49.0 5.0 18.7 772.3 166.0 28.7 3.7 1.0 46.7 124.3 260.7 81.0 156.7 26.7 124.0 24.3 Source: HEA Title II Reports - 2013, 2014, 2015
16
2016 Educator Preparation Provider Report
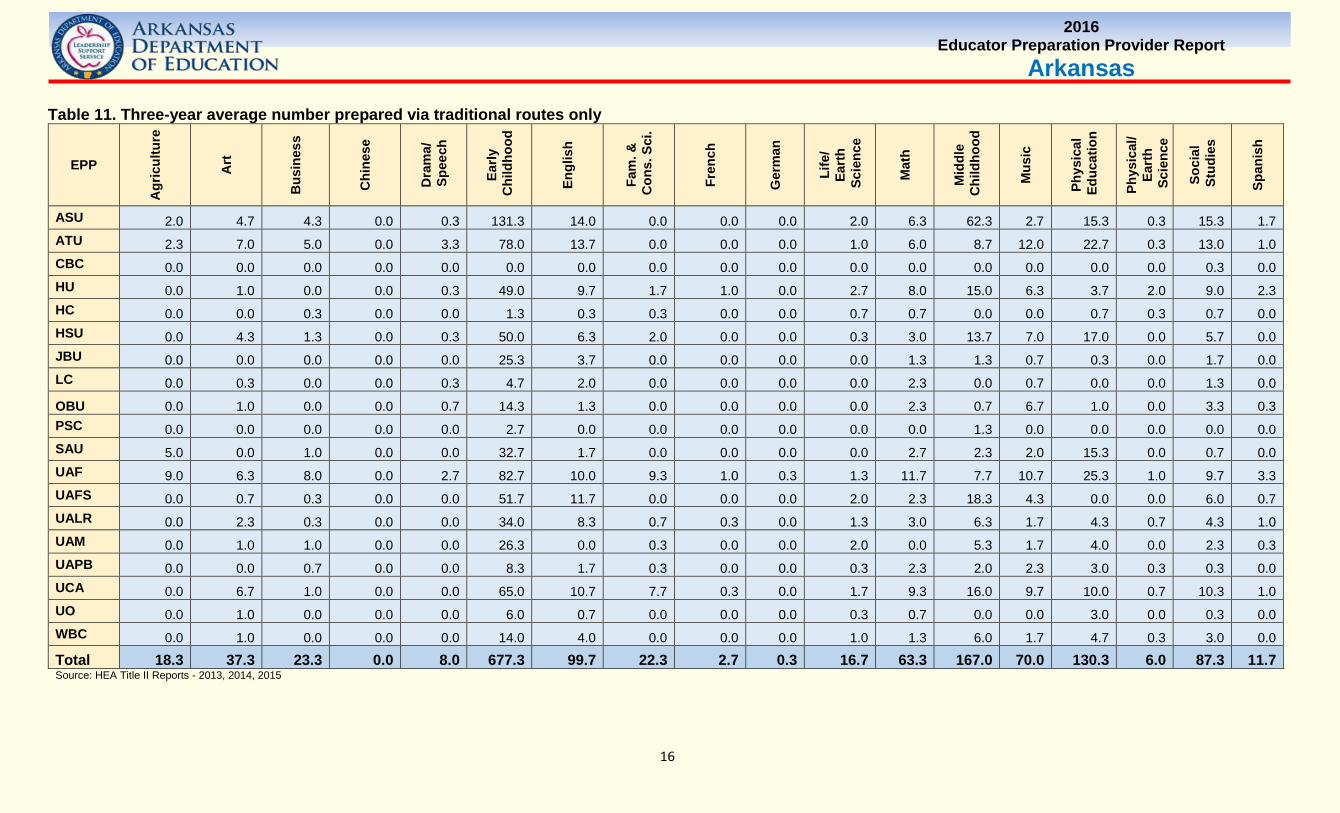
Arkansas Table 11. Three-year average number prepared via traditional routes only
EPP A
gric
ultu
re
Art
Bus
ines
s
Chi
nese
Dra
ma/
S
peec
h
Early
C
hild
hood
Engl
ish
Fam
. &
Con
s. S
ci.
Fren
ch
Ger
man
Life
/ Ea
rth
Sci
ence
Mat
h
Mid
dle
Chi
ldho
od
Mus
ic
Phys
ical
E
duca
tion
Phys
ical
/ Ea
rth
Sci
ence
Soci
al
Stu
dies
Span
ish
ASU 2.0 4.7 4.3 0.0 0.3 131.3 14.0 0.0 0.0 0.0 2.0 6.3 62.3 2.7 15.3 0.3 15.3 1.7 ATU 2.3 7.0 5.0 0.0 3.3 78.0 13.7 0.0 0.0 0.0 1.0 6.0 8.7 12.0 22.7 0.3 13.0 1.0 CBC 0.0 0.0 0.0 0.0 0.0 0.0 0.0 0.0 0.0 0.0 0.0 0.0 0.0 0.0 0.0 0.0 0.3 0.0 HU 0.0 1.0 0.0 0.0 0.3 49.0 9.7 1.7 1.0 0.0 2.7 8.0 15.0 6.3 3.7 2.0 9.0 2.3 HC 0.0 0.0 0.3 0.0 0.0 1.3 0.3 0.3 0.0 0.0 0.7 0.7 0.0 0.0 0.7 0.3 0.7 0.0 HSU 0.0 4.3 1.3 0.0 0.3 50.0 6.3 2.0 0.0 0.0 0.3 3.0 13.7 7.0 17.0 0.0 5.7 0.0 JBU 0.0 0.0 0.0 0.0 0.0 25.3 3.7 0.0 0.0 0.0 0.0 1.3 1.3 0.7 0.3 0.0 1.7 0.0 LC 0.0 0.3 0.0 0.0 0.3 4.7 2.0 0.0 0.0 0.0 0.0 2.3 0.0 0.7 0.0 0.0 1.3 0.0
OBU 0.0 1.0 0.0 0.0 0.7 14.3 1.3 0.0 0.0 0.0 0.0 2.3 0.7 6.7 1.0 0.0 3.3 0.3 PSC 0.0 0.0 0.0 0.0 0.0 2.7 0.0 0.0 0.0 0.0 0.0 0.0 1.3 0.0 0.0 0.0 0.0 0.0 SAU 5.0 0.0 1.0 0.0 0.0 32.7 1.7 0.0 0.0 0.0 0.0 2.7 2.3 2.0 15.3 0.0 0.7 0.0 UAF 9.0 6.3 8.0 0.0 2.7 82.7 10.0 9.3 1.0 0.3 1.3 11.7 7.7 10.7 25.3 1.0 9.7 3.3 UAFS 0.0 0.7 0.3 0.0 0.0 51.7 11.7 0.0 0.0 0.0 2.0 2.3 18.3 4.3 0.0 0.0 6.0 0.7 UALR 0.0 2.3 0.3 0.0 0.0 34.0 8.3 0.7 0.3 0.0 1.3 3.0 6.3 1.7 4.3 0.7 4.3 1.0 UAM 0.0 1.0 1.0 0.0 0.0 26.3 0.0 0.3 0.0 0.0 2.0 0.0 5.3 1.7 4.0 0.0 2.3 0.3 UAPB 0.0 0.0 0.7 0.0 0.0 8.3 1.7 0.3 0.0 0.0 0.3 2.3 2.0 2.3 3.0 0.3 0.3 0.0 UCA 0.0 6.7 1.0 0.0 0.0 65.0 10.7 7.7 0.3 0.0 1.7 9.3 16.0 9.7 10.0 0.7 10.3 1.0 UO 0.0 1.0 0.0 0.0 0.0 6.0 0.7 0.0 0.0 0.0 0.3 0.7 0.0 0.0 3.0 0.0 0.3 0.0 WBC 0.0 1.0 0.0 0.0 0.0 14.0 4.0 0.0 0.0 0.0 1.0 1.3 6.0 1.7 4.7 0.3 3.0 0.0
Total 18.3 37.3 23.3 0.0 8.0 677.3 99.7 22.3 2.7 0.3 16.7 63.3 167.0 70.0 130.3 6.0 87.3 11.7 Source: HEA Title II Reports - 2013, 2014, 2015
17
2016 Educator Preparation Provider Report
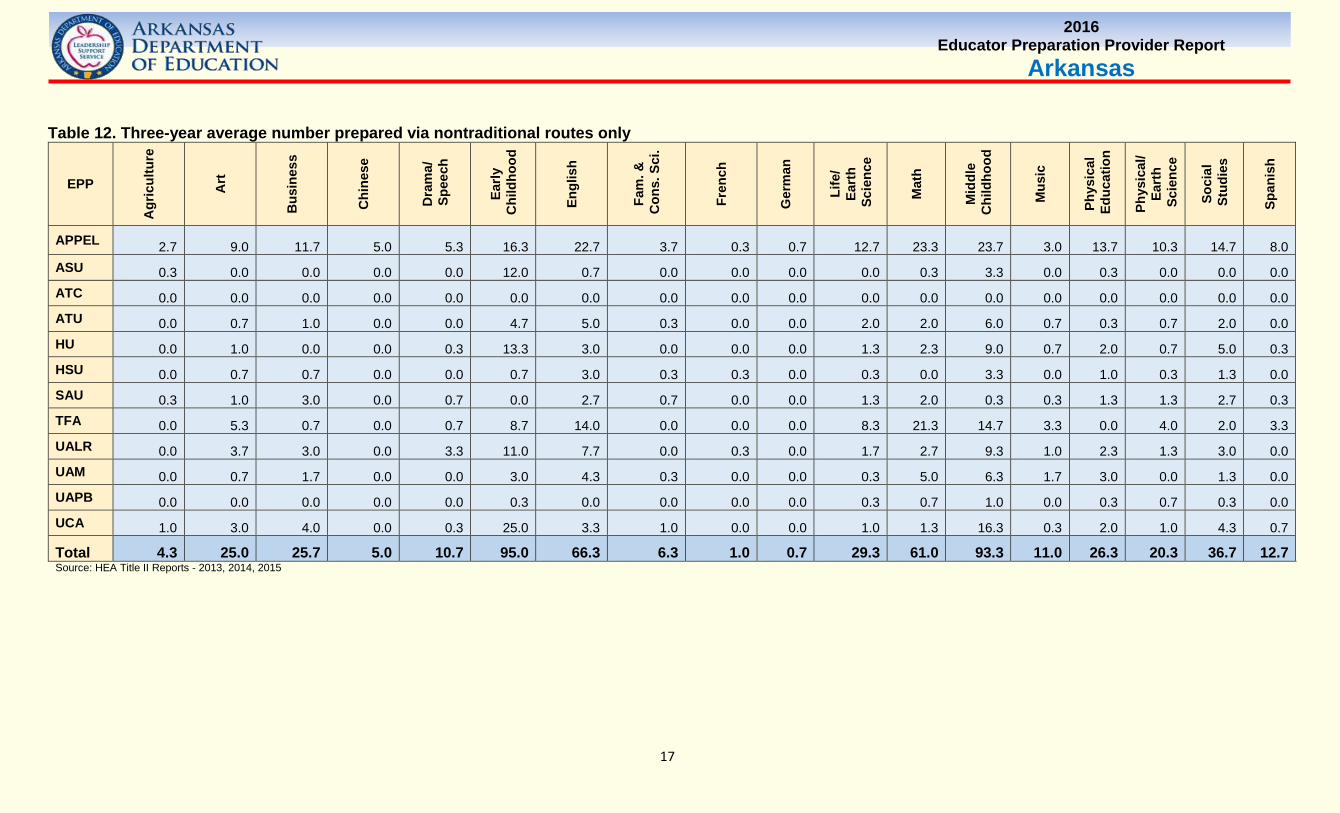
Arkansas Table 12. Three-year average number prepared via nontraditional routes only
EPP
Agr
icul
ture
Art
Bus
ines
s
Chi
nese
Dra
ma/
S
peec
h
Early
C
hild
hood
Engl
ish
Fam
. &
Con
s. S
ci.
Fren
ch
Ger
man
Life
/ Ea
rth
Sci
ence
Mat
h
Mid
dle
Chi
ldho
od
Mus
ic
Phys
ical
E
duca
tion
Phys
ical
/ Ea
rth
Sci
ence
Soci
al
Stu
dies
Span
ish
APPEL 2.7 9.0 11.7 5.0 5.3 16.3 22.7 3.7 0.3 0.7 12.7 23.3 23.7 3.0 13.7 10.3 14.7 8.0 ASU 0.3 0.0 0.0 0.0 0.0 12.0 0.7 0.0 0.0 0.0 0.0 0.3 3.3 0.0 0.3 0.0 0.0 0.0 ATC 0.0 0.0 0.0 0.0 0.0 0.0 0.0 0.0 0.0 0.0 0.0 0.0 0.0 0.0 0.0 0.0 0.0 0.0 ATU 0.0 0.7 1.0 0.0 0.0 4.7 5.0 0.3 0.0 0.0 2.0 2.0 6.0 0.7 0.3 0.7 2.0 0.0 HU 0.0 1.0 0.0 0.0 0.3 13.3 3.0 0.0 0.0 0.0 1.3 2.3 9.0 0.7 2.0 0.7 5.0 0.3 HSU 0.0 0.7 0.7 0.0 0.0 0.7 3.0 0.3 0.3 0.0 0.3 0.0 3.3 0.0 1.0 0.3 1.3 0.0 SAU 0.3 1.0 3.0 0.0 0.7 0.0 2.7 0.7 0.0 0.0 1.3 2.0 0.3 0.3 1.3 1.3 2.7 0.3 TFA 0.0 5.3 0.7 0.0 0.7 8.7 14.0 0.0 0.0 0.0 8.3 21.3 14.7 3.3 0.0 4.0 2.0 3.3 UALR 0.0 3.7 3.0 0.0 3.3 11.0 7.7 0.0 0.3 0.0 1.7 2.7 9.3 1.0 2.3 1.3 3.0 0.0 UAM 0.0 0.7 1.7 0.0 0.0 3.0 4.3 0.3 0.0 0.0 0.3 5.0 6.3 1.7 3.0 0.0 1.3 0.0 UAPB 0.0 0.0 0.0 0.0 0.0 0.3 0.0 0.0 0.0 0.0 0.3 0.7 1.0 0.0 0.3 0.7 0.3 0.0 UCA 1.0 3.0 4.0 0.0 0.3 25.0 3.3 1.0 0.0 0.0 1.0 1.3 16.3 0.3 2.0 1.0 4.3 0.7
Total 4.3 25.0 25.7 5.0 10.7 95.0 66.3 6.3 1.0 0.7 29.3 61.0 93.3 11.0 26.3 20.3 36.7 12.7 Source: HEA Title II Reports - 2013, 2014, 2015
18
2016 Educator Preparation Provider Report
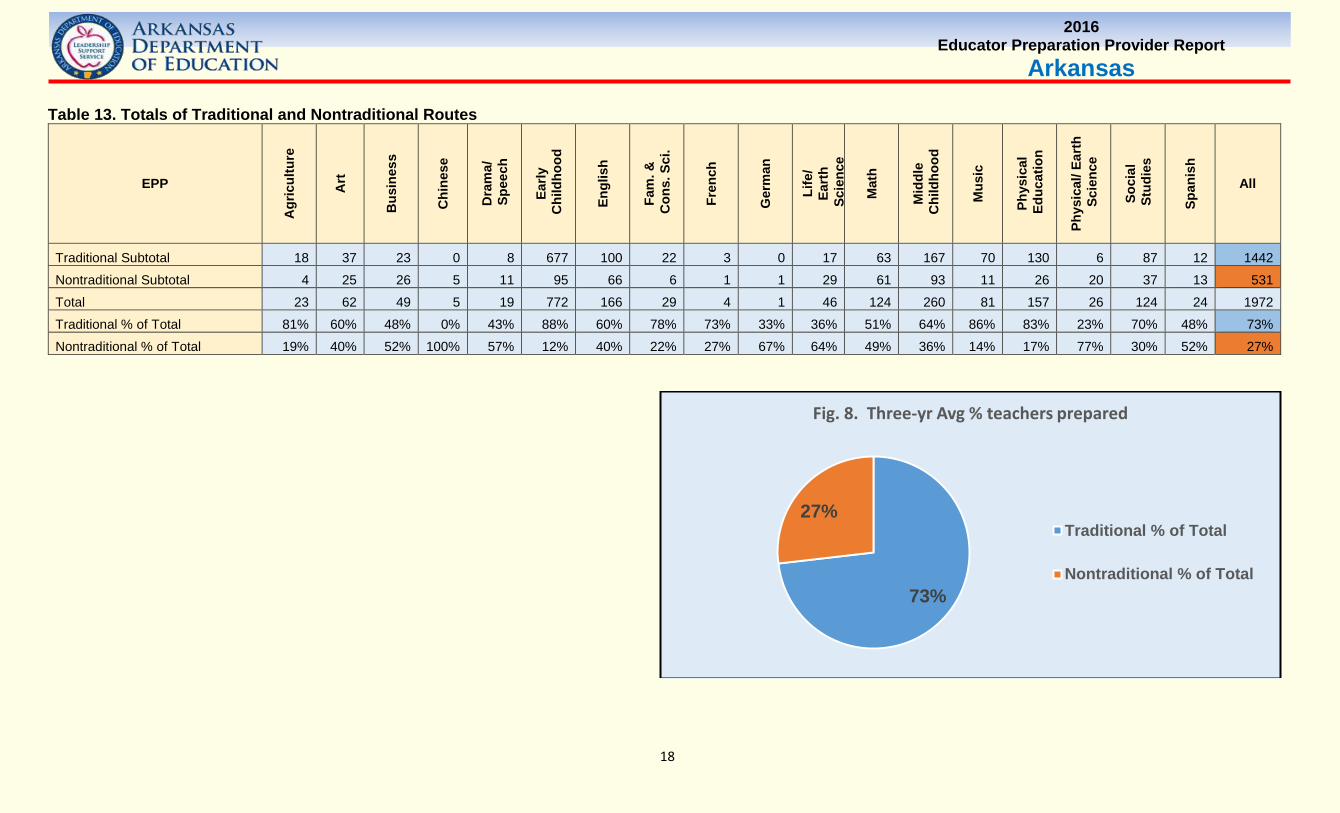
Arkansas Table 13. Totals of Traditional and Nontraditional Routes
EPP
Agr
icul
ture
Art
Bus
ines
s
Chi
nese
Dra
ma/
S
peec
h
Early
C
hild
hood
Engl
ish
Fam
. &
Con
s. S
ci.
Fren
ch
Ger
man
Life
/ Ea
rth
Sci
ence
Mat
h
Mid
dle
Chi
ldho
od
Mus
ic
Phys
ical
E
duca
tion
Phys
ical
/ Ear
th
Sci
ence
Soci
al
Stu
dies
Span
ish
All
Traditional Subtotal 18 37 23 0 8 677 100 22 3 0 17 63 167 70 130 6 87 12 1442
Nontraditional Subtotal 4 25 26 5 11 95 66 6 1 1 29 61 93 11 26 20 37 13 531
Total 23 62 49 5 19 772 166 29 4 1 46 124 260 81 157 26 124 24 1972
Traditional % of Total 81% 60% 48% 0% 43% 88% 60% 78% 73% 33% 36% 51% 64% 86% 83% 23% 70% 48% 73%
Nontraditional % of Total 19% 40% 52% 100% 57% 12% 40% 22% 27% 67% 64% 49% 36% 14% 17% 77% 30% 52% 27%
73%
27%
Fig. 8. Three-yr Avg % teachers prepared
Traditional % of Total
Nontraditional % of Total
19
2016 Educator Preparation Provider Report
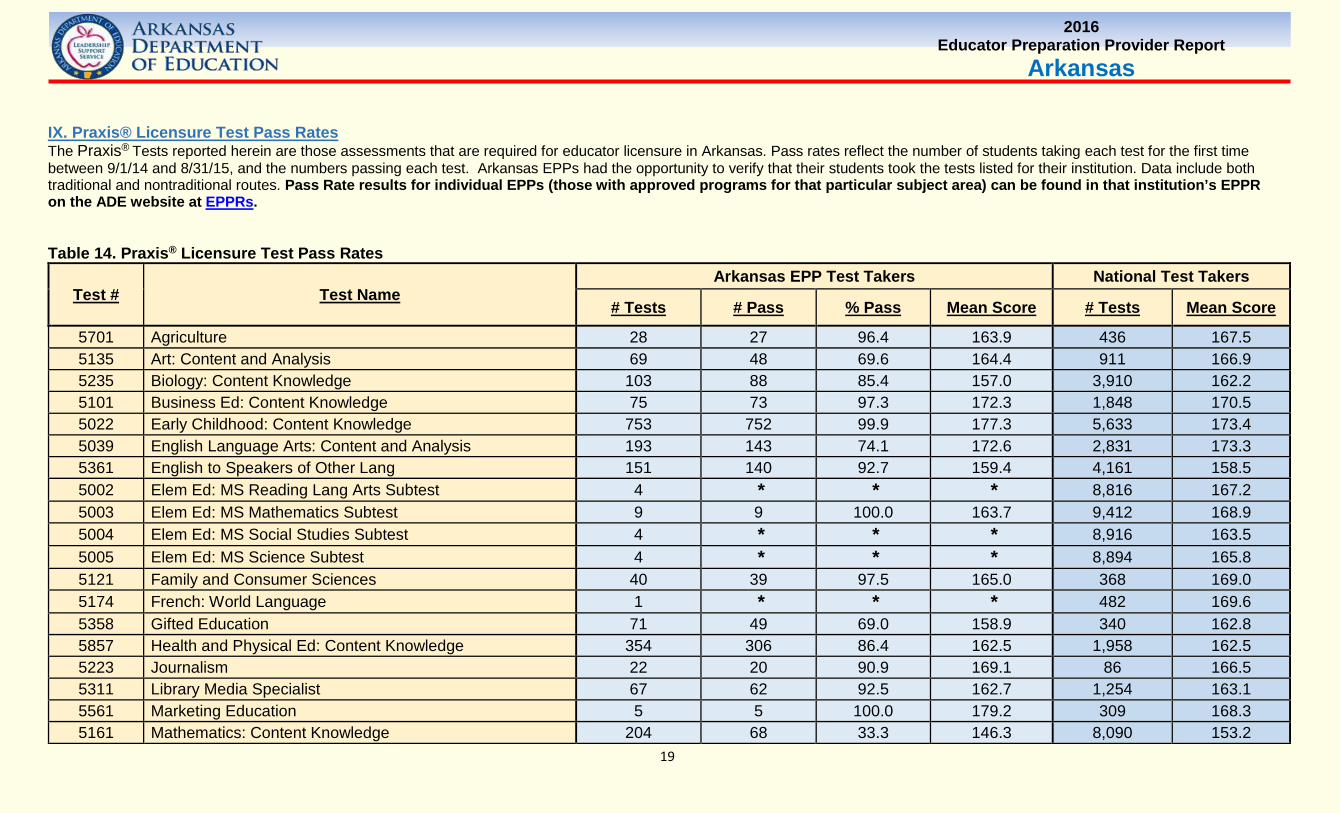
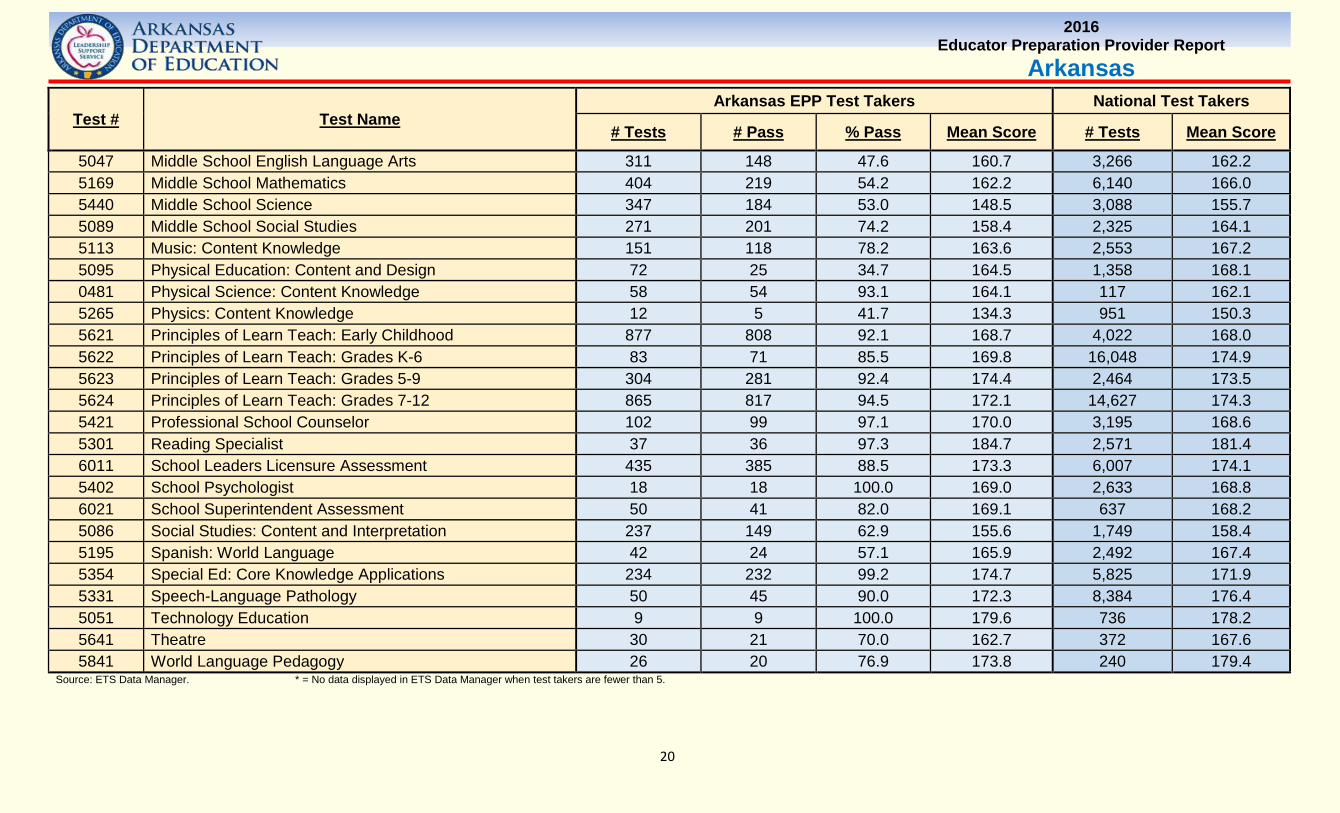
Arkansas IX. Praxis® Licensure Test Pass Rates The Praxis® Tests reported herein are those assessments that are required for educator licensure in Arkansas. Pass rates reflect the number of students taking each test for the first time between 9/1/14 and 8/31/15, and the numbers passing each test. Arkansas EPPs had the opportunity to verify that their students took the tests listed for their institution. Data include both traditional and nontraditional routes. Pass Rate results for individual EPPs (those with approved programs for that particular subject area) can be found in that institution’s EPPR on the ADE website at EPPRs. Table 14. Praxis® Licensure Test Pass Rates
Test # Test Name Arkansas EPP Test Takers National Test Takers
# Tests # Pass % Pass Mean Score # Tests Mean Score
5701 Agriculture 28 27 96.4 163.9 436 167.5 5135 Art: Content and Analysis 69 48 69.6 164.4 911 166.9 5235 Biology: Content Knowledge 103 88 85.4 157.0 3,910 162.2 5101 Business Ed: Content Knowledge 75 73 97.3 172.3 1,848 170.5 5022 Early Childhood: Content Knowledge 753 752 99.9 177.3 5,633 173.4 5039 English Language Arts: Content and Analysis 193 143 74.1 172.6 2,831 173.3 5361 English to Speakers of Other Lang 151 140 92.7 159.4 4,161 158.5 5002 Elem Ed: MS Reading Lang Arts Subtest 4 * * * 8,816 167.2 5003 Elem Ed: MS Mathematics Subtest 9 9 100.0 163.7 9,412 168.9 5004 Elem Ed: MS Social Studies Subtest 4 * * * 8,916 163.5 5005 Elem Ed: MS Science Subtest 4 * * * 8,894 165.8 5121 Family and Consumer Sciences 40 39 97.5 165.0 368 169.0 5174 French: World Language 1 * * * 482 169.6 5358 Gifted Education 71 49 69.0 158.9 340 162.8 5857 Health and Physical Ed: Content Knowledge 354 306 86.4 162.5 1,958 162.5 5223 Journalism 22 20 90.9 169.1 86 166.5 5311 Library Media Specialist 67 62 92.5 162.7 1,254 163.1 5561 Marketing Education 5 5 100.0 179.2 309 168.3 5161 Mathematics: Content Knowledge 204 68 33.3 146.3 8,090 153.2
20
2016 Educator Preparation Provider Report
Arkansas
Test # Test Name Arkansas EPP Test Takers National Test Takers
# Tests # Pass % Pass Mean Score # Tests Mean Score
5047 Middle School English Language Arts 311 148 47.6 160.7 3,266 162.2 5169 Middle School Mathematics 404 219 54.2 162.2 6,140 166.0 5440 Middle School Science 347 184 53.0 148.5 3,088 155.7 5089 Middle School Social Studies 271 201 74.2 158.4 2,325 164.1 5113 Music: Content Knowledge 151 118 78.2 163.6 2,553 167.2 5095 Physical Education: Content and Design 72 25 34.7 164.5 1,358 168.1 0481 Physical Science: Content Knowledge 58 54 93.1 164.1 117 162.1 5265 Physics: Content Knowledge 12 5 41.7 134.3 951 150.3 5621 Principles of Learn Teach: Early Childhood 877 808 92.1 168.7 4,022 168.0 5622 Principles of Learn Teach: Grades K-6 83 71 85.5 169.8 16,048 174.9 5623 Principles of Learn Teach: Grades 5-9 304 281 92.4 174.4 2,464 173.5 5624 Principles of Learn Teach: Grades 7-12 865 817 94.5 172.1 14,627 174.3 5421 Professional School Counselor 102 99 97.1 170.0 3,195 168.6 5301 Reading Specialist 37 36 97.3 184.7 2,571 181.4 6011 School Leaders Licensure Assessment 435 385 88.5 173.3 6,007 174.1 5402 School Psychologist 18 18 100.0 169.0 2,633 168.8 6021 School Superintendent Assessment 50 41 82.0 169.1 637 168.2 5086 Social Studies: Content and Interpretation 237 149 62.9 155.6 1,749 158.4 5195 Spanish: World Language 42 24 57.1 165.9 2,492 167.4 5354 Special Ed: Core Knowledge Applications 234 232 99.2 174.7 5,825 171.9 5331 Speech-Language Pathology 50 45 90.0 172.3 8,384 176.4 5051 Technology Education 9 9 100.0 179.6 736 178.2 5641 Theatre 30 21 70.0 162.7 372 167.6 5841 World Language Pedagogy 26 20 76.9 173.8 240 179.4
Source: ETS Data Manager. * = No data displayed in ETS Data Manager when test takers are fewer than 5.
21
2016 Educator Preparation Provider Report
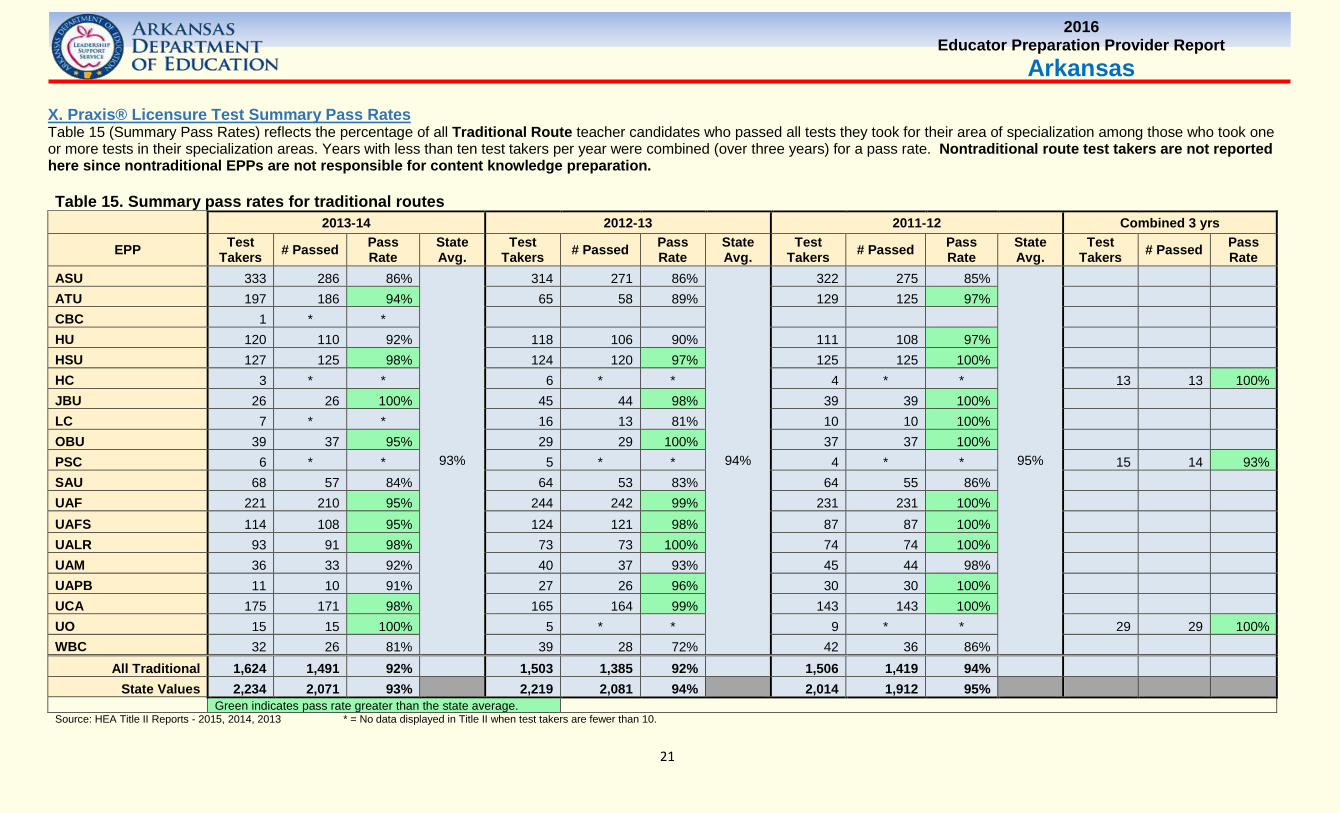
Arkansas X. Praxis® Licensure Test Summary Pass Rates Table 15 (Summary Pass Rates) reflects the percentage of all Traditional Route teacher candidates who passed all tests they took for their area of specialization among those who took one or more tests in their specialization areas. Years with less than ten test takers per year were combined (over three years) for a pass rate. Nontraditional route test takers are not reported here since nontraditional EPPs are not responsible for content knowledge preparation. Table 15. Summary pass rates for traditional routes
2013-14 2012-13 2011-12 Combined 3 yrs
EPP Test Takers # Passed Pass
Rate State Avg.
Test Takers # Passed Pass
Rate State Avg.
Test Takers # Passed Pass
Rate State Avg.
Test Takers # Passed Pass
Rate ASU 333 286 86%
93%
314 271 86%
94%
322 275 85%
95%
ATU 197 186 94% 65 58 89% 129 125 97% CBC 1 * * HU 120 110 92% 118 106 90% 111 108 97% HSU 127 125 98% 124 120 97% 125 125 100% HC 3 * * 6 * * 4 * * 13 13 100% JBU 26 26 100% 45 44 98% 39 39 100% LC 7 * * 16 13 81% 10 10 100% OBU 39 37 95% 29 29 100% 37 37 100% PSC 6 * * 5 * * 4 * * 15 14 93% SAU 68 57 84% 64 53 83% 64 55 86% UAF 221 210 95% 244 242 99% 231 231 100% UAFS 114 108 95% 124 121 98% 87 87 100% UALR 93 91 98% 73 73 100% 74 74 100% UAM 36 33 92% 40 37 93% 45 44 98% UAPB 11 10 91% 27 26 96% 30 30 100% UCA 175 171 98% 165 164 99% 143 143 100% UO 15 15 100% 5 * * 9 * * 29 29 100% WBC 32 26 81% 39 28 72% 42 36 86%
All Traditional 1,624 1,491 92% 1,503 1,385 92% 1,506 1,419 94% State Values 2,234 2,071 93% 2,219 2,081 94% 2,014 1,912 95%
Green indicates pass rate greater than the state average. Source: HEA Title II Reports - 2015, 2014, 2013 * = No data displayed in Title II when test takers are fewer than 10.
22
2016 Educator Preparation Provider Report
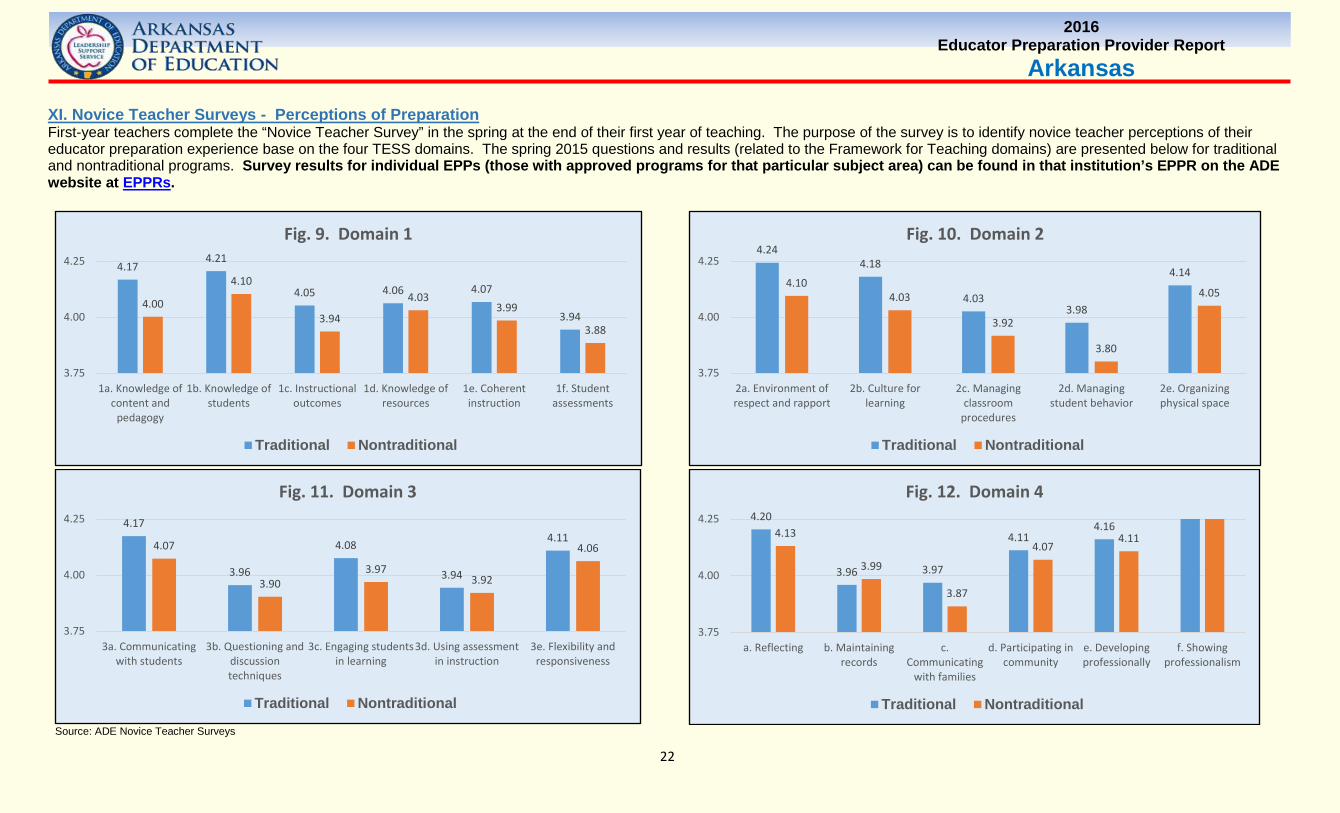
Arkansas XI. Novice Teacher Surveys - Perceptions of Preparation First-year teachers complete the “Novice Teacher Survey” in the spring at the end of their first year of teaching. The purpose of the survey is to identify novice teacher perceptions of their educator preparation experience base on the four TESS domains. The spring 2015 questions and results (related to the Framework for Teaching domains) are presented below for traditional and nontraditional programs. Survey results for individual EPPs (those with approved programs for that particular subject area) can be found in that institution’s EPPR on the ADE website at EPPRs.
Source: ADE Novice Teacher Surveys
4.174.21
4.05 4.06 4.07
3.944.00
4.10
3.94
4.033.99
3.88
3.75
4.00
4.25
1a. Knowledge ofcontent and
pedagogy
1b. Knowledge ofstudents
1c. Instructionaloutcomes
1d. Knowledge ofresources
1e. Coherentinstruction
1f. Studentassessments
Fig. 9. Domain 1
Traditional Nontraditional
4.244.18
4.033.98
4.144.10
4.03
3.92
3.80
4.05
3.75
4.00
4.25
2a. Environment ofrespect and rapport
2b. Culture forlearning
2c. Managingclassroom
procedures
2d. Managingstudent behavior
2e. Organizingphysical space
Fig. 10. Domain 2
Traditional Nontraditional
4.17
3.96
4.08
3.94
4.114.07
3.903.97
3.92
4.06
3.75
4.00
4.25
3a. Communicatingwith students
3b. Questioning anddiscussiontechniques
3c. Engaging studentsin learning
3d. Using assessmentin instruction
3e. Flexibility andresponsiveness
Fig. 11. Domain 3
Traditional Nontraditional
4.20
3.96 3.97
4.114.164.13
3.99
3.87
4.074.11
3.75
4.00
4.25
a. Reflecting b. Maintainingrecords
c.Communicating
with families
d. Participating incommunity
e. Developingprofessionally
f. Showingprofessionalism
Fig. 12. Domain 4
Traditional Nontraditional
23
2016 Educator Preparation Provider Report
Arkansas XII. Glossary Educator Preparation Provider (EPP) – Educator preparation providers are institutions and organizations that offer teacher preparation programs. Educator preparation
providers can be Institutions of Higher Education (IHEs) offering traditional programs (traditional route to licensure), IHEs offering alternative programs (nontraditional route to licensure), or organizations not based at IHEs offering alternative programs. Educator preparation “programs” are those individual tracks offered under the auspices of each provider.
HEA Title II (Title II of the Higher Education Act of 1965) – In October 1998 Congress reauthorized the Higher Education Act. Title II, Sections 207 and 208 reflect the
efforts of States, Institutions of Higher Education (IHE), and their school district partners to improve the recruitment, preparation, and support of new teachers. The HEA Title II Report includes requirements, conditions, and specifications for institutions and states related to teacher preparation and licensure.
IHE – Institution of Higher Education; college or university.
Nontraditional route to licensure – A post-baccalaureate preparation program designed for individuals seeking licensure as a teacher whose undergraduate, or post-
baccalaureate degree is not in educator preparation. Under the Arkansas Department of Education rules for nontraditional licensure, this is a program that allows them to serve as teacher of record while enrolled in a program of study.
Pedagogy – The art or science of teaching, education, or instructional methods.
Praxis® licensure tests – Examinations offered by Educational Testing Service (ETS®) taken by individuals entering the teaching profession (required by many states,
including Arkansas) as part of the licensure process. Passing scores are required on the appropriate basic skills, pedagogy, and content-area assessments as mandated by the State Board of Education.
Program completer – A person who has met all the requirements of a state-approved educator preparation program. Program completers include all those who are
documented as having met such requirements. Documentation may take the form of a degree, institutional certificate, program credential, transcript, or other written proof of having met the program’s requirements.
Traditional route to licensure – An undergraduate program of study or graduate program of study at an institution of higher education that prepares candidates for licensure
as a teacher, special education teacher, school counselor, school administrator, or other school professional. These programs include a supervised clinical experience (student teaching) but the students do not serve as teacher of record while enrolled in the program of study.