arkansas annual network plan (2015-2016) · are part of slams, ncore stations, stn stations, state...
TRANSCRIPT
ARKANSAS AMBIENT AIR MONITORING NETWORK ANNUAL NETWORK PLAN 2015–2016
Prepared By
Planning & Air Quality Analysis Branch, Air Division Air Laboratory Division, Technical Services Division
Arkansas Department of Environmental Quality 5301 Northshore Dr., North Little Rock, AR 72118
i
Table of Contents 1. Introduction ............................................................................................................................. 1 2. Population Statistics ................................................................................................................ 1 3. ADEQ Monitoring Network .................................................................................................... 2
3.1 Ozone Network ................................................................................................................ 5 3.2 Particulate Matter Network .............................................................................................. 7
3.2.1 Fine Particulate Matter (PM2.5) ................................................................................. 7 3.2.2 Particulate Matter (PM10) ........................................................................................ 10 3.2.3 Coarse Particulate Matter (PM10-2.5) ....................................................................... 10 3.2.4 Chemical Speciation ............................................................................................... 11
3.3 Sulfur Dioxide Network ................................................................................................. 11 3.4 Nitrogen Dioxide Network ............................................................................................. 12 3.5 Carbon Monoxide Network ............................................................................................ 12 3.6 Lead Network ................................................................................................................. 13
3.6.1 Waivers Renewal Requested ................................................................................... 14 3.6.2 Waivers No Longer Needed .................................................................................... 16
4. Contact Information .............................................................................................................. 21

ii
List of Tables
Table 1. Population Statistics for Metropolitan Statistical Areas (MSAs) in Arkansas ................. 1 Table 2. ADEQ Operated SLAMS Monitor Information ............................................................... 3 Table 3. Required Minimum Number of Ozone SLAMS for MSAs in Arkansas .......................... 5 Table 4. Proposed Schedule and Latest Design Value for ADEQ Ozone Sites ............................. 5 Table 5. Required Minimum Number of PM2.5 SLAMS for MSAs in Arkansas ........................... 7 Table 6. Continuous PM2.5 AQI Monitoring Site Information ....................................................... 8 Table 7. Proposed Schedule and Latest Design Value for ADEQ PM2.5 Sites ............................... 9 Table 8. Required Minimum Number of PM10 SLAMS for MSAs in Arkansas .......................... 10 Table 9. Proposed Schedule and Latest Estimated Exceedance for ADEQ PM10 Sites ............... 10 Table 10. Required Minimum Number of SO2 SLAMS for MSAs in Arkansas .......................... 11 Table 11. Source-Oriented Lead Waiver Status by Facility ......................................................... 13

iii
List of Figures Figure 1. Map of ADEQ Air Monitoring Network ......................................................................... 2 Figure 2. Historical 4th Daily Maximum Ozone Concentration for Little Rock MSA Monitors ... 6 Figure 3. Historical PM2.5 NAAQS (Annual and 24-Hour) for Newport (05-067-0001) ............... 8 Figure 4. Lead Emissions for Entergy Arkansas, Inc. (Independence Plant) ............................... 14 Figure 5. Lead Emissions for Entergy Arkansas, Inc. (White Bluff Plant) .................................. 15 Figure 6. Lead Emissions for Arkansas Steel Associates, LLC ................................................... 16 Figure 7. Lead Emissions for Georgia Pacific, LLC (Crossett Paper Operations) ....................... 17 Figure 8. Lead Emissions for Gerdau MacSteel ........................................................................... 18 Figure 9. Lead Emissions for Nucor Corporation (Nucor Steel, Arkansas) ................................. 19 Figure 10. Lead Emissions for Nucor-Yamato Steel Company ................................................... 20
1. Introduction The United States Environmental Protection Agency (EPA) has been responsible for establishing and updating the National Ambient Air Quality Standard (NAAQS) under the Federal Clean Air Act. In accordance with 40 CFR Part 58, Subpart B § 58.10, the State of Arkansas is required to submit an annual air monitoring network plan to EPA:
… the State, or where applicable local, agency shall adopt and submit to the Regional Administrator an annual monitoring network plan which shall provide for the establishment and maintenance of an air quality surveillance system that consists of a network of SLAMS monitoring stations including FRM, FEM, and ARM monitors that are part of SLAMS, NCore stations, STN stations, State speciation stations, SPM stations, and/or, in serious, severe and extreme ozone nonattainment areas, PAMS stations, and SPM monitoring stations…
The State of Arkansas’s 2015–2016 Annual Network Plan will be submitted to EPA Region 6 in Dallas, Texas. Federal regulations require that the plan be made available for public inspection for 30 days prior to submission to EPA Region 6. This network plan provides the framework for the establishment and maintenance of an air quality surveillance system. This plan represents Arkansas Department of Environmental Quality’s (ADEQ’s) commitment to protect the health of the citizens of Arkansas through ambient air monitoring using the latest and best technology that is commercially available, and to communicate the data collected as quickly and accurately as possible. Any proposed modifications to the network, as determined by the annual network review process each year, will be stated in the document. 2. Population Statistics Minimum monitoring requirements vary for each pollutant and are based on a combination of factors such as population data, previous year’s concentration levels, and metropolitan area boundaries. Table 1 contains the population statistics for the Metropolitan Statistical Areas (MSAs) located fully or partially in Arkansas. Table 1. Population Statistics for Metropolitan Statistical Areas (MSAs) in Arkansas
Metropolitan Statistical Area (MSA) 2010 Census
Fayetteville-Springdale-Rogers, AR-MO 463,204
Fort Smith, AR-OK 280,467
Hot Springs, AR 96,024
Jonesboro, AR 121,026
Little Rock-North Little Rock-Conway, AR 699,757
Memphis, TN-MS-AR 1,324,829
Pine Bluff, AR 100,258
Texarkana, TX-AR 149,198
1
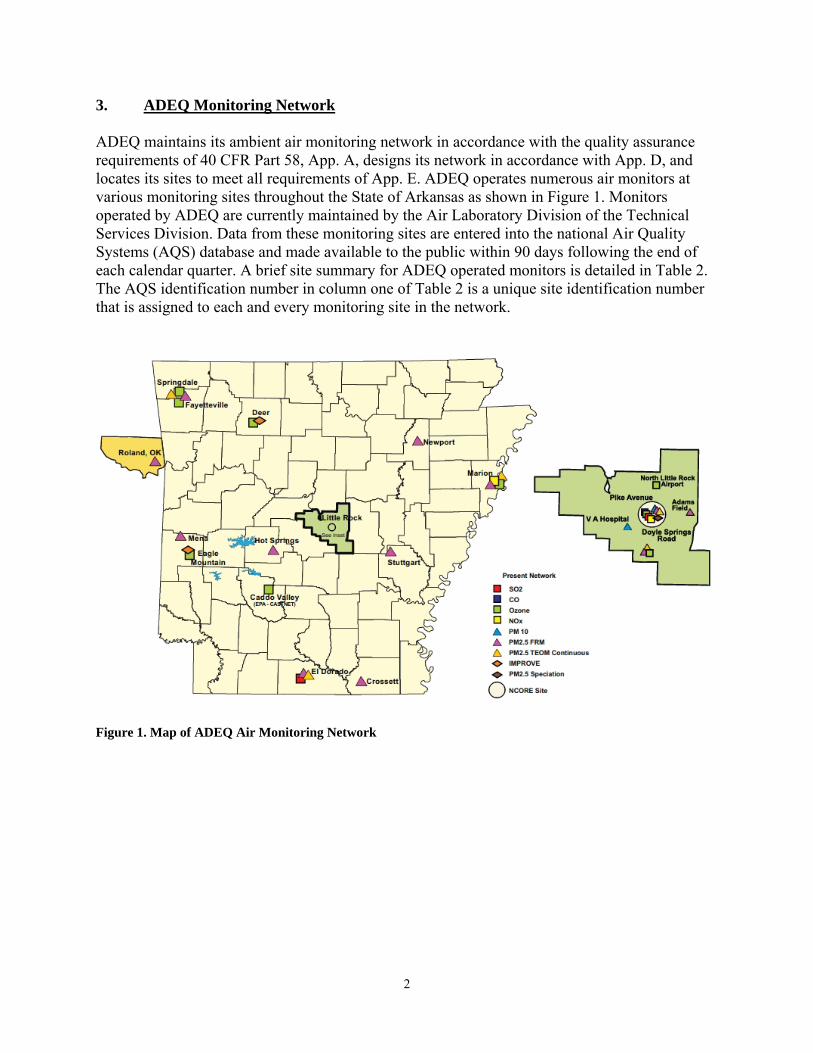
3. ADEQ Monitoring Network ADEQ maintains its ambient air monitoring network in accordance with the quality assurance requirements of 40 CFR Part 58, App. A, designs its network in accordance with App. D, and locates its sites to meet all requirements of App. E. ADEQ operates numerous air monitors at various monitoring sites throughout the State of Arkansas as shown in Figure 1. Monitors operated by ADEQ are currently maintained by the Air Laboratory Division of the Technical Services Division. Data from these monitoring sites are entered into the national Air Quality Systems (AQS) database and made available to the public within 90 days following the end of each calendar quarter. A brief site summary for ADEQ operated monitors is detailed in Table 2. The AQS identification number in column one of Table 2 is a unique site identification number that is assigned to each and every monitoring site in the network.
Figure 1. Map of ADEQ Air Monitoring Network
2

Table 2. ADEQ Operated SLAMS Monitor Information
AQS ID # Site Name Address/Location Latitude, Longitude Station Type
Pollutants Measured
Method Code
Sampling Method
05-001-0011 Stuttgart 1703 N. Beurkle 34.518392, -91.558822 SLAMS PM2.5 143 R&P 2000 FRM 05-003-0005 Crossett 201 Unity Rd. 33.136708, -91.950233 SLAMS PM2.5 143 R&P 2000 FRM 05-035-0005 Marion Polk & Colonial Dr. 35.197178, -90.193047 SLAMS
SLAMS SLAMS SLAMS
PM2.5
PM2.5
Ozone NO2
143 105
R&P 2000 FRM R&P TEOM UV Photometric Chemiluminescence
05-051-0003 Hot Springs 300 Werner 34.469309, -93.000000 SLAMS PM2.5* 143 R&P 2000 FRM 05-067-0001 Newport 7648 Victory Blvd. 35.638069, -91.189381 SLAMS PM2.5 143 R&P 2000 FRM 05-101-0002 Deer Hwy 16 35.832633, -93.208072 SLAMS Ozone UV Photometric 05-113-0002 Mena Hornbeck Rd 34.583581, -94.226019 SLAMS PM2.5 143 R&P 2000 FRM 05-113-0003 Eagle Mtn 463 Polk 631 34.454428, -94.143317 SLAMS Ozone UV Photometric 05-119-0007 PARR (NCore) Pike Ave at River Road 34.756072, -92.281139 SLAMS
SLAMS SLAMS SLAMS SLAMS SLAMS SLAMS SLAMS SLAMS SLAMS SLAMS
PM2.5*
PM2.5
PM10* PM10-2.5* Ozone NOx Speciation NOy Trace SO2 Trace CO Pb*
145 105 127 176
810
81
R & P 2025 FRM R&P TEOM Gravimetric Gravimetric/FRM UV Photometric Chemiluminescence Low Volume Chemiluminescence Infrared Gravimetric
05-119-1002 NLRAP Remount Rd 34.835606, -92.260425 SLAMS Ozone UV Photometric 05-119-1004 Adams Field 1701 S. Bond 34.729486, -92.243431 SLAMS PM2.5 143 R&P 2000 FRM 05-119-1007 VA 4300 Block of West 7th 34.744814, -92.319906 SLAMS PM10 127 Gravimetric 05-119-1008 DSR Doyle Springs Rd 34.681225, -92.328539 SLAMS
SLAMS SLAMS
PM2.5
PM2.5
Ozone
143 105
R&P 2025 FRM R&P TEOM UV Photometric
40-135-9021 Roland, OK 207 Cherokee Blvd 35.40814, -94.524413 SLAMS PM2.5 145 R&P 2025 FRM 05-139-0006 El Dorado Union Memorial Hospital 33.220122, -92.669453 SLAMS
SLAMS SLAMS
PM2.5
PM2.5
SO2
143 105
R&P 2000 FRM R&P TEOM Pulsed Fluorescent
05-143-0005 Springdale 600 S. Old Missouri Rd 36.179617, -94.116611 SLAMS SLAMS SLAMS
PM2.5
PM2.5
Ozone
145 105
R&P 2025 FRM R&P TEOM UV Photometric
05-143-0006 Fayetteville 429 Ernest Lancaster Dr. 36.011703, -94.167436 SLAMS Ozone UV Photometric * Collocated Monitors
3
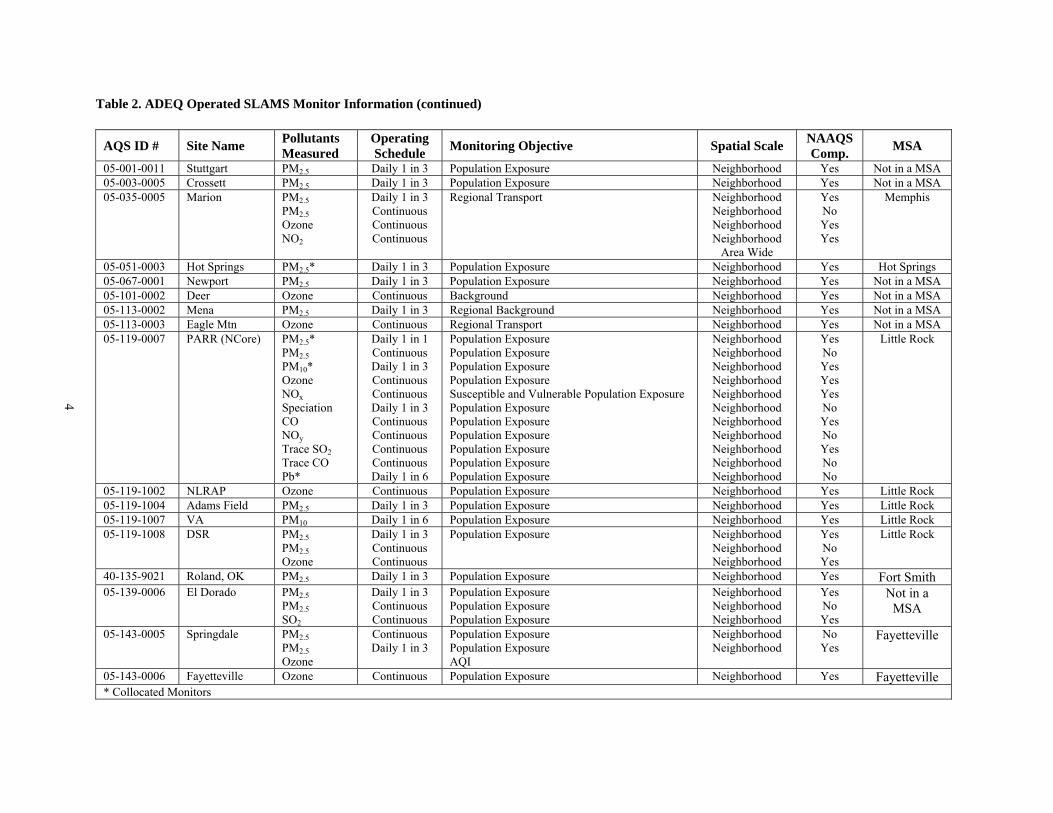
Table 2. ADEQ Operated SLAMS Monitor Information (continued)
AQS ID # Site Name Pollutants Measured
Operating Schedule
Monitoring Objective Spatial Scale NAAQS Comp.
MSA
05-001-0011 Stuttgart PM2.5 Daily 1 in 3 Population Exposure Neighborhood Yes Not in a MSA 05-003-0005 Crossett PM2.5 Daily 1 in 3 Population Exposure Neighborhood Yes Not in a MSA 05-035-0005 Marion PM2.5
PM2.5 Ozone NO2
Daily 1 in 3 Continuous Continuous Continuous
Regional Transport Neighborhood Neighborhood Neighborhood Neighborhood
Area Wide
Yes No Yes Yes
Memphis
05-051-0003 Hot Springs PM2.5* Daily 1 in 3 Population Exposure Neighborhood Yes Hot Springs 05-067-0001 Newport PM2.5 Daily 1 in 3 Population Exposure Neighborhood Yes Not in a MSA 05-101-0002 Deer Ozone Continuous Background Neighborhood Yes Not in a MSA 05-113-0002 Mena PM2.5 Daily 1 in 3 Regional Background Neighborhood Yes Not in a MSA 05-113-0003 Eagle Mtn Ozone Continuous Regional Transport Neighborhood Yes Not in a MSA 05-119-0007 PARR (NCore) PM2.5*
PM2.5 PM10* Ozone NOx
Speciation CO NOy Trace SO2 Trace CO Pb*
Daily 1 in 1 Continuous Daily 1 in 3 Continuous Continuous Daily 1 in 3 Continuous Continuous Continuous Continuous Daily 1 in 6
Population Exposure Population Exposure Population Exposure Population Exposure Susceptible and Vulnerable Population Exposure Population Exposure Population Exposure Population Exposure Population Exposure Population Exposure Population Exposure
Neighborhood Neighborhood Neighborhood Neighborhood Neighborhood Neighborhood Neighborhood Neighborhood Neighborhood Neighborhood Neighborhood
Yes No Yes Yes Yes No Yes No Yes No No
Little Rock
05-119-1002 NLRAP Ozone Continuous Population Exposure Neighborhood Yes Little Rock 05-119-1004 Adams Field PM2.5 Daily 1 in 3 Population Exposure Neighborhood Yes Little Rock 05-119-1007 VA PM10 Daily 1 in 6 Population Exposure Neighborhood Yes Little Rock 05-119-1008 DSR PM2.5
PM2.5 Ozone
Daily 1 in 3 Continuous Continuous
Population Exposure Neighborhood Neighborhood Neighborhood
Yes No Yes
Little Rock
40-135-9021 Roland, OK PM2.5 Daily 1 in 3 Population Exposure Neighborhood Yes Fort Smith 05-139-0006 El Dorado PM2.5
PM2.5 SO2
Daily 1 in 3 Continuous Continuous
Population Exposure Population Exposure Population Exposure
Neighborhood Neighborhood Neighborhood
Yes No Yes
Not in a MSA
05-143-0005 Springdale PM2.5 PM2.5 Ozone
Continuous Daily 1 in 3
Population Exposure Population Exposure AQI
Neighborhood Neighborhood
No Yes
Fayetteville
05-143-0006 Fayetteville Ozone Continuous Population Exposure Neighborhood Yes Fayetteville * Collocated Monitors
4
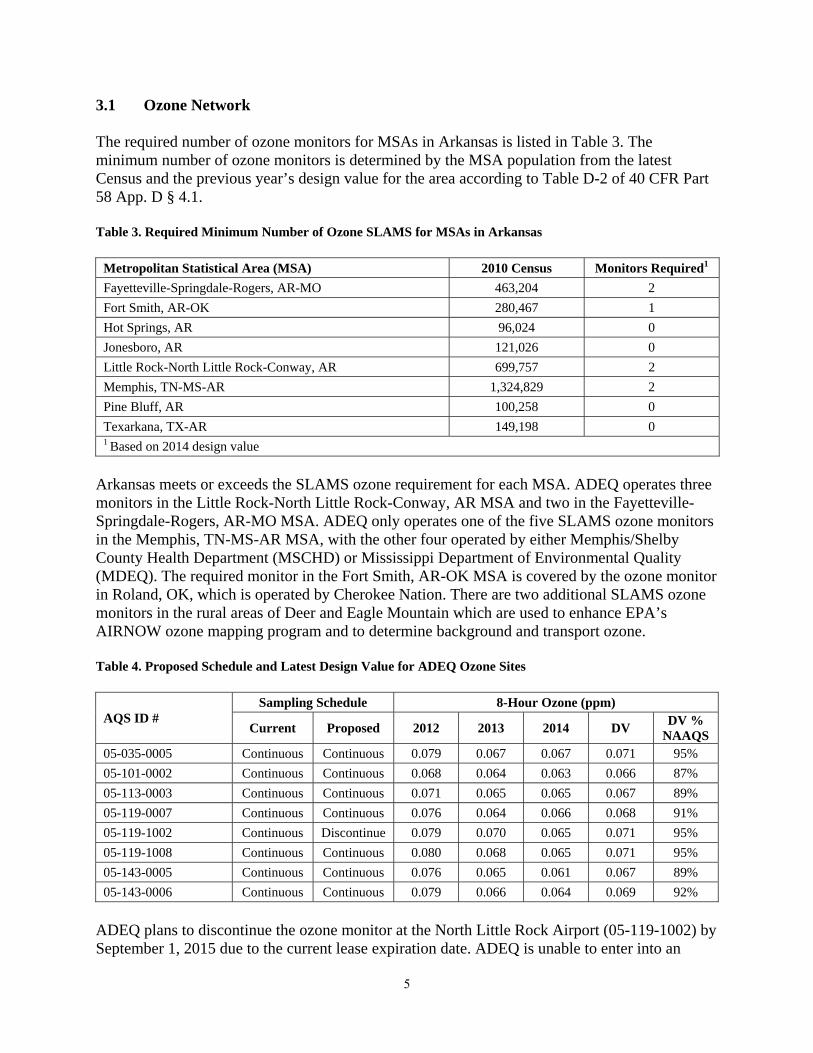
3.1 Ozone Network The required number of ozone monitors for MSAs in Arkansas is listed in Table 3. The minimum number of ozone monitors is determined by the MSA population from the latest Census and the previous year’s design value for the area according to Table D-2 of 40 CFR Part 58 App. D § 4.1. Table 3. Required Minimum Number of Ozone SLAMS for MSAs in Arkansas
Metropolitan Statistical Area (MSA) 2010 Census Monitors Required1
Fayetteville-Springdale-Rogers, AR-MO 463,204 2
Fort Smith, AR-OK 280,467 1
Hot Springs, AR 96,024 0
Jonesboro, AR 121,026 0
Little Rock-North Little Rock-Conway, AR 699,757 2
Memphis, TN-MS-AR 1,324,829 2
Pine Bluff, AR 100,258 0
Texarkana, TX-AR 149,198 0 1 Based on 2014 design value
Arkansas meets or exceeds the SLAMS ozone requirement for each MSA. ADEQ operates three monitors in the Little Rock-North Little Rock-Conway, AR MSA and two in the Fayetteville-Springdale-Rogers, AR-MO MSA. ADEQ only operates one of the five SLAMS ozone monitors in the Memphis, TN-MS-AR MSA, with the other four operated by either Memphis/Shelby County Health Department (MSCHD) or Mississippi Department of Environmental Quality (MDEQ). The required monitor in the Fort Smith, AR-OK MSA is covered by the ozone monitor in Roland, OK, which is operated by Cherokee Nation. There are two additional SLAMS ozone monitors in the rural areas of Deer and Eagle Mountain which are used to enhance EPA’s AIRNOW ozone mapping program and to determine background and transport ozone. Table 4. Proposed Schedule and Latest Design Value for ADEQ Ozone Sites
AQS ID # Sampling Schedule 8-Hour Ozone (ppm)
Current Proposed 2012 2013 2014 DV DV %
NAAQS 05-035-0005 Continuous Continuous 0.079 0.067 0.067 0.071 95%
05-101-0002 Continuous Continuous 0.068 0.064 0.063 0.066 87%
05-113-0003 Continuous Continuous 0.071 0.065 0.065 0.067 89%
05-119-0007 Continuous Continuous 0.076 0.064 0.066 0.068 91%
05-119-1002 Continuous Discontinue 0.079 0.070 0.065 0.071 95%
05-119-1008 Continuous Continuous 0.080 0.068 0.065 0.071 95%
05-143-0005 Continuous Continuous 0.076 0.065 0.061 0.067 89%
05-143-0006 Continuous Continuous 0.079 0.066 0.064 0.069 92%
ADEQ plans to discontinue the ozone monitor at the North Little Rock Airport (05-119-1002) by September 1, 2015 due to the current lease expiration date. ADEQ is unable to enter into an
5
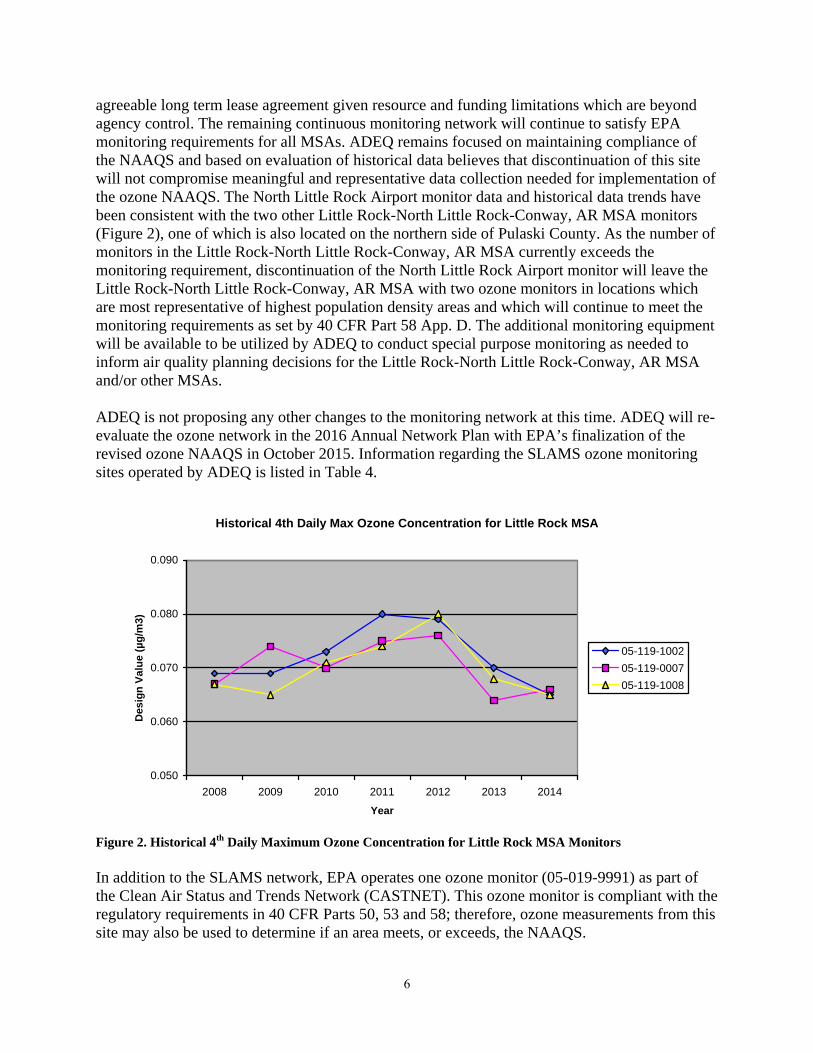
agreeable long term lease agreement given resource and funding limitations which are beyond agency control. The remaining continuous monitoring network will continue to satisfy EPA monitoring requirements for all MSAs. ADEQ remains focused on maintaining compliance of the NAAQS and based on evaluation of historical data believes that discontinuation of this site will not compromise meaningful and representative data collection needed for implementation of the ozone NAAQS. The North Little Rock Airport monitor data and historical data trends have been consistent with the two other Little Rock-North Little Rock-Conway, AR MSA monitors (Figure 2), one of which is also located on the northern side of Pulaski County. As the number of monitors in the Little Rock-North Little Rock-Conway, AR MSA currently exceeds the monitoring requirement, discontinuation of the North Little Rock Airport monitor will leave the Little Rock-North Little Rock-Conway, AR MSA with two ozone monitors in locations which are most representative of highest population density areas and which will continue to meet the monitoring requirements as set by 40 CFR Part 58 App. D. The additional monitoring equipment will be available to be utilized by ADEQ to conduct special purpose monitoring as needed to inform air quality planning decisions for the Little Rock-North Little Rock-Conway, AR MSA and/or other MSAs. ADEQ is not proposing any other changes to the monitoring network at this time. ADEQ will re-evaluate the ozone network in the 2016 Annual Network Plan with EPA’s finalization of the revised ozone NAAQS in October 2015. Information regarding the SLAMS ozone monitoring sites operated by ADEQ is listed in Table 4.
Historical 4th Daily Max Ozone Concentration for Little Rock MSA
0.050
0.060
0.070
0.080
0.090
2008 2009 2010 2011 2012 2013 2014
Year
Des
ign
Val
ue
(µg
/m3)
05-119-1002
05-119-0007
05-119-1008
Figure 2. Historical 4th Daily Maximum Ozone Concentration for Little Rock MSA Monitors In addition to the SLAMS network, EPA operates one ozone monitor (05-019-9991) as part of the Clean Air Status and Trends Network (CASTNET). This ozone monitor is compliant with the regulatory requirements in 40 CFR Parts 50, 53 and 58; therefore, ozone measurements from this site may also be used to determine if an area meets, or exceeds, the NAAQS.
6

3.2 Particulate Matter Network 3.2.1 Fine Particulate Matter (PM2.5) The number of SLAMS PM2.5 monitors for MSAs in Arkansas is listed in Table 5. According to the criteria listed in Table D-5 of 40 CFR Part 58 App. D § 4.7.1, the number of PM2.5 monitors is determined by the MSA population from the latest Census and the previous year’s design value for the area. Table 5. Required Minimum Number of PM2.5 SLAMS for MSAs in Arkansas
Metropolitan Statistical Area (MSA) 2010 Census Monitors Required1
Fayetteville-Springdale-Rogers, AR-MO 463,204 0
Fort Smith, AR-OK 280,467 0
Hot Springs, AR 96,024 0
Jonesboro, AR 121,026 0
Little Rock-North Little Rock-Conway, AR 699,757 2
Memphis, TN-MS-AR 1,324,829 2
Pine Bluff, AR 100,258 0
Texarkana, TX-AR 149,198 0 1 Based on 2014 design value
Arkansas has met or exceeded the SLAMS requirement for each MSA. ADEQ operates three monitors in the Little Rock-North Little Rock-Conway, AR MSA. In addition to the one monitor operated by ADEQ in the Memphis, TN-MS-AR MSA, there are three additional SLAMS monitors operated by either MSCHD or MDEQ. The Fayetteville-Springdale-Rogers, AR-MO MSA, Fort Smith, AR-OK MSA, and Hot Springs, AR MSA each have one monitor in operation. In addition, the Texas Commission on Environmental Quality (TCEQ) operates a monitor in Texarkana, TX that covers the Texarkana, TX-AR MSA. ADEQ also operates an additional five PM2.5 monitoring sites not located in MSAs. Additional information regarding the PM2.5 monitoring sites operated by ADEQ is listed in Table 7. The collocated FRM monitors for Hot Springs (05-051-0003) and PARR (05-119-0007) are operating on a 1:12 sampling schedule. In addition, the following sites are collocated with TEOM continuous monitor: Marion (05-035-0005), PARR (05-119-0007), DSR (05-119-1008), El Dorado (05-139-0006), and Springdale (05-143-0005).
7
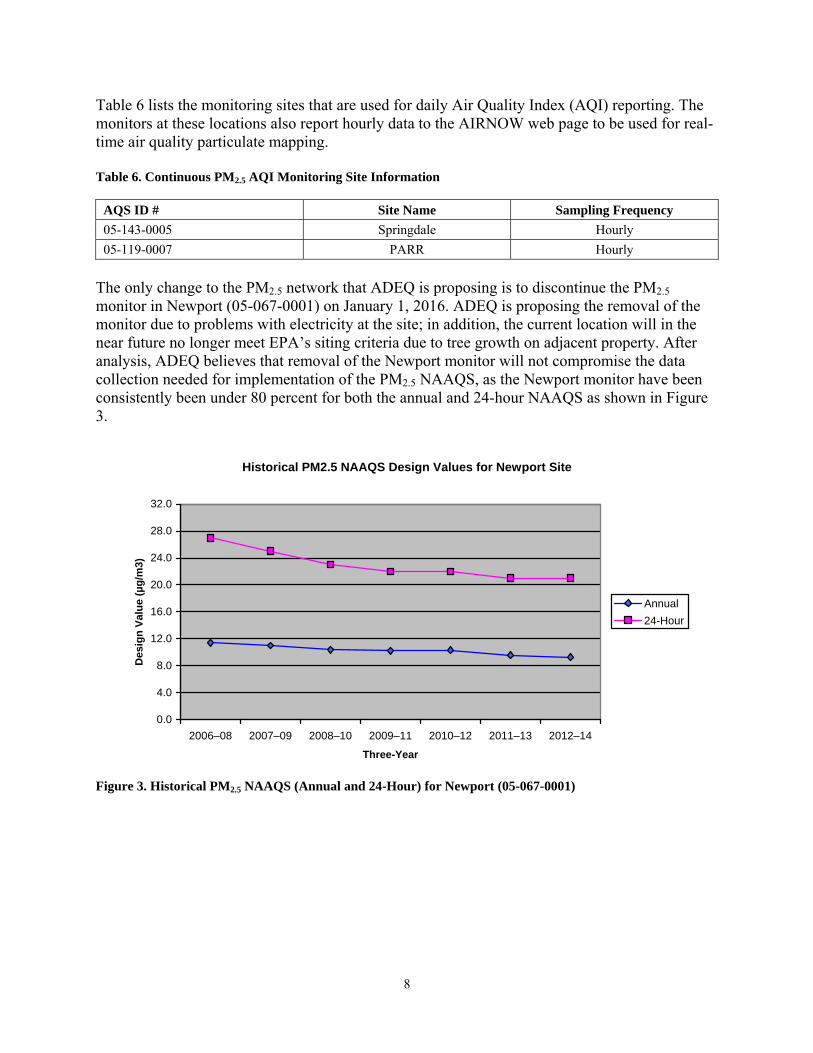
Table 6 lists the monitoring sites that are used for daily Air Quality Index (AQI) reporting. The monitors at these locations also report hourly data to the AIRNOW web page to be used for real-time air quality particulate mapping. Table 6. Continuous PM2.5 AQI Monitoring Site Information
AQS ID # Site Name Sampling Frequency
05-143-0005 Springdale Hourly
05-119-0007 PARR Hourly
The only change to the PM2.5 network that ADEQ is proposing is to discontinue the PM2.5 monitor in Newport (05-067-0001) on January 1, 2016. ADEQ is proposing the removal of the monitor due to problems with electricity at the site; in addition, the current location will in the near future no longer meet EPA’s siting criteria due to tree growth on adjacent property. After analysis, ADEQ believes that removal of the Newport monitor will not compromise the data collection needed for implementation of the PM2.5 NAAQS, as the Newport monitor have been consistently been under 80 percent for both the annual and 24-hour NAAQS as shown in Figure 3.
Historical PM2.5 NAAQS Design Values for Newport Site
0.0
4.0
8.0
12.0
16.0
20.0
24.0
28.0
32.0
2006–08 2007–09 2008–10 2009–11 2010–12 2011–13 2012–14
Three-Year
Des
ign
Val
ue
(µg
/m3)
Annual
24-Hour
Figure 3. Historical PM2.5 NAAQS (Annual and 24-Hour) for Newport (05-067-0001)
8

Table 7. Proposed Schedule and Latest Design Value for ADEQ PM2.5 Sites
AQS ID # Sampling Schedule 24-Hour PM2.5 (µg/m3) Annual PM2.5 (µg/m3) Collocated
with TEOM Current Proposed 2012 2013 2014 DV
DV % NAAQS
2012 2013 2014 DV DV %
NAAQS 05-001-0011 1:3 1:3 18.5 22.1 22.4 21 60% 10.0 9.5 9.1 9.5 79% No
05-003-0005 1:3 1:3 21.0 20.6 22.6 21 60% 10.0 9.1 8.6 9.2 77% No
05-035-0005 1:3 1:3 24.7 21.9 24.7 24 69% 10.0 10.0 9.3 9.8 82% Yes
05-051-0003 1:3 1:3 22.0 20.3 21.3 21 60% 10.5 9.4 9.1 9.7 81% No
05-067-0001 1:3 Discontinue 18.6 20.9 23.41 21 60% 9.4 9.1 9.61 9.3 78% No
05-113-0002 1:3 1:3 22.6 22.6 22.0 22 63% 10.0 9.9 9.4 9.8 82% No
05-119-0007 1:1 1:1 22.6 20.7 21.9 22 63% 11.3 10.4 10.1 10.6 88% Yes
05-119-1004 1:3 1:3 25.8 28.6 22.1 26 74% 11.1 10.6 9.4 10.4 87% No
05-119-1008 1:3 1:3 27.1 22.6 23.3 24 69% 11.6 11.0 10.8 11.1 93% Yes
05-139-0006 1:3 1:3 24.5 20.4 19.0 21 60% 10.9 9.6 9.0 9.8 82% Yes
05-143-0005 1:3 1:3 20.0 19.6 21.2 20 57% 9.6 9.3 8.7 9.2 77% Yes
40-135-9021 1:3 1:3 22.2 21.8 22.2 22 63% 10.2 9.7 9.3 9.7 81% No 1 Site did not meet data completeness
9

3.2.2 Particulate Matter (PM10)
The range of number of SLAMS PM10 monitors for Arkansas MSA is listed in Table 8, as determined by Table D-4 of 40 CFR Part 58 App. D § 4.6. The range of PM10 monitors a determined by the population size of the MSA from the latest Census and the previous year’s design value for the area. Table 8. Required Minimum Number of PM10 SLAMS for MSAs in Arkansas
Metropolitan Statistical Area (MSA) 2010 Census Monitors Required1
Fayetteville-Springdale-Rogers, AR-MO 463,204 0–1
Fort Smith, AR-OK 280,467 0–1
Hot Springs, AR 96,024 0
Jonesboro, AR 121,026 0
Little Rock-North Little Rock-Conway, AR 699,757 1–2
Memphis, TN-MS-AR 1,324,829 2–4
Pine Bluff, AR 100,258 0
Texarkana, TX-AR 149,198 0 1 Based on 2014 design value
ADEQ is operating two PM10 monitoring sites, both operating in the Little Rock-North Little Rock-Conway, AR MSA. The PARR site (05-119-0007) also has a collocated PM10 monitor operating on a 1:12 sampling schedule. The two PM10 sites in the Memphis, TN-MS-AR MSA are operated by MSCHD. Information regarding the two existing PM10 sites operated by ADEQ in the Little Rock-North Little Rock-Conway, AR MSA is located in Table 9. ADEQ will continue to monitor the population using the latest Census for each MSA to determine the number of monitors required as described in 40 CFR 58 App. D § 4.6. Table 9. Proposed Schedule and Latest Estimated Exceedance for ADEQ PM10 Sites
AQS ID # Sampling Schedule Estimated Exceedance
Current Proposed 2012 2013 2014 3-Yr Avg.
% NAAQS
05-119-0007 1:3 1:3 0.0 0.0 0.0 0.0 0%
05-119-1007 1:6 1:6 0.0 0.0 0.0 0.0 0%
3.2.3 Coarse Particulate Matter (PM10-2.5) The PM10-2.5 monitoring is performed at the PARR (05-119-0007) as part of the NCore requirement. The monitor is also operating on a 1:3 sampling schedule as required. No changes are being requested for this monitor.
10

3.2.4 Chemical Speciation
PM2.5 speciation sampling is performed at the PARR (05-119-0007) as part of the NCore requirement. No changes are being requested for this monitor. 3.3 Sulfur Dioxide Network The minimum number of SLAMS SO2 monitors for Arkansas core based statistical areas (CBSAs) by the Population Weighted Emissions Index (PWEI) is listed in Table 10, as determined by 40 CFR Part 58 App. D § 4.4.2. The minimum number of SO2 monitors is determined by CBSA population and the total SO2 emitted within the CBSA. Population data is based on the most current Census or estimate and emissions data is from the most recent National Emissions Inventory (NEI). Table 10. Required Minimum Number of SO2 SLAMS for MSAs in Arkansas
Core Based Statistical Area (CBSA) 2014 Estimate 2011 NEI
SO2 Emissions (tpy)
PWEI Monitors Required
Metropolitan Statistical Area
Fayetteville-Springdale-Rogers, AR-MO 501,653 9,020 4,525 0
Fort Smith, AR-OK 279,592 4,269 1,193 0
Hot Springs, AR 97,322 85 8 0
Jonesboro, AR 126,764 302 38 0
Little Rock-North Little Rock-Conway, AR 729,135 648 473 0
Memphis, TN-MS-AR 1,343,230 21,205 28,483 1
Pine Bluff, AR 94,716 33,791 3,201 0
Texarkana, TX-AR 149,235 2,444 365 0
Micropolitan Statistical Area
Arkadelphia, AR 22,576 215 5 0
Batesville, AR 36,959 34,008 1,257 0
Blytheville, AR 44,235 3,696 164 0
Camden, AR 30,030 166 5 0
El Dorado, AR 40,227 398 16 0
Forrest City, AR 26,899 100 3 0
Harrison, AR 45,100 182 8 0
Helena-West Helena, AR 19,930 189 4 0
Magnolia, AR 23,933 1,589 38 0
Malvern, AR 33,368 133 4 0
Mountain Home, AR 40,857 242 10 0
Paragould, AR 43,694 76 3 0
Russellville, AR 85,152 387 33 0
Searcy, AR 78,592 122 10 0
11
The Memphis, TN-MS-AR CBSA area is the only CBSA that requires a SO2 monitor. The required SO2 monitor in the Memphis CBSA is operated by MSCHD. ADEQ will continue to monitor the PWEI value for the Fayetteville-Springdale-Rogers, AR-MO CBSA. ADEQ also operates two additional SO2 monitoring sites in the state: PARR (05-119-0007) and El Dorado (05-139-0006). EPA Region 6 approved ADEQ’s request, from the 2014 Annual Network Plan, to remove the routine SO2 monitor at site PARR. The routine monitor was removed on January 1, 2015. The trace SO2 monitor remains in operation as part of the NCore requirement. There are no proposed changes to the SO2 network at this time. In addition, if ADEQ opts to characterize areas through monitoring for the 2010 1-hour NAAQS, any additional changes to the SO2 network will be addressed in the next annual network plan. Source oriented monitors are not required to be operational until January 1, 2017 according to the proposed SO2 Data Requirements Rule. ADEQ will adjust the timeframe accordingly if the monitor operational date changes in the finalized SO2 Data Requirements Rule. 3.4 Nitrogen Dioxide Network There are two NO2 sites in Arkansas operated by ADEQ: PARR (05-119-007) and Marion (05-035-0005). The Marion monitor operated by ADEQ was approved by EPA Region 6 to fulfill the area-wide requirement for the Memphis, TN-MS-AR MSA. Area-wide requirement is determined by population size of the CBSA. Memphis. TN-MS-AR MSA is required to have one area-wide NO2 monitor as the CBSA population exceeded 1,000,000. The PARR site meets the criteria for the RA-40 national requirement for susceptible and vulnerable populations as listed in 40 CFR Part 58, App. D § 4.3.4. There are no proposed changes to ADEQ’s NO2 network at this time. The near-road NO2 monitor for the Little Rock-North Little Rock-Conway, AR MSA will be address by ADEQ in the next annual network plan, as the near-road NO2 monitors are not required to be operational until January 1, 2017. The near-road NO2 monitor required for the Memphis, TN-MS-AR MSA was addressed by MSCHD and began operating on July 1, 2014. NO/NOy measurements are monitored at the PARR site as part of the NCore requirement. This monitor produces conservative estimates for NO2 as indicated in 40 CFR Part 58, App. D § 4.3.6.
3.5 Carbon Monoxide Network
ADEQ currently operates one CO monitor at site PARR (05-119-0007), the required trace CO monitor for NCore monitoring. EPA Region 6 approved ADEQ’s request, from the 2014 Annual Network Plan, to remove the routine CO monitor at site PARR. The routine monitor was removed on January 1, 2015. There are no proposed changes to the CO network at this time. The requirement for collocation of a CO monitor at the near-road NO2 site for the Memphis, TN-MS-AR MSA was addressed by MSCHD.
12
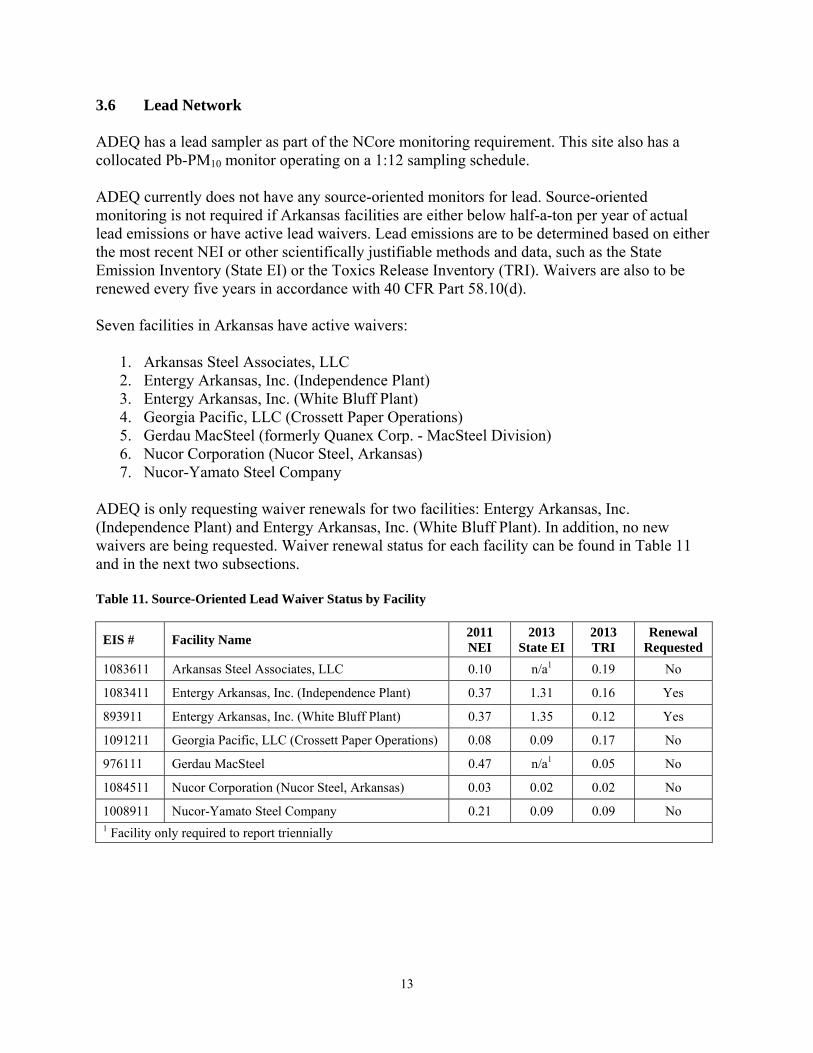
3.6 Lead Network ADEQ has a lead sampler as part of the NCore monitoring requirement. This site also has a collocated Pb-PM10 monitor operating on a 1:12 sampling schedule. ADEQ currently does not have any source-oriented monitors for lead. Source-oriented monitoring is not required if Arkansas facilities are either below half-a-ton per year of actual lead emissions or have active lead waivers. Lead emissions are to be determined based on either the most recent NEI or other scientifically justifiable methods and data, such as the State Emission Inventory (State EI) or the Toxics Release Inventory (TRI). Waivers are also to be renewed every five years in accordance with 40 CFR Part 58.10(d). Seven facilities in Arkansas have active waivers:
1. Arkansas Steel Associates, LLC 2. Entergy Arkansas, Inc. (Independence Plant) 3. Entergy Arkansas, Inc. (White Bluff Plant) 4. Georgia Pacific, LLC (Crossett Paper Operations) 5. Gerdau MacSteel (formerly Quanex Corp. - MacSteel Division) 6. Nucor Corporation (Nucor Steel, Arkansas) 7. Nucor-Yamato Steel Company
ADEQ is only requesting waiver renewals for two facilities: Entergy Arkansas, Inc. (Independence Plant) and Entergy Arkansas, Inc. (White Bluff Plant). In addition, no new waivers are being requested. Waiver renewal status for each facility can be found in Table 11 and in the next two subsections. Table 11. Source-Oriented Lead Waiver Status by Facility
EIS # Facility Name 2011 NEI
2013 State EI
2013 TRI
Renewal Requested
1083611 Arkansas Steel Associates, LLC 0.10 n/a1 0.19 No
1083411 Entergy Arkansas, Inc. (Independence Plant) 0.37 1.31 0.16 Yes
893911 Entergy Arkansas, Inc. (White Bluff Plant) 0.37 1.35 0.12 Yes
1091211 Georgia Pacific, LLC (Crossett Paper Operations) 0.08 0.09 0.17 No
976111 Gerdau MacSteel 0.47 n/a1 0.05 No
1084511 Nucor Corporation (Nucor Steel, Arkansas) 0.03 0.02 0.02 No
1008911 Nucor-Yamato Steel Company 0.21 0.09 0.09 No 1 Facility only required to report triennially
13
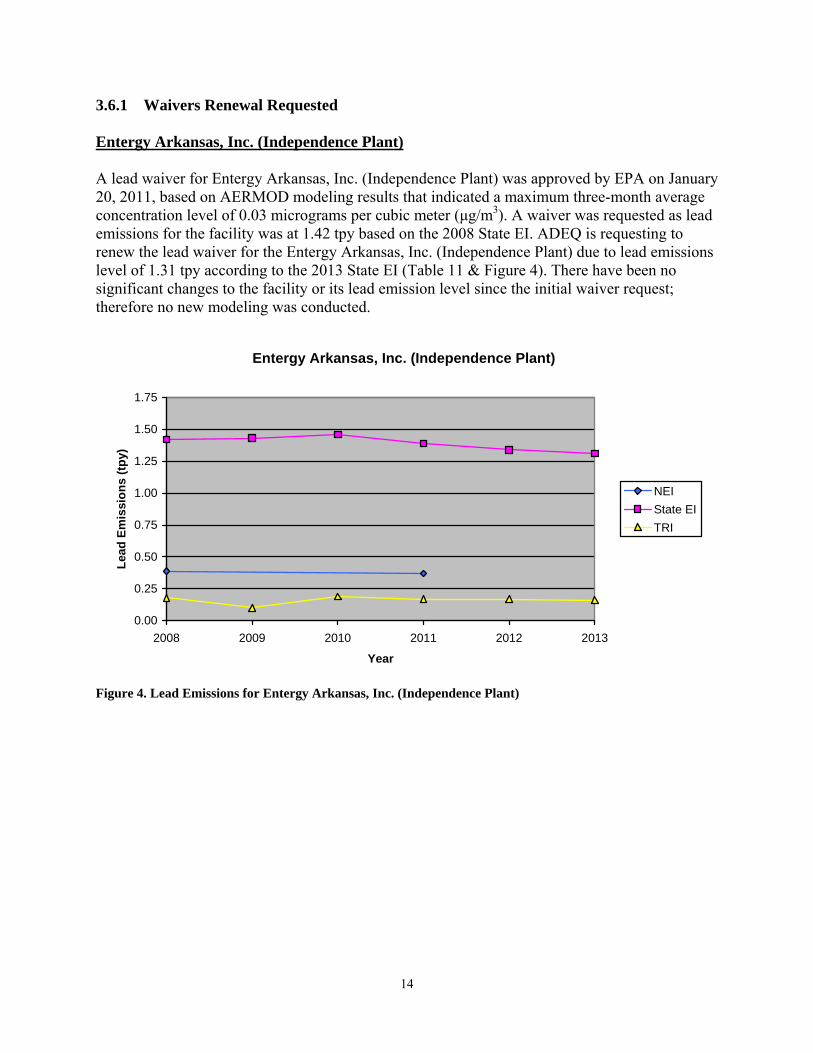
3.6.1 Waivers Renewal Requested Entergy Arkansas, Inc. (Independence Plant) A lead waiver for Entergy Arkansas, Inc. (Independence Plant) was approved by EPA on January 20, 2011, based on AERMOD modeling results that indicated a maximum three-month average concentration level of 0.03 micrograms per cubic meter (μg/m3). A waiver was requested as lead emissions for the facility was at 1.42 tpy based on the 2008 State EI. ADEQ is requesting to renew the lead waiver for the Entergy Arkansas, Inc. (Independence Plant) due to lead emissions level of 1.31 tpy according to the 2013 State EI (Table 11 & Figure 4). There have been no significant changes to the facility or its lead emission level since the initial waiver request; therefore no new modeling was conducted.
Entergy Arkansas, Inc. (Independence Plant)
0.00
0.25
0.50
0.75
1.00
1.25
1.50
1.75
2008 2009 2010 2011 2012 2013
Year
Lea
d E
mis
sio
ns
(tp
y)
NEI
State EI
TRI
Figure 4. Lead Emissions for Entergy Arkansas, Inc. (Independence Plant)
14
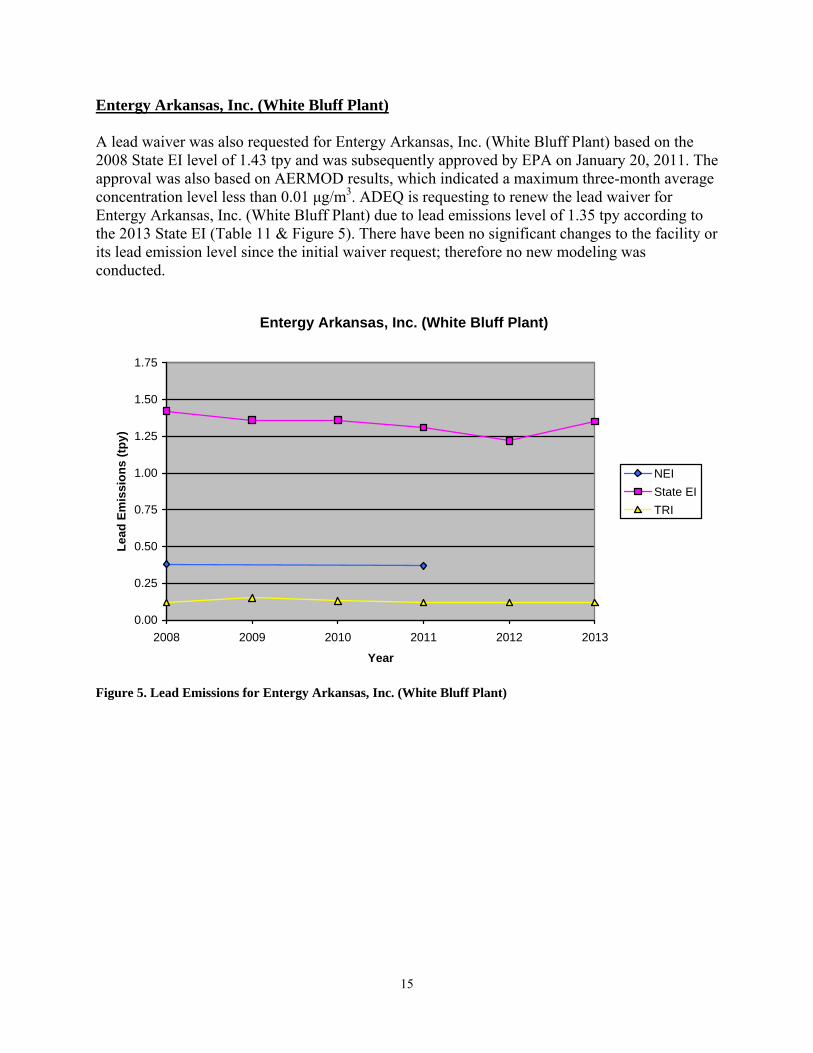
Entergy Arkansas, Inc. (White Bluff Plant) A lead waiver was also requested for Entergy Arkansas, Inc. (White Bluff Plant) based on the 2008 State EI level of 1.43 tpy and was subsequently approved by EPA on January 20, 2011. The approval was also based on AERMOD results, which indicated a maximum three-month average concentration level less than 0.01 μg/m3. ADEQ is requesting to renew the lead waiver for Entergy Arkansas, Inc. (White Bluff Plant) due to lead emissions level of 1.35 tpy according to the 2013 State EI (Table 11 & Figure 5). There have been no significant changes to the facility or its lead emission level since the initial waiver request; therefore no new modeling was conducted.
Entergy Arkansas, Inc. (White Bluff Plant)
0.00
0.25
0.50
0.75
1.00
1.25
1.50
1.75
2008 2009 2010 2011 2012 2013
Year
Lea
d E
mis
sio
ns
(tp
y)
NEI
State EI
TRI
Figure 5. Lead Emissions for Entergy Arkansas, Inc. (White Bluff Plant)
15

3.6.2 Waivers No Longer Needed Arkansas Steel Associates, LLC The 2008 NEI lead emissions for Arkansas Steel Associates, LLC was at 0.91 tpy, which prompted ADEQ to request a waiver for source-oriented lead monitoring in 2011. In the initial waiver request, ADEQ modeled to determine the impact the facility had on ambient lead NAAQS. The AERMOD results indicated that the facility contributed to 30.6 percent of the NAAQS with a maximum three-month average concentration level of 0.046 μg/m3. The waiver request for the facility was approved on July 13, 2012. ADEQ is not requesting to renew the lead waiver for Arkansas Steel Associates, LLC as it is no longer needed as actual emissions have decreased since the 2008 NEI and emissions have remained below the 0.5 tpy threshold since 2009 (Table 11 & Figure 6). Actual lead emissions used for renewal determination included the 2011 NEI, the 2011 State EI, and the 2013 TRI.
Arkansas Steel Associates, LLC
0.00
0.25
0.50
0.75
1.00
1.25
1.50
1.75
2008 2009 2010 2011 2012 2013
Year
Le
ad
Em
iss
ion
s (
tpy
)
NEI
State EI
TRI
Figure 6. Lead Emissions for Arkansas Steel Associates, LLC
16
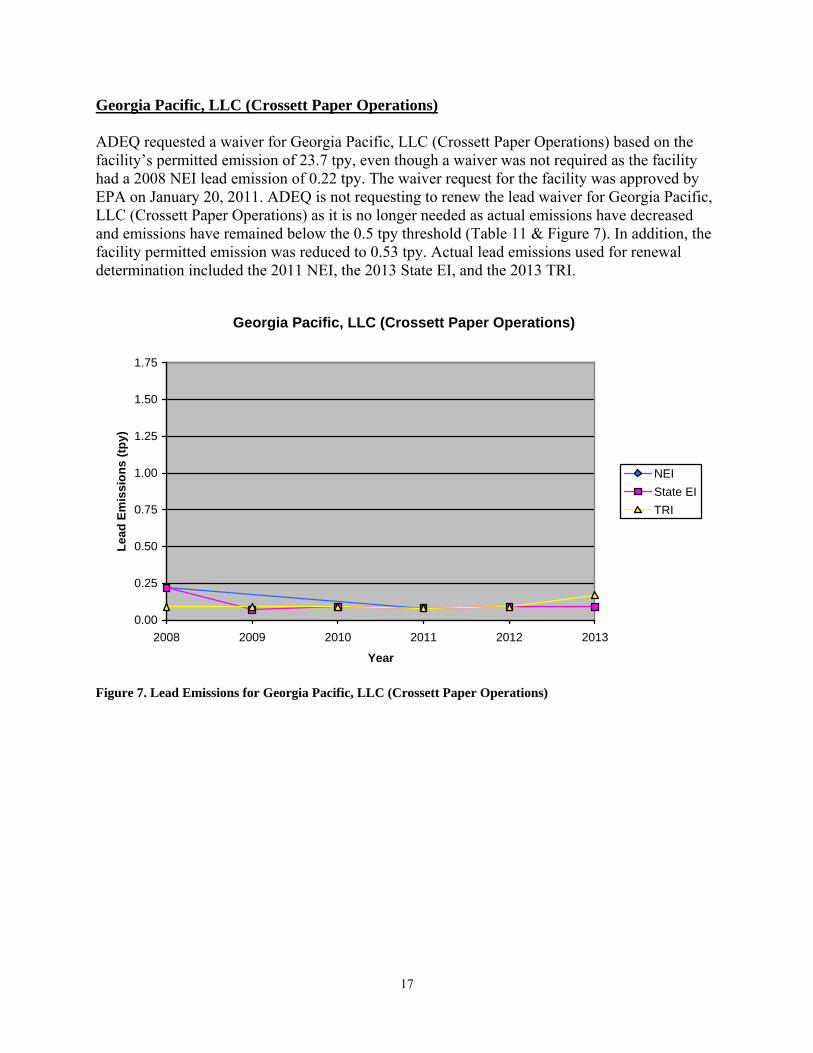
Georgia Pacific, LLC (Crossett Paper Operations) ADEQ requested a waiver for Georgia Pacific, LLC (Crossett Paper Operations) based on the facility’s permitted emission of 23.7 tpy, even though a waiver was not required as the facility had a 2008 NEI lead emission of 0.22 tpy. The waiver request for the facility was approved by EPA on January 20, 2011. ADEQ is not requesting to renew the lead waiver for Georgia Pacific, LLC (Crossett Paper Operations) as it is no longer needed as actual emissions have decreased and emissions have remained below the 0.5 tpy threshold (Table 11 & Figure 7). In addition, the facility permitted emission was reduced to 0.53 tpy. Actual lead emissions used for renewal determination included the 2011 NEI, the 2013 State EI, and the 2013 TRI.
Georgia Pacific, LLC (Crossett Paper Operations)
0.00
0.25
0.50
0.75
1.00
1.25
1.50
1.75
2008 2009 2010 2011 2012 2013
Year
Lea
d E
mis
sio
ns
(tp
y)
NEI
State EI
TRI
Figure 7. Lead Emissions for Georgia Pacific, LLC (Crossett Paper Operations)
17
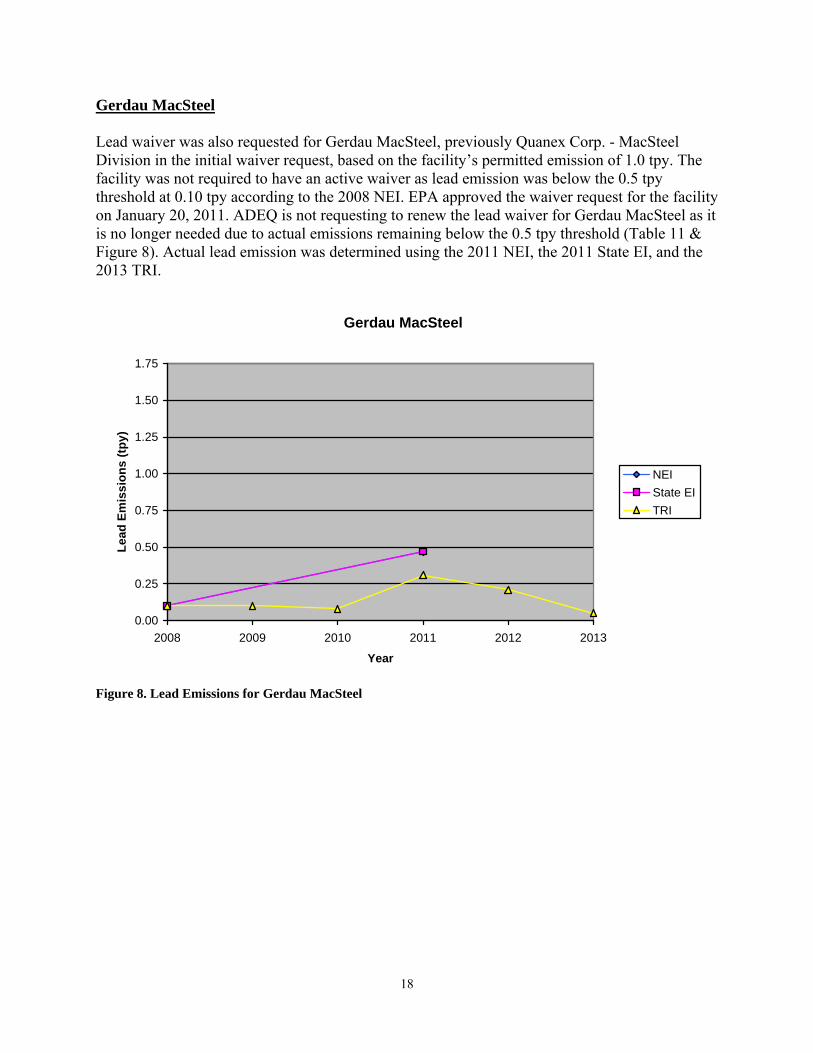
Gerdau MacSteel Lead waiver was also requested for Gerdau MacSteel, previously Quanex Corp. - MacSteel Division in the initial waiver request, based on the facility’s permitted emission of 1.0 tpy. The facility was not required to have an active waiver as lead emission was below the 0.5 tpy threshold at 0.10 tpy according to the 2008 NEI. EPA approved the waiver request for the facility on January 20, 2011. ADEQ is not requesting to renew the lead waiver for Gerdau MacSteel as it is no longer needed due to actual emissions remaining below the 0.5 tpy threshold (Table 11 & Figure 8). Actual lead emission was determined using the 2011 NEI, the 2011 State EI, and the 2013 TRI.
Gerdau MacSteel
0.00
0.25
0.50
0.75
1.00
1.25
1.50
1.75
2008 2009 2010 2011 2012 2013
Year
Le
ad
Em
iss
ion
s (
tpy
)
NEI
State EI
TRI
Figure 8. Lead Emissions for Gerdau MacSteel
18

Nucor Corporation (Nucor Steel, Arkansas) A lead waiver request for Nucor Corporation (Nucor Steel, Arkansas) was based on the facility’s permitted lead emission of 3.59 tpy. The facility was not required to have a waiver as actual emission at the time of the initial waiver request was 0.02 tpy, below the 0.5 tpy threshold. The waiver was approved on January 20, 2011. ADEQ is not requesting to renew the lead waiver for Nucor Corporation (Nucor Steel, Arkansas) as it is no longer needed due to actual emissions remaining below the 0.5 tpy threshold (Table 11 & Figure 9). Lead emissions used for renewal determination included the 2011 NEI, the 2013 State EI, and the 2013 TRI.
Nucor Corporation (Nucor Steel, Arkansas)
0.00
0.25
0.50
0.75
1.00
1.25
1.50
1.75
2008 2009 2010 2011 2012 2013
Year
Lea
d E
mis
sio
ns
(tp
y)
NEI
State EI
TRI
Figure 9. Lead Emissions for Nucor Corporation (Nucor Steel, Arkansas)
19
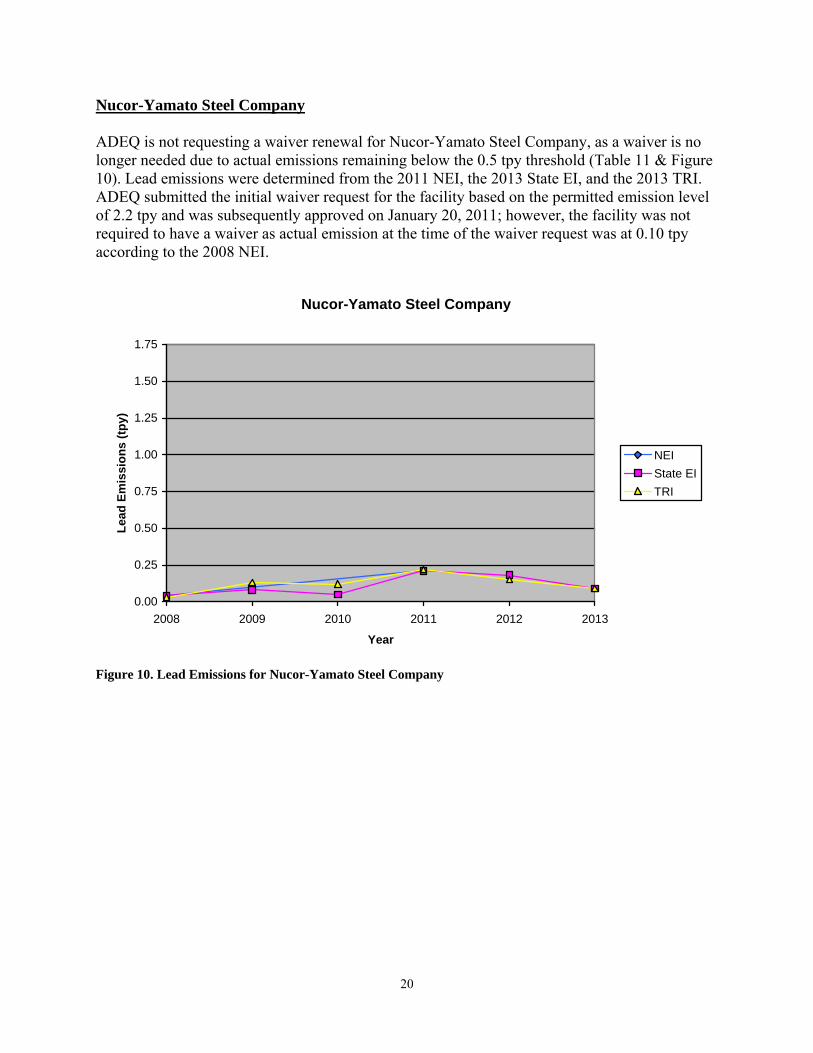
Nucor-Yamato Steel Company ADEQ is not requesting a waiver renewal for Nucor-Yamato Steel Company, as a waiver is no longer needed due to actual emissions remaining below the 0.5 tpy threshold (Table 11 & Figure 10). Lead emissions were determined from the 2011 NEI, the 2013 State EI, and the 2013 TRI. ADEQ submitted the initial waiver request for the facility based on the permitted emission level of 2.2 tpy and was subsequently approved on January 20, 2011; however, the facility was not required to have a waiver as actual emission at the time of the waiver request was at 0.10 tpy according to the 2008 NEI.
Nucor-Yamato Steel Company
0.00
0.25
0.50
0.75
1.00
1.25
1.50
1.75
2008 2009 2010 2011 2012 2013
Year
Lea
d E
mis
sio
ns
(tp
y)
NEI
State EI
TRI
Figure 10. Lead Emissions for Nucor-Yamato Steel Company
20

4. Contact Information
Questions concerning lead emissions and waivers should be sent to:
Mark McCorkle Arkansas Department of Environmental Quality 5301 Northshore Dr. North Little Rock, AR 72118 501-682-0736 [email protected]
Any other comments or questions should be sent to:
Miriam Talbert - Air Lab Supervisor Arkansas Department of Environmental Quality 5301 Northshore Dr. North Little Rock, AR 72118 501-682-0925 [email protected]
21