argos charting and olap techniques - evisionsgo.evisions.com/hubfs/cohesion louisville...
TRANSCRIPT


Welcome!
1. Overview of Charting
2. Charting Concepts
• Multiple Series
• Funnel Chart
• Drillable Charts
3. Overview of OLAP
4. OLAP Concepts
• Calculated Measures
• Grouping Dimensions
• Forecasting
• Scheduled Cubes
5. Q/A
2

CHARTINGMultiple Series, Funnel,
Drill-Through
3

• Allows a visual representation of data
• Types of charts
– Bar
– Pie
– Gauge
– Line
– Points
– Area
• Easy to Use Wizard
Overview on Charting

Overview on Charting

Multiple Series

Multiple Series

Multiple Series

Funnel Chart

• Area chart
• Needed to be displayed in a certain order
• Used SQL to control the output
Funnel Chart

Funnel Chart

• Start at a high level
• Migrate to specific data
• How to do this:
– Using a chart as a parameter to drive other objects
– On-Click Events
• Example:
– AR Aging Dashboard
Drillable Chart

Demo AR Aging Dashboard
Product demonstration.

Drillable Chart

Drillable Chart

Drillable Chart

Drillable Chart

Drillable Chart
OLAP
19

• Allows you to analyze your data in many different ways
• Update view of dimensions and measures on the fly
• Create with our OLAP Wizard
OLAP Overview
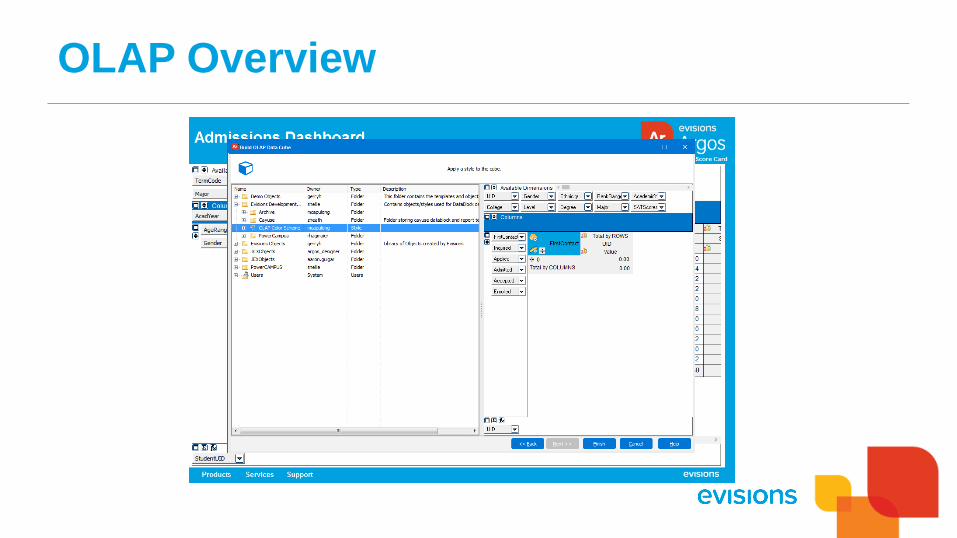
OLAP Overview

• Create expressions based off other existing measures
• Can be created at run time
Calculated Measures

Calculated Measures
Grouping Dimensions
• Reorganize dimensions in your cube
• Done at Run Time
• Can be saved into OLAP settings

Grouping Dimensions

• Predict future or historical information
• Requires 3 points of data
• Different forecasting methods
– Simple Moving Average
– Weighted Moving Average
– Double Exponential Smoothing
– Triple Exponential Smoothing
– Show Data Margins Only
– Show First and Last Members
Forecasting

Forecasting

• Save an Execution State to create a snapshot of data
• Useful for Cubes that take a long time to generate
Scheduled Cubes

Questions? Q&A

CONNECT WITH
EVISIONSKeep up with the latest
news, events, and content


Social Media
32
https://twitter.com/EvisionsInc
www.youtube.com/user/EvisionsVideos
www.linkedin.com/company/evisions-inc
