area of interest 2, geomechanics of co reservoir seals library/events/2016/fy16 cs rd/wed... ·...
TRANSCRIPT

Area of Interest 2
Geomechanics of CO2
Reservoir SealsDE-FE0023316
Peter Eichhubl1 Pania Newell2 Jon Olson3 Tom Dewers2
1 Bureau of Economic Geology Jackson School of Geosciences The University of Texas at Austin
2Sandia National Laboratories Albuquerque NM3UT Center for Petroleum amp Geosystems Engineering
US Department of Energy
National Energy Technology Laboratory
Mastering the Subsurface Through Technology Innovation and Collaboration
Carbon Storage and Oil and Natural Gas Technologies Review Meeting
August 16-18 2016
Sandia National Laboratories is a multi-program laboratory managed and operated by Sandia Corporation a wholly owned subsidiary of Lockheed Martin
Corporation for the US Department of Energyrsquos National Nuclear Security Administration under contract DE-AC04-94AL8500
2
Presentation Outline
bull Benefit
bull Problem Statement
bull Project Overview
bull Methodology
bull Accomplishments to Date
ndash Fracture mechanics experiments
ndash Fracture amp leakage modeling
bull Summary
3
Benefit to the Program
bull Program goals Develop characterization tools technologies andor
methodologies that improve the ability to predict geologic storage capacity within plusmn30 improve the utilization of the reservoir by understanding how faults and fractures in a reservoir affect the flow of CO2 and ensure storage permanence
ndash Area of Interest 2 ndash Fractured Reservoir and Seal Behavior Develop tools and techniques to increase the accuracy and reduce the costs of assessing subsurface seal containment and the sealreservoir interface including the measurement of in-situ rock properties in order to develop a better understanding of seal behavior when CO2 is injected into a reservoir
bull Project is designed to ndash Provide calibrated and validated numerical predictive
tools for long-term prediction of reservoir seal integrity beyond the engineering (injection) time scale
ndash Contribute toward technology ensuring 99 storage permanence in the injection zone for 1000 years
Problem Statement
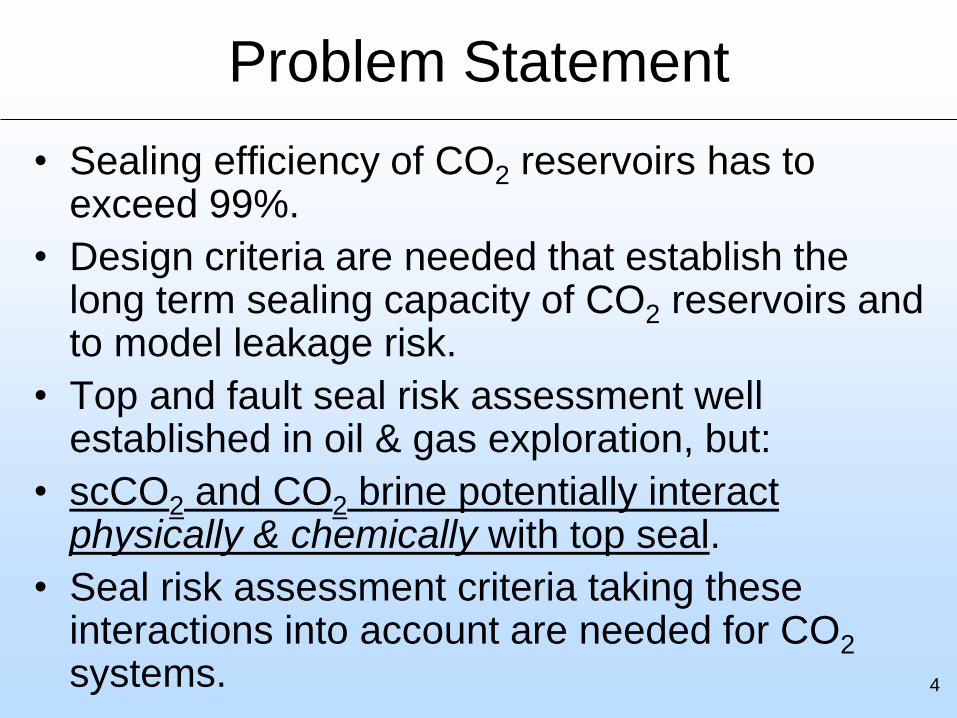
bull Sealing efficiency of CO2 reservoirs has to exceed 99
bull Design criteria are needed that establish the long term sealing capacity of CO2 reservoirs and to model leakage risk
bull Top and fault seal risk assessment well established in oil amp gas exploration but
bull scCO2 and CO2 brine potentially interact physically amp chemically with top seal
bull Seal risk assessment criteria taking these interactions into account are needed for CO2
systems 4
5
Project Overview Goals and Objectives
bull Perform laboratory fracture mechanics testing to
ndash gain fundamental understanding into fracture processes in chemically reactive systems and to
ndash provide input parameters on fracture constitutive behavior fracture rate and geometry and deformation and transport processes involved in subcritical chemically assisted fracture growth for relevant top seal lithologies
bull Derive predictive and validated numerical models for fracture growth in chemically reactive environments relevant to CCUS top seal lithologies
bull Validate numerical amp laboratory observations against microstructural and textural observations on fractures from natural CO2 seeps
bull Perform upscaled numerical simulations that are informed by field and lab results toward predictive tools for top seal integrity analysis top seal mechanical failure and impact on CO2 leakage in CCUS applications
6
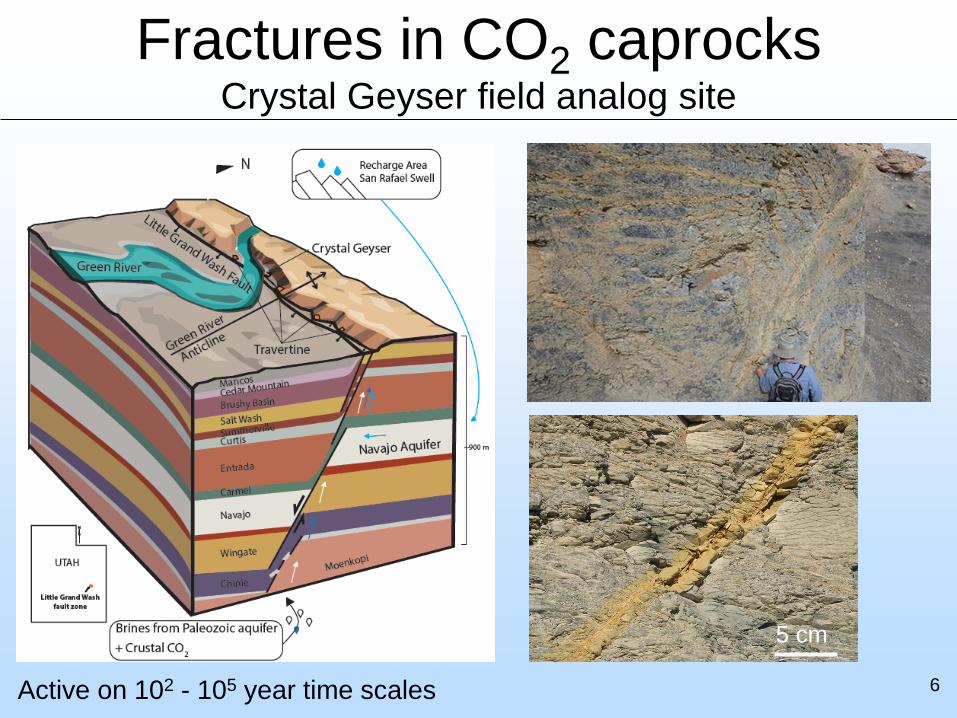
Fractures in CO2 caprocksCrystal Geyser field analog site
Active on 102 - 105 year time scales
5 cm
Natural fracture networksMancos Shale at Crystal Geyser
7
10 m from CO2 conduit gt 300 m away from CO2 conduit
1m
Methodology
bull Experimental measurement of subcritical fracture propagation in various shale lithologiesndash Double torsion test unconfined conditions
ndash Short-rod test confined conditions (scCO2)
bull Textural and compositional characterizationndash Shale material used for fracture testing
ndash Fractures amp CO2 alteration in natural systems
ndash Post-mortem analysis of lab test specimens
bull Numerical modeling of fracture propagation in top sealsndash Fracture network modeling using JOINTS
ndash Upscaled modeling for top seal deformation using Sierra Mechanics
8
Double torsion fracture mechanics testing
9Sample geometry
Rijken 2005
V fracture propagation velocity
KI mode-I stress intensity factor
KIC mode-I fracture toughness
A pre-exponential constant
n velocity exponent subcritical crack index (SCI)
Pyrite
Calcite
Dolomite
Quartz
ClaysClays
Quartz
Clays
Feldspars
Carbonate
Marcellus Shale
(carbonate-rich)
Woodford Shale
bull Carbonate amp clay
bull Minor amounts of quartz and pyrite
bull Quartz amp clay
bull Minor amounts of carbonate
and feldspar
Material characterization
10
0
02
04
06
08
1
Dry CO2 (g) Ambient air DI water
KIC
(MP
am
12
)
0
20
40
60
80
100
Dry CO2 (g) Ambient air DI water
Su
bcr
itic
al i
nd
ex
Strong reduction of KIC (48) and SCI (75) from ambient air to DI water
Fracturing strongly facilitated in H2O saturated conditions
K-V curves obey power-law indicating fracturing stress-corrosion regime (I)
Load relaxation technique (lines) match constant loading rate method (squares) 11
Woodford dry-air-water
Sample
H2O H2O
H2OH2O
H2O
SampleFracture
H2O
Sample
Fracture Tip
H2O Vfracture
Vdegradation
H-treatment restricts water-sample interaction to the fracture tip
H-treatment protects KIC from large weakening in DI water
H-treatment has little effect on long-term SCI both in ambient air and DI water12
0
20
40
60
80
air H-air DI water H-DI water
Su
bcr
itic
al i
nd
ex
Woodford hydrophobic treatment
0
02
04
06
08
air H-air DI water H-DI water
KIC
(MP
a m
12
)
KIC SCI not obviously dependent on pH
Non-power-law K-V curves for H-treated sample
SCI begin gt SCI Untreated gt SCI end
H-treatment protects KIC from strong weakening13
0
02
04
06
0 3 6 9 12
KIC
(MP
a m
12
)
pH
Untreated
H-treated
0
10
20
30
40
0 3 6 9 12
Su
bcr
itic
al i
nd
ex
pH
UntreatedH-treated SCI beginH-treated SCI endSCI end
SCI begin
Woodford effect of pH
KIC dependency on salinity Untreated KIC darr as salinity uarr
H-treated KIC uarr as salinity uarr
Non-power-law K-V curves for H-treated samples
SCI begin gt SCI Untreated gt SCI end14
SCI end
0
01
02
03
04
05
06
-01 04 09 14 19
KIC
(MP
a m
12
)
NaCl concentration (M)
Untreated
H-treated
DI water
0
20
40
60
-01 04 09 14 19
Su
bcr
itic
al i
nd
ex
NaCl concentration (M)
Untreated
H-treated SCI begin
H-treated SCI end
DI water
Woodford effect of salinity
15
Woodford large drop of KIC and SCI between ambient to aqueous solutions
Glass and Marcellus less change in KIC and SCI
Woodford
Glass
Marcellus
Correlation between KIC amp SCI
16
bull Kic and SCI lower in water compared to dry tests
bull Dry tests of limited applicability for aqueous
subsurface systems
bull Dry tests potentially applicable to scCO2
systems
bull Effect of varying water chemistry minor in current
tests
bull Dry-out by scCO2 injection could strengthen
caprock
bull Water increases inelastic behavior impedes
fracture growth
bull Decreased inleastic behavior under dry CO2
conditions could favor fracture growth
Results fracture mechanics testing
JOINTS fracture network model
bull Boundary element code
bull Linear elastic
bull Pseudo-3D accounts for elastic interaction
ndash Opening-mode and mixed-mode fracture propagation
bull Allows simulation of subcritical fracture
propagation as function of
ndash Subcritical index SCI
ndash Elastic material properties
ndash Distribution of nucleation sites (seed fractures)
ndash For applied displacement or stress boundary
conditions17
Effect of var SCI constant KIc = 1 MPam12
5 10 20
40 80 160
18
KIC = 059
SCI = 63
KIC = 021
SCI = 11
KIC = 028
SCI = 11
KIC = 032
SCI = 14
KIC = 024
SCI = 14
JOINTS models for WoodfordPlan view Fractures initiate internally
KIC = 081
SCI = 68
JOINTS models of caprock failure
bull Vertical section in shale caprock
bull Fractures initiate at base
bull Best fracture connectivity with DI water
bull Decreased fracture connectivity in dry CO2gas
20
-12
-8
-4
0
4
8
12
-12 -10 -8 -6 -4 -2 0 2 4 6 8 10 12
Y (
mete
rs)
X (meters)
Woodford DI water
-12
-8
-4
0
4
8
12
-12 -10 -8 -6 -4 -2 0 2 4 6 8 10 12
Y (
mete
rs)
X (meters)
Woodford Dry CO2
-12
-8
-4
0
4
8
12
-12 -10 -8 -6 -4 -2 0 2 4 6 8 10 12
Y (
mete
rs)
X (meters)
Woodford Ambient
KIC = 059
SCI = 63
KIC = 032
SCI = 14
KIC = 081
SCI = 68
Caprock Integrity Sierra Mechanics
Test for effect of
bull wellbore orientation vertical horizontal
bull injection rate 3 Mtyr 5 Mtyr for 30 years
bull caprockreservoir thickness 50 m 100 m 200 m
on leakage across caprock withwithout pre-existing fractures (implicit
continuum scale)
Vertical wellbore Horizontal wellbore
P Newell M J Martinez P Eichhubl 2016 Impact of layer thickness and well orientation on
caprock integrity for geologic carbon storage Journal of Petroleum Engineering
httpdoi101016jpetrol201607032
21
Pore pressure within reservoir
bull Lower pressure in horizontal wellbore cases
bull Even for horizontal well fractures can be
reactivated causing leakage
Reservoir cap 100 m
Fracture opening
Fracture opening
22
Vertical well Horizontal well
Maximum saturation of CO2 on top of seal
bull Leakage for higher injection rates even in horizontal
wellbore
bull Long-term same leakage for horizontal amp vertical well
5 Mtyr later onset of leakage for horizontal wellReservoir cap 100 m
5 Mtyr
3 MtyrV
V
H
23
Effect of layer thicknessVertical well
Thick reservoir is safer
For given reservoir
thickness thicker caprock
is safer
Reservoir thickness is more
important than caprock
thickness
Horizontal well
Combined reservoir amp
caprock thickness (htotal)
controls leakage amount of
to the top layer
High total thickness is safer
24
Summary
bull Wide range in fracture properties for different
caprock lithologies
bull Distinct stress corrosion effect observed in
DT tests in water w varying composition
bull Shale less fracture prone in dry CO2gas
environment
bull Fractures most transmissive at intermediate
SCI
bull Horizontal wells thick reservoir amp seal favor
caprock integrity
ndash Vertical well Reservoir thickness most important25
Accomplishments to Date
bull Fracture mechanics testing on caprock lithologies in dry amp aqueous environments of varying composition
bull Conducted numerical simulations on fracture network evolution by chemically aided fracture growth
bull Simulated caprock leakage behavior using in Sierra Mechanics continuum models for varying wellreservoircaprock geometry
26
Next steps
bull DT and short-rod fracture testing under
ndash varying temperature
ndash water composition
ndash pressure
ndash scCO2
bull Integration of continuum amp fracture network modeling
ndash Effects of varying Kic amp SCI included into Sierra Mechanics
bull Validation of fracture network models with field fracture network observations
27
Synergy Opportunities
bull Fracture mechanics analysis of Cranfield
and FutureGen II core material
bull Coordination with EFRC research on
reservoir rock geomechanics
bull Integration of lab results with fracture
network modeling (phase-field cohesive
end-zone peridynamics)
bull Integration with hydraulic fracture research
28
Appendix
29
30
Organization Chart
Communication Plan
bull Established Sandia-UT collaborationbull Olson ndash Schultz ndash Eichhubl on joint industry
projects
bull Dewers ndash Newell ndashEichhubl on joint EFRC
31
Team
Peter Eichhubl
UT BEG
Tom Dewers
Sandia
Pania Newell
Sandia
Jon Olson
UT PGE
Rich Schultz
UT PGE
Owen
Callahan
UT BEG
Erick Wright
UT BEG
Xiaofeng
Chen
UT BEG
Jon Major
UT BEG
Gantt Chart
91
20
14
-12
31
20
14
11
20
15
-33
12
01
5
41
20
15
-63
02
01
5
71
20
15
-93
02
01
5
10
12
01
5-1
23
12
01
5
11
20
16
-33
12
01
6
41
20
16
-63
02
01
6
71
20
16
-93
02
01
6
10
12
01
6-1
23
12
01
6
11
20
17
-33
12
01
7
41
20
17
-63
02
01
7
71
20
17
-83
12
01
7
1 Project Management and Planning a a a a a a a p p p p p
21 Short rod fracture toughness tests 22 Double torsion tests a a a a a a a p p p p
23 Fracturing in water-bearing supercritical CO2 a a a a a a p p p p
31 Field fracture characterization a a a a a a a p
32 Textural and compositional fracture imaging p p p p p p p p
41 Discrete fracture modeling using Sierra Mechanics a a a a a a a p p p p
42 Fracture network modeling using JOINTS a a p p p p
43 Upscaled modeling using Kayenta a a a p
5 Model validation and integration p p p p
TaskSubtask
Year 1 Year 2 Year 3
Short rod tests (task 21) are being performed under task 23 under confined conditions
Bibliographybull Journal multiple authors
ndash P Newell M J Martinez P Eichhubl 2016 Impact of layer thickness and well
orientation on caprock integrity for geologic carbon storage Journal of Petroleum
Science and Engineering available at httpdoi101016jpetrol201607032

2
Presentation Outline
bull Benefit
bull Problem Statement
bull Project Overview
bull Methodology
bull Accomplishments to Date
ndash Fracture mechanics experiments
ndash Fracture amp leakage modeling
bull Summary
3
Benefit to the Program
bull Program goals Develop characterization tools technologies andor
methodologies that improve the ability to predict geologic storage capacity within plusmn30 improve the utilization of the reservoir by understanding how faults and fractures in a reservoir affect the flow of CO2 and ensure storage permanence
ndash Area of Interest 2 ndash Fractured Reservoir and Seal Behavior Develop tools and techniques to increase the accuracy and reduce the costs of assessing subsurface seal containment and the sealreservoir interface including the measurement of in-situ rock properties in order to develop a better understanding of seal behavior when CO2 is injected into a reservoir
bull Project is designed to ndash Provide calibrated and validated numerical predictive
tools for long-term prediction of reservoir seal integrity beyond the engineering (injection) time scale
ndash Contribute toward technology ensuring 99 storage permanence in the injection zone for 1000 years
Problem Statement
bull Sealing efficiency of CO2 reservoirs has to exceed 99
bull Design criteria are needed that establish the long term sealing capacity of CO2 reservoirs and to model leakage risk
bull Top and fault seal risk assessment well established in oil amp gas exploration but
bull scCO2 and CO2 brine potentially interact physically amp chemically with top seal
bull Seal risk assessment criteria taking these interactions into account are needed for CO2
systems 4
5
Project Overview Goals and Objectives
bull Perform laboratory fracture mechanics testing to
ndash gain fundamental understanding into fracture processes in chemically reactive systems and to
ndash provide input parameters on fracture constitutive behavior fracture rate and geometry and deformation and transport processes involved in subcritical chemically assisted fracture growth for relevant top seal lithologies
bull Derive predictive and validated numerical models for fracture growth in chemically reactive environments relevant to CCUS top seal lithologies
bull Validate numerical amp laboratory observations against microstructural and textural observations on fractures from natural CO2 seeps
bull Perform upscaled numerical simulations that are informed by field and lab results toward predictive tools for top seal integrity analysis top seal mechanical failure and impact on CO2 leakage in CCUS applications
6
Fractures in CO2 caprocksCrystal Geyser field analog site
Active on 102 - 105 year time scales
5 cm
Natural fracture networksMancos Shale at Crystal Geyser
7
10 m from CO2 conduit gt 300 m away from CO2 conduit
1m
Methodology
bull Experimental measurement of subcritical fracture propagation in various shale lithologiesndash Double torsion test unconfined conditions
ndash Short-rod test confined conditions (scCO2)
bull Textural and compositional characterizationndash Shale material used for fracture testing
ndash Fractures amp CO2 alteration in natural systems
ndash Post-mortem analysis of lab test specimens
bull Numerical modeling of fracture propagation in top sealsndash Fracture network modeling using JOINTS
ndash Upscaled modeling for top seal deformation using Sierra Mechanics
8
Double torsion fracture mechanics testing
9Sample geometry
Rijken 2005
V fracture propagation velocity
KI mode-I stress intensity factor
KIC mode-I fracture toughness
A pre-exponential constant
n velocity exponent subcritical crack index (SCI)
Pyrite
Calcite
Dolomite
Quartz
ClaysClays
Quartz
Clays
Feldspars
Carbonate
Marcellus Shale
(carbonate-rich)
Woodford Shale
bull Carbonate amp clay
bull Minor amounts of quartz and pyrite
bull Quartz amp clay
bull Minor amounts of carbonate
and feldspar
Material characterization
10
0
02
04
06
08
1
Dry CO2 (g) Ambient air DI water
KIC
(MP
am
12
)
0
20
40
60
80
100
Dry CO2 (g) Ambient air DI water
Su
bcr
itic
al i
nd
ex
Strong reduction of KIC (48) and SCI (75) from ambient air to DI water
Fracturing strongly facilitated in H2O saturated conditions
K-V curves obey power-law indicating fracturing stress-corrosion regime (I)
Load relaxation technique (lines) match constant loading rate method (squares) 11
Woodford dry-air-water
Sample
H2O H2O
H2OH2O
H2O
SampleFracture
H2O
Sample
Fracture Tip
H2O Vfracture
Vdegradation
H-treatment restricts water-sample interaction to the fracture tip
H-treatment protects KIC from large weakening in DI water
H-treatment has little effect on long-term SCI both in ambient air and DI water12
0
20
40
60
80
air H-air DI water H-DI water
Su
bcr
itic
al i
nd
ex
Woodford hydrophobic treatment
0
02
04
06
08
air H-air DI water H-DI water
KIC
(MP
a m
12
)
KIC SCI not obviously dependent on pH
Non-power-law K-V curves for H-treated sample
SCI begin gt SCI Untreated gt SCI end
H-treatment protects KIC from strong weakening13
0
02
04
06
0 3 6 9 12
KIC
(MP
a m
12
)
pH
Untreated
H-treated
0
10
20
30
40
0 3 6 9 12
Su
bcr
itic
al i
nd
ex
pH
UntreatedH-treated SCI beginH-treated SCI endSCI end
SCI begin
Woodford effect of pH
KIC dependency on salinity Untreated KIC darr as salinity uarr
H-treated KIC uarr as salinity uarr
Non-power-law K-V curves for H-treated samples
SCI begin gt SCI Untreated gt SCI end14
SCI end
0
01
02
03
04
05
06
-01 04 09 14 19
KIC
(MP
a m
12
)
NaCl concentration (M)
Untreated
H-treated
DI water
0
20
40
60
-01 04 09 14 19
Su
bcr
itic
al i
nd
ex
NaCl concentration (M)
Untreated
H-treated SCI begin
H-treated SCI end
DI water
Woodford effect of salinity
15
Woodford large drop of KIC and SCI between ambient to aqueous solutions
Glass and Marcellus less change in KIC and SCI
Woodford
Glass
Marcellus
Correlation between KIC amp SCI
16
bull Kic and SCI lower in water compared to dry tests
bull Dry tests of limited applicability for aqueous
subsurface systems
bull Dry tests potentially applicable to scCO2
systems
bull Effect of varying water chemistry minor in current
tests
bull Dry-out by scCO2 injection could strengthen
caprock
bull Water increases inelastic behavior impedes
fracture growth
bull Decreased inleastic behavior under dry CO2
conditions could favor fracture growth
Results fracture mechanics testing
JOINTS fracture network model
bull Boundary element code
bull Linear elastic
bull Pseudo-3D accounts for elastic interaction
ndash Opening-mode and mixed-mode fracture propagation
bull Allows simulation of subcritical fracture
propagation as function of
ndash Subcritical index SCI
ndash Elastic material properties
ndash Distribution of nucleation sites (seed fractures)
ndash For applied displacement or stress boundary
conditions17
Effect of var SCI constant KIc = 1 MPam12
5 10 20
40 80 160
18
KIC = 059
SCI = 63
KIC = 021
SCI = 11
KIC = 028
SCI = 11
KIC = 032
SCI = 14
KIC = 024
SCI = 14
JOINTS models for WoodfordPlan view Fractures initiate internally
KIC = 081
SCI = 68
JOINTS models of caprock failure
bull Vertical section in shale caprock
bull Fractures initiate at base
bull Best fracture connectivity with DI water
bull Decreased fracture connectivity in dry CO2gas
20
-12
-8
-4
0
4
8
12
-12 -10 -8 -6 -4 -2 0 2 4 6 8 10 12
Y (
mete
rs)
X (meters)
Woodford DI water
-12
-8
-4
0
4
8
12
-12 -10 -8 -6 -4 -2 0 2 4 6 8 10 12
Y (
mete
rs)
X (meters)
Woodford Dry CO2
-12
-8
-4
0
4
8
12
-12 -10 -8 -6 -4 -2 0 2 4 6 8 10 12
Y (
mete
rs)
X (meters)
Woodford Ambient
KIC = 059
SCI = 63
KIC = 032
SCI = 14
KIC = 081
SCI = 68
Caprock Integrity Sierra Mechanics
Test for effect of
bull wellbore orientation vertical horizontal
bull injection rate 3 Mtyr 5 Mtyr for 30 years
bull caprockreservoir thickness 50 m 100 m 200 m
on leakage across caprock withwithout pre-existing fractures (implicit
continuum scale)
Vertical wellbore Horizontal wellbore
P Newell M J Martinez P Eichhubl 2016 Impact of layer thickness and well orientation on
caprock integrity for geologic carbon storage Journal of Petroleum Engineering
httpdoi101016jpetrol201607032
21
Pore pressure within reservoir
bull Lower pressure in horizontal wellbore cases
bull Even for horizontal well fractures can be
reactivated causing leakage
Reservoir cap 100 m
Fracture opening
Fracture opening
22
Vertical well Horizontal well
Maximum saturation of CO2 on top of seal
bull Leakage for higher injection rates even in horizontal
wellbore
bull Long-term same leakage for horizontal amp vertical well
5 Mtyr later onset of leakage for horizontal wellReservoir cap 100 m
5 Mtyr
3 MtyrV
V
H
23
Effect of layer thicknessVertical well
Thick reservoir is safer
For given reservoir
thickness thicker caprock
is safer
Reservoir thickness is more
important than caprock
thickness
Horizontal well
Combined reservoir amp
caprock thickness (htotal)
controls leakage amount of
to the top layer
High total thickness is safer
24
Summary
bull Wide range in fracture properties for different
caprock lithologies
bull Distinct stress corrosion effect observed in
DT tests in water w varying composition
bull Shale less fracture prone in dry CO2gas
environment
bull Fractures most transmissive at intermediate
SCI
bull Horizontal wells thick reservoir amp seal favor
caprock integrity
ndash Vertical well Reservoir thickness most important25
Accomplishments to Date
bull Fracture mechanics testing on caprock lithologies in dry amp aqueous environments of varying composition
bull Conducted numerical simulations on fracture network evolution by chemically aided fracture growth
bull Simulated caprock leakage behavior using in Sierra Mechanics continuum models for varying wellreservoircaprock geometry
26
Next steps
bull DT and short-rod fracture testing under
ndash varying temperature
ndash water composition
ndash pressure
ndash scCO2
bull Integration of continuum amp fracture network modeling
ndash Effects of varying Kic amp SCI included into Sierra Mechanics
bull Validation of fracture network models with field fracture network observations
27
Synergy Opportunities
bull Fracture mechanics analysis of Cranfield
and FutureGen II core material
bull Coordination with EFRC research on
reservoir rock geomechanics
bull Integration of lab results with fracture
network modeling (phase-field cohesive
end-zone peridynamics)
bull Integration with hydraulic fracture research
28
Appendix
29
30
Organization Chart
Communication Plan
bull Established Sandia-UT collaborationbull Olson ndash Schultz ndash Eichhubl on joint industry
projects
bull Dewers ndash Newell ndashEichhubl on joint EFRC
31
Team
Peter Eichhubl
UT BEG
Tom Dewers
Sandia
Pania Newell
Sandia
Jon Olson
UT PGE
Rich Schultz
UT PGE
Owen
Callahan
UT BEG
Erick Wright
UT BEG
Xiaofeng
Chen
UT BEG
Jon Major
UT BEG
Gantt Chart
91
20
14
-12
31
20
14
11
20
15
-33
12
01
5
41
20
15
-63
02
01
5
71
20
15
-93
02
01
5
10
12
01
5-1
23
12
01
5
11
20
16
-33
12
01
6
41
20
16
-63
02
01
6
71
20
16
-93
02
01
6
10
12
01
6-1
23
12
01
6
11
20
17
-33
12
01
7
41
20
17
-63
02
01
7
71
20
17
-83
12
01
7
1 Project Management and Planning a a a a a a a p p p p p
21 Short rod fracture toughness tests 22 Double torsion tests a a a a a a a p p p p
23 Fracturing in water-bearing supercritical CO2 a a a a a a p p p p
31 Field fracture characterization a a a a a a a p
32 Textural and compositional fracture imaging p p p p p p p p
41 Discrete fracture modeling using Sierra Mechanics a a a a a a a p p p p
42 Fracture network modeling using JOINTS a a p p p p
43 Upscaled modeling using Kayenta a a a p
5 Model validation and integration p p p p
TaskSubtask
Year 1 Year 2 Year 3
Short rod tests (task 21) are being performed under task 23 under confined conditions
Bibliographybull Journal multiple authors
ndash P Newell M J Martinez P Eichhubl 2016 Impact of layer thickness and well
orientation on caprock integrity for geologic carbon storage Journal of Petroleum
Science and Engineering available at httpdoi101016jpetrol201607032

5
Project Overview Goals and Objectives
bull Perform laboratory fracture mechanics testing to
ndash gain fundamental understanding into fracture processes in chemically reactive systems and to
ndash provide input parameters on fracture constitutive behavior fracture rate and geometry and deformation and transport processes involved in subcritical chemically assisted fracture growth for relevant top seal lithologies
bull Derive predictive and validated numerical models for fracture growth in chemically reactive environments relevant to CCUS top seal lithologies
bull Validate numerical amp laboratory observations against microstructural and textural observations on fractures from natural CO2 seeps
bull Perform upscaled numerical simulations that are informed by field and lab results toward predictive tools for top seal integrity analysis top seal mechanical failure and impact on CO2 leakage in CCUS applications
6
Fractures in CO2 caprocksCrystal Geyser field analog site
Active on 102 - 105 year time scales
5 cm
Natural fracture networksMancos Shale at Crystal Geyser
7
10 m from CO2 conduit gt 300 m away from CO2 conduit
1m
Methodology
bull Experimental measurement of subcritical fracture propagation in various shale lithologiesndash Double torsion test unconfined conditions
ndash Short-rod test confined conditions (scCO2)
bull Textural and compositional characterizationndash Shale material used for fracture testing
ndash Fractures amp CO2 alteration in natural systems
ndash Post-mortem analysis of lab test specimens
bull Numerical modeling of fracture propagation in top sealsndash Fracture network modeling using JOINTS
ndash Upscaled modeling for top seal deformation using Sierra Mechanics
8
Double torsion fracture mechanics testing
9Sample geometry
Rijken 2005
V fracture propagation velocity
KI mode-I stress intensity factor
KIC mode-I fracture toughness
A pre-exponential constant
n velocity exponent subcritical crack index (SCI)
Pyrite
Calcite
Dolomite
Quartz
ClaysClays
Quartz
Clays
Feldspars
Carbonate
Marcellus Shale
(carbonate-rich)
Woodford Shale
bull Carbonate amp clay
bull Minor amounts of quartz and pyrite
bull Quartz amp clay
bull Minor amounts of carbonate
and feldspar
Material characterization
10
0
02
04
06
08
1
Dry CO2 (g) Ambient air DI water
KIC
(MP
am
12
)
0
20
40
60
80
100
Dry CO2 (g) Ambient air DI water
Su
bcr
itic
al i
nd
ex
Strong reduction of KIC (48) and SCI (75) from ambient air to DI water
Fracturing strongly facilitated in H2O saturated conditions
K-V curves obey power-law indicating fracturing stress-corrosion regime (I)
Load relaxation technique (lines) match constant loading rate method (squares) 11
Woodford dry-air-water
Sample
H2O H2O
H2OH2O
H2O
SampleFracture
H2O
Sample
Fracture Tip
H2O Vfracture
Vdegradation
H-treatment restricts water-sample interaction to the fracture tip
H-treatment protects KIC from large weakening in DI water
H-treatment has little effect on long-term SCI both in ambient air and DI water12
0
20
40
60
80
air H-air DI water H-DI water
Su
bcr
itic
al i
nd
ex
Woodford hydrophobic treatment
0
02
04
06
08
air H-air DI water H-DI water
KIC
(MP
a m
12
)
KIC SCI not obviously dependent on pH
Non-power-law K-V curves for H-treated sample
SCI begin gt SCI Untreated gt SCI end
H-treatment protects KIC from strong weakening13
0
02
04
06
0 3 6 9 12
KIC
(MP
a m
12
)
pH
Untreated
H-treated
0
10
20
30
40
0 3 6 9 12
Su
bcr
itic
al i
nd
ex
pH
UntreatedH-treated SCI beginH-treated SCI endSCI end
SCI begin
Woodford effect of pH
KIC dependency on salinity Untreated KIC darr as salinity uarr
H-treated KIC uarr as salinity uarr
Non-power-law K-V curves for H-treated samples
SCI begin gt SCI Untreated gt SCI end14
SCI end
0
01
02
03
04
05
06
-01 04 09 14 19
KIC
(MP
a m
12
)
NaCl concentration (M)
Untreated
H-treated
DI water
0
20
40
60
-01 04 09 14 19
Su
bcr
itic
al i
nd
ex
NaCl concentration (M)
Untreated
H-treated SCI begin
H-treated SCI end
DI water
Woodford effect of salinity
15
Woodford large drop of KIC and SCI between ambient to aqueous solutions
Glass and Marcellus less change in KIC and SCI
Woodford
Glass
Marcellus
Correlation between KIC amp SCI
16
bull Kic and SCI lower in water compared to dry tests
bull Dry tests of limited applicability for aqueous
subsurface systems
bull Dry tests potentially applicable to scCO2
systems
bull Effect of varying water chemistry minor in current
tests
bull Dry-out by scCO2 injection could strengthen
caprock
bull Water increases inelastic behavior impedes
fracture growth
bull Decreased inleastic behavior under dry CO2
conditions could favor fracture growth
Results fracture mechanics testing
JOINTS fracture network model
bull Boundary element code
bull Linear elastic
bull Pseudo-3D accounts for elastic interaction
ndash Opening-mode and mixed-mode fracture propagation
bull Allows simulation of subcritical fracture
propagation as function of
ndash Subcritical index SCI
ndash Elastic material properties
ndash Distribution of nucleation sites (seed fractures)
ndash For applied displacement or stress boundary
conditions17
Effect of var SCI constant KIc = 1 MPam12
5 10 20
40 80 160
18
KIC = 059
SCI = 63
KIC = 021
SCI = 11
KIC = 028
SCI = 11
KIC = 032
SCI = 14
KIC = 024
SCI = 14
JOINTS models for WoodfordPlan view Fractures initiate internally
KIC = 081
SCI = 68
JOINTS models of caprock failure
bull Vertical section in shale caprock
bull Fractures initiate at base
bull Best fracture connectivity with DI water
bull Decreased fracture connectivity in dry CO2gas
20
-12
-8
-4
0
4
8
12
-12 -10 -8 -6 -4 -2 0 2 4 6 8 10 12
Y (
mete
rs)
X (meters)
Woodford DI water
-12
-8
-4
0
4
8
12
-12 -10 -8 -6 -4 -2 0 2 4 6 8 10 12
Y (
mete
rs)
X (meters)
Woodford Dry CO2
-12
-8
-4
0
4
8
12
-12 -10 -8 -6 -4 -2 0 2 4 6 8 10 12
Y (
mete
rs)
X (meters)
Woodford Ambient
KIC = 059
SCI = 63
KIC = 032
SCI = 14
KIC = 081
SCI = 68
Caprock Integrity Sierra Mechanics
Test for effect of
bull wellbore orientation vertical horizontal
bull injection rate 3 Mtyr 5 Mtyr for 30 years
bull caprockreservoir thickness 50 m 100 m 200 m
on leakage across caprock withwithout pre-existing fractures (implicit
continuum scale)
Vertical wellbore Horizontal wellbore
P Newell M J Martinez P Eichhubl 2016 Impact of layer thickness and well orientation on
caprock integrity for geologic carbon storage Journal of Petroleum Engineering
httpdoi101016jpetrol201607032
21
Pore pressure within reservoir
bull Lower pressure in horizontal wellbore cases
bull Even for horizontal well fractures can be
reactivated causing leakage
Reservoir cap 100 m
Fracture opening
Fracture opening
22
Vertical well Horizontal well
Maximum saturation of CO2 on top of seal
bull Leakage for higher injection rates even in horizontal
wellbore
bull Long-term same leakage for horizontal amp vertical well
5 Mtyr later onset of leakage for horizontal wellReservoir cap 100 m
5 Mtyr
3 MtyrV
V
H
23
Effect of layer thicknessVertical well
Thick reservoir is safer
For given reservoir
thickness thicker caprock
is safer
Reservoir thickness is more
important than caprock
thickness
Horizontal well
Combined reservoir amp
caprock thickness (htotal)
controls leakage amount of
to the top layer
High total thickness is safer
24
Summary
bull Wide range in fracture properties for different
caprock lithologies
bull Distinct stress corrosion effect observed in
DT tests in water w varying composition
bull Shale less fracture prone in dry CO2gas
environment
bull Fractures most transmissive at intermediate
SCI
bull Horizontal wells thick reservoir amp seal favor
caprock integrity
ndash Vertical well Reservoir thickness most important25
Accomplishments to Date
bull Fracture mechanics testing on caprock lithologies in dry amp aqueous environments of varying composition
bull Conducted numerical simulations on fracture network evolution by chemically aided fracture growth
bull Simulated caprock leakage behavior using in Sierra Mechanics continuum models for varying wellreservoircaprock geometry
26
Next steps
bull DT and short-rod fracture testing under
ndash varying temperature
ndash water composition
ndash pressure
ndash scCO2
bull Integration of continuum amp fracture network modeling
ndash Effects of varying Kic amp SCI included into Sierra Mechanics
bull Validation of fracture network models with field fracture network observations
27
Synergy Opportunities
bull Fracture mechanics analysis of Cranfield
and FutureGen II core material
bull Coordination with EFRC research on
reservoir rock geomechanics
bull Integration of lab results with fracture
network modeling (phase-field cohesive
end-zone peridynamics)
bull Integration with hydraulic fracture research
28
Appendix
29
30
Organization Chart
Communication Plan
bull Established Sandia-UT collaborationbull Olson ndash Schultz ndash Eichhubl on joint industry
projects
bull Dewers ndash Newell ndashEichhubl on joint EFRC
31
Team
Peter Eichhubl
UT BEG
Tom Dewers
Sandia
Pania Newell
Sandia
Jon Olson
UT PGE
Rich Schultz
UT PGE
Owen
Callahan
UT BEG
Erick Wright
UT BEG
Xiaofeng
Chen
UT BEG
Jon Major
UT BEG
Gantt Chart
91
20
14
-12
31
20
14
11
20
15
-33
12
01
5
41
20
15
-63
02
01
5
71
20
15
-93
02
01
5
10
12
01
5-1
23
12
01
5
11
20
16
-33
12
01
6
41
20
16
-63
02
01
6
71
20
16
-93
02
01
6
10
12
01
6-1
23
12
01
6
11
20
17
-33
12
01
7
41
20
17
-63
02
01
7
71
20
17
-83
12
01
7
1 Project Management and Planning a a a a a a a p p p p p
21 Short rod fracture toughness tests 22 Double torsion tests a a a a a a a p p p p
23 Fracturing in water-bearing supercritical CO2 a a a a a a p p p p
31 Field fracture characterization a a a a a a a p
32 Textural and compositional fracture imaging p p p p p p p p
41 Discrete fracture modeling using Sierra Mechanics a a a a a a a p p p p
42 Fracture network modeling using JOINTS a a p p p p
43 Upscaled modeling using Kayenta a a a p
5 Model validation and integration p p p p
TaskSubtask
Year 1 Year 2 Year 3
Short rod tests (task 21) are being performed under task 23 under confined conditions
Bibliographybull Journal multiple authors
ndash P Newell M J Martinez P Eichhubl 2016 Impact of layer thickness and well
orientation on caprock integrity for geologic carbon storage Journal of Petroleum
Science and Engineering available at httpdoi101016jpetrol201607032
6
Fractures in CO2 caprocksCrystal Geyser field analog site
Active on 102 - 105 year time scales
5 cm
Natural fracture networksMancos Shale at Crystal Geyser
7
10 m from CO2 conduit gt 300 m away from CO2 conduit
1m
Methodology
bull Experimental measurement of subcritical fracture propagation in various shale lithologiesndash Double torsion test unconfined conditions
ndash Short-rod test confined conditions (scCO2)
bull Textural and compositional characterizationndash Shale material used for fracture testing
ndash Fractures amp CO2 alteration in natural systems
ndash Post-mortem analysis of lab test specimens
bull Numerical modeling of fracture propagation in top sealsndash Fracture network modeling using JOINTS
ndash Upscaled modeling for top seal deformation using Sierra Mechanics
8
Double torsion fracture mechanics testing
9Sample geometry
Rijken 2005
V fracture propagation velocity
KI mode-I stress intensity factor
KIC mode-I fracture toughness
A pre-exponential constant
n velocity exponent subcritical crack index (SCI)
Pyrite
Calcite
Dolomite
Quartz
ClaysClays
Quartz
Clays
Feldspars
Carbonate
Marcellus Shale
(carbonate-rich)
Woodford Shale
bull Carbonate amp clay
bull Minor amounts of quartz and pyrite
bull Quartz amp clay
bull Minor amounts of carbonate
and feldspar
Material characterization
10
0
02
04
06
08
1
Dry CO2 (g) Ambient air DI water
KIC
(MP
am
12
)
0
20
40
60
80
100
Dry CO2 (g) Ambient air DI water
Su
bcr
itic
al i
nd
ex
Strong reduction of KIC (48) and SCI (75) from ambient air to DI water
Fracturing strongly facilitated in H2O saturated conditions
K-V curves obey power-law indicating fracturing stress-corrosion regime (I)
Load relaxation technique (lines) match constant loading rate method (squares) 11
Woodford dry-air-water
Sample
H2O H2O
H2OH2O
H2O
SampleFracture
H2O
Sample
Fracture Tip
H2O Vfracture
Vdegradation
H-treatment restricts water-sample interaction to the fracture tip
H-treatment protects KIC from large weakening in DI water
H-treatment has little effect on long-term SCI both in ambient air and DI water12
0
20
40
60
80
air H-air DI water H-DI water
Su
bcr
itic
al i
nd
ex
Woodford hydrophobic treatment
0
02
04
06
08
air H-air DI water H-DI water
KIC
(MP
a m
12
)
KIC SCI not obviously dependent on pH
Non-power-law K-V curves for H-treated sample
SCI begin gt SCI Untreated gt SCI end
H-treatment protects KIC from strong weakening13
0
02
04
06
0 3 6 9 12
KIC
(MP
a m
12
)
pH
Untreated
H-treated
0
10
20
30
40
0 3 6 9 12
Su
bcr
itic
al i
nd
ex
pH
UntreatedH-treated SCI beginH-treated SCI endSCI end
SCI begin
Woodford effect of pH
KIC dependency on salinity Untreated KIC darr as salinity uarr
H-treated KIC uarr as salinity uarr
Non-power-law K-V curves for H-treated samples
SCI begin gt SCI Untreated gt SCI end14
SCI end
0
01
02
03
04
05
06
-01 04 09 14 19
KIC
(MP
a m
12
)
NaCl concentration (M)
Untreated
H-treated
DI water
0
20
40
60
-01 04 09 14 19
Su
bcr
itic
al i
nd
ex
NaCl concentration (M)
Untreated
H-treated SCI begin
H-treated SCI end
DI water
Woodford effect of salinity
15
Woodford large drop of KIC and SCI between ambient to aqueous solutions
Glass and Marcellus less change in KIC and SCI
Woodford
Glass
Marcellus
Correlation between KIC amp SCI
16
bull Kic and SCI lower in water compared to dry tests
bull Dry tests of limited applicability for aqueous
subsurface systems
bull Dry tests potentially applicable to scCO2
systems
bull Effect of varying water chemistry minor in current
tests
bull Dry-out by scCO2 injection could strengthen
caprock
bull Water increases inelastic behavior impedes
fracture growth
bull Decreased inleastic behavior under dry CO2
conditions could favor fracture growth
Results fracture mechanics testing
JOINTS fracture network model
bull Boundary element code
bull Linear elastic
bull Pseudo-3D accounts for elastic interaction
ndash Opening-mode and mixed-mode fracture propagation
bull Allows simulation of subcritical fracture
propagation as function of
ndash Subcritical index SCI
ndash Elastic material properties
ndash Distribution of nucleation sites (seed fractures)
ndash For applied displacement or stress boundary
conditions17
Effect of var SCI constant KIc = 1 MPam12
5 10 20
40 80 160
18
KIC = 059
SCI = 63
KIC = 021
SCI = 11
KIC = 028
SCI = 11
KIC = 032
SCI = 14
KIC = 024
SCI = 14
JOINTS models for WoodfordPlan view Fractures initiate internally
KIC = 081
SCI = 68
JOINTS models of caprock failure
bull Vertical section in shale caprock
bull Fractures initiate at base
bull Best fracture connectivity with DI water
bull Decreased fracture connectivity in dry CO2gas
20
-12
-8
-4
0
4
8
12
-12 -10 -8 -6 -4 -2 0 2 4 6 8 10 12
Y (
mete
rs)
X (meters)
Woodford DI water
-12
-8
-4
0
4
8
12
-12 -10 -8 -6 -4 -2 0 2 4 6 8 10 12
Y (
mete
rs)
X (meters)
Woodford Dry CO2
-12
-8
-4
0
4
8
12
-12 -10 -8 -6 -4 -2 0 2 4 6 8 10 12
Y (
mete
rs)
X (meters)
Woodford Ambient
KIC = 059
SCI = 63
KIC = 032
SCI = 14
KIC = 081
SCI = 68
Caprock Integrity Sierra Mechanics
Test for effect of
bull wellbore orientation vertical horizontal
bull injection rate 3 Mtyr 5 Mtyr for 30 years
bull caprockreservoir thickness 50 m 100 m 200 m
on leakage across caprock withwithout pre-existing fractures (implicit
continuum scale)
Vertical wellbore Horizontal wellbore
P Newell M J Martinez P Eichhubl 2016 Impact of layer thickness and well orientation on
caprock integrity for geologic carbon storage Journal of Petroleum Engineering
httpdoi101016jpetrol201607032
21
Pore pressure within reservoir
bull Lower pressure in horizontal wellbore cases
bull Even for horizontal well fractures can be
reactivated causing leakage
Reservoir cap 100 m
Fracture opening
Fracture opening
22
Vertical well Horizontal well
Maximum saturation of CO2 on top of seal
bull Leakage for higher injection rates even in horizontal
wellbore
bull Long-term same leakage for horizontal amp vertical well
5 Mtyr later onset of leakage for horizontal wellReservoir cap 100 m
5 Mtyr
3 MtyrV
V
H
23
Effect of layer thicknessVertical well
Thick reservoir is safer
For given reservoir
thickness thicker caprock
is safer
Reservoir thickness is more
important than caprock
thickness
Horizontal well
Combined reservoir amp
caprock thickness (htotal)
controls leakage amount of
to the top layer
High total thickness is safer
24
Summary
bull Wide range in fracture properties for different
caprock lithologies
bull Distinct stress corrosion effect observed in
DT tests in water w varying composition
bull Shale less fracture prone in dry CO2gas
environment
bull Fractures most transmissive at intermediate
SCI
bull Horizontal wells thick reservoir amp seal favor
caprock integrity
ndash Vertical well Reservoir thickness most important25
Accomplishments to Date
bull Fracture mechanics testing on caprock lithologies in dry amp aqueous environments of varying composition
bull Conducted numerical simulations on fracture network evolution by chemically aided fracture growth
bull Simulated caprock leakage behavior using in Sierra Mechanics continuum models for varying wellreservoircaprock geometry
26
Next steps
bull DT and short-rod fracture testing under
ndash varying temperature
ndash water composition
ndash pressure
ndash scCO2
bull Integration of continuum amp fracture network modeling
ndash Effects of varying Kic amp SCI included into Sierra Mechanics
bull Validation of fracture network models with field fracture network observations
27
Synergy Opportunities
bull Fracture mechanics analysis of Cranfield
and FutureGen II core material
bull Coordination with EFRC research on
reservoir rock geomechanics
bull Integration of lab results with fracture
network modeling (phase-field cohesive
end-zone peridynamics)
bull Integration with hydraulic fracture research
28
Appendix
29
30
Organization Chart
Communication Plan
bull Established Sandia-UT collaborationbull Olson ndash Schultz ndash Eichhubl on joint industry
projects
bull Dewers ndash Newell ndashEichhubl on joint EFRC
31
Team
Peter Eichhubl
UT BEG
Tom Dewers
Sandia
Pania Newell
Sandia
Jon Olson
UT PGE
Rich Schultz
UT PGE
Owen
Callahan
UT BEG
Erick Wright
UT BEG
Xiaofeng
Chen
UT BEG
Jon Major
UT BEG
Gantt Chart
91
20
14
-12
31
20
14
11
20
15
-33
12
01
5
41
20
15
-63
02
01
5
71
20
15
-93
02
01
5
10
12
01
5-1
23
12
01
5
11
20
16
-33
12
01
6
41
20
16
-63
02
01
6
71
20
16
-93
02
01
6
10
12
01
6-1
23
12
01
6
11
20
17
-33
12
01
7
41
20
17
-63
02
01
7
71
20
17
-83
12
01
7
1 Project Management and Planning a a a a a a a p p p p p
21 Short rod fracture toughness tests 22 Double torsion tests a a a a a a a p p p p
23 Fracturing in water-bearing supercritical CO2 a a a a a a p p p p
31 Field fracture characterization a a a a a a a p
32 Textural and compositional fracture imaging p p p p p p p p
41 Discrete fracture modeling using Sierra Mechanics a a a a a a a p p p p
42 Fracture network modeling using JOINTS a a p p p p
43 Upscaled modeling using Kayenta a a a p
5 Model validation and integration p p p p
TaskSubtask
Year 1 Year 2 Year 3
Short rod tests (task 21) are being performed under task 23 under confined conditions
Bibliographybull Journal multiple authors
ndash P Newell M J Martinez P Eichhubl 2016 Impact of layer thickness and well
orientation on caprock integrity for geologic carbon storage Journal of Petroleum
Science and Engineering available at httpdoi101016jpetrol201607032
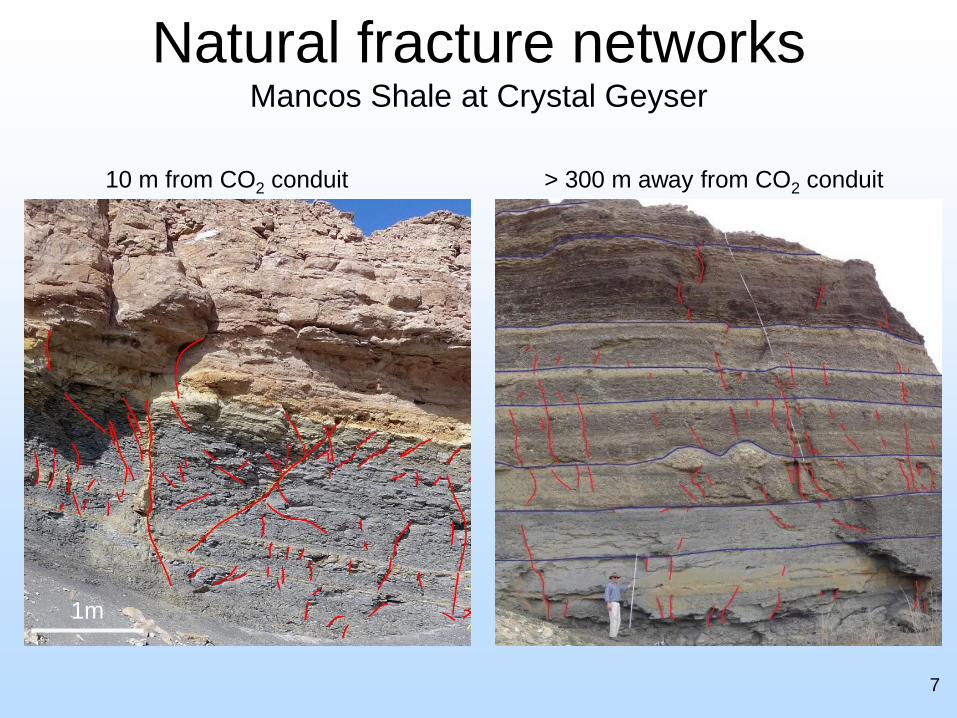

0
02
04
06
08
1
Dry CO2 (g) Ambient air DI water
KIC
(MP
am
12
)
0
20
40
60
80
100
Dry CO2 (g) Ambient air DI water
Su
bcr
itic
al i
nd
ex
Strong reduction of KIC (48) and SCI (75) from ambient air to DI water
Fracturing strongly facilitated in H2O saturated conditions
K-V curves obey power-law indicating fracturing stress-corrosion regime (I)
Load relaxation technique (lines) match constant loading rate method (squares) 11
Woodford dry-air-water
Sample
H2O H2O
H2OH2O
H2O
SampleFracture
H2O
Sample
Fracture Tip
H2O Vfracture
Vdegradation
H-treatment restricts water-sample interaction to the fracture tip
H-treatment protects KIC from large weakening in DI water
H-treatment has little effect on long-term SCI both in ambient air and DI water12
0
20
40
60
80
air H-air DI water H-DI water
Su
bcr
itic
al i
nd
ex
Woodford hydrophobic treatment
0
02
04
06
08
air H-air DI water H-DI water
KIC
(MP
a m
12
)
KIC SCI not obviously dependent on pH
Non-power-law K-V curves for H-treated sample
SCI begin gt SCI Untreated gt SCI end
H-treatment protects KIC from strong weakening13
0
02
04
06
0 3 6 9 12
KIC
(MP
a m
12
)
pH
Untreated
H-treated
0
10
20
30
40
0 3 6 9 12
Su
bcr
itic
al i
nd
ex
pH
UntreatedH-treated SCI beginH-treated SCI endSCI end
SCI begin
Woodford effect of pH
KIC dependency on salinity Untreated KIC darr as salinity uarr
H-treated KIC uarr as salinity uarr
Non-power-law K-V curves for H-treated samples
SCI begin gt SCI Untreated gt SCI end14
SCI end
0
01
02
03
04
05
06
-01 04 09 14 19
KIC
(MP
a m
12
)
NaCl concentration (M)
Untreated
H-treated
DI water
0
20
40
60
-01 04 09 14 19
Su
bcr
itic
al i
nd
ex
NaCl concentration (M)
Untreated
H-treated SCI begin
H-treated SCI end
DI water
Woodford effect of salinity
15
Woodford large drop of KIC and SCI between ambient to aqueous solutions
Glass and Marcellus less change in KIC and SCI
Woodford
Glass
Marcellus
Correlation between KIC amp SCI
16
bull Kic and SCI lower in water compared to dry tests
bull Dry tests of limited applicability for aqueous
subsurface systems
bull Dry tests potentially applicable to scCO2
systems
bull Effect of varying water chemistry minor in current
tests
bull Dry-out by scCO2 injection could strengthen
caprock
bull Water increases inelastic behavior impedes
fracture growth
bull Decreased inleastic behavior under dry CO2
conditions could favor fracture growth
Results fracture mechanics testing
JOINTS fracture network model
bull Boundary element code
bull Linear elastic
bull Pseudo-3D accounts for elastic interaction
ndash Opening-mode and mixed-mode fracture propagation
bull Allows simulation of subcritical fracture
propagation as function of
ndash Subcritical index SCI
ndash Elastic material properties
ndash Distribution of nucleation sites (seed fractures)
ndash For applied displacement or stress boundary
conditions17
Effect of var SCI constant KIc = 1 MPam12
5 10 20
40 80 160
18
KIC = 059
SCI = 63
KIC = 021
SCI = 11
KIC = 028
SCI = 11
KIC = 032
SCI = 14
KIC = 024
SCI = 14
JOINTS models for WoodfordPlan view Fractures initiate internally
KIC = 081
SCI = 68
JOINTS models of caprock failure
bull Vertical section in shale caprock
bull Fractures initiate at base
bull Best fracture connectivity with DI water
bull Decreased fracture connectivity in dry CO2gas
20
-12
-8
-4
0
4
8
12
-12 -10 -8 -6 -4 -2 0 2 4 6 8 10 12
Y (
mete
rs)
X (meters)
Woodford DI water
-12
-8
-4
0
4
8
12
-12 -10 -8 -6 -4 -2 0 2 4 6 8 10 12
Y (
mete
rs)
X (meters)
Woodford Dry CO2
-12
-8
-4
0
4
8
12
-12 -10 -8 -6 -4 -2 0 2 4 6 8 10 12
Y (
mete
rs)
X (meters)
Woodford Ambient
KIC = 059
SCI = 63
KIC = 032
SCI = 14
KIC = 081
SCI = 68
Caprock Integrity Sierra Mechanics
Test for effect of
bull wellbore orientation vertical horizontal
bull injection rate 3 Mtyr 5 Mtyr for 30 years
bull caprockreservoir thickness 50 m 100 m 200 m
on leakage across caprock withwithout pre-existing fractures (implicit
continuum scale)
Vertical wellbore Horizontal wellbore
P Newell M J Martinez P Eichhubl 2016 Impact of layer thickness and well orientation on
caprock integrity for geologic carbon storage Journal of Petroleum Engineering
httpdoi101016jpetrol201607032
21
Pore pressure within reservoir
bull Lower pressure in horizontal wellbore cases
bull Even for horizontal well fractures can be
reactivated causing leakage
Reservoir cap 100 m
Fracture opening
Fracture opening
22
Vertical well Horizontal well
Maximum saturation of CO2 on top of seal
bull Leakage for higher injection rates even in horizontal
wellbore
bull Long-term same leakage for horizontal amp vertical well
5 Mtyr later onset of leakage for horizontal wellReservoir cap 100 m
5 Mtyr
3 MtyrV
V
H
23
Effect of layer thicknessVertical well
Thick reservoir is safer
For given reservoir
thickness thicker caprock
is safer
Reservoir thickness is more
important than caprock
thickness
Horizontal well
Combined reservoir amp
caprock thickness (htotal)
controls leakage amount of
to the top layer
High total thickness is safer
24
Summary
bull Wide range in fracture properties for different
caprock lithologies
bull Distinct stress corrosion effect observed in
DT tests in water w varying composition
bull Shale less fracture prone in dry CO2gas
environment
bull Fractures most transmissive at intermediate
SCI
bull Horizontal wells thick reservoir amp seal favor
caprock integrity
ndash Vertical well Reservoir thickness most important25
Accomplishments to Date
bull Fracture mechanics testing on caprock lithologies in dry amp aqueous environments of varying composition
bull Conducted numerical simulations on fracture network evolution by chemically aided fracture growth
bull Simulated caprock leakage behavior using in Sierra Mechanics continuum models for varying wellreservoircaprock geometry
26
Next steps
bull DT and short-rod fracture testing under
ndash varying temperature
ndash water composition
ndash pressure
ndash scCO2
bull Integration of continuum amp fracture network modeling
ndash Effects of varying Kic amp SCI included into Sierra Mechanics
bull Validation of fracture network models with field fracture network observations
27
Synergy Opportunities
bull Fracture mechanics analysis of Cranfield
and FutureGen II core material
bull Coordination with EFRC research on
reservoir rock geomechanics
bull Integration of lab results with fracture
network modeling (phase-field cohesive
end-zone peridynamics)
bull Integration with hydraulic fracture research
28
Appendix
29
30
Organization Chart
Communication Plan
bull Established Sandia-UT collaborationbull Olson ndash Schultz ndash Eichhubl on joint industry
projects
bull Dewers ndash Newell ndashEichhubl on joint EFRC
31
Team
Peter Eichhubl
UT BEG
Tom Dewers
Sandia
Pania Newell
Sandia
Jon Olson
UT PGE
Rich Schultz
UT PGE
Owen
Callahan
UT BEG
Erick Wright
UT BEG
Xiaofeng
Chen
UT BEG
Jon Major
UT BEG
Gantt Chart
91
20
14
-12
31
20
14
11
20
15
-33
12
01
5
41
20
15
-63
02
01
5
71
20
15
-93
02
01
5
10
12
01
5-1
23
12
01
5
11
20
16
-33
12
01
6
41
20
16
-63
02
01
6
71
20
16
-93
02
01
6
10
12
01
6-1
23
12
01
6
11
20
17
-33
12
01
7
41
20
17
-63
02
01
7
71
20
17
-83
12
01
7
1 Project Management and Planning a a a a a a a p p p p p
21 Short rod fracture toughness tests 22 Double torsion tests a a a a a a a p p p p
23 Fracturing in water-bearing supercritical CO2 a a a a a a p p p p
31 Field fracture characterization a a a a a a a p
32 Textural and compositional fracture imaging p p p p p p p p
41 Discrete fracture modeling using Sierra Mechanics a a a a a a a p p p p
42 Fracture network modeling using JOINTS a a p p p p
43 Upscaled modeling using Kayenta a a a p
5 Model validation and integration p p p p
TaskSubtask
Year 1 Year 2 Year 3
Short rod tests (task 21) are being performed under task 23 under confined conditions
Bibliographybull Journal multiple authors
ndash P Newell M J Martinez P Eichhubl 2016 Impact of layer thickness and well
orientation on caprock integrity for geologic carbon storage Journal of Petroleum
Science and Engineering available at httpdoi101016jpetrol201607032
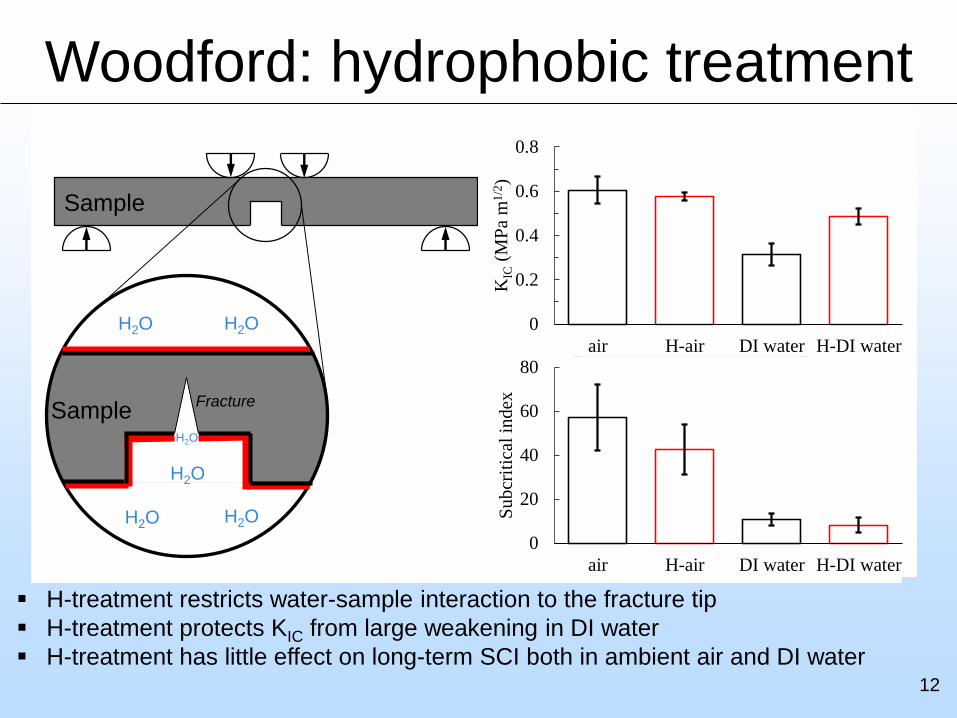
Sample
H2O H2O
H2OH2O
H2O
SampleFracture
H2O
Sample
Fracture Tip
H2O Vfracture
Vdegradation
H-treatment restricts water-sample interaction to the fracture tip
H-treatment protects KIC from large weakening in DI water
H-treatment has little effect on long-term SCI both in ambient air and DI water12
0
20
40
60
80
air H-air DI water H-DI water
Su
bcr
itic
al i
nd
ex
Woodford hydrophobic treatment
0
02
04
06
08
air H-air DI water H-DI water
KIC
(MP
a m
12
)
KIC SCI not obviously dependent on pH
Non-power-law K-V curves for H-treated sample
SCI begin gt SCI Untreated gt SCI end
H-treatment protects KIC from strong weakening13
0
02
04
06
0 3 6 9 12
KIC
(MP
a m
12
)
pH
Untreated
H-treated
0
10
20
30
40
0 3 6 9 12
Su
bcr
itic
al i
nd
ex
pH
UntreatedH-treated SCI beginH-treated SCI endSCI end
SCI begin
Woodford effect of pH
KIC dependency on salinity Untreated KIC darr as salinity uarr
H-treated KIC uarr as salinity uarr
Non-power-law K-V curves for H-treated samples
SCI begin gt SCI Untreated gt SCI end14
SCI end
0
01
02
03
04
05
06
-01 04 09 14 19
KIC
(MP
a m
12
)
NaCl concentration (M)
Untreated
H-treated
DI water
0
20
40
60
-01 04 09 14 19
Su
bcr
itic
al i
nd
ex
NaCl concentration (M)
Untreated
H-treated SCI begin
H-treated SCI end
DI water
Woodford effect of salinity
15
Woodford large drop of KIC and SCI between ambient to aqueous solutions
Glass and Marcellus less change in KIC and SCI
Woodford
Glass
Marcellus
Correlation between KIC amp SCI
16
bull Kic and SCI lower in water compared to dry tests
bull Dry tests of limited applicability for aqueous
subsurface systems
bull Dry tests potentially applicable to scCO2
systems
bull Effect of varying water chemistry minor in current
tests
bull Dry-out by scCO2 injection could strengthen
caprock
bull Water increases inelastic behavior impedes
fracture growth
bull Decreased inleastic behavior under dry CO2
conditions could favor fracture growth
Results fracture mechanics testing
JOINTS fracture network model
bull Boundary element code
bull Linear elastic
bull Pseudo-3D accounts for elastic interaction
ndash Opening-mode and mixed-mode fracture propagation
bull Allows simulation of subcritical fracture
propagation as function of
ndash Subcritical index SCI
ndash Elastic material properties
ndash Distribution of nucleation sites (seed fractures)
ndash For applied displacement or stress boundary
conditions17
Effect of var SCI constant KIc = 1 MPam12
5 10 20
40 80 160
18
KIC = 059
SCI = 63
KIC = 021
SCI = 11
KIC = 028
SCI = 11
KIC = 032
SCI = 14
KIC = 024
SCI = 14
JOINTS models for WoodfordPlan view Fractures initiate internally
KIC = 081
SCI = 68
JOINTS models of caprock failure
bull Vertical section in shale caprock
bull Fractures initiate at base
bull Best fracture connectivity with DI water
bull Decreased fracture connectivity in dry CO2gas
20
-12
-8
-4
0
4
8
12
-12 -10 -8 -6 -4 -2 0 2 4 6 8 10 12
Y (
mete
rs)
X (meters)
Woodford DI water
-12
-8
-4
0
4
8
12
-12 -10 -8 -6 -4 -2 0 2 4 6 8 10 12
Y (
mete
rs)
X (meters)
Woodford Dry CO2
-12
-8
-4
0
4
8
12
-12 -10 -8 -6 -4 -2 0 2 4 6 8 10 12
Y (
mete
rs)
X (meters)
Woodford Ambient
KIC = 059
SCI = 63
KIC = 032
SCI = 14
KIC = 081
SCI = 68
Caprock Integrity Sierra Mechanics
Test for effect of
bull wellbore orientation vertical horizontal
bull injection rate 3 Mtyr 5 Mtyr for 30 years
bull caprockreservoir thickness 50 m 100 m 200 m
on leakage across caprock withwithout pre-existing fractures (implicit
continuum scale)
Vertical wellbore Horizontal wellbore
P Newell M J Martinez P Eichhubl 2016 Impact of layer thickness and well orientation on
caprock integrity for geologic carbon storage Journal of Petroleum Engineering
httpdoi101016jpetrol201607032
21
Pore pressure within reservoir
bull Lower pressure in horizontal wellbore cases
bull Even for horizontal well fractures can be
reactivated causing leakage
Reservoir cap 100 m
Fracture opening
Fracture opening
22
Vertical well Horizontal well
Maximum saturation of CO2 on top of seal
bull Leakage for higher injection rates even in horizontal
wellbore
bull Long-term same leakage for horizontal amp vertical well
5 Mtyr later onset of leakage for horizontal wellReservoir cap 100 m
5 Mtyr
3 MtyrV
V
H
23
Effect of layer thicknessVertical well
Thick reservoir is safer
For given reservoir
thickness thicker caprock
is safer
Reservoir thickness is more
important than caprock
thickness
Horizontal well
Combined reservoir amp
caprock thickness (htotal)
controls leakage amount of
to the top layer
High total thickness is safer
24
Summary
bull Wide range in fracture properties for different
caprock lithologies
bull Distinct stress corrosion effect observed in
DT tests in water w varying composition
bull Shale less fracture prone in dry CO2gas
environment
bull Fractures most transmissive at intermediate
SCI
bull Horizontal wells thick reservoir amp seal favor
caprock integrity
ndash Vertical well Reservoir thickness most important25
Accomplishments to Date
bull Fracture mechanics testing on caprock lithologies in dry amp aqueous environments of varying composition
bull Conducted numerical simulations on fracture network evolution by chemically aided fracture growth
bull Simulated caprock leakage behavior using in Sierra Mechanics continuum models for varying wellreservoircaprock geometry
26
Next steps
bull DT and short-rod fracture testing under
ndash varying temperature
ndash water composition
ndash pressure
ndash scCO2
bull Integration of continuum amp fracture network modeling
ndash Effects of varying Kic amp SCI included into Sierra Mechanics
bull Validation of fracture network models with field fracture network observations
27
Synergy Opportunities
bull Fracture mechanics analysis of Cranfield
and FutureGen II core material
bull Coordination with EFRC research on
reservoir rock geomechanics
bull Integration of lab results with fracture
network modeling (phase-field cohesive
end-zone peridynamics)
bull Integration with hydraulic fracture research
28
Appendix
29
30
Organization Chart
Communication Plan
bull Established Sandia-UT collaborationbull Olson ndash Schultz ndash Eichhubl on joint industry
projects
bull Dewers ndash Newell ndashEichhubl on joint EFRC
31
Team
Peter Eichhubl
UT BEG
Tom Dewers
Sandia
Pania Newell
Sandia
Jon Olson
UT PGE
Rich Schultz
UT PGE
Owen
Callahan
UT BEG
Erick Wright
UT BEG
Xiaofeng
Chen
UT BEG
Jon Major
UT BEG
Gantt Chart
91
20
14
-12
31
20
14
11
20
15
-33
12
01
5
41
20
15
-63
02
01
5
71
20
15
-93
02
01
5
10
12
01
5-1
23
12
01
5
11
20
16
-33
12
01
6
41
20
16
-63
02
01
6
71
20
16
-93
02
01
6
10
12
01
6-1
23
12
01
6
11
20
17
-33
12
01
7
41
20
17
-63
02
01
7
71
20
17
-83
12
01
7
1 Project Management and Planning a a a a a a a p p p p p
21 Short rod fracture toughness tests 22 Double torsion tests a a a a a a a p p p p
23 Fracturing in water-bearing supercritical CO2 a a a a a a p p p p
31 Field fracture characterization a a a a a a a p
32 Textural and compositional fracture imaging p p p p p p p p
41 Discrete fracture modeling using Sierra Mechanics a a a a a a a p p p p
42 Fracture network modeling using JOINTS a a p p p p
43 Upscaled modeling using Kayenta a a a p
5 Model validation and integration p p p p
TaskSubtask
Year 1 Year 2 Year 3
Short rod tests (task 21) are being performed under task 23 under confined conditions
Bibliographybull Journal multiple authors
ndash P Newell M J Martinez P Eichhubl 2016 Impact of layer thickness and well
orientation on caprock integrity for geologic carbon storage Journal of Petroleum
Science and Engineering available at httpdoi101016jpetrol201607032
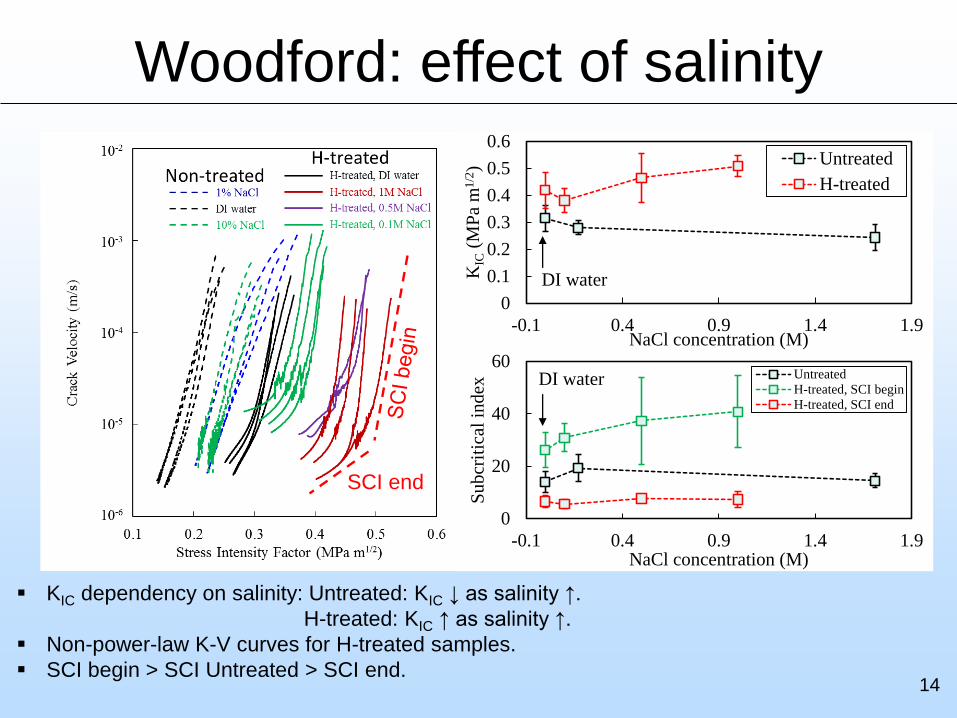

15
Woodford large drop of KIC and SCI between ambient to aqueous solutions
Glass and Marcellus less change in KIC and SCI
Woodford
Glass
Marcellus
Correlation between KIC amp SCI
16
bull Kic and SCI lower in water compared to dry tests
bull Dry tests of limited applicability for aqueous
subsurface systems
bull Dry tests potentially applicable to scCO2
systems
bull Effect of varying water chemistry minor in current
tests
bull Dry-out by scCO2 injection could strengthen
caprock
bull Water increases inelastic behavior impedes
fracture growth
bull Decreased inleastic behavior under dry CO2
conditions could favor fracture growth
Results fracture mechanics testing
JOINTS fracture network model
bull Boundary element code
bull Linear elastic
bull Pseudo-3D accounts for elastic interaction
ndash Opening-mode and mixed-mode fracture propagation
bull Allows simulation of subcritical fracture
propagation as function of
ndash Subcritical index SCI
ndash Elastic material properties
ndash Distribution of nucleation sites (seed fractures)
ndash For applied displacement or stress boundary
conditions17
Effect of var SCI constant KIc = 1 MPam12
5 10 20
40 80 160
18
KIC = 059
SCI = 63
KIC = 021
SCI = 11
KIC = 028
SCI = 11
KIC = 032
SCI = 14
KIC = 024
SCI = 14
JOINTS models for WoodfordPlan view Fractures initiate internally
KIC = 081
SCI = 68
JOINTS models of caprock failure
bull Vertical section in shale caprock
bull Fractures initiate at base
bull Best fracture connectivity with DI water
bull Decreased fracture connectivity in dry CO2gas
20
-12
-8
-4
0
4
8
12
-12 -10 -8 -6 -4 -2 0 2 4 6 8 10 12
Y (
mete
rs)
X (meters)
Woodford DI water
-12
-8
-4
0
4
8
12
-12 -10 -8 -6 -4 -2 0 2 4 6 8 10 12
Y (
mete
rs)
X (meters)
Woodford Dry CO2
-12
-8
-4
0
4
8
12
-12 -10 -8 -6 -4 -2 0 2 4 6 8 10 12
Y (
mete
rs)
X (meters)
Woodford Ambient
KIC = 059
SCI = 63
KIC = 032
SCI = 14
KIC = 081
SCI = 68
Caprock Integrity Sierra Mechanics
Test for effect of
bull wellbore orientation vertical horizontal
bull injection rate 3 Mtyr 5 Mtyr for 30 years
bull caprockreservoir thickness 50 m 100 m 200 m
on leakage across caprock withwithout pre-existing fractures (implicit
continuum scale)
Vertical wellbore Horizontal wellbore
P Newell M J Martinez P Eichhubl 2016 Impact of layer thickness and well orientation on
caprock integrity for geologic carbon storage Journal of Petroleum Engineering
httpdoi101016jpetrol201607032
21
Pore pressure within reservoir
bull Lower pressure in horizontal wellbore cases
bull Even for horizontal well fractures can be
reactivated causing leakage
Reservoir cap 100 m
Fracture opening
Fracture opening
22
Vertical well Horizontal well
Maximum saturation of CO2 on top of seal
bull Leakage for higher injection rates even in horizontal
wellbore
bull Long-term same leakage for horizontal amp vertical well
5 Mtyr later onset of leakage for horizontal wellReservoir cap 100 m
5 Mtyr
3 MtyrV
V
H
23
Effect of layer thicknessVertical well
Thick reservoir is safer
For given reservoir
thickness thicker caprock
is safer
Reservoir thickness is more
important than caprock
thickness
Horizontal well
Combined reservoir amp
caprock thickness (htotal)
controls leakage amount of
to the top layer
High total thickness is safer
24
Summary
bull Wide range in fracture properties for different
caprock lithologies
bull Distinct stress corrosion effect observed in
DT tests in water w varying composition
bull Shale less fracture prone in dry CO2gas
environment
bull Fractures most transmissive at intermediate
SCI
bull Horizontal wells thick reservoir amp seal favor
caprock integrity
ndash Vertical well Reservoir thickness most important25
Accomplishments to Date
bull Fracture mechanics testing on caprock lithologies in dry amp aqueous environments of varying composition
bull Conducted numerical simulations on fracture network evolution by chemically aided fracture growth
bull Simulated caprock leakage behavior using in Sierra Mechanics continuum models for varying wellreservoircaprock geometry
26
Next steps
bull DT and short-rod fracture testing under
ndash varying temperature
ndash water composition
ndash pressure
ndash scCO2
bull Integration of continuum amp fracture network modeling
ndash Effects of varying Kic amp SCI included into Sierra Mechanics
bull Validation of fracture network models with field fracture network observations
27
Synergy Opportunities
bull Fracture mechanics analysis of Cranfield
and FutureGen II core material
bull Coordination with EFRC research on
reservoir rock geomechanics
bull Integration of lab results with fracture
network modeling (phase-field cohesive
end-zone peridynamics)
bull Integration with hydraulic fracture research
28
Appendix
29
30
Organization Chart
Communication Plan
bull Established Sandia-UT collaborationbull Olson ndash Schultz ndash Eichhubl on joint industry
projects
bull Dewers ndash Newell ndashEichhubl on joint EFRC
31
Team
Peter Eichhubl
UT BEG
Tom Dewers
Sandia
Pania Newell
Sandia
Jon Olson
UT PGE
Rich Schultz
UT PGE
Owen
Callahan
UT BEG
Erick Wright
UT BEG
Xiaofeng
Chen
UT BEG
Jon Major
UT BEG
Gantt Chart
91
20
14
-12
31
20
14
11
20
15
-33
12
01
5
41
20
15
-63
02
01
5
71
20
15
-93
02
01
5
10
12
01
5-1
23
12
01
5
11
20
16
-33
12
01
6
41
20
16
-63
02
01
6
71
20
16
-93
02
01
6
10
12
01
6-1
23
12
01
6
11
20
17
-33
12
01
7
41
20
17
-63
02
01
7
71
20
17
-83
12
01
7
1 Project Management and Planning a a a a a a a p p p p p
21 Short rod fracture toughness tests 22 Double torsion tests a a a a a a a p p p p
23 Fracturing in water-bearing supercritical CO2 a a a a a a p p p p
31 Field fracture characterization a a a a a a a p
32 Textural and compositional fracture imaging p p p p p p p p
41 Discrete fracture modeling using Sierra Mechanics a a a a a a a p p p p
42 Fracture network modeling using JOINTS a a p p p p
43 Upscaled modeling using Kayenta a a a p
5 Model validation and integration p p p p
TaskSubtask
Year 1 Year 2 Year 3
Short rod tests (task 21) are being performed under task 23 under confined conditions
Bibliographybull Journal multiple authors
ndash P Newell M J Martinez P Eichhubl 2016 Impact of layer thickness and well
orientation on caprock integrity for geologic carbon storage Journal of Petroleum
Science and Engineering available at httpdoi101016jpetrol201607032

16
bull Kic and SCI lower in water compared to dry tests
bull Dry tests of limited applicability for aqueous
subsurface systems
bull Dry tests potentially applicable to scCO2
systems
bull Effect of varying water chemistry minor in current
tests
bull Dry-out by scCO2 injection could strengthen
caprock
bull Water increases inelastic behavior impedes
fracture growth
bull Decreased inleastic behavior under dry CO2
conditions could favor fracture growth
Results fracture mechanics testing
JOINTS fracture network model
bull Boundary element code
bull Linear elastic
bull Pseudo-3D accounts for elastic interaction
ndash Opening-mode and mixed-mode fracture propagation
bull Allows simulation of subcritical fracture
propagation as function of
ndash Subcritical index SCI
ndash Elastic material properties
ndash Distribution of nucleation sites (seed fractures)
ndash For applied displacement or stress boundary
conditions17
Effect of var SCI constant KIc = 1 MPam12
5 10 20
40 80 160
18
KIC = 059
SCI = 63
KIC = 021
SCI = 11
KIC = 028
SCI = 11
KIC = 032
SCI = 14
KIC = 024
SCI = 14
JOINTS models for WoodfordPlan view Fractures initiate internally
KIC = 081
SCI = 68
JOINTS models of caprock failure
bull Vertical section in shale caprock
bull Fractures initiate at base
bull Best fracture connectivity with DI water
bull Decreased fracture connectivity in dry CO2gas
20
-12
-8
-4
0
4
8
12
-12 -10 -8 -6 -4 -2 0 2 4 6 8 10 12
Y (
mete
rs)
X (meters)
Woodford DI water
-12
-8
-4
0
4
8
12
-12 -10 -8 -6 -4 -2 0 2 4 6 8 10 12
Y (
mete
rs)
X (meters)
Woodford Dry CO2
-12
-8
-4
0
4
8
12
-12 -10 -8 -6 -4 -2 0 2 4 6 8 10 12
Y (
mete
rs)
X (meters)
Woodford Ambient
KIC = 059
SCI = 63
KIC = 032
SCI = 14
KIC = 081
SCI = 68
Caprock Integrity Sierra Mechanics
Test for effect of
bull wellbore orientation vertical horizontal
bull injection rate 3 Mtyr 5 Mtyr for 30 years
bull caprockreservoir thickness 50 m 100 m 200 m
on leakage across caprock withwithout pre-existing fractures (implicit
continuum scale)
Vertical wellbore Horizontal wellbore
P Newell M J Martinez P Eichhubl 2016 Impact of layer thickness and well orientation on
caprock integrity for geologic carbon storage Journal of Petroleum Engineering
httpdoi101016jpetrol201607032
21
Pore pressure within reservoir
bull Lower pressure in horizontal wellbore cases
bull Even for horizontal well fractures can be
reactivated causing leakage
Reservoir cap 100 m
Fracture opening
Fracture opening
22
Vertical well Horizontal well
Maximum saturation of CO2 on top of seal
bull Leakage for higher injection rates even in horizontal
wellbore
bull Long-term same leakage for horizontal amp vertical well
5 Mtyr later onset of leakage for horizontal wellReservoir cap 100 m
5 Mtyr
3 MtyrV
V
H
23
Effect of layer thicknessVertical well
Thick reservoir is safer
For given reservoir
thickness thicker caprock
is safer
Reservoir thickness is more
important than caprock
thickness
Horizontal well
Combined reservoir amp
caprock thickness (htotal)
controls leakage amount of
to the top layer
High total thickness is safer
24
Summary
bull Wide range in fracture properties for different
caprock lithologies
bull Distinct stress corrosion effect observed in
DT tests in water w varying composition
bull Shale less fracture prone in dry CO2gas
environment
bull Fractures most transmissive at intermediate
SCI
bull Horizontal wells thick reservoir amp seal favor
caprock integrity
ndash Vertical well Reservoir thickness most important25
Accomplishments to Date
bull Fracture mechanics testing on caprock lithologies in dry amp aqueous environments of varying composition
bull Conducted numerical simulations on fracture network evolution by chemically aided fracture growth
bull Simulated caprock leakage behavior using in Sierra Mechanics continuum models for varying wellreservoircaprock geometry
26
Next steps
bull DT and short-rod fracture testing under
ndash varying temperature
ndash water composition
ndash pressure
ndash scCO2
bull Integration of continuum amp fracture network modeling
ndash Effects of varying Kic amp SCI included into Sierra Mechanics
bull Validation of fracture network models with field fracture network observations
27
Synergy Opportunities
bull Fracture mechanics analysis of Cranfield
and FutureGen II core material
bull Coordination with EFRC research on
reservoir rock geomechanics
bull Integration of lab results with fracture
network modeling (phase-field cohesive
end-zone peridynamics)
bull Integration with hydraulic fracture research
28
Appendix
29
30
Organization Chart
Communication Plan
bull Established Sandia-UT collaborationbull Olson ndash Schultz ndash Eichhubl on joint industry
projects
bull Dewers ndash Newell ndashEichhubl on joint EFRC
31
Team
Peter Eichhubl
UT BEG
Tom Dewers
Sandia
Pania Newell
Sandia
Jon Olson
UT PGE
Rich Schultz
UT PGE
Owen
Callahan
UT BEG
Erick Wright
UT BEG
Xiaofeng
Chen
UT BEG
Jon Major
UT BEG
Gantt Chart
91
20
14
-12
31
20
14
11
20
15
-33
12
01
5
41
20
15
-63
02
01
5
71
20
15
-93
02
01
5
10
12
01
5-1
23
12
01
5
11
20
16
-33
12
01
6
41
20
16
-63
02
01
6
71
20
16
-93
02
01
6
10
12
01
6-1
23
12
01
6
11
20
17
-33
12
01
7
41
20
17
-63
02
01
7
71
20
17
-83
12
01
7
1 Project Management and Planning a a a a a a a p p p p p
21 Short rod fracture toughness tests 22 Double torsion tests a a a a a a a p p p p
23 Fracturing in water-bearing supercritical CO2 a a a a a a p p p p
31 Field fracture characterization a a a a a a a p
32 Textural and compositional fracture imaging p p p p p p p p
41 Discrete fracture modeling using Sierra Mechanics a a a a a a a p p p p
42 Fracture network modeling using JOINTS a a p p p p
43 Upscaled modeling using Kayenta a a a p
5 Model validation and integration p p p p
TaskSubtask
Year 1 Year 2 Year 3
Short rod tests (task 21) are being performed under task 23 under confined conditions
Bibliographybull Journal multiple authors
ndash P Newell M J Martinez P Eichhubl 2016 Impact of layer thickness and well
orientation on caprock integrity for geologic carbon storage Journal of Petroleum
Science and Engineering available at httpdoi101016jpetrol201607032

KIC = 059
SCI = 63
KIC = 021
SCI = 11
KIC = 028
SCI = 11
KIC = 032
SCI = 14
KIC = 024
SCI = 14
JOINTS models for WoodfordPlan view Fractures initiate internally
KIC = 081
SCI = 68
JOINTS models of caprock failure
bull Vertical section in shale caprock
bull Fractures initiate at base
bull Best fracture connectivity with DI water
bull Decreased fracture connectivity in dry CO2gas
20
-12
-8
-4
0
4
8
12
-12 -10 -8 -6 -4 -2 0 2 4 6 8 10 12
Y (
mete
rs)
X (meters)
Woodford DI water
-12
-8
-4
0
4
8
12
-12 -10 -8 -6 -4 -2 0 2 4 6 8 10 12
Y (
mete
rs)
X (meters)
Woodford Dry CO2
-12
-8
-4
0
4
8
12
-12 -10 -8 -6 -4 -2 0 2 4 6 8 10 12
Y (
mete
rs)
X (meters)
Woodford Ambient
KIC = 059
SCI = 63
KIC = 032
SCI = 14
KIC = 081
SCI = 68
Caprock Integrity Sierra Mechanics
Test for effect of
bull wellbore orientation vertical horizontal
bull injection rate 3 Mtyr 5 Mtyr for 30 years
bull caprockreservoir thickness 50 m 100 m 200 m
on leakage across caprock withwithout pre-existing fractures (implicit
continuum scale)
Vertical wellbore Horizontal wellbore
P Newell M J Martinez P Eichhubl 2016 Impact of layer thickness and well orientation on
caprock integrity for geologic carbon storage Journal of Petroleum Engineering
httpdoi101016jpetrol201607032
21
Pore pressure within reservoir
bull Lower pressure in horizontal wellbore cases
bull Even for horizontal well fractures can be
reactivated causing leakage
Reservoir cap 100 m
Fracture opening
Fracture opening
22
Vertical well Horizontal well
Maximum saturation of CO2 on top of seal
bull Leakage for higher injection rates even in horizontal
wellbore
bull Long-term same leakage for horizontal amp vertical well
5 Mtyr later onset of leakage for horizontal wellReservoir cap 100 m
5 Mtyr
3 MtyrV
V
H
23
Effect of layer thicknessVertical well
Thick reservoir is safer
For given reservoir
thickness thicker caprock
is safer
Reservoir thickness is more
important than caprock
thickness
Horizontal well
Combined reservoir amp
caprock thickness (htotal)
controls leakage amount of
to the top layer
High total thickness is safer
24
Summary
bull Wide range in fracture properties for different
caprock lithologies
bull Distinct stress corrosion effect observed in
DT tests in water w varying composition
bull Shale less fracture prone in dry CO2gas
environment
bull Fractures most transmissive at intermediate
SCI
bull Horizontal wells thick reservoir amp seal favor
caprock integrity
ndash Vertical well Reservoir thickness most important25
Accomplishments to Date
bull Fracture mechanics testing on caprock lithologies in dry amp aqueous environments of varying composition
bull Conducted numerical simulations on fracture network evolution by chemically aided fracture growth
bull Simulated caprock leakage behavior using in Sierra Mechanics continuum models for varying wellreservoircaprock geometry
26
Next steps
bull DT and short-rod fracture testing under
ndash varying temperature
ndash water composition
ndash pressure
ndash scCO2
bull Integration of continuum amp fracture network modeling
ndash Effects of varying Kic amp SCI included into Sierra Mechanics
bull Validation of fracture network models with field fracture network observations
27
Synergy Opportunities
bull Fracture mechanics analysis of Cranfield
and FutureGen II core material
bull Coordination with EFRC research on
reservoir rock geomechanics
bull Integration of lab results with fracture
network modeling (phase-field cohesive
end-zone peridynamics)
bull Integration with hydraulic fracture research
28
Appendix
29
30
Organization Chart
Communication Plan
bull Established Sandia-UT collaborationbull Olson ndash Schultz ndash Eichhubl on joint industry
projects
bull Dewers ndash Newell ndashEichhubl on joint EFRC
31
Team
Peter Eichhubl
UT BEG
Tom Dewers
Sandia
Pania Newell
Sandia
Jon Olson
UT PGE
Rich Schultz
UT PGE
Owen
Callahan
UT BEG
Erick Wright
UT BEG
Xiaofeng
Chen
UT BEG
Jon Major
UT BEG
Gantt Chart
91
20
14
-12
31
20
14
11
20
15
-33
12
01
5
41
20
15
-63
02
01
5
71
20
15
-93
02
01
5
10
12
01
5-1
23
12
01
5
11
20
16
-33
12
01
6
41
20
16
-63
02
01
6
71
20
16
-93
02
01
6
10
12
01
6-1
23
12
01
6
11
20
17
-33
12
01
7
41
20
17
-63
02
01
7
71
20
17
-83
12
01
7
1 Project Management and Planning a a a a a a a p p p p p
21 Short rod fracture toughness tests 22 Double torsion tests a a a a a a a p p p p
23 Fracturing in water-bearing supercritical CO2 a a a a a a p p p p
31 Field fracture characterization a a a a a a a p
32 Textural and compositional fracture imaging p p p p p p p p
41 Discrete fracture modeling using Sierra Mechanics a a a a a a a p p p p
42 Fracture network modeling using JOINTS a a p p p p
43 Upscaled modeling using Kayenta a a a p
5 Model validation and integration p p p p
TaskSubtask
Year 1 Year 2 Year 3
Short rod tests (task 21) are being performed under task 23 under confined conditions
Bibliographybull Journal multiple authors
ndash P Newell M J Martinez P Eichhubl 2016 Impact of layer thickness and well
orientation on caprock integrity for geologic carbon storage Journal of Petroleum
Science and Engineering available at httpdoi101016jpetrol201607032
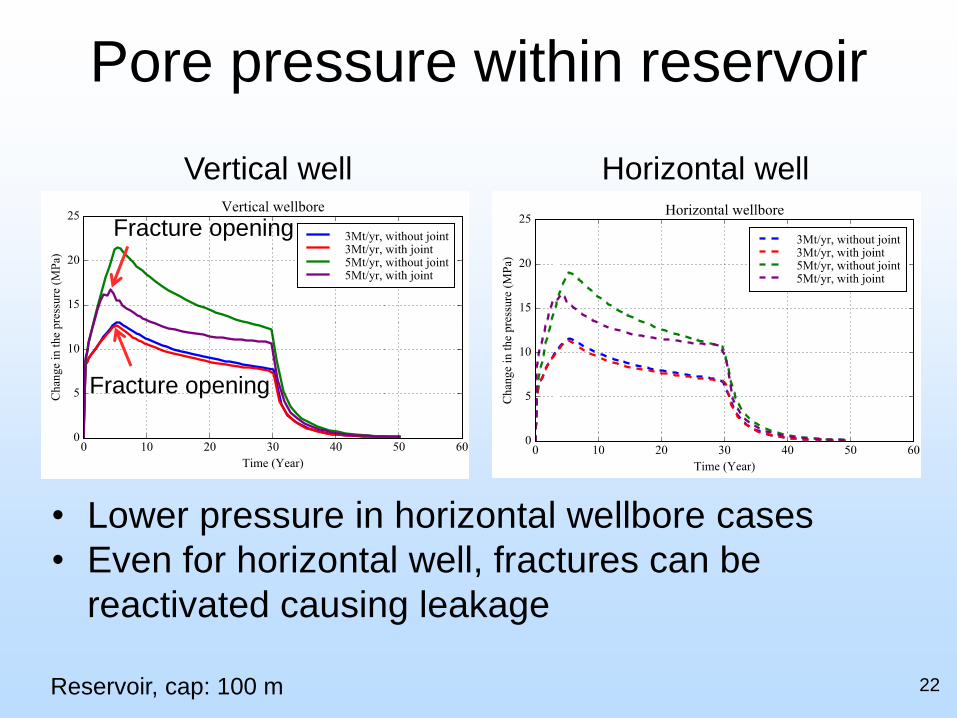

31
Team
Peter Eichhubl
UT BEG
Tom Dewers
Sandia
Pania Newell
Sandia
Jon Olson
UT PGE
Rich Schultz
UT PGE
Owen
Callahan
UT BEG
Erick Wright
UT BEG
Xiaofeng
Chen
UT BEG
Jon Major
UT BEG
Gantt Chart
91
20
14
-12
31
20
14
11
20
15
-33
12
01
5
41
20
15
-63
02
01
5
71
20
15
-93
02
01
5
10
12
01
5-1
23
12
01
5
11
20
16
-33
12
01
6
41
20
16
-63
02
01
6
71
20
16
-93
02
01
6
10
12
01
6-1
23
12
01
6
11
20
17
-33
12
01
7
41
20
17
-63
02
01
7
71
20
17
-83
12
01
7
1 Project Management and Planning a a a a a a a p p p p p
21 Short rod fracture toughness tests 22 Double torsion tests a a a a a a a p p p p
23 Fracturing in water-bearing supercritical CO2 a a a a a a p p p p
31 Field fracture characterization a a a a a a a p
32 Textural and compositional fracture imaging p p p p p p p p
41 Discrete fracture modeling using Sierra Mechanics a a a a a a a p p p p
42 Fracture network modeling using JOINTS a a p p p p
43 Upscaled modeling using Kayenta a a a p
5 Model validation and integration p p p p
TaskSubtask
Year 1 Year 2 Year 3
Short rod tests (task 21) are being performed under task 23 under confined conditions
Bibliographybull Journal multiple authors
ndash P Newell M J Martinez P Eichhubl 2016 Impact of layer thickness and well
orientation on caprock integrity for geologic carbon storage Journal of Petroleum
Science and Engineering available at httpdoi101016jpetrol201607032

Bibliographybull Journal multiple authors
ndash P Newell M J Martinez P Eichhubl 2016 Impact of layer thickness and well
orientation on caprock integrity for geologic carbon storage Journal of Petroleum
Science and Engineering available at httpdoi101016jpetrol201607032